Article

Design Optimization of a Mooring System for an Offshore Aquaculture Platform

1
Fishery Machinery and Instrument Research Institute, Chinese Academy of Fishery Sciences, Shanghai 200092, China
2
State Key Laboratory of Ocean Engineering, Shanghai Jiao Tong University, Shanghai 200240, China
3
Qingdao Marine Science and Technology Center, Qingdao 266237, China
4
Shanghai Waigaoqiao Shipbuilding Co., Ltd., Shanghai 200137, China
*
Author to whom correspondence should be addressed.
J. Mar. Sci. Eng. 2023, 11(11), 2134; https://doi.org/10.3390/jmse11112134
Submission received: 6 October 2023 / Revised: 1 November 2023 / Accepted: 5 November 2023 / Published: 8 November 2023
(This article belongs to the Section Marine Aquaculture)

Abstract

:
In the present paper, the mooring system of an offshore aquaculture platform is designed and optimized, applying a shallow water mooring system design methodology which combines the Non-dominated Sorting Genetic Algorithm-II (NSGA-II) and the cable–platform coupled model. One mooring design is first given using the proposed methodology. Two reference mooring systems are modified based on an NSGA-II design, and AIP criteria and expertise. The hydrodynamic performance of the offshore aquaculture platform with these three mooring systems is compared via use of a potential flow time–domain numerical simulation. A physical model-scale experiment is carried out to validate the numerical coupled model. Both numerical and experimental results confirm the effectiveness of present model. The comparative analysis shows that the mooring system designed using NSGA-II can provide a relative radical solution compared to the other two mooring designs when considering a limited budget.

1. Introduction

Offshore aquaculture platforms, as an newly developing application form of ocean engineering in recent years, are usually engaged in long-term deployment facing different environmental conditions [1,2]. This means there are higher requirements of the mooring system, which is one of critical supporting systems serving to anchor and stabilize offshore floating structures in challenging marine environments [3,4,5,6]. Considering a limited budget and complicated sea environment, it is necessary to further optimize mooring system designs.
Mooring system optimization is a critical aspect of designing and operating floating structures efficiently, economically, and safely. Mooring system optimization addresses a range of complex challenges, including maximizing stability, minimizing risks, and optimizing cost-efficiency. This multidisciplinary field draws upon expertise in engineering, hydrodynamics, structural analysis, and mathematical optimization techniques to develop optimal mooring configurations. The literature on mooring system optimization encompasses decades of research, covering topics such as numerical modeling, dynamic analysis, environmental impact assessment, and risk management. Researchers and engineers continue to explore innovative approaches. This ongoing evolution of knowledge is reflected in numerous scholarly articles and publications. One notable study performed by Shafieefar and Rezvani [7] demonstrated a successful application of genetic algorithms to optimize the mooring design of floating platforms. The proposed method can optimize the platform heading and its mooring pattern, taking into account environmental force spreading; the method can also give optimum line length or line tension for each mooring line. Brommundt et al. [8] presented an optimization method for a catenary mooring system. An optimization problem with four design variables was solved using the Nelder–Mead algorithm. Cruces Girón et al. [9] proposed an improved mooring system design method combining a rapid analysis of mooring lines and risers using an un-coupled model, alongside an accurate mooring system design using a coupled model. Monteiro et al. [10] compared the Particle Swarm Optimization (PSO) method and Differential Evolution (DE) method by designing a mooring system for a deep-sea floating production platform. Gonzalez and Mercier [11] designed static equivalent moorings using a Genetic Algorithm (GA) to replace a conventional mooring system when testing deep water offshore facilities. The conclusions showed that beyond a certain minimum, increasing population size does not lead to noticeably improved optimal designs as measured by the fitness function. Li et al. [12] proposed an integrated optimization methodology for mooring design and applied it to a vessel-shaped offshore fish farm. The method combines the design of experiments, screening analysis, dynamic analysis and a metamodel-based optimization. Liang et al. [13] carried out mooring system optimization for a semi-submersible very large floating structure in shallow water by applying Non-dominated Sorting Genetic Algorithm-II (NSGA-II) with a coupled numerical model. Their work showcases the practical benefits of optimization techniques in achieving reliable mooring solutions for complex offshore structures. Monteiro et al. [14] presented an improved mooring optimization procedure for a floating production system (FPS) which associated the PSO algorithm with an ϵ -constrained method in order to efficiently handle the constraints. Yu et al. [15] designed a hybrid mooring line composition for keeping an aquaculture platform in position. They experimentally and numerically assessed the hydrodynamic and mooring performance of the platform under operational and bottom-sitting conditions. The results showed that the bottom-sitting condition was a feasible option for the platform to deal with the extreme environmental conditions, as the wave hydrodynamic effect was much lower near the seabed.
Differing from previous studies, the subject of this investigation is a comprehensive experiment and observation platform designed for near-sea aquaculture. The primary component of this aquaculture platform is an unpowered hull, consisting of four aquaculture cabins. Additionally, there is a towing system, electromechanical system, enclosed aquaculture system, and a ship–shore integrated monitoring system. The platform is securely anchored to the seabed using a mooring system, enabling cultured experiments and research observations to be conducted.
In this paper, the optimization of a mooring system design for an offshore aquaculture platform applying NSGA-II coupled with a platform-mooring time–domain numerical model is reported. A multi-objective optimization problem for catenary mooring system design is first formulated and resolved taking budget constraints, survivability, and dynamic performance into account. The results are compared with the other two reference mooring system designs. A physical model test is carried out to validate the dynamic performance of the moored offshore aquaculture platform. Both numerical and experimental results confirm that the mooring tensions and motion responses are within a reasonable range which can meet the requirements of by classification societies. Some concluding remarks and suggestions are given in the final section.

2. Problem Formulation of Mooring Design Optimization

The optimization problem can usually be regarded as the problem of finding the best balance point between the performance and limited budget. In present mooring system designs, the anchor type is already decided upon, and the cost can be inferred from the total weight of the mooring system Φ W , which includes line number ϕ N , line dimension ϕ D and line length ϕ L . The performance can inferred from the maximum motion responses of the platform ϕ i , which shall be within acceptable range; the mooring system safety is defined as fulfilling the ultimate limit state (ULS), fatigue limit state (FLS), and accidental limit state (ALS). Here, ULS is used to check the safety factor ϕ S of the mooring line in the complete state, ALS is used to check that there is still adequate safety redundancy when losing one mooring line, and FLS is used to ensure the lifetime of the mooring system, which is simplified considering the 3 mm corrosion allowance over 15 years in the present design. Based on above discussions, the multi-objective optimization problem can be established as follows:
m i n i m i z e : F ( N , L , D ) = [ ϕ i , ϕ N , ϕ D , ϕ L ] , s u b j e c t t o : N , L , D Ω , c o n s t r a i n e d t o : ϕ S ϕ S 0 , ϕ W ϕ W 0 , r i R i , ϕ b o t t o m 0
where Ω is the feasible range of the design; i indicates the ith degree of freedom (DOF); r represents the total restoring load provided by the mooring system; R is the estimated environmental load; ϕ b o t t o m is the length of line–bottom contact part; ϕ W 0 is the total weight limit; and ϕ S 0 is the safety factor limit. Based on API standards [16], for complete state, ϕ S 0 = 1.67 , and for one-line breakage state, ϕ S 0 = 1.25 .
To solve abovementioned optimization problem, the NSGA-II algorithm [13,17] is adopted and is described in Algorithm 1. The input parent is initialized randomly first. Second, the objective function of each individual in the combination of parents and children is solved via the platform–mooring coupled model. Third, the individuals are sorted into different fronts and the crowding distance is estimated. At last, individuals with a higher rank and larger crowding distance are selected for generating the next generation with crossover and mutation until the termination conditions are met. For more details, the relevant literature [13] can be referred to.
Algorithm 1: Multi-objective optimization problem solved by NSGA-II.
1
Initialize the feasible range of design variables based on API standards [16];
2
Calculate the mooring system stiffness and estimate the survival environmental conditions;
3
Initialize the population, generation number, and first generation ( G 1 ) of NSGA-II;
4
Meanwhile, carry out the following steps
5
Resolve the objective function for each individual in G i ;
6
Calculate the rank and crowding distance for each individual in G i by using non-dominated sort algorithm and crowded comparison approach;
7
Select the individuals with higher rank and larger crowding distance based on the results of the previous step;
8
Generate the next generation P i ;
9
If i < generation number then
10
i = i + 1 ;
11
G i = G i 1 P i 1
12
else
13
Break and output P i ;

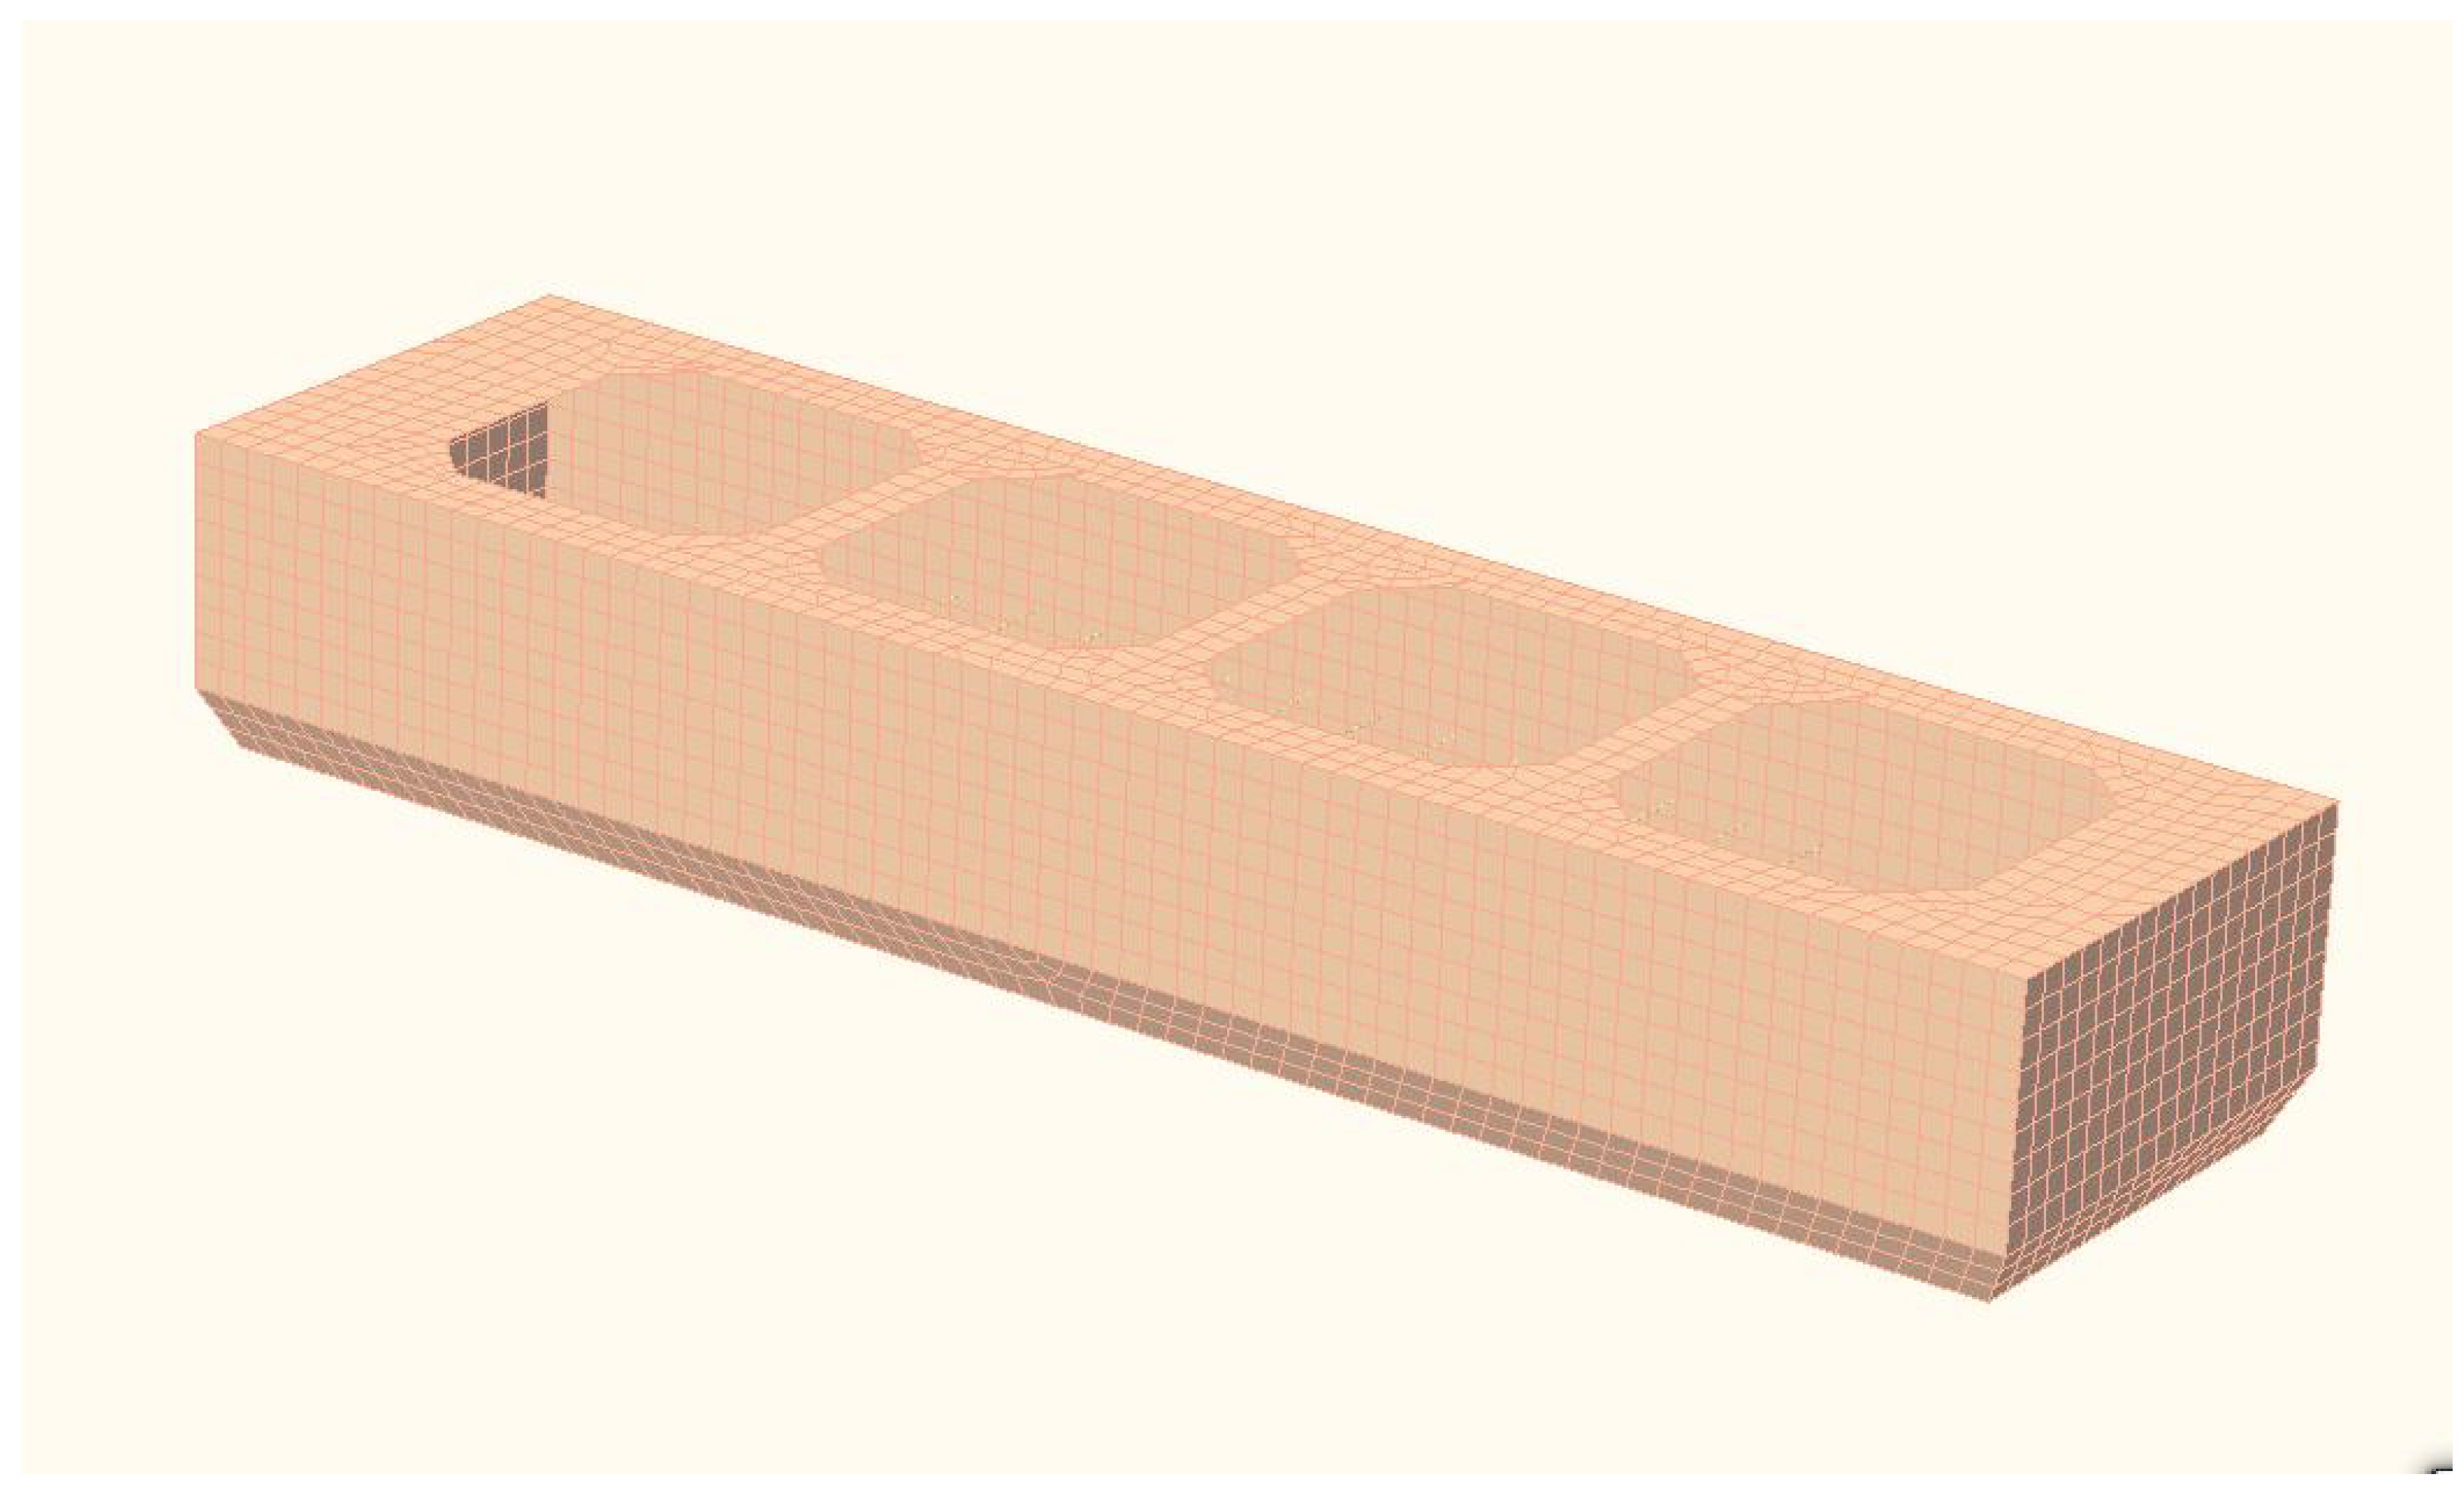
3. Description of the Present Offshore Aquaculture Platform

The aquaculture platform investigated in the present study is a rectangle-type four-cabin offshore structure with length of 64.5 m and width of 17 m. The panel model of the aquaculture platform can be found in Figure 1. This platform is designed to be deployed in a coastal region with an average water depth of 15 m in the East China Sea. The full-scale major features are listed in Table 1. All the results presented in this paper are given in prototype values if there are no special annotations.
Two coordinate systems are established in order to quantitatively describe the motion responses of the moored aquaculture platform (see Figure 2). A global coordinate system or fixed reference frame ( O e X e Y e Z e ) is located at the mean water surface, and a local system or so-called body reference frame ( O b X b Y b Z b ) is located at the center of gravity (COG). The positive Z-axis is upward, the positive X-axis points to the bow, and the positive Y-axis points to the larboard. The 90 environmental direction means that the wave, wind, and current travels towards the positive Y-axis.
The environmental conditions adopted in numerical simulations are selected based on the marine observation statistics of the target operating site in East China Sea. All the detailed parameters of the environmental conditions (three operational conditions (OCs) and one survival condition (SC)) are listed in Table 2. The JONSWAP wave spectrum with a peak enhancement factor γ of 1.0 is applied for simulating the irregular waves. The colinear wind, wave, and current are simulated for considering the critical environmental impact. Because of the symmetrical configuration, three representative directions, 0, 45, and 90 degrees, are selected.

4. Numerical and Experimental Modelling

4.1. Platform–Mooring Coupled Time–Domain Model

In order to calculate the maximum tensions, minimum line–bottom contact length of mooring lines, and maximum motion responses of the offshore platform, a linear potential-flow time–domain numerical model is applied. The motion equation of the platform can be formulated as follows [18]:
( M + A ) x ¨ ( t ) + 0 t H ( t τ ) x ˙ ( τ ) d τ + K x ( t ) = F e n v ( t ) + F m o o r ( t Δ t )
where x ¨ , x ˙ and x are the acceleration, velocity, and displacement of the offshore aquaculture platform. M and A are the mass and added mass matrix of the aquaculture platform; K is the hydrostatic restoring matrix; H is the retardation function matrix; and F e n v is the environmental load on the platform, including the current load F c u r r , wind load F w i n d and wave load F w a v e . F m o o r is the mooring load acting on the platform.
The hydrodynamic coefficients such as the added mass, radiation damping, and hydrostatic restoring matrix can be directly calculated via use of frequency–domain diffraction–radiation method [19,20]. For the environmental loads F e n v , the current F c u r r and wind loads F w i n d can be obtained by adopting Oil Companies International Marine Forum (OCIMF) formulations [21].
F w i n d = 1 2 C w i n d ρ a V w i n d 2 A w i n d
F c u r r = 1 2 C c u r r ρ w V c u r r 2 A c u r r
where C w i n d and C c u r r are the surge, sway, and yaw wind/current drag coefficients for the wind/current direction relative to the low-frequency platform heading. These coefficients are computed by utilizing the Computational Fluid Dynamics (CFD) tools. ρ a and ρ w are, respectively, air and water density. V w i n d is the wind velocity at 10 m above the mean water surface. V c u r r is the relative current speed. A w i n d is the surge, sway project area, and yaw area moment above the waterline. A c u r r is the exposed surge, sway, and yaw area moment below the waterline.
The wave excitation load F w a v e includes the first- and second-order wave excitation load. The first-order wave excitation load can be calculated through the integration of the first-order hydrodynamic pressure on the surface of the platform caused by the diffraction wave, which also can be derived by solving the diffraction–radiation problem. Normally, the second-order difference–frequency wave load is considered for a catenary moored platform. There are three main methods for computing the second-order difference–frequency wave load, which are the near-field [22], middle-field [23] and far-field methods [24]. In the present paper, the near-field method is applied for computing mean drift forces and second-order difference frequency components.
The viscous damping effect should be taken into account, because the potential flow numerical simulation ignores the non-linear viscous effect of the water. A linear equivalent damping coefficient D * ( ω ) can be given based on the damping ratio obtained from physical model tests, which can be expressed as follows [25]:
D * ( ω ) = 2 γ [ M + A ] K
where γ is the damping ratio of the floater damping divided by critical damping.
The mooring force F m o o r is calculated via the lumped-mass approach [26], as can be seen in Figure 3. Each mooring line is divided into several segments with a node at each end. Physical properties, like the weight and buoyancy of the segment, are lumped into the nodes. The segment models the axial and torsional properties using axial and torsional dampers and springs. The tension of one node provided by the segment j can be expressed as follows:
T 2 j = Q j y 2 q = E A ( 1 L j 1 | y 2 y 1 | ) ( y 1 y 2 )
where T 2 j represents the tension of the node 2 provided by the segment j; Q j is the elastic potential energy; y 2 q is the qth global coordinates of node 2; E is the Young’s modulus; A is the cross-sectional area of line; and L j is non-stretched length. Q j can be expressed by:
Q j = 1 2 E A L j ( | y 2 y 1 | L j ) 2
For numerical simulations, in present study, the frequency–domain hydrodynamic coefficients were obtained by applying the conventional three-dimensional (3D) panel software HydroStar [20]. The platform–mooring coupled time–domain simulation was performed using OracFlex [26].

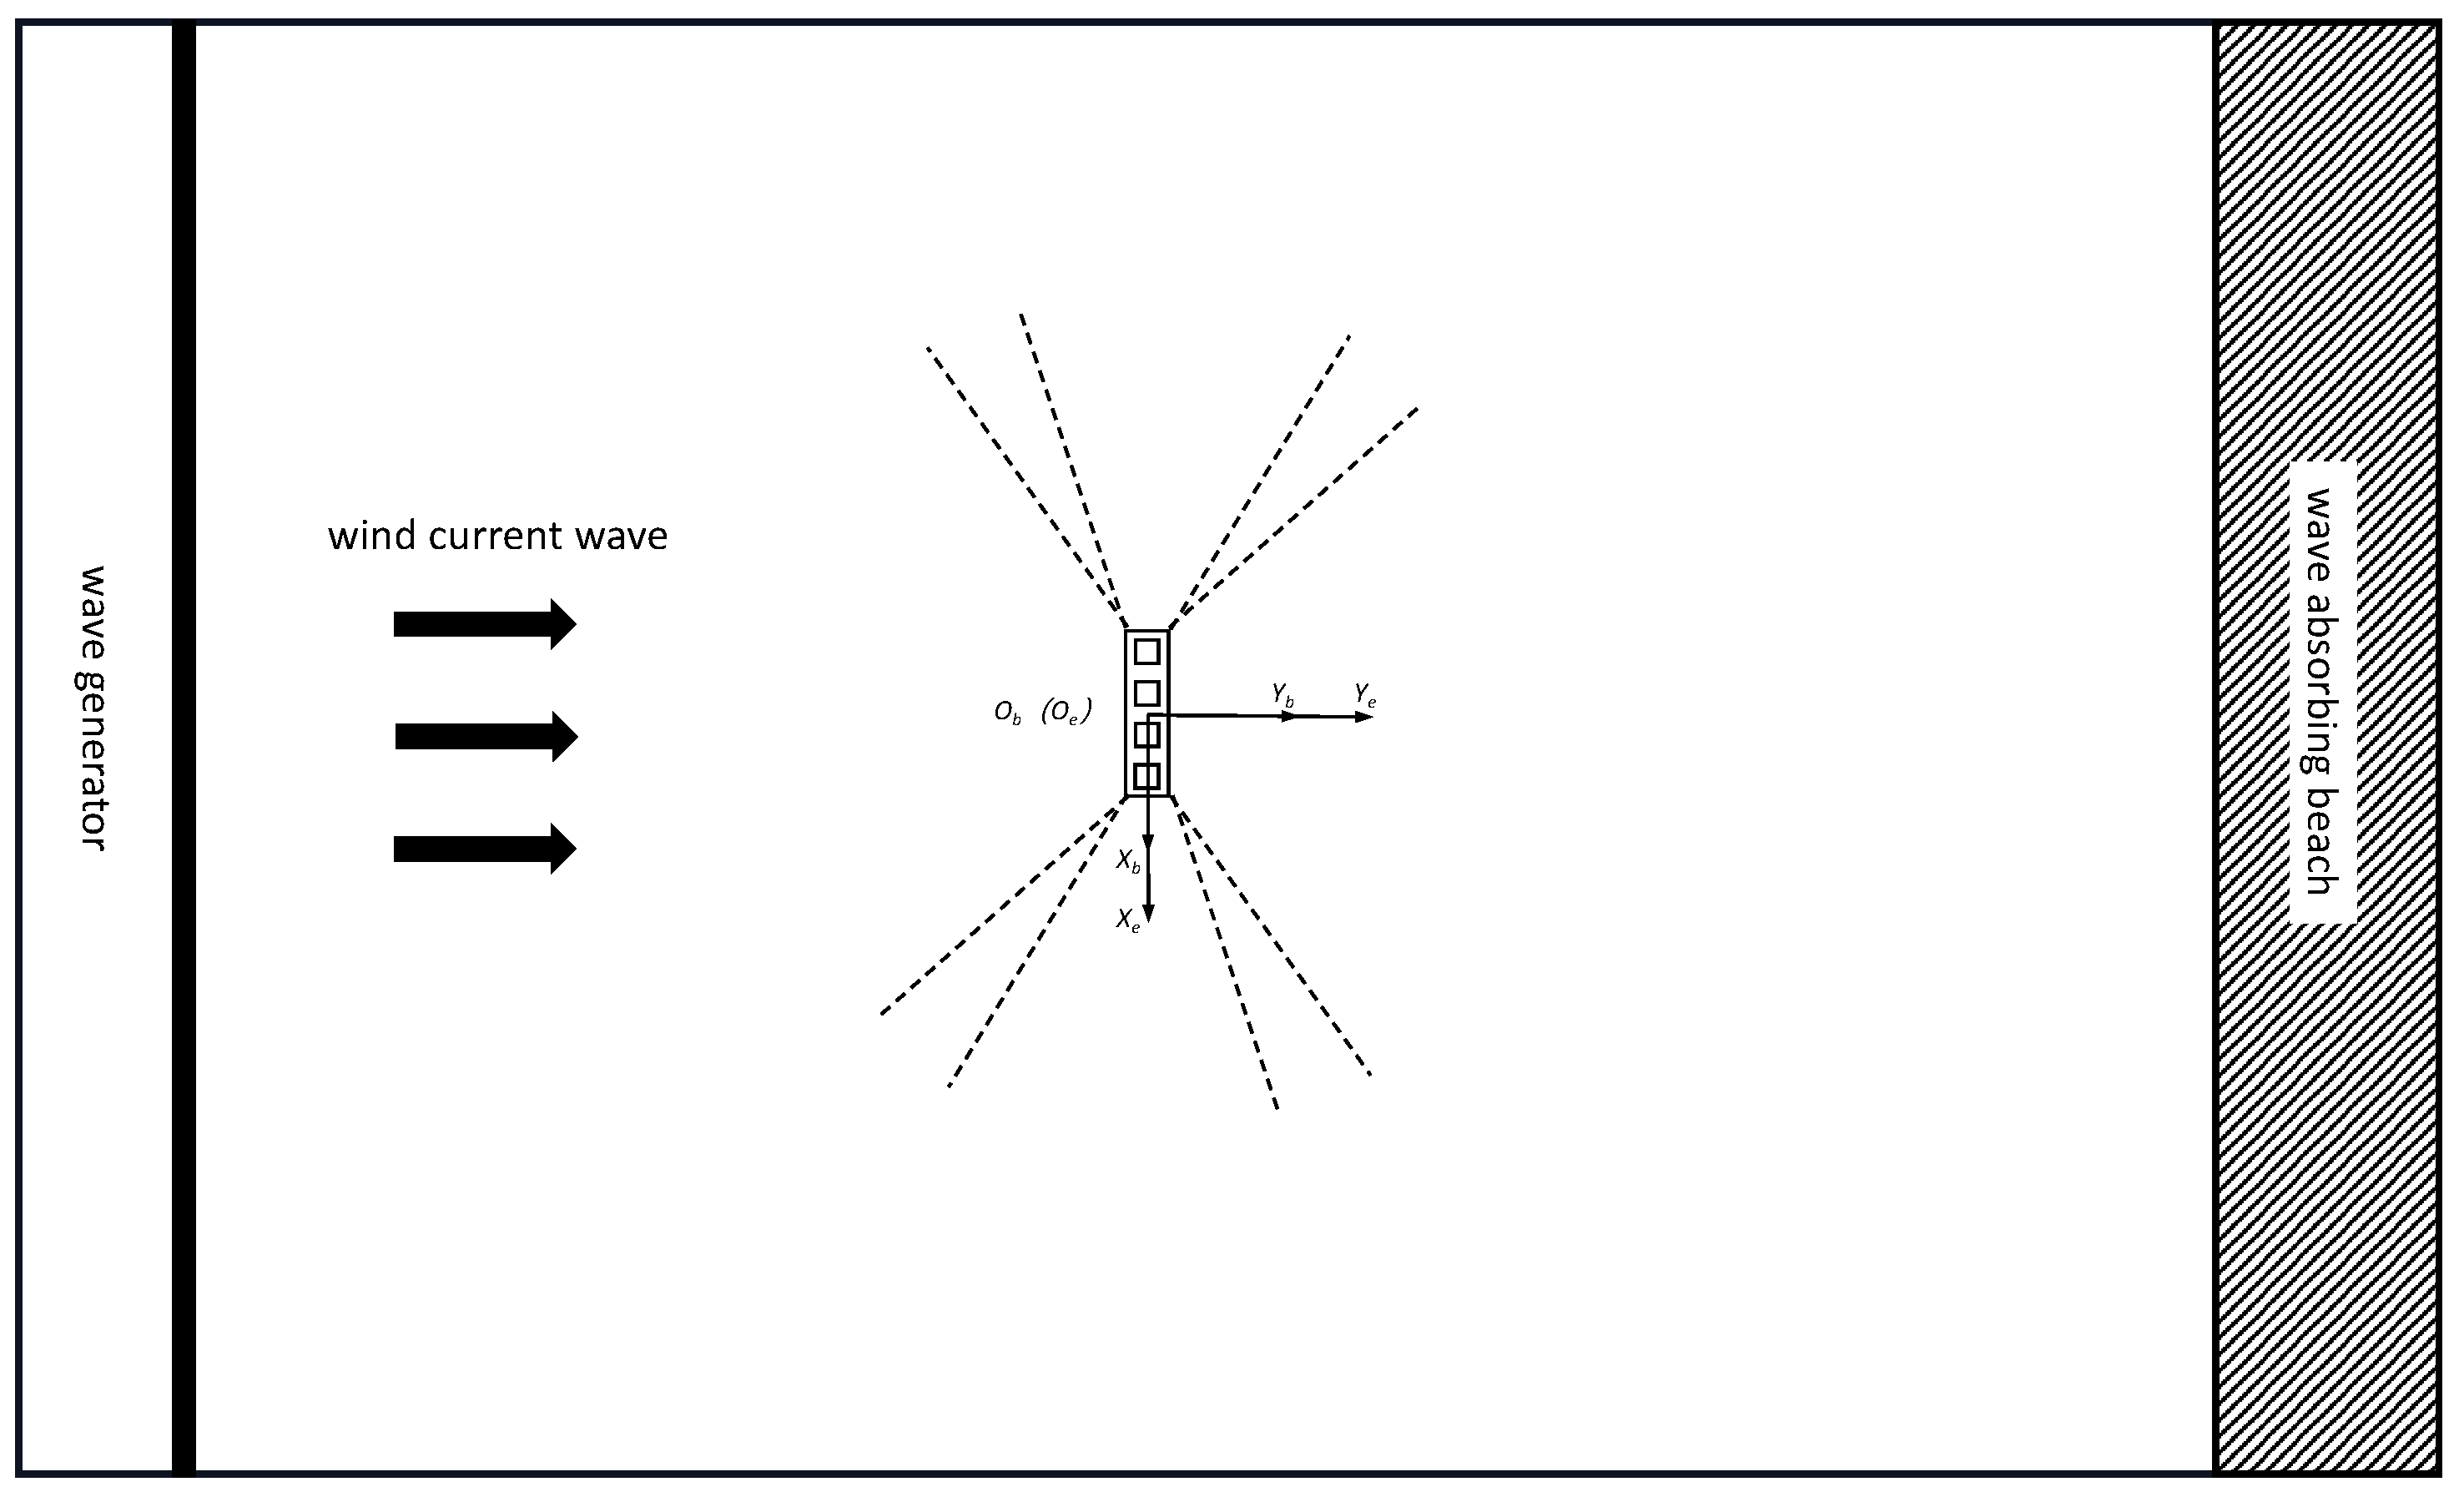
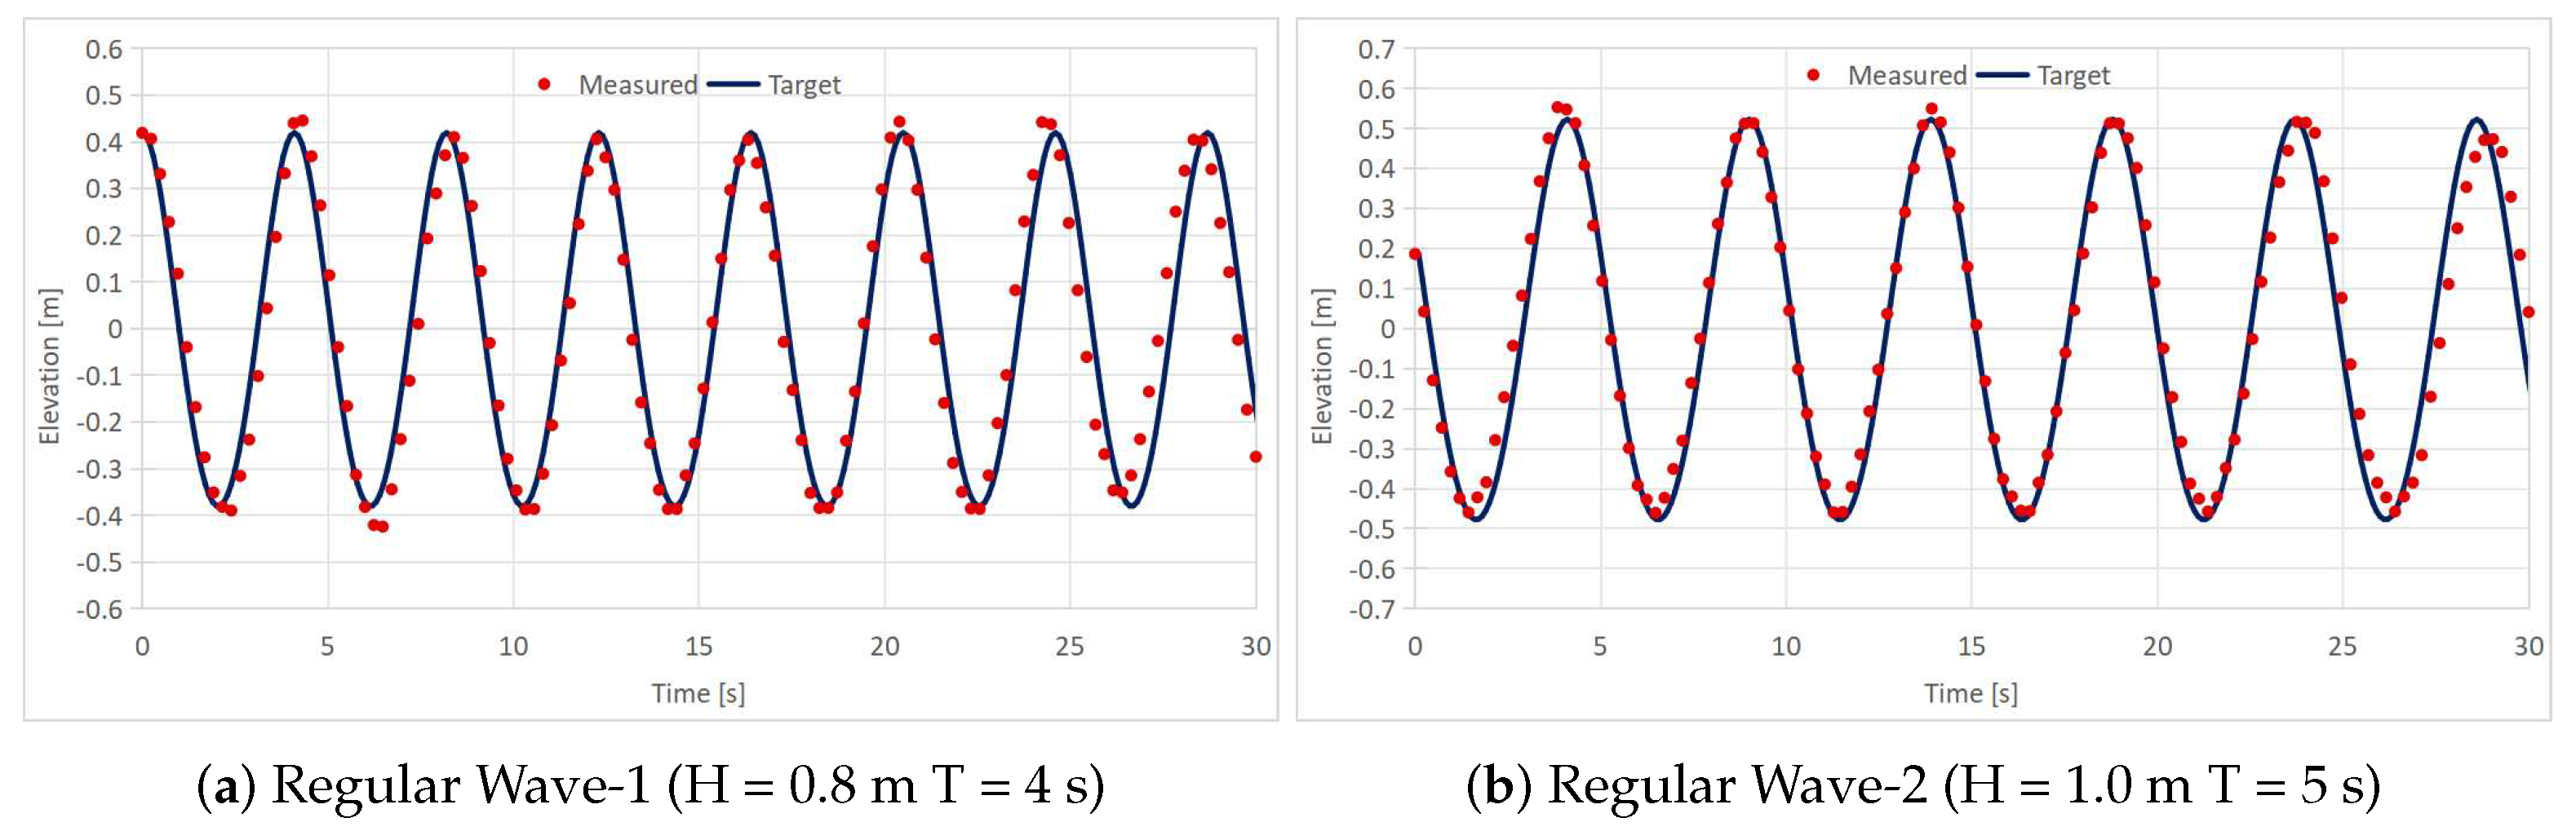
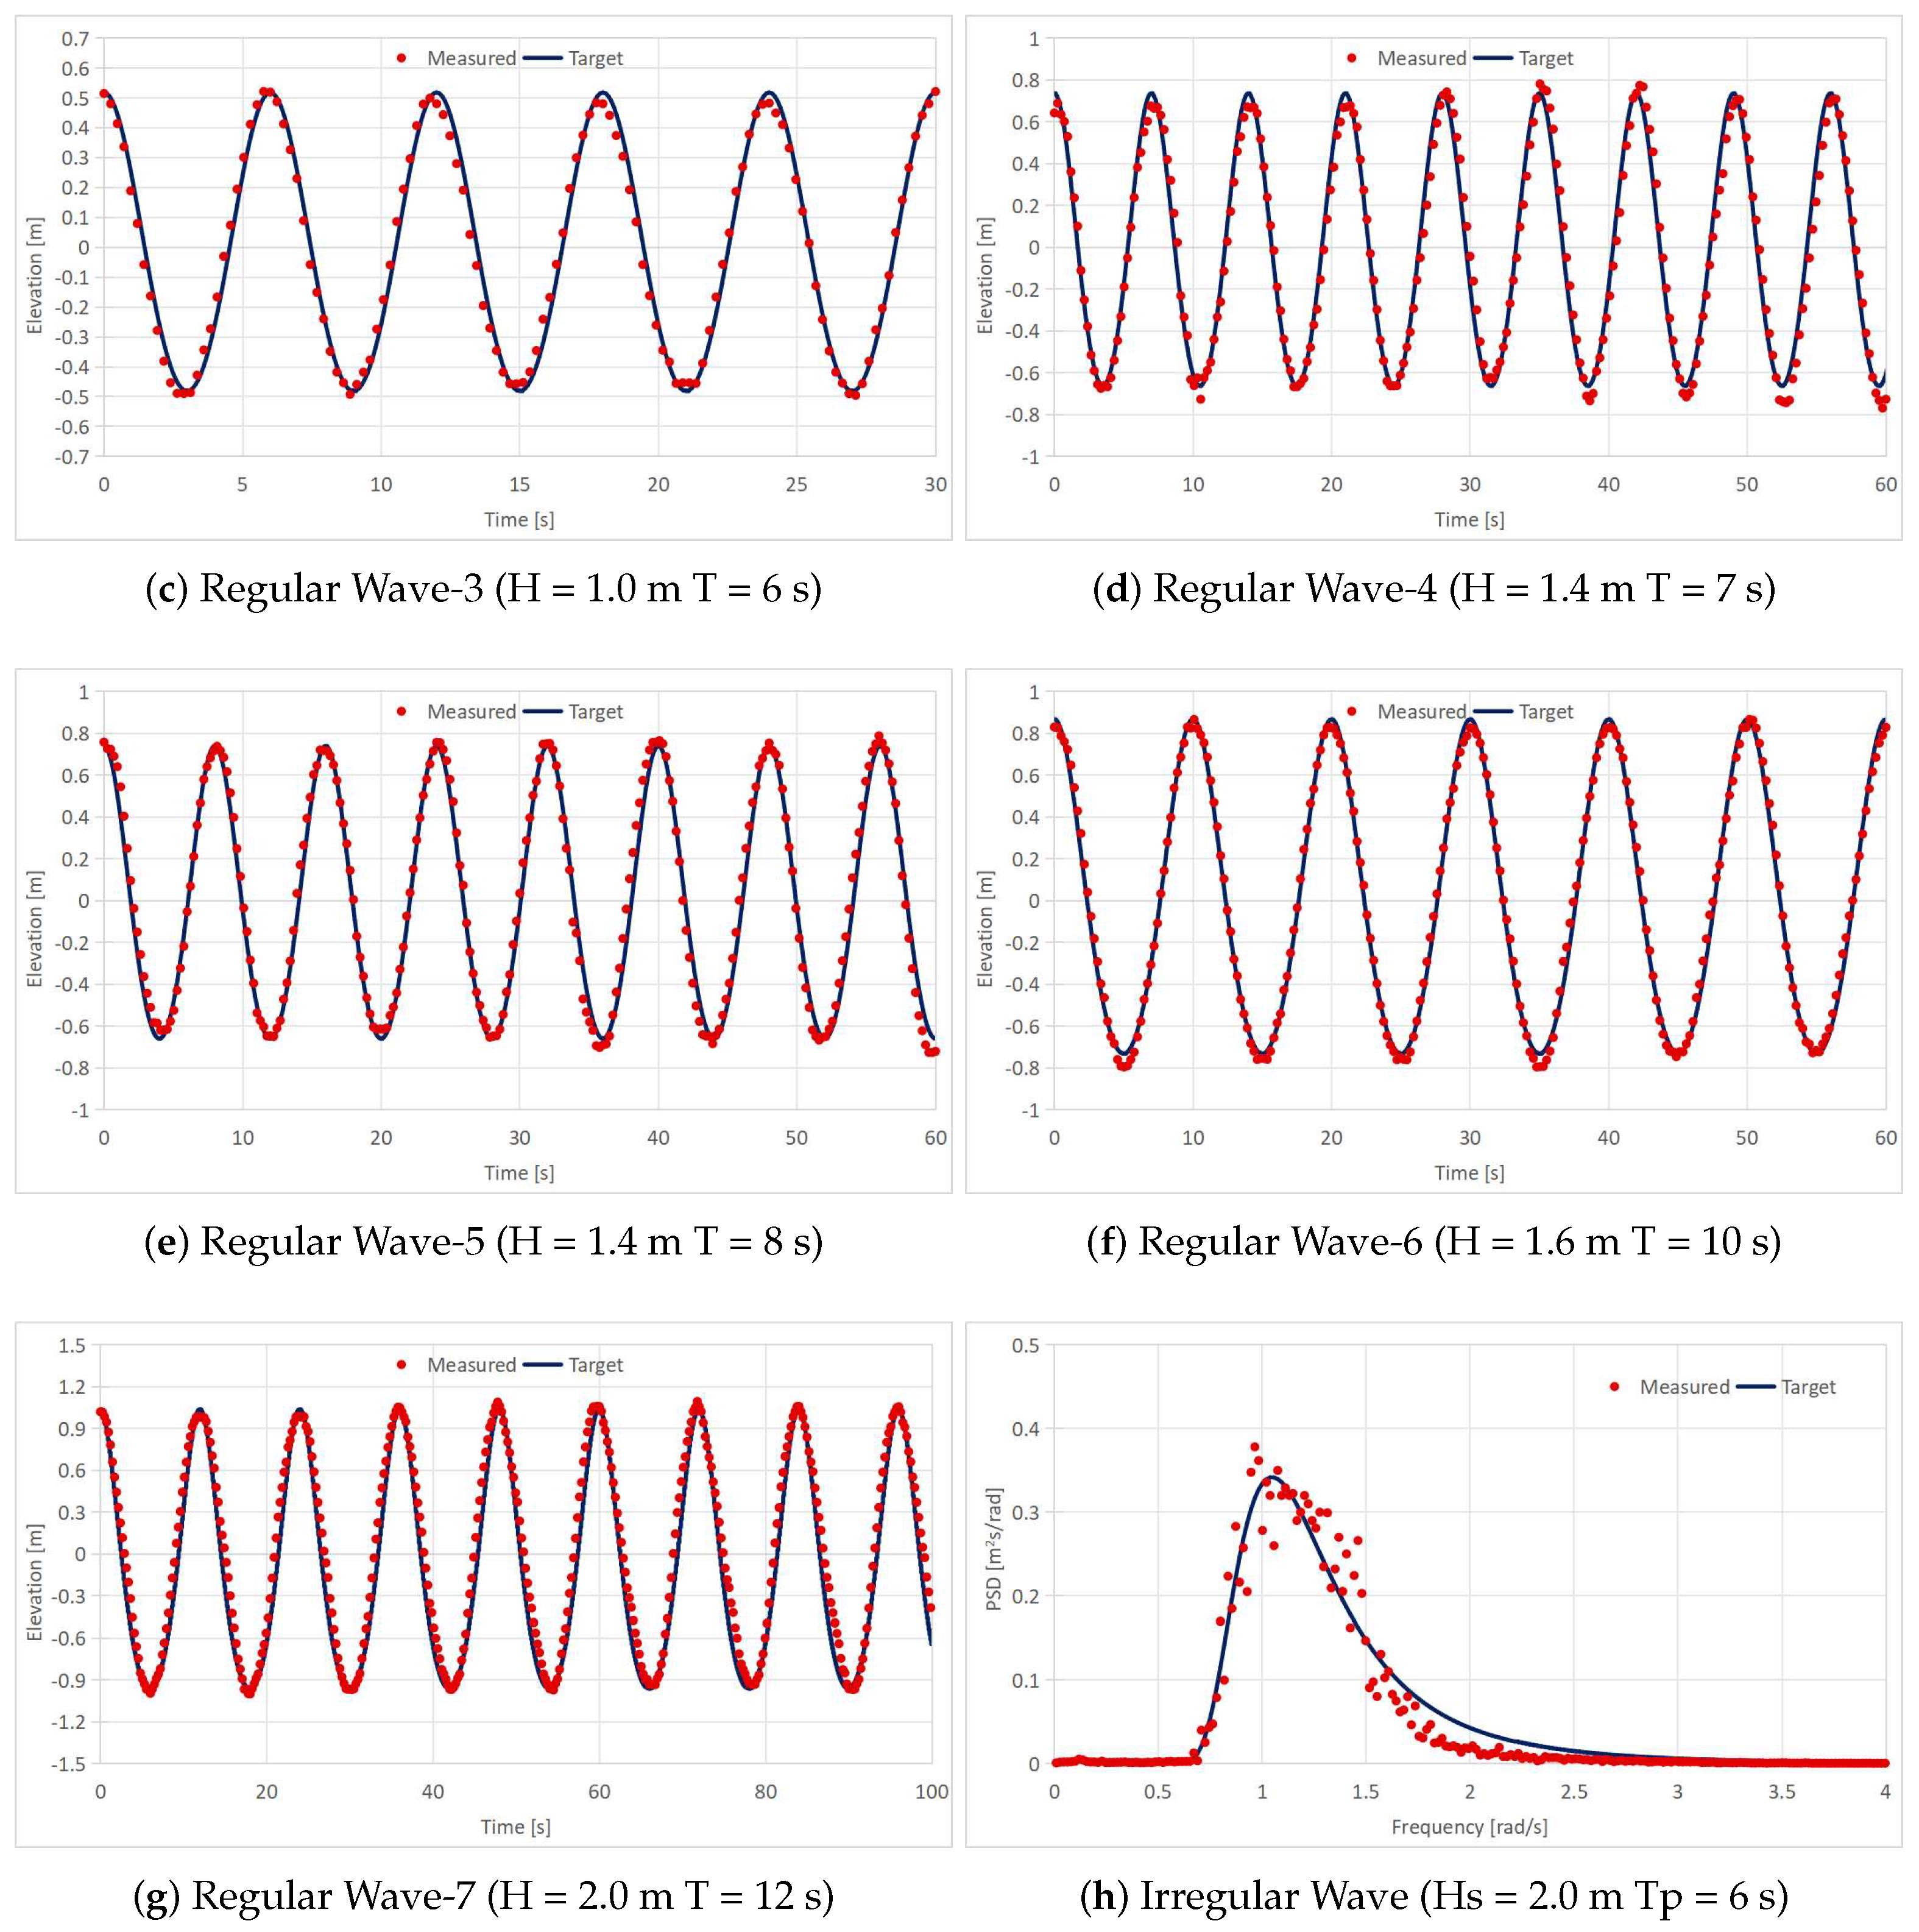
4.2. Experimental Modelling

The coupled numerical model shall be validated by physical experiments, and viscous damping modification needs to be performed based on experimental data. Therefore, in the present study, physical model-scale experiments, including free decay tests, static offset tests, regular wave tests, and irregular wave tests, were carried out with a scaling ratio of 1:36 at Ocean Engineering Basin in Shanghai Jiao Tong University. The length of the basin is 60 m, and the width is 30 m. The water depth in model tests is 0.417 m. A dual-flap-type hydraulic wave generator is adopted to model long-crested regular waves and irregular waves. A wind-generating system and a high-pressure water-jet-type current generator were applied for, respectively, simulating the target wind and current. A non-contact optical six DOFs motion measurement system was applied to track the motion responses of the model under the action of wind, wave and current. The experimental configuration is illustrated in Figure 2. A snapshot of the model test is shown in Figure 4.
Seven regular waves and one irregular wave were calibrated before the tests. Only the survival condition in Table 2 and the 90-degree wave heading were selected for checking critical environmental influence. The calibration results can be found in Figure 5. It can be confirmed that the difference in the time–domain wave elevation for regular waves between simulations and experiments is smaller than 5%. The frequency–domain Power Spectral Density (PSD) for the measured irregular wave height data shows good agreement with the target.
Free decay tests were conducted to confirm and measure the moment of inertia and viscous damping ratio of the offshore aquaculture platform. Figure 6 shows the heave, roll, and pitch modes of the free decay motions measured in free decay tests. Viscous damping ratios are applied for supplementing the viscous damping load in potential-flow time–domain simulations. The natural periods of the heave, roll, and pitch motion modes are all around 7 s.

5. Results and Discussion

In this section, the numerical simulated data and experimental measured data are presented together. The data obtained from static offset tests are applied for confirming the same horizontal stiffness of the mooring system. The results obtained from regular wave tests show the hydrodynamic performance of the offshore aquaculture platform in different wave periods. The irregular wave results further validate the numerical model and show the hydrodynamic performance of the offshore aquaculture platform in a complex sea state.

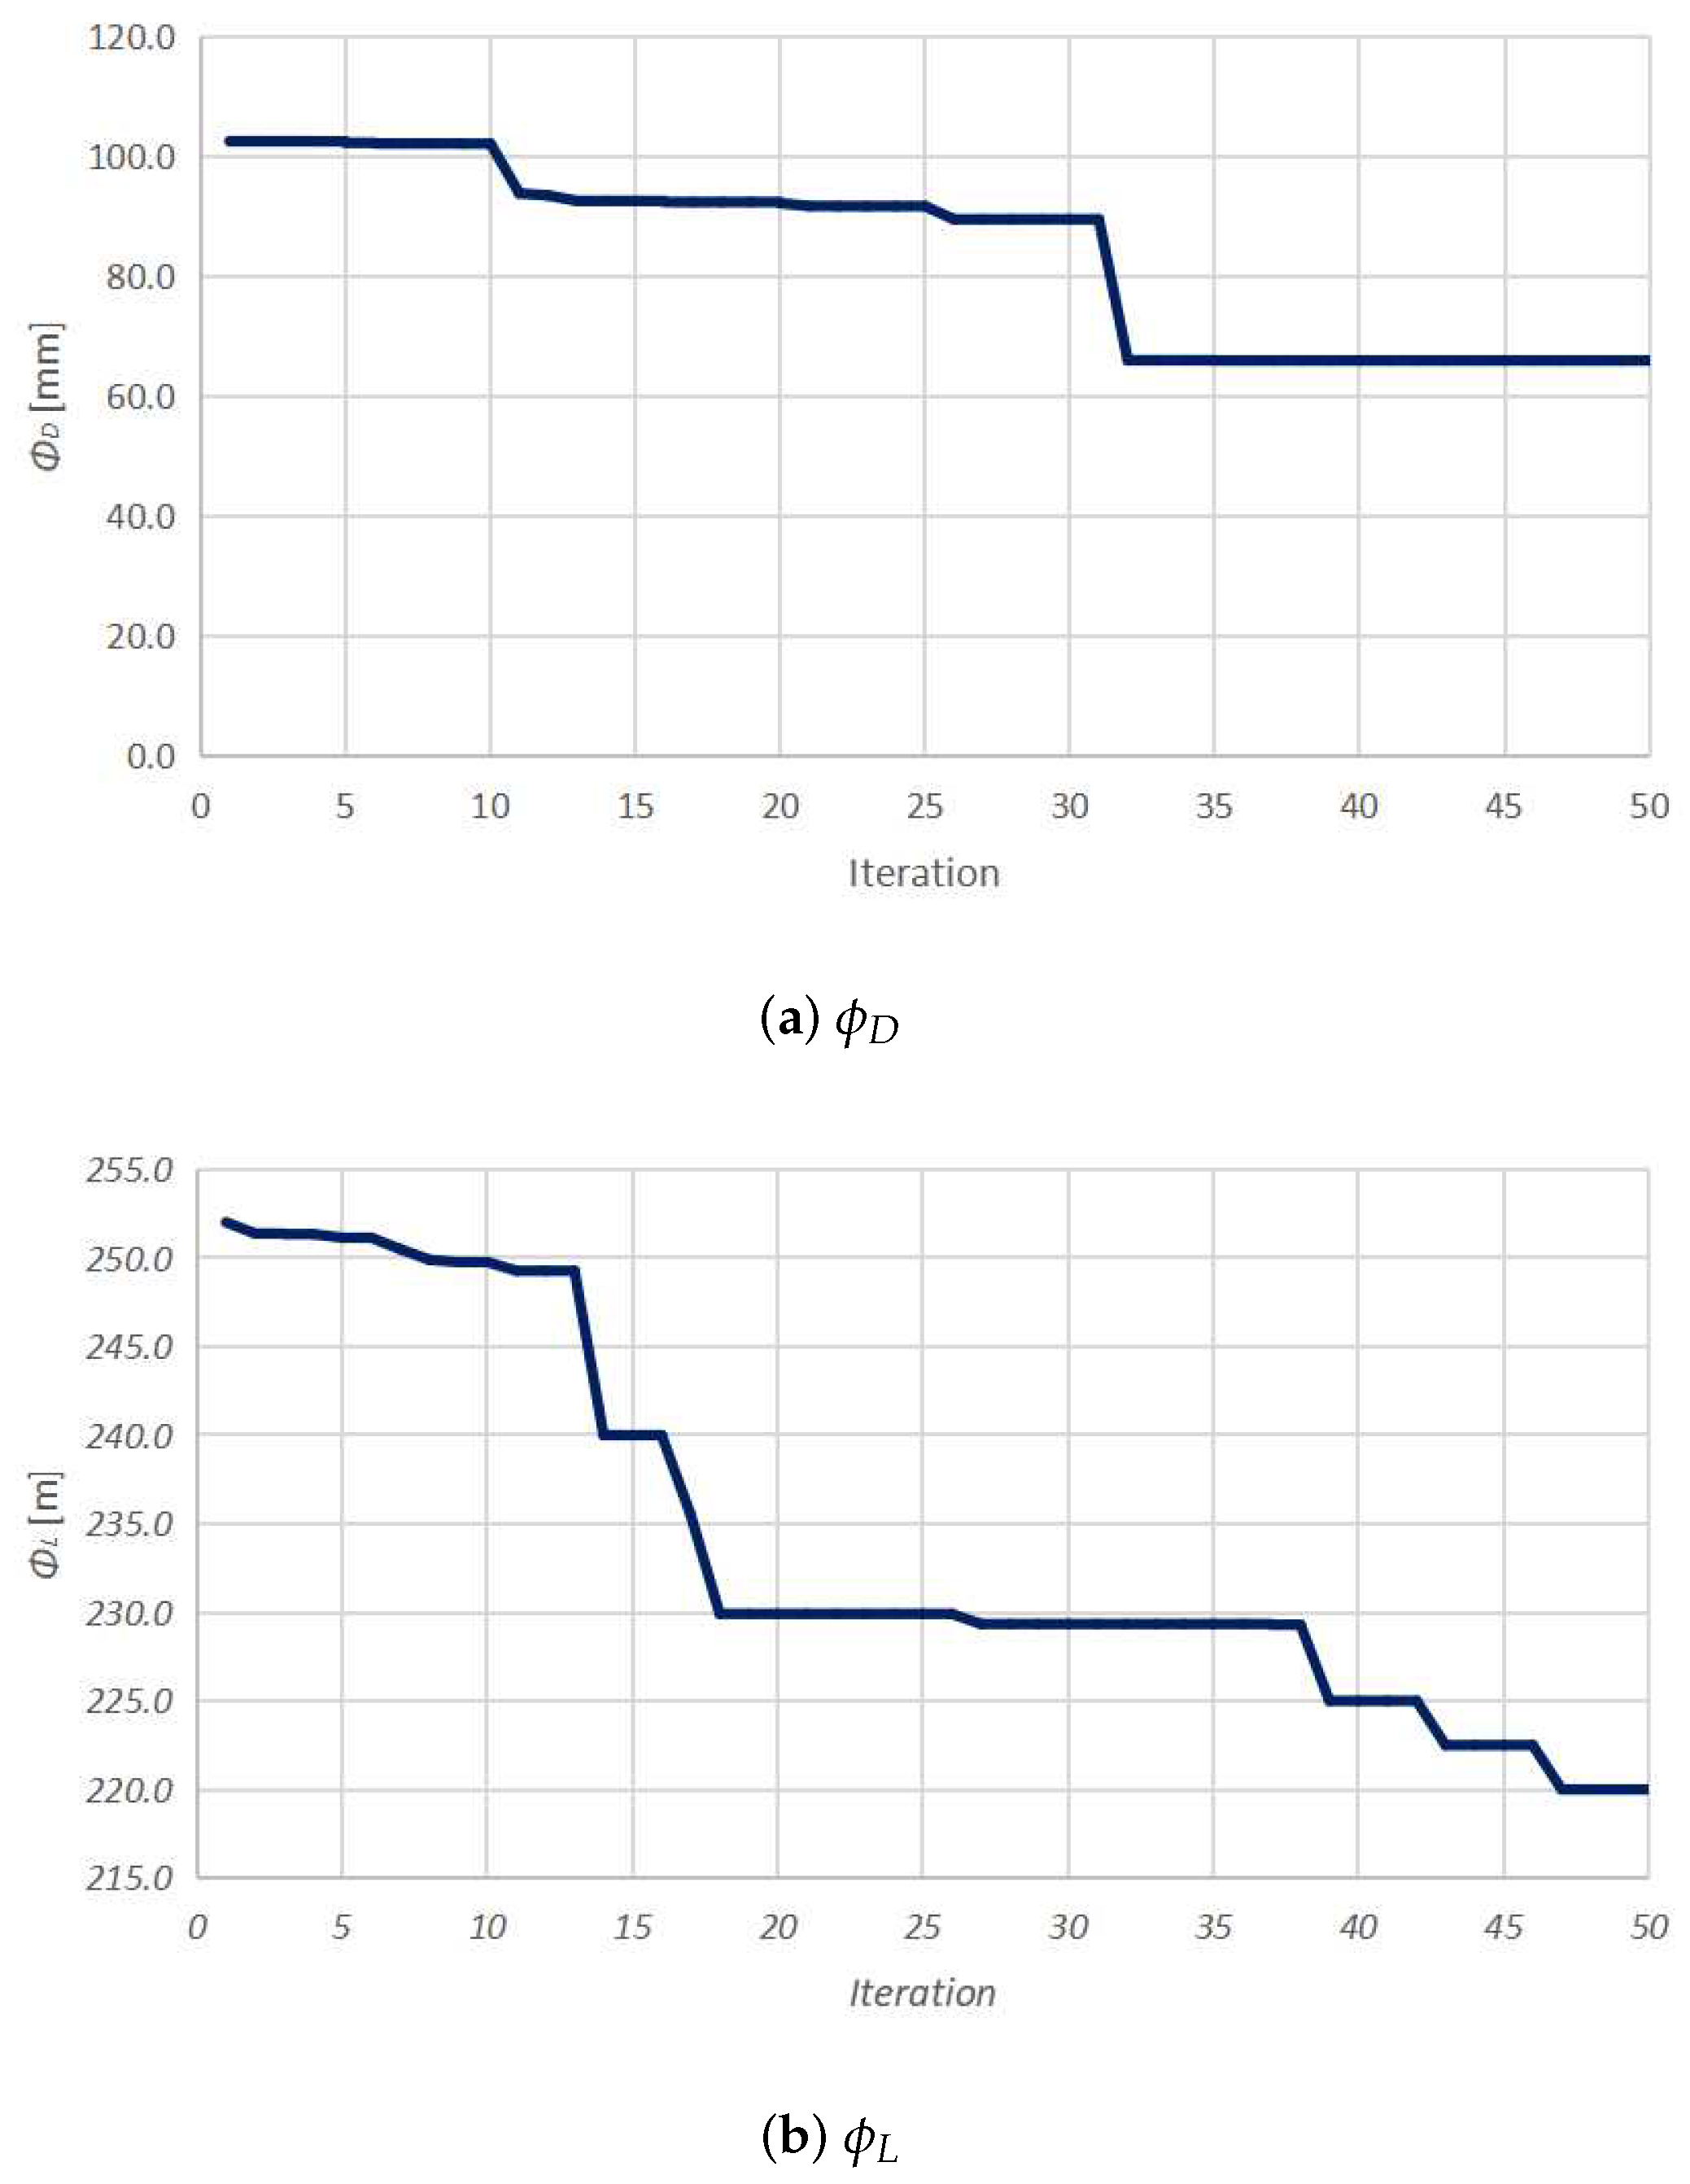
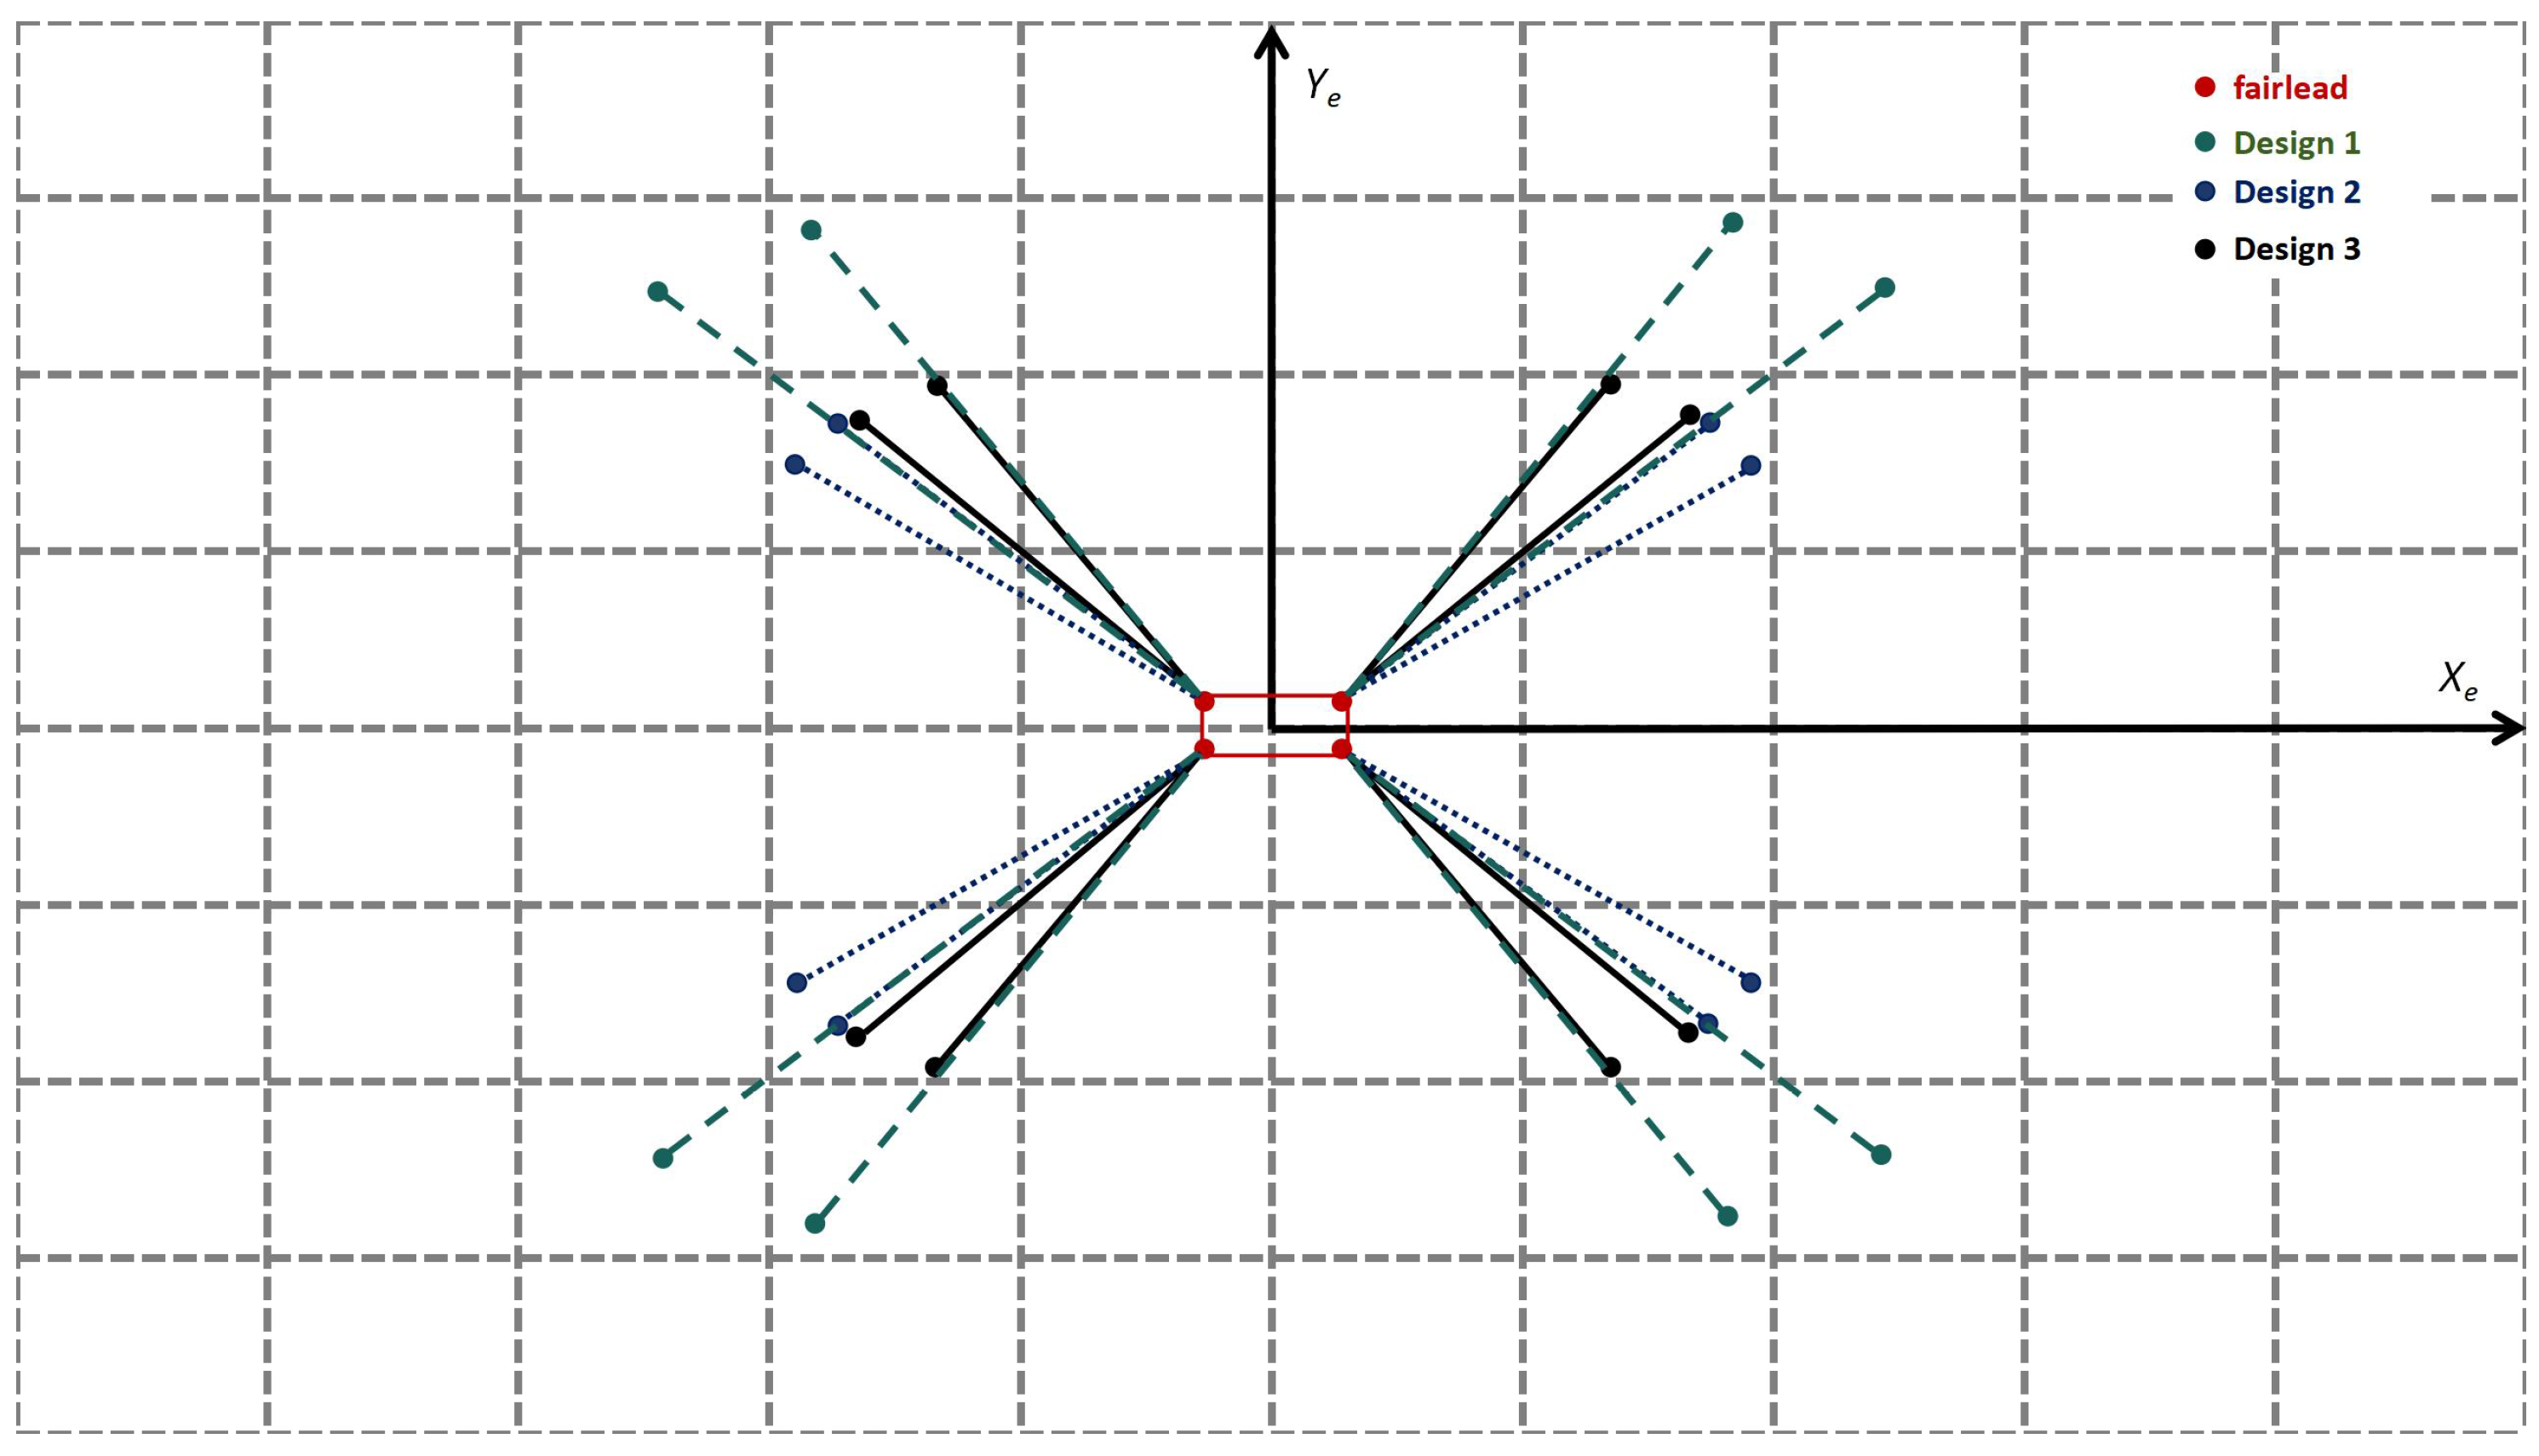
5.1. Mooring System Design

One mooring system (Design 3) is produced via the coupling of NSGA-II with a platform–mooring coupled model based on the constraints and API standards [16] listed in Section 2. The iteration process of ϕ D and ϕ L in the present mooring system’s optimization is illustrated in Figure 7. It can be found that the cable dimension ϕ D is convergent to 66 mm, and there is a tendency for the cable length ϕ L to converge to 220 m. Considering the limitation of the calculation resources, a cable length of 220 m was chosen. Two mooring systems (Design 1 and Design 2) were designed and modified for comparative analysis based on the NSGA-II mooring design, the mooring API design standards, and the target operation environmental conditions. Design 1 was designed considering the greater line–bottom contact length, and Design 2 was designed for better hydrodynamic performance. The parameters of catenary mooring cables are given in Table 3. For comparative analysis, the mooring configuration of these three mooring systems can be viewed in Figure 8.
It can be derived from the mooring configuration and the parameters of the mooring cables that because the restoring forces of the catenary mooring system are mainly contributed by the weights of the mooring lines, the hydrodynamic performance of the platform with the Design 1 or Design 2 mooring system is estimated to be much better than that with Design 3 in the head sea. The Design 1 and Design 2 mooring systems are relatively conservative, and their total weight is much larger than that of Design 3.

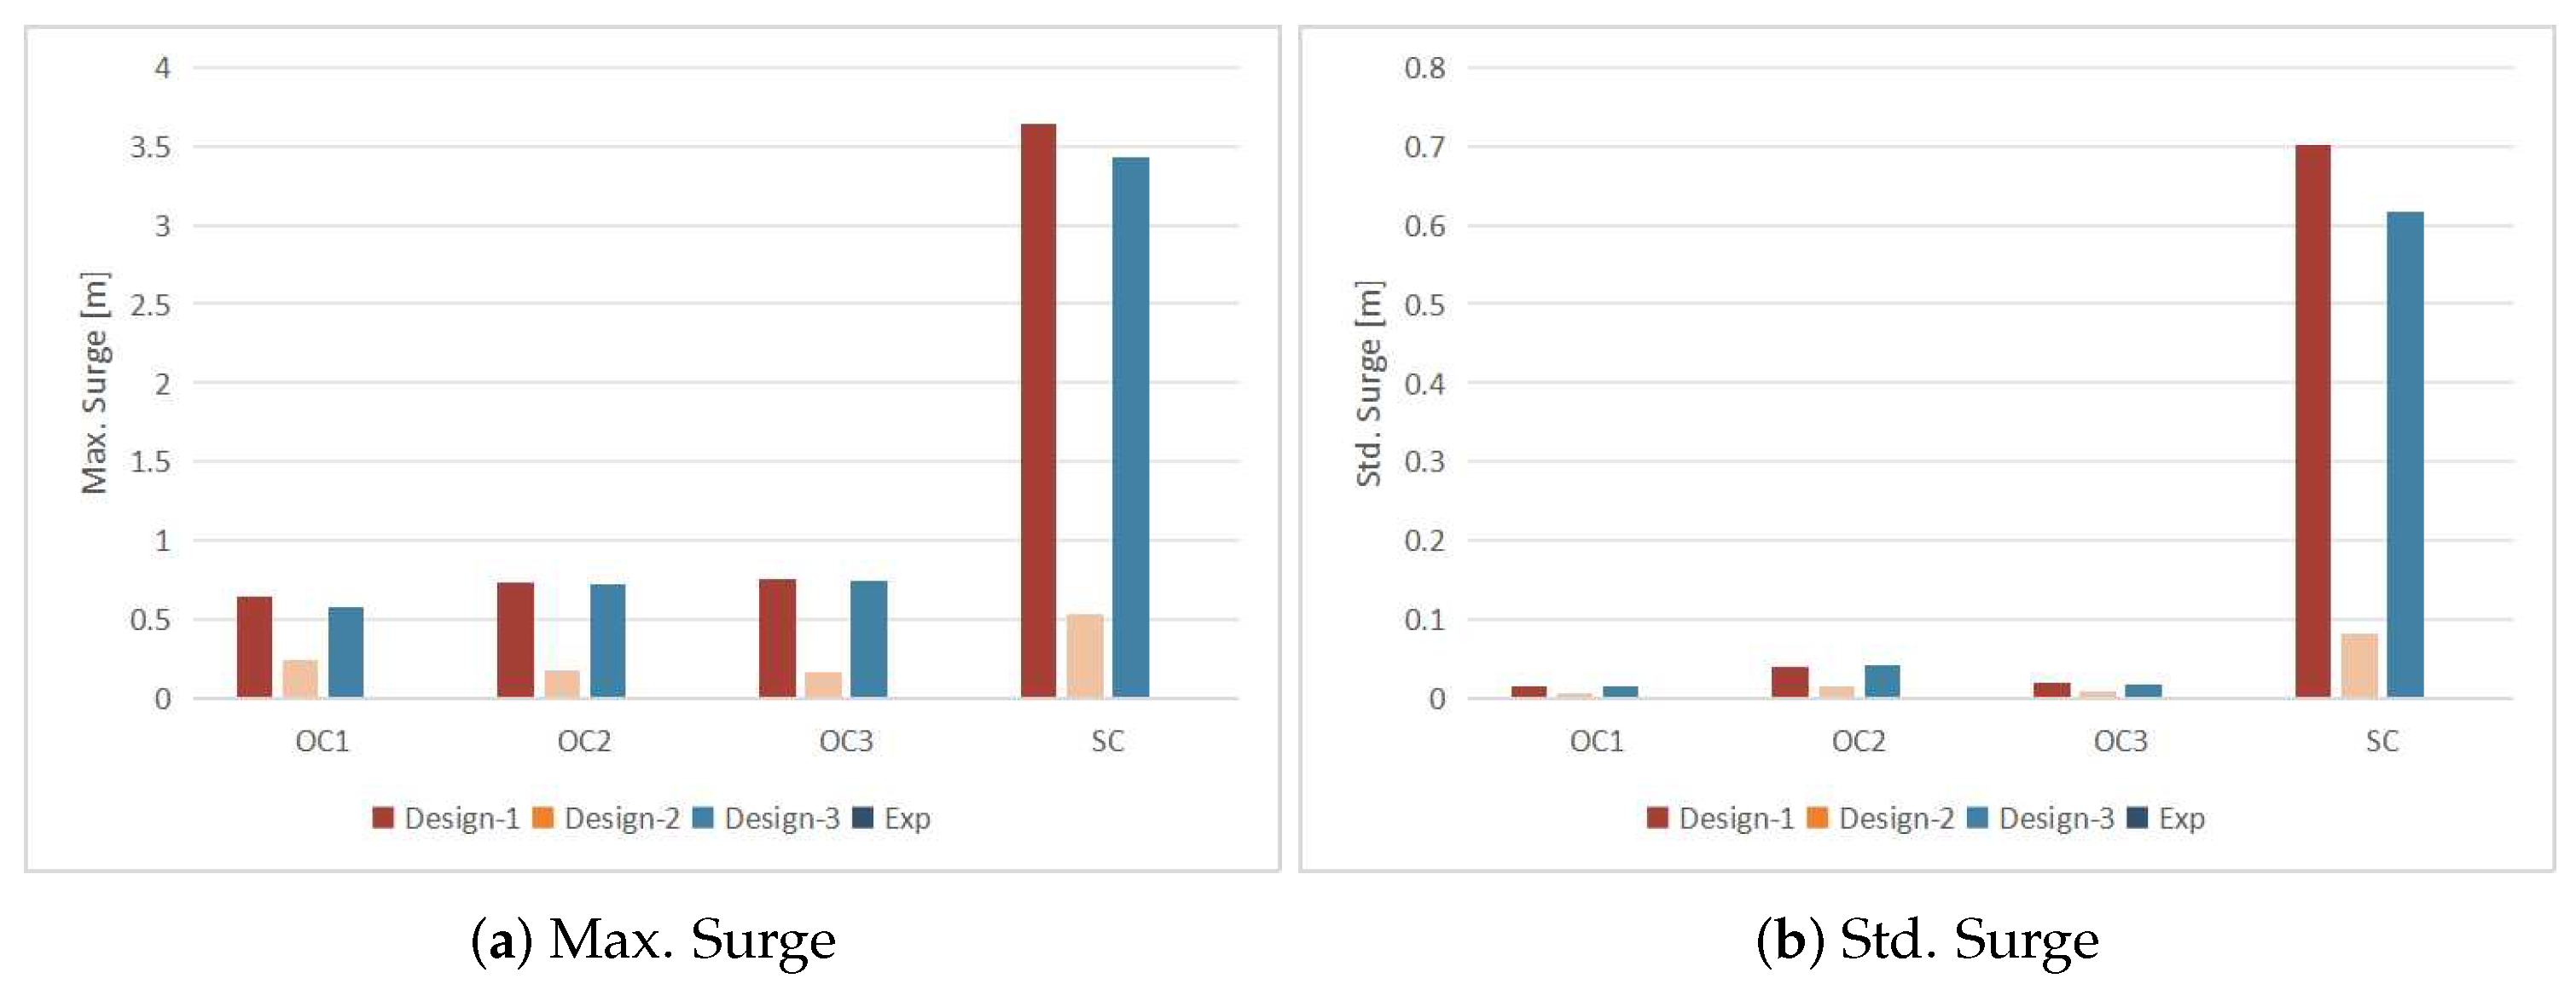
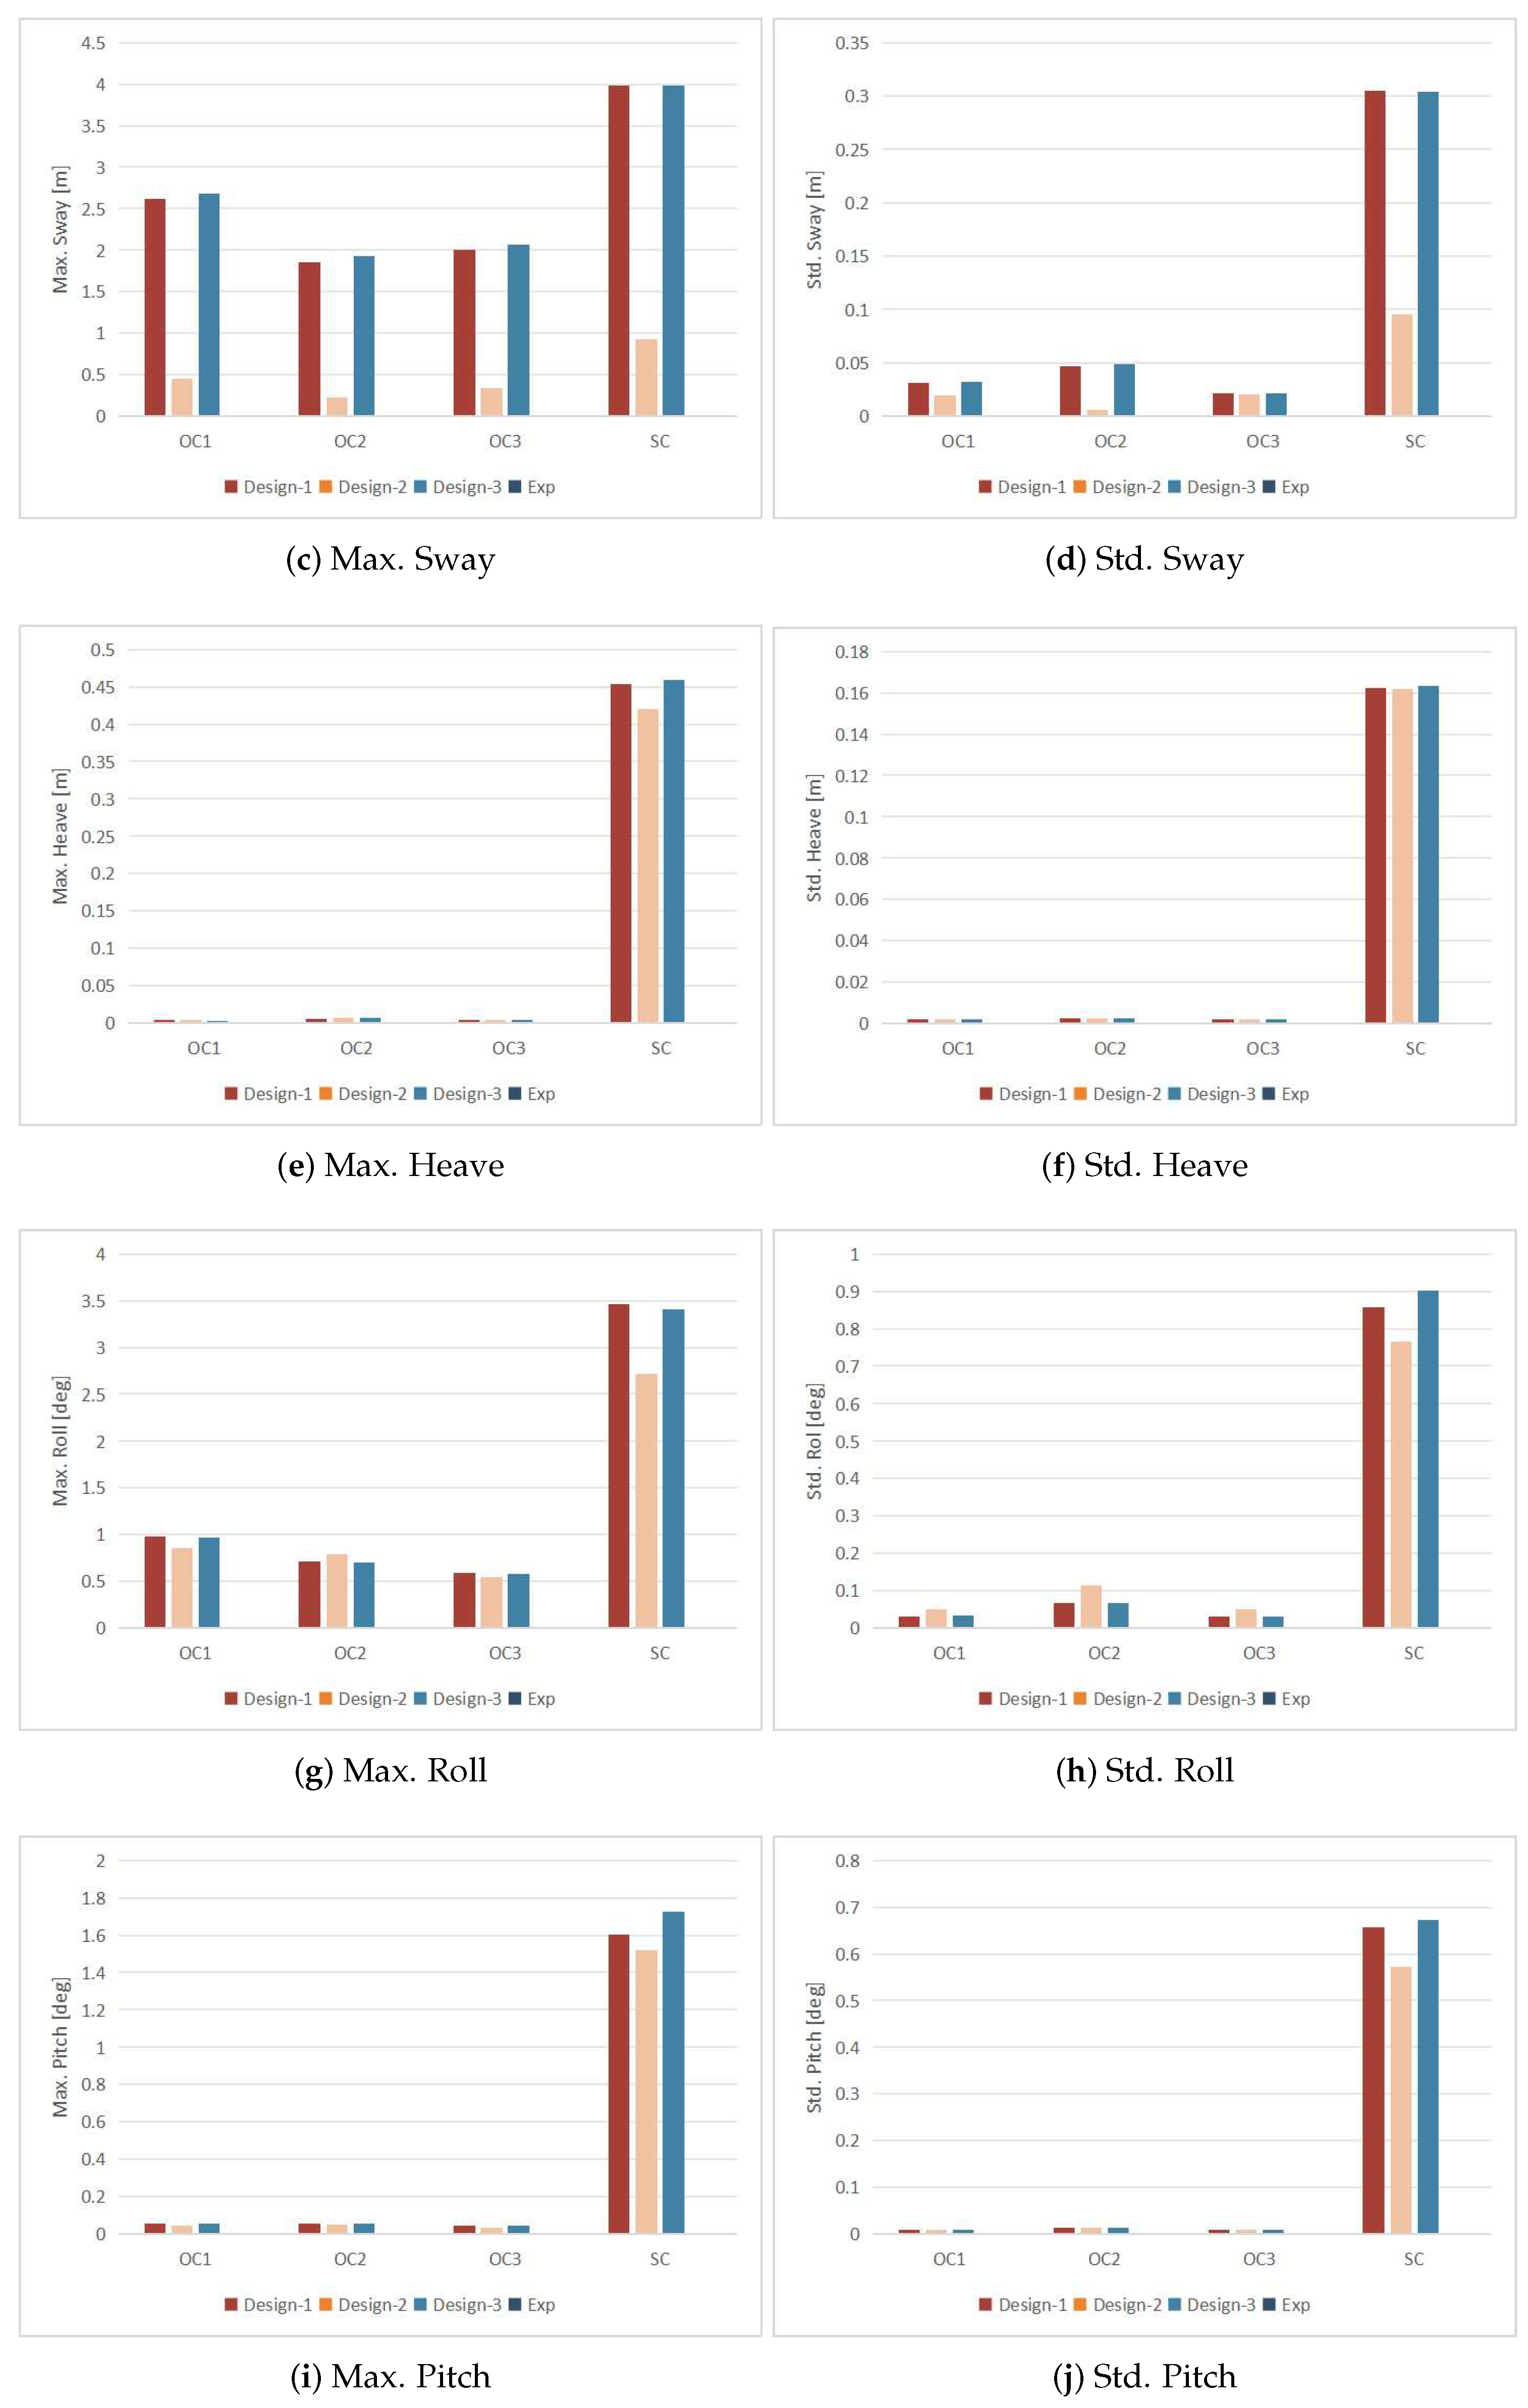
5.2. Comparative Analysis and Discussion

In model tests, Design 3’s mooring system is applied for numerical coupled model validation. The mooring system is calibrated via static offset tests (see Figure 9). It can be found that the measured static X-axis and Y-axis stiffness curves match the target one well.
Figure 10, Figure 11 and Figure 12 show the maximum and standard deviations of motion responses of the moored aquaculture platform obtained via numerical calculations and experiments. It is evident that there is significant concurrence between the time–domain simulations and model tests in terms of both sway and heave maximum and standard deviations. The discrepancies in standard deviations between these two methods are less than 2.5%. However, there are slightly larger errors in the maximum values due to the variation in random seeds used in simulations and experiments. Furthermore, there is a notable disparity in roll motions. The model tests reveal the presence of green water in irregular waves, which can lead to highly nonlinear behavior, particularly in roll motions. On the other hand, the numerical coupled model is based on linear wave assumptions, resulting in some theoretical inaccuracies.
Figure 13 describes the maximum tensions of the cables in regular waves using both numerical and experimental tools. It should be noted that the tensions here are divided by wave height for comparison. The maximum mooring tension given by numerical simulations is slightly larger than that provided by model tests, which may be caused by the relatively conservative estimation of the nonlinear damping. Table 4 also shows the comparison of the maximum tension and safety factor in harsh sea states between numerical simulations and experiments. Furthermore, this observation provides confirmation of the robustness and reliability of the numerical model, which can subsequently be utilized for conducting additional simulations.
Figure 10, Figure 11, Figure 12 and Figure 13 and Table 4 present a comparison of the motion response and maximum tension of the aquaculture platform under the influence of different environmental load directions and mooring system designs. The following observations can be drawn:
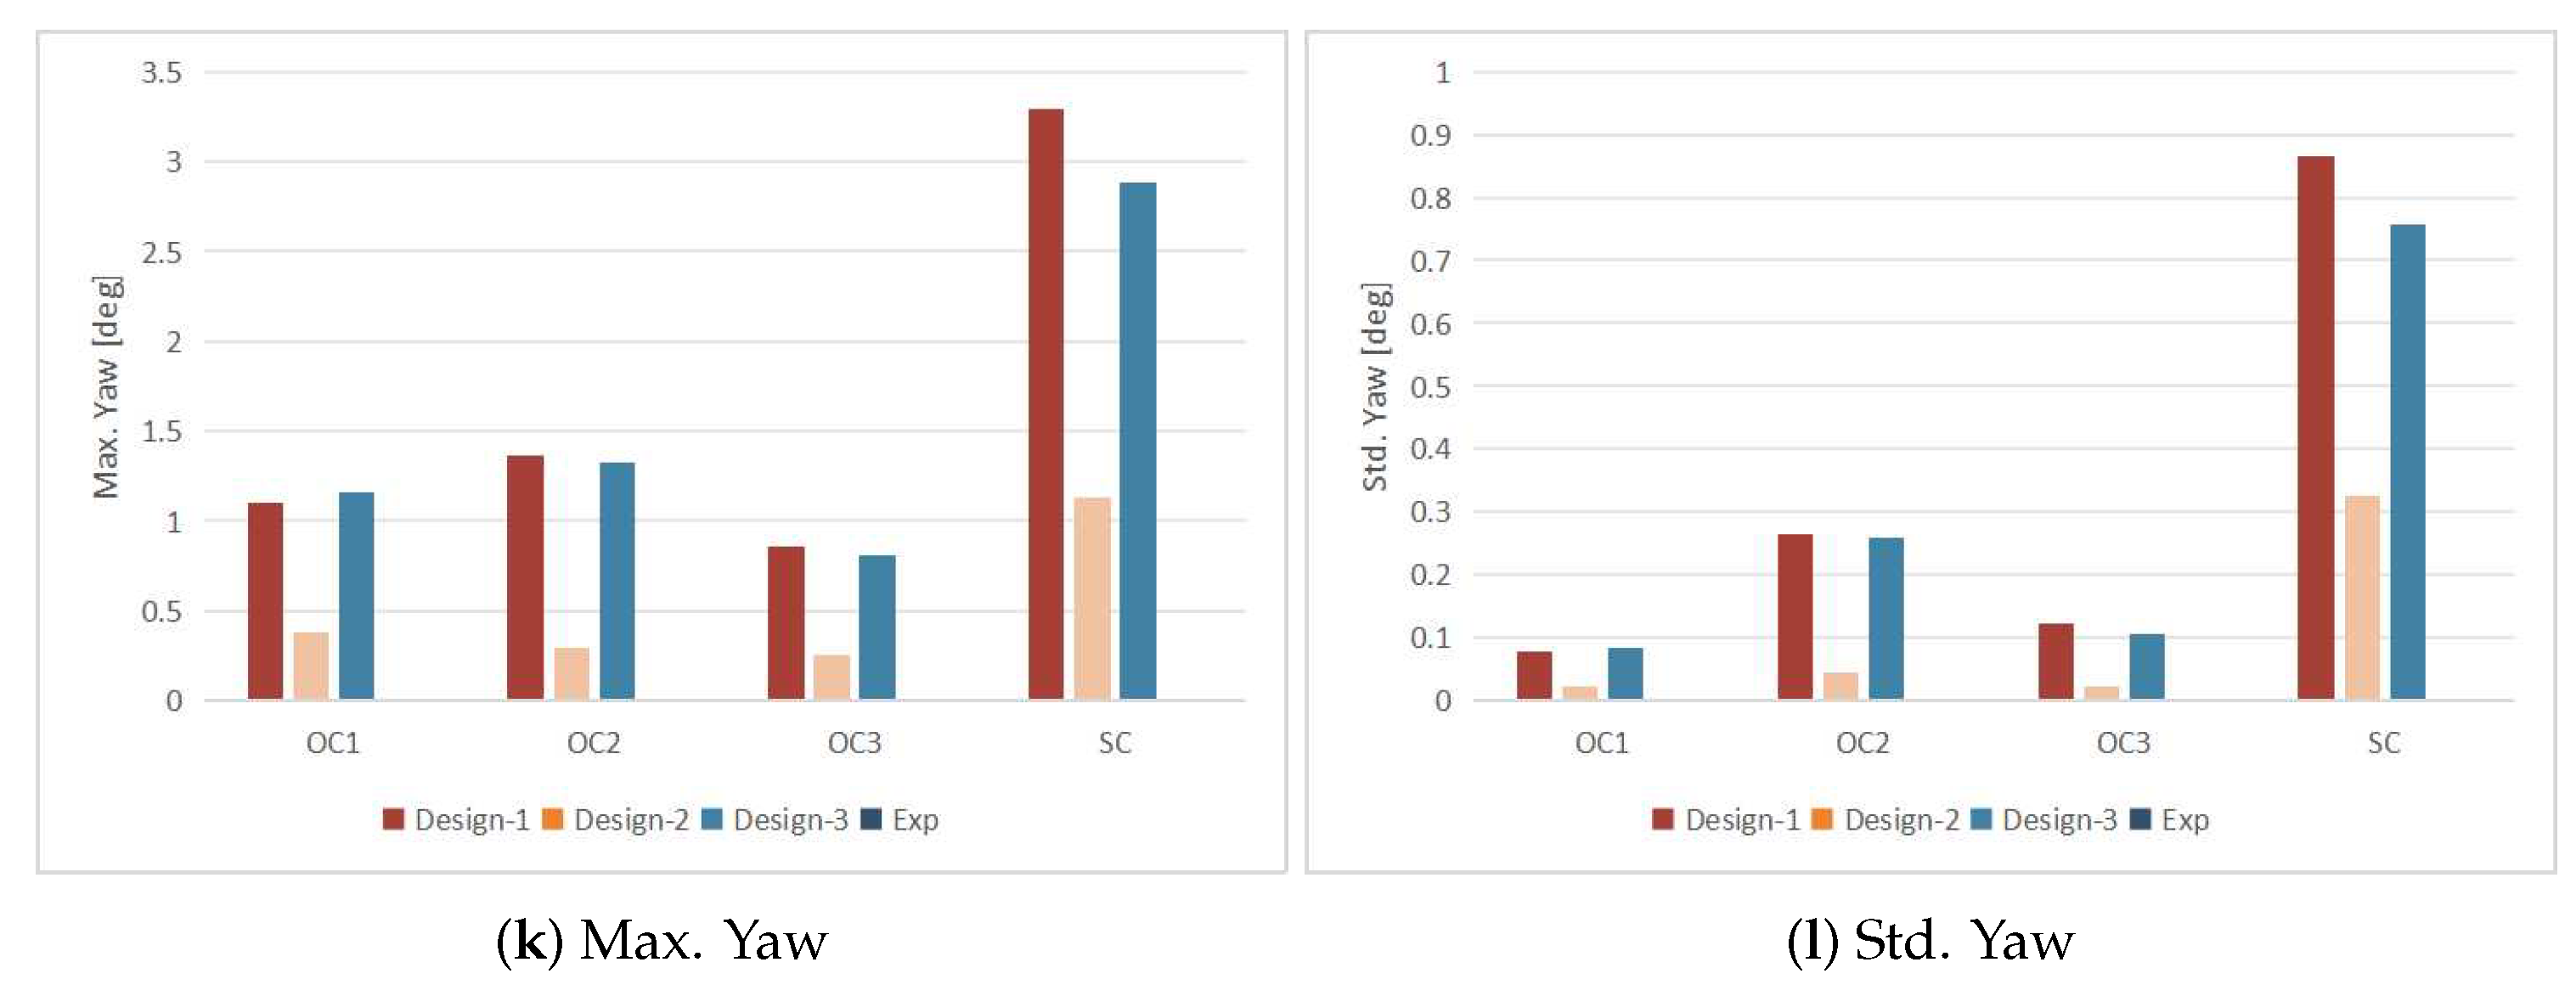
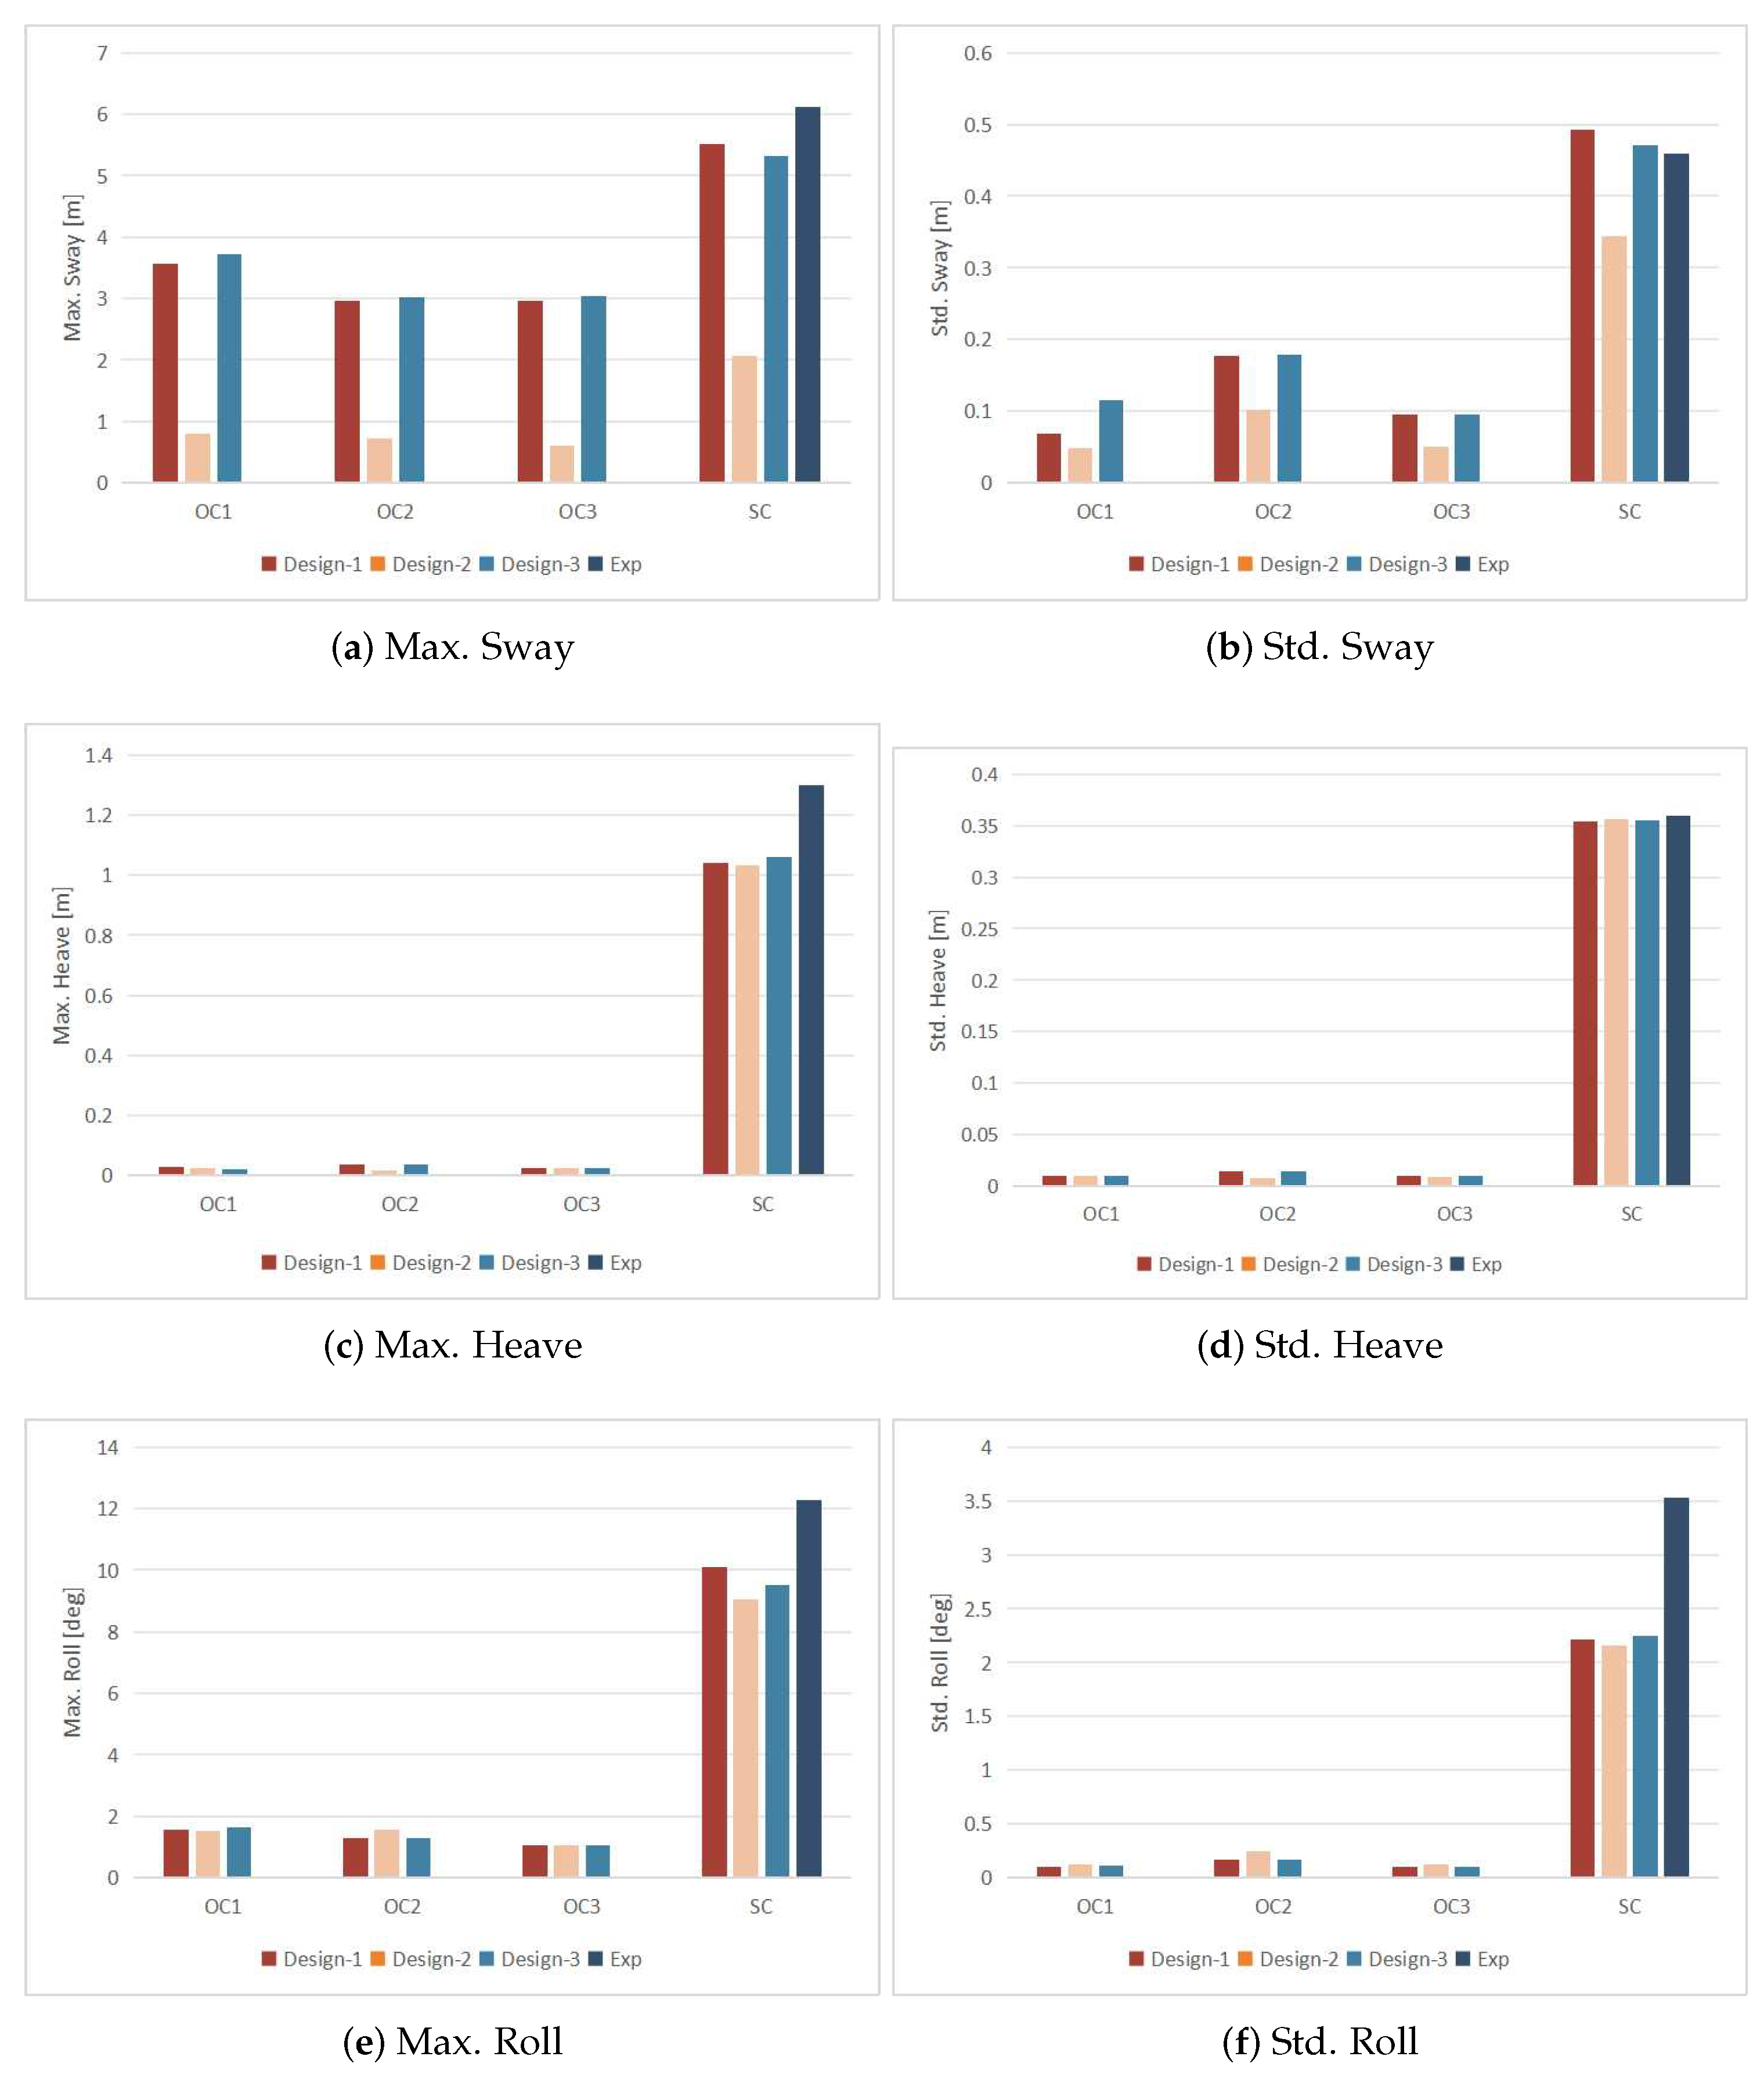
  • Design 2 performs well in terms of motion responses, both in survival conditions and operational conditions, compared to the other two mooring designs.
  • Design 1 and Design 3 exhibit similar performance, particularly in horizontal motions such as surge, sway, and yaw. However, these motions are noticeably larger in magnitude compared to Design 2. This difference may be attributed to the relatively small axial stiffness of Design 1 and Design 3.
  • In operational conditions, the heave, roll, and pitch motions of all three designs are quite similar, possibly due to the presence of small wave heights.
  • In some cases, Design 1, despite having a larger total weight, shows worse motion responses than Design 3. However, both Design 1 and Design 2 demonstrate better safety performance overall.
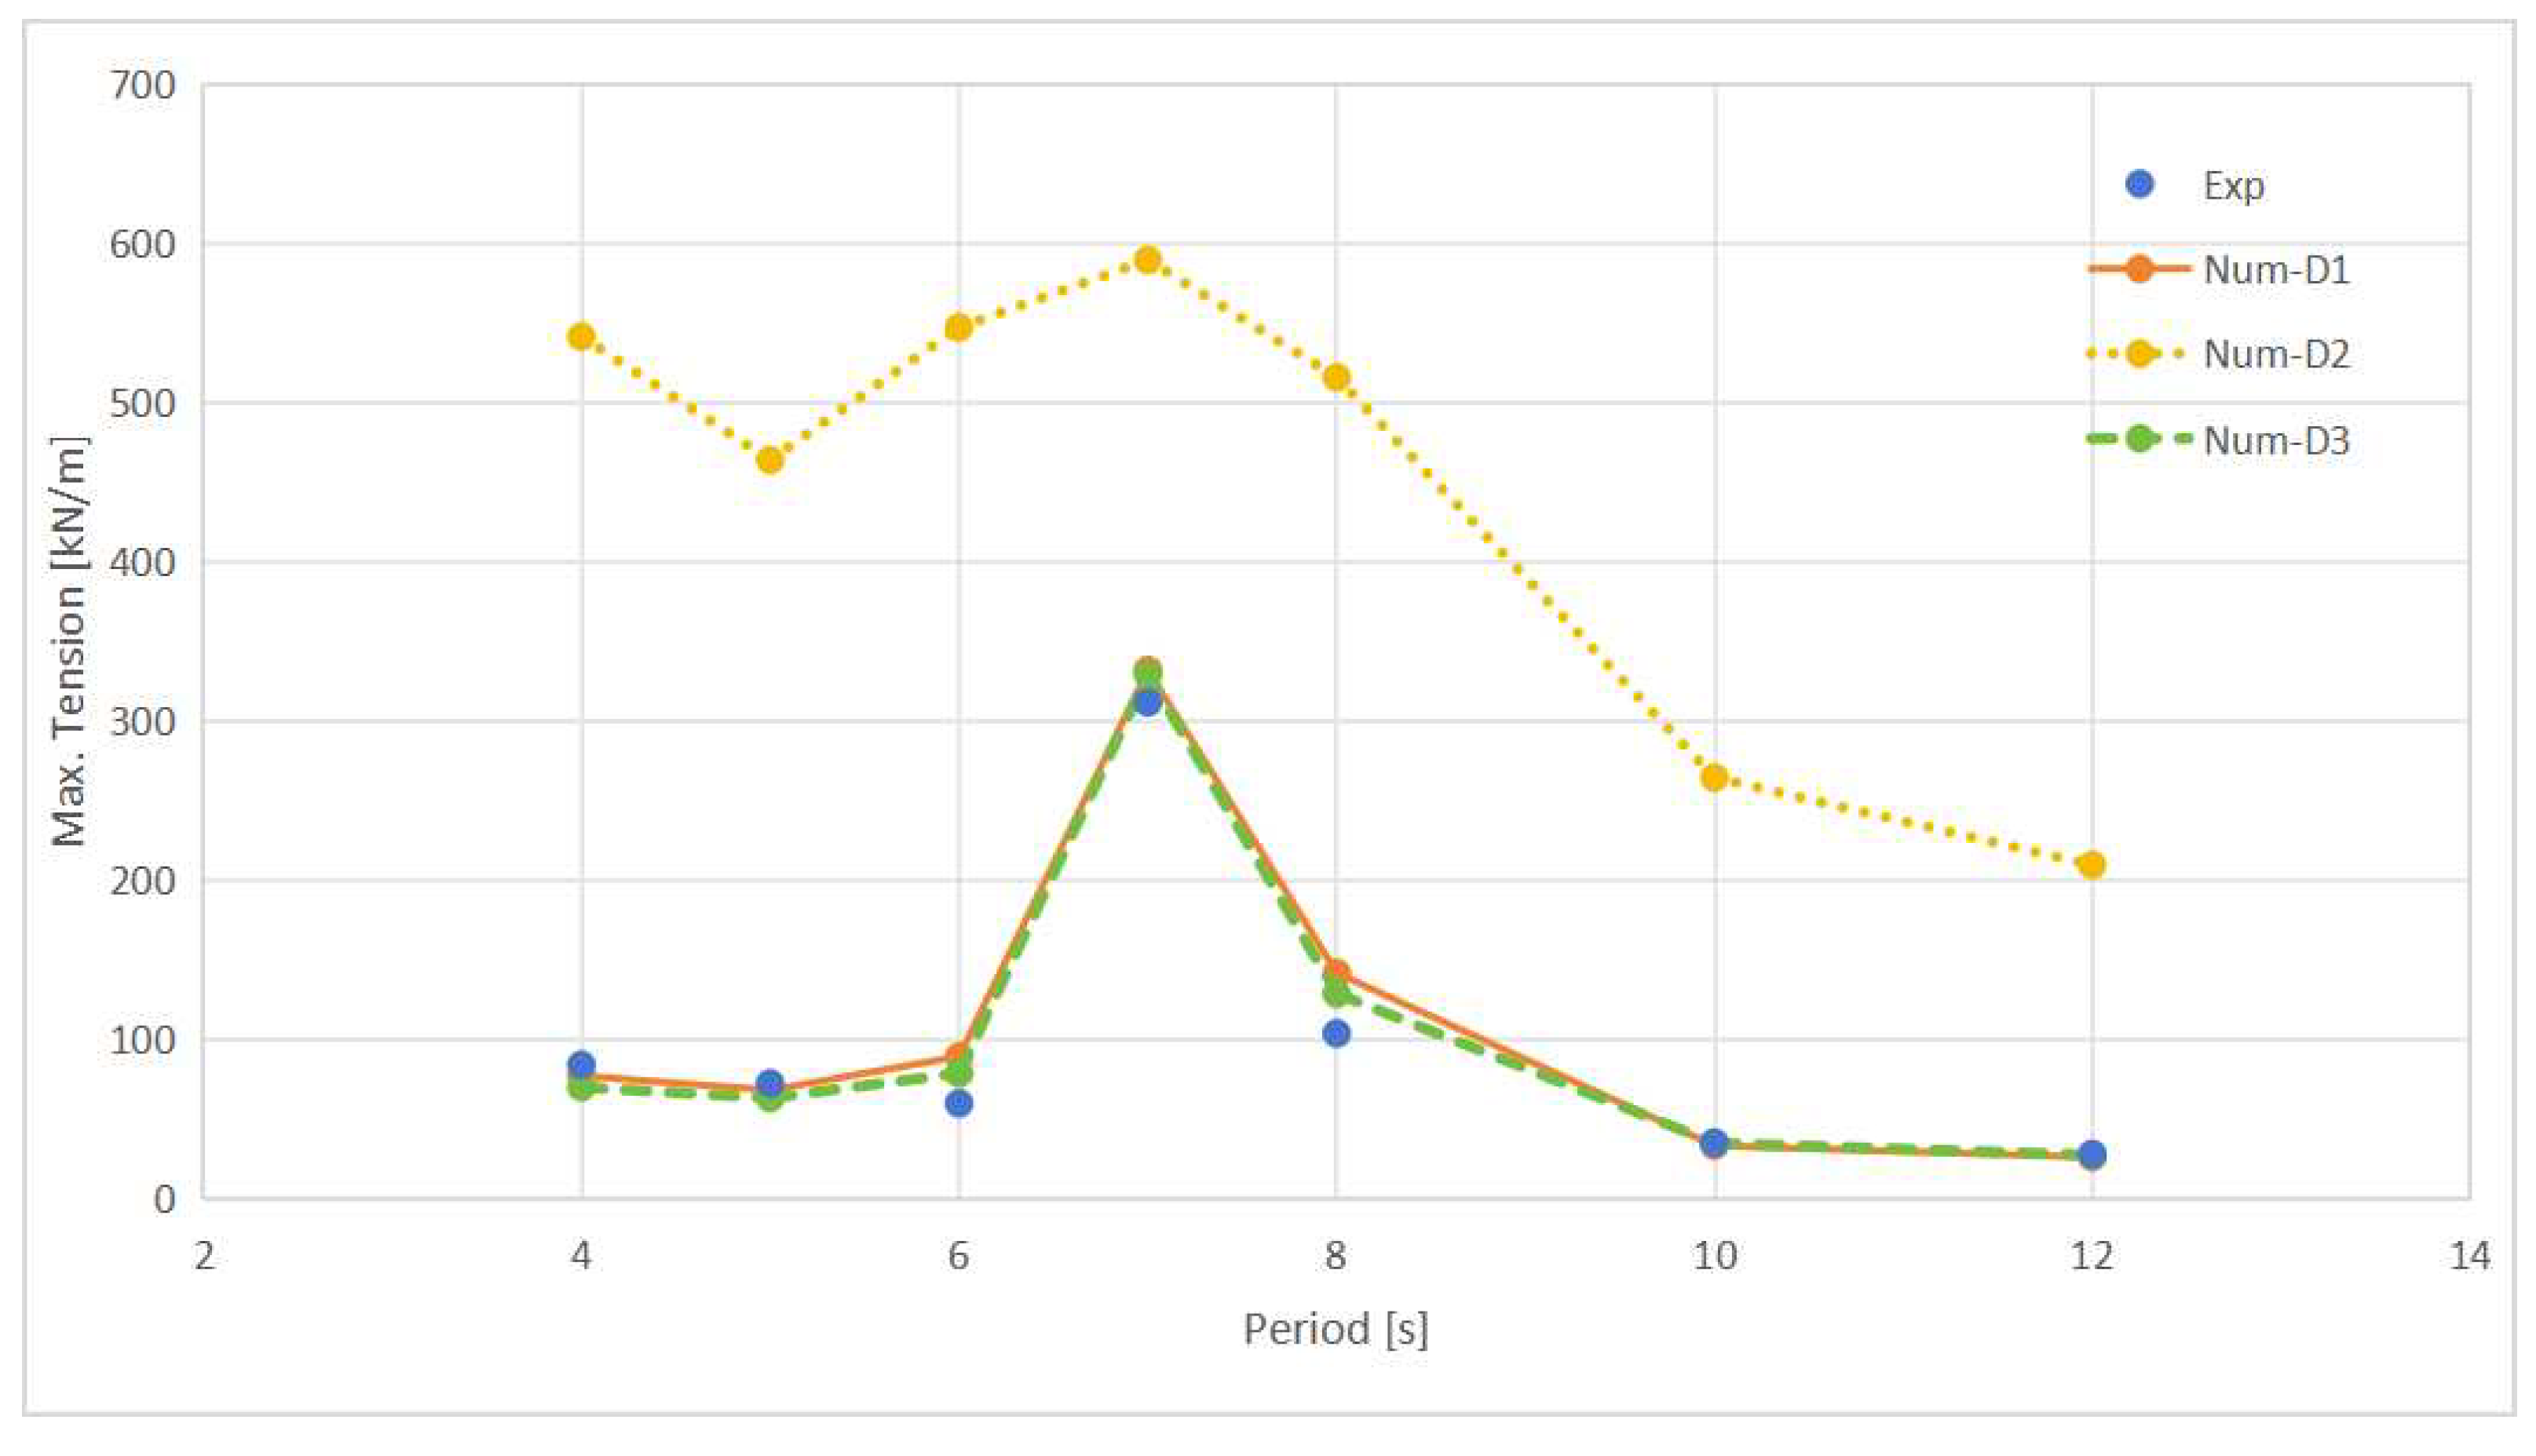
  • The maximum cable tensions increase when the wave period approaches the natural period identified in free decay tests. Among the three designs, Design 2 exhibits the highest maximum cable tension due to relatively large pretensions and stiffness.

6. Conclusions and Suggestions

In the present paper, three mooring systems are designed for an offshore aquaculture platform: two designs are based on API standards [16], and one is derived from the NSGA-II optimization method. A coupled numerical model has been established and validated via physical experiments for comparing the hydrodynamic performance of an aquaculture platform with different mooring systems. The following conclusions and suggestions can be given.
  • Potential flow time–domain numerical simulations with reasonable viscous damping modifications have been validated by model tests. Good agreement between the numerical model and the experiment has been observed.
  • Based on the evaluation of multiple designs, Design 1 does not seem to be a cost-effective and efficient solution. Although it provides sufficient line–bottom contact length, it has a high total weight and does not significantly improve the motion performance or cable tension.
  • Design 2 offers smaller motion responses and higher safety factors compared to the other designs. However, it has a much larger total weight, and therefore a higher cost. Despite this drawback, Design 2 is still a suitable solution due to its good hydrodynamic performance and reasonable budget.
  • Considering a limited budget, Design 3 emerges as a better choice. It performs similarly to the other designs in operational conditions, and meets safety factor requirements in survival conditions. Notably, Design 3 is at least 33.6% less expensive than Design 2. Therefore, Design 3 is the optimal solution, particularly when there are budget constraints.

Author Contributions

Methodology, L.W. (Liang Wang), L.W. (Lei Wang) and M.C.; Validation, L.W. (Liang Wang), M.L. and H.L.; Writing—original draft, L.W. (Liang Wang); Writing—review & editing, M.C. All authors have read and agreed to the published version of the manuscript.

Funding

This research was funded by the National Key Research and Development Program of China (Grant No. 2022YFD2401101), the Program of Qingdao National Laboratory for Marine Science and Technology (Grant No. 2021WHZZB1301), the Marine S&T Fund of Shandong Province for Qingdao Marine Science and Technology Center (Grant No. 2022QNLM030001-3), and the Central Public Interest Scientific Institution Basal Research Fund, YSFRI, Chinese Academy of Fisheries Science (Grant No. 2021YJS005).

Institutional Review Board Statement

Not applicable.

Informed Consent Statement

Not applicable.

Data Availability Statement

The data that support the findings of this study are available within the article.

Conflicts of Interest

Author Mingxiao Liang was employed by the company Shanghai Waigaoqiao Shipbuilding Co., Ltd. The remaining authors declare that the research was conducted in the absence of any commercial or financial relationships that could be construed as a potential conflict of interest.

References

  1. Bi, C.W.; Ma, C.; Zhao, Y.P.; Xin, L.X. Physical model experimental study on the motion responses of a multi-module aquaculture platform. Ocean. Eng. 2021, 239, 109862. [Google Scholar] [CrossRef]
  2. Bujas, T.; Vladimir, N.; Koričan, M.; Vukić, M.; Ćatipović, I.; Fan, A. Extended Bibliometric Review of Technical Challenges in Mariculture Production and Research Hotspot Analysis. Appl. Sci. 2023, 13, 6699. [Google Scholar] [CrossRef]
  3. Benassai, G.; Campanile, A.; Piscopo, V.; Scamardella, A. Optimization of Mooring Systems for Floating Offshore Wind Turbines. Coast. Eng. J. 2015, 57, 1550021-1–1550021-19. [Google Scholar] [CrossRef]
  4. Xu, T.J.; Dong, G.H.; Zhao, Y.P.; Li, Y.C.; Gui, F.K. Numerical investigation of the hydrodynamic behaviors of multiple net cages in waves. Aquac. Eng. 2012, 48, 6–18. [Google Scholar] [CrossRef]
  5. Shen, Y.; Greco, M.; Faltinsen, O.M.; Nygaard, I. Numerical and experimental investigations on mooring loads of a marine fish farm in waves and current. J. Fluids Struct. 2018, 79, 115–136. [Google Scholar] [CrossRef]
  6. Wang, Y.; Wang, X.; Xu, S.; Wang, L. Motion Responses of a Catenary-Taut-Hybrid Moored Single Module of a Semisubmersible Very Large Floating Structure in Multisloped Seabed. J. Offshore Mech. Arct. Eng. 2018, 140, 031102. [Google Scholar] [CrossRef]
  7. Shafieefar, M.; Rezvani, A. Mooring optimization of floating platforms using a genetic algorithm. Ocean. Eng. 2007, 34, 1413–1421. [Google Scholar] [CrossRef]
  8. Brommundt, M.; Krause, L.; Merz, K.; Muskulus, M. Mooring System Optimization for Floating Wind Turbines using Frequency Domain Analysis. Energy Procedia 2012, 24, 289–296. [Google Scholar] [CrossRef]
  9. Cruces Girón, A.R.; Corrêa, F.N.; Vázquez Hernández, A.O.; Jacob, B.P. An integrated methodology for the design of mooring systems and risers. Mar. Struct. 2014, 39, 395–423. [Google Scholar] [CrossRef]
  10. Monteiro, B.d.F.; de Pina, A.A.; Baioco, J.S.; Albrecht, C.H.; de Lima, B.S.L.P.; Jacob, B.P. Toward a methodology for the optimal design of mooring systems for floating offshore platforms using evolutionary algorithms. Mar. Syst. Ocean. Technol. 2016, 11, 55–67. [Google Scholar] [CrossRef]
  11. Gonzalez, I.F.; Mercier, R.S. Optimized design of statically equivalent mooring systems. Ocean. Eng. 2016, 111, 384–397. [Google Scholar] [CrossRef]
  12. Li, L.; Jiang, Z.; Ong, M.C.; Hu, W. Design optimization of mooring system: An application to a vessel-shaped offshore fish farm. Eng. Struct. 2019, 197, 109363. [Google Scholar] [CrossRef]
  13. Liang, M.; Wang, X.; Xu, S.; Ding, A. A shallow water mooring system design methodology combining NSGA-II with the vessel-mooring coupled model. Ocean. Eng. 2019, 190, 106417. [Google Scholar] [CrossRef]
  14. Monteiro, B.d.F.; Baioco, J.S.; Albrecht, C.H.; Pires, B.S.L.; Jacob, B.P. Optimization of mooring systems in the context of an integrated design methodology. Mar. Struct. 2021, 75, 102874. [Google Scholar] [CrossRef]
  15. Yu, J.; Cheng, X.; Fan, Y.; Ni, X.; Chen, Y.; Ye, Y. Mooring design of offshore aquaculture platform and its dynamic performance. Ocean. Eng. 2023, 275, 114146. [Google Scholar] [CrossRef]
  16. API. Recommended Practice for Design and Analysis of Stationkeeping Systems for Floating Structures: Exploration and Production Department. API Recommended Practice 2SK (RP 2SK); American Petroleum Institute: Washington, DC, USA, 1997. [Google Scholar]
  17. Deb, K.; Pratap, A.; Agarwal, S.; Meyarivan, T. A fast and elitist multiobjective genetic algorithm: NSGA-II. IEEE Trans. Evol. Comput. 2002, 6, 182–197. [Google Scholar] [CrossRef]
  18. Cummins, W. The impulse response function and ship motions. In Proceedings of the Symposium on Ship Theory, Hamburg, Germany, 25–27 January 1962. [Google Scholar]
  19. Lee, C. WAMIT Theory Manual; MIT Press: Cambridge, MA, USA, 1995. [Google Scholar]
  20. Bureau-Veritas. Hydrostar for Experts User Manual; Research Department Bureau Veritas Press: Paris, France, 2007. [Google Scholar]
  21. Forum, O.C.I.M. Prediction of Wind and Current Loads on VLCCs; OCIMF: London, UK, 1977. [Google Scholar]
  22. Pinkster, J. Low-frequency phenomena associated with vessels moored at sea. Soc. Pet. Eng. J. 1975, 15, 487–494. [Google Scholar] [CrossRef]
  23. Chen, X.B. Middle-field formulation for the computation of wave-drift loads. J. Eng. Math. 2007, 59, 61–82. [Google Scholar] [CrossRef]
  24. Newman, J.N. The drift force and moment on ships in waves. J. Ship Res. 1967, 11, 51–60. [Google Scholar] [CrossRef]
  25. Wang, Y.; Wang, X.; Xu, S.; Ding, A. Motion responses of a moored semi-submersible-type single module of a VLFS in multi-slope shallow water. Int. J. Offshore Polar Eng. 2017, 27, 397–405. [Google Scholar] [CrossRef]
  26. Orcina, L. OrcaFlex User Manual Version 11.0 B; Orcina: Ulverston, UK, 2016. [Google Scholar]
Figure 1. The panel model of the present offshore aquaculture platform.
Jmse 11 02134 g001
Figure 2. Experimental configuration of the catenary-moored aquaculture platform.
Jmse 11 02134 g002
Figure 3. Illustration of the lumped-mass method.
Jmse 11 02134 g003
Figure 4. Snapshot of the offshore aquaculture platform within waves.
Jmse 11 02134 g004
Figure 5. Regular and irregular wave calibration results.
Jmse 11 02134 g005aJmse 11 02134 g005b
Figure 6. The results of free decay tests.
Jmse 11 02134 g006aJmse 11 02134 g006b
Figure 7. The iteration process of ϕ D and ϕ L in present mooring system’s optimization.
Jmse 11 02134 g007
Figure 8. The mooring configuration of the three mooring system designs.
Jmse 11 02134 g008
Figure 9. The results of static offset tests.
Jmse 11 02134 g009
Figure 10. The motion responses of the moored aquaculture platform in 0-degree environmental conditions.
Jmse 11 02134 g010
Figure 11. The motion responses of the moored aquaculture platform in 45-degree environmental conditions.
Jmse 11 02134 g011aJmse 11 02134 g011bJmse 11 02134 g011c
Figure 12. The motion responses of the moored aquaculture platform in 90-degree environmental conditions.
Jmse 11 02134 g012
Figure 13. The maximum tension of the cables in regular waves.
Jmse 11 02134 g013
Table 1. Major features of the present offshore aquaculture platform.
DesignationUnitValue
Length over allm64.5
Breadthm17.0
Depthm10.2
Draftm7.7
Displacementton8654.0
Longitudinal center of gravitym32.3
Transverse center of gravitym0.0
Vertical center of gravity am4.7
Radius of roll gyrationm5.7
Radius of pitch gyrationm20.6
Radius of yaw gyrationm20.9
Table 2. Environmental conditions used in numerical simulations.
Case No.Wave HeightPeriodWind VelocityCurrent Velocity
[m][s][m/s][m/s]
OC10.8412.31.5
OC21.2412.31.0
OC30.84251.0
SC26251.5
Table 3. The parameters of catenary mooring cables designed in the present study.
Design No.MethodologyLDWAxial StiffnessMBL
[m][mm][kg/m][MN][kN]
Design 1Expertise38068101.3467.03500
Design 2Expertise22081143.7662.74500
Design 3NSGA-II2206695.4440.03130
Table 4. The maximum tension and safety factor of the cables in numerical simulations and experiments.
DirectionDesign 1Design 2Design 3Exp
[kN]/[-][kN]/[-][kN]/[-][kN]/[-]
0 degrees277.05/12.63598.77/7.52278.64/11.23-
45 degrees799.42/4.381299.19/3.46860.96/3.64-
90 degrees1385.15/2.531635.06/2.751449.82/2.161476.29/2.12
Disclaimer/Publisher’s Note: The statements, opinions and data contained in all publications are solely those of the individual author(s) and contributor(s) and not of MDPI and/or the editor(s). MDPI and/or the editor(s) disclaim responsibility for any injury to people or property resulting from any ideas, methods, instructions or products referred to in the content.

