Article

Blade Number Effects in Radial Disc Pump Impellers: Overall Performances with Cavitation Sensitivity Analysis

1
Key Laboratory of Fluid and Power Machinery, Ministry of Education, Xihua University, No. 9999 Hongguang Avenue, Pidu District, Chengdu 610039, China
2
Key Laboratory of Fluid Machinery and Engineering, Xihua University, No. 9999 Hongguang Avenue, Pidu District, Chengdu 610039, China
3
University of Lille, CNRS, ONERA, Arts et Métiers Institute of Technology, Centrale Lille, UMR 9014-LMFL-Laboratoire de Mécanique des Fluides de Lille-Kampé de Fériet, F-59000 Lille, France
*
Author to whom correspondence should be addressed.
J. Mar. Sci. Eng. 2023, 11(11), 2104; https://doi.org/10.3390/jmse11112104
Submission received: 20 September 2023 / Revised: 20 October 2023 / Accepted: 22 October 2023 / Published: 2 November 2023
(This article belongs to the Section Ocean Engineering)

Abstract

:
Straight radial impeller disc pumps are widely used in several industrial applications for hard-to-pump working flow media, such as two-phase inlet conditions, either including non-miscible bubbles or solid particles with a high concentration within the main working flow. Compared with conventional pump designs, these pumps have not been widely studied, because of their particular simple design and low efficiency values that can however reach a maximum value of 0.5 with a good pressure increase in single-phase conditions. Regarding this, no basic analysis has been performed to build one-dimensional design rules considering the relative effects of design parameters proper to these unusual designs like the blade number, blade height and disc spacing. This step is an important one for two-phase flow performance evaluations which are usually derived from single-phase ones as for conventional pumps. Two different disc pump designs with, respectively, 8 and 10 radial blades, are numerically and experimentally investigated. Experimental investigations are performed in an open loop tap water test facility, under various working conditions, combining flow rate and rotational speed variations. The overall pump performances are compared and analyzed, including cavitation onset phenomena that have been found to influence the experimental performances of both pumps. The overall performance modification between both impeller designs is analyzed. Comparisons between CFD and experimental results give reliable results and can be considered to cover a sufficiently wide range of design parameters allowing us to build future adapted design rules for such specific designs.

1. Introduction

Present disc pump designs are adapted from Nikola Tesla’s [1] design proposed in 1913. At that time, the pump impeller used several co-rotating parallel thin discs. Each thin disc was separated by a small gap through which the working fluid flows. The work that can be transferred to the fluid is only due to frictional work caused by rotation, so that such a pump can only transport high-viscosity fluids.
In 1988 and later, Gurth [2,3,4] further improved the initial Tesla pump impeller by adding small-height radial blades to gain additional pressure instead of friction forces only. Blades are fixed on each co-rotating disc, named, respectively, the front (shroud) and rear (hub) discs. Compared with the initial Tesla design, the bladeless gap between the two co-rotating discs is larger, as shown on Figure 1. A bladeless gap is believed to be more suitable for solid and gas transport and can avoid clogging effects for crude materials in chemistry processing and submarine pumping applications.
Few scientific studies have been performed on such unconventional designs during the past decade. They are mainly devoted to mechanical stress analysis due to disc mode deformation related to the way the two rotating discs are connected (Chen, Y. et al. [5]). Some of them, like Gao [6], Zhang [7], Yin et al. [8], and Pei et al. [9], give overall performance results but with information lacking on geometrical parameters protected by patents.
Recently, an experimental analysis has been proposed by Heng et al. [10,11,12], on one impeller disc pump model with eight radial blades with a disc gap ratio b2/R2 = 0.16 (b2 is the disc gap distance and R2 the impeller outlet radius), which is smaller than the one proposed by the DiscFlow TM Corporation [13].
Typical conventional radial pump designs use backward impeller blade profiles followed by a spiral shape volute. At the best efficiency point (the maximum value may reach 77%), the head rise is roughly equal to 20 m for a volume flow rate of 50 m3/h for 2900 rpm and an impeller outlet radius of about 0.07 m. Present disc pumps can reach more than 40 m of head rise for 100 m3/h for the same rotational speed but with a larger impeller radius of 0.1 m and a lower efficiency close to 50%.
Disc pumps are also known to face cavitation problems due to straight radial inlet blade profiles, which seriously affect their performance and current use.
Conventional pump performance predictions are now essentially carried out through computational fluid dynamics (CFD) approaches, including cavitation effects, because of a large number of model improvements and high confidence [14,15]. However, when applied to disc pump designs, these approaches still need to be compared with experimental results. Only few CFD results have been recently published on one single type of disc pump with eight radial blades mainly focusing on solid-liquid two phases and modal disc deformation problems [16,17,18]. Some specific papers deal with pump inlet chamber effects and volute designs [8,19] without explaining how the work is really transferred to the fluid from the impeller shaft.
This paper combines experimental tests and CFD approaches to study the effects of specific impeller parameters like the blade number and blade height associated with disc spacing for two different impeller geometries keeping the same impeller diameter and the same volute design. These two different geometries have been selected according to a previous global CFD analysis only based on three similar disc pump cases presented by Heng et al. [10]. Cavitation effects are also analyzed to explain experimental observation on pump overall performance degradation with some flow insights inside two different impeller design models.
The paper considers the inlet single-phase flow condition for the present step. However, the final objective concerns a two-phase and/or multiphase pump behavior for which disc pumps are generally chosen by end users.

2. Disc Pump Models and Meshes

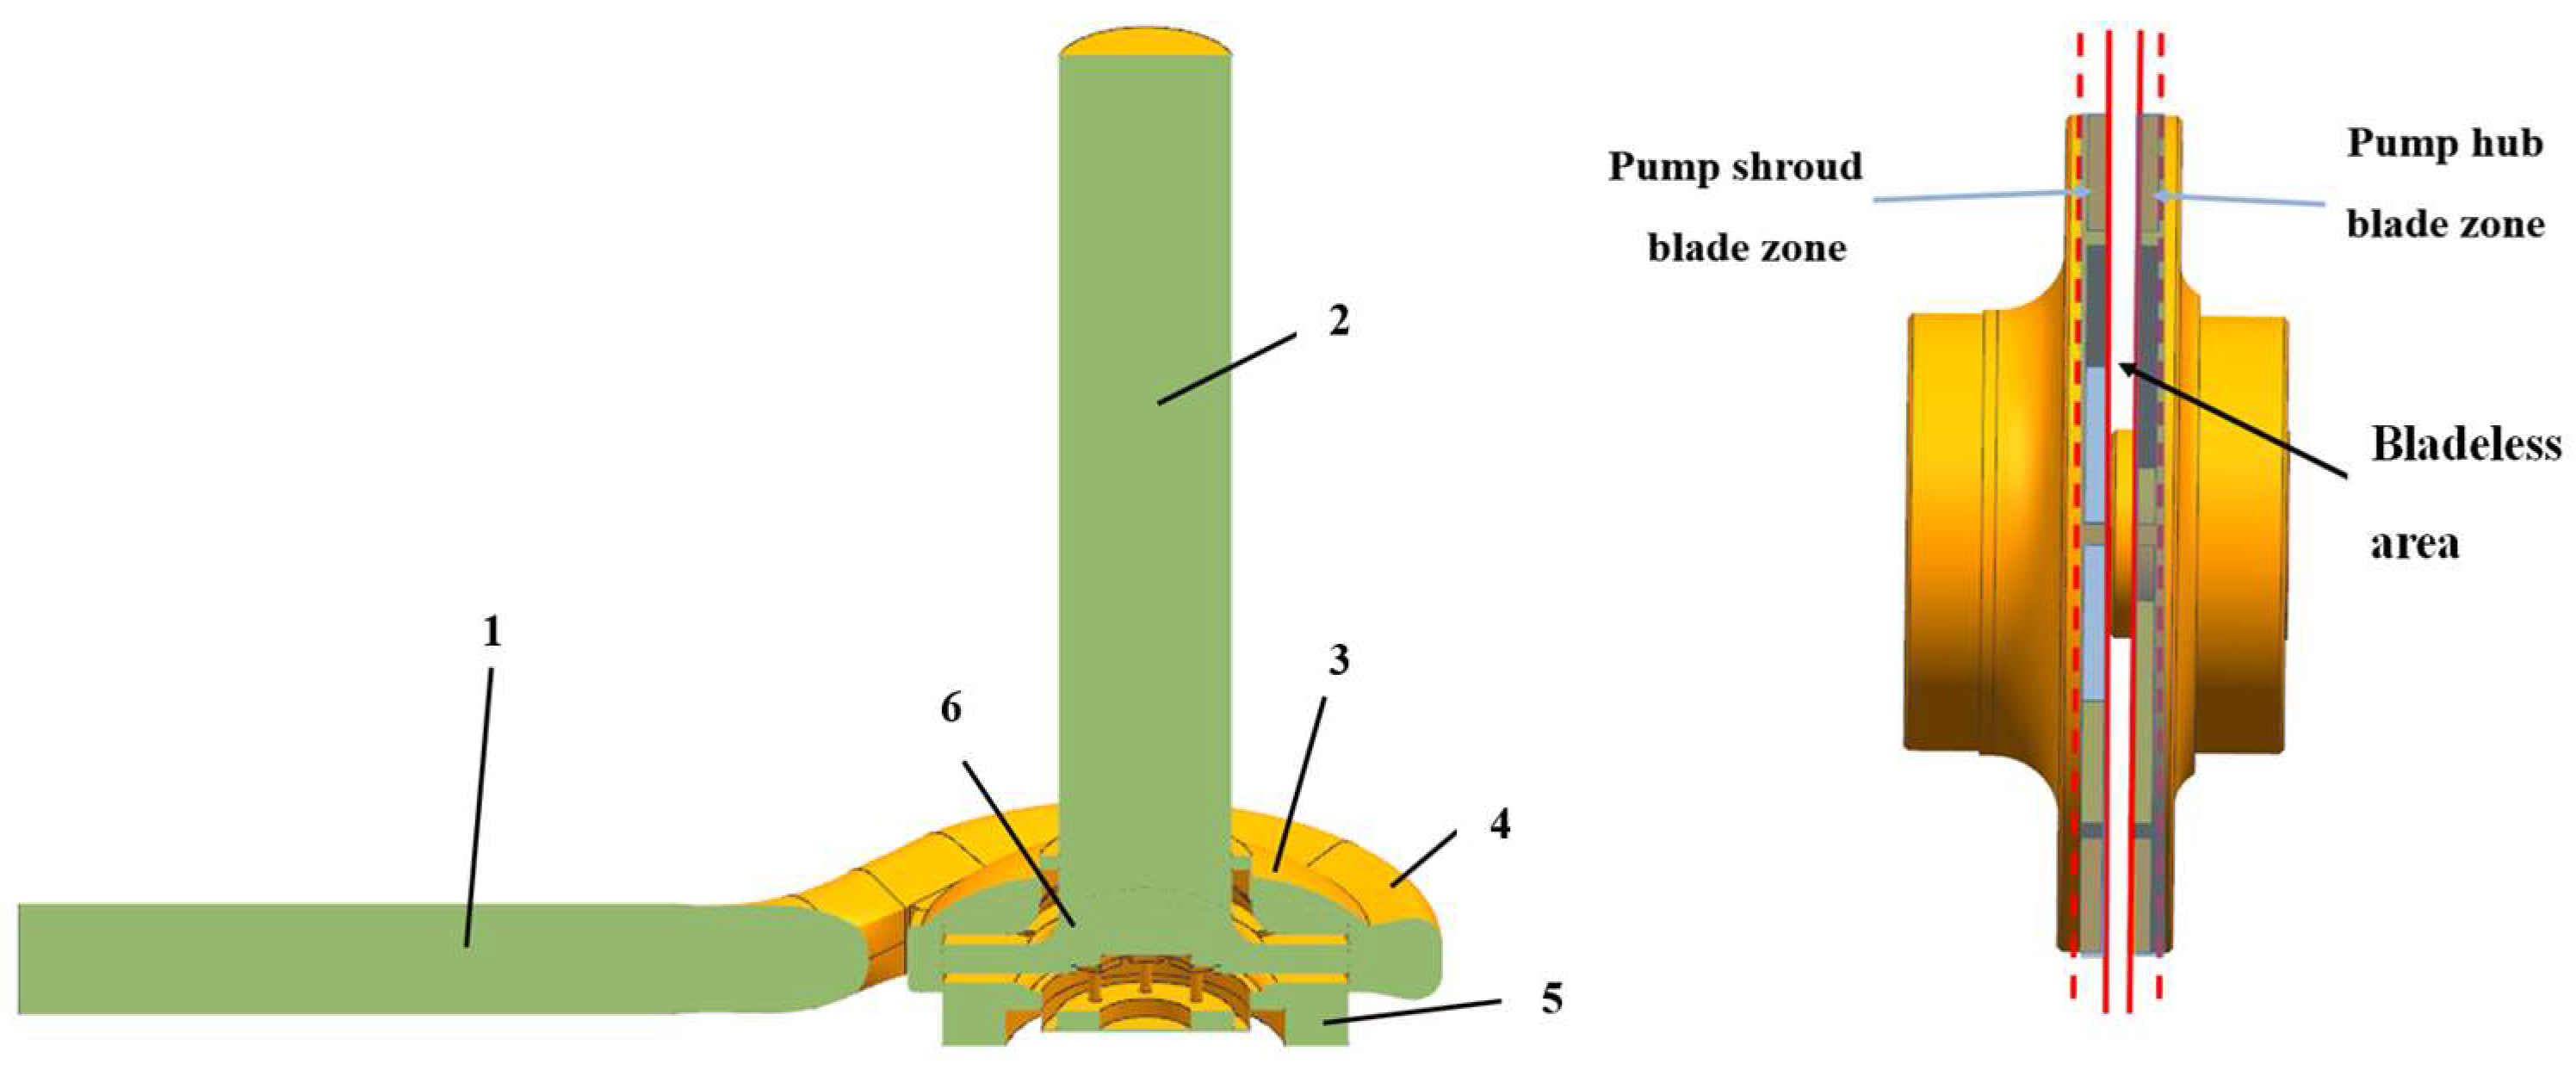
2.1. Disc Pump Models

Compared with the traditional centrifugal pump, the biggest unique feature of the disc pump impeller is that it contains axially discontinuous blades, as shown in Figure 1. The area through which the blades rotate on the front and rear discs of the impeller is defined as the blade area. The area between the two blade zones is defined as the bladeless area.
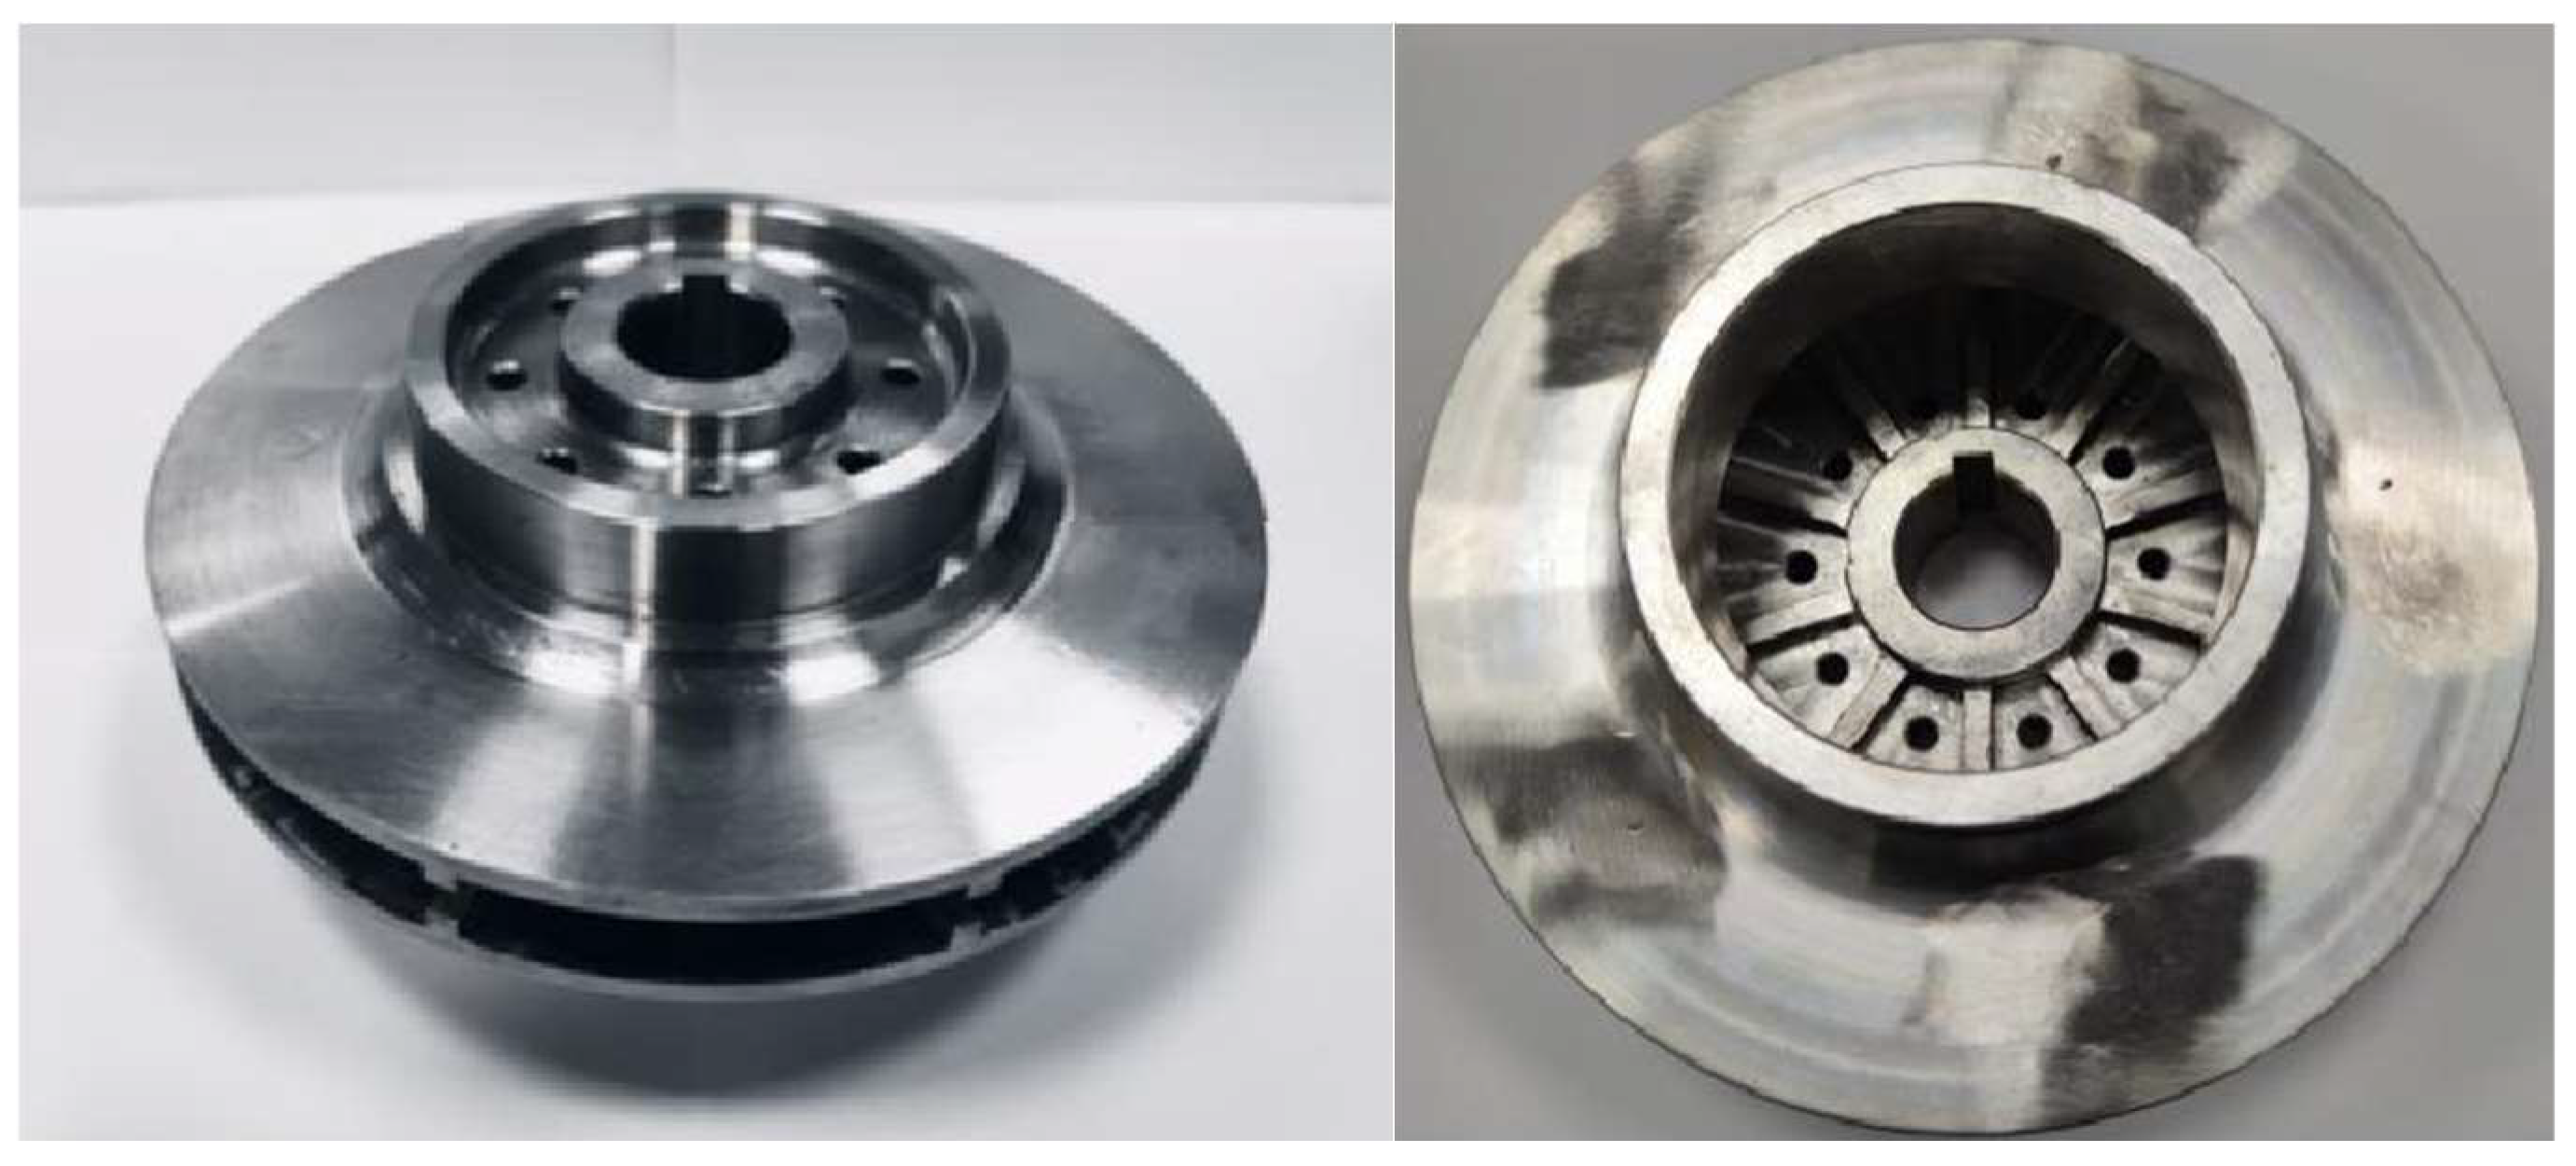
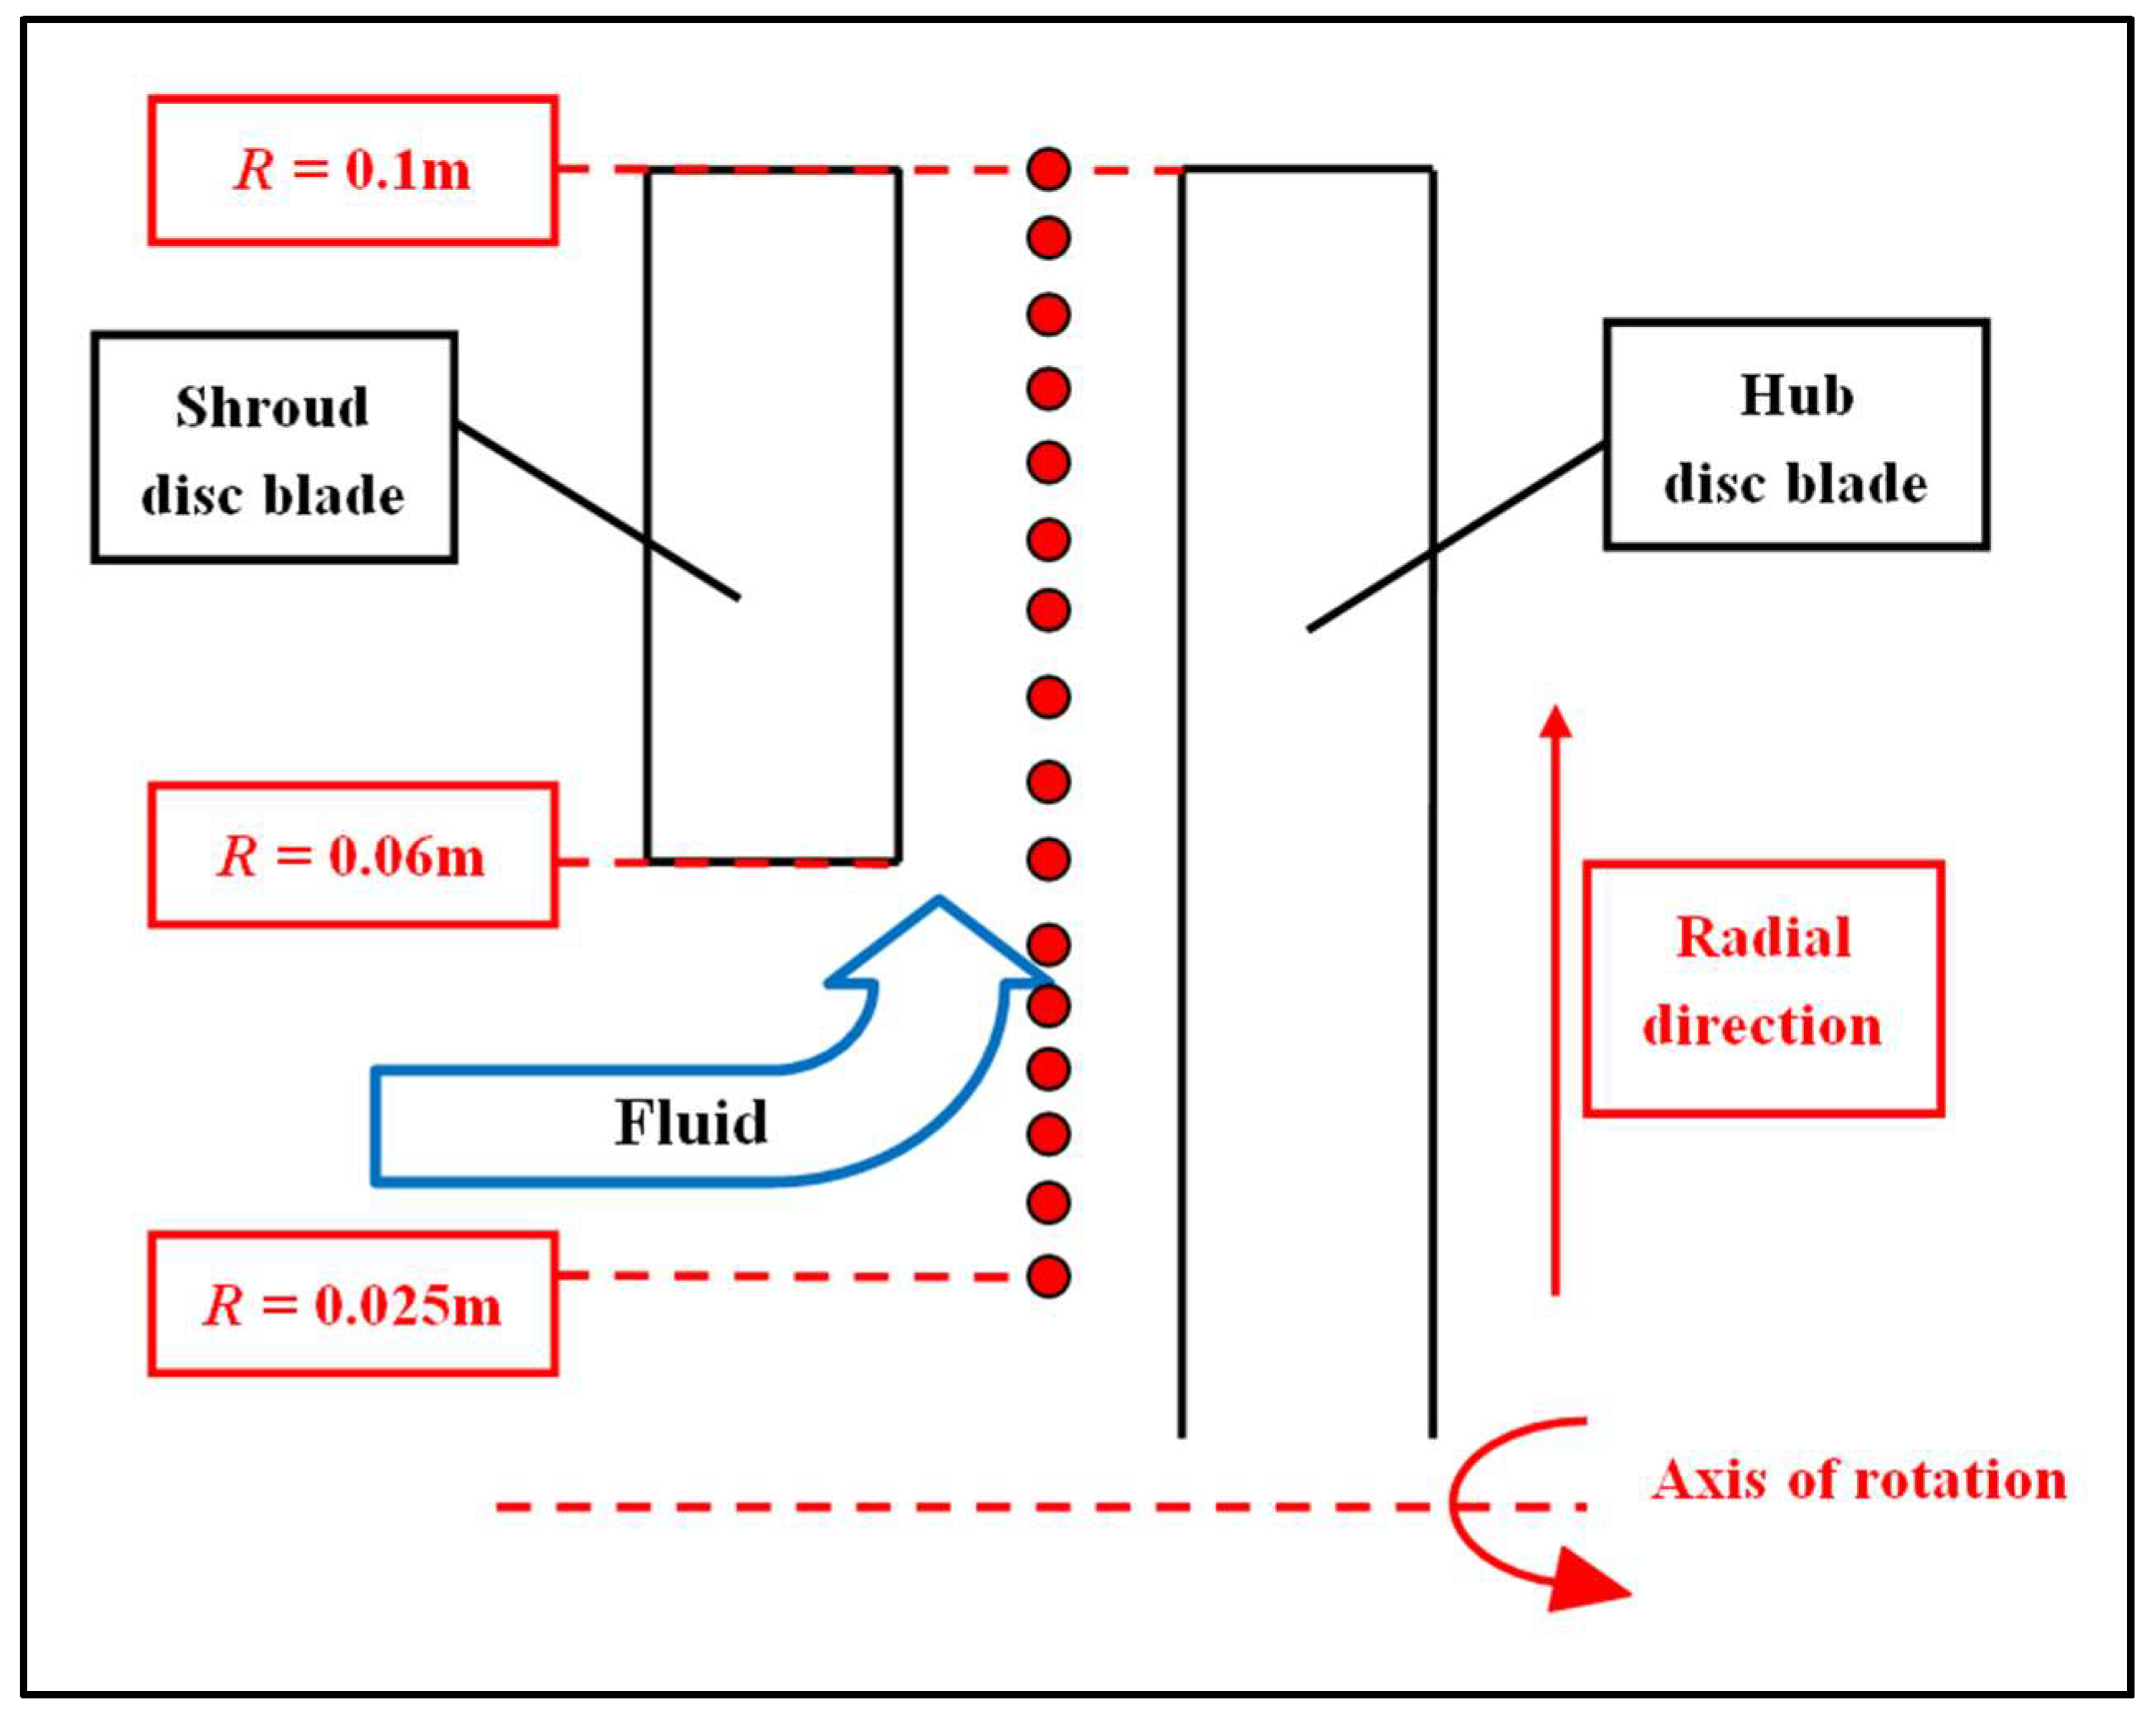
  • On the left side of Figure 2, the physical model of impeller A can be seen from the shaft side. The blade number ZA is equal to 8, each blade height value is hA = 0.004 m, and the disc spacing value is: bA = 0.016 m. Eight balance holes are placed near the drive shaft on the hub disc. Detailed impeller geometry information can be found in the reference [20].
  • The right side of Figure 2 shows the physical model of impeller B seen from the flow entrance section. The blade number ZB is equal to 10 with a blade height of hB = 0.00715 m. The disc spacing value is bB = 0.022 m. Ten balance holes are located near the drive shaft as well.
Table 1 shows the design parameters of each disc pump impeller. If we look at the two impeller designs, we can see that the number of blades has been increased to 10 for model B (instead of 8 for model A). The disc spacing also changed from 0.016 m for model A to 0.022 m for model B. The blade height has also been increased from 0.004 m to 0.00715 m, so that the ratio 2b/h does not remain constant between the two models. For model A, the blade height ratio is equal to 2bA/hA = 0.5, whereas it reaches a value equal to 2bB/hB = 0.65. However, the impeller’s outlet radius remains the same at R = 0.1 m. Model B is consequently supposed to give more power to the fluid than model A. The disc spacing of model B is equivalent to the one that can be found from the DiscFlow TM Corporation and in most of the previous published studies, as stated in the present paper’s introduction.

2.2. Grid Independence Verification for CFD Approach

The fluid domain grid is an unstructured grid divided by the integrated computer engineering and manufacturing code for computational fluid dynamics (ICEM CFD). Figure 3 shows the grid of the disc pump. The simulation calculation was carried out using Ansys CFX. In addition, the model wall boundary, sharp corners and large local curvature are refined to improve certain simulation accuracy. The selected mesh numbers are, respectively, 8.39 million, 9.12 million, 13.77 million and 15.31 million to check convergence criteria. Table 2. shows the computing time, outlet pressure values evolutions corresponding to different mesh numbers and the convergence ratio.
As can be seen from Table 2, when the number of grids increases from 13.77 million to 15.31 million, the relative outlet pressure change is less than 1%. In order to ensure a good compromise between the calculation accuracy and limited computing resources, the mesh number of 13.77 million is selected as the grid model for the following numerical calculations.

3. Mathematical Model

3.1. Turbulence Model

Both k-ε and k-Ω SST models were tested for numerical simulations. These turbulence models are widely used, reliable, have good convergence, and can deal with most of the flow numerical calculations of turbomachinery applications. The k-Ω SST model was finally chosen, according to previous analysis performed on pump model A both by Heng et al. [10] and Weibin et al. [13].

3.2. Cavitation Model

The cavitation model was selected based on the work by Zwart et al. [21], which considers the growth and collapse of bubbles assuming a homogeneous multiphase condition:
Γ l v = F vap 3 α nuc R ρ V 2 P V P 3 ρ l   , P < P V  
Γ v l = F cond 3 α V R ρ V 2 P P V 3 ρ l   ,   P > P V  
where Γ l v is the bubble formation rate, Γ v l is the bubble condensation rate, P is the fluid pressure, and P V is the saturation vapor pressure; the saturation vapor pressure of water at 25 °C is P V   = 3169 Pa, α nuc is the volume fraction of the nucleation site, α nuc   = 5 × 10⁻⁴, F vap is the evaporation coefficient, F vap = 50, and the saturation vapor pressure of water is P V   = 3169 Pa. F cond is the condensation coefficient, F cond   = 0.01, α V is the gas volume fraction, and R is the cavity radius. This model has been successfully used in centrifugal pump applications [15,16].

3.3. Boundary Condition

For experimental and CFD comparisons, the inlet condition is set as the inlet total pressure deduced from the measured inlet static pressure on the test loop increased by the mean dynamic pressure obtained through the measured mass flow rate. The outlet boundary condition is the mass flow rate. The wall surface is selected as a non-slip wall, and the near wall is processed with a scalable wall function, considering that there is a loss along the path. To make the CFD results closer to the test, the pipe roughness was set at 12.5 μm and the volute and impeller roughness at 6.3 μm, while the inlet lobe area and the rear cover lobe area were set as the rotating domain. The others were all stationary domains. The interface between the rotating domain and the stationary domain was selected by a freezing rotor method for data exchange, and the reference pressure was 0 Pa. Compared with a full unsteady calculation, the frozen rotor approximation was already satisfactorily used in such a pump as mentioned in a previous study performed by Zhang, W. et al. [13].
The convergence level is 10−6, the saturated vapor pressure (25 °C) is set at 3169 Pa, and the volume fraction of the water at the inlet condition is equal to 1 and equal to 0 for gas when simulating a cavitation.

4. Experimental Results and Numerical Simulation

4.1. Test Stand

The disc pump test bench is composed of an electric motor, the disc pump, a water tank with inlet and outlet pipelines and a data acquisition system. The maximum speed of the disc pump is 2900 r/min. The motor that powers the pump has a power of 22 kW. Figure 4 shows the disc pump test bed. More details on the measuring devices that were used and on the estimated experimental uncertainties can be found in Heng et al. [11].
It must be noted that the test bed corresponds to an open loop which does not allow pressure control for cavitation studies. However, the pump inlet pressure is systematically recorded for cavitation analysis that will be presented in a separate section of the present paper.

4.2. Overall Performance Results

One-dimensional flow and head coefficients are used to represent the performance chart of each impeller design. They are defined as follows and presented on Figure 5.
Flow   coefficient :   φ = Q v / 2 π Rb U 2
Head   coefficient :   Ψ = g H / U 2 2
Efficiency :   η = ρ g H Q v / P S
As expected, the head coefficient value is always better for case B compared with case A. This is due to the larger blade number and larger blade height. The larger disc spacing also influences the velocity triangle at the impeller outlet. According to the well-known EULER equation applied between inlet and outlet impeller sections, the fluid absolute tangential velocity is greater for model B compared with model A at the impeller outlet section for a given flow rate. For more details on the Euler equation hypothesis and development, one can refer to the paper published by Heng et al. [12].
A less decreasing slope is also observed for model B for an increasing flow coefficient up to a certain value for which two different evolutions can be observed:
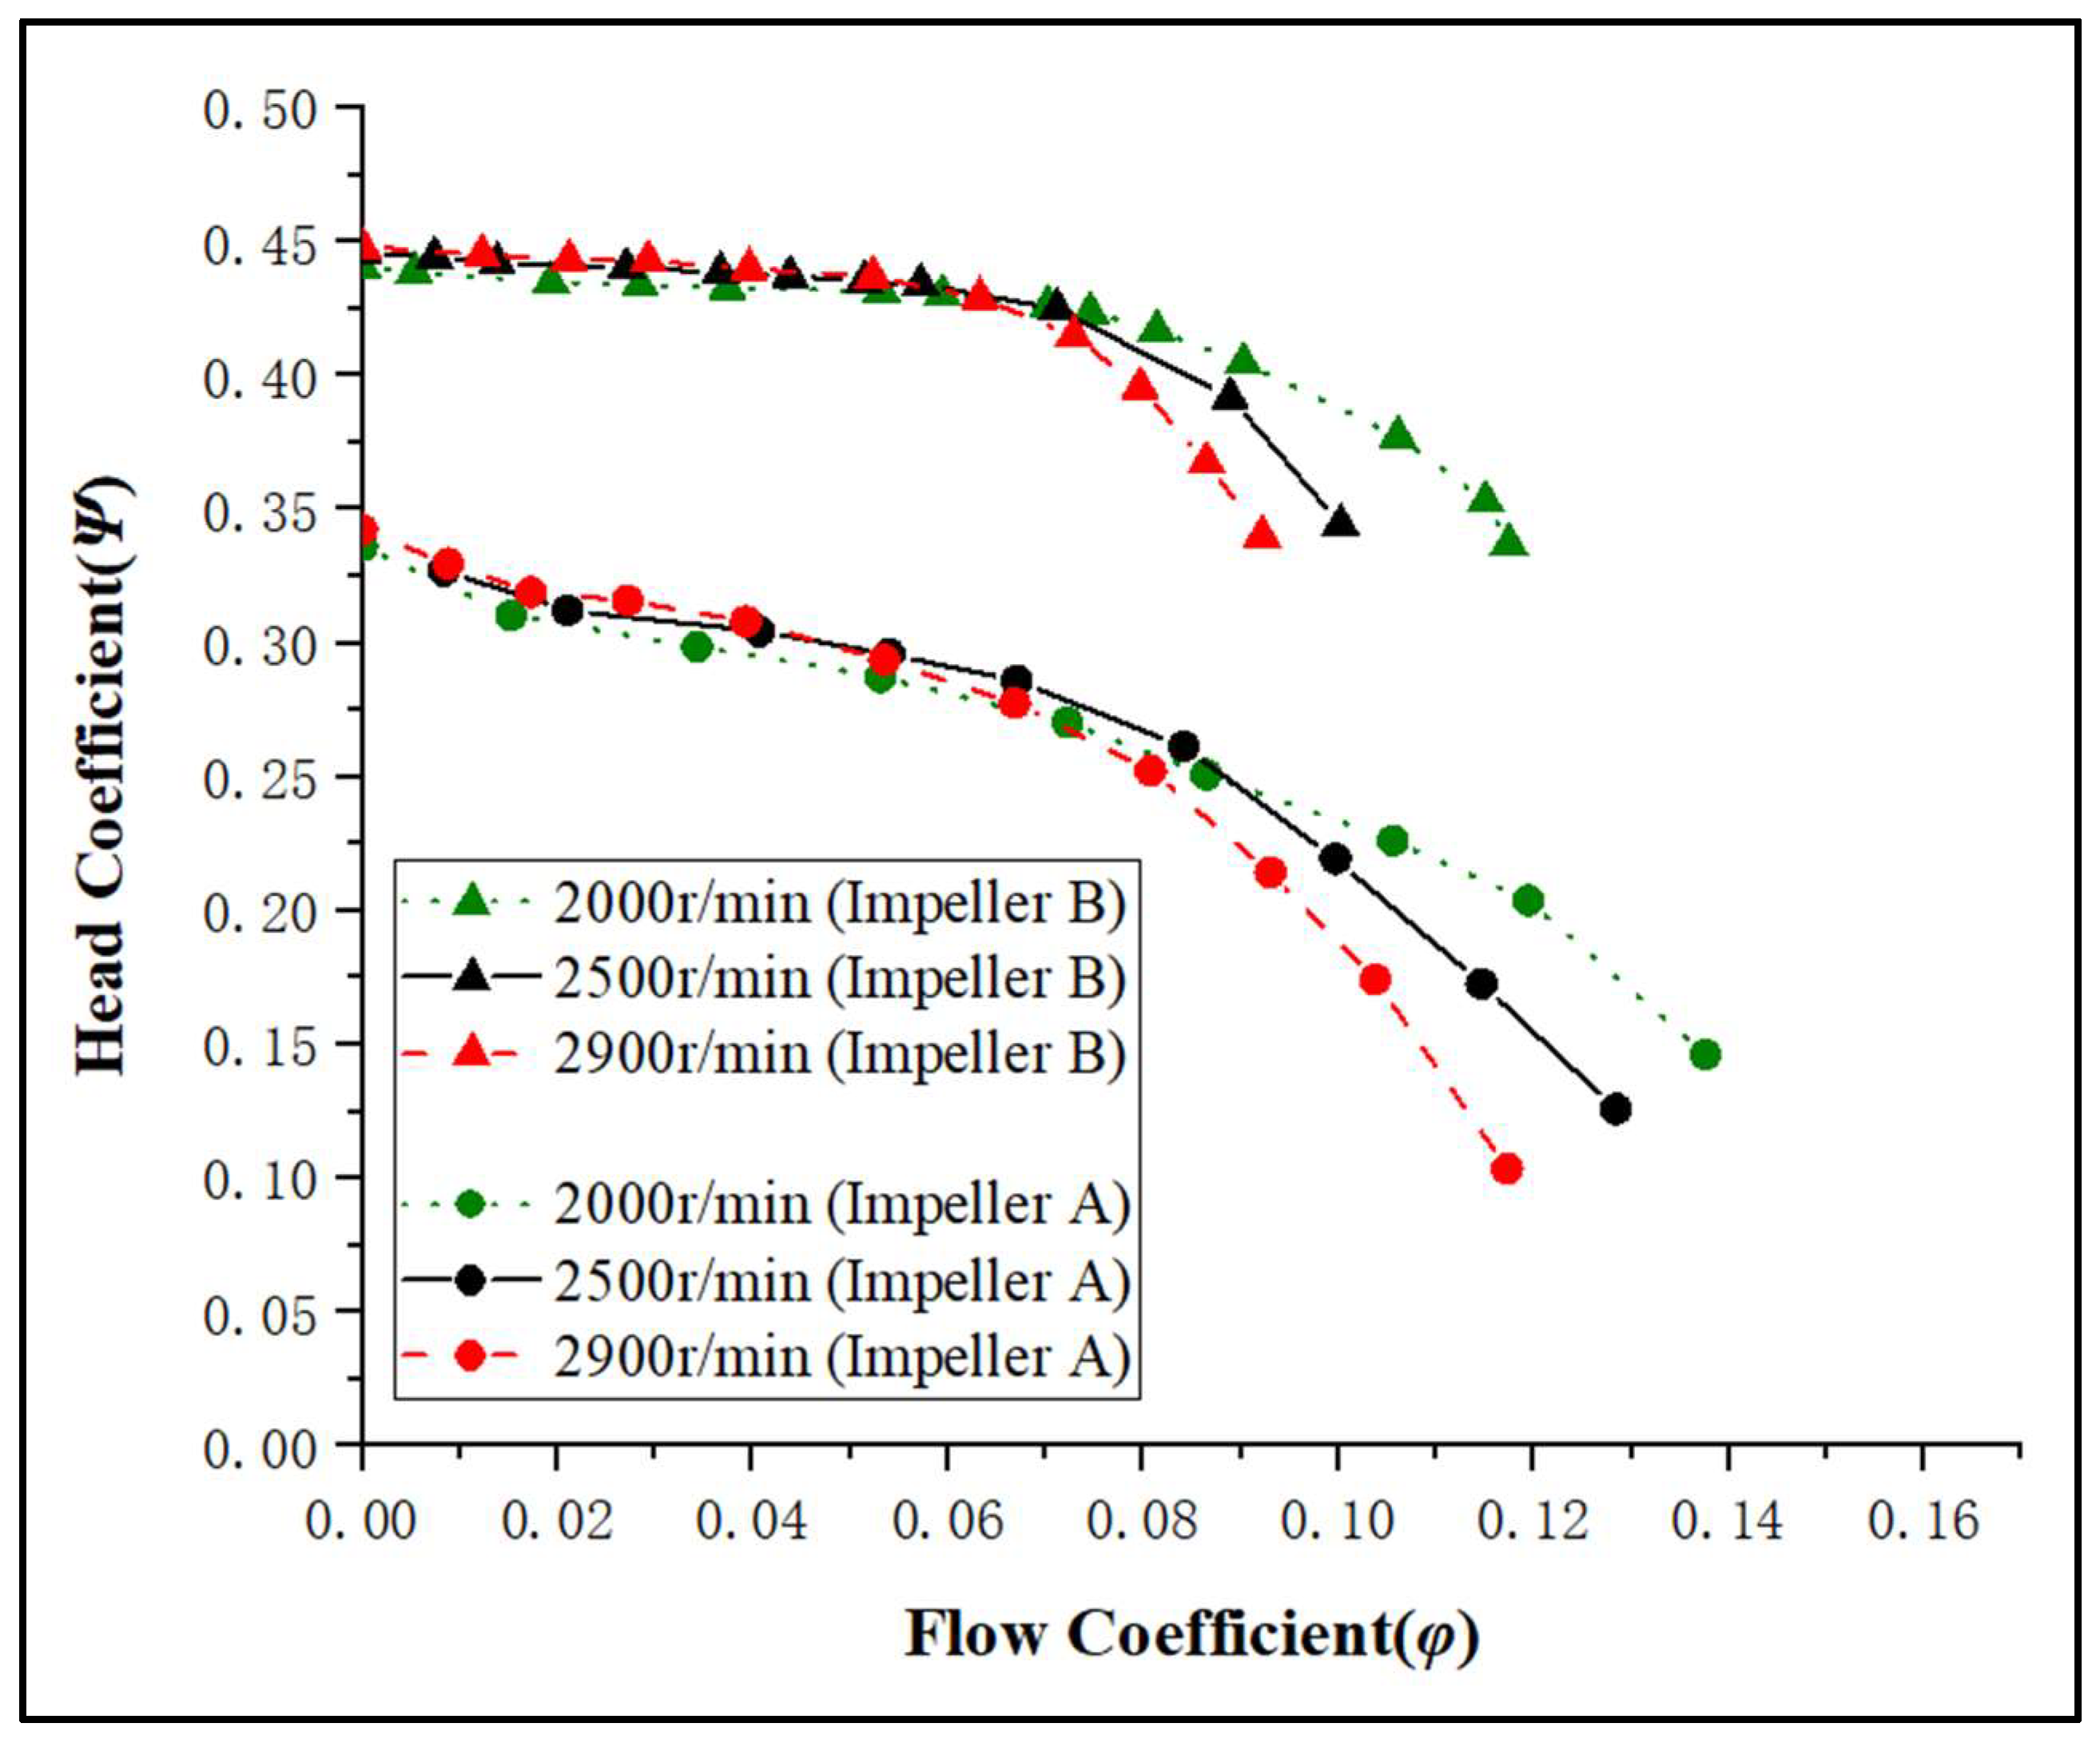
  • First, between flow coefficient values of 0 up to 0.06, all curves give the same head evolution whatever the rotational speeds for each model. This obeys the non-dimensional analysis result for which head-versus-flow coefficients are independent of the rotational speed for a given pump as for conventional designs.
  • Second, the rotational speed has an effect of the performance chart for a flow coefficient higher than 0.06 for both models. The greater the rotational speed is, the greater is the decrease. However, the head rate decrease in the pump performance is more pronounced for model B than for model A. This effect is attributed to a different experimental cavitation onset inside both models’ impeller passages and is discussed and evaluated in the next section. The more pronounced relative head decrease of model B performances allows us to expect that model A should be less sensitive to cavitation effects than model B.

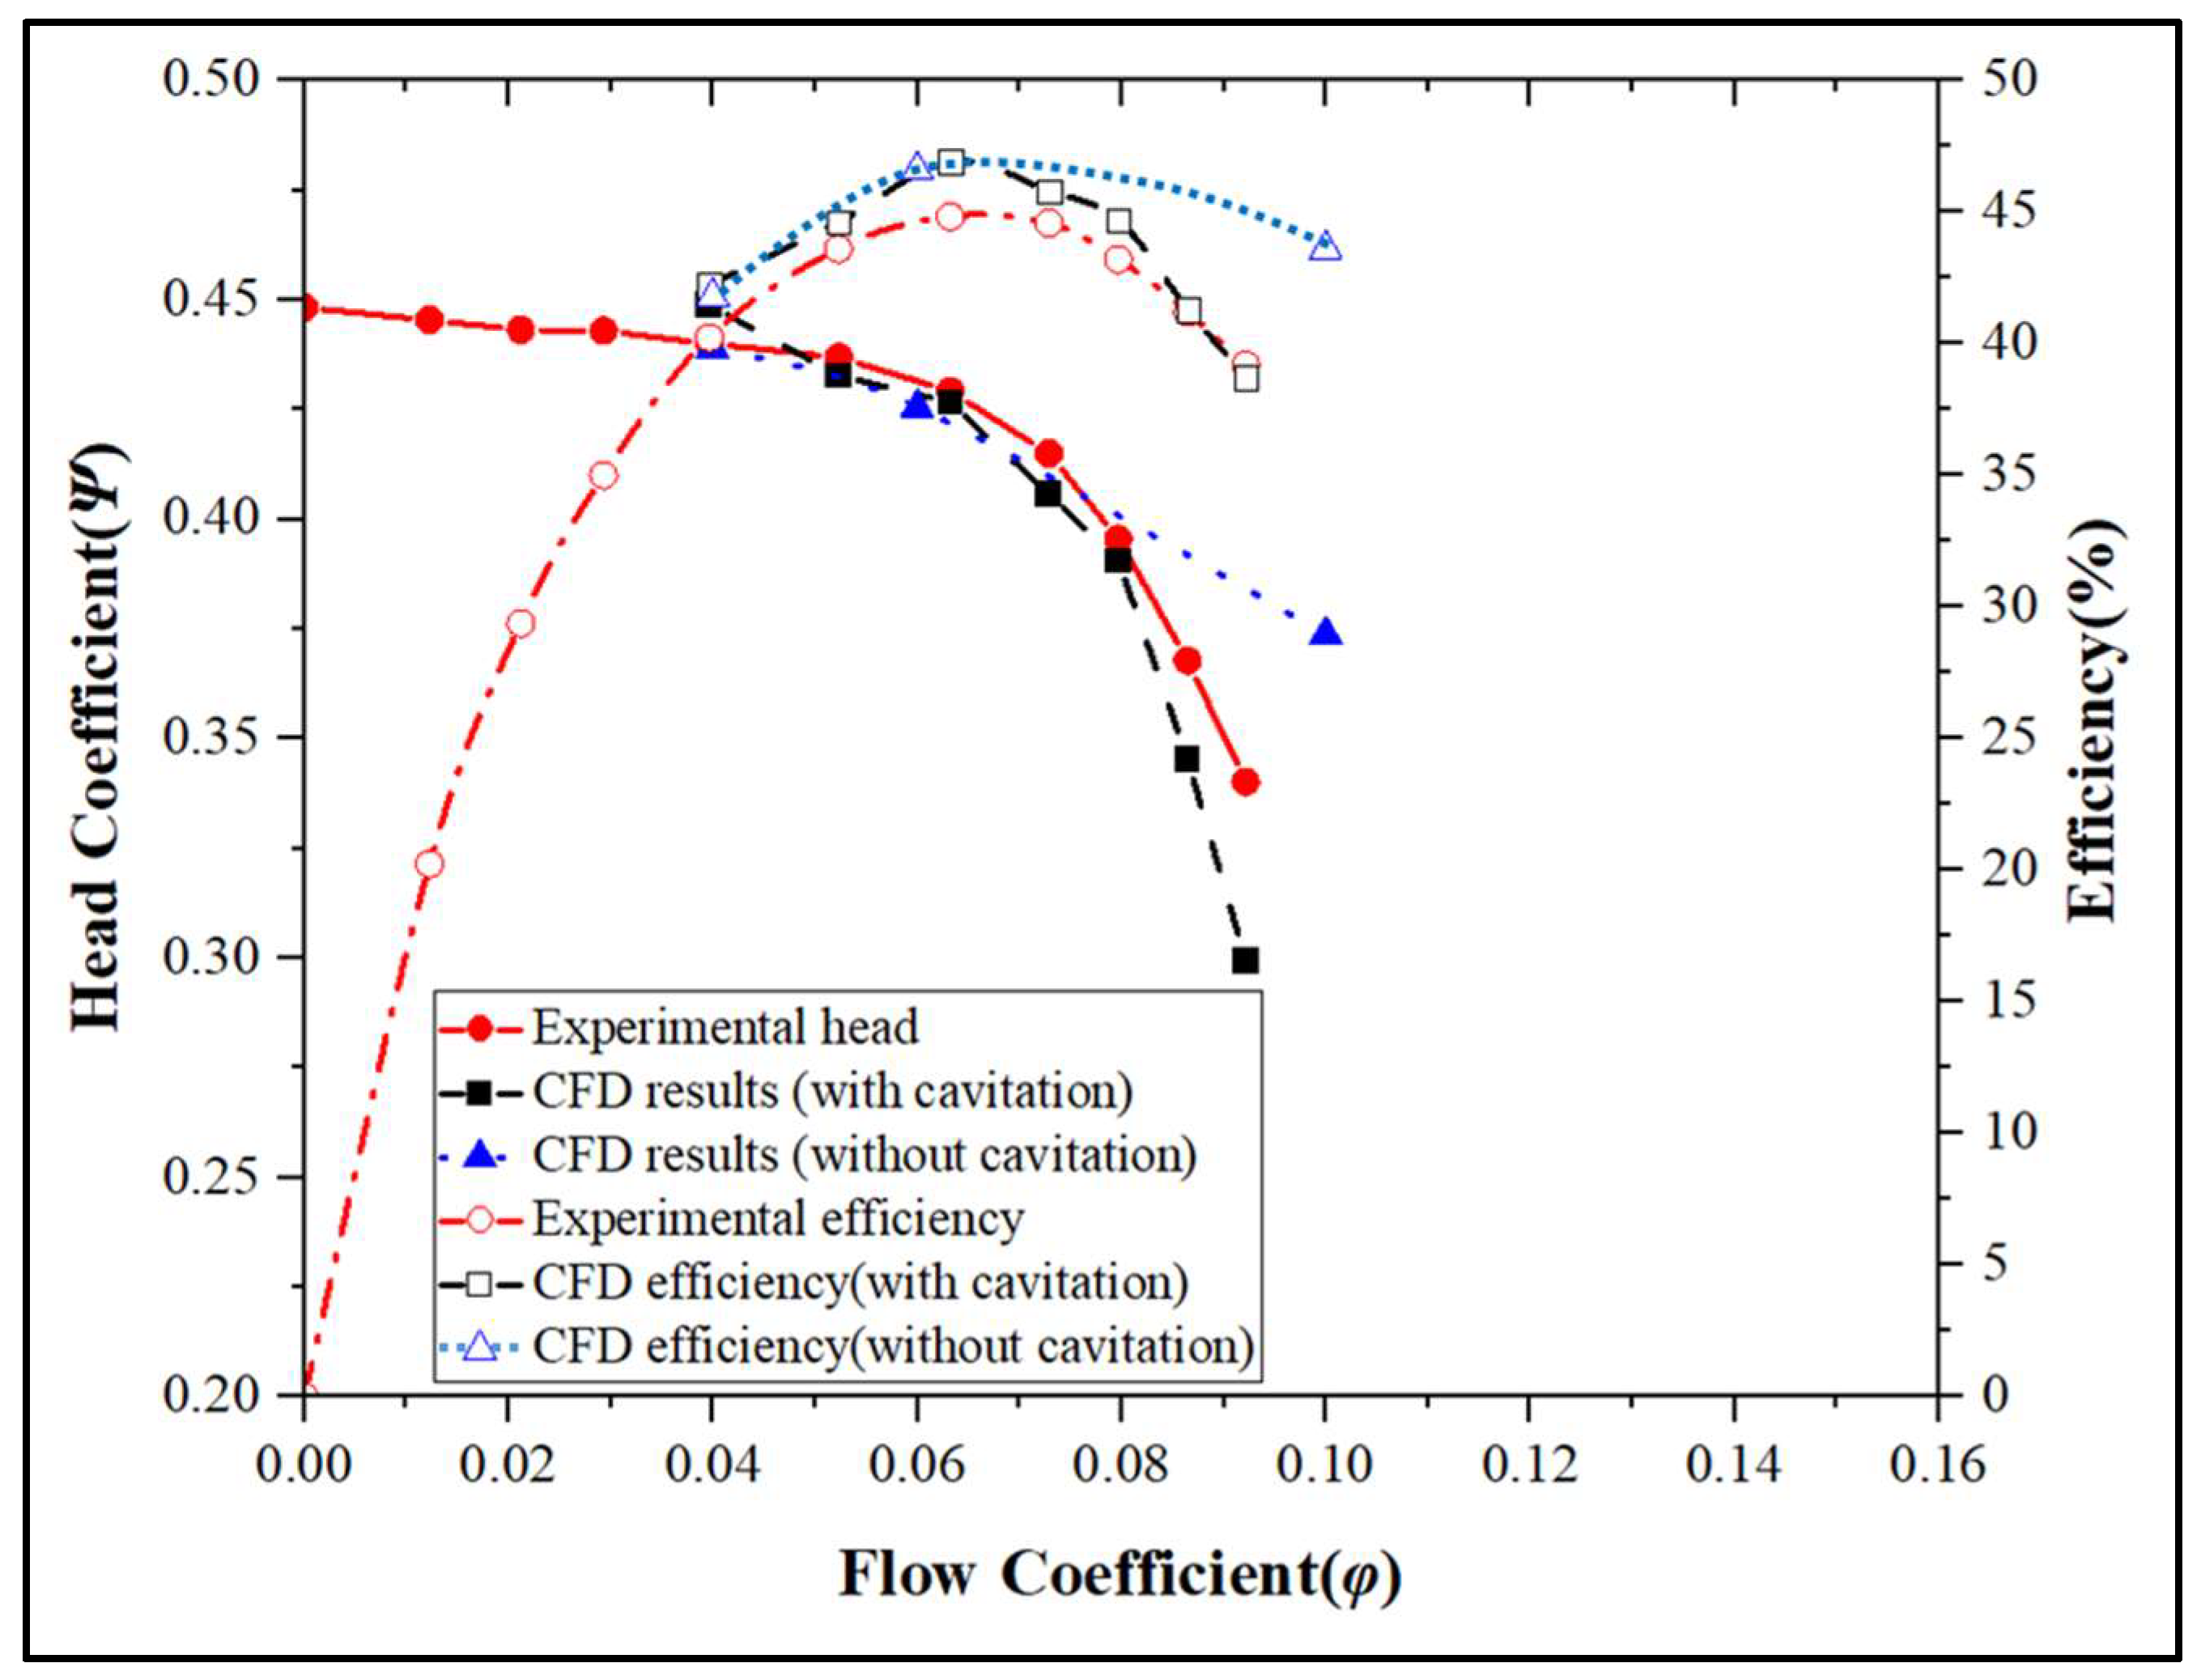
4.3. Comparison between Experiments and CFD Results

The CFD results are compared with the experimental results in Figure 6 and Figure 7, respectively, for model A and B. CFD results without cavitation are quite close to the experimental results obtained at the lowest rotational speed of 2000 rpm for both models. For this rotational speed, no experimental cavitation was detected. To confirm this assertion, additional experimental results were also obtained for n = 1500 rpm and 1000 rpm. The results are the same as for n = 2000 rpm using non-dimensional head and flow coefficients and are not represented here for simplicity.
CFD results, including cavitation effects, are obtained using the effective inlet pressure measured at the pump inlet section for a rotational speed of 2900 rpm, for which the cavitation effects are expected to be significant due to the relatively high local relative velocity value at the impeller shroud blade entrance. It can be observed that the head CFD prediction is reasonably good for both models with a good evaluation of the sharp relative performance decrease experimentally observed for model B compared with model A.
Because CFD results are considered reliable for the present models, different inlet pressure conditions were numerically investigated to evaluate each model sensitivity to cavitation for a given rotational speed n = 2900 rpm. The results are discussed in the next section.

5. Discussion on Pump Performances and Cavitation Effects, Local Performance Analysis

This section only concerns impeller model B, because it has a better performance level compared with case A, and additionally because its design is close to what can be found in industrial applications. The analysis is performed for a flow coefficient equal to 0.1.
The numerical static pressure rise coefficient CP inside the impeller bladeless area is presented along the radial direction in Figure 8 and Figure 9 with non-cavitating conditions and in Figure 10 for a different inlet pressure in the pump inlet section.
It is defined as:
Cp = (p (R) − P0)/0.5 ρ U22
p(R) is the circumferentially average static pressure value in the impeller bladeless area using several monitoring point positions, as shown in Figure 11. This location was chosen although the axial pressure gradient can be found inside the impeller. An example of the hub-to-shroud circumferentially averaged axial pressure gradient is given in Figure 12. With reference to the present axial pressure distribution, it has been considered that the chosen location in the mid-section of the bladeless area can be used for the present analysis that does not yet encounter high local 3D flow structures that can be further analyzed.
It must be noted that it is impossible to measure the static pressure rise inside the impeller due to the co-rotating discs arrangement of such a design. Because of the good global CFD evaluation of each pump model performance, the present analysis of numerical local pressure results is considered in the present paper in addition to the overall performance pump prediction already presented in Figure 5.

5.1. Performance Analysis without Cavitation, n = 2900 rpm, φ = 0.1

The non-cavitating conditions were obtained using sufficiently high inlet pressure conditions that ensure no cavitation onset inside the impeller. The corresponding static pressure coefficients are given in Figure 8. The Cp evolution first shows a small decrease corresponding to the velocity change between the inlet pump section and local velocity variations along the radius.
Between local radius R = 0.0125 m and R = 0.06 m, the static pressure coefficient essentially evolves close to non-viscous conditions. When we assume a one-dimensional approach to approximate the present CFD results, and apply Bernoulli’s equation, a small tangential velocity is created due to the work performed by the radial hub, just before entering the shroud blade inlet section. Because this blade height is small compared to the entire inlet section of the impeller at R = 0.06 m, the tangential velocity evaluation is assumed to be ¼ of the local rotational speed, that is, Vu1 = 0.25. ω. R1 = 4.55 m/s and the radial velocity component VR1 = 5 m/s. This corresponds to a local approximate Cp value of −0.05. The effective calculated Cp value, given in Figure 9, is a little bit lower due to some friction and gap losses occurring between the rotating hub plate blade and the main flow.
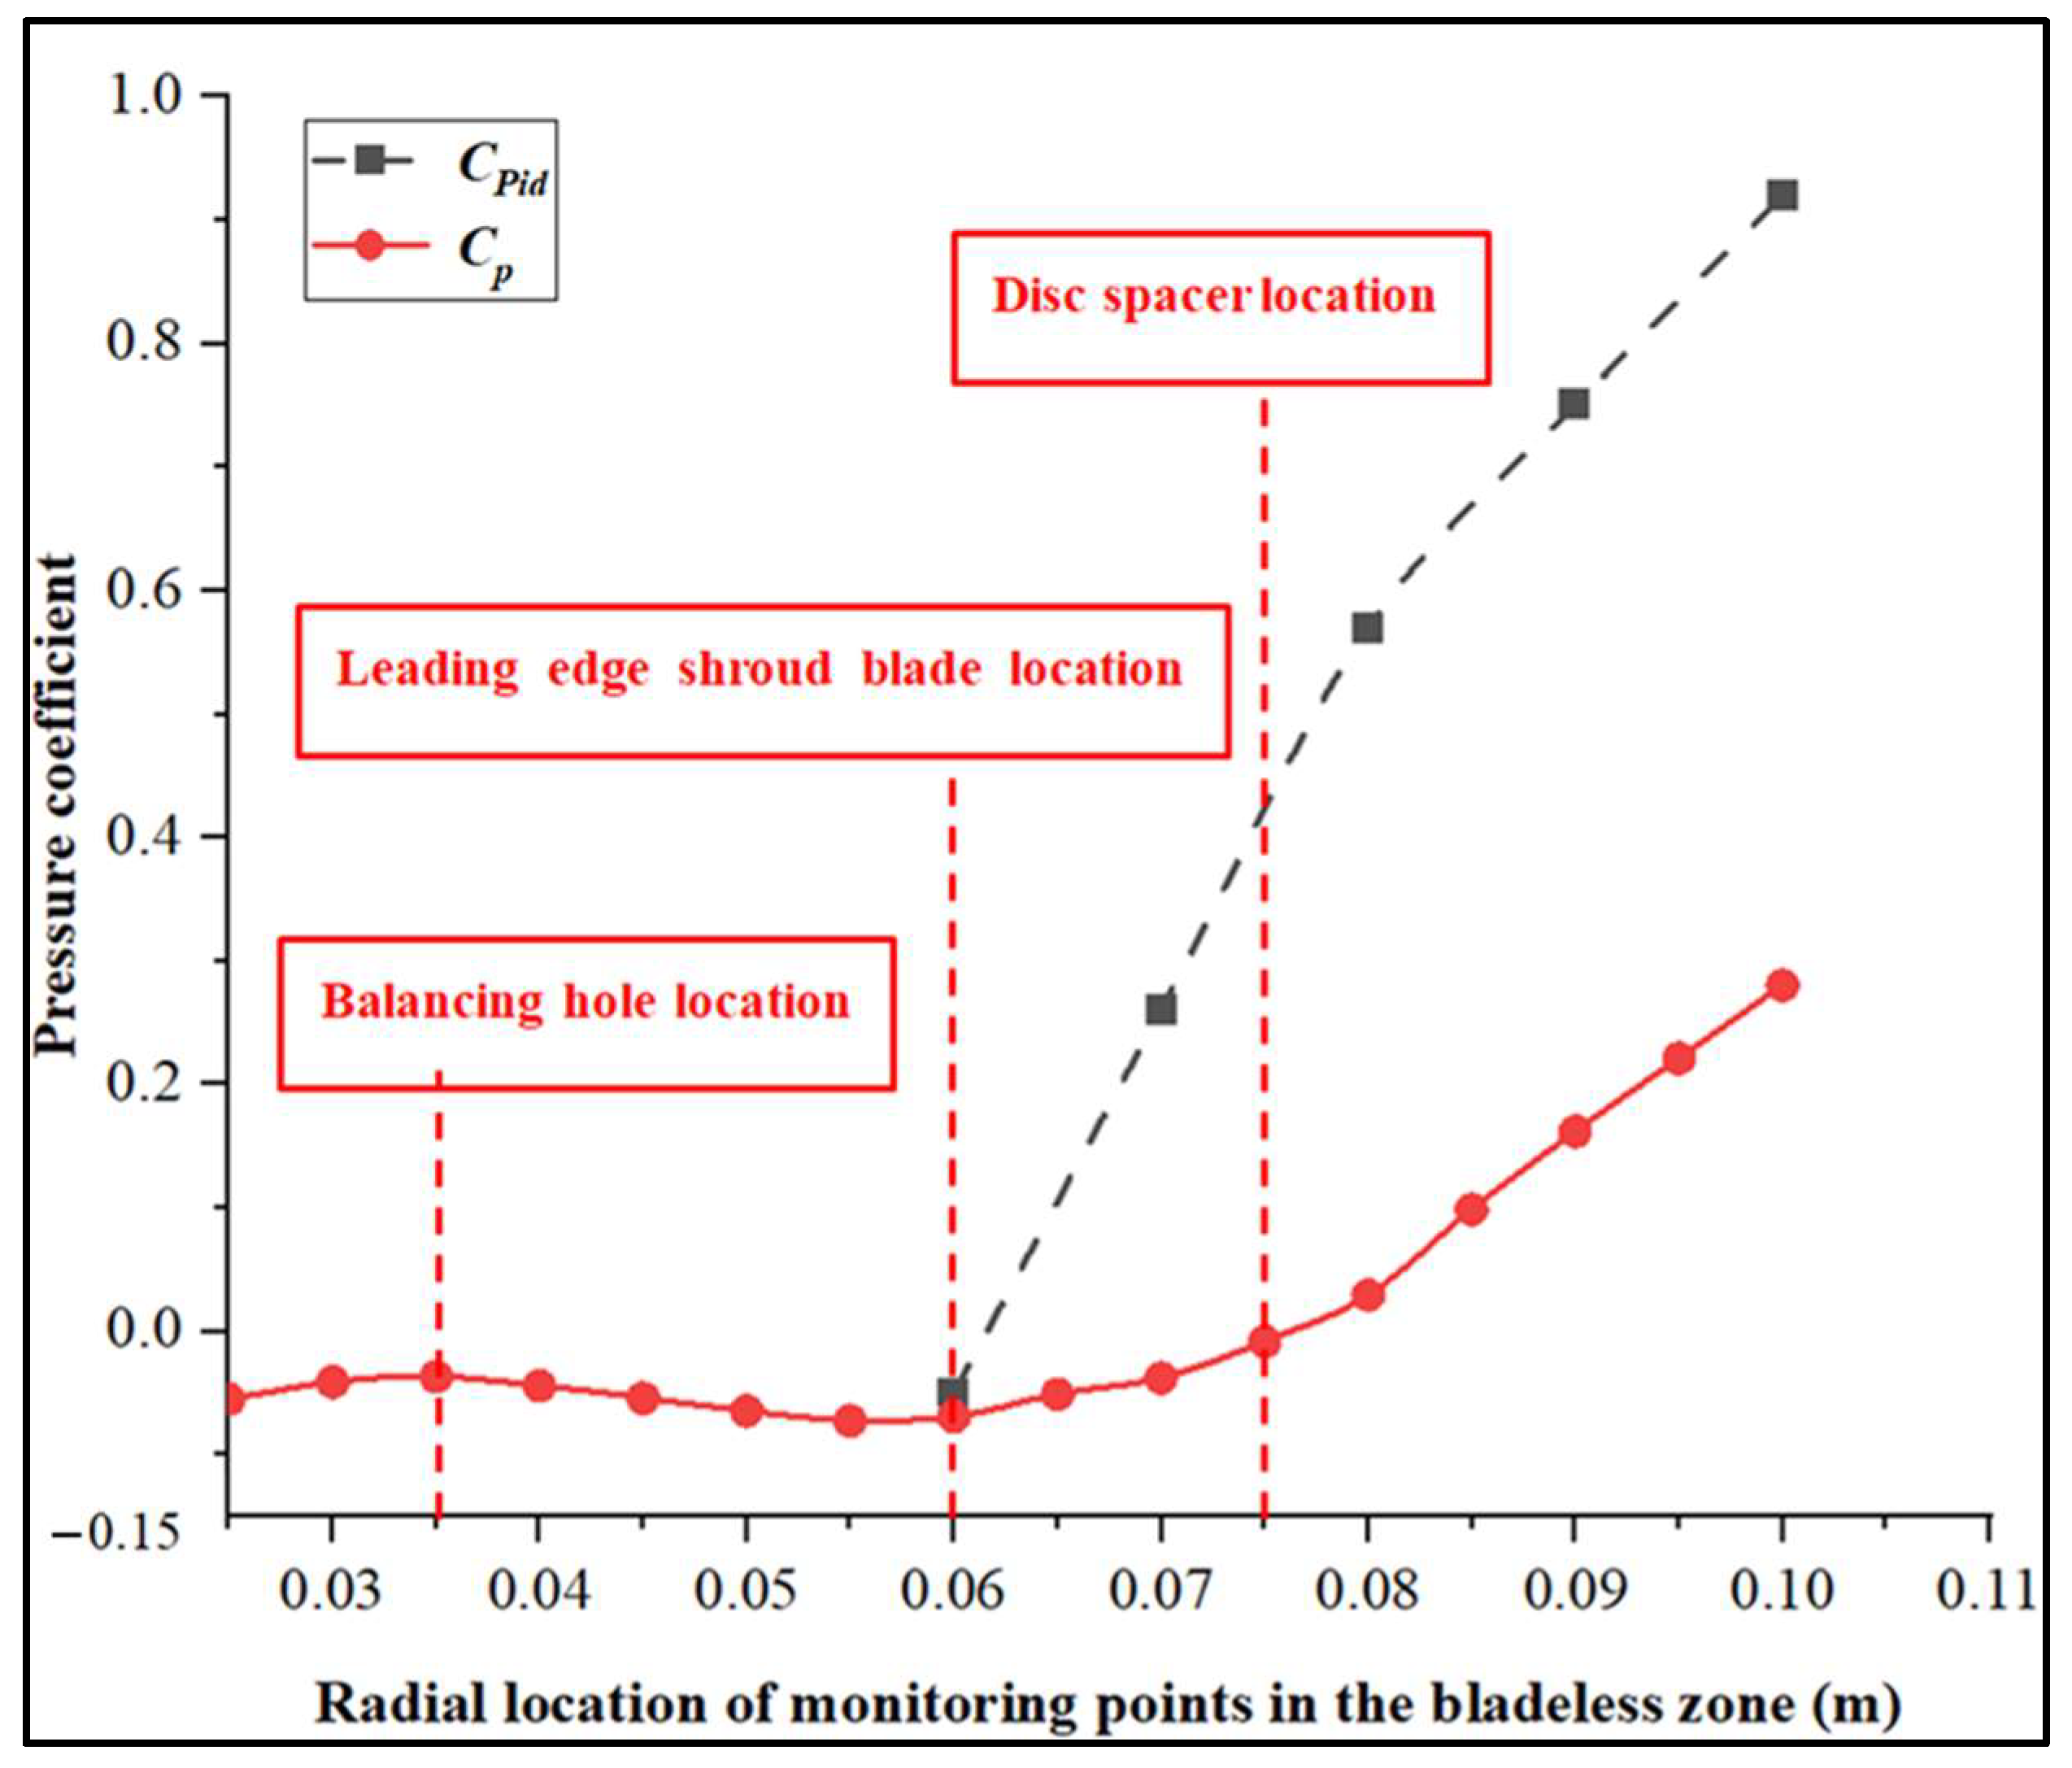
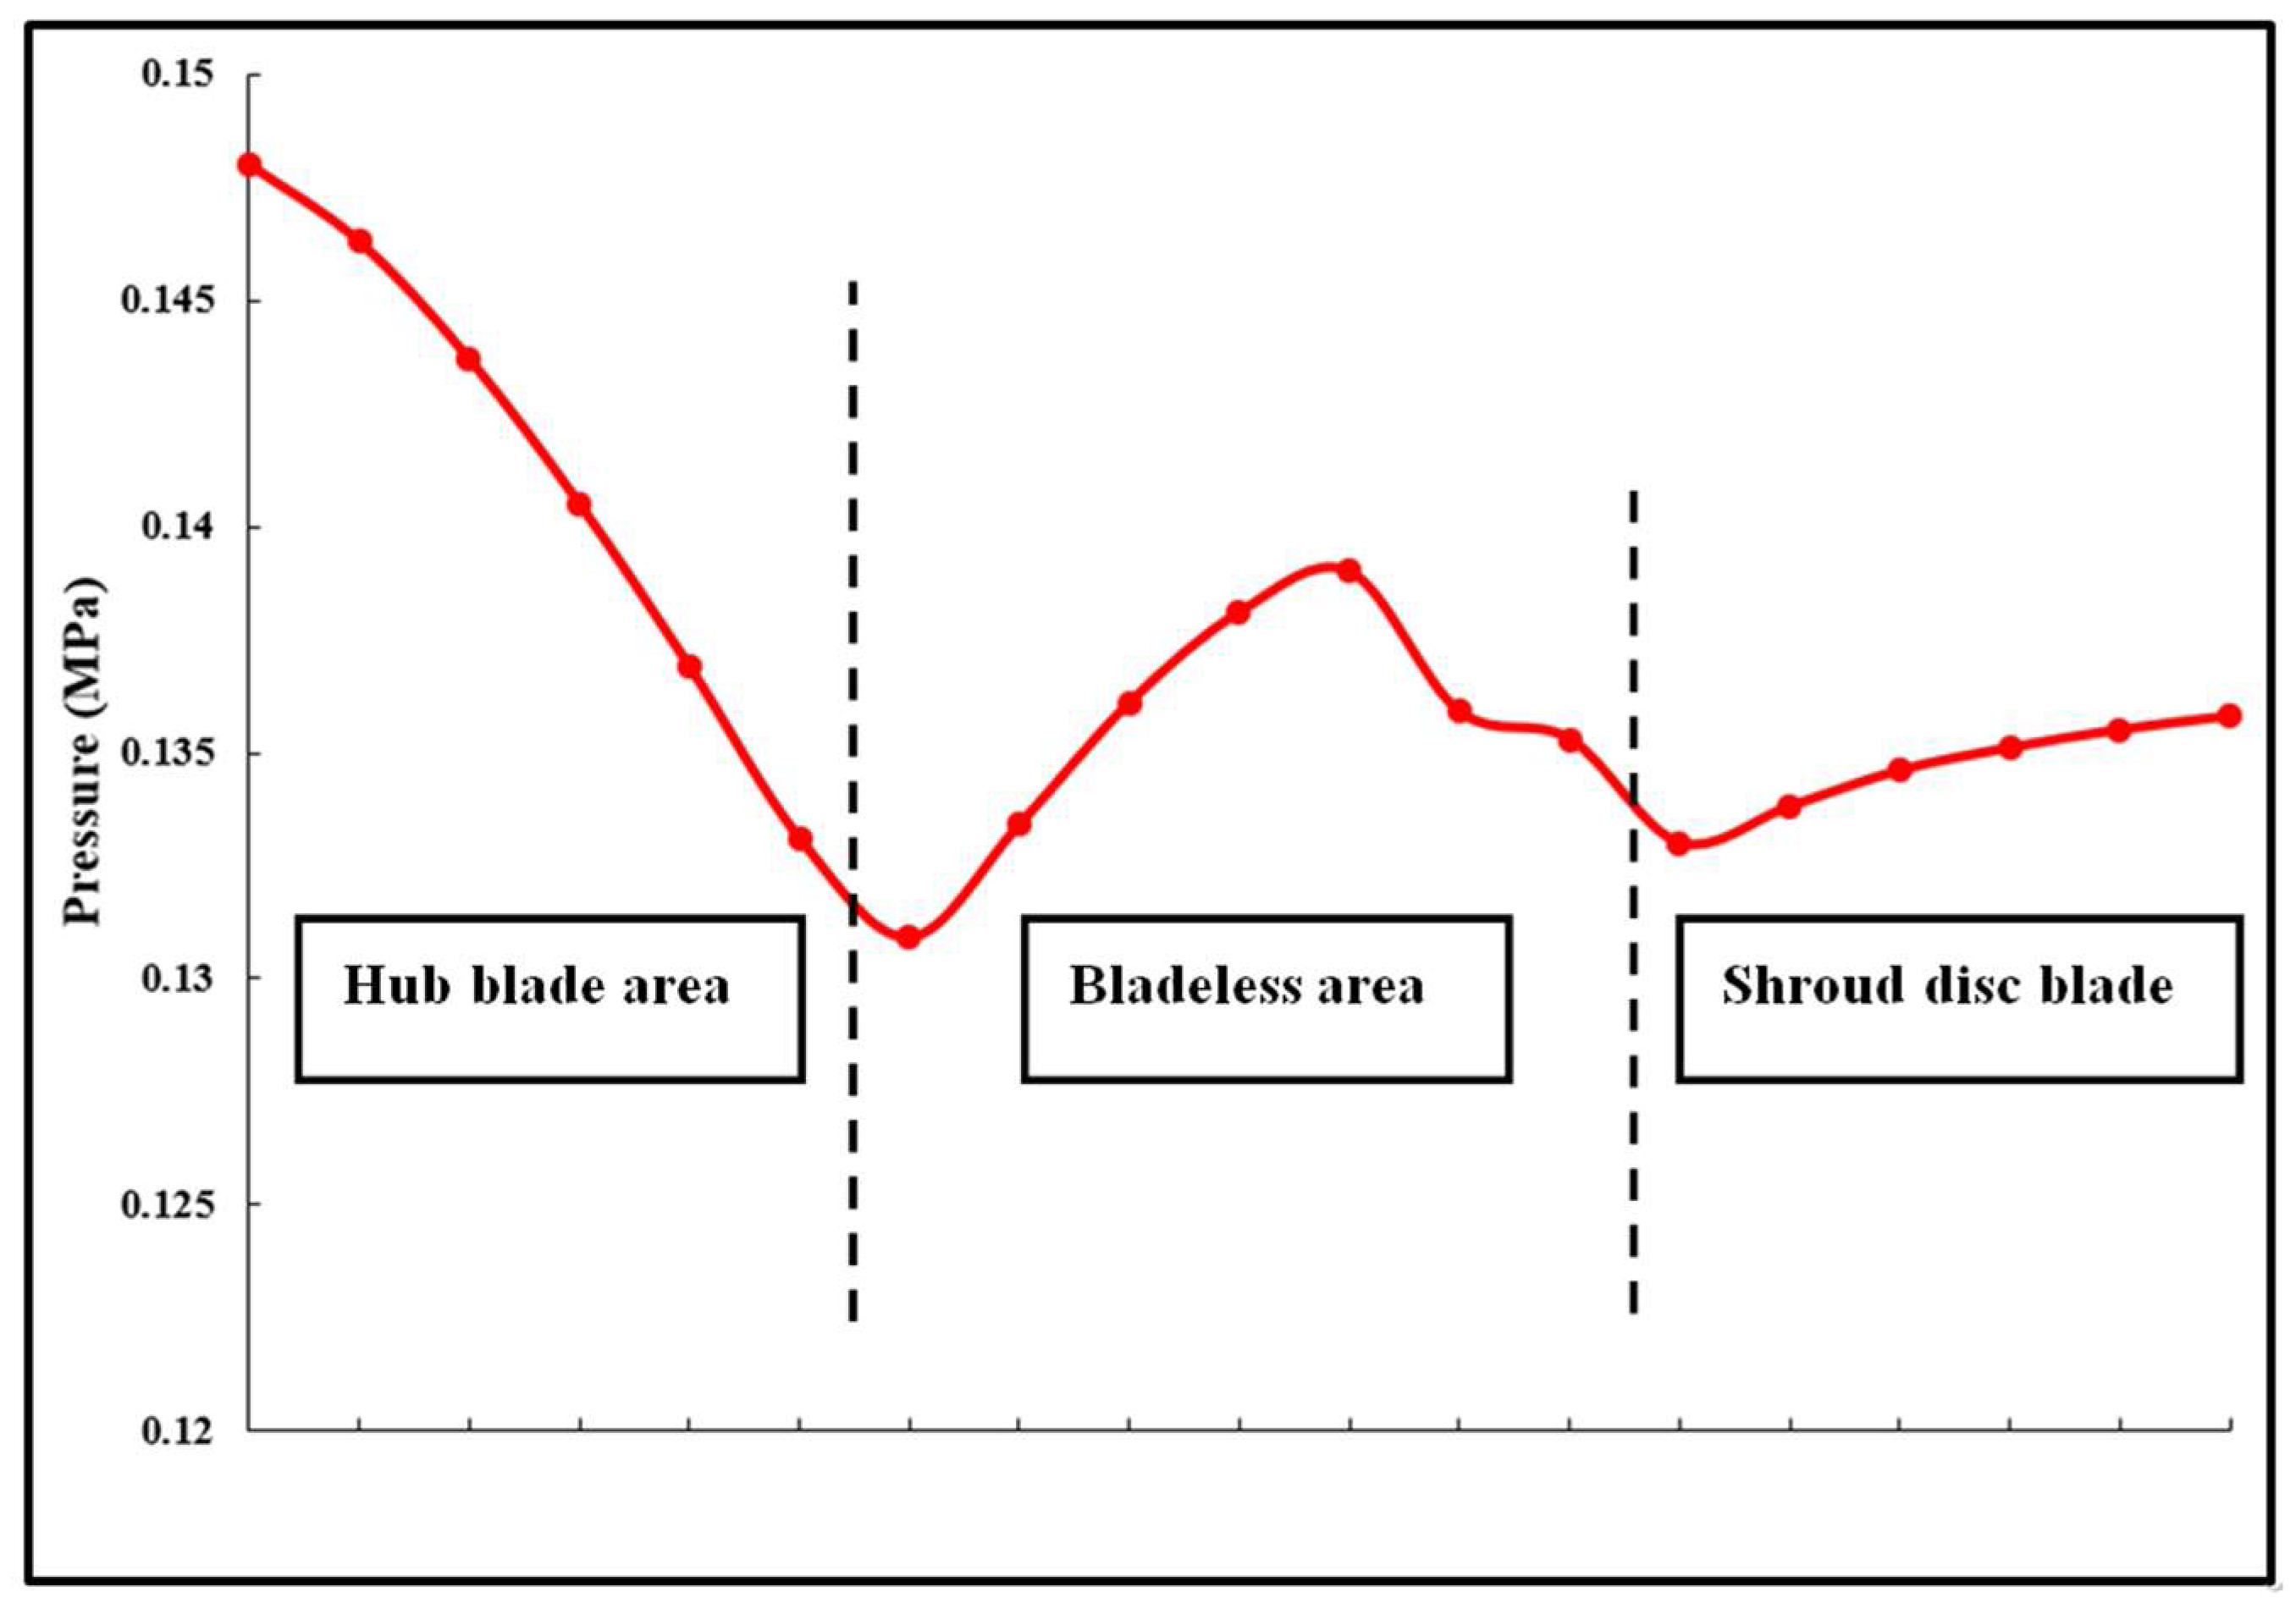
  • Along the radial direction between R = 0.06 m and 0.1 m, the rotation effects create an increase in the pressure coefficient. It should be noted that the pressure coefficient is mainly independent of the rotational speed for n = 2000 rpm and below. This is coherent with the results of classical similarity laws applied in rotating machineries when assuming incompressible and steady flow conditions for a sufficiently high Reynolds number. This pressure increase is clearly lower than the ideal one due to the losses inside the impeller passage.
  • The Cp value remains at zero up to R = 0.08, which means that pressure losses destroy the potential pressure increase that should have been obtained by the impeller rotation. This effect is mainly related to the incidence losses occurring on the radial shroud blade’s leading edge.
  • The ideal pressure coefficient can be expressed according to the momentum equation applied in the relative frame inside the impeller, assuming a one-dimensional approach, steady flow conditions and incompressible media. It can be written as follows:
(pid/ρ + W2/2 − U2/2)
This quantity remains constant along a streamline from the inlet to the outlet section of the rotating impeller. The ideal pressure coefficient CPid is defined as:
Cp id = (pid(R) − P0)/0.5ρU22
is plotted in Figure 9. The difference between the Cp id and Cp reflects all flow losses occurring inside the impeller. A strong loss increase can be observed between R = 0.06 and 0.08 m essentially attributed to the incidence and gap leakage losses due to mixing effects between the bladed area and the bladeless one. Between R = 0.08 and R = 0.1 m, the losses continue to increase but with a lower gradient due to only gap leakage losses, assuming that incidence effects are not any more detectable.

5.2. Performance Analysis with Cavitation Effects, n = 2900 rpm, φ = 0.1

Figure 10 gives the radial evolution of the predicted pressure coefficient for different inlet absolute pressure values.
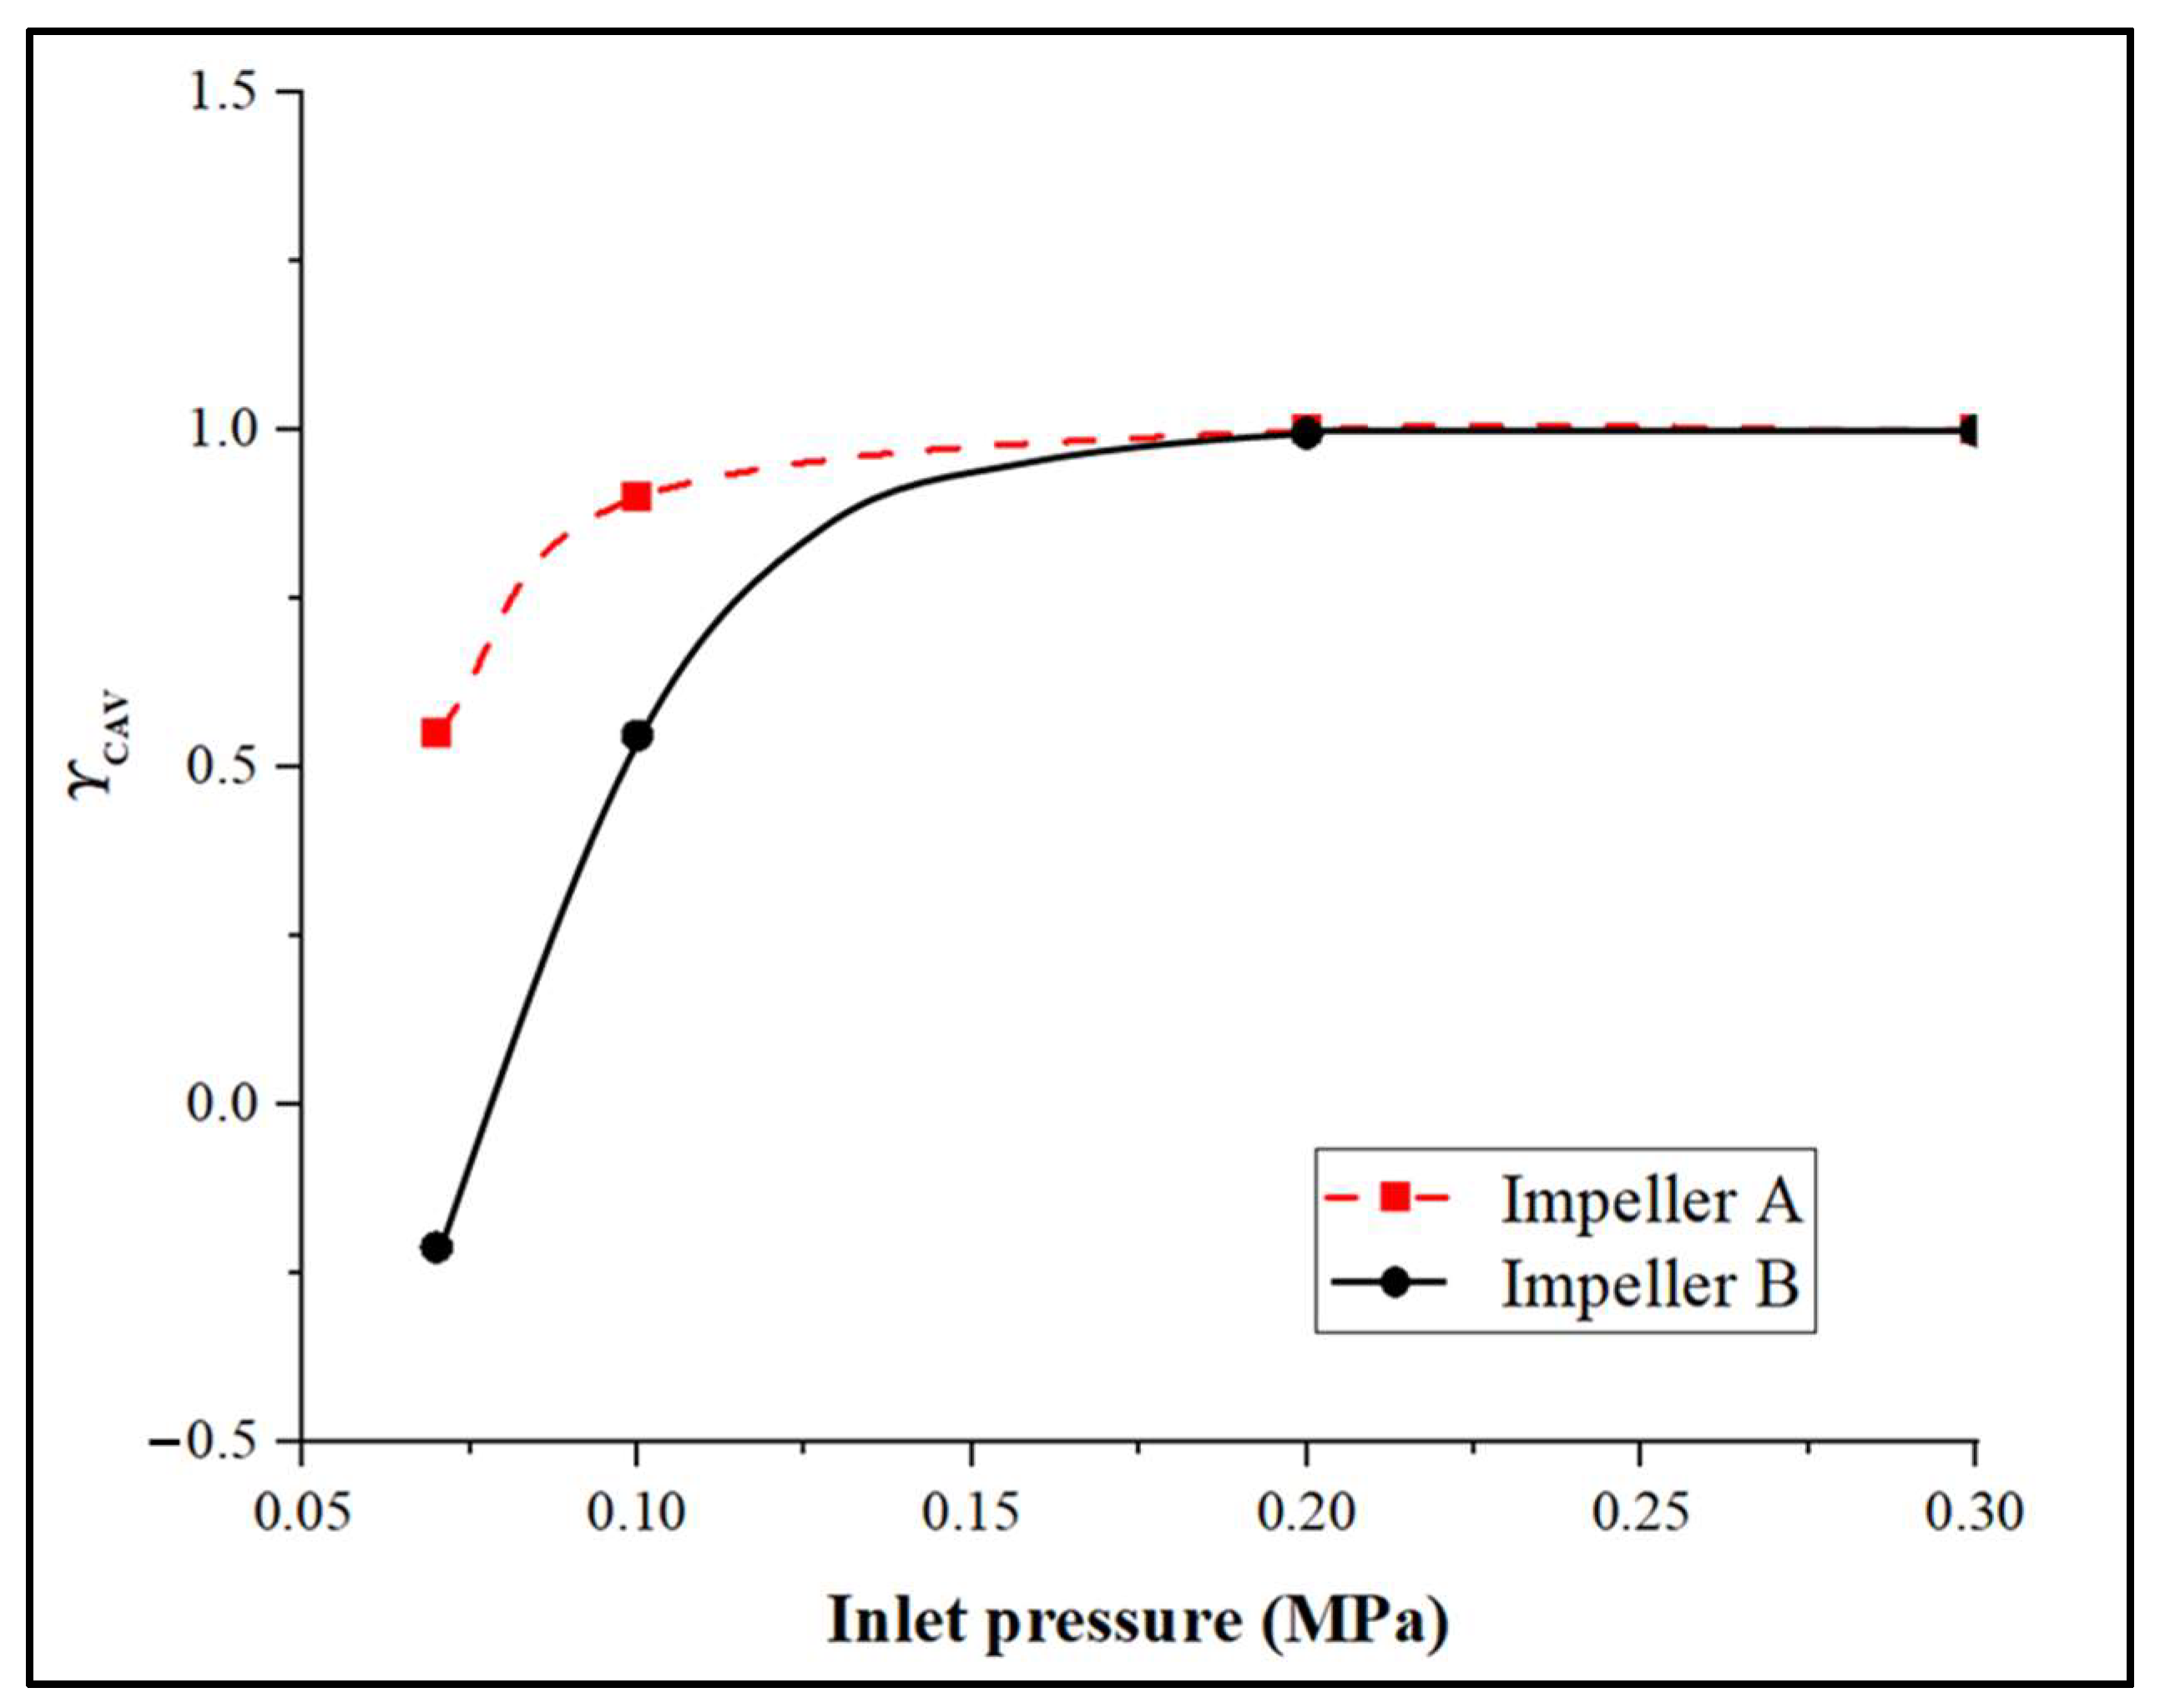
  • It can be observed that the impeller performance drastically decreases when the absolute inlet pressure is below 0.2 MPa. This indicates that disc pumps are much more sensitive to cavitation than conventional pumps and must be used in at least 10 m of water under sea level conditions.
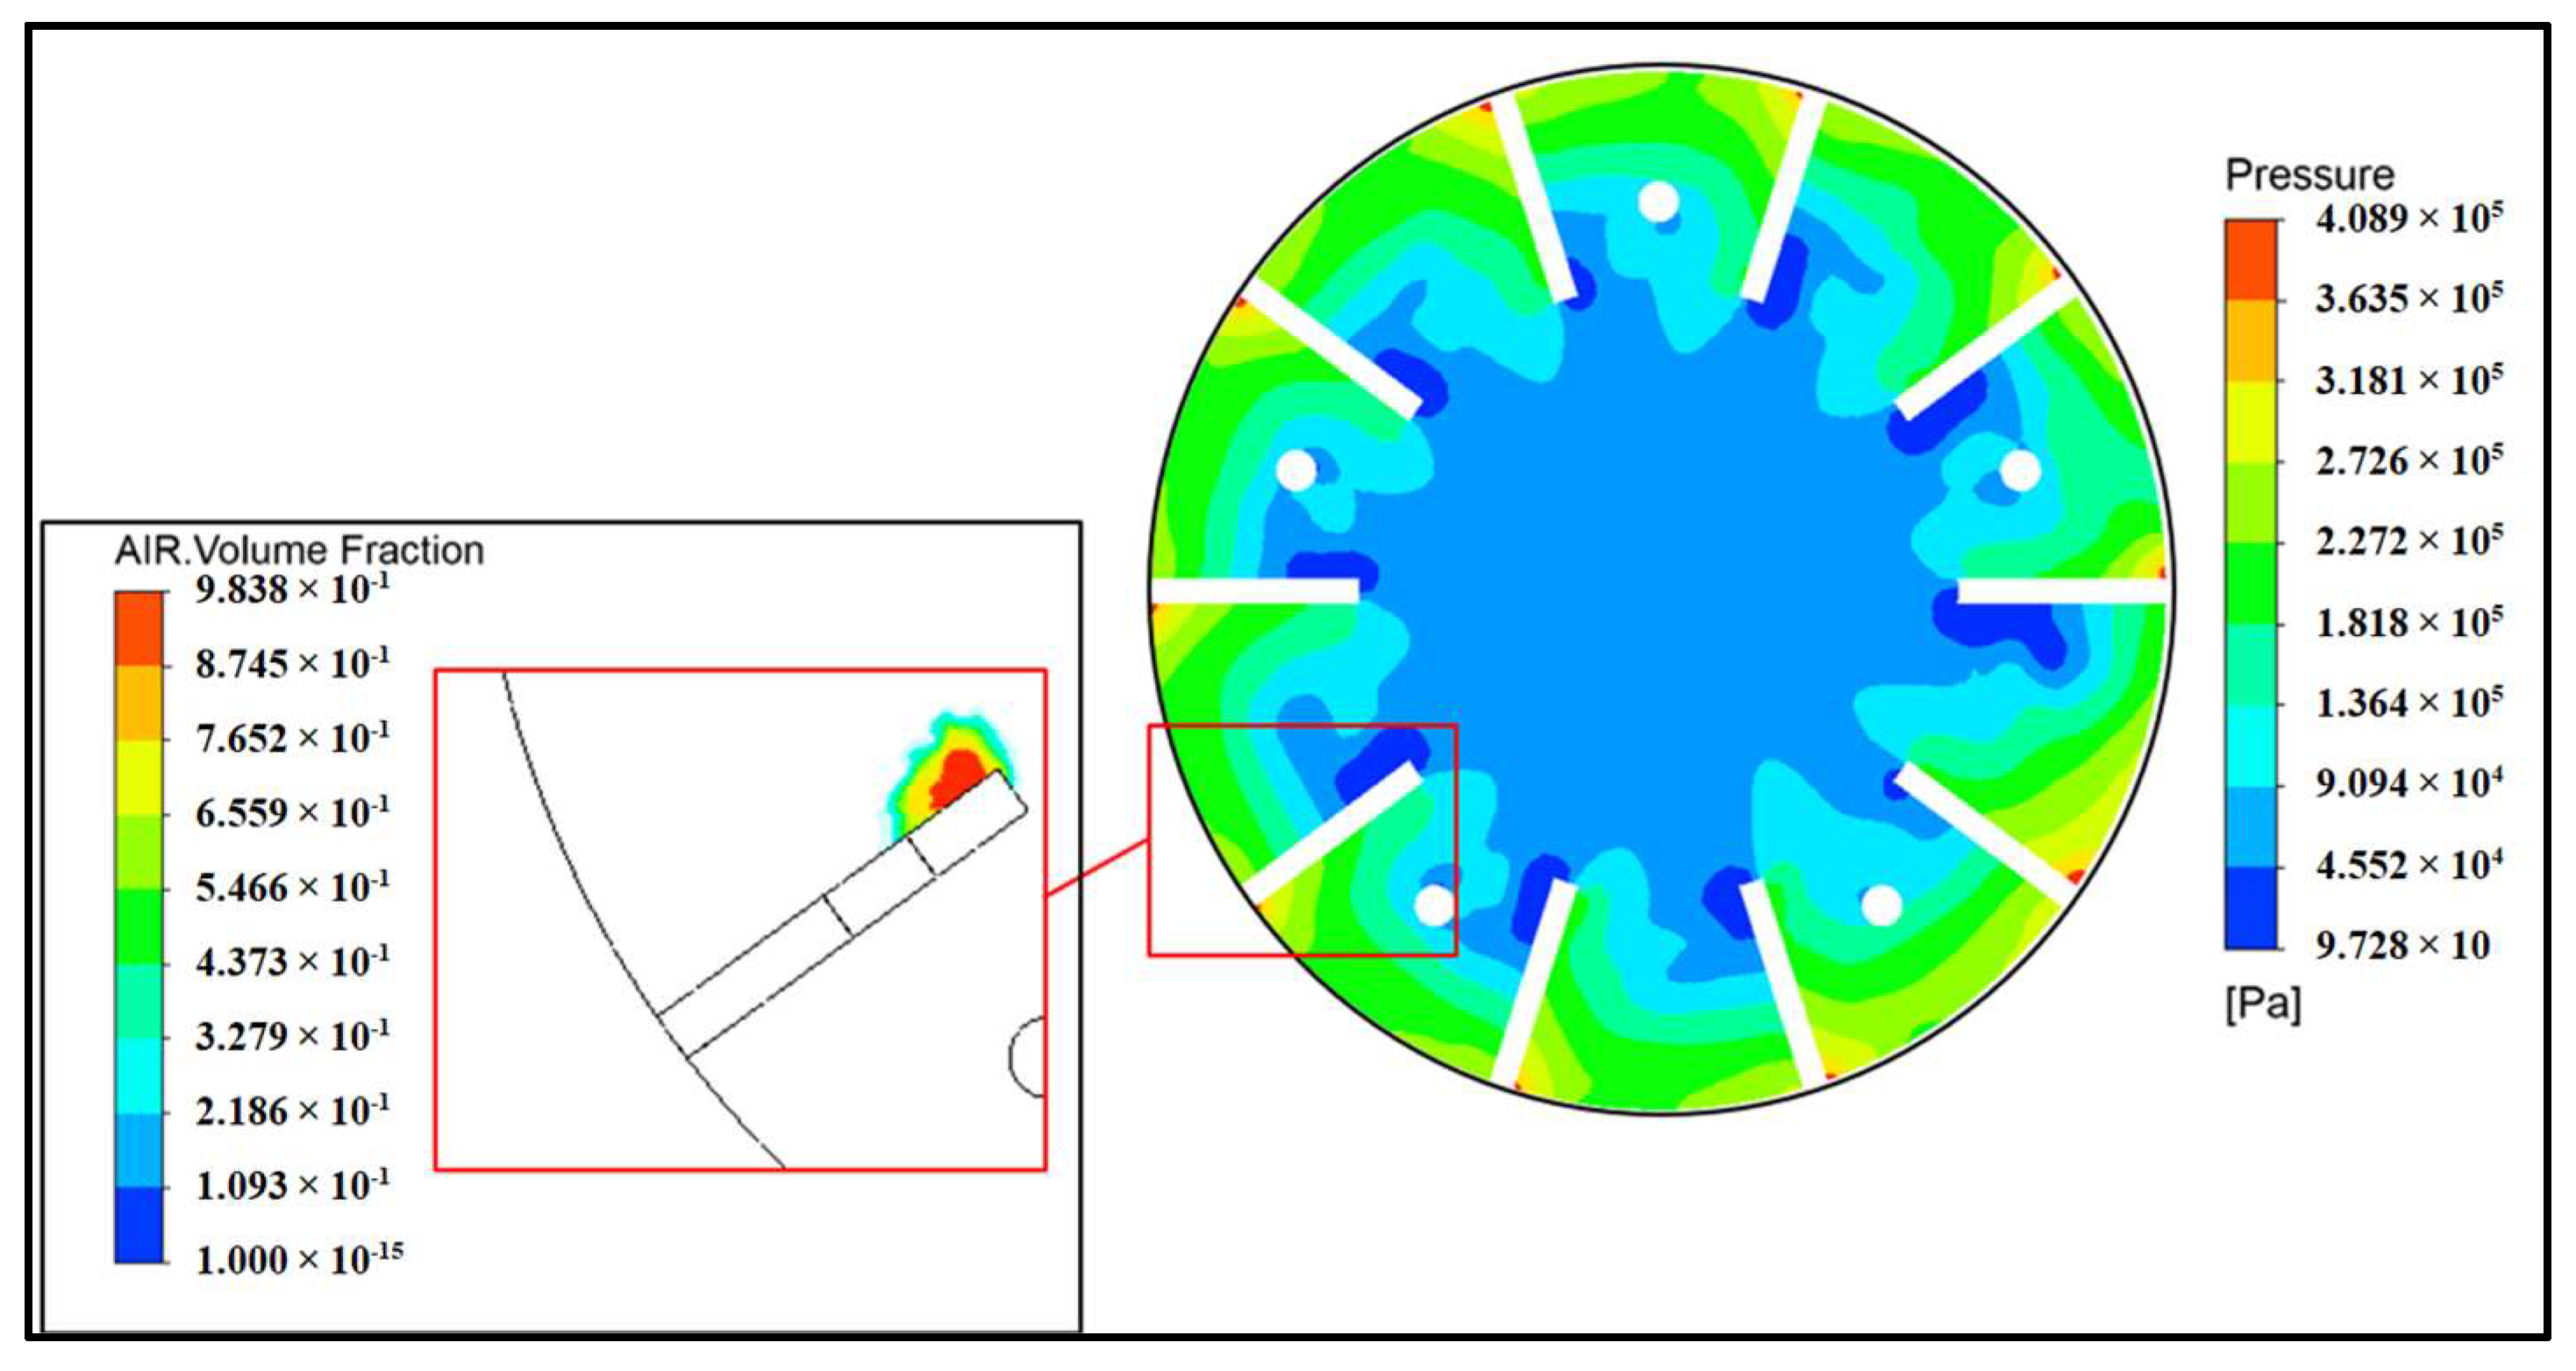
  • The static pressure increase inside the impeller becomes negligible when the inlet absolute pressure is set to 0.07 MPa, which corresponds to the experimental measured value. The effect of the cavitation onset starts at the radial location R = 0.06 m, which corresponds to the blade leading edge placed on the shroud disc, as shown in Figure 13.
  • This is a confirmation of the performance decrease measured during the experimental campaign for several rotational speeds that are discussed in Section 4.2, in relation to comments in Figure 5. As an example, a rapid evaluation of the relative velocity that impinges the blade’s leading edge for n = 2900 rpm, φ = 0.1 at R = 0.06 gives W0.06 = 19 m/s. The corresponding dynamic pressure is equal to 0.1785 MPa. This means that the pressure vapor limit is reached when the inlet pressure is below 0.2 MPa. This corresponds well with the results obtained through the CFD approach. This is the reason why no cavitation was detected for n = 1500 rpm and below during the experimental campaign.

5.3. Cavitation Sensitivity of Both Impellers

Figure 14 gives an evaluation of the cavitation effects on the performance pressure coefficient cavitation ratio ΥCAV for both impeller designs based on CFD results presented in Figure 10 (impeller model B) and previous results obtained by Zhang, W. et al. [13], related to impeller model A.
ΥCAV = Cp,cav/Cp
where Cp,cav corresponds to the pressure coefficient obtained under cavitating conditions.
For a given flow coefficient, impeller model A is less sensitive to cavitation effects than impeller model B. This is strongly related to the blade number which is greater for impeller model B with more geometrical blockage effects at the impeller’s leading-edge location.

6. Conclusions

Experimental and numerical analysis was performed and analyzed in two different impeller designs of co-rotating disc pumps with a specific attention to cavitation occurrence during the experiments.
  • Experimental and CFD results are in good agreement for both impeller model cases for a wide range of flow rates.
  • Increasing the blade number from 8 to 10 with a 30% increase in the blade height ratio strongly modifies the pump performance characteristics. Head curve variation versus flow coefficient exhibits a flatter curve in the case of 10 blades compared with 8 blades of constant thickness.
  • The head pump increases for a higher disc spacing. This is the direct consequence of the modification to the velocity triangle at the impeller outlet. For the same flow rate, the mean radial velocity component decreases resulting in an increase in the absolute tangential velocity component and, consequently, in the work given to the fluid. However, the relative influence of the distance between the two rotating discs for a given blade number and a given blade height ratio needs to be investigated in the future.
  • An increase in the blade height associated with a larger disc gap also contributes to an increase in the pump’s efficiency. This is related to a reduced gap leakage between impeller model A and B. For model A, this relative gap is equal to 0.5, whereas it is reduced to 0.35, corresponding to a potential relative diminution of 30% on tip leakage loss in the bladeless part of the impeller.
  • Disc pump models A and B are both very sensitive to a cavitation occurrence because of the radial blade configuration. Inlet pressure requirement avoiding cavitation requires an inlet absolute pressure of 0.2 MPa for the maximum rotational speed of 2900 rpm and 0.15 MPa for a 3% head decrease allowance for conventional pump designs. These pressure conditions are currently observed in marine sub-sea applications.
  • Cavitation was not detected for rotational speeds below 1500 rpm for atmospheric inlet pressure conditions over the whole range of flow rates examined in the present test results.
  • The present results can be used as a database to establish semi-empirical design laws for disc pumps equivalent to the one already developed for conventional pumps for single conditions. However, experimental campaigns with variable inlet two-phase air liquid mixtures are still necessary to provide a complete analysis concerning the future objective of the present research.

Author Contributions

Conceptualization, G.B.; Methodology, Q.J., C.L., G.B. and Y.H.; Software, C.L. and G.B.; Validation, C.L., G.B. and Y.H.; Formal analysis, Y.H.; Data curation, C.L. and G.B.; Writing—original draft, C.L. and G.B.; Writing—review & editing, G.B.; Supervision, Y.H.; Project administration, Q.J.; Funding acquisition, Q.J. All authors have read and agreed to the published version of the manuscript.

Funding

This research was funded by [Funded by Science and Technology Department of Sichuan Province] grant number [2020YFH152]. This research was funded by [Funded by Sichuan Provincial Department of Education] grant number [18ZB0563]. This research was funded by [Funded by Sichuan Science and Technology Program] grant number [2022YFH0017].

Institutional Review Board Statement

Not applicable.

Informed Consent Statement

Not applicable.

Data Availability Statement

The data that support the findings of this study are available from the author, [Liu], upon reasonable request.

Conflicts of Interest

The authors declare no conflict of interest.

Abbreviations

bimpeller passage width (m). Disc spacing (m)
Cppressure coefficient
D diameter (m)
g acceleration (m2/s)
h blade height(m)
Hhead (m)
Psshaft power (W).
Pttotal pressure (Pa)
p static pressure (Pa)
Q volume flow rate(m3/h)
R radius (m)
Uimpeller speed (m/s)
n rotational speed (rev/min)
Z number of blades
φ flow coefficient
Ψhead coefficient
η efficiency (%)
Υ ratio
Subscripts
A impeller model A
B impeller model B
0 pump inlet section
1impeller inlet section
2impeller outlet section
3casing base circle
cav related to cavitation
id ideal
inpipe inlet
out pipe outlet

References

  1. Tesla, N. Fluid Propulsion. U.S. Patent 1061142, 6 May 1913. [Google Scholar]
  2. Gurth, M. Rotary Disc Slurry Pump. U.S. Patent 4773819, 27 September 1988. [Google Scholar]
  3. Gurth, M. Rotary Disc Pump. U.S. Patent 4940385, 10 July 1990. [Google Scholar]
  4. Gurth, M. Rotary Disc Pump. U.S. Patent 7097416B2, 29 August 2006. [Google Scholar]
  5. Chen, Y.; Chen, G. Analysis on the influence of blade structure on exterior characteristics of disc pump. J. Mech. Des. 2014, 31, 93–96. [Google Scholar]
  6. Gao, B. Flow Field Simulation and Performance Assessment for the Subsea Mud Lift Disc Pump. Master’s Thesis, China University of Petroleum (East China), Qingdao, China, 2009. [Google Scholar]
  7. Zhang, Y. Study on Design Application Method for Subsea Mud Lift Disc Pump. Master’s Thesis, China University of Petroleum (East China), Qingdao, China, 2015. [Google Scholar]
  8. Yin, S.; Chen, G.; Zhou, C. New-type impeller design and performance prediction for disc pump. Fluid Mach. 2012, 40, 19–23. [Google Scholar]
  9. Pei, Y.; Liu, Q.; Wang, C.; Wang, G. Analytical methods, and verification of impeller outlet velocity slip of solid–liquid disc pump with multi-type blades. Arab. J. Sci. Eng. 2020, 46, 6835–6847. [Google Scholar] [CrossRef]
  10. Heng, Y.; Han, Y.; Zhang, H.; Zhang, W.; Bois, G.; Jiang, Q.; Wang, Z.; Lui, X. Tesla bladed pump (disc bladed pump) preliminary experimental performance analysis. Energies 2020, 13, 4873. [Google Scholar] [CrossRef]
  11. Heng, Y.; He, K.; Jiang, Q.; Zhang, W.; Bois, G.; Liu, X. An Analysis on Hydraulic Loss in a Co-Rotating Bladed Disc Pump. J. Mar. Sci. Eng. 2022, 10, 214. [Google Scholar] [CrossRef]
  12. Discflo-Disc Pump. Available online: https://discflo.com (accessed on 16 July 2021).
  13. Zhang, W.; Li, H.; Kun, S.; Jiang, Q.; Bois, G. Internal Cavitating Flow Distribution and Performance Comparison of a Disc Pump with Radial Straight Blade. J. Mar. Sci. Eng. 2022, 10, 1641. [Google Scholar] [CrossRef]
  14. Ye, Y.; Zhu, X.; Lai, F.; Li, G. Application of the semi-analytical cavitation model to flows in a centrifugal pump. Int. Commun. Heat Mass Transf. 2017, 86, 92–100. [Google Scholar] [CrossRef]
  15. Liu, W.; Jiang, H. Partially-Averaged Navier-Stokes Model for Predicting Cavitating Flow in Centrifugal Pump. Eng. Appl. Comput. Fluid Mech. 2014, 8, 476. [Google Scholar] [CrossRef]
  16. Zhou, C.J.; Cheng, G.M.; Tan, H.D. Numerical simulation of flow in solid-liquid Blade disc pump volute. Chem. Eng. Mach. 2014, 41, 501–504. [Google Scholar]
  17. Zhou, C.J.; Qu, Y.; Zhang, D.H.; Gao, B. Influence of Particle characteristics on the distribution of solid particles in the disk impeller with radial straight blade. Fluid Mach. 2015, 43, 14–18. [Google Scholar]
  18. Chen, Y.C.; Chen, G.M.; Yin, S.M.; Zhou, C.J.; Lv, T. Modal analysis on the impeller of disc pump with radial straight blade based on fluid-structure interation. J. Mech. Strength 2014, 36, 134–138. [Google Scholar]
  19. Wang, C.; Zhang, B.H.; Fei, Y.J.; Wang, D.B. Research on unsteady characteristics and inflow mechanism of different pumping chamber of disc pump. J. Eng. Therm. Energy Power 2021, 36, 17–22. [Google Scholar]
  20. Heng, Y.; Jiang, Q.; Han, Y.; Zhang, W.; Bois, G.; Wan, Z.; Lui, X. Tesla Bladed Disc Pump Hydraulic Performance. In Proceedings of the 14th European Conference on Turbomachinery Fluid Dynamics and Thermodynamics, ETC 14, Gdansk, Poland, 12–16 April 2012. Paper ID: ETC 21.448. [Google Scholar]
  21. Zwart, P.; Gerber, A.G.; Belamri, T. A two-phase model for predicting cavitation dynamics. In Proceedings of the ICMF2004 International Conference on Multiphase Flow, Yokohama, Japan, 30 May–3 June 2004. Paper No.152. [Google Scholar]
Figure 1. Fluid domain model (left) and impeller A 3D model (right). 1: Outlet extension. 2: Inlet extension. 3: Front cavity. 4: Volute. 5: Back cavity. 6: Impeller.
Jmse 11 02104 g001
Figure 2. Impeller A model (left) and impeller B model (right).
Jmse 11 02104 g002
Figure 3. Example of the grid configuration inside the disc pump flow passage.
Jmse 11 02104 g003
Figure 4. Disc pump test bed; 1. Electric variable speed motor; 2. Torque measuring device; 3. Disc pump; 4. Flow meter; 5. Flow control valve; 6. Water tank; 7. Data acquisition system.
Jmse 11 02104 g004
Figure 5. Experimental non-dimensional performance charts of impeller models A and B for three different rotational speeds.
Jmse 11 02104 g005
Figure 6. Impeller model A. Experiments-CFD comparison for n = 2900 rpm.
Jmse 11 02104 g006
Figure 7. Impeller Model B. Experiments-CFD comparison for n = 2900 rpm.
Jmse 11 02104 g007
Figure 8. Static pressure evolution along radial direction in the middle of the bladeless area. Impeller model B. Several rotational speeds. No cavitation. φ = 0.1. The locations of the monitoring points are given in Figure 11.
Jmse 11 02104 g008
Figure 9. Comparison between the ideal pressure coefficient Cp id and present Cp along the radial direction in the middle of the bladeless area. No cavitation. The locations of the monitoring points are given in Figure 11.
Jmse 11 02104 g009
Figure 10. CFD results. Static pressure rise coefficient evolution along radial direction in the middle of the bladeless area. Impeller model B. n = 2900 rpm. Influence of the absolute inlet pressure level. φ = 0.1. The locations of the monitoring points are given in Figure 11.
Jmse 11 02104 g010
Figure 11. Monitoring point positions, Impeller model B.
Jmse 11 02104 g011
Figure 12. Hub-to-shroud axial distribution of the static pressure in the impeller outlet section. Impeller model B. n = 2900 rpm. Inlet pressure: 0.1 MPa. φ = 0.0625. (Best efficiency point.)
Jmse 11 02104 g012
Figure 13. CFD results. Static pressure map and local air volume fraction on the shroud blade suction side. Impeller model B, n = 2900 rpm. Inlet pressure: 0.07 MPa. φ = 0.0625. (Best efficiency point.)
Jmse 11 02104 g013
Figure 14. Pressure coefficient evolution due to cavitation induced by inlet pressure variation. Impeller model A and B. n = 2900 rpm. φ = 0.1.
Jmse 11 02104 g014
Table 1. Design parameters of disc pump impeller.
Major ParameterSymbolsValueUnits
max rotation speedn2900r/min
number of bladesZA/ZB8/10-
blade heighthA/hB0.004/0.00715m
impeller passage widthbA/bB0.016/0.022m
impeller inlet diameterD10.088m
impeller outlet diameterD20.200m
base circle diameter of casingD30.220m
inlet pipe diameterDin0.088m
outlet pipe diameterDout0.064m
Table 2. Outlet pressure corresponding to different grid numbers.
Mesh Number (Million)Computing Time (h)Outlet Pressure (MPa)Convergence Ratio
8.394.70.3793
9.124.90.36820.3010
13.776.50.36210.01682
15.3170.36340.00357
Disclaimer/Publisher’s Note: The statements, opinions and data contained in all publications are solely those of the individual author(s) and contributor(s) and not of MDPI and/or the editor(s). MDPI and/or the editor(s) disclaim responsibility for any injury to people or property resulting from any ideas, methods, instructions or products referred to in the content.

