1. Introduction
A ship structure is a substantial welded assembly, and welding operations often introduce welding defects. Simultaneously, geometric discontinuity in the ship construction process can cause significant stress concentration, resulting in large stress peaks, meaning that fatigue cracks always occur at the ends of the welding toe and the flat butt weld. When members containing such cracks are subjected to alternating loads, even if the loads are lower than the fatigue strength limit of the material itself, the cracks will still quickly propagate and break, resulting in catastrophic damage [
1].
In particular, for large container ships with large openings, small block coefficients, significant profile changes, and high speeds, in order to reduce the hull weight, a large amount of high-strength steel is used in the structure. Fatigue strength assessment is extremely important for the structural safety of large container ships [
2]. A safety life assessment should have the ability to predict and evaluate the safety and remaining life of cracks during a container ship’s service life, and to determine, based on scientific inspection, a maintenance cycle based on the safety life assessment results of the cracked structure. Therefore, for the safety assessments of ship structures with crack defects, it is necessary to predict crack growth under the environmental loads acting on a ship.
In the structural fatigue assessment of ships, the traditional cumulative damage method based on the S-N curve method has been verified via extensive application in real-word scenarios. In recent years, the fracture mechanics method has attracted more attention than the cumulative damage method, as the influence of geometric defects and the construction accuracy in fatigue life assessment are both considered. Bowness and Lee [
3] developed an empirical formula for the amplification coefficient of the crack stress intensity factor under tensile stress and bending stress in T-welded joints. A simplified calculation method was proposed by Han et al. [
4] to evaluate the impact of the crack stress intensity factor on the surface of fillet welding, and the influence of the crack depth and shape ratio on the stress intensity factor was revealed. Huang et al. [
5,
6,
7] carried out research on the selection of material parameters in the crack propagation analysis model under various loads of amplitude. Using fracture mechanics theory, a single propagation rate curve model for marine steel structures was thus proposed. Based on fracture mechanics theory, Karan et al. [
8] investigated fatigue crack propagation in a typical location for a large oil tanker. Feng et al. [
9] comprehensively studied the probabilistic model and reliability for crack propagation in structural stiffened hull plates. The Monte Carlo simulation method was used to define the probabilistic model. The probabilistic model for crack size in a stiffened plate changed over time, acting as a time-dependent function under different parameters. Sumi [
10] conducted an analysis of fatigue crack propagation in a ship structure under operational sailing conditions, and a comparative study of theoretical calculation results and experimental data was included. Yan [
11] et al. compared the FEA with the empirical formula method to determine the stress intensity factor in typical critical locations, and the effectiveness of the fatigue crack propagation analysis method was verified; this study also provided a feasible calculation method for fatigue strength assessment. Using finite element analysis, Kong et al. [
12] proposed a formula for calculating the stress intensity factor for stiffeners, and the characteristics of various structural forms and their influence on stress intensity factors were analyzed to categorize the different structural forms, but the calculation method for the stress intensity factor needed to be further verified and analyzed on actual ships. Željko et al. [
13] presented a method where the effect of residual stresses was considered in order to predict fatigue crack propagation in stiffened welded panels.
In summary, these studies support the feasibility of predicting the structural fatigue life using the fracture mechanics method. Most research on the fracture mechanics method primarily emphasizes theoretical analysis. However, the calculation process for the present fracture mechanics method is complicated, and this poses challenges to its practical application and widespread adoption in engineering projects. A simple and practical fatigue life assessment method is necessary to improve the practicality of fatigue assessments for hull structures.
With reference to the research results in the relevant literature [
14,
15,
16], factors such as initial material defects, structural discontinuities, and construction process deviations are comprehensively considered and advanced to propose a simplified fatigue analysis model and crack propagation analysis method that can be conveniently applied to structural design and security assessment. Improvements in new shipbuilding technology makes the initial size of the welding crack controllable in the shipyard. The size of the initial crack can be adjusted based on the accuracy of the actual ship construction and has received approval from classification societies. Therefore, the actual size and shape of the initial crack, which can be obtained via the shipyard’s construction process and inspection, is very important for the prediction of structural fatigue life and, compared to the conventional S-N curve method, the crack propagation analysis method based on fracture mechanics theory that is proposed in this paper can precisely consider the above factors.
The fatigue life evaluation and engineering analysis verification were carried out on a large container ship, and the following will be focused on in this paper:
- (1)
The structural response induced by wave loads
The fatigue load spectrum of fracture mechanics methods must be established with the probability density under the specific stress range. The long-term distribution of working stress is applied to describe the long-term distribution in the fatigue stress range of large container ships; it is the combination of wave-induced working stresses during the service period at sea, and most classification societies have adopted the Weibull distribution with two parameters (the shape and scale parameters). The selection of reasonable shape parameters and scale parameters is critical to improving the prediction accuracy for fatigue life in large container ships.
- (2)
The calculation of the stress intensity factor
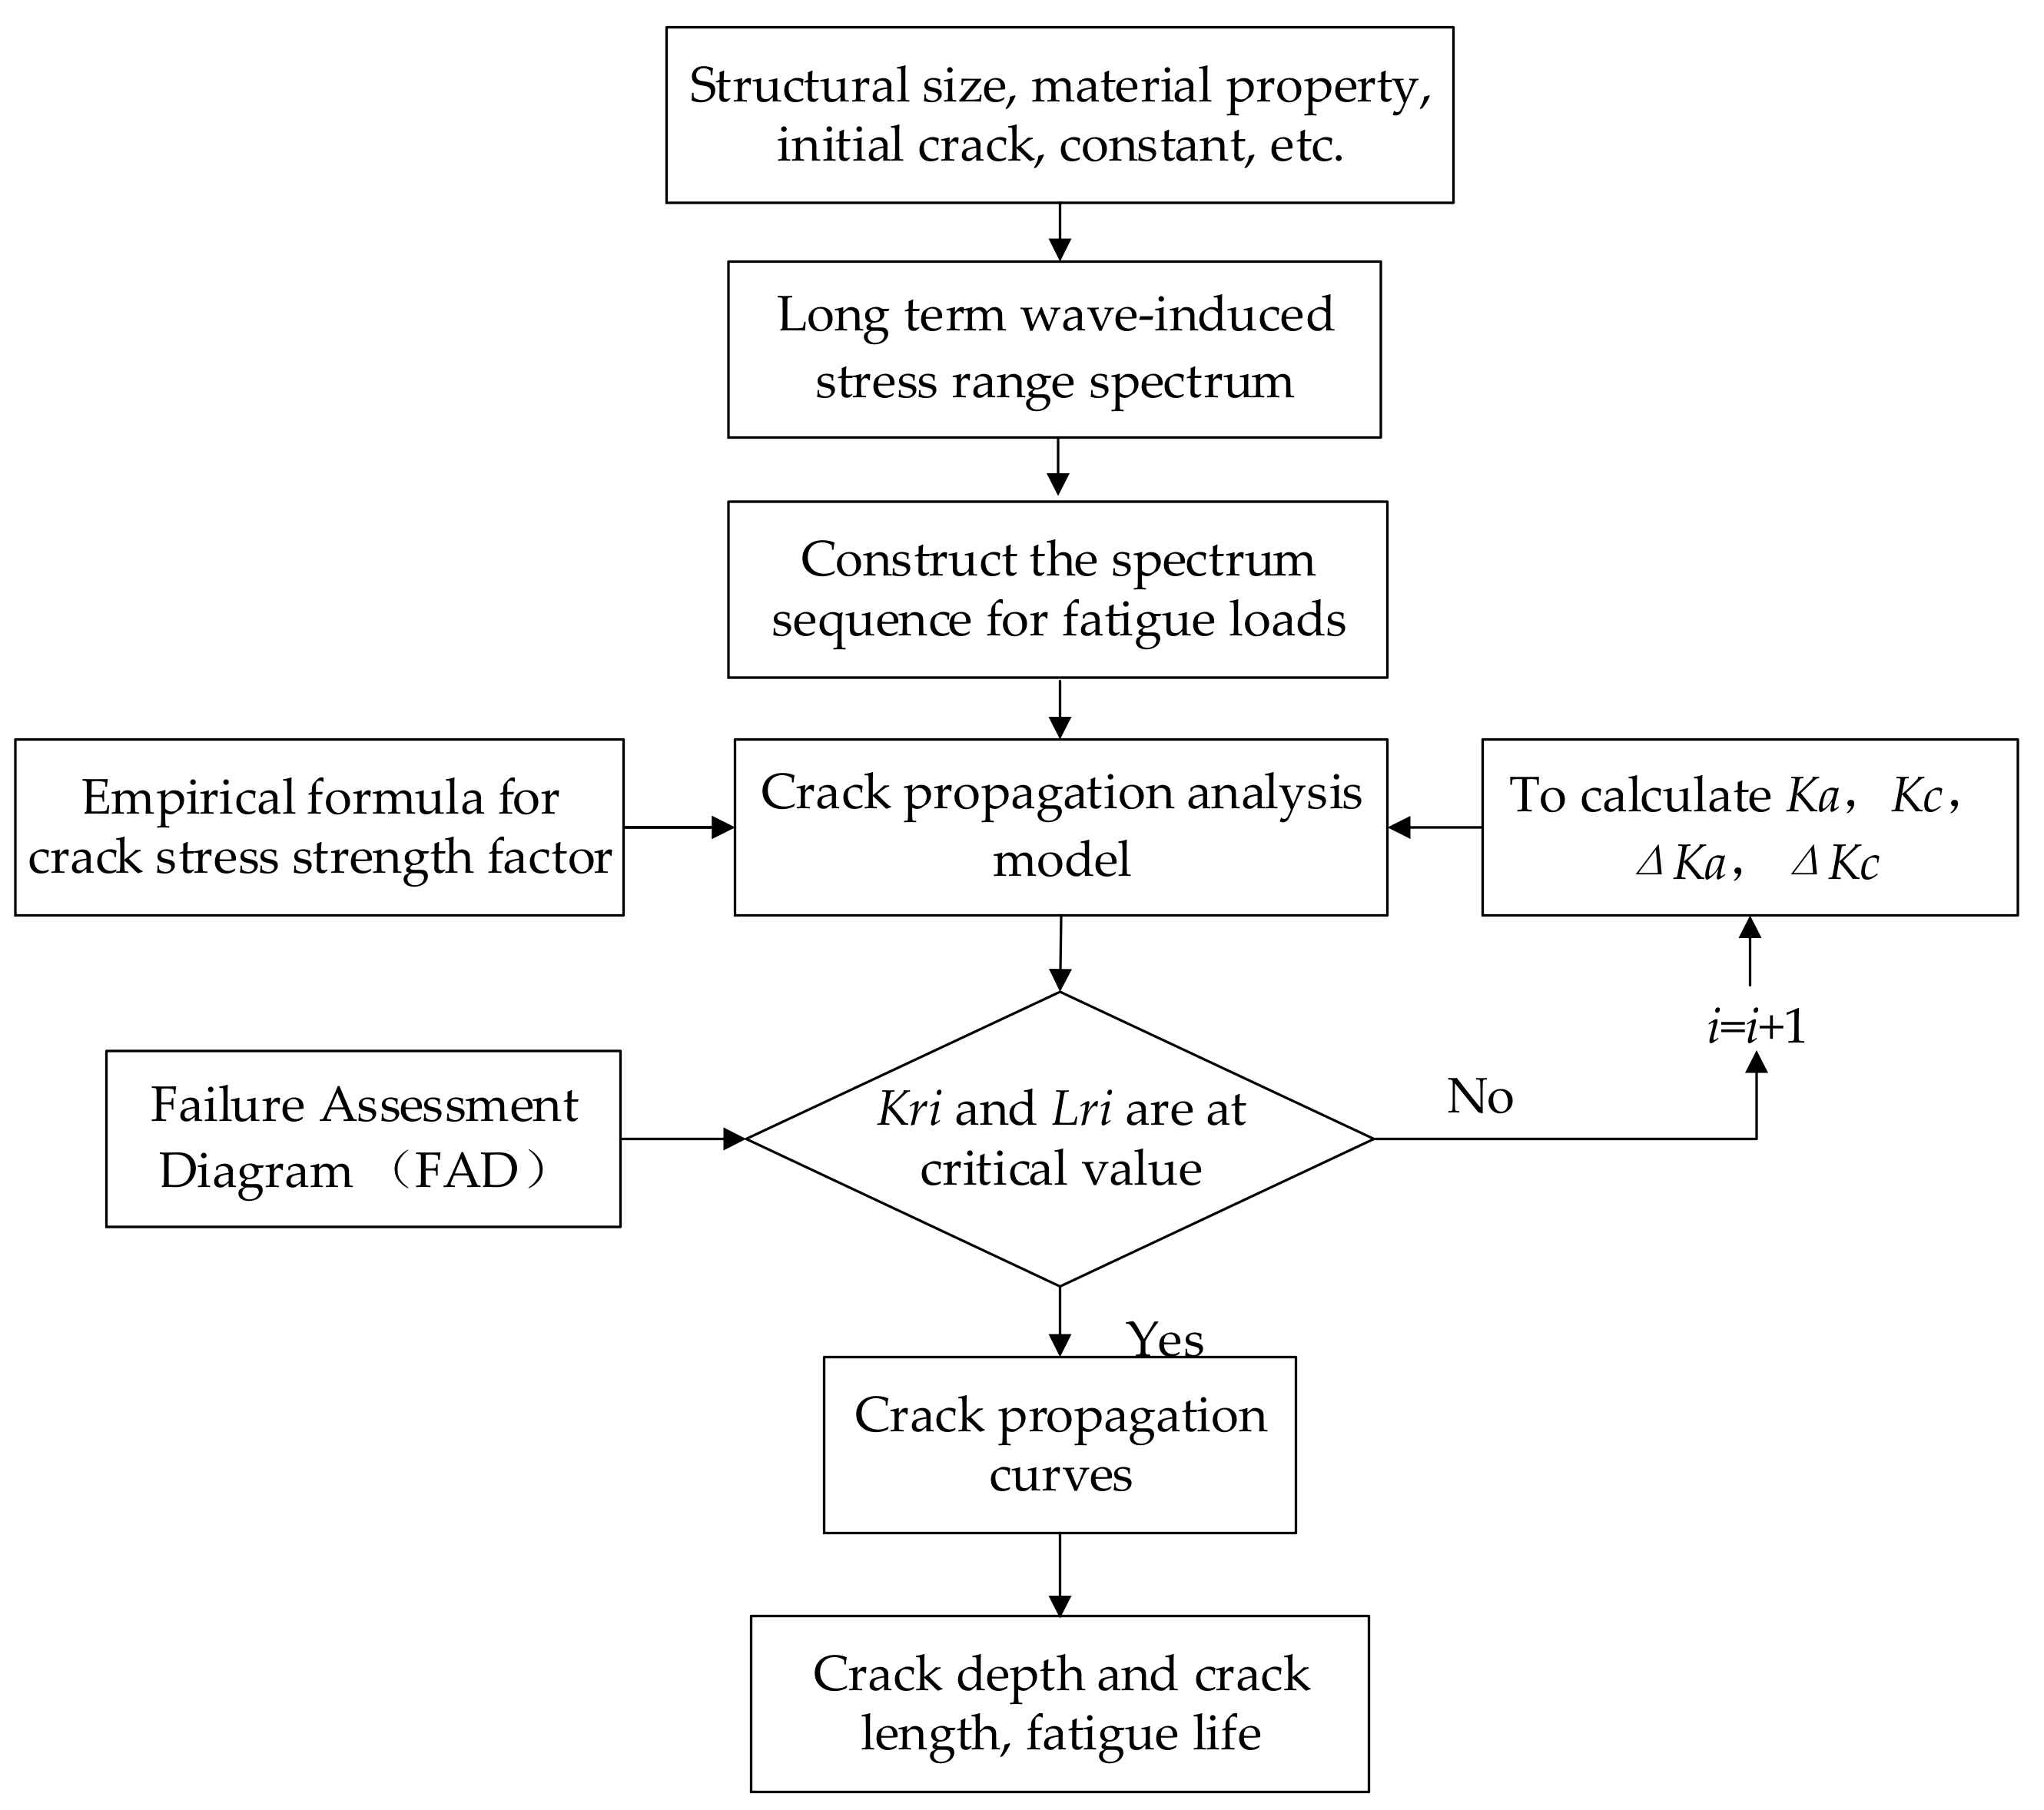
In fatigue crack propagation analysis, the modified Newman–Raju equation is generally used in the calculation of the SIF, based on the initial crack forms, and it is used as the structural fatigue crack propagation law. However, the size and shape of the initial crack defect will have a specific influence on the fatigue crack propagation analysis, so consideration of the effects of the initial defects and construction process and, further, the completion of the calculation of SIF, is the key to accurately simulating the fatigue crack propagation behavior for container ship structures.
- (3)
A comparison between the fracture mechanics theory and S-N curves method
The fatigue analysis specification had been established by most classification societies as a guiding document. The S-N curve method is used in the above specifications, but there are always defects, such as the inability to consider the difference in the initial defects caused by the ship’s construction accuracy. Therefore, it is necessary to compare the differences between the fracture mechanics theory and the S-N curve method for the fatigue life evaluation in the target container ship. In this way, we can provide a reference for the subsequent fatigue analysis and revision of the guidelines.
3. Fatigue Crack Propagation Analysis in Typical Critical Locations
3.1. Ship’s Characteristics and FE Model
In this paper, a large container ship is selected as the research object, the fatigue crack propagation analysis is carried out, and the principal dimensions of the container ship are as follows: the overall length is 366.0 m, the molded breadth is 48.2 m, the molded depth is 30.2 m, the design draft is 13.5 m, the design speed is 23.0 knots, the loading containers are about 13,800 TEU, the double-island design is adopted, and the deckhouse is arranged in the front of the ship.
The finite element model of the global ship is modeled via the commercial software PATRAN 2012 version. In order to accurately simulate the motion response of the target container ship during actual operation, the global hull structure, such as the cargo hold and ship bow, the superstructure at the top cargo hold, etc., are included in the finite element model. All primary longitudinal members, i.e., the upper deck, bottom, inner bottom, side shell, and longitudinal bulkheads, are represented by quadrilateral plate elements, with their secondary stiffeners being modelled by equivalent bar elements. The mesh size on the critical location is small enough to detect the stress concentration, and the element size at the hot-spot area is equal to the plate thickness; to capture the peak stress, the dummy rod element is added on the free edge. The container forces in the cargo hold and hatch corner are defined to simulate the container weight distribution in actual loading conditions.
3.2. Fatigue Calculation and Crack Propagation Analysis Model
Based on practical engineering experience, the typical locations of the target ship structure, where fatigue damage always occurs, are selected for fatigue verification. The calculation of the external wave pressure and inertial force is the basis for ship fatigue analysis. The fatigue analysis process can be seen in the relevant class guidelines [
20]. To explore the fatigue crack propagation method for large container ship, the simulation is conducted via the fatigue load range under full loading conditions. In the simulation, the five typical positions are considered: the top deck connection transition (No.1), the hatch coaming connection (No.2), the side longitudinal connection (No.3 and No.4), and the connection transition between the inner bottom plate and transverse bulkhead in the fuel oil tank (No.5 and No.6). In these locations, a fatigue life assessment for large container ship is presented, and the initial crack defects in the components are considered. The specific fatigue calculation location and finite element model for the target container ship are shown in
Figure 2.
3.3. Long-Term Stress Distribution for Fatigue Analysis
When ships are sailing at sea, the alternating stresses in the hull structure will be induced by the wave load changes. The literature [
21] shows that, if the service life for a ship or offshore platform is from 20 to 25 years, the number of cycles of alternating stresses within the structure due to wave loads is 10
8. Considering the actual navigation route of the target container ship, the long-term distribution of the fatigue stress range is determined by the load spectrum in the North Atlantic sea state, with an exceedance probability of 10
−8.
The statistical data for actual ship measurement show that the long-term distribution of the stress range under the wave load response, Δ
σ can be expressed by a Weibull distribution with two parameters, and the expression formula for the probability distribution and probability density function are shown in Equations (5) and (6).
where
k and
ξ are the two parameters in the Weibull distribution,
k is the scale parameter, and
ξ is the shape parameter, which is related to factors such as the marine environment, ship types, load response characteristics, and location of the components. In practical engineering,
ξ can be calculated via empirical equations or be obtained via fitting the results of the long-term analysis of wave loads or response stresses. The research results [
22] indicate that the value of the shape parameter is generally between 0.7 and 1.3. There is usually a long-term statistical analysis of the fatigue loads of a group of ships using specific sea state data, and then the results are fitted with the Weibull distribution to obtain the value. The scale parameter
k can be expressed as a stress range corresponding to a special exceedance probability obtained via long-term prediction for fatigue loads during the recovery period. Based on the calculation equation of Weibull distribution recommended by IACS, the shape and scale parameters for long-term distribution are shown in Equations (7) and (8), respectively:
where
L is the rule length, and
f is the correction coefficient. The correction coefficient is related to the calculation reference location; the expression is shown as:
where
D is the molded depth,
d is the draft under the calculation condition,
z is the height in the calculation point from the baseline,
is the design stress range based on the probability level of 10
−8 N/mm
2,
is the cycle number corresponding to the stress range
, and
N is the load cycle number during the recovery period based on the 20-year design life; the value of
N is 10
8.
The total load spectrum for the ship design life can be simplified, and it is divided into a stress range histogram. It can be directly used as the basis for the fatigue life calculation; the number of stress range blocks is 30 and, as shown in
Figure 3, the simplification of the stress range spectrum in critical location No.1 is plotted as an example. All cycles should be associated with the stress ranges in the blocks.
The hot spot stress method is adopted to assess the fatigue strength; the requirement for the element size and the determination of the hot spot stress is clearly stated in the guidance [
23]. As the shape of the weld toe is not considered in the finite element model, the extrapolation method is used to obtain the stress of the weld toe. As shown in
Figure 4, the stress values at the positions located
t/2 and 3
t/2 away from the weld toe are used for linear interpolation. The hot spot stress at the weld toe can be extrapolated via the following formula:
where
is the hot spot stress, and
and
are the element stress at the positions located
t/2 and 3
t/2 away from the weld toe.
3.4. Reference Stress Calculation
When performing crack propagation analysis on the components in the critical location, it is necessary to determine the reference stress for structural components with defects. The reference stress in the critical location is the maximum possible value of the sum of all possible stresses causing structural plastic failure, and the value is related to the plastic instability parameter , where , and is the material yield strength.
The calculation formula for the reference stress in the surface cracks is shown as [
19]:
where
and
are the membrane stress and bending stress in the crack surface, respectively.
is the function of
,
and
; if
, then
, and if
, then
.
is the crack depth,
is the half-length of the crack,
is the plate thickness, and
W is the plate width.
The calculation formula for the reference stress in the edge crack [
19] is shown as
where
.
The selection of the reference stress depends on the type of cracks, and the methodology for the reference stress can be seen in BS 7910. In addition, traditional fatigue assessment methods are different in that they consider the compress stress contribution; the compressive stress is not considered as promoting an effect on crack propagation, or even delay crack propagation based on fracture mechanics theory [
24], which means that the influence of compress stress in crack propagation analysis for large container ships will be ignored.
As the fatigue locations from No.1 to No.4 are the free edge, the residual stress is not considered for these locations, but the conservative calculation is carried out in this paper. Meanwhile, for the fatigue locations for No.5 and No.6, the residual stresses are assumed to be parallel to the direction of the welding seam, and the value is taken as 0.3; is the material yield strength.
3.5. Initial Defect and Crack Propagation Path Assumptions
During the construction of large container ships, defects such as a structural undercut, incomplete penetration, cracks, and pores are common in the structures, and these defects can significantly impact crack propagation. Following the principle of defect treatment in fracture mechanics, these defects should be treated as regularly shaped cracks.
Combined with the relevant research methods [
25], the crack propagation shape of large container ships is simplified as follows: the maximum length of the defect along the free surface is
S, and the maximum depth along the plate thickness direction is
D. Differences in crack propagation forms and directions can result in a large variation in crack propagation analysis and predictions of fatigue life. In engineering, particular attention is given to the failure impact of crack propagation direction on the structural strength and destruction of the component. In the research process, it is assumed that the propagation path of the surface cracks in the fillet and butt welds is perpendicular to the plate thickness direction, and the propagation path of the edge cracks is perpendicular to the arc tangent of the free edge. The crack propagation paths in the above typical critical fatigue locations (No.1~No.6) are shown in
Figure 5.
3.6. Fatigue Crack Propagation Analysis Results
The fatigue loads on the target ship are determined via global finite element structural analysis, and the calculation process can be seen in
Section 2.2. Crack propagation analysis is conducted at typical critical locations for the target ship, based on the maximum stress amplitude range under the fatigue calculation conditions. Following relevant international guidelines, it is recommended that the initial crack and construction defect should be uniformly defined as
, and
.
Table 1 summarizes the results of the crack propagation analysis and fatigue life calculation at typical critical locations (No.1–No.6) for the target ship.
As listed in
Table 1, the fatigue life of most positions can meet the fatigue life requirement of 20 years; however, a significant stress concentration is observed at the connection area between the inner bottom and the transverse bulkhead in the fuel tank (No.5 and No.6), and the fatigue life is lower than 20 years. The high stress can be decreased via setting a circular elbow plate or increasing the local plate thickness, and the fatigue life in the above local structures is improved.
3.7. Comparison between the Fracture Mechanics and the S-N Curve Method
According to CCS guidance [
23], the fatigue assessment is calculated using the appropriate S-N curve under the assumption of linear cumulative damage, based on the Palmgren–Miner rule. In general, this method is adopted by most classification societies. In the future, the fracture mechanics method is expected to find extensive application in structural analysis and design. This is due to its capability of considering the influence of different initial defects, such as initial cracks and shape parameters, in actual ship structures.
In order to compare the differences between the above two methods, the structural fatigue life at the typical critical location of a large container ship in
Table 1 is further predicted, based on the S-N curve method. The S-N curves method used is derived from experimental data, obtained from tests performed with parent material and configurations of welded joints, and related to the associated consumable, welding method, welding position, etc. The S-N curve data from the CCS class are shown in
Figure 6.
The selection of the equivalent design wave in the S-N curve method is same as the fatigue analysis definition provided in
Section 2.2. The comparison results of fatigue life obtained via fracture mechanics theory and the S-N curve method at specific typical locations are shown in
Table 2.
The fatigue life results obtained via the two different methods are listed in
Table 2, and it can be seen that the fatigue life of the components in the typical critical location based on fracture mechanics theory and the S-N curve are in the same order of magnitude. It is also found that the fatigue life results obtained via the fracture mechanics method are obviously shorter for the welded structures, such as the butt weld and fillet weld. Observing No.5 and No.6 critical locations, it is obvious that the difference between the predicted values of fatigue life obtained via fracture mechanics and the S-N curve method is large. Meanwhile, for the free edge structure (No.1–No.4), the fracture mechanics method can provide a similar fatigue life to the S-N curve, with the difference within a 25% range.
As crack initiation and propagation are both considered, the S-N curve method is suitable for evaluating the total fatigue life of welded structures. However, the fracture mechanics method is used to evaluate the remaining life in actual ships, when defects have occurred at the base metal and weld in an operating vessel. In view of the extensive application of the S-N curve method and its dominance, the fracture mechanics method is used as an auxiliary and supporting means for fatigue strength analysis. But the fatigue life assessment method based on fracture mechanics is very important, especially for the application of real ship engineering, such as for the assessment of the remaining life in some aging ships, and it should be able to predict and evaluate the safety and remaining life of cracks at any stage in the service life of a container ship, so as to determine its scientific inspection and maintenance cycle.
4. Influence of Initial Crack Defects on Fatigue Life
As previously mentioned, the shape and size of the initial defects are required in the fracture mechanics method. If an obvious initial crack is in the component, it aggravates the local stress concentration. As a result, the crack propagation rate accelerates, resulting in a rapid transition into the high-speed propagation stage [
27]. In this section, the influence of initial defects in the surface cracks on crack propagation and fatigue life is revealed. Considering the connection area between the inner bottom and the transverse bulkhead in No.6 fatigue location, its fatigue life is the shortest. So, the No.6 fatigue position is selected for investigation.
4.1. Effect of the Initial Crack Size on the Fatigue Life
The initial crack size has a significant influence on the fatigue life [
28]. Generally, the specifications recommend that the initial crack depth
is between 0.25 mm and 1.25 mm. Luo [
29] compared the effects of four initial crack depths of 0.5 mm, 1.0 mm, 1.5 mm, and 2.0 mm on structural fatigue life assessment in container ship, respectively, for butt and fillet welding. Yu [
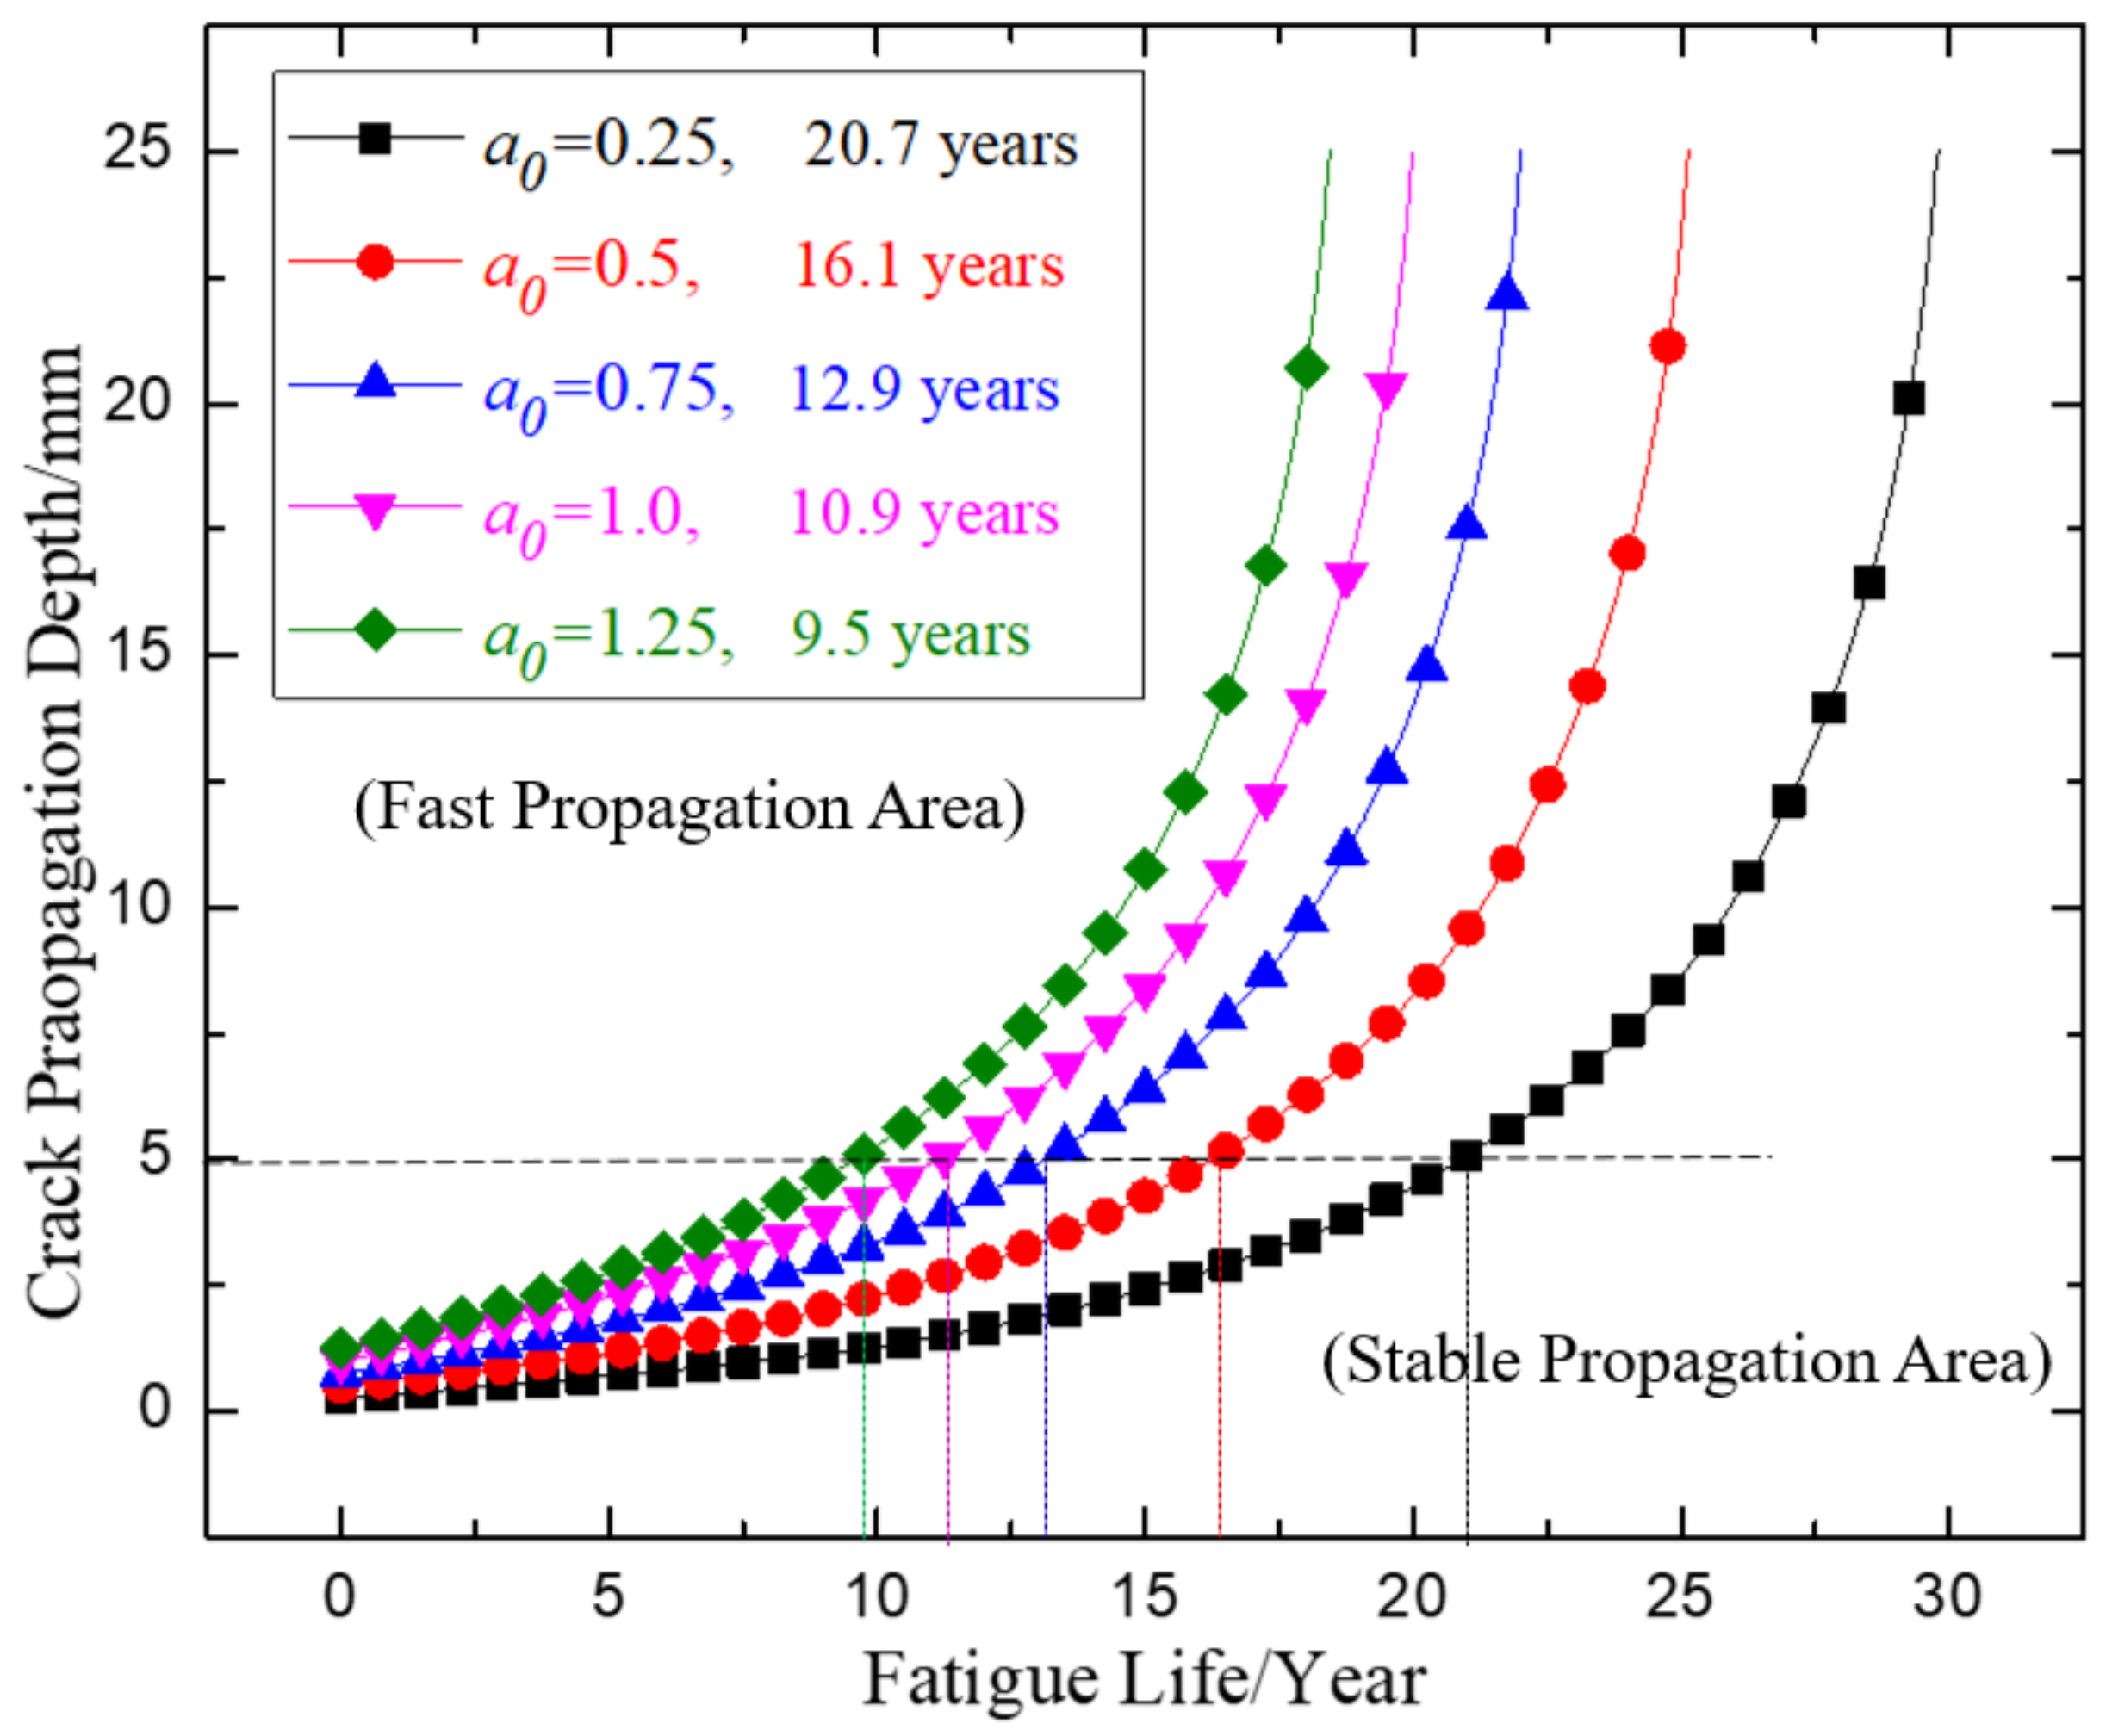
30] gives recommended values for initial cracks for crack propagation analysis in container ships. In this paper, the effect of different initial crack sizes on the fatigue life is studied. The initial crack shape ratio is defined as 0.2, and five different initial crack depths are chosen: 0.25 mm, 0.5 mm, 0.75 mm, 1.0 mm, and 1.25 mm. The crack propagation curve and fatigue life calculation obtained with the different initial crack depths are shown in
Figure 7.
According to the crack propagation calculation results in
Figure 7, the slope of the crack propagation depth–fatigue life curve in the critical location represents the crack propagation rate. It is obvious that the crack propagation rate increases with the fatigue life (the number of load cycles). The crack propagation rate at the initial stage of crack propagation is low, but it accounts for a significant portion of the entire fatigue life.
From
Figure 7, it is shown that the initial depth of the cracks in a component has a great influence on the structural fatigue life. As the initial crack depth increases, the crack propagation rate becomes faster, and the fatigue life is shorter. When the initial crack depth is doubled, the fatigue life decreases by approximately 20%. But the final crack depths are very closely based on the different initial crack depths when the structure component finally fails.
According to the calculation results, the initial crack depth in the target fatigue calculation location No.6 is reduced to 0.25 mm, and the structural fatigue life is 21 years, which is already longer than the 20-year design life; therefore, the existing structural design in fatigue location No.6 can meet the fatigue life requirements. If the initial cracks in the fatigue location can be guaranteed to be less than 0.25 mm via strict detection methods in the ship construction process, the above methods will effectively solve the fatigue problem and avoid the implementation of additional complex reinforcement schemes.
In crack propagation analysis for large container ships, the influence of the initial crack depth on the structure fatigue life must be considered properly. It is very important to control the depth of small cracks at the welding toes and the edges of components, and to reduce the risk of structural fatigue failure in large container ships.
4.2. Effect of the Initial Crack Shape Ratio on the Fatigue Life
As previously discussed, the welding defects can be simplified as surface cracks, but these defects are inherently disorganized, resulting in various types of crack shapes following simplification. In this analysis, the initial depth in the surface crack in fatigue location No.6 is taken as 1.0 mm, and the crack shape ratio (
a/
c, that is, crack depth/crack half-length) is defined as 0.1, 0.15, 0.2, 0.25, and 0.3.
Figure 8 shows the crack propagation curve and fatigue life calculation results obtained for different initial crack shape ratios.
According to the crack propagation analysis results in
Figure 8, it can be seen that the propagation trends of the fatigue crack propagation curve based on different initial crack shape ratios have a parabolic form. As the initial crack shape ratio (
a/
c) increases, the structure fatigue life in the target calculation location increases accordingly; this is because as the shape ratio (
a/
c) increases, the crack shape coefficient will decrease, and the stress intensity factor amplitude decreases with the reduction in the crack shape coefficient under the same load distribution, and the fatigue life of the component is further improved.
However, it is also found that the effect of the initial crack shape ratios on the structural fatigue life is not particularly significant. Taking the initial crack shape ratios 0.1 and 0.3 as an example, the initial crack length of the above two initial crack shape ratios is 10.0 mm and 3.3 mm, respectively, and they are three times different nearly, but the final fatigue life prediction values in fatigue location No.6 are 9.8 mm and 11.8 mm, respectively; there is not much difference. It can be concluded that the shape ratio parameter will have a certain impact on the structural fatigue life, but its impact on the structural fatigue life is limited compared with the crack depth parameter.
5. Conclusions
Based on the fatigue fracture mechanics theory, this paper proposes a set of crack propagation analysis methods for large container ships; these can quickly perform the prediction of the crack fatigue life of ship components. The method is simple, its applicability is strong, and it can take into account the influence of different initial defects, such as initial cracks. The shape parameters of the actual ship can be widely used in structure analysis and ship design. Referring to the comparative results of the crack propagation analysis, the following conclusions can be obtained.
(1) Affected by the hull girder bending moments and torques, there is a certain stress concentration in typical locations for the target large container ship; in particular, due to the local deformation influence caused by the discontinuity between the inner floor and the transverse bulkhead structure of the fuel oil tank, a high combined stress level is generated, so the fatigue life assessment in the above typical joints needs to be considered in the actual structural design.
(2) In the design and building of ships, the aim of preventing crack propagation and improving the fatigue life of components can be achieved through reducing or inhibiting the generation of cracks in the early stages. Non-destructive testing is also recommended, because the accurate detection of defect dimensions is key to accurately predicting the remaining fatigue life. This research suggests that, combined with the non-destructive testing accuracy and welding process quality in the shipyard, the initial crack size of the surface crack located in the weld zone and the base metal transition zone can be assumed to be 0.25 mm in the absence of other reliable data.
(3) In the research work of this paper, the simplified calculation method was adopted in the calculation of the stress intensity factor and reference stress. This method is suitable for fatigue calculation in surface cracks in the butt and fillet welding, or in structural free edges of large container ships, and has considerable calculation accuracy. However, the applicability of this simplified method for structural fatigue analysis with initial defects, such as buried cracks, needs to be further verified. In addition, shipyard construction precision factors, such as misalignment and angular distortion, have great influence on the fatigue life of the structure, which needs to be further studied in follow-up work.


