Article

Song Notes and Patterns of the Mediterranean Fin Whale (Balaenoptera physalus) in the Ionian Sea

by
Virginia Sciacca
1,*,
Giuseppe Morello
2,
Laura Beranzoli
3,
Davide Embriaco
3,
Francesco Filiciotto
1,
Giuditta Marinaro
3,
Giorgio Maria Riccobene
4,
Francesco Simeone
3 and
Salvatore Viola
4
1
Istituto di Scienze Polari-Consiglio Nazionale delle Ricerche (CNR-ISP), 98122 Messina, Italy
2
Università degli Studi di Palermo, Dip. Scienze della Terra e del Mare (DISTEM), 90123 Palermo, Italy
3
Istituto Nazionale di Geofisica e Vulcanologia (INGV), Sede di Roma, 00143 Roma, Italy
4
Istituto Nazionale di Fisica Nucleare-Laboratori Nazionali del Sud (INFN-LNS), 95123 Catania, Italy
*
Author to whom correspondence should be addressed.
J. Mar. Sci. Eng. 2023, 11(11), 2057; https://doi.org/10.3390/jmse11112057
Submission received: 25 September 2023 / Revised: 23 October 2023 / Accepted: 25 October 2023 / Published: 28 October 2023
(This article belongs to the Section Marine Biology)

Abstract

:
The Mediterranean fin whale emits two types of 20-Hz calls, known as “classic” and “backbeat”, that can be produced in irregular series or in patterned sequences called songs. The analysis of songs is recognized as a meaningful approach to study baleen whales and can be used to investigate populations’ identities. Mediterranean fin whale songs have been studied previously, but only in the western Mediterranean Sea. This work describes the structure of the songs recorded in the Ionian Sea. The inter-note intervals and the alternation of 20-Hz note types were considered to assess the occurrence of recurring patterns. Differences between patterned songs and irregular sequences were also investigated. Acoustic data were sampled continuously for about 10 months by the cabled observatory NEMO-SN1, deployed at 2100 m depth, 25 km offshore Catania; 28 call sequences were isolated and 10 of these were classified as either patterned songs or irregular sequences. Significant differences were observed in the spectral features of classic notes between songs and irregulars; four-note patterns were found repeatedly over different months, indicating a regular structure in detected songs. This work establishes a reference to interpret Mediterranean fin whale songs, and to assess the acoustic behavior of the population.

1. Introduction

The fin whale (Balaenoptera physalus) is protected worldwide under several national and international agreements. The species is globally considered “vulnerable” by the International Union for Conservation of Nature (IUCN) Red List of Threatened Species [1]. However, some populations are more pressured than others, and the Mediterranean sub-population of fin whales is today listed as “endangered” by the IUCN [2]. To enable fin whale conservation, it is crucial to monitor their distribution, to identify threats and to provide policymakers with effective mitigation tools. Acoustics represents an essential, non-invasive tool to study the movements and the ecology of this species. Several studies in recent years demonstrated the importance of long-term Passive Acoustic Monitoring (PAM) in the assessment of the population distribution and conservation status in the Mediterranean Sea [3,4,5,6]. Fin whales’ acoustic repertoire is mainly composed of vocalizations, i.e., “calls”, which have fundamental frequencies in the range between 15 and 142 Hz [7]. Calls are used for intraspecies communication [8,9]. The only known Mediterranean fin whale calls are centered around the frequency of 20 Hz and are often defined as “20 Hz calls” [3,4,5,6,10]. These calls can be differentiated in two main types: “classic pulse” or “type A”, a downswept signal from a maximum frequency of about 23–25 Hz to a minimum frequency around 17 Hz, lasting approximately 1 s, and “backbeat” or “type B”, featuring a constant frequency of 18–20 Hz, lasting about 0.8–1 s [3,4,10]. The 20 Hz calls can be emitted in short, irregular series or in long, stereotyped sequences, i.e., “songs” [8]. The calls repeated in long sequences will be hereafter mentioned as “notes” for functional differentiation between a generic isolated call and calls repeated in songs [3,11]. Different types of notes and songs are known to be emitted by fin whales across all oceans [3,6,8,9,12,13,14,15]. The main differences between them seem to reside in the frequency features and in the intervals between consecutive notes, defined as inter-note-intervals (INIs). These variations are higher between different populations and geographic locations [3,16,17]. There is also some evidence that songs change over time within the same population [10,11,18,19,20]. In the Mediterranean Sea, there is no evidence of seasonality in INI duration or in song production [3,6,10]. Concerning the definition of the term “song”, in behavioral research it is generally used to describe repeating sets of sounds, structured in patterned units of varying complexity, and often nested into a hierarchical structure [21]. In fin whales, songs are thought to be used by male individuals for courtship purposes [22]. Fin whales are also known to use irregular repetition calls with various frequency features to keep contact and convey information at distance [9,23,24,25,26]. Long stereotyped 20 Hz note sequences are most certainly associated with male communication and courtship display [22]. However, knowledge of what differentiates a general calling sequence (i.e., irregularly spaced, or isolated 20 Hz calls) [27] from a song intended as a male courtship display is still limited [10,17,23,26]. The definition of these call sequences has often been limited by the lack of direct behavioral observations which makes it impossible to establish whether these sounds have reproductive implications [8]. The alternation of different INI types has been commonly used as a distinctive trait of songs. Watkins et al. [8] described fin whale songs as long 20 Hz patterned call series with a single repeated INI value, defined as a “singlet”, or sometimes as “doublets” of two alternating INIs. Thompson et al. [28] also defined the patterned 20 Hz pulse series as pairs or doublets, alternating short and long INI durations. “Triplet” patterns were also described, having at least two distinct alternating INIs, with one of them repeated two or more times [29]. The definition of singlet, doublet and triplet patterns can be useful in grouping songs as a function of their INIs and in understanding the seasonal fluctuations and inter-annual variations in different areas and populations [29]. Yet, these studies considered only the alternation of INIs of different duration for the definition of songs’ typical patterns. Recently, it has been shown that there is a strong relationship between note type and INI [30]. Best et al. [6] suggested that Mediterranean fin whale songs may exhibit more diversity in the alternation of note types than simple singlets or doublets. The traditional definition of singlet, doublet and triplet song patterns is not exhaustive enough to describe different populations’ repertoires completely. Knowledge of note type alternation, together with INI variations is essential when songs are used to isolate different populations or to monitor long-term changes in acoustic behavior. The classification of these “patterns” can be used to describe the songs of a population and the differences between songs and other call sequences [26]. In this work, the structure and patterns of fin whale songs recorded in the Ionian Sea (central Mediterranean Sea) were studied over different seasons during ten months of continuous recording. To improve knowledge of Mediterranean fin whales’ song repertoire, we assessed the occurrence of recurring patterns by considering INIs, spectral features and note type alternation. Rather than proposing the definition of a unique song type for this population, we aimed to define the units that compose recorded songs and to establish a baseline knowledge of song patterns. The time–frequency differences between patterned songs and irregular call sequences were also investigated for the first time in the Mediterranean Sea.

2. Materials and Methods

2.1. Data Acquisition

Data were continuously sampled at 2 kHz by a seismic hydrophone installed aboard the cabled NEMO-SN1 (Neutrino Mediterranean Observatory-Submarine Network 1) observatory [31], deployed on the seafloor at a depth of 2100 m, 25 km east from the harbor of Catania. The multidisciplinary observatory was operated within the activities of the Western Ionian Sea site which is now a regional facility of EMSO (European Multidisciplinary Seafloor and water column Observatory) Research Infrastructures [32,33]. Initial information on the acoustic occurrence of fin whales offshore in eastern Sicily was provided by the analysis of the same dataset as [4]. Fin whale calls were detected offshore in eastern Sicily in 7 out of 11 months of continuous passive acoustic monitoring, with a 3-month gap from November to January. Fin whale call detection was estimated in a range of about 20 km from the location of the sensor, considering the typical depth of emission known for the species, the median received noise levels, the typical oceanographic characteristics of the water column in the area and the position of hydrophone [4]. The data used in this work consist of a subset of about 40 h of acoustic recordings containing fin whale calls, extracted from the original dataset of continuous recordings [33]. The subset consisted of 241 files of 10 min duration.

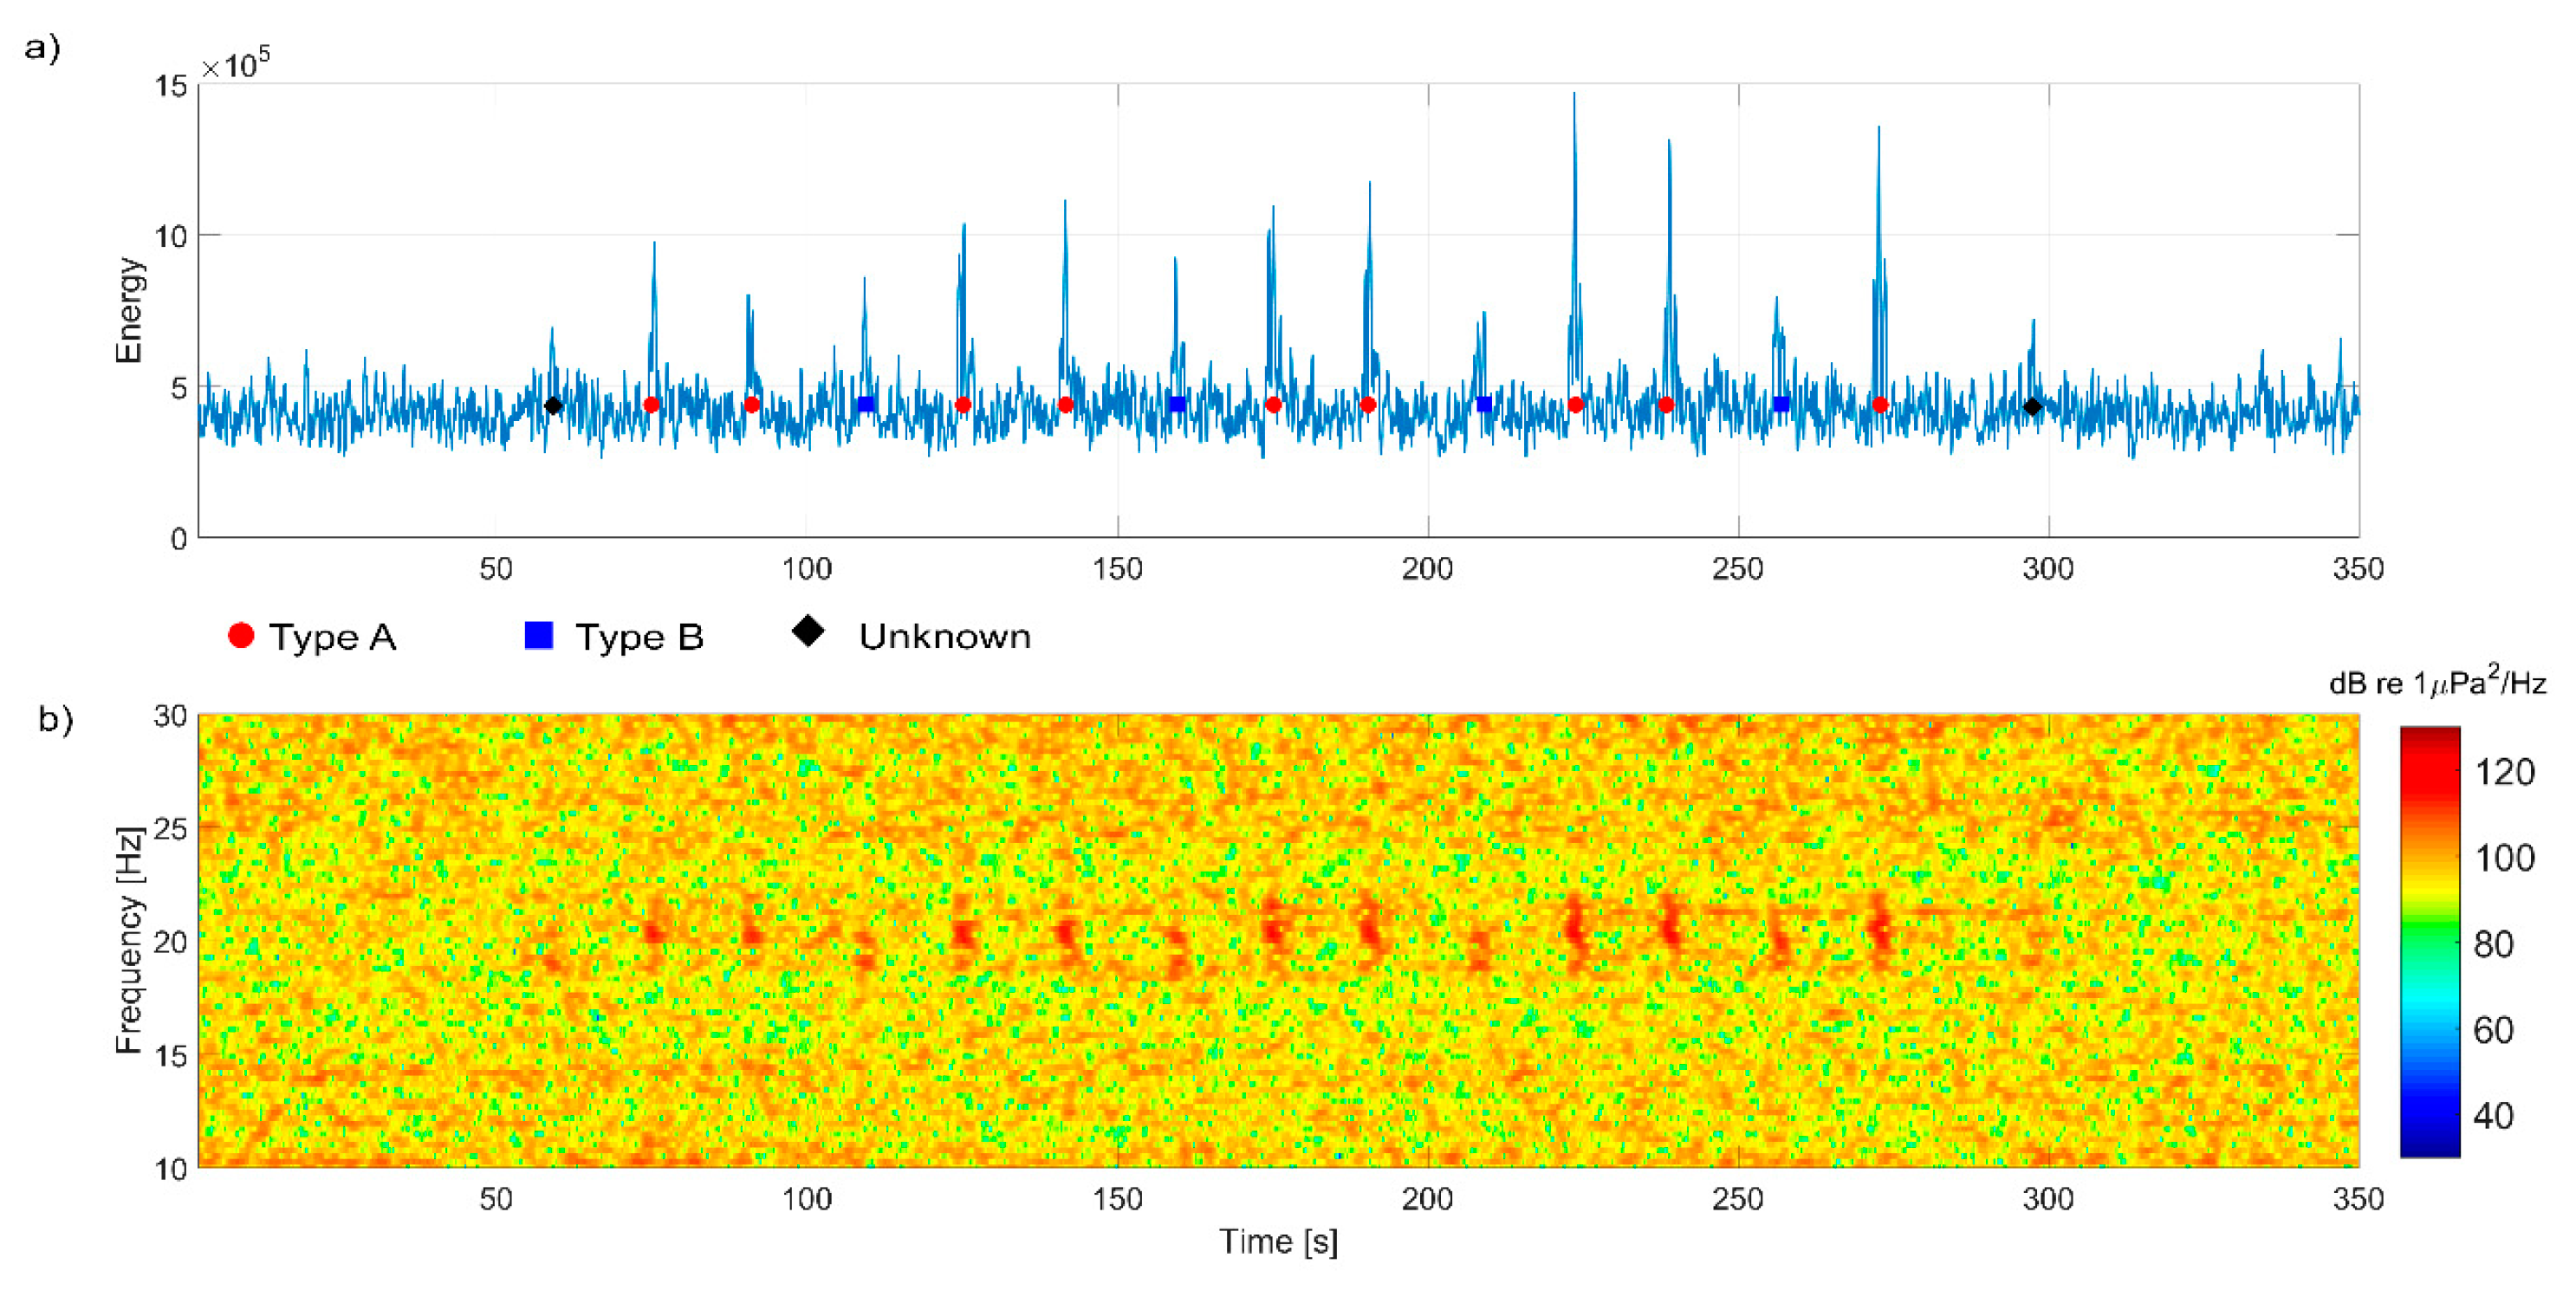
2.2. Detection of Notes and Songs

The spectrograms of the recordings containing fin whale calls were analyzed with the aim of discerning separate songs. The spectrograms were produced in MATLAB© (8192 fast Fourier transform (FFT) points, 4096 Hanning window, 98% overlap), using a viewing window of 5 min. A song was defined as a sequence of stereotyped 20 Hz notes with regular intervals [8]. The 20 Hz notes were classified discerning type A (classic pulse), and type B (backbeat) [4,10]. Fin whale 20 Hz notes were then extracted using the automatic call detector SAW (Spectrogram-based Approach to the automatic detection of fin Whale 20 Hz calls). The algorithm was specifically set to find isolated acoustic energy peaks in the frequencies and the typical duration of Mediterranean fin whale 20 Hz pulses by looking at the data spectrograms with a time resolution of 0.04 s and a frequency resolution of 0.24 Hz. A detailed description of SAW detection function and related performance evaluation can be found in [5]. For each sequence, the output returned by SAW was a MATLAB© structure containing information related to the detections in the 10 min files: file name; date (year, month, day, hour, minutes); number of calls detected; detection time: the time corresponding to the energy peak of the detected calls, measured in samples and relative to the start time of the file; and absolute time: a reference of the detection time produced with the MATLAB© datenum function. This generates a serial number referring to a date according to the proleptic ISO calendar (January 0, 0000). Note: a portion of the signal extrapolated in a contour of five seconds around the detected energy peak (2 s before the peak and 3 s after), including the entire note detected.

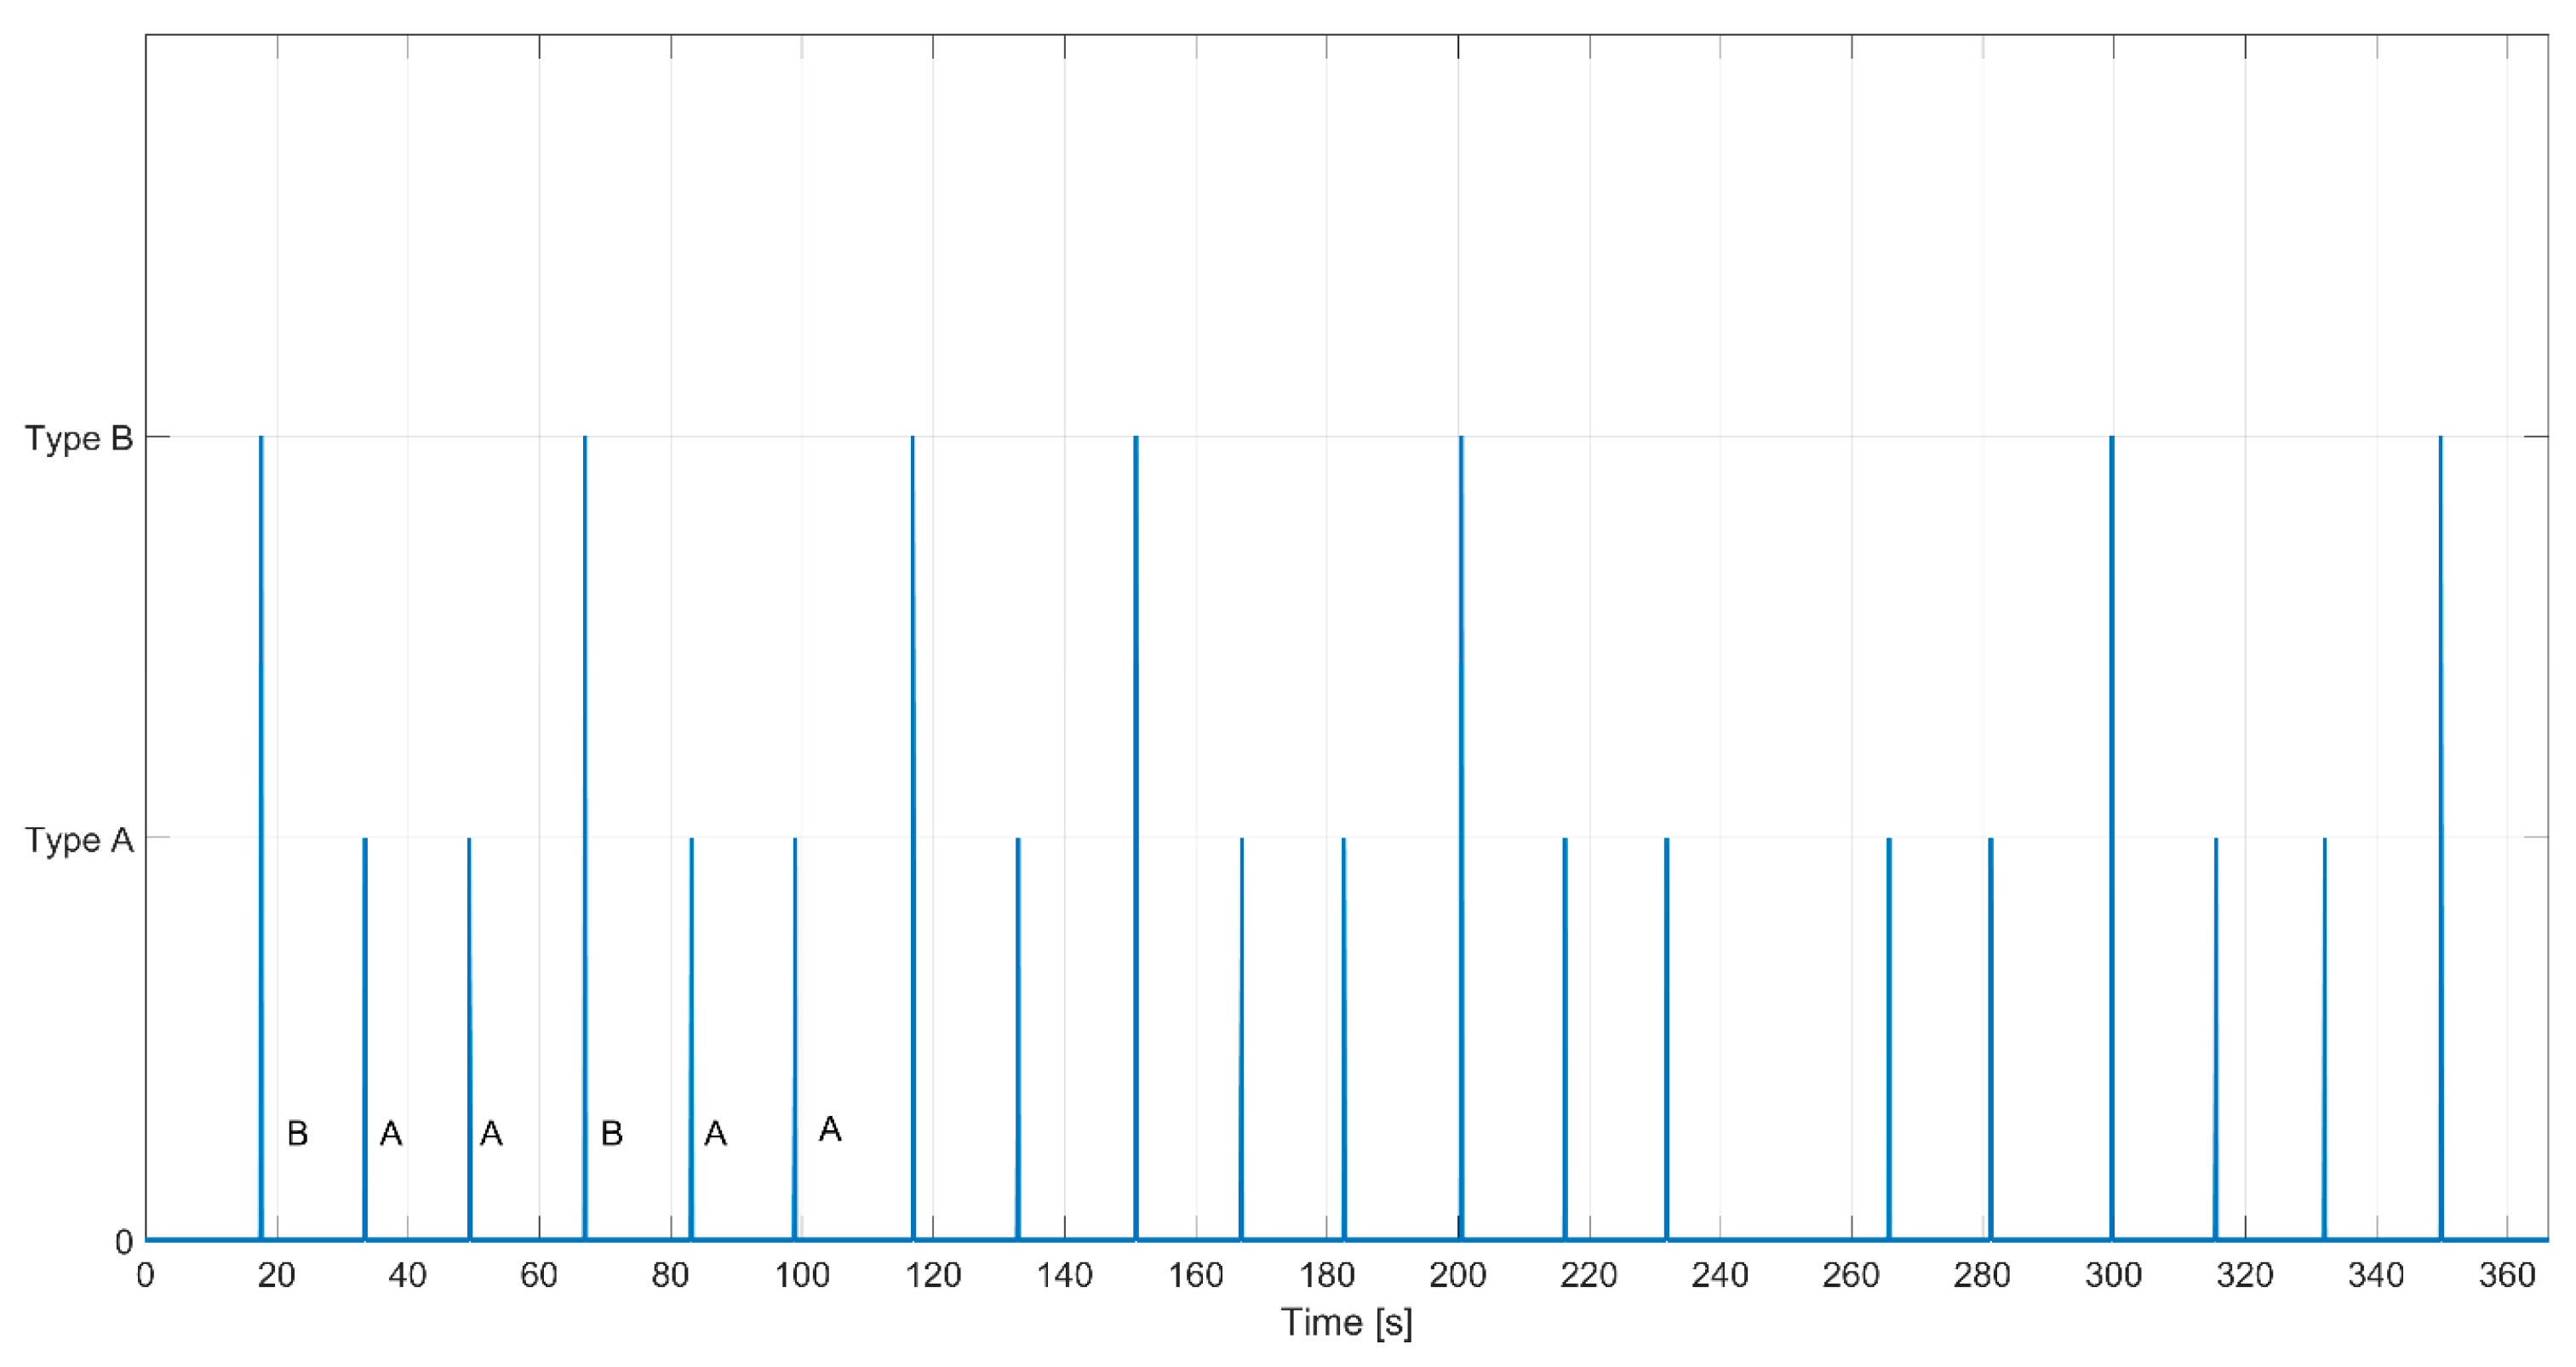
2.3. Classification of the 20-Hz Notes

To classify and mark A and B note types, the upper root-mean-square (RMS) envelope of the signal energy was studied by performing a Hilbert transform with a sliding window of 500 samples. The energy envelope was marked with time peaks corresponding to the maximum energy peaks of the notes detected by SAW. The spectrogram of the same signal was also shown as a subplot. To ascertain note type, an expert operator looked at all detected peaks and related spectrograms and classified each note as A or B type, adding this information to the MATLAB© structure produced by SAW (Figure 1). Following Castellote et al. [3], notes were classified by type only when they had clear time–frequency contours on the spectrogram and a good signal-to noise ratio (SNR), indicating either whales closer to the receiver or lower background noise levels within the signals’ frequency band. Notes with ambiguous time–frequency contours or poor SNR were classified as “unknowns”, but were still counted for further reference (Figure 1a). The detection rate was subsequently studied for each call type as number of notes detected per minute within each song. A two-sample Kolmogorov–Smirnov test was used to test whether there were any significant differences in the detection rates per minute of the two note types (null hypothesis: type A and type B detection rate/min are from the same continuous distribution for p > 0.05).

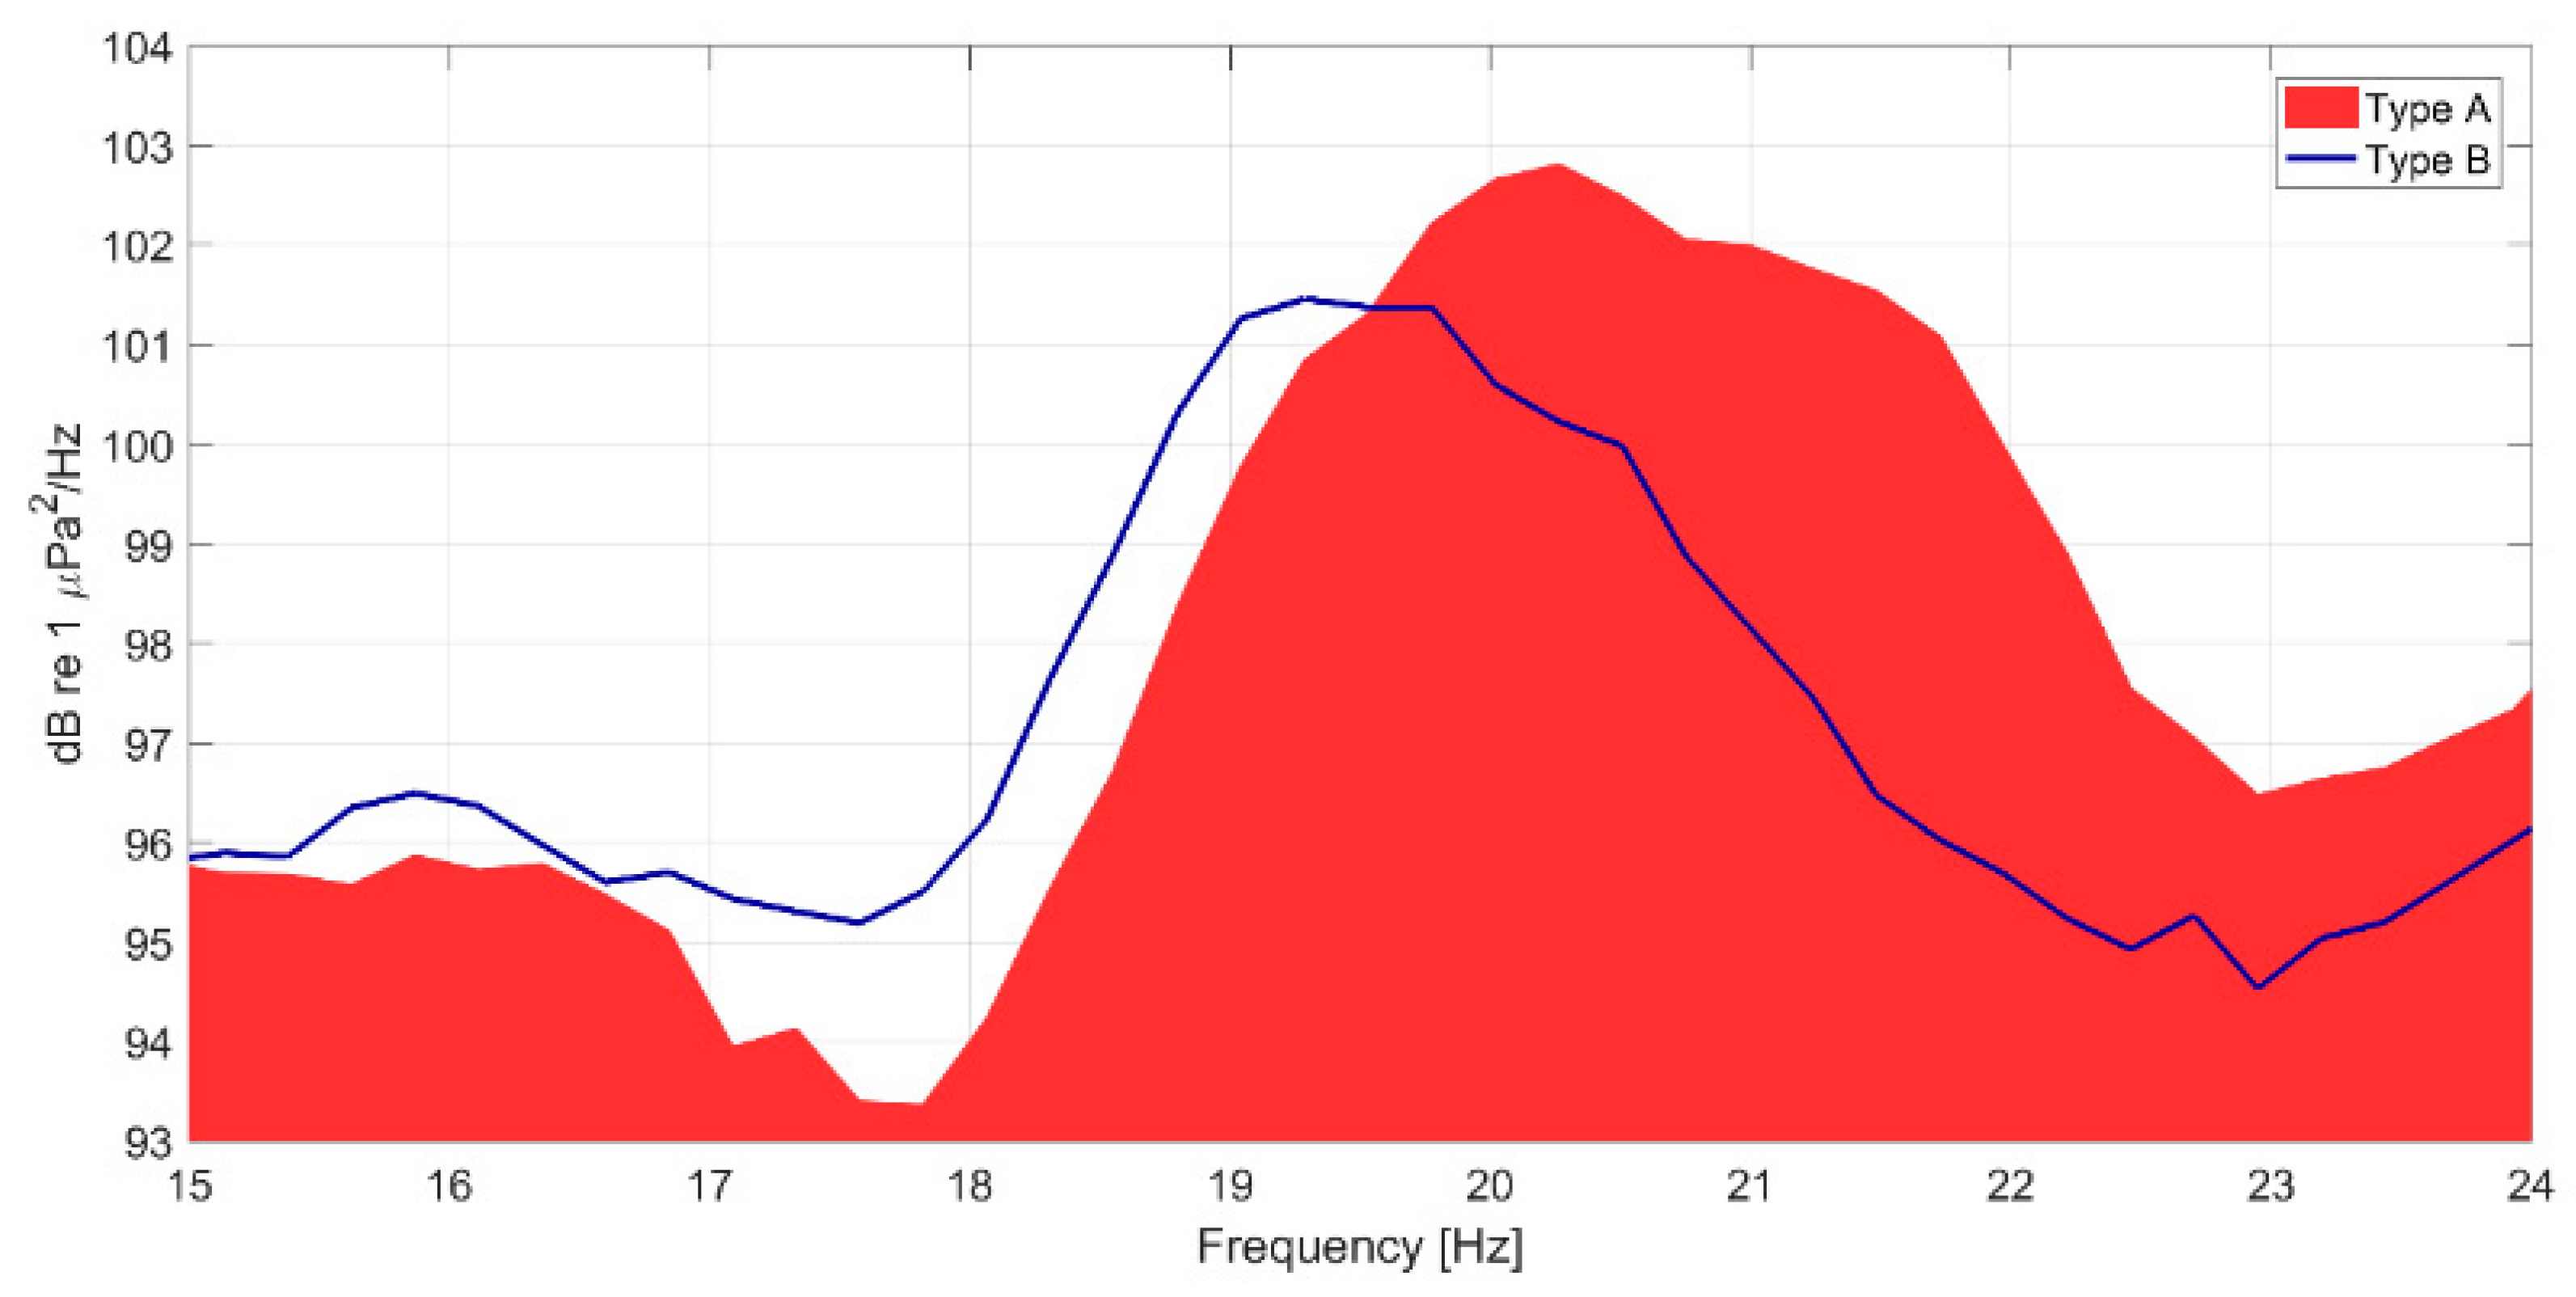
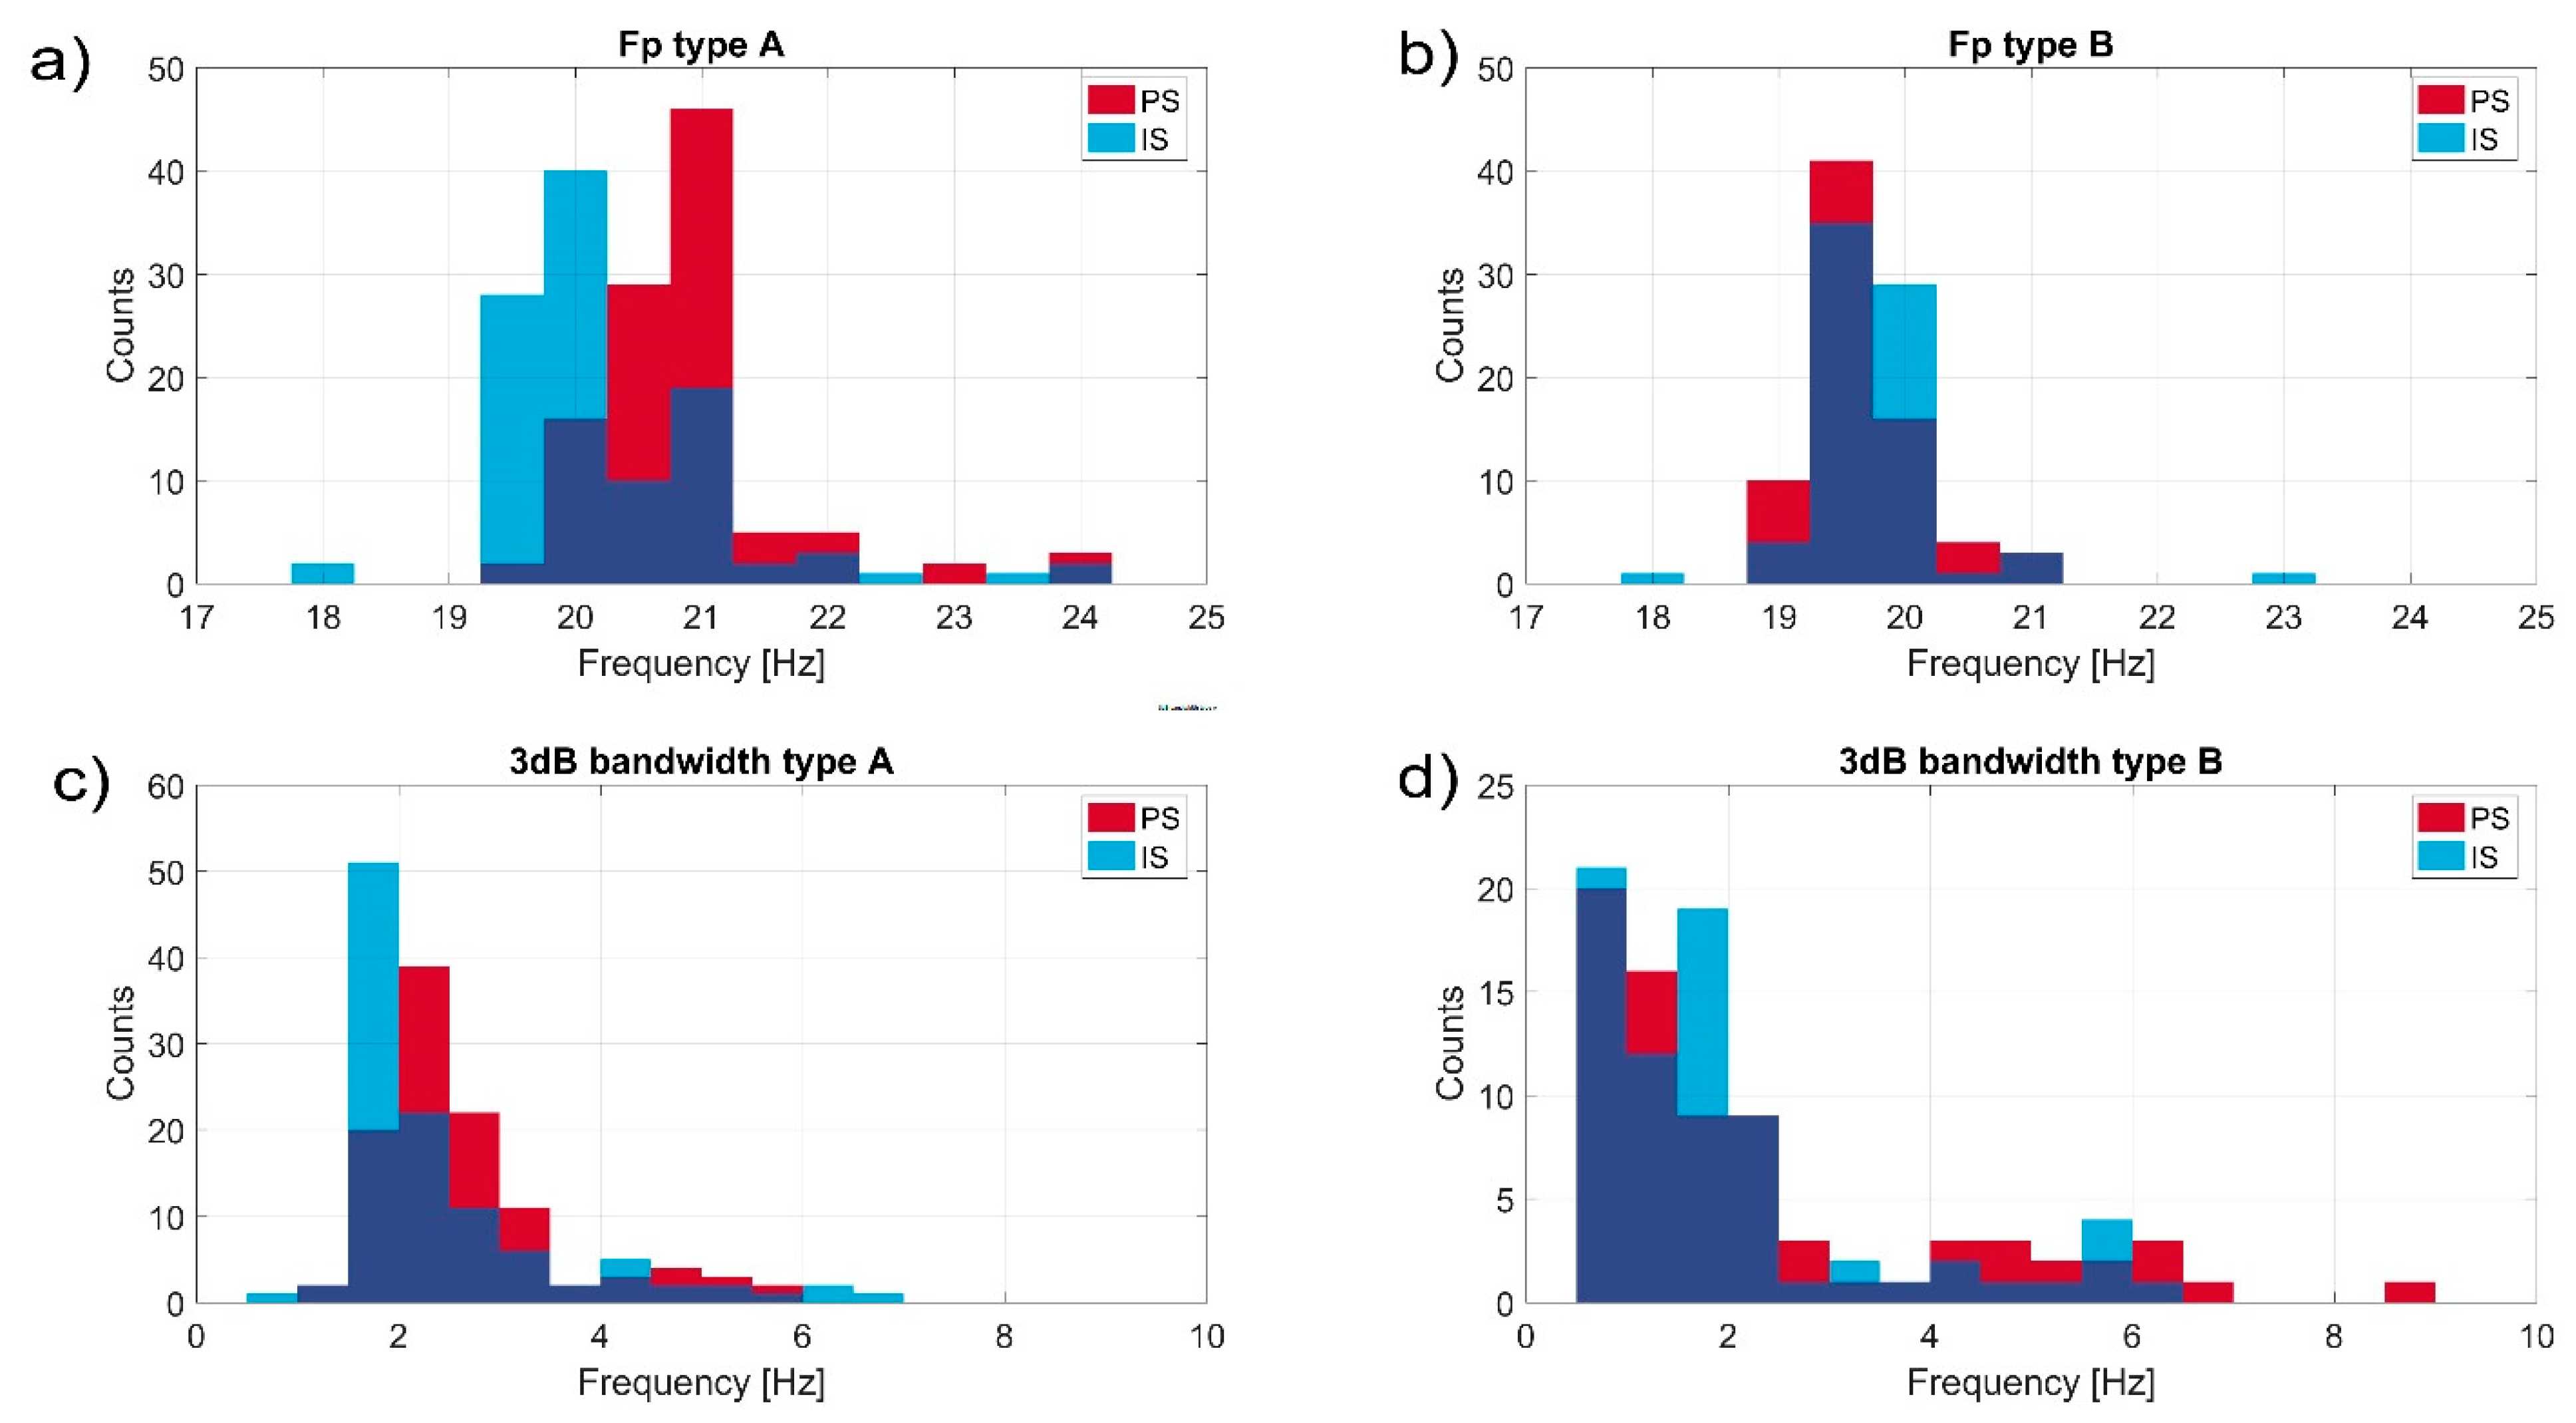
2.4. Spectral Features

Following note classification, the frequency spectra, and hence the distribution of the signal’s power content of the different note types were studied. For this purpose, each note extracted by SAW was filtered in the frequency band from 5 Hz to 40 Hz by applying a finite-duration impulse response (FIR) Equiripple bandpass filter. The filtered signal was cut down to an interval of 3 s, corresponding to 1 s before and 2 s after the energy peak of each detection. The SNR of all isolated notes was estimated as the ratio between the peak and the median value of the RMS energy envelope. The Power Spectral Density (PSD) of each note, measured in dB re 1 µPa2/Hz, was then calculated by using MATLAB© pwelch function (FFT points: 8192; Hanning window: 2048 points, overlap: 98%). The frequency spectra created were grouped by note type and by song, and the median values of PSD were measured. For each song, the frequency features of the notes were also measured. The peak frequency value (Hz), corresponding to the maximum of the signal’s power spectra (Fp), was extracted from the PSD spectra of each call using MATLAB© function findpeaks. Taking as reference the peak frequency of the signal, the 3 dB bandwidth (BW) was estimated. This parameter corresponds to the frequency band attenuated by 3 decibels, and it is measured as the difference between the initial and final frequencies around the peak, where the spectrum level is 3 dB below Fp [30,34].

2.5. INI Type Pair Analysis

Once notes were categorized, the song structure was studied in terms of note type and repetition rate. The inter-note-intervals (INIs) were measured as the time distance between two consecutive notes, in seconds. Peak energy times (Tp) extracted by SAW detector for each call were used to estimate the INIs. Following Helble et al. [30], INIs were studied by differentiating the intervals in A–A, A–B, B–A and B–B type pairs. All INI distributions were studied in the interval between 1 and 100 s and binned at 0.3 s. Whenever a sequence showed an appreciable distribution of the different INIs, having a clear modal distribution for at least three INI values of three different type pairs, it was classified as a patterned song (PS), otherwise it was classified as an irregular sequence (IS). Sequences without any clear INI distributions and with a high number of undefined note types (higher than approximately 80% of all detected notes) were marked as “unknowns” and they were excluded from further analysis. The variability of the different INIs was compared over the different type pairs and songs using the interquartile range, including all values between the 25th and the 75th percentiles of the distribution. Frequency features of the different call types were also studied and compared for PSs and ISs. To reduce measurement uncertainty, only notes with an SNR value higher than 3.5 dB for type A and 1.2 dB for type B notes (corresponding to the lowest 25th percentiles of all SNR values per note type) were selected. Selected notes were used to verify if Fp type A (FpA), Fp type B (FpB) and related 3 dB bandwidth were significantly different in PSs and in ISs. A two-tailed Mann–Whitney U-Test was then used to test (at the 1% significance level) the null hypothesis that data in PSs and in ISs (Fp and 3 dB bandwidth grouped by note type) were samples from continuous distributions with equal medians. To compare the two samples, which had different numbers of A and B notes, a random subsample was extracted from a PS as large as the number of notes available in an IS. The same Mann–Whitney U-Test was also performed on both note types to assess whether there were any significant differences (at the 1% significance level) in the SNR values of type A and type B notes in PSs and in ISs.

2.6. Study of Song Patterns

Patterned songs were then further studied to define the most common patterns. Patterns were searched by looking for recurring INIs of the various type pairs. The occurrence of these INIs and their alternation paths were verified within each song. This was possible by producing a vector corresponding to the length of the whole song in the samples, in which the arbitrary values 1 and 2 were assigned, respectively, to type A and type B notes, and the value 0 to all samples without detections. The vector was then plotted in MATLAB© to study note sequences at their exact detection times in seconds (Figure 2). Patterns were then manually annotated from this plot by moving throughout the length of each song in about 360 s steps. The occurrence of the different recurring patterns observed was subsequentially studied in the overall dataset.

3. Results

3.1. Song Detection and Classification
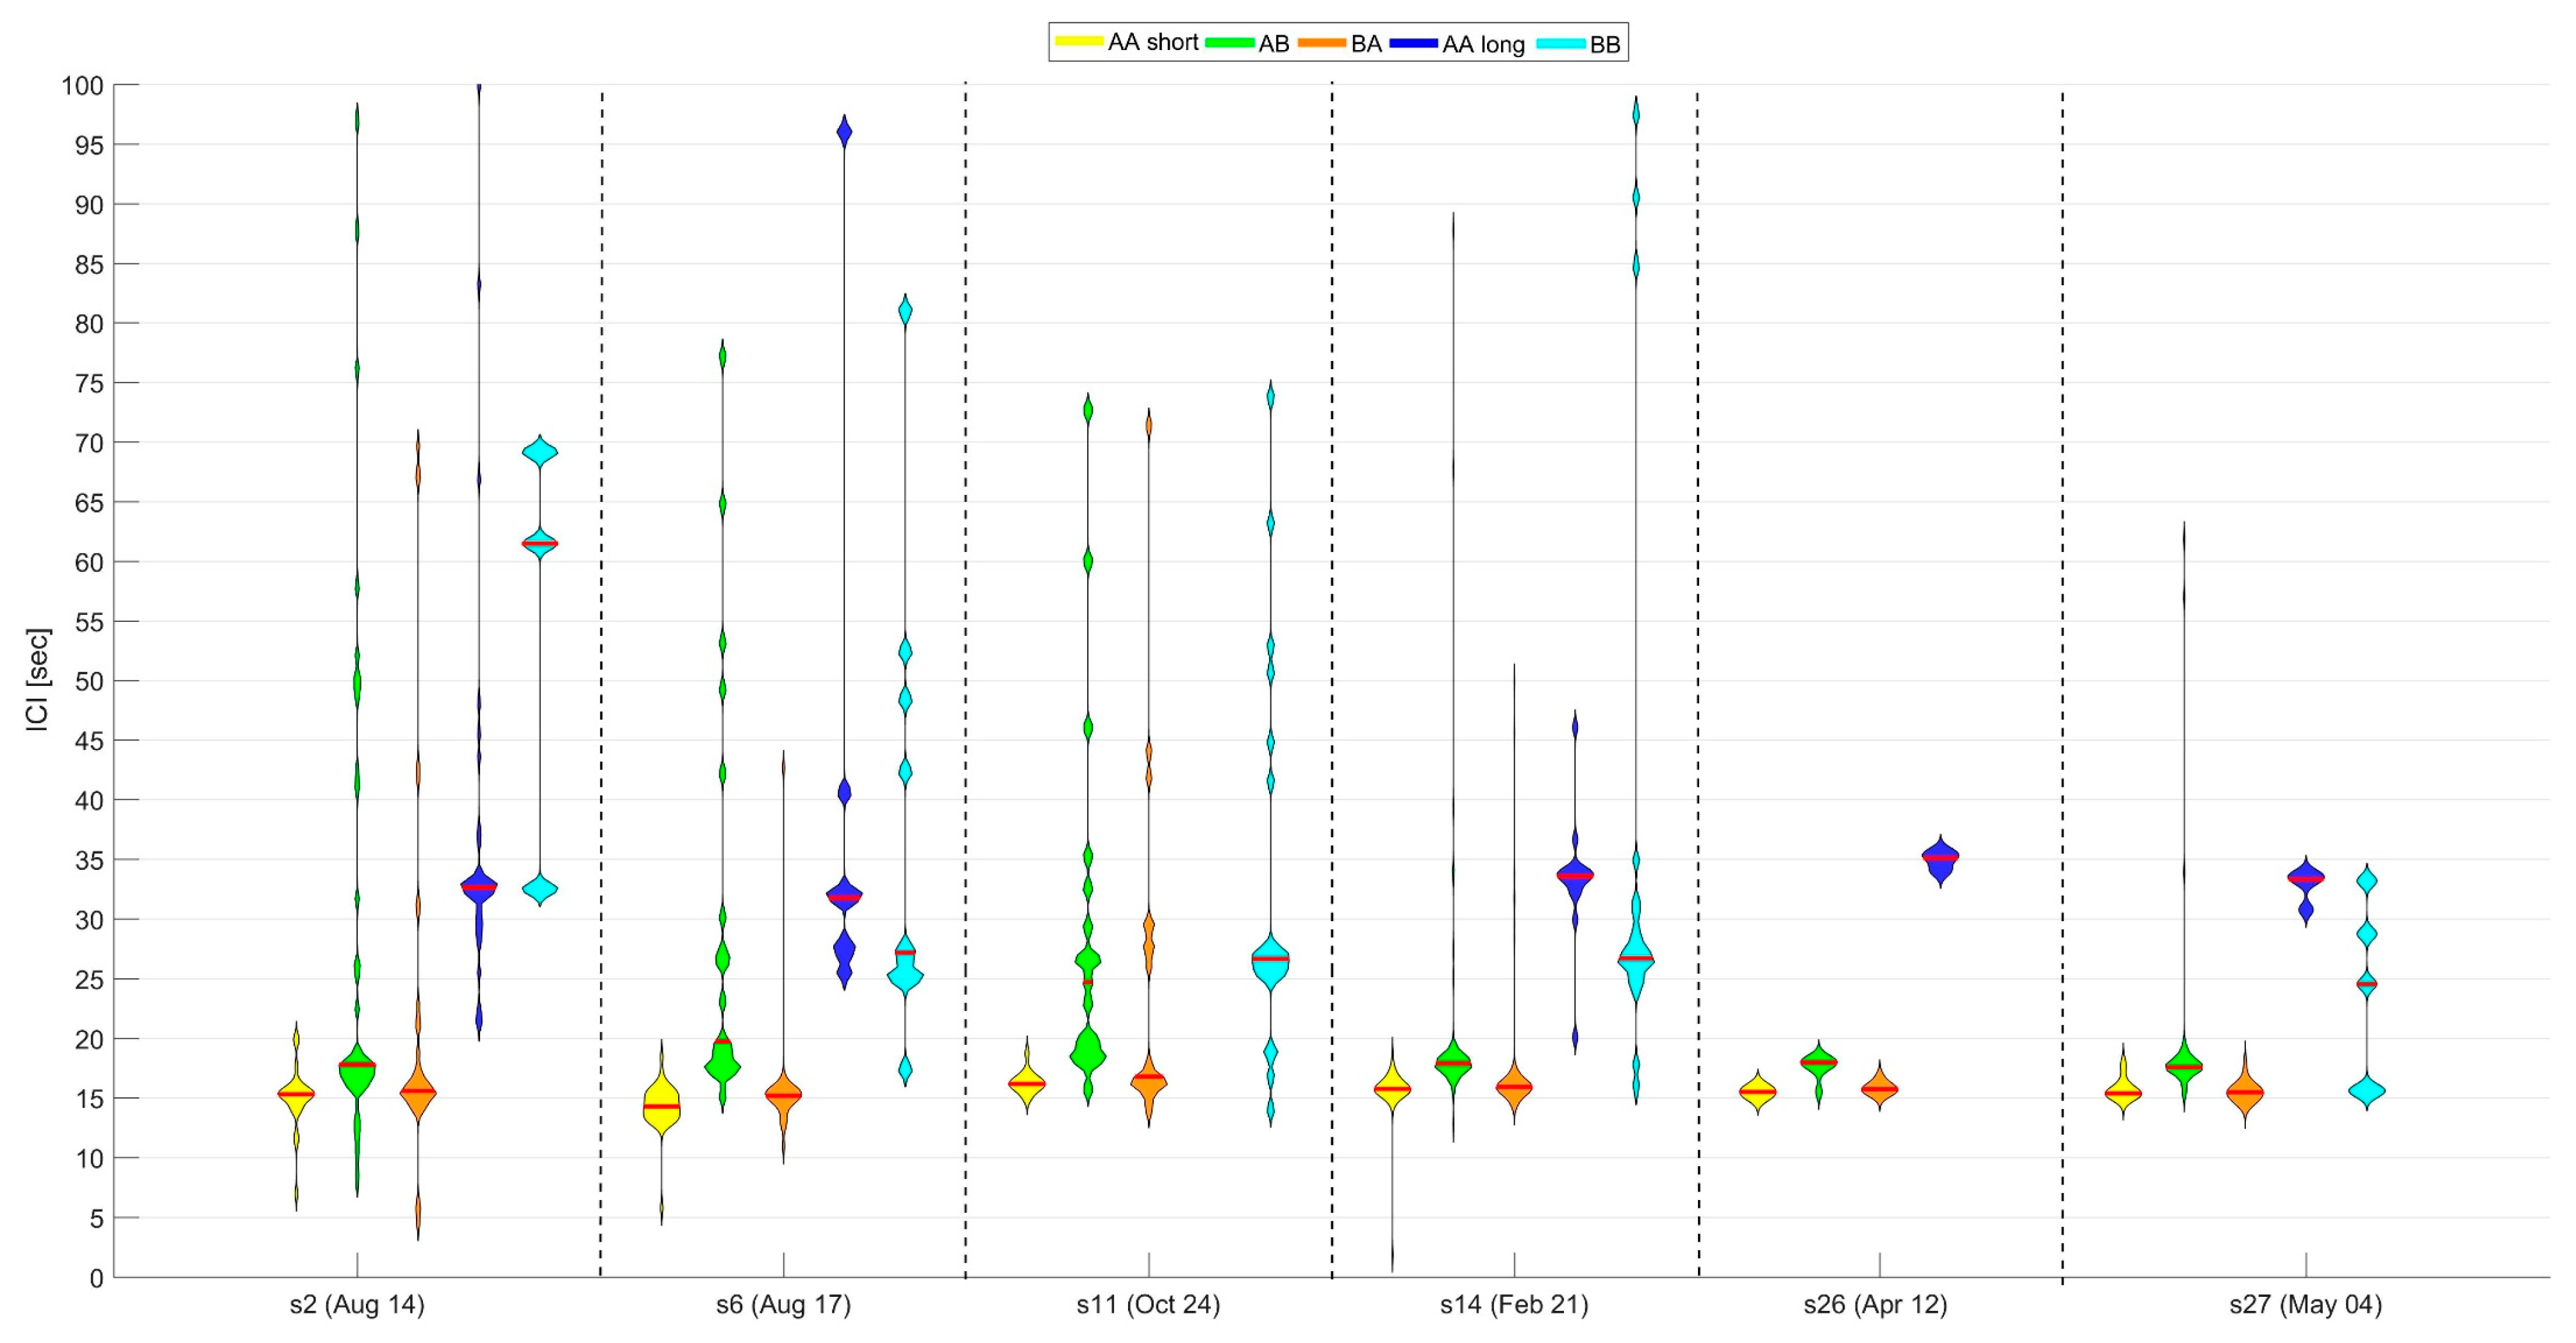
Fin whale vocalizations were detected monthly between June 2012 and May 2013, except for the time between 28 October 2012, and 21 February 2013, as described in previous work by Sciacca and colleagues [3]. A total of 28 fin whale call sequences were initially detected and classified as “songs” following the definitions by Watkins et al. [8,27] (Table 1). Then, 59% of the detected calls were classified as either type A or type B notes (representing 35% and 24% of all detections, respectively), and the remaining 41% were marked as “unknown”. Statistical analysis showed no significant difference by note type in the detection rate per minute (Kolmogorov–Smirnov test p > 0.05; D = 0.22). Unknown calls were subsequently excluded from further analysis. The overall median PSD spectra of the two main note types are shown in Figure 3. The longest sequence detected was the 14th (recorded on 21 February 2013) with about 270 min duration, and a total of 390 vocalizations found. The shortest sequence was the 1st one recorded (2 July 2021), with a duration of only 10 min and 7 vocalizations recorded (Table 1; Figure 4). The distribution of all INIs was then studied for each type pair (A–A, A–B, B–B, B–A) and for each song. Based on note classification and INI type pair distribution, among the twenty-eight call sequences detected and initially classified as songs, six were classified as patterned songs (PS) and four as irregular sequences (IS). The duration and distribution of all twenty-eight sequences over the 24 h is shown in Figure 4, together with PS and IS classification.

3.2. INI Type Pairs

Five main INIs were identified based on type pairs and on their distributions. Showing a clear bimodal distribution, the INI A–A was indeed distinguished in two different INIs: A–A short (A–AS) and A–A long (A–AL). The A–AS lasted between 10 and 20 s and the A–AL duration was between 25 and 35 s. Hence, the main INI type pairs were: A–AL, A–AS, A–B, B–A and B–B. The descriptive statistical analysis of all INIs between 0 and 100 s is shown in Table 2 for PS and in Table 3 for IS. The interquartile range (IqR) can be used as a reference to assess INI variability. As shown in Table 2, in PSs the IqR was smaller than 3 s for all the type pairs, except for the B–B type. Concerning the percentage of occurrence, B–A, A–B and A–AS INIs were evenly distributed in all PSs (Table 4). The A–AL and B–B types occurred less frequently with the exceptions of song 2 and song 11, respectively. On the other hand, irregular sequences showed higher IqRs (higher than 4 s) for all the INI types (Table 3). INI type pairs were also homogeneously distributed in all ISs, except for the A–AL type, which was found only in S3 and for S9, and lacked both A–AL and A–AS.
A significant difference was also found between patterned songs and irregular sequences in the frequency features of type A notes. The two-sided Mann–Whitney U-Test had p value < 0.01 in type A notes for both frequency peaks of A type notes (FpA) and a 3 dB bandwidth of its spectral peak, with a z value of 6.43 and of 3.55, respectively. No significant difference was found in type B notes between patterned songs and irregular sequences (Mann–Whitney U-Test p value > 0.01 for both FpB and 3 dB bandwidth type B, and z values of −0.95 and 0.49, respectively). The histogram distributions of Fp and 3 dB bandwidth in type A and type B notes and for both PS and IS are shown in Figure 5. Descriptive statistics of frequency features are shown in Table 5. A similar result was found in the SNR values of type A and type B notes in PS and in IS. A significant difference was found in the median values of type A SNR notes between PS and IS (Mann–Whitney p value < 0.01; zval: −3.3180), whilst the median SNR of type B notes did not show any significant differences (Mann–Whitney p value > 0.05; zval: −1.1519).

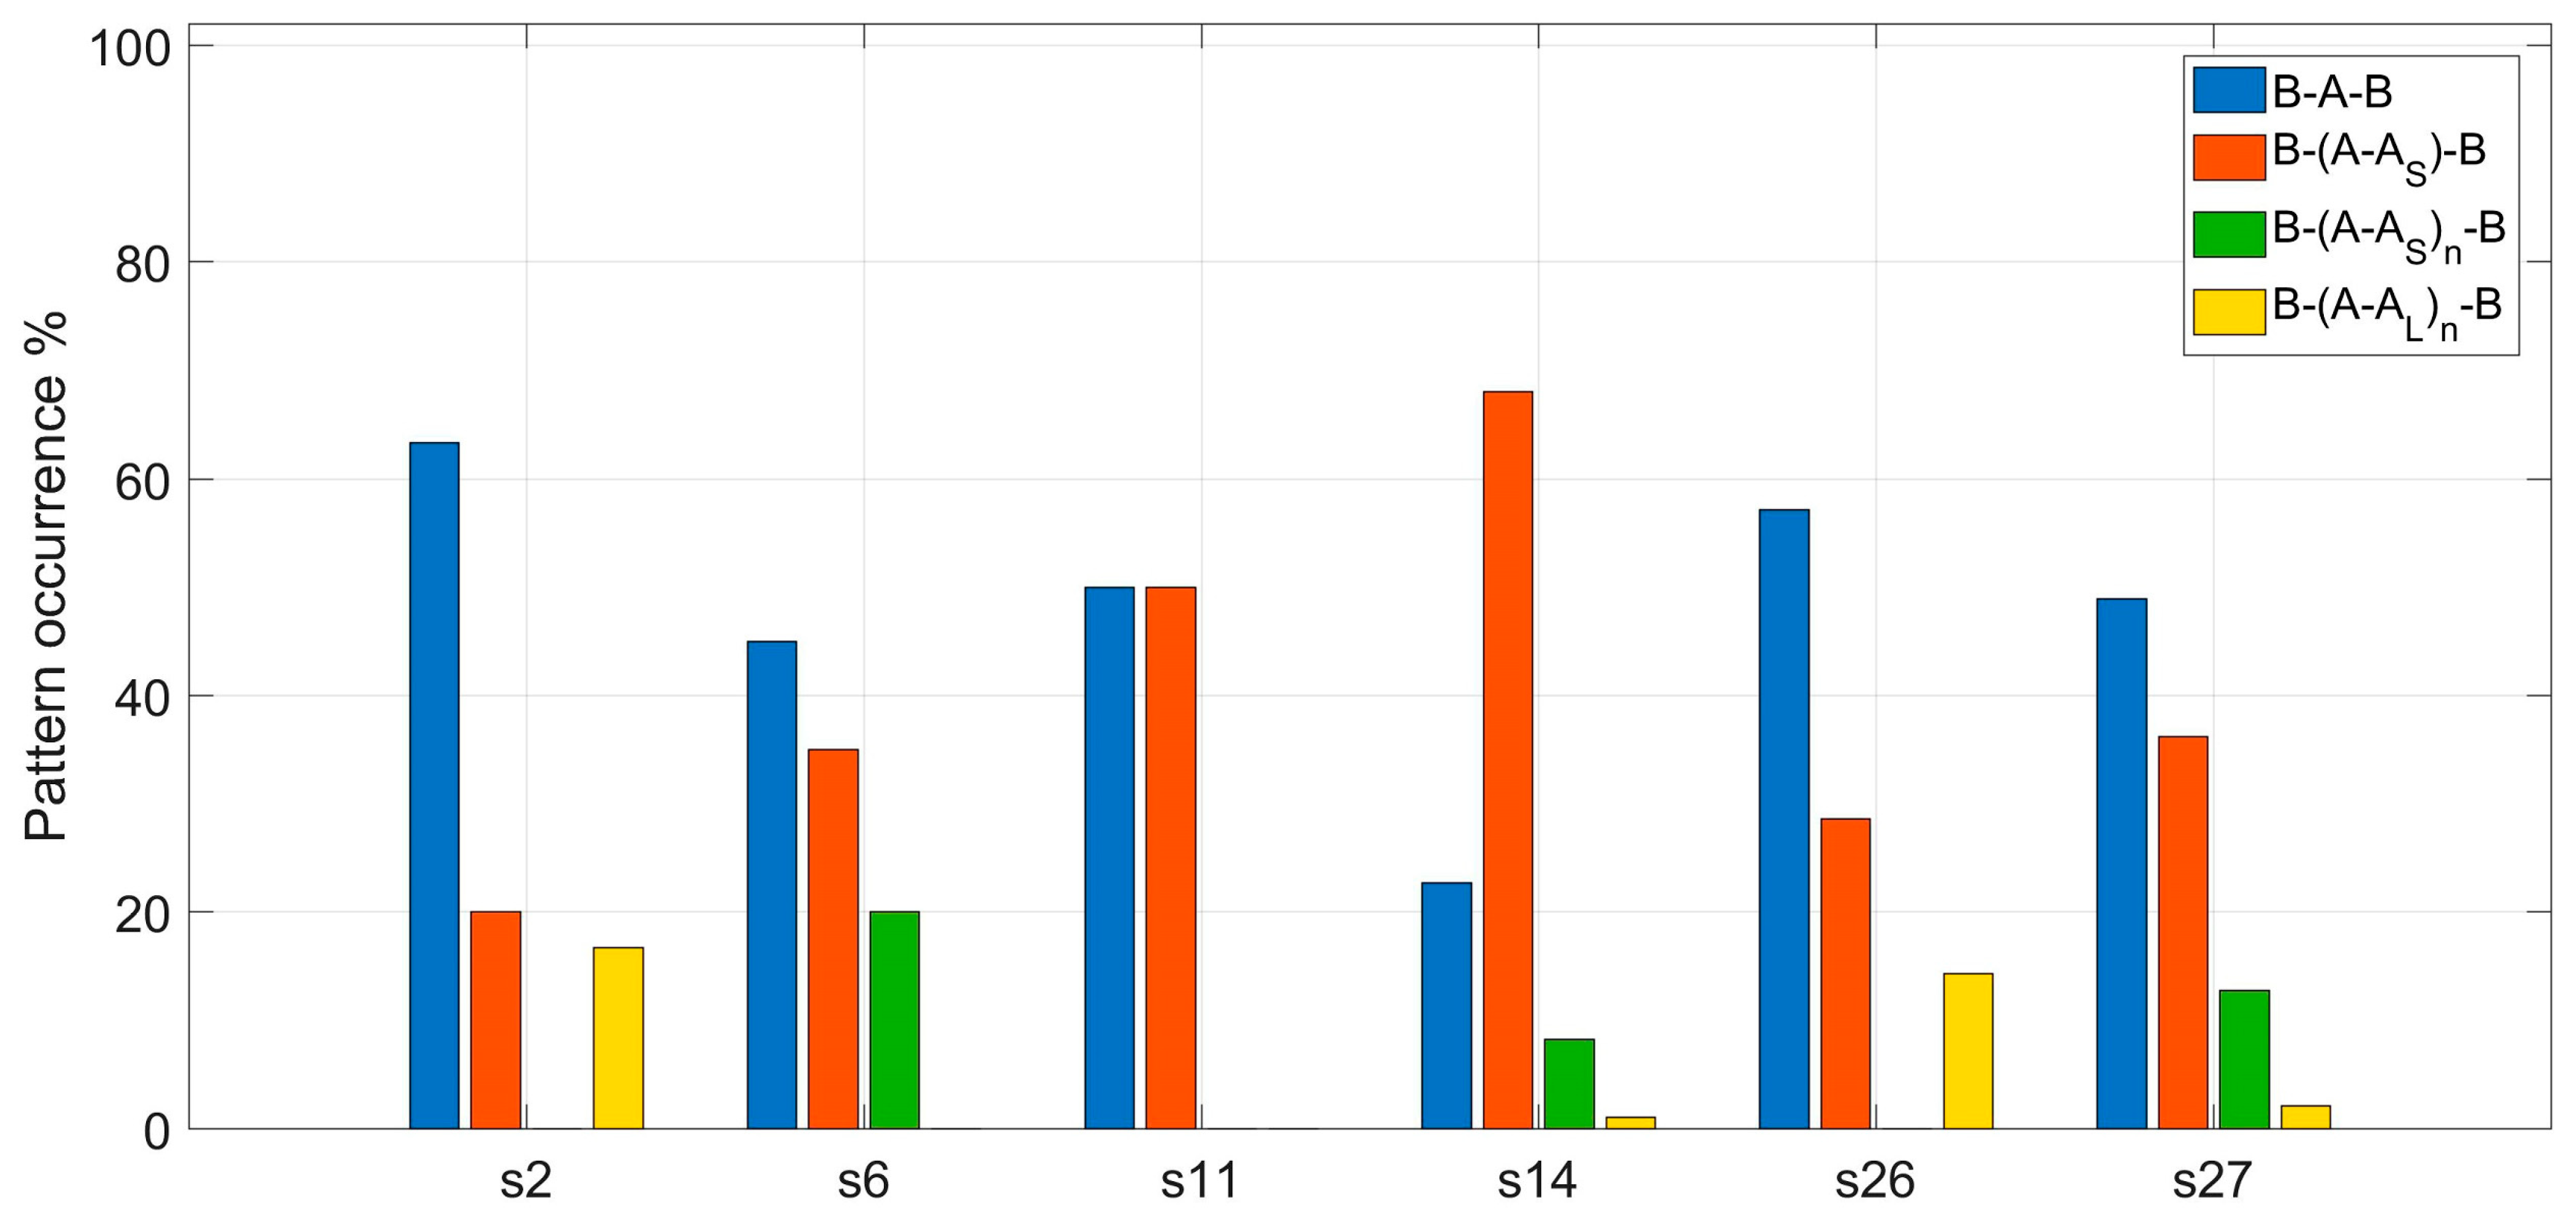
3.3. Characterization of Song Patterns

To define the occurrence of recurring patterns, PS were further investigated in terms of note alternation and INI type duration for each song. Figure 6 shows the distribution of the different INI type pairs for all patterned songs. Despite the low number of samples in some of the songs, the study of the distribution underlined that INIs were similarly distributed over time. A–AS had generally slightly smaller intervals than B–A INIs, whilst the A–B INIs were always higher than the first two, but lower than the A–AL INIs (when present). B–B INIs were the most variable among songs, since they were highly dispersed in S2 and not detected in S26 (Figure 6). The occurrence of song patterns based on INI type pairs’ alternation was then investigated within each song. B–B INIs were not directly related to any particular pattern within detected songs.
Four main patterns were found and classified as follows:
  • Simple doublet “B–A–B”: alternation of B–A and A–B INIs, where the shorter B–A was always the initial interval of a unit. This pattern is characterized by the repetition of two main INI types.
In addition, three patterns with similar structure and B–A and A–B INIs distributions were defined; the main difference among them is related to the number of repetitions and time interval of type A notes included between the initial B–A and the final A–B.
  • Short triplet “B–A–AS–B”: the A–A INI is a A–A short interval, and two type A notes are always enclosed between the first and the final type B note.
  • Complex short “B–(A–AS)n–B” triplet: the A–A INI was classified as A–A short, and n is a value between three and nine which indicates the number of INI A–AS repetitions.
  • Complex long “B–(A–AL)n–B” triplet: the A–A INI is A–A long, and n varies between two and five and indicates the number of INI A–AL repetitions.
The relative percentage of occurrence of the different patterns is described Figure 7 for each song. Song 14 and song 27 showed all four patterns, whilst song 11 had only simple doublets and short triplets. Over all the songs, the simple doublet was the most recurrent pattern, with a mean occurrence of 47.85%. The second most frequent pattern was the short triplet with a mean percentage of 39.63%. The complex-short and the complex-long were less common with, respectively, 6.84% and the 5.69% of mean occurrence.

4. Discussion

This study describes the note patterns of fin whale songs recorded in the central Mediterranean Sea (Ionian Sea) during about ten months of continuous acoustic recording, between 2012 and 2013. Out of the 28 sequences initially classified as songs following the classical definitions from Watkins et al. [8,27], 18 sequences were excluded from further analysis due to the occurrence of a high number of uncategorized notes and no clear trends in INI distribution. The high number of uncategorized notes was due to the poor spectral contours and SNR determined either by the greater distance of the singing whale or by environmental conditions that affected the sound detection range. Indeed, despite a typical detection range of about 20 km, at certain depths and distances 20 Hz notes could have been recorded many tens of km further from the NEMO-SN1 location (see detection range model in [4]). Similar distance ranges were also observed in other locations [35]. The remaining 10 sequences, which were categorized in terms of song notes, were further analyzed to assess the occurrence of patterned units made by different alternations of note type pairs and INIs. Results have shown that duration and time distribution of all sequences were highly variable across the whole recording year. Received call sequences lasted from 10 min (S1) to 270 min (S14). The brief duration of some of the detected sequences could be due to the recording of animals travelling across the detection range or communicating over long distances. The study area seems to represent a regular transit area between the eastern and the western sides of the Mediterranean Sea [36]. Here, fin whales have been recorded for a few days at the time before possibly moving to other feeding and or breeding locations such as the area around Lampedusa and the Sicily Channel [4], or towards the western side of the basin through the Strait of Messina [37]. Differently from the north-western Mediterranean Sea, where the detection rate at daytime observed in other studies was significantly higher than the detection rate at night-time [5], no such patterns were observed in detected call sequences [4] and songs. The number of detected type A (classic) notes was generally higher compared to type B (backbeat) notes, however there was no significant difference in the detection rates per minute of any note type. Frequency characteristics of detected 20 Hz notes were highly consistent with available measurements from previous observations in North-Western Mediterranean Sea [10]. The main difference observed was a smaller 3 dB bandwidth for type A notes compared to what found by Clark and colleagues [10]. Based on note type alternation and their occurrence within the different sequences, five main INI type pairs were identified: A–B, B–B, B–A, A–AS and A–AL. The study of INI type pair distributions led to grouping the call sequences into two categories: patterned songs and irregular sequences. The distribution of the INIs observed in PSs was similar to that recently observed by Best and colleagues [6] in fin whale songs recorded in the north-western Mediterranean Sea between 2008 and 2018. The main difference in [6] was the lack of a long A–A INI. Both PSs and ISs were found throughout the recording year, without any seasonality. PSs were recorded in the months of August, October, February, April, and May. Sequences classified as IS were instead detected in August, September and March. In PSs all INI type pairs were highly stable, except for the B–B type. In ISs, INIs were instead highly variable for all type pairs. One of these sequences was composed of only classic (type A) notes, with a slightly more stable A–AS INI. Differences in the frequency features were also found between PS and IS sequences. In particular, the medians of Fp and 3 dB bandwidth distribution values of type A notes were significantly different in PSs and ISs. Type A notes had higher peak frequency values in PS compared to IS, with distributions peaked, respectively, at about 21 Hz and 20 Hz. Median 3 dB bandwidth values were also significantly higher in PS, with a modal value about 0.5 Hz higher than IS, and most values (>80% of the distribution) included were between 1.5 Hz and 3.5 Hz. On the other hand, type B notes did not show any significant differences in frequency parameters between ISs and PSs. FpB distributions were centered between 19 and 21 Hz, and about 80% of the 3 dB bandwidth values were between 0.5 Hz and 2.5 Hz. The study of INI type pair alternation and duration for each patterned song resulted in the identification of four main recurrent patterns: simple doublet “B–A–B”, short triplet “B–A–AS–B”, complex-short “B–(A–AS)n–B” and complex-long “B–(A–AL)n–B” triplets. The simple doublet and the short triplet were the most common patterns, which were found in all PSs. In particular, the “simple doublet” represents the simplest pattern found and it is consistent with the classic “doublet” found in previous studies from various fin whale populations [8,28,29]. On the other hand, the short triplet represents another distinctive pattern of detected songs, since it was the second most found in all songs. These two patterns explained on average cumulatively about 90% of all the songs and they can be considered as essential functional units in investigated fin whale songs. These patterns are consistent with the INI type distributions found in the western Mediterranean Sea [6], demonstrating a recurring structure in the songs of this population. Still, further investigations and larger samples are required to understand their variations over space and time and to define the repetition rates of both complex short and long triplets, which were highly variable within detected songs.

5. Conclusions

This study showed the spectral characteristics and patterned structure of Mediterranean fin whale song notes recorded in the Ionian Sea. Time and frequency differences between patterned songs and irregular call sequences were studied for the first time in the Mediterranean Sea. The sequences categorized as “irregulars” presented highly variable INIs in association with most type pairs. These sequences had type A notes with lower peak frequencies and a narrower 3 dB bandwidth, compared to patterned songs. However, considering the significantly lower SNR value of type A notes in irregular sequences, these results may either indicate functional differences in fin whale acoustic repertoire, or they could be related to the different levels of noise within fin whale frequency band. In addition, considering the high levels of noise measured at the study location [4,38], further observations are needed to establish the differences between songs and irregular sequences. For example, it would be important to assess the position of the emitting whale and the source level of all emitted sounds. Several studies indeed demonstrated that classic and backbeat notes show different received levels [10,39] and that higher frequency calls, such as the 130 Hz upsweep observed in other populations, exhibited a source level about 20–25 dB lower than 20 Hz pulses [17,40]. This will be possible by extending the recording time and coupling PAM data with direct behavioral observations on site, and by tracking the position of the emitting whales. Furthermore, the inter-note-intervals of patterned songs were studied in combination with note type alternation to define the units that composed recorded songs. Four main recurring patterns were found, which constituted the baseline of detected patterned song. Presented results confirm that Mediterranean fin whale songs show more diversity in the alternation of pulse types than simple singlets or doublets [6]. Still, all observed patterns can be represented by the scheme “B–An–B”, where a backbeat always precedes a classic 20 Hz note type. This scheme is consistent with what has been described in previous studies from the Mediterranean Sea [3,10] and lays the groundwork to future studies of fin whale songs. Detected songs did not show any diel or seasonal trend. The lack of seasonality in Mediterranean fin whale songs confirmed by this study also supports the hypothesis that this population has developed unique song use due to its geographic isolation [6] and peculiar behavior [36]. In addition, presented results reinforce the theory suggesting that Mediterranean fin whale breeding activities extend year round [36,41]. The occurrence and definition of recurring patterns considering spectral features, INIs and note type alternation, such as those observed in this study, will help the assessment of populations’ repertoires and inter-seasonal and inter-annual variations [26]. The results shown will serve as a baseline to ascertain the structure of and the potential variations in Mediterranean fin whale songs over time.

Author Contributions

Conceptualization and methodology V.S., G.M. (Giuseppe Morello), S.V., F.F. and F.S.; formal analysis, V.S. and G.M. (Giuseppe Morello); software, supervision, and writing—original draft preparation, V.S.; resources, data curation, writing—review and editing, L.B., D.E., G.M. (Giuditta Marinaro), G.M.R., F.S. and S.V. All authors have read and agreed to the published version of the manuscript.

Funding

This research received no external funding.

Institutional Review Board Statement

Not applicable.

Informed Consent Statement

Not applicable.

Data Availability Statement

Data are available from Embriaco, D., Marinaro, G., & Giovanetti, G. (2010). https://doi.org/10.13127/MD/600DBC39-8769-4FA3-8154-7DD71EFA659E, accessed on 18 October 2023.

Acknowledgments

The authors are grateful to the NEMO-SN1 team for its contribution to the deployment and operation of the observatory. The authors dedicate this work to the cherished memory of our esteemed friend and mentor, Professor Gianni Pavan, a recognized pioneer in the field of bioacoustics in Italy.

Conflicts of Interest

The authors declare no conflict of interest. The funders had no role in the design of the study; in the collection, analyses or interpretation of data; in the writing of the manuscript; or in the decision to publish the results.

References

  1. Cooke, J.G. Balaenoptera physalus. The IUCN Red List of Threatened Species 2018: E.T2478A50349982. 2018. Available online: https://www.iucnredlist.org/species/2478/50349982 (accessed on 12 January 2023).
  2. Panigada, S.; Gauffier, P.; Notarbartolo di Sciara, G. Balaenoptera physalus (Mediterranean subpopulation). The IUCN Red List of Threatened Species 2021: E.T16208224A50387979. 2021. Available online: https://www.iucnredlist.org/species/16208224/50387979 (accessed on 10 January 2023).
  3. Castellote, M.; Clark, C.W.; Lammers, M.O. Fin Whale (Balaenoptera physalus) Population Identity in the Western Mediterranean Sea. Mar. Mammal Sci. 2012, 28, 325–344. [Google Scholar] [CrossRef]
  4. Sciacca, V.; Caruso, F.; Beranzoli, L.; Chierici, F.; De Domenico, E.; Embriaco, D.; Favali, P.; Giovanetti, G.; Larosa, G.; Marinaro, G.; et al. Annual Acoustic Presence of Fin Whale (Balaenoptera physalus) Offshore Eastern Sicily, Central Mediterranean Sea. PLoS ONE 2015, 10, e0141838. [Google Scholar] [CrossRef]
  5. Pintore, L.; Sciacca, V.; Viola, S.; Giacoma, C.; Papale, E.; Giorli, G. Fin Whale (Balaenoptera physalus) in the Ligurian Sea: Preliminary Study on Acoustics Demonstrates Their Regular Occurrence in Autumn. J. Mar. Sci. Eng. 2021, 9, 966. [Google Scholar] [CrossRef]
  6. Best, P.; Marxer, R.; Paris, S.; Glotin, H. Temporal Evolution of the Mediterranean Fin Whale Song. Sci. Rep. 2022, 12, 13565. [Google Scholar] [CrossRef]
  7. Pereira, A.; Harris, D.; Tyack, P.; Matias, L. Fin Whale Acoustic Presence and Song Characteristics in Seas to the Southwest of Portugal. J. Acoust. Soc. Am. 2020, 147, 2235–2249. [Google Scholar] [CrossRef]
  8. Watkins, W.A.; Tyack, P.; Moore, K.E.; Bird, J.E. The 20-Hz Signals of Finback Whales (Balaenoptera physalus). J. Acoust. Soc. Am. 1987, 82, 1901–1912. [Google Scholar] [CrossRef]
  9. Edds-walton, P.L. Acoustic Communication Signals of Mysticete Whales. Bioacoustics 1997, 8, 47–60. [Google Scholar] [CrossRef]
  10. Clark, C.W.; Borsani, J.F.; Notarbartolo-Di-sciara, G. Vocal activity of fin whales, Balaenoptera physalus, in the Ligurian Sea. Mar. Mammal Sci. 2002, 18, 286–295. [Google Scholar] [CrossRef]
  11. Weirathmueller, M.J.; Stafford, K.M.; Wilcock, W.S.D.; Hilmo, R.S.; Dziak, R.P.; Tréhu, A.M. Spatial and Temporal Trends in Fin Whale Vocalizations Recorded in the NE Pacific Ocean between 2003–2013. PLoS ONE 2017, 12, e0186127. [Google Scholar] [CrossRef]
  12. Romagosa, M.; Pérez-Jorge, S.; Cascão, I.; Mouriño, H.; Lehodey, P.; Pereira, A.; Marques, T.A.; Matias, L.; Silva, M.A. Food Talk: 40-Hz Fin Whale Calls Are Associated with Prey Biomass. Proc. R. Soc. B Biol. Sci. 2021, 288, 20211156. [Google Scholar] [CrossRef]
  13. Furumaki, S.; Tsujii, K.; Mitani, Y. Fin Whale (Balaenoptera physalus) Song Pattern in the Southern Chukchi Sea. Polar Biol. 2021, 44, 1021–1027. [Google Scholar] [CrossRef]
  14. Constaratas, A.N.; McDonald, M.A.; Goetz, K.T.; Giorli, G. Fin Whale Acoustic Populations Present in New Zealand Waters: Description of Song Types, Occurrence and Seasonality Using Passive Acoustic Monitoring. PLoS ONE 2021, 16, e0253737. [Google Scholar] [CrossRef]
  15. Wood, M.; Širović, A. Characterization of Fin Whale Song off the Western Antarctic Peninsula. PLoS ONE 2022, 17, 11–15. [Google Scholar] [CrossRef]
  16. Širović, A.; Hildebrand, J.A.; Wiggins, S.M.; Thiele, D. Blue and Fin Whale Acoustic Presence around Antarctica during 2003 and 2004. Mar. Mammal Sci. 2009, 25, 125–136. [Google Scholar] [CrossRef]
  17. Simon, M.; Stafford, K.M.; Beedholm, K.; Lee, C.M.; Madsen, P.T. Singing Behavior of Fin Whales in the Davis Strait with Implications for Mating, Migration and Foraging. J. Acoust. Soc. Am. 2010, 128, 3200–3210. [Google Scholar] [CrossRef]
  18. Morano, J.L.; Salisbury, D.P.; Rice, A.N.; Conklin, K.L.; Falk, K.L.; Clark, C.W. Seasonal and Geographical Patterns of Fin Whale Song in the Western North Atlantic Ocean. J. Acoust. Soc. Am. 2012, 132, 1207–1212. [Google Scholar] [CrossRef]
  19. Oleson, E.M.; Širović, A.; Bayless, A.R.; Hildebrand, J.A. Synchronous Seasonal Change in Fin Whale Song in the North Pacific. PLoS ONE 2014, 9, e115678. [Google Scholar] [CrossRef]
  20. Stafford, K.M.; Mellinger, D.K.; Moore, S.E.; Fox, C.G. Seasonal Variability and Detection Range Modeling of Baleen Whale Calls in the Gulf of Alaska, 1999–2002. J. Acoust. Soc. Am. 2007, 122, 3378–3390. [Google Scholar] [CrossRef]
  21. Kershenbaum, A.; Blumstein, D.T.; Roch, M.A.; Akçay, Ç.; Backus, G.; Bee, M.A.; Bohn, K.; Cao, Y.; Carter, G.; Cäsar, C.; et al. Acoustic Sequences in Non-Human Animals: A Tutorial Review and Prospectus. Biol. Rev. 2016, 91, 13–52. [Google Scholar] [CrossRef]
  22. Croll, D.A.; Clark, C.W.; Acevedo, A.; Tershy, B.; Gedamke, J.; Urban, J.; Suki, B. Only Male Fin Whales Sing Loud Songs. Nature 2002, 417, 809–811. [Google Scholar] [CrossRef]
  23. Mcdonald, M.A.; Hildebrand, J.A.; Webb, S.C. Blue and Fin Whales Observed on a Seafloor Array Pacific. J. Acoust. Soc. Am. 1995, 98, 712–721. [Google Scholar] [CrossRef]
  24. Širović, A.; Williams, L.N.; Kerosky, S.M.; Wiggins, S.M.; Hildebrand, J.A. Temporal Separation of Two Fin Whale Call Types across the Eastern North Pacific. Mar. Biol. 2013, 160, 47–57. [Google Scholar] [CrossRef] [PubMed]
  25. Soule, D.C.; Wilcock, W.S.D. Fin Whale Tracks Recorded by a Seismic Network on the Juan de Fuca Ridge, Northeast Pacific Ocean. J. Acoust. Soc. Am. 2013, 133, 1751–1761. [Google Scholar] [CrossRef] [PubMed]
  26. Sciacca, V.; Morello, G.; Filiciotto, F. Measuring Fin Whale Songs in a Noisy Environment. In The Effects of Noise on Aquatic Life; Popper, A.N., Sisneros, J., Hawkins, A.D., Thomsen, F., Eds.; Springer: Cham, Switzerland, 2023. [Google Scholar] [CrossRef]
  27. Watkins, W.A. Activities and Underwater Sounds of Fin Whales (Balaenoptera physalus). Sci. Rep. Whales Res. Inst. Tokyo 1981, 33, 83–117. [Google Scholar]
  28. Thompson, P.O.; Findley, L.T.; Vidal, O. 20-Hz Pulses and Other Vocalizations of Fin Whales, Balaenoptera physalus, in the Gulf of California, Mexico. J. Acoust. Soc. Am. 1992, 92, 3051–3057. [Google Scholar] [CrossRef]
  29. Širović, A.; Oleson, E.M.; Buccowich, J.; Rice, A.; Bayless, A.R. Fin Whale Song Variability in Southern California and the Gulf of California. Sci. Rep. 2017, 7, 10126. [Google Scholar] [CrossRef]
  30. Helble, T.A.; Guazzo, R.A.; Alongi, G.C.; Martin, C.R.; Martin, S.W.; Henderson, E.E. Fin Whale Song Patterns Shift Over Time in the Central North Pacific. Front. Mar. Sci. 2020, 7, 587110. [Google Scholar] [CrossRef]
  31. Favali, P.; Chierici, F.; Marinaro, G.; Giovanetti, G.; Azzarone, A.; Beranzoli, L.; De Santis, A.; Embriaco, D.; Monna, S.; Lo Bue, N.; et al. NEMO-SN1 Abyssal Cabled Observatory in the Western Ionian Sea. IEEE J. Ocean. Eng. 2013, 38, 358–374. [Google Scholar] [CrossRef]
  32. EMSO ERIC Website. Available online: https://emso.eu (accessed on 19 October 2023).
  33. Embriaco, D.; Marinaro, G.; Giovanetti, G. Hydrophone Dataset (SMID DT-405D(V)1 @ 2 kHz) from INGV/NEMO-SN1 Seafloor Platform during SMO Project in Western Ionian Sea Site (East Sicily), Part of EMSO Network [Data Set]. Istituto Nazionale di Geofisica e Vulcanologia (INGV). 2012. Available online: https://doi.org/10.13127/MD/600DBC39-8769-4FA3-8154-7DD71EFA659E (accessed on 18 October 2023).
  34. Crane, N.L.; Lashkari, K. Sound Production of Gray Whales, Eschrichtius Robustus, along Their Migration Route: A New Approach to Signal Analysis. J. Acoust. Soc. Am. 1996, 100, 1878–1886. [Google Scholar] [CrossRef]
  35. Samaran, F.; Adam, O.; Guinet, C. Detection Range Modeling of Blue Whale Calls in Southwestern Indian Ocean. Appl. Acoust. 2010, 71, 1099–1106. [Google Scholar] [CrossRef]
  36. Geijer, C.K.A.; Notarbartolo di Sciara, G.; Panigada, S. Mysticete Migration Revisited: Are Mediterranean Fin Whales an Anomaly? Mamm. Rev. 2016, 46, 284–296. [Google Scholar] [CrossRef]
  37. Monaco, C.; Ibáñez, J.M.; Carrión, F.; Tringali, L.M. Cetacean behavioral responses to noise exposure generated by seismic surveys: How to mitigate better? Ann. Geophys. 2016, 59, S0436. [Google Scholar]
  38. Viola, S.; Grammauta, R.; Sciacca, V.; Bellia, G.; Beranzoli, L.; Buscaino, G.; Caruso, F.; Chierici, F.; Cuttone, G.; D’Amico, A.; et al. Continuous Monitoring of Noise Levels in the Gulf of Catania (Ionian Sea). Study of Correlation with Ship Traffic. Mar. Pollut. Bull. 2017, 121, 97–103. [Google Scholar] [CrossRef] [PubMed]
  39. Weirathmueller, M.J.; Wilcock, W.S.D.; Soule, D.C. Source Levels of Fin Whale 20 Hz Pulses Measured in the Northeast Pacific Ocean. J. Acoust. Soc. Am. 2013, 133, 741–749. [Google Scholar] [CrossRef] [PubMed]
  40. Garcia, H.A.; Zhu, C.; Schinault, M.E.; Kaplan, A.I.; Handegard, N.O.; Godø, O.R.; Ahonen, H.; Makris, N.C.; Wang, D.; Huang, W.; et al. Temporal–Spatial, Spectral, and Source Level Distributions of Fin Whale Vocalizations in the Norwegian Sea Observed with a Coherent Hydrophone Array. ICES J. Mar. Sci. 2019, 76, 268–283. [Google Scholar] [CrossRef]
  41. Notarbartolo-Di-Sciara, G.; Zanardelli, M.; Jahoda, M.; Panigada, S.; Airoldi, S. The Fin Whale Balaenoptera physalus (L. 1758) in the Mediterranean Sea. Mamm. Rev. 2003, 33, 105–150. [Google Scholar] [CrossRef]
Figure 1. Detection and classification window. (a) Energy envelope with peaks marked by note type for each 20 Hz note detected. Red dots indicate classic notes (type A), blue squares are backbeats (type B) and black diamonds mark unknown notes. (b) Spectrogram of the same note sequence (8192 points FFT, 4096 points Hanning Window, 98% overlap).
Jmse 11 02057 g001
Figure 2. Example of an analysis window from song 14 showing a 20 Hz note sequence with several pattern alternations.
Jmse 11 02057 g002
Figure 3. PSD spectra of the medians of type A and type B notes estimated over all detected songs and sequences.
Jmse 11 02057 g003
Figure 4. Duration and distribution of all detected sequences (S1 to S28) over time (24 h format). Unknown call sequences are shown as black bars, patterned songs and irregular sequences are shown as green and as red, respectively.
Jmse 11 02057 g004
Figure 5. Histograms binned at 0.5 Hz resolution, showing the frequency distribution in Hz for both patterned songs (PS) and irregular sequences (IS) of: (a) frequency peak (Fp) of all type A notes; (b) Fp type B notes; (c) 3 dB bandwidth of type A notes; (d) 3 dB bandwidth of type B notes. Dark blue areas represent the overlap between the distributions of PSs and ISs.
Jmse 11 02057 g005
Figure 6. Violin plot based on kernel density estimation (bandwidth 0.3 s) showing the time distribution (in seconds) of the INIs corresponding to type pairs A–A (long and short), B–A, A–B and B–B for each patterned song. In the plot, the red lines indicate the median values. The vertical dashed lines separate different songs.
Jmse 11 02057 g006
Figure 7. Percentage of occurrence of the different patterns found in each PS. Simple doublet “B–A–B” is shown in blue bars, short triplet “B–A–AS–B” in orange, complex short “B–(A–AS)n–B” in green and complex long “B–(A–AL)n–B” in yellow.
Jmse 11 02057 g007
Table 1. Table showing the date, start time (24 h format) and duration (min) of each detected call sequence identified by the abbreviation “Song ID”. Total number of notes and number of notes for each type are also presented for each song.
Song IDDateDur [min]StartNotesType AType BUnknown
S1July-021012:307430
S2August-14_124013:002271174763
S3August-14_25021:104229130
S4August-153002:3010361
S5August-162022:4015870
S6August-1722002:4015597553
S7August-294011:203110417
S8August-307002:5018549
S9September-24_122011:30160373885
S10September-24_212018:20123481956
S11October-24_18003:509743522
S12October-24_22012:107430
S13October-283016:20202117
S14February-2127001:1039022614618
S15February-26_12010:4013067
S16February-26_24016:30400040
S17February-26_36022:20436532
S18March-04_12001:20164120
S19March-04_211004:509951480
S20March-04_310010:5010616981
S21March-04_417015:301045792
S22March-052001:50182016
S23March-097014:30720072
S24March-304015:20232318
S25April-072022:104040
S26April-12_18008:2073171343
S27April-12_221018:103329763172
S28May-043009:005014
Sum 2410 2250787535928
Table 2. Summary statistics of all INI values found between 0 and 100 s for each type pair in patterned songs. “N” indicates the number of samples (INIs) used for the analysis. SE is standard error, SD is standard deviation, IqR is interquartile range.
A–ASA–ALA–BB–AB–B
N2226523224963
Mean15.4035.9422.7917.9234.30
SE0.121.780.910.552.41
Variance2.98205.62192.4975.80367.03
SD1.7314.3413.878.7119.16
Median15.5132.8017.9015.7526.86
25 percentile15.0831.7717.4315.2625.10
75 percentile16.0434.0018.8016.3634.45
IqR0.962.231.381.109.34
Table 3. Summary statistics of all INI values found between 0 and 100 s for each type pair in irregular sequences. “N” indicates the number of samples (INIs) used for the analysis. SE is standard error, SD is standard deviation, IqR is interquartile range.
A–ASA–ALA–BB–AB–B
N844402326
Mean14.2235.0137.1926.8335.58
SE1.141.824.942.612.87
Variance10.40146.30561.38177.07329.78
SD3.2212.1023.6913.3118.16
Median14.0129.7827.7226.7127.99
25 percentile11.8327.2026.4015.6326.76
75 percentile16.2235.6950.0029.0234.24
IqR4.398.4923.6013.397.47
Table 4. Percentage frequency (%) of INI type pairs in patterned songs (PS) and irregular sequences (IS).
PSIS
S2S6S11S14S26S27S3S9S10S19
A–AL24.4940.0022.9529.7621.0525.5522.580.000.000.00
A–AS23.475.450.002.980.002.1912.9016.6745.950.00
A–B21.4310.9118.0327.9842.1132.8525.8123.3310.8126.67
B–A26.5329.0916.3930.0636.8435.0422.5823.3313.5120.00
B–B4.0814.5542.629.230.004.3816.1336.6729.7353.33
Table 5. Descriptive statistics of peak frequency (F peak) and 3 dB bandwidth values for type A and B notes in both PS and IS. “N” indicates the number of samples (calls) used for the analysis. SE is standard error. Min and max, respectively, indicate the minimum and maximum values that occurred in the distribution. Mean, median, min and max values are expressed in Hz.
F Peak3 dB Bandwidth
Type AType BType AType B
PSISPSISPSISPSIS
N10810874741081087474
Mean20.8220.2119.5919.652.722.522.312.04
SE0.080.090.050.070.090.110.210.16
Median20.7519.7819.5319.532.442.081.711.71
Min19.2918.0719.0418.071.460.980.730.73
Max23.9323.9320.7522.955.866.598.796.10
Disclaimer/Publisher’s Note: The statements, opinions and data contained in all publications are solely those of the individual author(s) and contributor(s) and not of MDPI and/or the editor(s). MDPI and/or the editor(s) disclaim responsibility for any injury to people or property resulting from any ideas, methods, instructions or products referred to in the content.

