Article

Dynamic Characteristics of an Underwater Ventilated Vehicle Exiting Water in an Environment with Scattered Ice Floes

State Key Laboratory of Structural Analysis, Optimization and CAE Software for Industrial Equipment, School of Naval Architecture, Dalian 116024, China
*
Author to whom correspondence should be addressed.
J. Mar. Sci. Eng. 2023, 11(11), 2046; https://doi.org/10.3390/jmse11112046
Submission received: 21 September 2023 / Revised: 9 October 2023 / Accepted: 10 October 2023 / Published: 25 October 2023
(This article belongs to the Section Ocean Engineering)

Abstract

:
The presence of ice floes on the water surface has a significant impact on the complex hydrodynamic process of submersible ventilated vehicles exiting the water. In this paper, we propose numerical simulations based on computational fluid dynamics to investigate the process of a ventilated vehicle exiting water in an ice-water mixture. The Schnerr–Sauer model is used to describe the cavitation, while the turbulence is solved by using the k-ω shear stress transport (SST) model. We also introduce the contact coupling method to simulate the rigid collision between the vehicle and the ice floe. We calculated and analyzed the process of the vehicle exiting the water under three conditions: ice-free conditions and in the presence of regularly shaped and irregularly shaped ice floes. The findings indicate that the ice floes contributed to the rapid fragmentation of the water plume to induce the premature collapse of the ventilated cavity and alter its form of collapse. The presence of ice floes intensified the evolution of the flow field close to the vehicle, and their flipping led to a significant volume of splashing water that could have led to the localized secondary closure of the cavity. Moreover, the collision between the vehicle and the ice floes caused pressure pulsations on the surface of the former, with a more pronounced effect observed on the head compared with the cylindrical section. While crossing the ice-water mixture, the vehicle was exposed to water jets formed by the flipping ice floes, which might have led to localized high pressure.

1. Introduction

The gradual rise in global temperatures in recent decades has caused a rapid reduction in the volume of Arctic sea ice [1]. This has led, in turn, to the opening of Arctic shipping routes and the development of equipment for polar water exits. However, the complex nature of the polar environment poses daunting challenges for underwater vessels. When a ventilated vehicle crosses the free surface, the collapse of the shoulder-ventilated cavity significantly affects its posture and loading, a complex phenomenon of multi-phase flow [2]. Unlike the typical problem of water exit, the numerous ice floes on the surface of Arctic waters complicate the process for underwater vehicles. It is thus important to investigate the process of submersible vehicles traversing ice-water mixtures while exiting water. The work here provides an important reference for research on and the development of equipment for water exit in the polar environment.
Research on the problem of water exit has been ongoing for many years, and the relevant methods can be categorized into theoretical analyses, experimental research, and numerical simulations. Greenhow and Moyo [3,4] conducted numerical simulations on the nonlinear trans-medium motion of cylinders and showed good agreement with the experiment. Liu et al. [5] and Chu et al. [6] used numerical simulations to investigate the water exit process of a cylinder and successfully capture the evolution of the cavity, respectively. Wang et al. [7] and Chen et al. [8] examined the collapse of the cavity during water exit and analyzed its effects on structural vibrations and pressure-induced loads. The accuracy and speed of numerical simulations have significantly increased with advances in computational technology in recent years. Qin et al. [2] used simulations to investigate the evolution of a ventilated cavity in the presence of waves, and their results showed that the waves had a weak effect on the cavity at the nodes but a significant influence at the crests and valleys. Chen et al. [9,10] numerically investigated the structure of flow and the characteristics of pressure of a vehicle exiting water and provided a detailed analysis of the turbulent vortical structures with and without cavitation. They also examined cavitation shedding and pressure pulsations caused by the evolution of the cavity as the vehicle exited the water. Zhang et al. [11] numerically analyzed the problem of a cylinder exiting water and concluded that collapse of the cavity leads to pressure fluctuations on the wall of the cylinder as well as in the surrounding water. Nguyen et al. [12] conducted numerical simulations of the process of a projectile exiting water to examine the characteristics of growth, shedding, and collapse of the cavity under the influence of the free surface. Gao et al. [13,14] used a model of the improved, delayed detached eddy simulation (IDDES) to study the structure of cavitation-induced flow, the structure of the vortex on the wall, and the loading characteristics of vehicles during their exit from water, with a focus on analyzing the mechanism of evolution of cavitation-induced flows. Wang et al. [15] numerically studied the high-speed process of water exit of a supercavitating projectile at various attitude angles and investigated the characteristics of cavity collapse and the impact of different attitudes on it. Ni and Wu [16] theoretically examined the problem of the exit of a fully submerged floating body based on velocity potential flow theory while analyzing the characteristics of motion of objects with different shapes and densities during the exit process. Korobkin et al. [17] proposed a weakly nonlinear model of water exit that considered certain nonlinear terms in Bernoulli’s equations for the hydrodynamic pressure and the shape of the object. Their results showed that this model could more accurately predict the loads on the object than linear models. Furthermore, many researchers [18,19,20,21,22,23] have set up experimental platforms to investigate the phenomenon of cavitation during the process of water exit, the morphology of the ventilated cavity, the deformation of the free surface, the movement of the vehicle, and the characteristics of load and have reported satisfactory results. A considerable amount of research [24,25,26,27,28,29,30] has also been devoted to the ventilated cavity of underwater vehicles. Most of the relevant work has involved experiments and numerical simulations on circulating water holes, with the aim of comprehensively analyzing the structure of cavitation-induced flow and the loading characteristics of the vehicle. The above studies provide an important foundation for further research on the problem of water exit. However, they have all considered a pure water environment and have not dealt with the exit of objects from a complex water surface in the presence of ice floes.
The presence of sea ice poses a significant challenge to vehicles exiting the water. A limited amount of research has been devoted to the entry of objects into and their exit from ice-water mixtures, with most relevant studies focusing on the interaction between ice and marine structures. However, these investigations have also provided valuable insights. Kim [31] used a numerical model to simulate the interaction between ice floes and marine structures to evaluate the fatigue-induced damage incurred by an icebreaker while navigating a fragmented ice field. Barooni et al. [32] proposed a suite of models of ice-induced load to study the dynamic response of offshore floating wind turbines in the presence of sea ice in cold regions. Guo et al. [33] used numerical simulations and experimental methods to predict the resistance of a container ship to ice with different densities, and Zambon et al. [34] used a combination of experiments and numerical simulations to investigate the correlation between the conditions of sea ice and ice-induced torsional excitation on the propellers of marine vessels. Wang et al. [35,36] performed numerical simulations on a projectile passing through an ice-water mixture at low and high velocities and showed that the presence of ice floes altered the mode of formation and evolution of the cavity, such that this influenced the hydrodynamic and ballistic properties of the projectile. Hu et al. [37] examined the process of a projectile passing through an ice hole on the surface of water at a high speed under different ambient temperatures and showed that the ice hole affected the evolution of the cavity. Ren and Zhao [38] simulated a rigid sphere entering water through an ice sheet to analyze the expansion of cracks in the ice, the evolution of the flow field, and the characteristics of motion of the sphere. Cui et al. [39] simulated the high-speed entry of a projectile into water in the absence of ice as well as in the presence of ice with varying thickness and analyzed the evolution of the cavity as well as the formation and expansion of cracks in the ice cap. Sun et al. [40] experimentally investigated the evolution of the cavity and the characteristics of motion of a vehicle during its exit from water in an environment with floating ice. The results showed that the cavity exhibited strong nonstationary characteristics during the exit of the vehicle from the water due to the influence of the ice. You et al. [41] numerically investigated the evolution of the cavity of a cylinder during its exit from water in a zone containing broken ice. The results showed that the broken ice primarily influenced the shape of the cavity while also impacting the displacement and cornering behavior of the cylinder.
In summary, prevalent research on the characteristics of motion of trans-medium vehicles in the presence of ice floes is inadequate, and refined numerical studies to analyze the problem in the context of a microscopic flow field during the exit of a vehicle from water are lacking in particular. In light of this, the authors of this study apply the computational fluid dynamics (CFD) method to simulate the process of a vehicle exiting water in a low-temperature environment in the presence of ice floes. Both the vehicle and the ice floe are treated as rigid bodies while considering their collision. Three free-surface conditions—ice-free conditions ( I c e f r ); conditions involving the presence of regularly shaped ice floes ( I c e r e ); and irregularly shaped ice floes ( I c e i r )—were simulated; with a focus on examining the evolution of the cavity; the characteristics of the flow field; and the motion and load characteristics of the vehicle. The remainder of this paper is structured as follows: Section 2 details the numerical methods used and the corresponding setup of the computational model; Section 3 analyzes the computational results. We investigate the effects of ice floes on the evolution of the flow field, the kinematic parameters of the vehicle, and the characteristics of the load. Section 4 summarizes the conclusions of this study regarding the mechanism of influence of ice floes on a vehicle exiting water.

2. Numerical Method and Computational Details

2.1. Governing Equations

The exit of the vehicle through the ice-water mixture involves the collapse of the ventilated cavity, a large deformation of the free surface, and collision, and thus is a complicated process. Reassuming the incompressibility of both water and air, the main governing equations can be expressed as follows:
ρ m t + ρ m u i x i = 0 ,
ρ m u i t + ρ m u i u j x j = P x i + μ m x j u i x j + u j x i + ρ m g i ,
where t is time, ρ m is the density of the fluid, u i is the component of velocity of the fluid, μ m is the coefficient of dynamic viscosity of the mixture, P is pressure, and g i is gravitational acceleration.
To accurately capture the deformation of the free surface, the volume of fluid (VOF) method is used in the numerical simulations. It describes the phase distribution and the location of the interfaces based on the phase volume fraction, α i , which is defined as follows:
α i = V i V ,
where V i is the volume of phase i in the grid cell, and V is the volume of the grid cell.
The volume fraction of all phases in the grid cell is one,
i = 1 N α i = 1 ,
where N is the total number of phases.
The distribution of phase i is driven by the equation of the conservation of mass of the phase:
t V α i d V + A α i v · d a = V S α i α i ρ i D ρ i D t d V V 1 ρ i · ( α i ρ i v d , i ) d V ,
where a is the vector of the surface area, v is the mixing (mass-averaged) velocity, v d , i is the velocity of diffusion, S α i is the source term for phase i, and D ρ i / D t is the material or Lagrangian derivative of the phase density ρ i .
We used the k-ω shear stress transport (SST) turbulence model, which is widely used in engineering. It was proposed by Menter [42] and uses a mixing function to combine the k-ε model in the far field with the k-ω model on the near-wall surface. The equations of transport of the turbulence kinetic energy, k, and the rate of turbulence dissipation, ω, are given as follows:
t ρ k + · ρ k v = · [ ( μ + σ k μ t ) k ] + P k ρ β * f β * ( ω k ω 0 k 0 ) ,
t ρ ω + · ρ ω v = · [ ( μ + σ ω μ t ) ω ] + P ω ρ β f β ( ω 2 ω 0 2 ) ,
where v is the mean velocity, μ is dynamic viscosity, σ k and σ ω are correlation coefficients of the model, and both have a value of 0.5. P k is a parameter that considers turbulence, buoyancy, and nonlinearities, and P ω is a parameter that considers the terms of unit dissipation and cross-diffusion. β * and β are model coefficients, with β * = 0.09 and β = 0.072, f β * is the free-shear correction factor, f β is the eddy extension correction factor, and k 0 and ω 0 are ambient turbulence values that prevent turbulent decay.
The Schnerr–Sauer cavitation model [43] is a pioneering model of cavitation-induced mass transport that eliminates the need for empirical constants. It is based on the simplified Rayleigh–Plesset equations while disregarding acceleration in the growth of bubbles, viscous effects, and the effects of surface tension. The rate of growth of the cavitation bubble is characterized by using an inertia-controlled model:
v r 2 = 2 3 p s a t p ρ l ,
The source terms in this model are as follows:
m ˙ + = ρ v ρ l ρ m α v 1 α v 3 R 2 3 p p s a t ρ l ,                     p > p s a t m ˙ = ρ v ρ l ρ m α v 1 α v 3 R 2 3 p s a t p ρ l ,             p p s a t ,
where p s a t is the saturation vapor pressure associated with the phase transition in cavitation, p is the pressure of the surrounding liquid, ρ l is its density, m ˙ + is the source term for evaporation, and m ˙ is the source term for condensation.

2.2. Contact Coupling Method

To realistically simulate the collision between the vehicle and ice floes, we use the contact coupling method to calculate the collision between rigid bodies. In previous studies, the majority of scholars have employed either CFD-DEM or CFD-FEM coupling methods [44,45,46,47,48,49] for simulating collision problems. However, these methods introduce complexity to the simulation process. For addressing the research problem in this paper, adopting a contact coupling method is a favorable choice as it enables rigid body collision simulation solely using the CFD method, eliminating the need for additional methodological couplings and significantly streamlining the simulation process.
Contact coupling prevents boundaries associated with rigid bodies from coming into contact with each other by applying a contact force based on the distance between them. If the distance between boundary surfaces exceeds an effective range, no contact force is applied; otherwise, a repulsive force is applied. The contact force on the boundary surface f can be expressed as follows:
f f = f n + f t ,
where f n is the normal component of force that prevents contact, and f t is its tangential component that characterizes friction.
The normal component f n of the contact force can be expressed as:
f n d f = a f k 1 d 0 d f k 2 d f ˙ n b f ,
where k 1 is the coefficient of elasticity, k 2 is the damping coefficient, a f is the area of the face mesh, d f is the distance between the center of the face and the relative boundary, d 0 is the range of validity, and n b f is the normal direction of the boundary surface next to the face f .
The coefficients of elasticity k 1 and damping coefficient k 2 are crucial for calculating the process of collision and are defined as follows:
k 1 = m 1 m 2 m 1 + m 2 1 A v n 2 d 0 d m i n 2 ,
k 2 = 2 ς ( m 1 m 2 ) k 1 m 1 + m 2 A ,
where m 1 and m 2 denote the masses of the two rigid bodies in contact, A is the estimated area of contact between them, v n is the normal relative impact velocity of the coupled objects, d m i n is the minimum distance between them, and ς is a constant factor describing the amount of damping.
The tangential component f t of the contact force can be expressed as:
f t = μ | f n | tanh k t v t ,
where μ is the coefficient of friction, k t is the tanh coefficient, and v t is the relative tangential velocity.

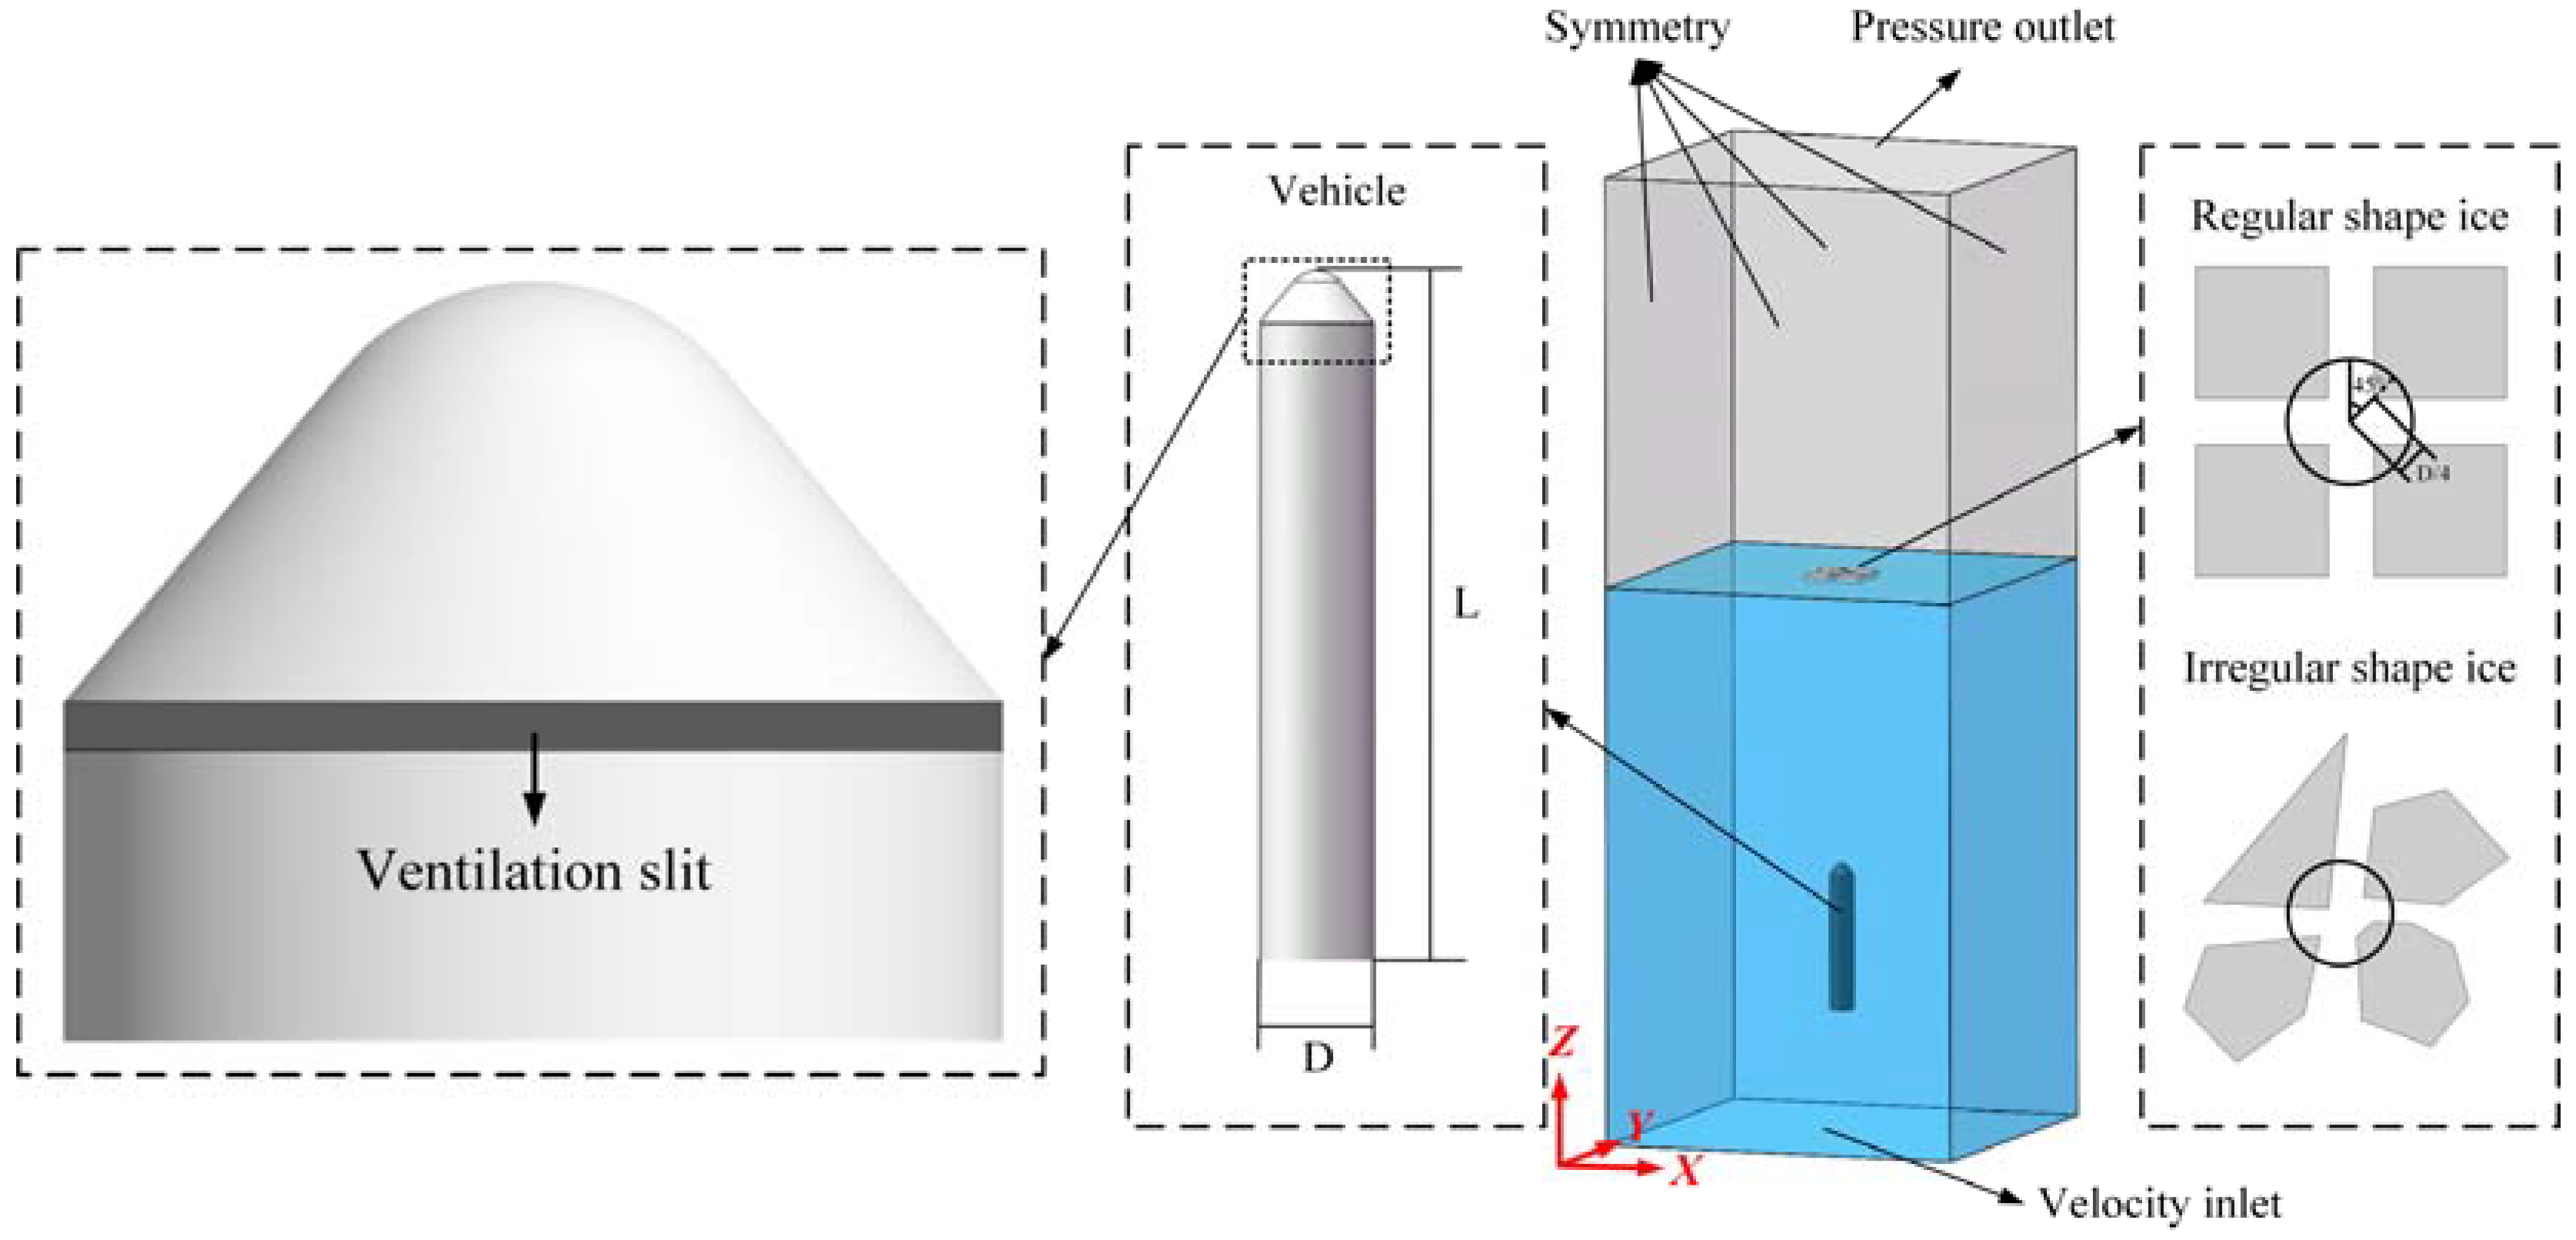
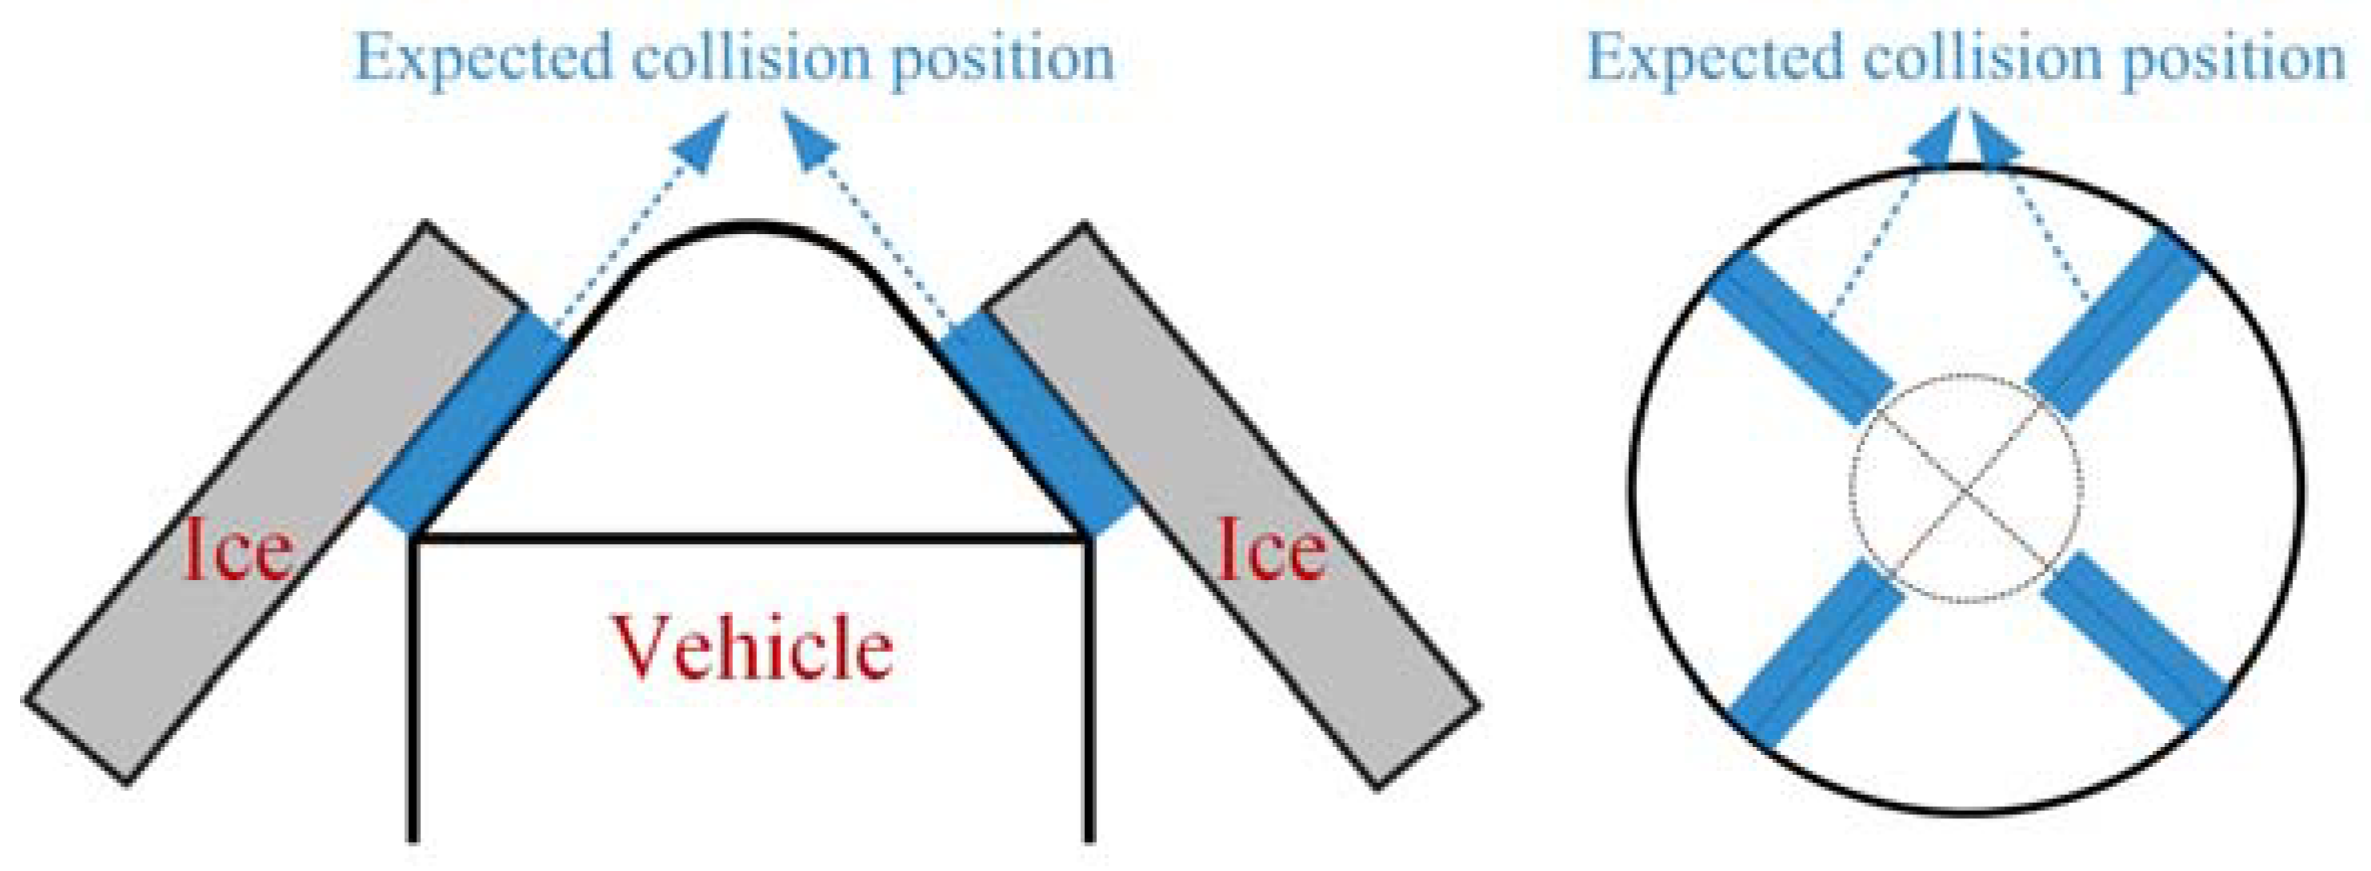
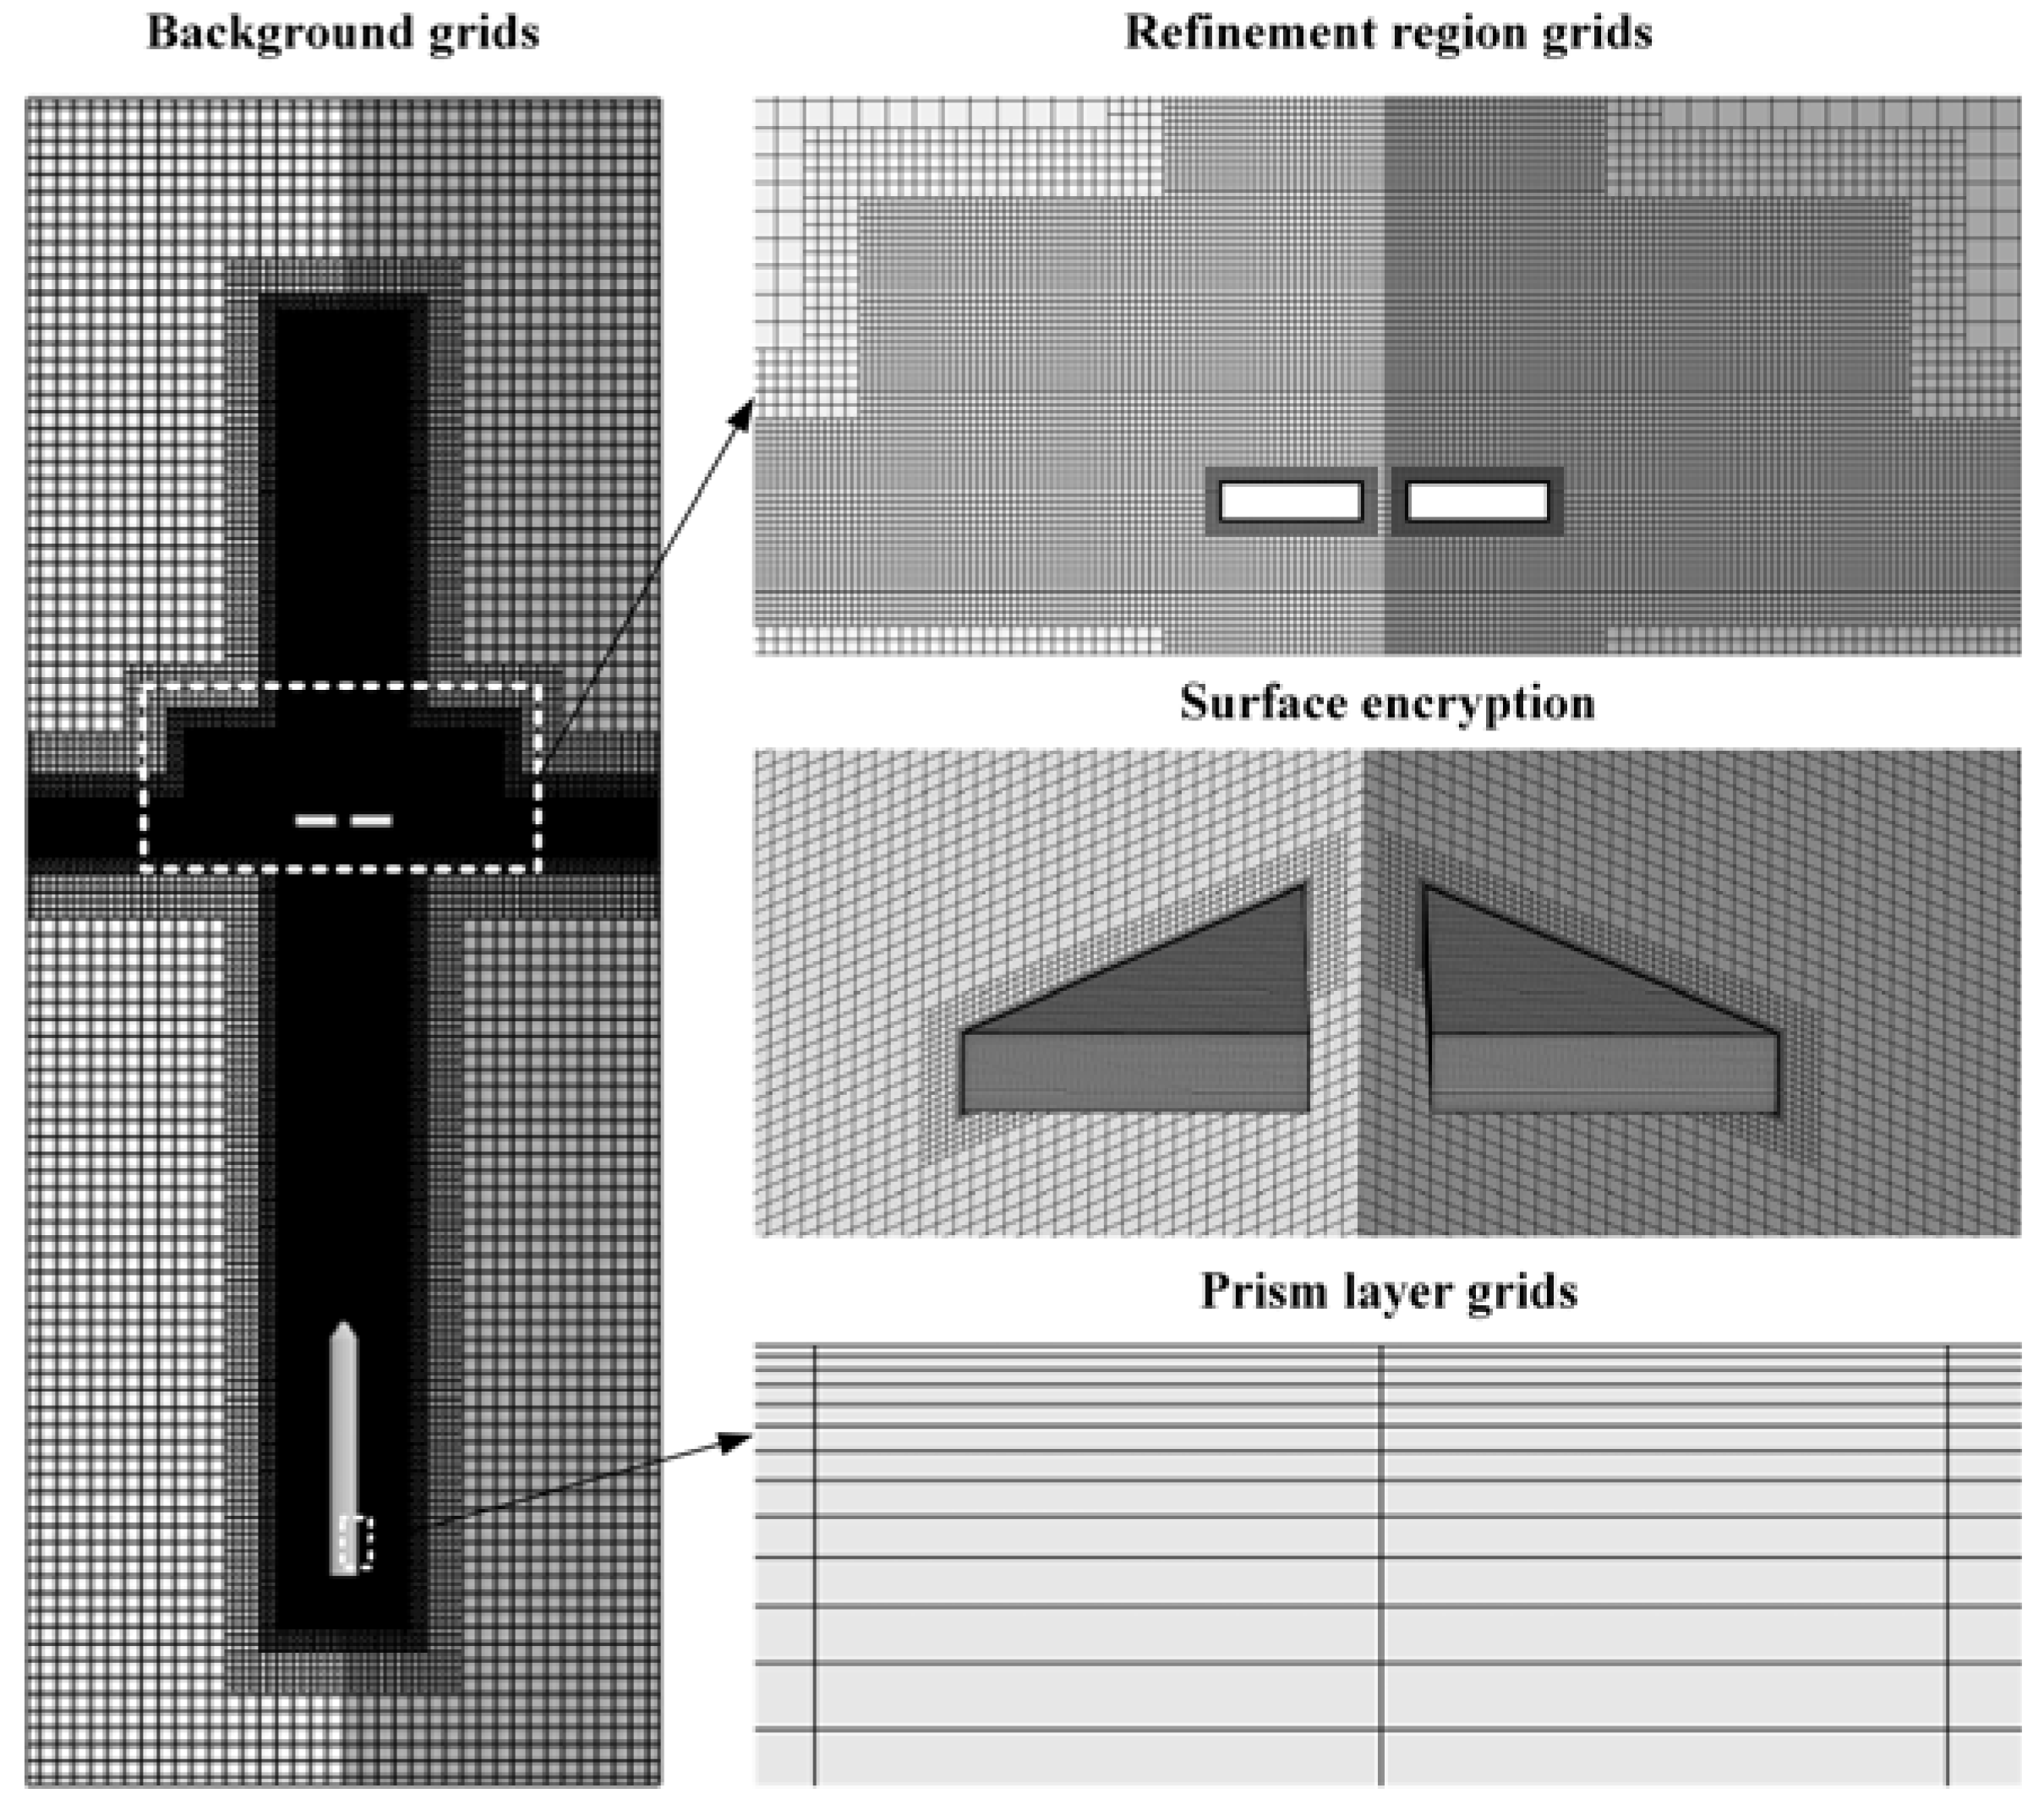
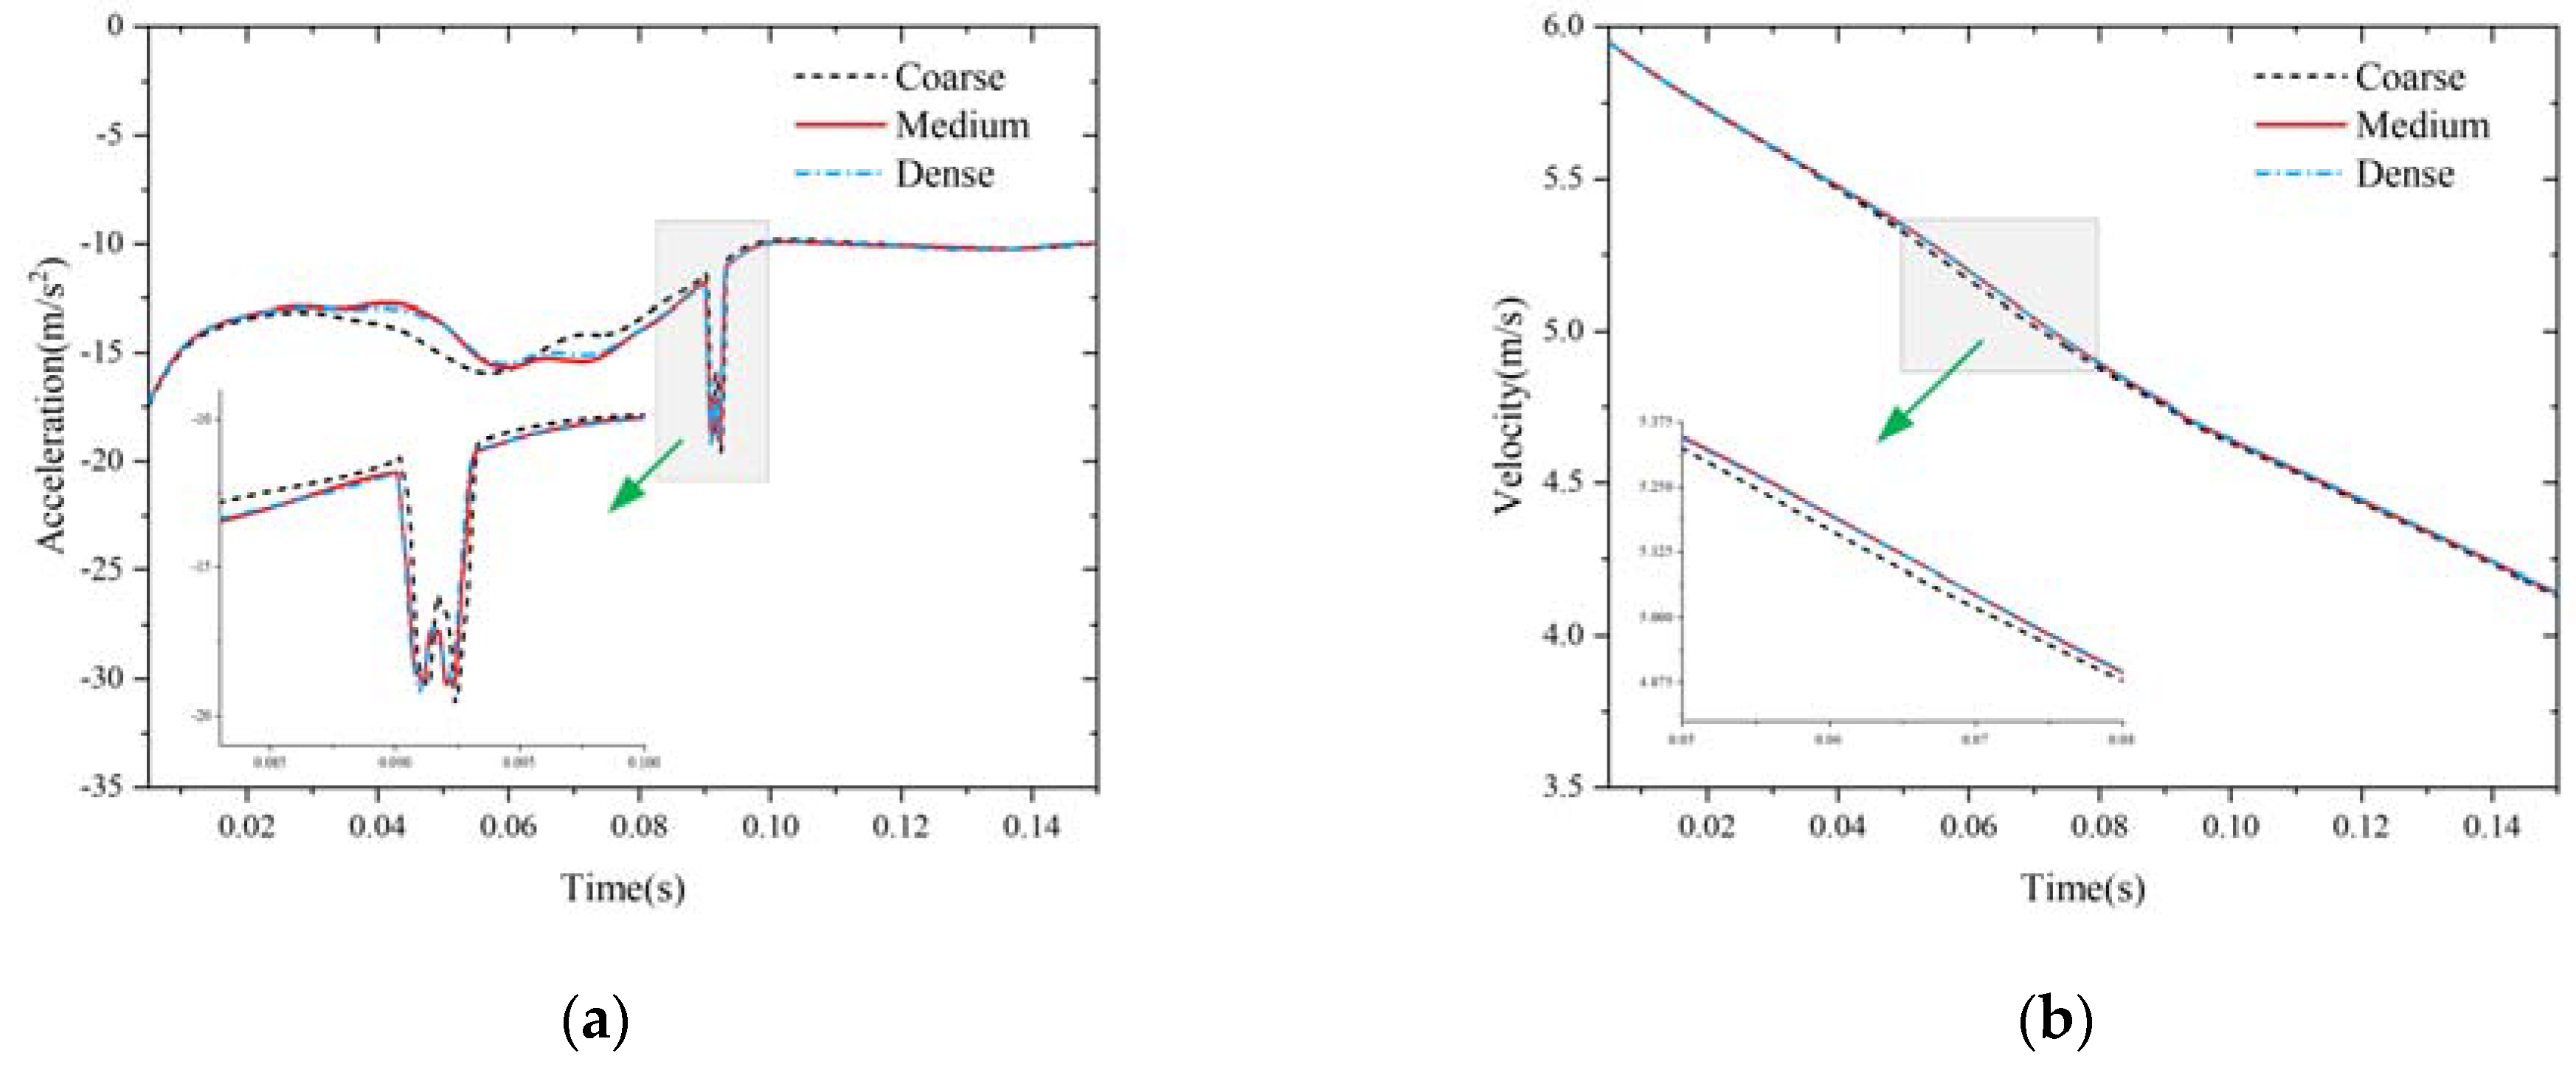
2.3. Numerical Setup

Figure 1 shows the setup of the computational domain and the model. The vehicle was assumed to be a rotating structure with a length L = 0.243 m, a diameter D = 0.04 m, and a ventilation slit s = 0.002 m at the shoulder. The computational domain was partitioned into two regions and had a total height of 40D and a width of 15D. Water occupied the lower region at a depth of 23D, while the upper region contained air at a height of 17D. The bottom of the vehicle was initially situated 18D below the free surface. The bottom of the computational domain was set as the velocity inlet and its top as the pressure outlet, and the remaining four sides were set as symmetric boundary conditions to eliminate the influence of the wall. The ice floes were classified according to their distribution into regular and irregular floes and were oriented parallel to the free surface while maintaining equilibrium in the initial moment. The regular-shaped ice floe serves as a means to investigate the fundamental mechanism of interaction between vehicle and ice, whereas irregular-shaped ice is more representative of the physical state and holds broader significance. The top view revealed that the regular ice floe comprised four identical square blocks of ice, each with a side length of D. Similarly, the irregular ice floe consisted of four blocks and ensured that it had an equivalent total area to that of the regular ice floe. Furthermore, the density of ice was 900 kg/m3, and its thickness was set to 0.25D. Furthermore, Figure 2 illustrates the anticipated collision position between the vehicle and ice floes, with no inter-collision among the ice floes. Although there might be some deflection in the vehicle’s trajectory during movement, the collision position is not expected to deviate significantly.
We assumed that both the vehicle and the ice floes were rigid structures, which means that they did not undergo deformation or sustain any damage. The initial launch velocity of the vehicle was 6 m/s, and it was directed along the positive Z-axis. The vehicle began moving with the shoulder ventilated outward, and this was defined as t = 0 s. Furthermore, to prevent the instability of the flow field from prompting an abrupt increase in the velocity of the vehicle from 0 to 6 m/s at the initial moment, we used a buffer of 0.005 s, during which the force acting on the vehicle gradually increased. This approach minimized the potential impact of the initial moment on the results of the calculations. Owing to the frigid temperatures in the Arctic region, we set the saturation vapor pressure of water to 610 Pa, which corresponded to its value at 0 °C, to accurately simulate the process of the vehicle exiting water.
The meshing scheme used for the numerical calculations is shown in Figure 3. To optimize the computations and minimize the total number of grids, we used a coarse grid size in the far field while applying finer refinements within the trajectory of the vehicle, the free surface, the region of collision, and the structural surfaces to accurately capture details of the flow field. We used the overlapping mesh technique and the DFBI model to simulate the motion of the vehicle. The maximum size of the mesh of the overlapping region was maintained such that it was equal to that of the mesh of the encrypted region in the background mesh. To ensure that the y+ values of the wall satisfied the requirements of the model of turbulence, we used the prismatic layer mesh to capture flow along the boundary layer, with 12 prismatic layers used for the vehicle and six layers for the ice floe. The time step of the calculations was 0.0001 s.
To reduce the influence of the grid size on the numerical results, we used grids with three densities for the calculations by using I c e r e as an example. The total number of meshes for the three meshing schemes is given in Table 1. Figure 4 shows a comparison of the vertical acceleration and velocity of the vehicle calculated by using grids of different densities. The computational results obtained when using the medium and coarse meshes exhibited a substantial disparity, as is evidenced by their curves. However, there was no significant variation in the computational outcomes as the number of meshes increased. The results of calculations obtained when using both medium and dense meshes demonstrated excellent agreement within the locally enlarged area. We thus used a mesh with a medium density for our calculations.

2.4. Validation of the Numerical Method

The physical processes involved in the problem considered here are highly complex and include a large deformation of the free surface, evolution of the ventilated cavity, and vehicle-ice floe interactions. It is important for the numerical model to accurately represent these phenomena. We compared our method with prevalent techniques to verify its accuracy.

2.4.1. Validation of the VOF Method

To validate the capability of the VOF method used in this study to capture the deformation of the free surface, we established a numerical model similar in structure to experiments conducted by Hou et al. [50]. The relevant settings of the numerical model were set to be identical to those of the experiments. The length of the cylinder was 0.197 m, its diameter was 0.05 m, its weight was 1.06 kg, the Froude number was Fr = 6.21, the corresponding entry velocity was 4.35 m/s, the entry angle was θ 0 = 60 ° , and the ambient pressure was set to 101,325 Pa. The results of the comparison are shown in Figure 5 and reveal a remarkable agreement between the simulation and the experiment in terms of the evolution of the cavity during the entry of the cylinder into water. We can conclude that the VOF method can accurately capture the dynamic evolution of free surfaces during the trans-medium motion of objects.

2.4.2. Validation of the Evolution of Ventilated Cavities

We also validated the plausibility of the evolution of the ventilated cavity by constructing a numerical model identical to that used in the experiments by Liu et al. [25]. The experiments had been conducted in a high-speed water tunnel by using a vehicle with a diameter of D = 0.02 m and a length of L = 0.126 m. Assuming a consistent numerical calculation setup with the experiments, we conducted calculations for each of the three angles of attack (0°, 5°, and 8°) at Froude number Fr = 15.66 and the gas entrainment coefficient C Q = 0.06. The comparison between the numerical and experimental results is shown in Figure 6, with the experimental images at the top and the numerical results at the bottom. The calculated results show that the morphology and dimensions of the cavity are in good agreement with the experimental results. Consequently, these findings demonstrate the plausibility of the ventilated cavity simulation method proposed in this study.

2.4.3. Validation of Contact Coupling Method

The application of the contact coupling method is seldom observed, thus necessitating a thorough validation of its rationality. We developed a numerical model to simulate the collision between a block of ice and a cylinder to validate the proposed method, as shown in Figure 7. The numerical results were compared with experimental data reported by Zhang et al. [49] In this case, the block of ice was a 0.15 m × 0.15 m × 0.08 m rectangle and was composed of polypropylene so that it did not break down. The diameter of the cylinder was 0.14 m, and it was fixed in the water. The distance between the ice block and the cylinder was 1.2 m at the outset, the velocity of water flow was 0.307 m/s, and the ice block began moving from rest toward the cylinder under the action of the flow of water. The numerical setup accurately reflected the experimental conditions, and we assumed d 0 = 0.004 m in the contact coupling algorithm. This means that repulsive contact force began when the distance between the ice block and the cylinder was shorter than or equal to 0.004 m. Figure 8 shows a comparison between the results of the simulation and the experiments in terms of the velocity and displacement of the ice block. The first collision between the ice block and the cylinder occurred at 0 s, and the former then immediately gained velocity in the opposite direction, with a relative error smaller than 10% in its peak velocity. Although the curve of velocity incurred a slightly larger error in the case of the second collision, the trend was basically consistent. As we did not consider multiple collisions in this study, the contact coupling algorithm was deemed suitable for our purposes here.

3. Results and Discussion

3.1. Effect of Ice Floes on the Evolution of Ventilated Cavities

The evolution of the ventilated cavity along three dimensions during the exit of the vehicle from the water under the three conditions considered here is shown in Figure 9. The process of the vehicle exiting water was analyzed in two distinct phases: the phase of underwater navigation by the vehicle and the phase of it crossing the free surface. Figure 9a shows the evolution of the ventilated cavity of the vehicle under the ice-free condition. The vehicle was in the underwater navigation phase during 0–0.09 s, and its ventilated cavity was gradually formed as a result of the continuous venting of gas. When the vehicle was submerged, this cavity developed in two stages. During initial motion, it rapidly expanded downward with a stable morphology and a relatively smooth surface. As its velocity decreased and a re-entrant jet progressed along the surface of its body to connect with the external fluid at the shoulder of the cavity, the pressure distribution within it subsequently changed. This led to pulsations that destabilized it and caused multiple contractions and expansions on the surface of the ventilated cavity that induced a slight asymmetry and wrinkling. The findings of Shi et al. [51] align with our current research. At 0.09 s, the head of the vehicle had reached the free surface, which then became raised to form a prominent “water plume”. The vehicle then entered the phase of crossing the free surface. Under the ice-free condition, the free surface continued to rise as the vehicle ascended, the water plume became more prominent, and it persisted for a longer period to provide suitable protection for the ventilation cavity. The development of the water plume was inhibited when ice floes were present on the free surface, while the shoulder of the cavity was subjected to their crushing action. Once the head of the vehicle had crossed the free surface, the integrity of the water plume was rapidly destroyed by the ice floes, such that it lasted for a short time.
Figure 9b,c show that the patterns of evolution of the ventilated cavity remained consistent with those observed in the ice-free case during the underwater navigation phase, although they exhibited slightly distinct shapes. This discrepancy occurred mainly owing to the highly stochastic nature of the pressure pulsations induced by the re-entrant jet inside the cavity, which led to a certain stochasticity in its evolution. The influence of the ice floes on the ventilated cavity became apparent when traversing the free surface. On the one hand, direct interactions between the ice floes and the ventilated cavity occurred through extruding and rubbing actions; on the other hand, the impact between the ice floe and the vehicle caused the former to tip over, thus perturbing the nearby flow fields and indirectly affecting the behavior of the ventilated cavity.
To thoroughly analyze the impact of ice floes on the ventilated cavity during the passage of the vehicle through the free surface, we show magnified images of the morphology of the cavity at four specific times (t = 0.09 s, t = 0.105 s, t = 0.113 s, and t = 0.125 s) in Figure 10. At 0.09 s, the surface of water near the head of the vehicle was significantly elevated under condition I c e f r , and less significantly under conditions I c e r e and I c e i r . This suggests that the ice floes had an inhibitory effect on the formation of the water plume. By 0.105 s, although the free surface near the head of the vehicle in I c e i r continued to rise without breaking, fragmentation became evident at the top of the cavities in both I c e r e and I c e i r due to crushing and cutting by the ice floes. The fragmentation of the head of the ventilated cavity did not begin until 0.113 s under the ice-free condition, by which time about half of the ventilated cavity had collapsed due to the presence of ice floes. Different patterns of collapse were observed at 0.125 s: While the cavity in I c e f r contracted toward its center after collapsing and caused the bottom to be squeezed, the collapses under both I c e r e and I c e i r involved an outward expansion with an open aperture formed above, accompanied by substantial splashing of water. The top view in Figure 11 also shows that the area of collapse of the cavity was minimal under ice-free conditions. However, when ice was present on the free surface, the impact caused the ice floes to disperse in all directions, resulting in splashing of the surrounding water and a visibly sunken free surface below the ice floes. In addition, the holes created by the collapse of the cavities were significantly larger in this case. This phenomenon can be attributed to two factors: First, a water plume rising high broke up and compressed the cavity toward its center under ice-free conditions. Second, the presence of ice floes disrupted the effect of the squeezing of the water plume and led to an outward rotation of the ice floes that caused the cavity to expand into an open hole. These observations suggest that the ice floes not only caused the premature collapse of the ventilated cavity but also altered the form of its collapse.

3.2. Analysis of Unsteady Flow Field Structure

To further investigate the effects of the ice floes on the development of the ventilated cavity, we show a series of images of the distribution of the volume fraction of water on a two-dimensional (2D) oblique section (shown schematically in Figure 12) in Figure 13. A distinct re-entrant jet forms inside the cavity, with re-entrant jets on both sides displaying slight asymmetric features about the vehicle’s mid-axis and a degree of randomness. As the re-entrant jet ascended to a certain height along the surface of the vehicle, its velocity significantly decreased, and it began to deflect out of the cavity. At 0.12 s under I c e f r , the re-entrant jet connected with the fragmented water plume to cause the localized secondary closure of the cavity. A similar phenomenon was observed under I c e r e and I c e i r ; however, its causes differed from those under I c e f r . When the floes were overturned by the vehicles in both cases, some liquid under them moved to one side of the vehicle owing to the combined effects of the re-entrant jet and the consequent local secondary closure of the cavities. Furthermore, the distribution of the ice floes significantly affected the closure-related behavior of the cavity. Ice floes of identical shapes and sizes in I c e r e led to relatively similar evolutions of the flow field on both sides of the vehicle, where consistent spatiotemporal phenomena occurred to cause secondary closure. On the contrary, ice floes of different shapes and sizes in I c e i r led to the asynchronous spatiotemporal occurrence of secondary closures on both sides.
The presence of ice floes also introduced greater complexity and turbulence to the process of cavity collapse. Compared with I c e f r , the presence of ice floes on the free surface led to the accumulation of a substantial water-air mixture around the vehicle post-collapse in the other two conditions, primarily due to the movement of the ice floes. Moreover, both I c e r e and I c e i r featured rapid cavity collapses that subsequently led to significant depressions on the free surface near the vehicle. These depressions were influenced by the pattern of distribution of the ice floes, with symmetric depressions observed in I c e r e and noticeably asymmetric ones in I c e i r .
The collapse of the cavity was unsteady, and the vortical structure to some extent reflected the unsteady evolution of the flow field. Figure 14 shows images of the evolution of the 3D vortex structure as the vehicle crossed the free surface. It is plotted based on the Q-criterion of the iso-surface, where Q = 4000/s2. As shown in Figure 14a, the horizontal dashed line represents the position of the free surface, while the two inclined dashed lines represent the positions of the head and the tail of the vehicle. The vortex appeared mainly in the areas of the shoulder and the wake when the vehicle was underwater. The structure of the vortex in the shoulder agreed well with the morphology of the ventilation cavity, while the region of the wake featured an annular vortical structure that gradually shed away from the vehicle as it moved upward. As the vehicle crossed the free surface, the number of vortices around it increased owing to the violent interactions among multiple phases during the collapse of the cavity. The evolution of the vortices intensified in the presence of ice floes on the free surface. Figure 14b,c show that the vortex underwent explosive growth as the vehicle traversed through the ice-water mixture and rapidly surrounded the entire vehicle. This phenomenon can be primarily attributed to a substantial amount of liquid being splashed up by the flipped ice floes, along with the intricate and intense multi-phase flow surrounding the vehicle during rapid cavity collapse. Furthermore, the ice floes significantly influenced both the morphology and the distribution of the vortex structures and led to the generation of numerous fine-scale vortices near the free surface that were absent under ice-free conditions. I c e r e yielded a symmetric distribution of the vortex structures, while I c e i r yielded an asymmetric distribution, indicating that the even distribution of the ice floes played a crucial role in determining the distribution of the vortex structures. Moreover, it should be noted that the ice floes had a minimal impact on the morphology of the vortex on the tail of the vehicle as it shed below the free surface without interacting with the floes.
The ventilated cavity collapsed rapidly, and the details of flow near the free surface were crucial in this regard. Figure 15 shows images of the velocity vector of the flow field near the vehicle on a 2D oblique cross-section at various typical times. Owing to the upward movement of the re-entrant jet inside the cavity along the surface of the body, prominent regions of high-velocity flow were formed on both sides of the vehicle. However, the velocity of the re-entrant jet decayed over time, eventually leading to the collapse of the cavity and the disappearance of the regions of high-velocity flow. The regions of high-velocity flow on both sides of the vehicle owing to the re-entrant jet in I c e r e and I c e i r were similar to those in I c e f r . However, as it was overturned, the ice floe generated regions of high-velocity flow at locations adjacent to those where they had been formed before that exceeded the velocity of the re-entrant jet. Furthermore, this high-velocity jet moved toward the side of the vehicle and could impact the surface of its body to affect its load distribution.

3.3. Motion Features and Load Characteristics

Due to variations in the conditions on the surface of water, the ventilated cavity collapsed as the vehicle crossed the free surface at different times and in various forms, which had varying effects on the movement of the vehicle and the force on it. Figure 16 illustrates the vertical acceleration and velocity of the vehicle over time in all three cases. Changes in its acceleration during underwater navigation were consistent across all cases, with only slight differences observed around 0.05 s and 0.075 s due to variations in the morphology of the ventilated cavity. The vehicle came into contact with the ice floe at approximately 0.09 s, which led to an instantaneous increase in its acceleration and suggests that a significant impact force was exerted by the ice floe on the vehicle. The local magnification of the relevant location showed two sudden changes in acceleration, suggesting that more than one collision had occurred. The first peak of the change in acceleration in I c e i r was two times larger than before, while the second peak was comparable to the two peaks observed in I c e r e . This phenomenon can be attributed to variations in the size and relative position of the ice floe. The profiles of velocity and acceleration of the vehicle were intertwined because the velocity was derived by integrating the acceleration. The magnified region of the curve of velocity of the vehicle shows a slight decrease in it following collision with the ice floes owing to their obstructive influence. However, this reduction was not significant.
The ice floes on the free surface influenced the rotational characteristics of the vehicle in addition to its vertical kinematic characteristics. Figure 17 illustrates curves of the moment of the vehicle along the X- and Y-axes, with a pattern of change similar to that of the curve of its acceleration. The ice floes had a minimal impact on the vehicle during underwater navigation but had a dominant influence on its motion as it crossed the free surface. Significant differences in its moment occurred among the three cases at around 0.05 s due to the destabilization of the cavity. The latter was caused by the re-entrant jet rising to the shoulder of the vehicle and impacting its trajectory. However, this perturbation exhibited some random characteristics. At approximately 0.09 s, the vehicle collided with the ice floe and was subjected to a lateral force. Its moment thus underwent multiple abrupt changes in opposite directions within a brief interval, and each peak owing to these sudden changes had a different magnitude. If such changes in the moment occur simultaneously along different directions within a short period, they can significantly compromise the stability of motion of the vehicle.
The collapse of the ventilated cavity of the vehicle induced strong pressure pulsations that were intensified in the presence of ice floes on the free surface. The resulting pressure-induced loads on the surface of the vehicle had different characteristics. We analyzed these loads by establishing multiple points to monitor the pressure, as illustrated in Figure 12. The central point on the head was denoted by H0, while four radial circles of measuring points were denoted by H1, H2, H3, and H4. Each circle comprised 36 evenly spaced points. Moreover, four measurement points (B1, B2, B3, and B4) and two pressure-sensing lines (L1 and L2) were set on the cylindrical section of the vehicle. Figure 18 shows the variations in pressure at point H0. As the vehicle ascended to the surface of the water, its velocity gradually decreased, and this was accompanied by a corresponding decline in pressure. There was a momentary drop in pressure at the head of the vehicle beneath the ice floe following a collision, followed by a rapid recovery. The collision between the vehicle and the ice floe led to an instantaneous transfer of momentum, which led to the sudden outward flipping of the ice floe. This disturbance subsequently affected the nearby flow field and led to a localized reduction in pressure.
To further analyze the distribution of pressure at the head of the vehicle, Figure 19 shows radar maps of it in the four circles of measuring points at 0.09 s. The pressure distribution at the head of the vehicle was highly uniform in the ice-free case, while localized reductions in pressure were evident in the cases in which ice floes were present. This phenomenon was more pronounced in I c e i r than in I c e r e , which can be attributed to the distribution of the ice floes. Moreover, the drop in pressure became increasingly pronounced at the top of the vehicle and decreased near its bottom.
The variations in pressure at the four measurement points on the cylindrical section of the vehicle are shown in Figure 20. Each curve exhibited a prominent high-pressure peak, with the magnitude of the pressure increasing as the measurement points approached the bottom of the vehicle. A comparison of the morphology of the cavity at the moment of peak pressure shows that the ventilated cavity precisely corresponded to the position of the corresponding measurement point at this time. The close correlation between the length of the cavity and the time of the occurrence of the peak pressure at the measurement point was evident. The time taken for the cavity to attain this length can be deduced from the data on pressure at the monitoring points, while information from multiple monitoring points enabled us to determine the length of the cavity at any given time. Furthermore, significant pulsations in pressure were observed at the four points due to the development of the re-entrant jet within the cavity. For instance, as shown in Figure 20a, at approximately 0.04 s, the re-entrant jet established a connection with the external fluid at the shoulder of the cavity, leading to a subsequent decrease in pressure at point B1. The jet ascended in the vicinity of the shoulder of the vehicle at approximately 0.06 s, accompanied by a minor peak in pressure at point B1. At 0.075 s in Figure 20c, the re-entrant jet in I c e i r rose close to point B3 and caused an abrupt change in pressure. The re-entrant jet had a strong, repetitive, and stochastic influence and caused the pressure-induced loads on the surface of the vehicle to exhibit pronounced characteristics of pulsation.
The collision not only influenced the pressure-induced loads at the head of the vehicle but also altered them on its cylindrical segments. Figure 20b shows that when the vehicle encountered ice floes in I c e r e and I c e i r , there was a slight oscillation in the pressure-induced load at point B2, and a similar behavior was observed at the other points. The amplitude of the oscillations decreases with the drop of the measurement point, indicating that the collision between the vehicle and the ice floe had a greater impact on pressure-induced loads at the front of the vehicle than at other locations. As the vehicle crossed the free surface (t > 0.09 s), the presence of the ice floes led to slightly higher pressures at all four measuring points compared with those in the ice-free scenario, with point B4 exhibiting the most significant increase. As shown in Figure 20d, a comparison of the information on the flow field among the three cases at 0.11 s shows that the relative pressure of the ice floe and the vehicle was higher in cases involving the presence of ice floes than in the ice-free case. This phenomenon primarily arose due to the impact of liquid swirling up against the surface of the vehicle due to the ice floe.
We also extracted the distributions of pressure from monitoring lines on both sides of the vehicle for comparative analysis and show curves of the pressure distribution along the line at four typical times in Figure 21. A localized region of high pressure was observed at the bottom of the cavity and corresponded to a significant peak in the curve of pressure. However, due to the instability of the cavity, the size of this peak varied across the cases considered. Moreover, a secondary peak appeared at the base of the cavity, as shown in Figure 21a; however, its magnitude was significantly smaller than that of the primary peak. When the ventilated cavity collapsed, the flow field around the vehicle became turbulent, leading to substantial fluctuations in pressure and changes in the distribution of the pressure-induced load on its surface. This in turn led to fluctuations in the curves of the distribution of pressure at 0.110 s, 0.115 s, and 0.120 s in the latter half of the profile. The fluctuations in pressure were more pronounced under I c e r e and I c e i r . As shown in Figure 21b, the pressure on a section of the surface of the vehicle in I c e r e was significantly higher than in the other two cases because water was swept up by the ice floe. The impact of the ice floes on pressure-induced loads on the surface of the vehicle was even more significant in Figure 21c,d as some water rapidly impinged on its surface to cause localized pressure peaks. These observations suggest that the ice floes might have increased the localized surface pressure-induced loads on the vehicle.

4. Conclusions

In this paper, we used the computational fluid dynamics (CFD) method to numerically simulate the process of a ventilated vehicle exiting water in a polar environment as it traversed an ice-water mixture while considering collisions between the vehicle and ice floes. We analyzed the mechanism of influence of the ice floes on the mode of evolution and characteristics of the flow field of the ventilated cavity of the vehicle and investigated their impact on the motion and characteristics of the load of the vehicle. The main conclusions are as follows:
(1)
The ice floes hastened the collapse of the ventilation cavity of the vehicle and could change the form of the collapse as well. A water plume developed to a sufficient extent under the ice-free case, thereby offering robust protection for the ventilated cavity. When the water plume disintegrated, it compressed the cavity toward its core, resulting in a reduction in its scope of collapse. In the cases in which they were present, the crushing and scratching of ice floes accelerated the fragmentation of the water plume. When the ice floes rotated outward, they simultaneously induced a rapid expansion of the cavity, which led to a larger scope of its collapse than in the ice-free case.
(2)
The presence of the ice floes accentuated the development of the flow field as the vehicle traversed the free surface. Ice floes impacted by the vehicle flipped over rapidly, inducing the splashing of the surrounding liquid and generating high-velocity water jets that impinged upon the surface of the vehicle. Owing to the combined influence of the ice floes and the re-entrant jet within the cavity, the localized secondary closure of the cavity was prone to occur. An explosive increase in vortex structures and numerous fine vortices were observed during the passage of the vehicle through the ice-water mixture.
(3)
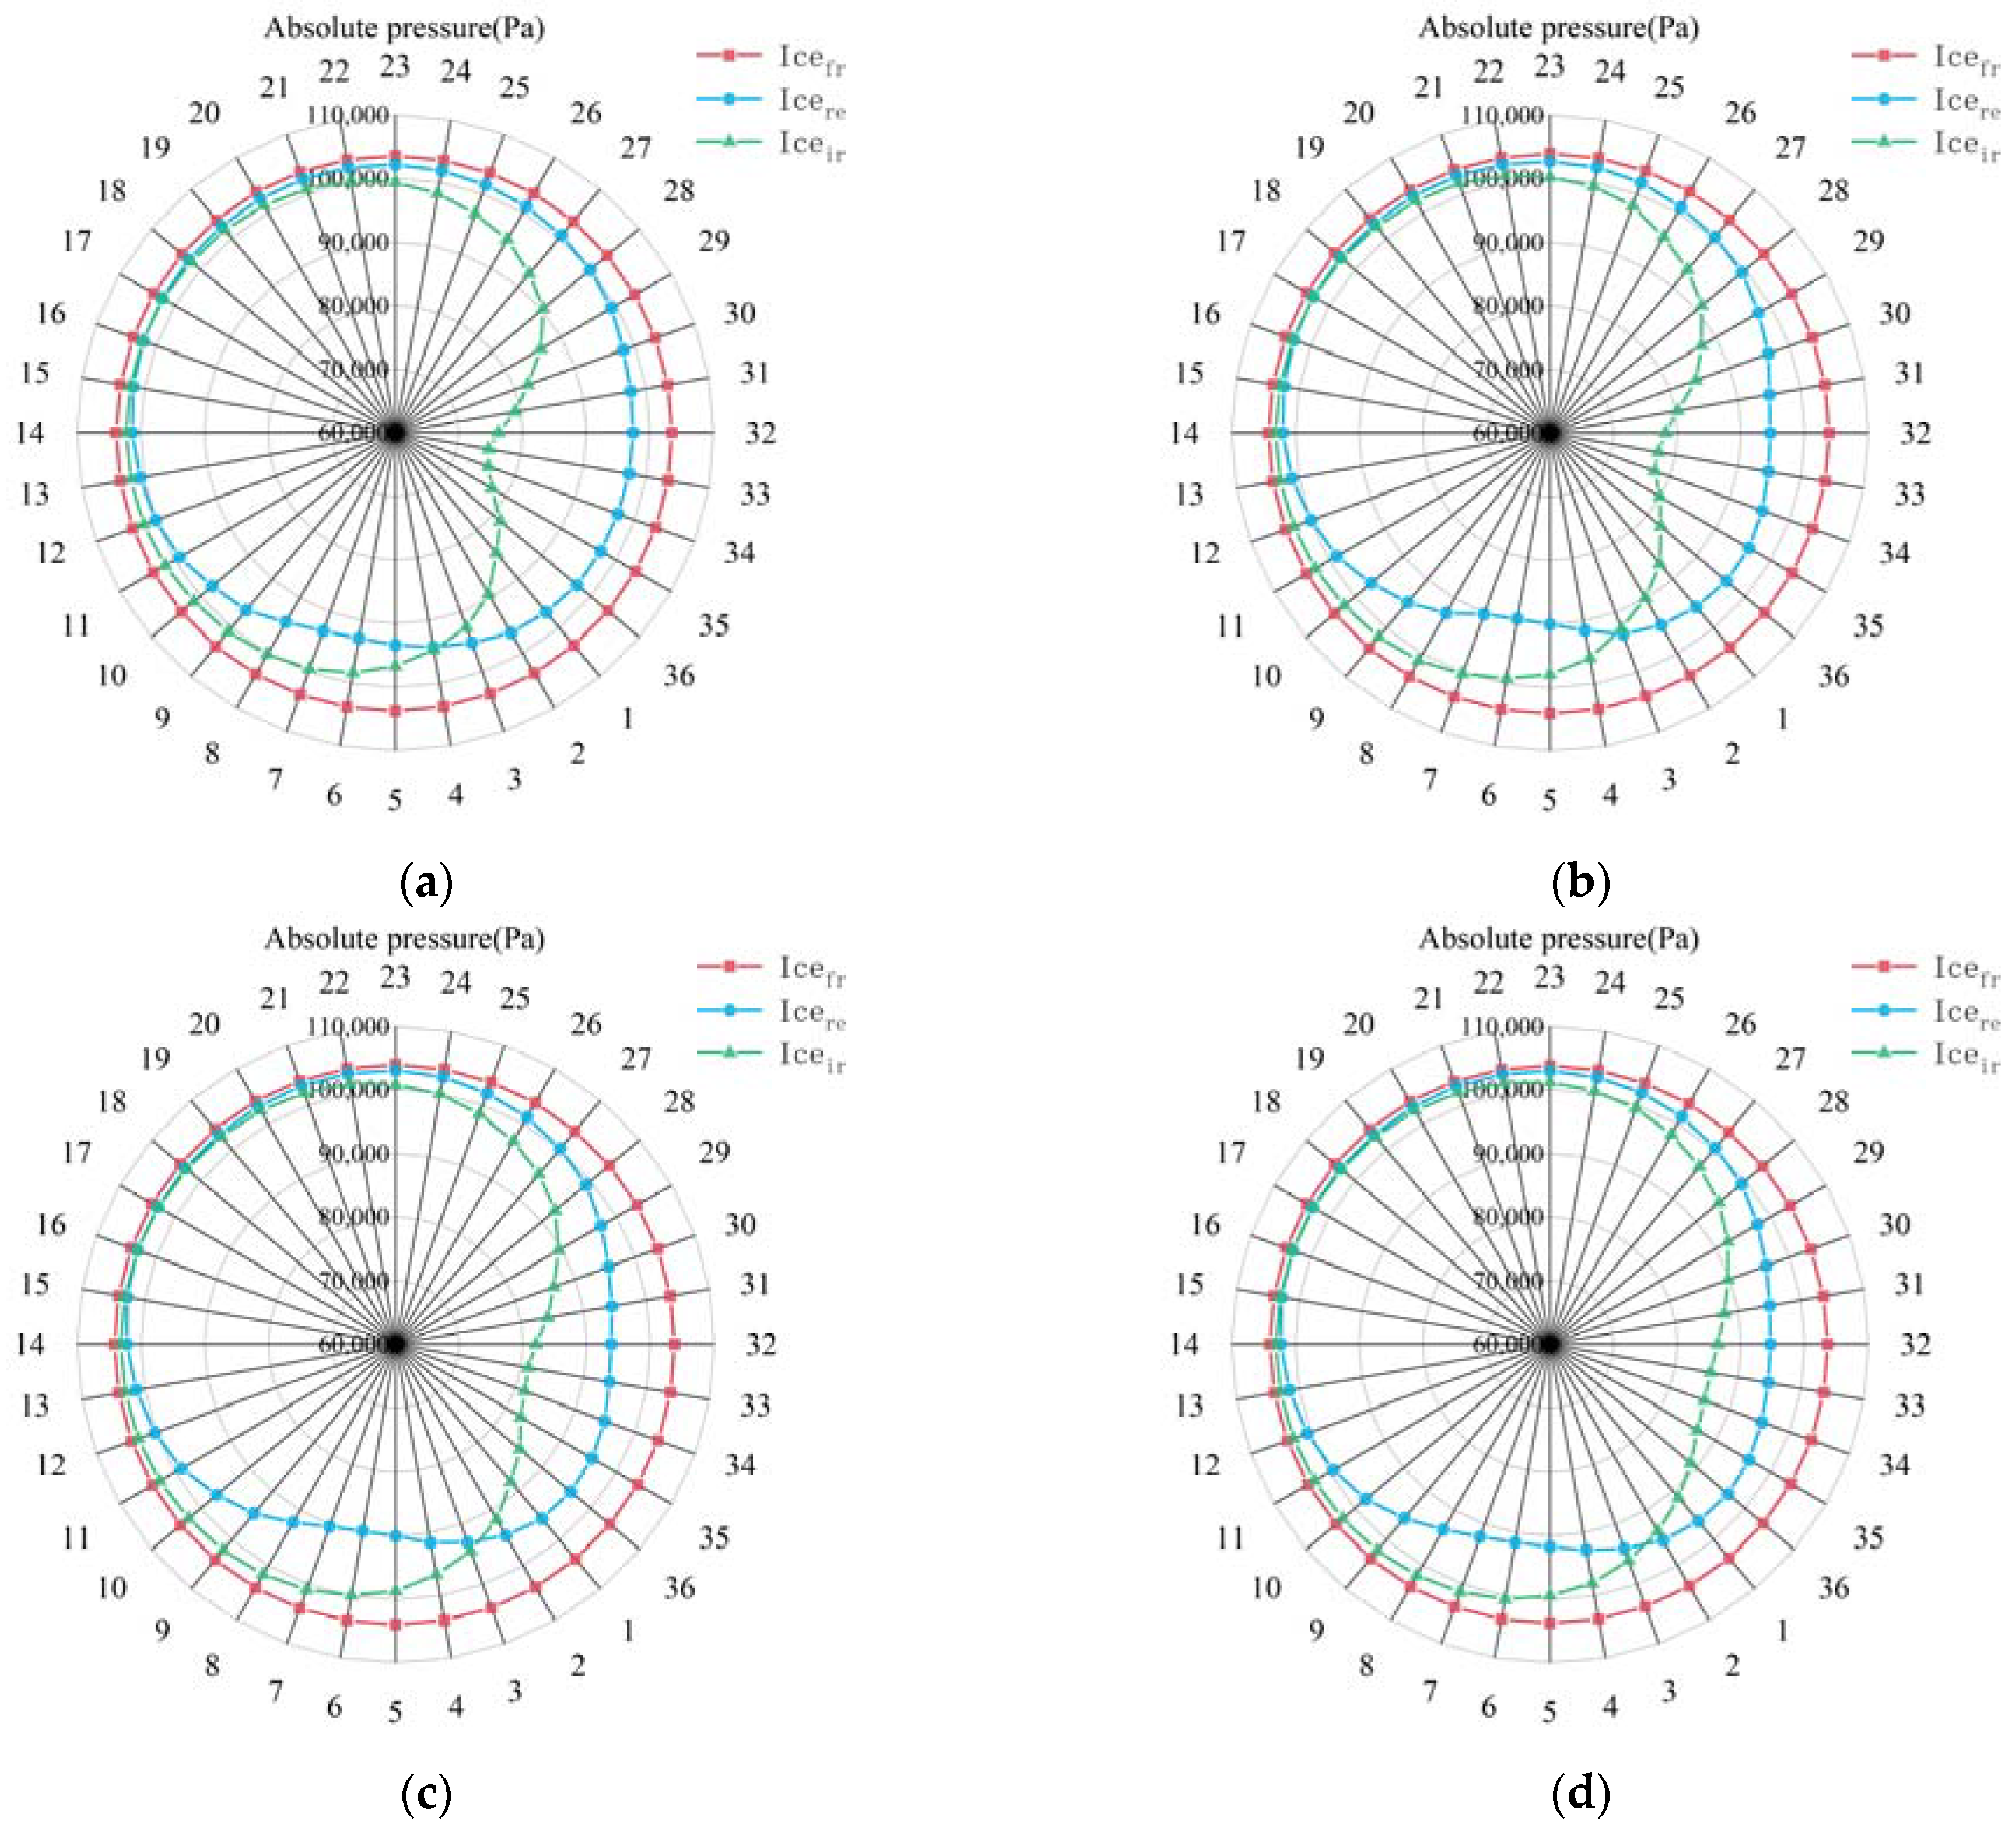
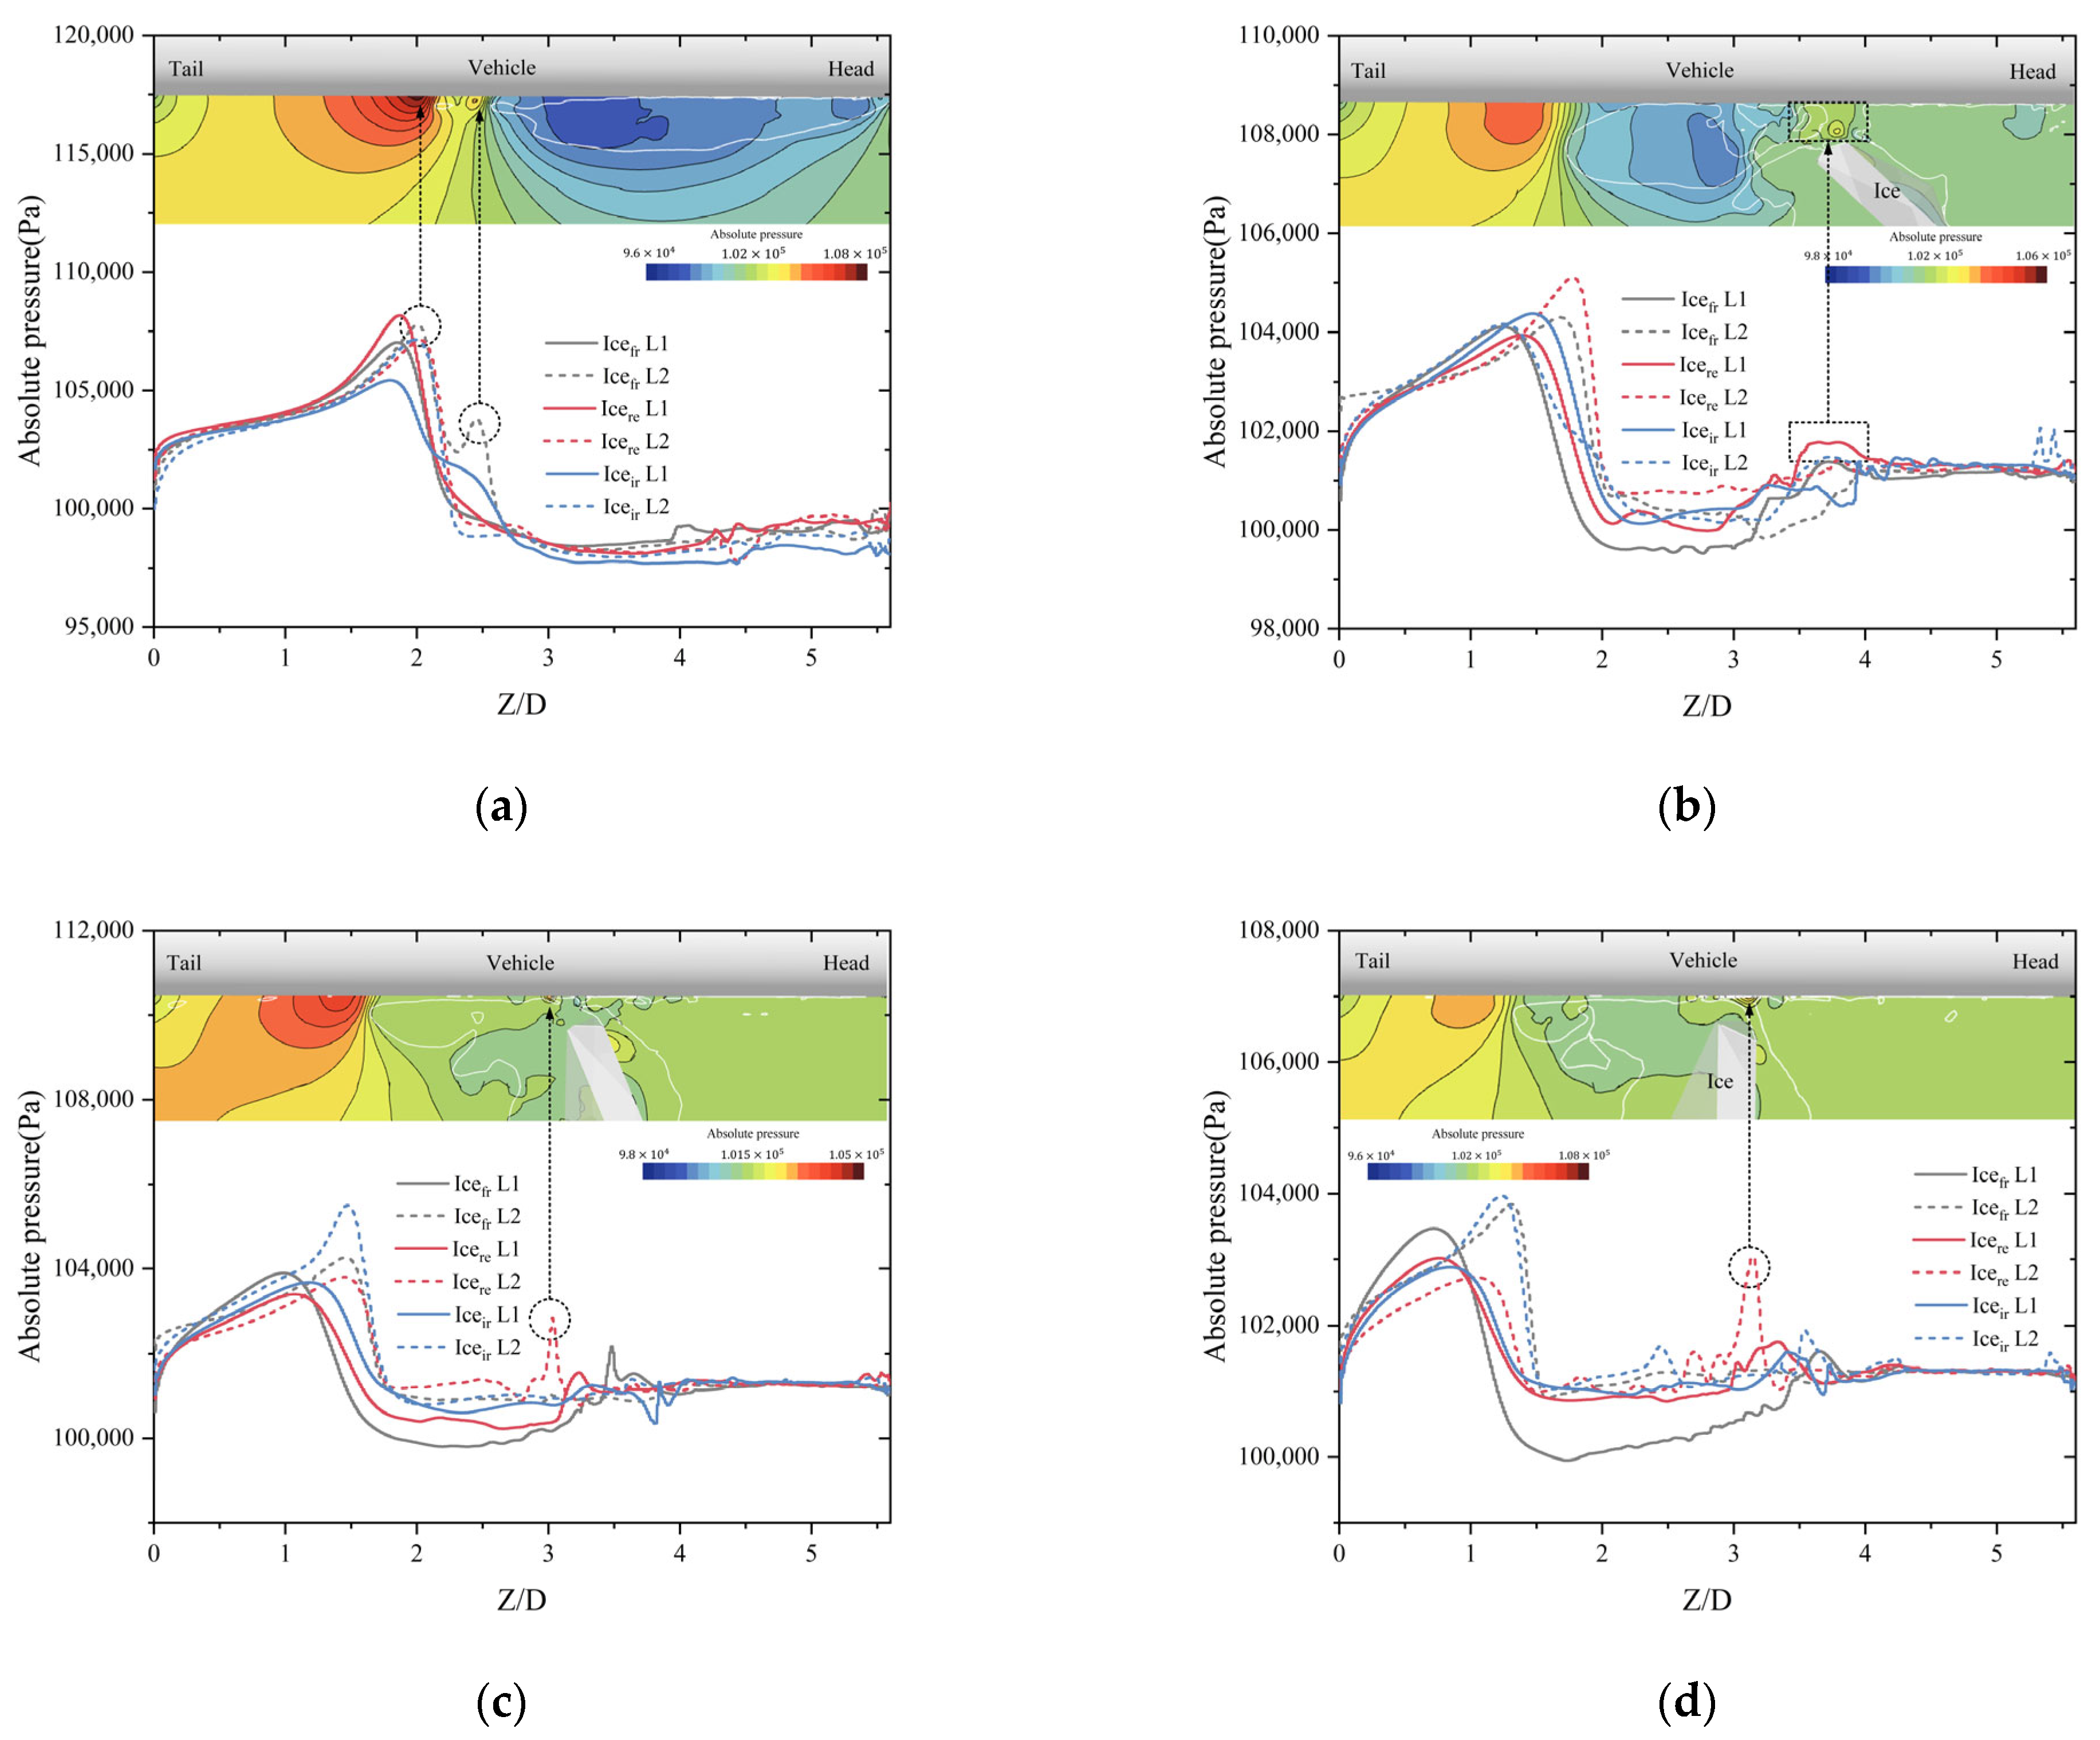
The kinematics and loading characteristics of the vehicle were significantly influenced by the ice floes. Both the acceleration and the moment of the vehicle were susceptible to abrupt changes in the event of such a collision, which compromised its kinematic stability. When the vehicle collided with an ice floe, a sudden decrease in pressure occurred beneath the latter that affected both the head and cylindrical segments of the former. However, the fluctuations in pressure were more pronounced at the head of the vehicle than at its cylindrical segments. Furthermore, as it traversed the ice-water mixture, the surface of the vehicle was exposed to water jets splashed by the ice floes, and this led to localized areas of increased pressure.
In the present study, we investigate the evolution of the flow field, motion, and loading characteristics of an underwater vehicle during water exit in an ice floe environment. However, the effects of additional variables on the water exit process have not been considered in previous studies. In the upcoming study, we will thoroughly examine how ice width, thickness, and collision position with the navigational body impact the water discharge process. Furthermore, the structural dynamic response of the vehicle poses a critical issue that cannot be overlooked. It is imperative to thoroughly explore this matter through extensive experimentation and numerical simulations.

Author Contributions

Conceptualization and methodology, S.Z., W.L., H.X. and T.S.; software, S.Z., W.L., H.X. and T.S.; validation, S.Z., H.X. and T.S.; formal analysis, S.Z., W.L., H.X. and T.S.; data curation, S.Z. and T.S.; writing—original draft preparation, S.Z., W.L., H.X. and T.S.; writing—review and editing, S.Z., W.L., H.X. and T.S.; supervision, T.S.; project administration, T.S.; funding acquisition, T.S. All authors have read and agreed to the published version of the manuscript.

Funding

This research was funded by the National Natural Science Foundation of China (Grant No. 52071062) and the National Natural Science Foundation of China (Grant No. 52192692).

Institutional Review Board Statement

Not applicable.

Informed Consent Statement

Not applicable.

Data Availability Statement

The data that supports the findings of this study are available from the corresponding author upon reasonable request.

Conflicts of Interest

The authors declare no conflict of interest.

References

  1. Chen, P.; Zhao, J. Variation of Sea Ice Extent in Different Regions of the Arctic Ocean. Acta Oceanol. Sin. 2017, 36, 9–19. [Google Scholar]
  2. Qin, N.; Lu, C.; Li, J. Numerical Investigation of Characteristics of Water-Exit Ventilated Cavity Collapse. J. Shanghai Jiaotong Univ. Sci. 2016, 21, 530–540. [Google Scholar] [CrossRef]
  3. Greenhow, M. Water-Entry and-Exit of a Horizontal Circular Cylinder. Appl. Ocean Res. 1988, 10, 191–198. [Google Scholar] [CrossRef]
  4. Greenhow, M.; Moyo, S. Water Entry and Exit of Horizontal Circular Cylinders. Philos. Trans. R. Soc. Lond. Ser. Math. Phys. Eng. Sci. 1997, 355, 551–563. [Google Scholar] [CrossRef]
  5. Liu, Z.; Yi, S.; Yan, K.; Xu, S.; Wang, B. Numerical Simulation of Water-Exit Cavity. In Proceedings of the 5th International Symposium on Cavitation, CAV2003, Osaka, Japan, 1–4 November 2003. [Google Scholar]
  6. Chu, X.; Yan, K.; Wang, Z.; Zhang, K.; Feng, G.; Chen, W. Numerical Simulation of Water-Exit of a Cylinder with Cavities. J. Hydrodyn. Ser. B 2010, 22, 877–881. [Google Scholar] [CrossRef]
  7. Wang, Y.; Liao, L.; Du, T.; Huang, C.; Liu, Y.; Fang, X.; Liang, N. A Study on the Collapse of Cavitation Bubbles Surrounding the Underwater-Launched Projectile and Its Fluid–Structure Coupling Effects. Ocean Eng. 2014, 84, 228–236. [Google Scholar] [CrossRef]
  8. Chen, Y.; Lu, C.; Chen, X.; Cao, J. Numerical Investigation on the Cavitation Collapse Regime around the Submerged Vehicles Navigating with Deceleration. Eur. J. Mech. B Fluids 2015, 49, 153–170. [Google Scholar] [CrossRef]
  9. Chen, Y.; Li, J.; Gong, Z.; Chen, X.; Lu, C. LES Investigation on Cavitating Flow Structures and Loads of Water-Exiting Submerged Vehicles Using a Uniform Filter of Octree-Based Grids. Ocean Eng. 2021, 225, 108811. [Google Scholar] [CrossRef]
  10. Chen, Y.; Gong, Z.; Li, J.; Chen, X.; Lu, C. Numerical Investigation on the Regime of Cavitation Shedding and Collapse during the Water-Exit of Submerged Projectile. J. Fluids Eng. 2020, 142, 011403. [Google Scholar]
  11. Zhang, X.; Lyu, X.; Fan, X. Numerical Study on the Vertical Water Exit of a Cylinder with Cavity. China Ocean Eng. 2022, 36, 734–742. [Google Scholar] [CrossRef]
  12. Nguyen, V.-T.; Phan, T.-H.; Duy, T.-N.; Park, W.-G. Unsteady Cavitation around Submerged and Water-Exit Projectiles under the Effect of the Free Surface: A Numerical Study. Ocean Eng. 2022, 263, 112368. [Google Scholar]
  13. Gao, S.; Shi, Y.; Pan, G.; Quan, X. A Study on the Performance of the Cavitating Flow Structure and Load Characteristics of the Vehicle Launched Underwater. Phys. Fluids 2022, 34, 0127656. [Google Scholar]
  14. Gao, S.; Shi, Y.; Pan, G.; Quan, X. The Transient Vortex Structure in the Wake of an Axial-Symmetric Projectile Launched Underwater. Phys. Fluids 2022, 34, 065109. [Google Scholar]
  15. Wang, Q.; Cao, W.; Zhang, T.; Wang, C.; Wei, Y. Research on Cavity Collapse Characteristics during High-Speed Water-Exit of the Supercavitating Projectile. Phys. Fluids 2023, 35, 073307. [Google Scholar]
  16. Ni, B.Y.; Wu, G.X. Numerical Simulation of Water Exit of an Initially Fully Submerged Buoyant Spheroid in an Axisymmetric Flow. Fluid Dyn. Res. 2017, 49, 045511. [Google Scholar] [CrossRef]
  17. Korobkin, A.A.; Khabakhpasheva, T.I.; Maki, K.J. Hydrodynamic Forces in Water Exit Problems. J. Fluids Struct. 2017, 69, 16–33. [Google Scholar] [CrossRef]
  18. Fu, G.; Zhao, J.; Sun, L.; Lu, Y. Experimental Investigation of the Characteristics of an Artificial Cavity during the Water-Exit of a Slender Body. J. Mar. Sci. Appl. 2018, 17, 578–584. [Google Scholar] [CrossRef]
  19. Chen, X.; Xiao, W.; Gong, R.; Yao, X.; Hu, S. Experimental Investigation of Ventilation Bubble Dynamics around a Vertically Moving Cylinder under Reduced Ambient Pressure. Fluid Dyn. Res. 2022, 54, 015512. [Google Scholar]
  20. Gan, N.; Yao, X.; Cheng, S.; Chen, Y.; Ma, G. Experimental Investigation on Dynamic Characteristics of Ventilation Bubbles on the Surface of a Vertical Moving Body. Ocean Eng. 2022, 246, 110641. [Google Scholar] [CrossRef]
  21. Wu, Q.G.; Ni, B.Y.; Bai, X.L.; Cui, B.; Sun, S.L. Experimental Study on Large Deformation of Free Surface during Water Exit of a Sphere. Ocean Eng. 2017, 140, 369–376. [Google Scholar] [CrossRef]
  22. Wang, Y.; Huang, C.; Fang, X.; Wu, X.; Du, T. On the Internal Collapse Phenomenon at the Closure of Cavitation Bubbles in a Deceleration Process of Underwater Vertical Launching. Appl. Ocean Res. 2016, 56, 157–165. [Google Scholar] [CrossRef]
  23. Zhao, Q.; Chen, T.; Xiao, W.; Chen, X.; Yao, X.; Wang, W. Research on the Characteristics of Cavitation Flow and Pressure Load during Vertical Water Exit of Different Head-Shaped Vehicles. Ocean Eng. 2022, 265, 112663. [Google Scholar] [CrossRef]
  24. Yu, A.; Luo, X.; Ji, B. Analysis of Ventilated Cavitation around a Cylinder Vehicle with Nature Cavitation Using a New Simulation Method. Sci. Bull. 2015, 60, 1833–1839. [Google Scholar] [CrossRef]
  25. Liu, T.; Huang, B.; Wang, G.; Zhang, M. Experimental Investigation of Ventilated Partial Cavitating Flows with Special Emphasis on Flow Pattern Regime and Unsteady Shedding Behavior around an Axisymmetric Body at Different Angles of Attack. Ocean Eng. 2018, 147, 289–303. [Google Scholar] [CrossRef]
  26. Sun, T.; Zhang, X.; Xu, C.; Zhang, G.; Wang, C.; Zong, Z. Experimental Investigation on the Cavity Evolution and Dynamics with Special Emphasis on the Development Stage of Ventilated Partial Cavitating Flow. Ocean Eng. 2019, 187, 106140. [Google Scholar] [CrossRef]
  27. Zhang, X.; Wang, C.; Wekesa, D.W. Numerical and Experimental Study of Pressure-Wave Formation around an Underwater Ventilated Vehicle. Eur. J. Mech. B Fluids 2017, 65, 440–449. [Google Scholar] [CrossRef]
  28. Yang, Q.; Wang, C.; Wei, Y.; Wang, Y.; Zhang, D.; Hu, X. Experimental Study on the Collapse of Tail Cavity Induced by Underwater Ventilation. Phys. Fluids 2022, 34, 112111. [Google Scholar] [CrossRef]
  29. Sun, L.; Li, W.; Ma, G.; Chen, Y.; Fang, M.; Zhang, W.; Yao, X. Study on Ventilated Cavity Uncertainty of the Vehicle under Stochastic Conditions Based on the Monte Carlo Method. Ocean Eng. 2021, 239, 109789. [Google Scholar] [CrossRef]
  30. Zhang, D.; Zhang, J.; Sun, T.; Jiang, Y. Ventilated Cavity Dynamics of an Axisymmetric Body under the Influence of a Structure. Phys. Fluids 2023, 35, 055112. [Google Scholar]
  31. Kim, J.-H.; Kim, Y. Numerical Simulation on the Ice-Induced Fatigue Damage of Ship Structural Members in Broken Ice Fields. Mar. Struct. 2019, 66, 83–105. [Google Scholar] [CrossRef]
  32. Barooni, M.; Nezhad, S.K.; Ali, N.A.; Ashuri, T.; Sogut, D.V. Numerical Study of Ice-Induced Loads and Dynamic Response Analysis for Floating Offshore Wind Turbines. Mar. Struct. 2022, 86, 103300. [Google Scholar] [CrossRef]
  33. Guo, C.; Zhang, Z.; Tian, T.; Li, X.; Zhao, D. Numerical Simulation on the Resistance Performance of Ice-Going Container Ship under Brash Ice Conditions. China Ocean Eng. 2018, 32, 546–556. [Google Scholar] [CrossRef]
  34. Zambon, A.; Moro, L.; Kennedy, A.; Oldford, D. Torsional Vibrations of Polar-Class Shaftlines: Correlating Ice–Propeller Interaction Torque to Sea Ice Thickness. Ocean Eng. 2023, 267, 113250. [Google Scholar] [CrossRef]
  35. Wang, H.; Huang, Z.; Huang, D.; Hou, Y.; Chen, Z.; Guo, Z.; Sun, S.; Xue, R. Influences of Floating Ice on the Vertical Water Entry Process of a Trans-Media Projectile at High Speeds. Ocean Eng. 2022, 265, 112548. [Google Scholar] [CrossRef]
  36. Wang, H.; Luo, Y.; Chen, Z.; Guo, Z.; Huang, Z. Influences of Ice-Water Mixture on the Vertical Water-Entry of a Cylinder at a Low Velocity. Ocean Eng. 2022, 256, 111464. [Google Scholar] [CrossRef]
  37. Hu, X.; Wei, Y.; Wang, C. Study on High-Speed Water Entry of the Projectile Passing through an Ice Hole in a Low-Temperature Environment Based on a Modified Thermodynamic Cavitation Model. Phys. Fluids 2023, 35, 0138052. [Google Scholar] [CrossRef]
  38. Ren, H.; Zhao, X. Numerical Simulation for Ice Breaking and Water Entry of Sphere. Ocean Eng. 2022, 243, 110198. [Google Scholar] [CrossRef]
  39. Cui, W.; Kong, D.; Sun, T.; Yan, G. Coupling Dynamic Characteristics of High-Speed Water-Entry Projectile and Ice Sheet. Ocean Eng. 2023, 275, 114090. [Google Scholar] [CrossRef]
  40. Sun, T.; Zhang, J.; Wei, H.; Zhang, D.; Zhang, G. Experimental Investigation of the Influence of Floating Ices Constraint on the Cavity Dynamics of an Axisymmetric Body during the Water Exit Process. Ocean Eng. 2022, 244, 110383. [Google Scholar] [CrossRef]
  41. You, C.; Sun, T.; Zhang, G.; Wei, Y.; Zong, Z. Numerical Study on Effect of Brash Ice on Water Exit Dynamics of Ventilated Cavitation Cylinder. Ocean Eng. 2022, 245, 110443. [Google Scholar] [CrossRef]
  42. Menter, F.R. Two-Equation Eddy-Viscosity Turbulence Models for Engineering Applications. AIAA J. 1994, 32, 1598–1605. [Google Scholar] [CrossRef]
  43. Schnerr, G.H.; Sauer, J. Physical and Numerical Modeling of Unsteady Cavitation Dynamics. In Proceedings of the Fourth International Conference on Multiphase Flow, ICMF, New Orleans, LO, USA, 27 May–1 June 2001; Volume 1. [Google Scholar]
  44. Luo, W.; Jiang, D.; Wu, T.; Guo, C.; Wang, C.; Deng, R.; Dai, S. Numerical Simulation of an Ice-Strengthened Bulk Carrier in Brash Ice Channel. Ocean Eng. 2020, 196, 106830. [Google Scholar] [CrossRef]
  45. Huang, L.; Tuhkuri, J.; Igrec, B.; Li, M.; Stagonas, D.; Toffoli, A.; Cardiff, P.; Thomas, G. Ship Resistance When Operating in Floating Ice Floes: A Combined CFD&DEM Approach. Mar. Struct. 2020, 74, 102817. [Google Scholar]
  46. Tang, X.; Zou, M.; Zou, Z.; Li, Z.; Zou, L. A Parametric Study on the Ice Resistance of a Ship Sailing in Pack Ice Based on CFD-DEM Method. Ocean Eng. 2022, 265, 112563. [Google Scholar] [CrossRef]
  47. Xie, C.; Zhou, L.; Ding, S.; Liu, R.; Zheng, S. Experimental and Numerical Investigation on Self-Propulsion Performance of Polar Merchant Ship in Brash Ice Channel. Ocean Eng. 2023, 269, 113424. [Google Scholar] [CrossRef]
  48. Zhang, J.; Zhang, Y.; Shang, Y.; Jin, Q.; Zhang, L. CFD-DEM Based Full-Scale Ship-Ice Interaction Research under FSICR Ice Condition in Restricted Brash Ice Channel. Cold Reg. Sci. Technol. 2022, 194, 103454. [Google Scholar] [CrossRef]
  49. Zhang, G.; Zhao, Y.; Yang, B.; Sun, Z. Experimental and Numerical Investigation of the Hydrodynamic Effect During the Ice Floe-Structure Interaction. In Proceedings of the ISOPE International Ocean and Polar Engineering Conference, ISOPE, Ottawa, ON, Canada, 19–23 June 2022; p. ISOPE-I-22-317. [Google Scholar]
  50. Hou, Z.; Sun, T.; Quan, X.; Zhang, G.; Sun, Z.; Zong, Z. Large Eddy Simulation and Experimental Investigation on the Cavity Dynamics and Vortex Evolution for Oblique Water Entry of a Cylinder. Appl. Ocean Res. 2018, 81, 76–92. [Google Scholar] [CrossRef]
  51. Shi, Y.; Lu, J.; Gao, S.; Pan, G.; Ren, J. Experimental Study on the Cavitation Flow and Motion Characteristics of the Vehicle Launched Underwater. Int. J. Nav. Archit. Ocean Eng. 2022, 100492. [Google Scholar] [CrossRef]
Figure 1. Model of simulation and boundary conditions.
Jmse 11 02046 g001
Figure 2. Expected collision position.
Jmse 11 02046 g002
Figure 3. The computational mesh.
Jmse 11 02046 g003
Figure 4. Mesh independence study: (a) vertical acceleration; (b) vertical velocity (The green arrow points to the local zoom area).
Jmse 11 02046 g004
Figure 5. Comparison of the evolution of the cavity: (a) experiment results; (b) results of the numerical simulation.
Jmse 11 02046 g005
Figure 6. Comparison of cavity morphology: (a) experiment results; (b) results of the numerical simulation.
Jmse 11 02046 g006
Figure 7. Computational model of the collision between the ice block and the cylinder.
Jmse 11 02046 g007
Figure 8. Comparison between experimental results and those of numerical simulations: (a) velocity and (b) displacement (The green arrow points to the local zoom area).
Jmse 11 02046 g008
Figure 9. The evolution of the three-dimensional shape of the ventilated cavity: (a) Icefr; (b) Icere; (c) Iceir.
Jmse 11 02046 g009aJmse 11 02046 g009b
Figure 10. Comparisons of the shape of the three-dimensional ventilated cavity at four typical moments: (a) t = 0.090 s; (b) t = 0.105 s; (c) t = 0.113 s; (d) t = 0.125 s.
Jmse 11 02046 g010
Figure 11. Top view of the shapes of the cavity at four moments under the three conditions: (a) I c e f r ; (b) I c e r e ; (c) I c e i r .
Jmse 11 02046 g011aJmse 11 02046 g011b
Figure 12. The planar section and pressure-monitoring points.
Jmse 11 02046 g012
Figure 13. Evolution of the shape of the cavity on the two-dimensional cross-section: (a) Icefr; (b) Icere; (c) Iceir.
Jmse 11 02046 g013
Figure 14. Evolution of three-dimensional vortex structure: (a) Icefr; (b) Icere; (c) Iceir.
Jmse 11 02046 g014
Figure 15. Evolution of the velocity vector: (a) Icefr; (b) Icere; (c) Iceir.
Jmse 11 02046 g015
Figure 16. Vertical acceleration and velocity of the vehicle: (a) Vertical acceleration. (b) Vertical velocity.
Jmse 11 02046 g016
Figure 17. The moments of the vehicle along the (a) X-axis and (b) Y-axis.
Jmse 11 02046 g017
Figure 18. The absolute pressure at point H0 (The green arrow points to the local zoom area).
Jmse 11 02046 g018
Figure 19. The absolute pressures at points on the four circles at the head of the vehicle are: (a) H1; (b) H2; (c) H3; and (d) H4.
Jmse 11 02046 g019
Figure 20. The absolute pressures at four points on the body of the vehicle are: (a) B1; (b) B2; (c) B3; and (d) B4.
Jmse 11 02046 g020
Figure 21. The distributions of the absolute pressure on the line are: (a) t = 0.090 s; (b) t = 0.110 s; (c) t = 0.115 s; and (d) t = 0.120 s.
Jmse 11 02046 g021
Table 1. Three meshes with different densities (unit: millions).
Mesh DensityTotal Number of Cells
Coarse4.84
Medium8.40
Dense12.50
Disclaimer/Publisher’s Note: The statements, opinions and data contained in all publications are solely those of the individual author(s) and contributor(s) and not of MDPI and/or the editor(s). MDPI and/or the editor(s) disclaim responsibility for any injury to people or property resulting from any ideas, methods, instructions or products referred to in the content.

