
Relative Sea-Level Rise Projections and Flooding Scenarios for 2150 CE for the Island of Ustica (Southern Tyrrhenian Sea, Italy)

 ,
,  , , , ,
  ,
,  and
and 
Abstract
:1. Introduction
- -
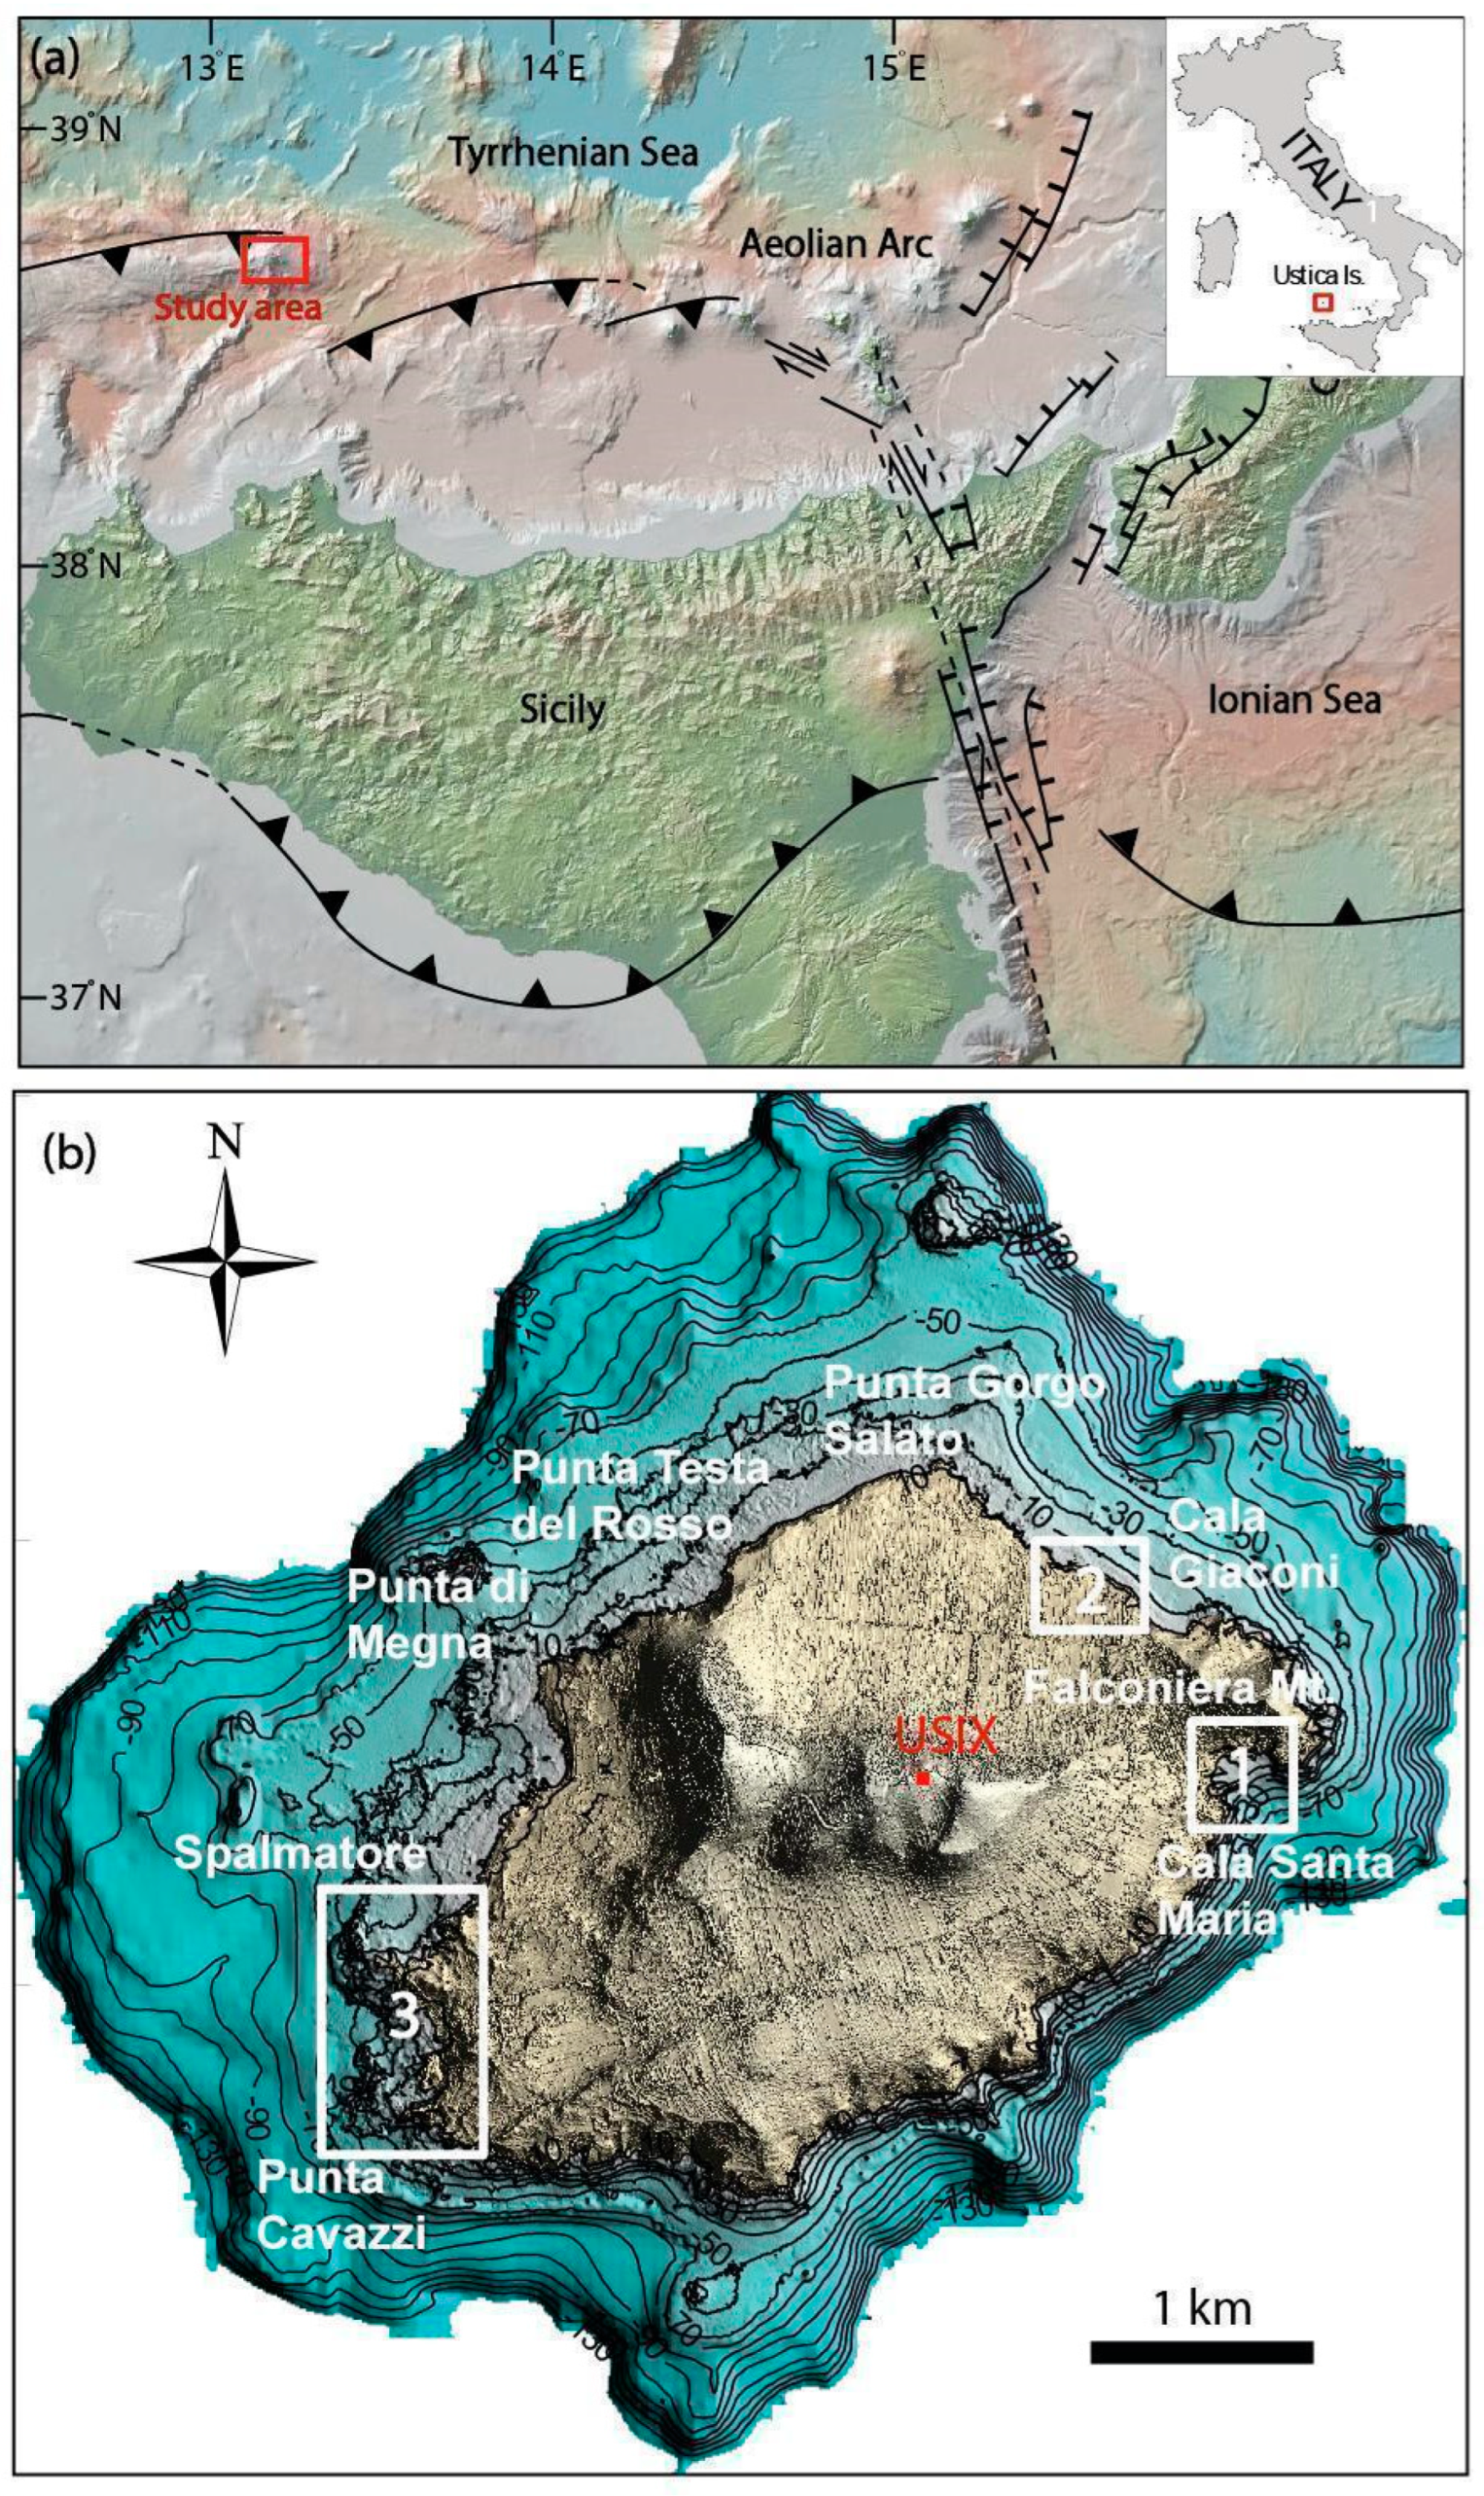
- The southern sector, positioned between Cala S. Maria and Punta Cavazzi. It is characterized by high (~80 m a.s.l.) and jagged cliffs that descend into the sea, with steep slopes characterized by basaltic rocks, hyaloclastite, and lava flows [6].
- -
- The western sector, which lies along the coasts of Spalmatore. It is characterized by the lowest and most indented coast of the island and is formed from a succession of subaerial and submarine volcanic layers [6].
- -
- The northern sector, which exhibits high cliffs of up to 40 m and faults. A stretch of cliff between 10 and 40 m high starts from Punta di Megna and continues up to Punta Gorgo Salato, resulting from a NE–SW-oriented fault. Another stretch of cliff, about 20 m high, starts from Punta del Gorgo Salato and continues up to Cala Giaconi. It arises from a fault aligned in the NW–SE direction [6,7].
- -
2. Materials and Methods
- (1)
- Image collection by UAV surveys to obtain ultra-high-resolution DSMs and orthomosaic images of the three selected coastal zones. The latter were selected based on the presence of human facilities and on the different coastal morphology (an especially steep coastline made by lavas without beaches vs. a smoother coastline with wide beaches). These data were then calibrated and integrated with topographic LiDAR (see Section 2.1);
- (2)
- Geodetic analysis for the estimation of the current rates of vertical land movement (VLM) from the GNSS station USIX, located in the inner island (Figure 1b);
- (3)
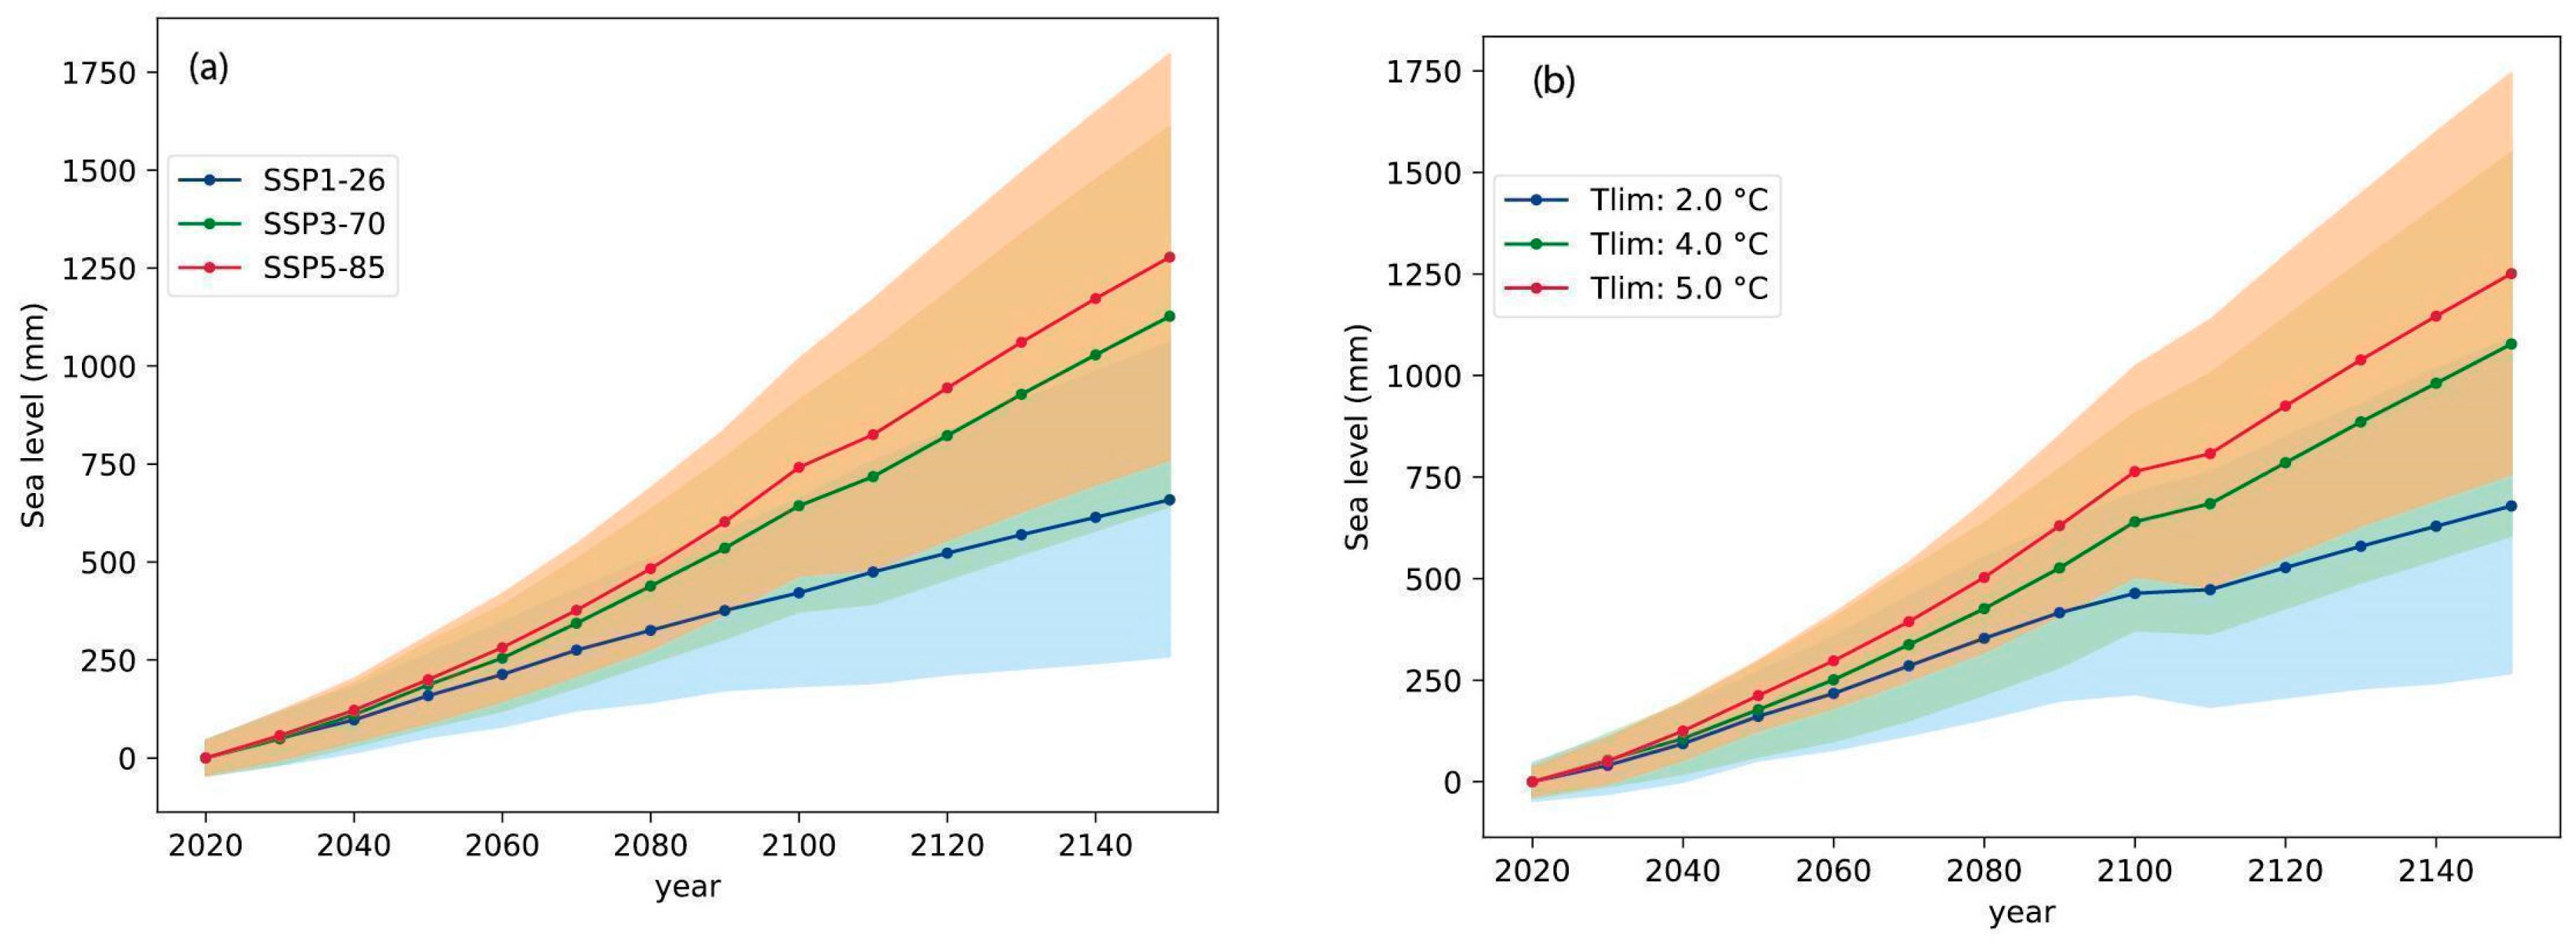
- Incorporating geodetic and topographic data with the regional IPCC-AR6 projections (RCP-SSP2.6 and RCP-SSP8.5 climatic scenarios) to calculate the upper bounds of the expected sea levels for 2050, 2100, and 2150 CE.
2.1. Topographic and Bathymetric Data
2.2. Aerial Photogrammetry and Digital Elevation Model Production
- (1)
- To extract the orthometric elevation (that is, the elevation above sea level) for the determination of mean sea level, we corrected both the point cloud and the GNSS/RTK coordinates of the GCPs by using the Italgeo2005 model (from the Instituto Geografico Militare elevation grid).
- (2)
- To mitigate the 3D model distortion inherent to the photogrammetric process, we used topographic LiDAR data as a reference frame to further constrain the photogrammetric model. To achieve this, we created several virtual GCPs in the common areas between the LiDAR data and drone survey (e.g., parking lots, buildings, roads, pavements, squares, docks, etc.), obtaining a final mismatch between the drone and LiDAR datasets on the order of maximum 10 cm on the Z component (see N.GCPs (LiDAR GCPs) in Table 2).
- (3)
- Finally, DEMs were extracted through an interpolation of the photogrammetric point cloud, resulting in a final DEM resolution of approximately 3 cm/px (Table 1). The last step was to create an orthomosaic of each area by merging the orthorectified images using SFM Agisoft Metashape 2.0 software.
- (4)
- In order to extract the coastline position, we generated contour lines from the DEMs. However, in areas where sea waves and water refraction hindered precise automatic reconstruction, we manually drew and adjusted the coastline using the orthomosaic as a reference.
2.3. Geodetic Data
2.4. Storm Surge Analysis
2.5. Relative Sea-Level Rise Projections and Flooding Scenarios for 2050 and 2100 CE
3. Results
4. Discussion
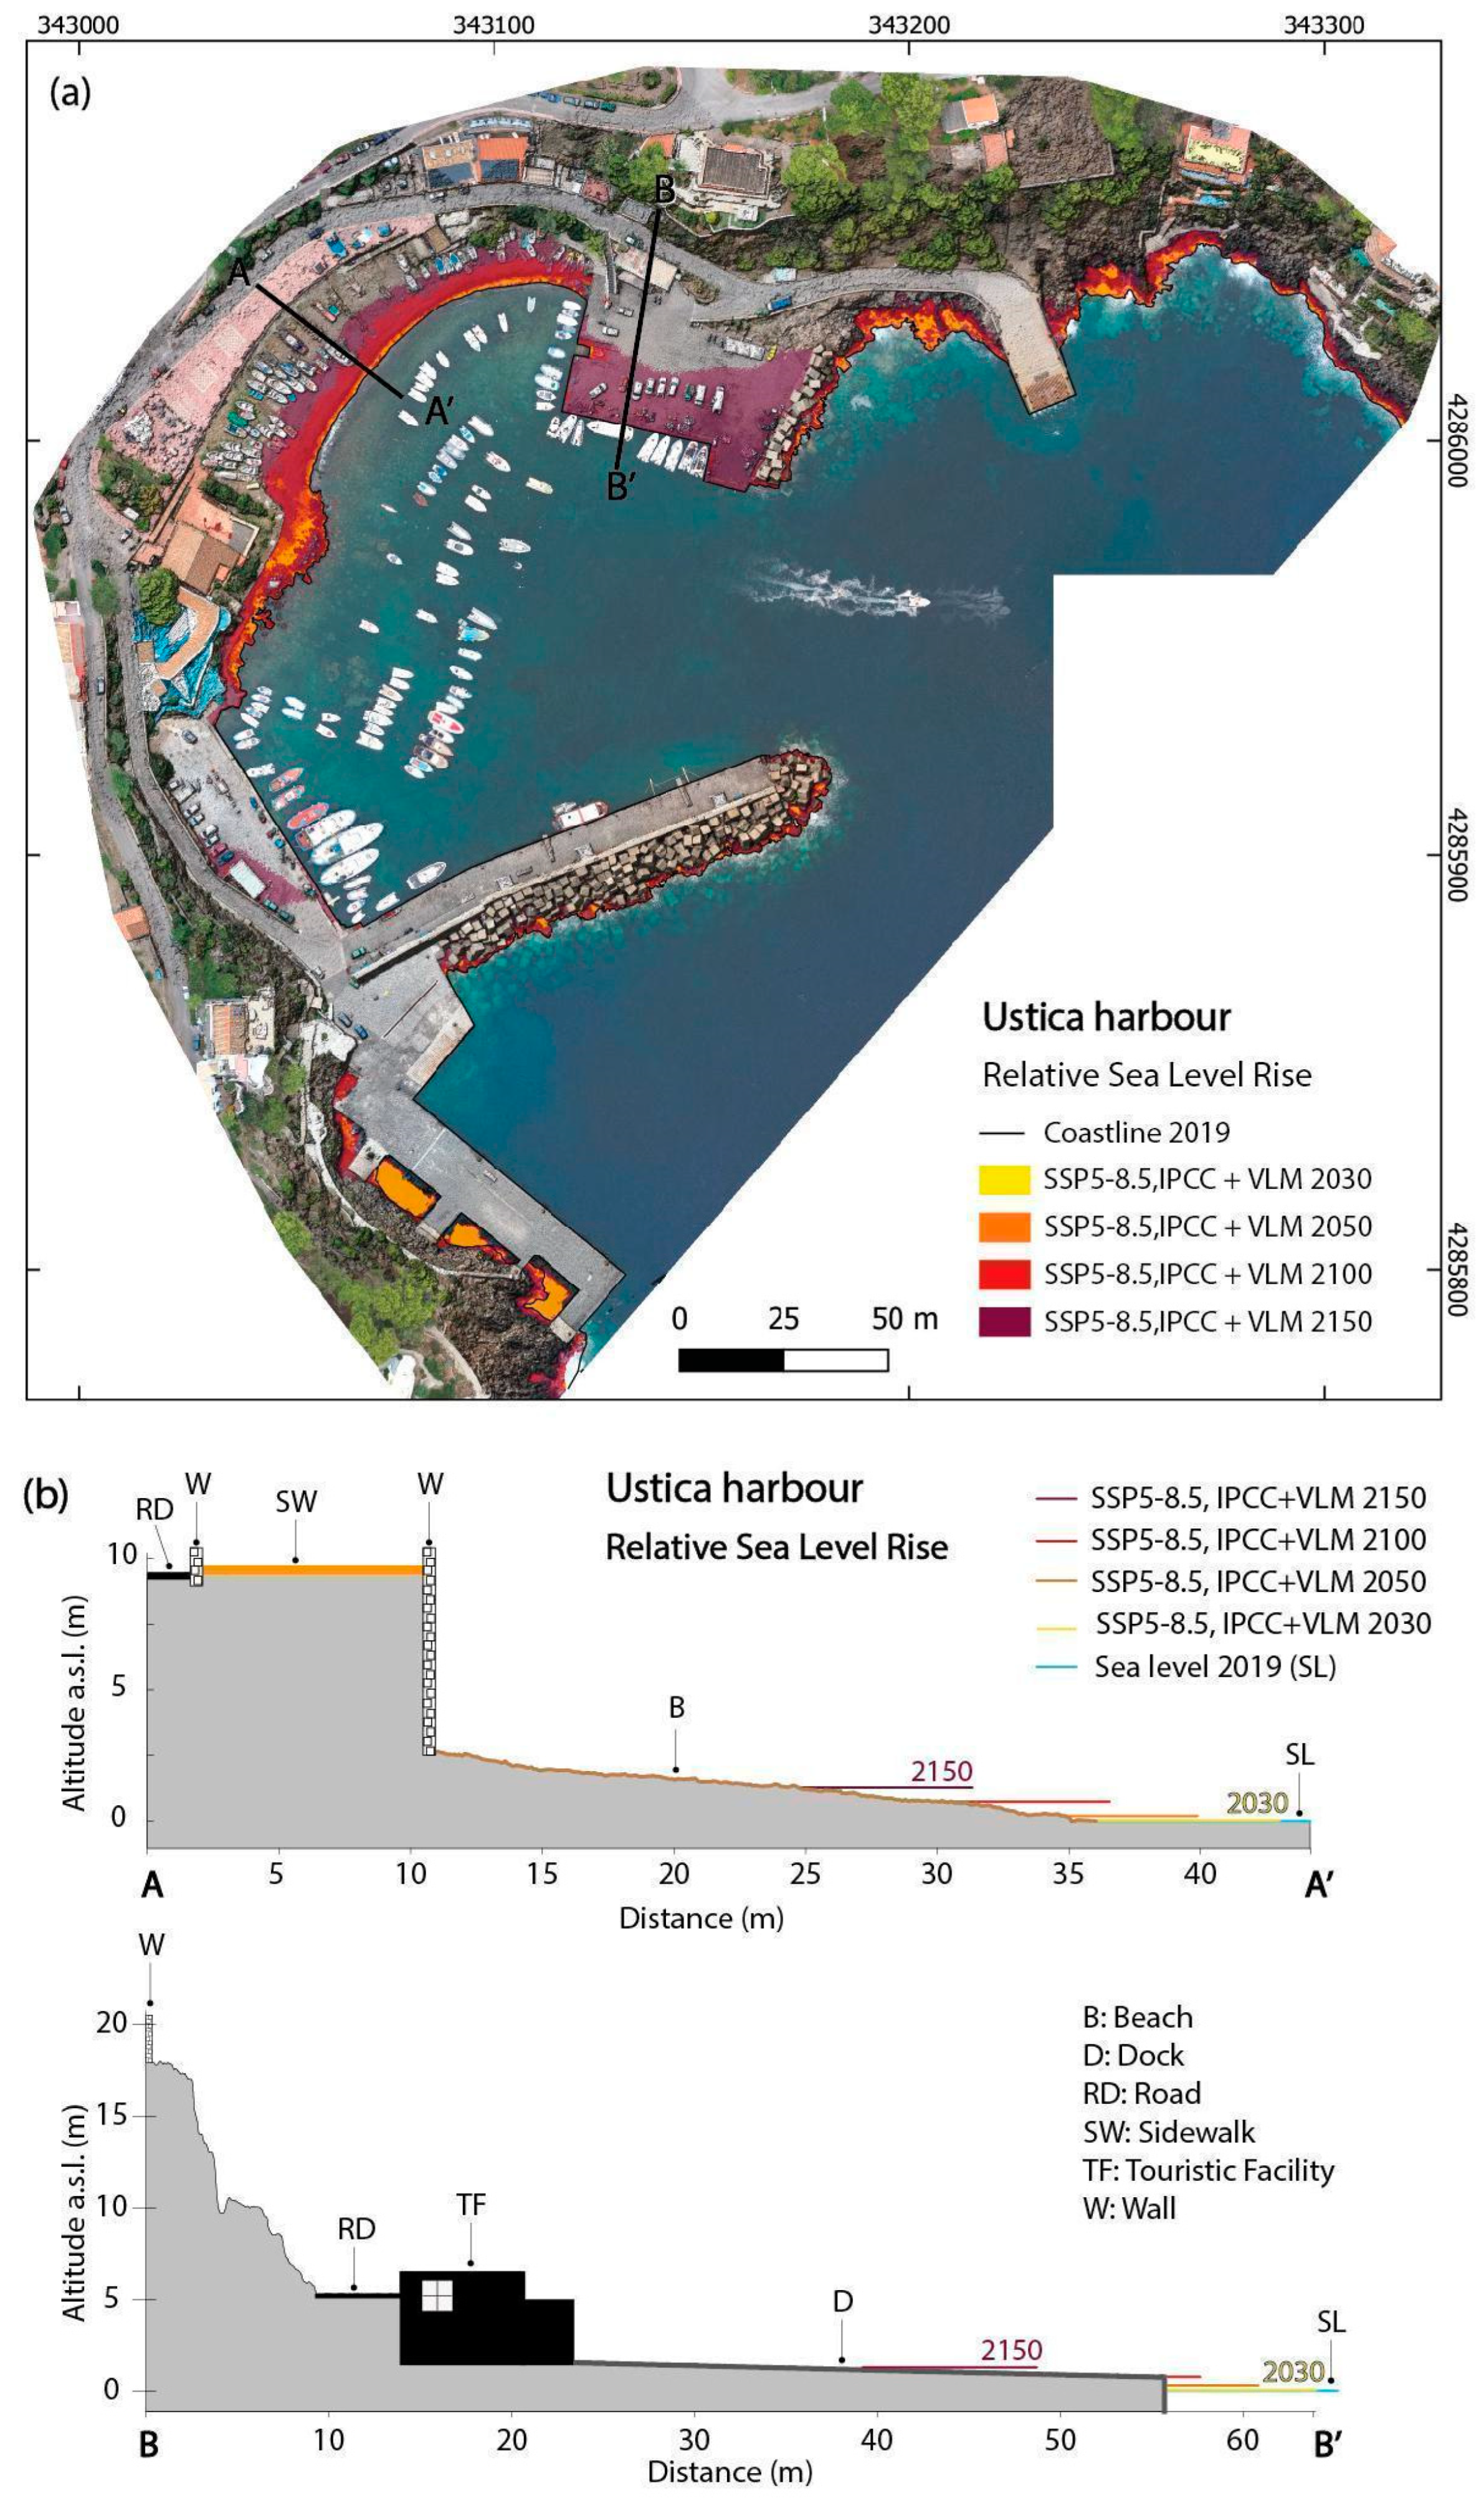
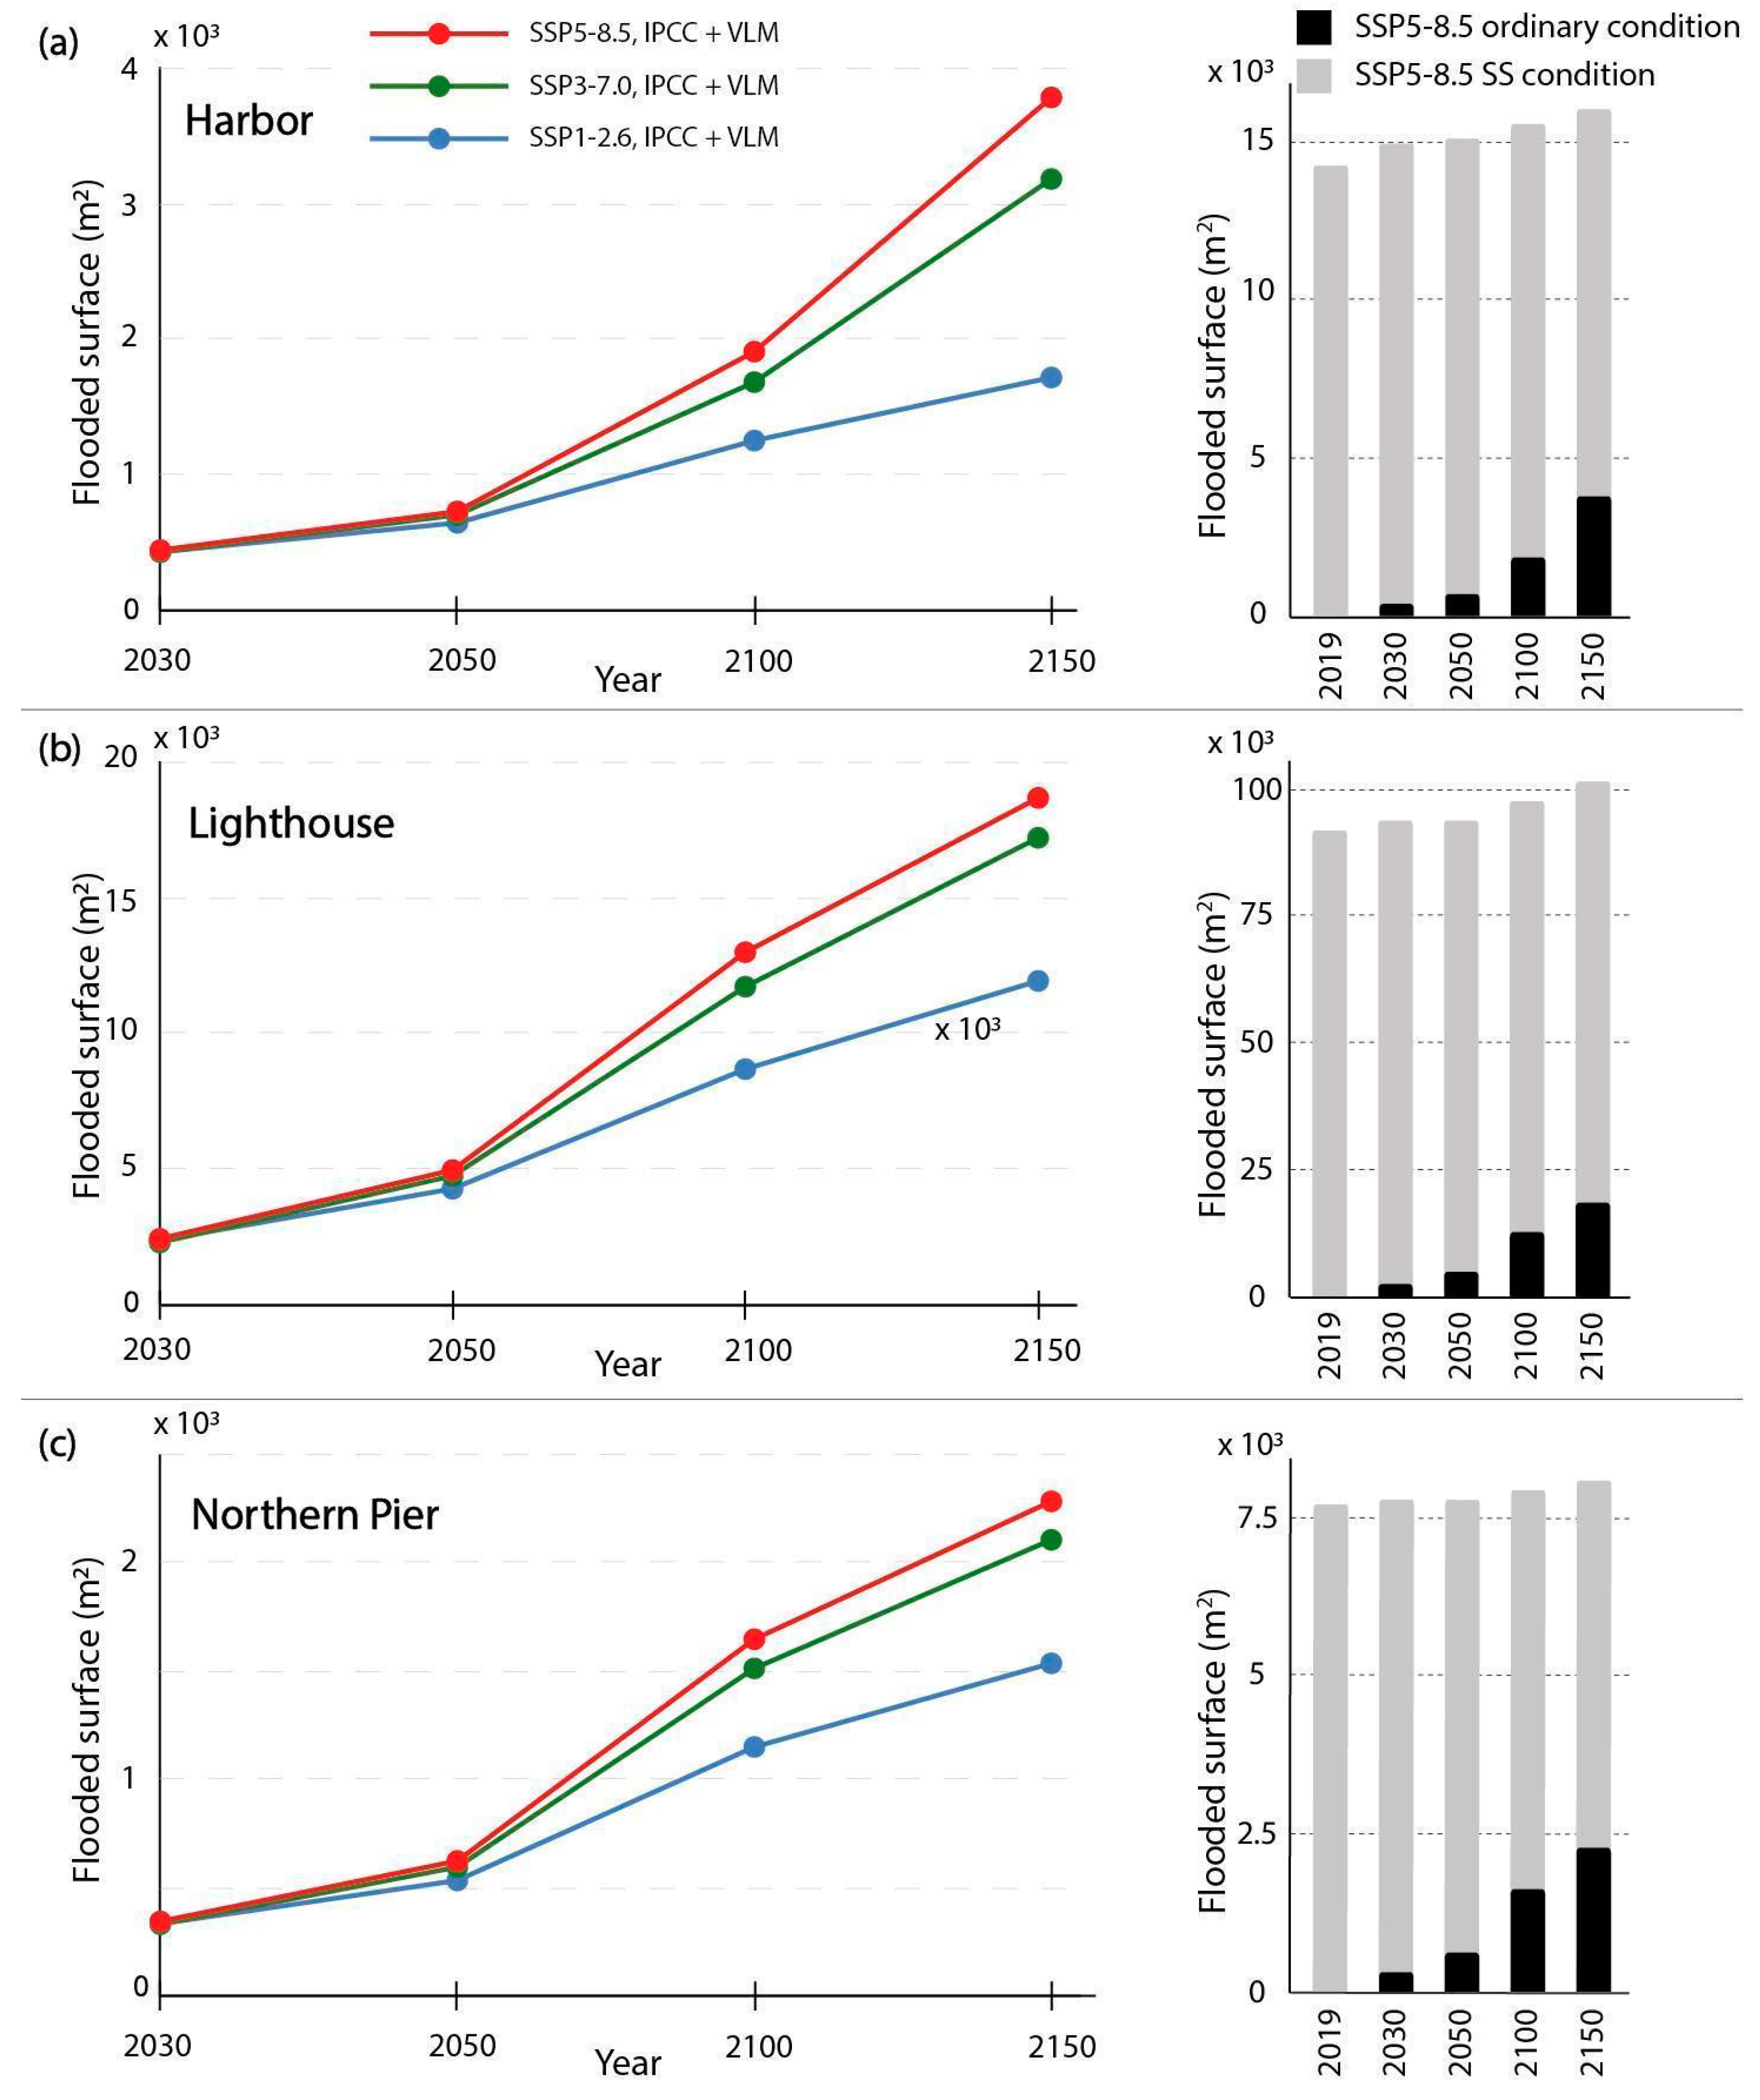
4.1. Main Harbor
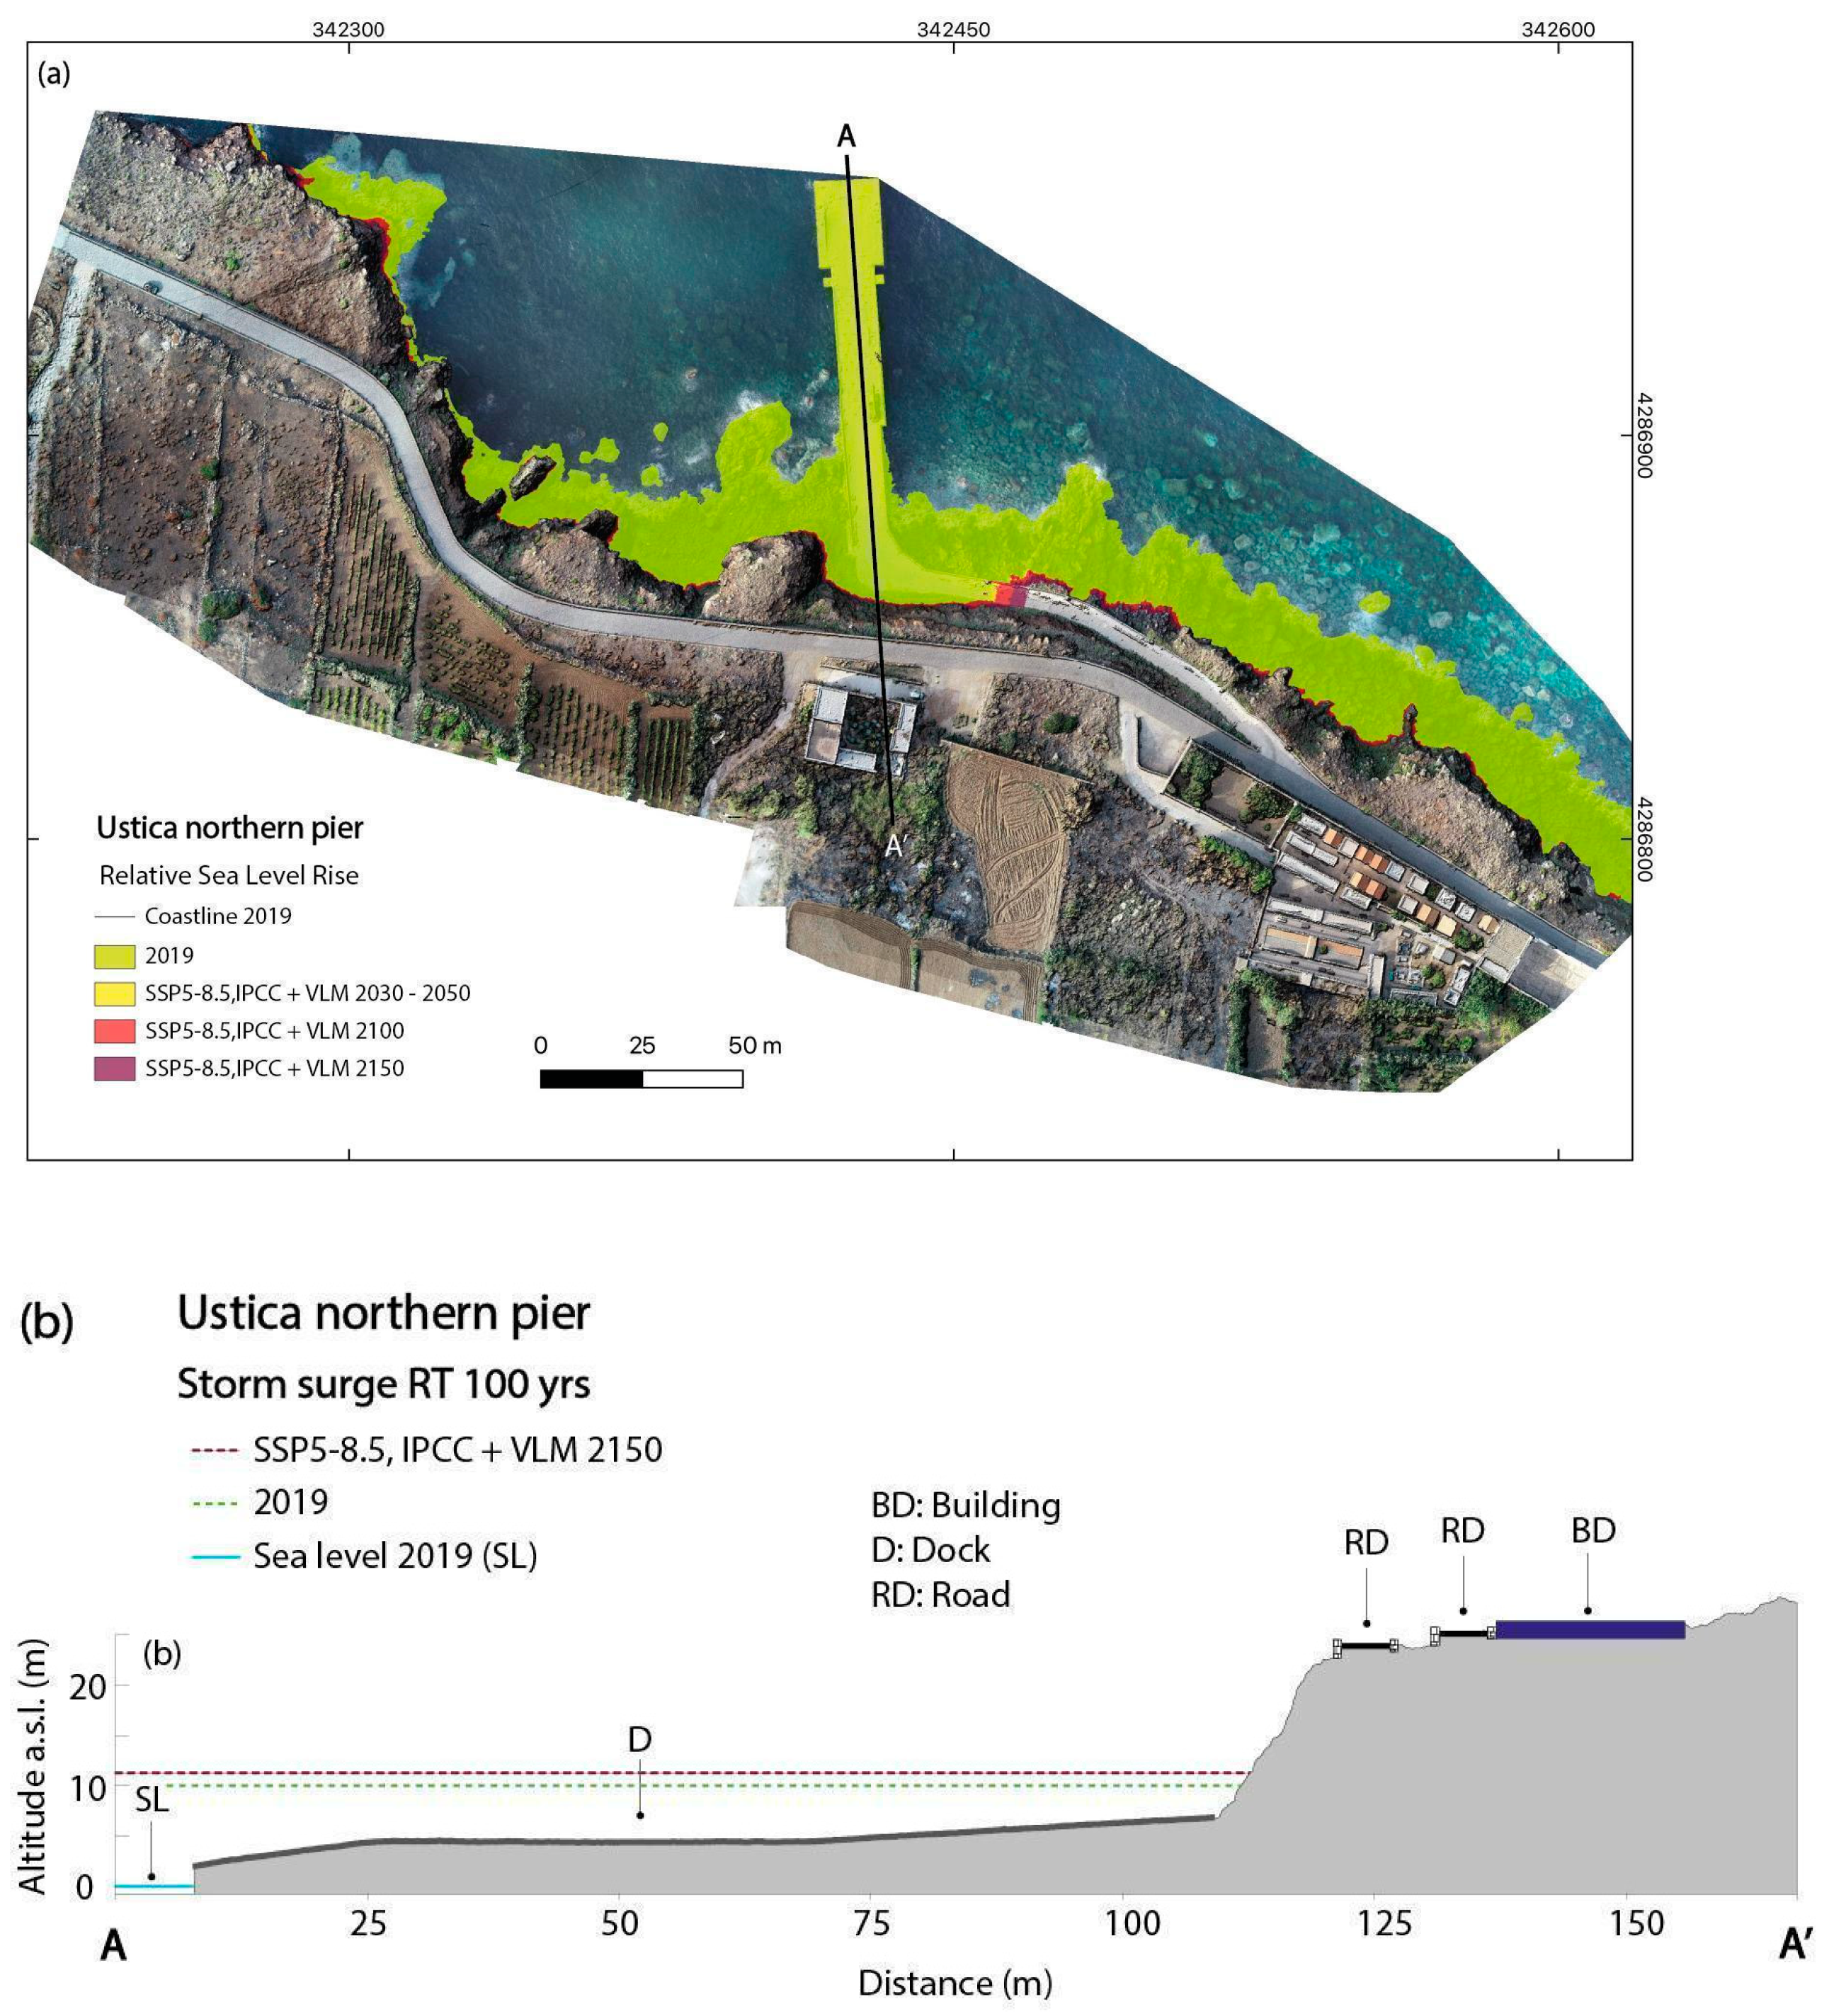
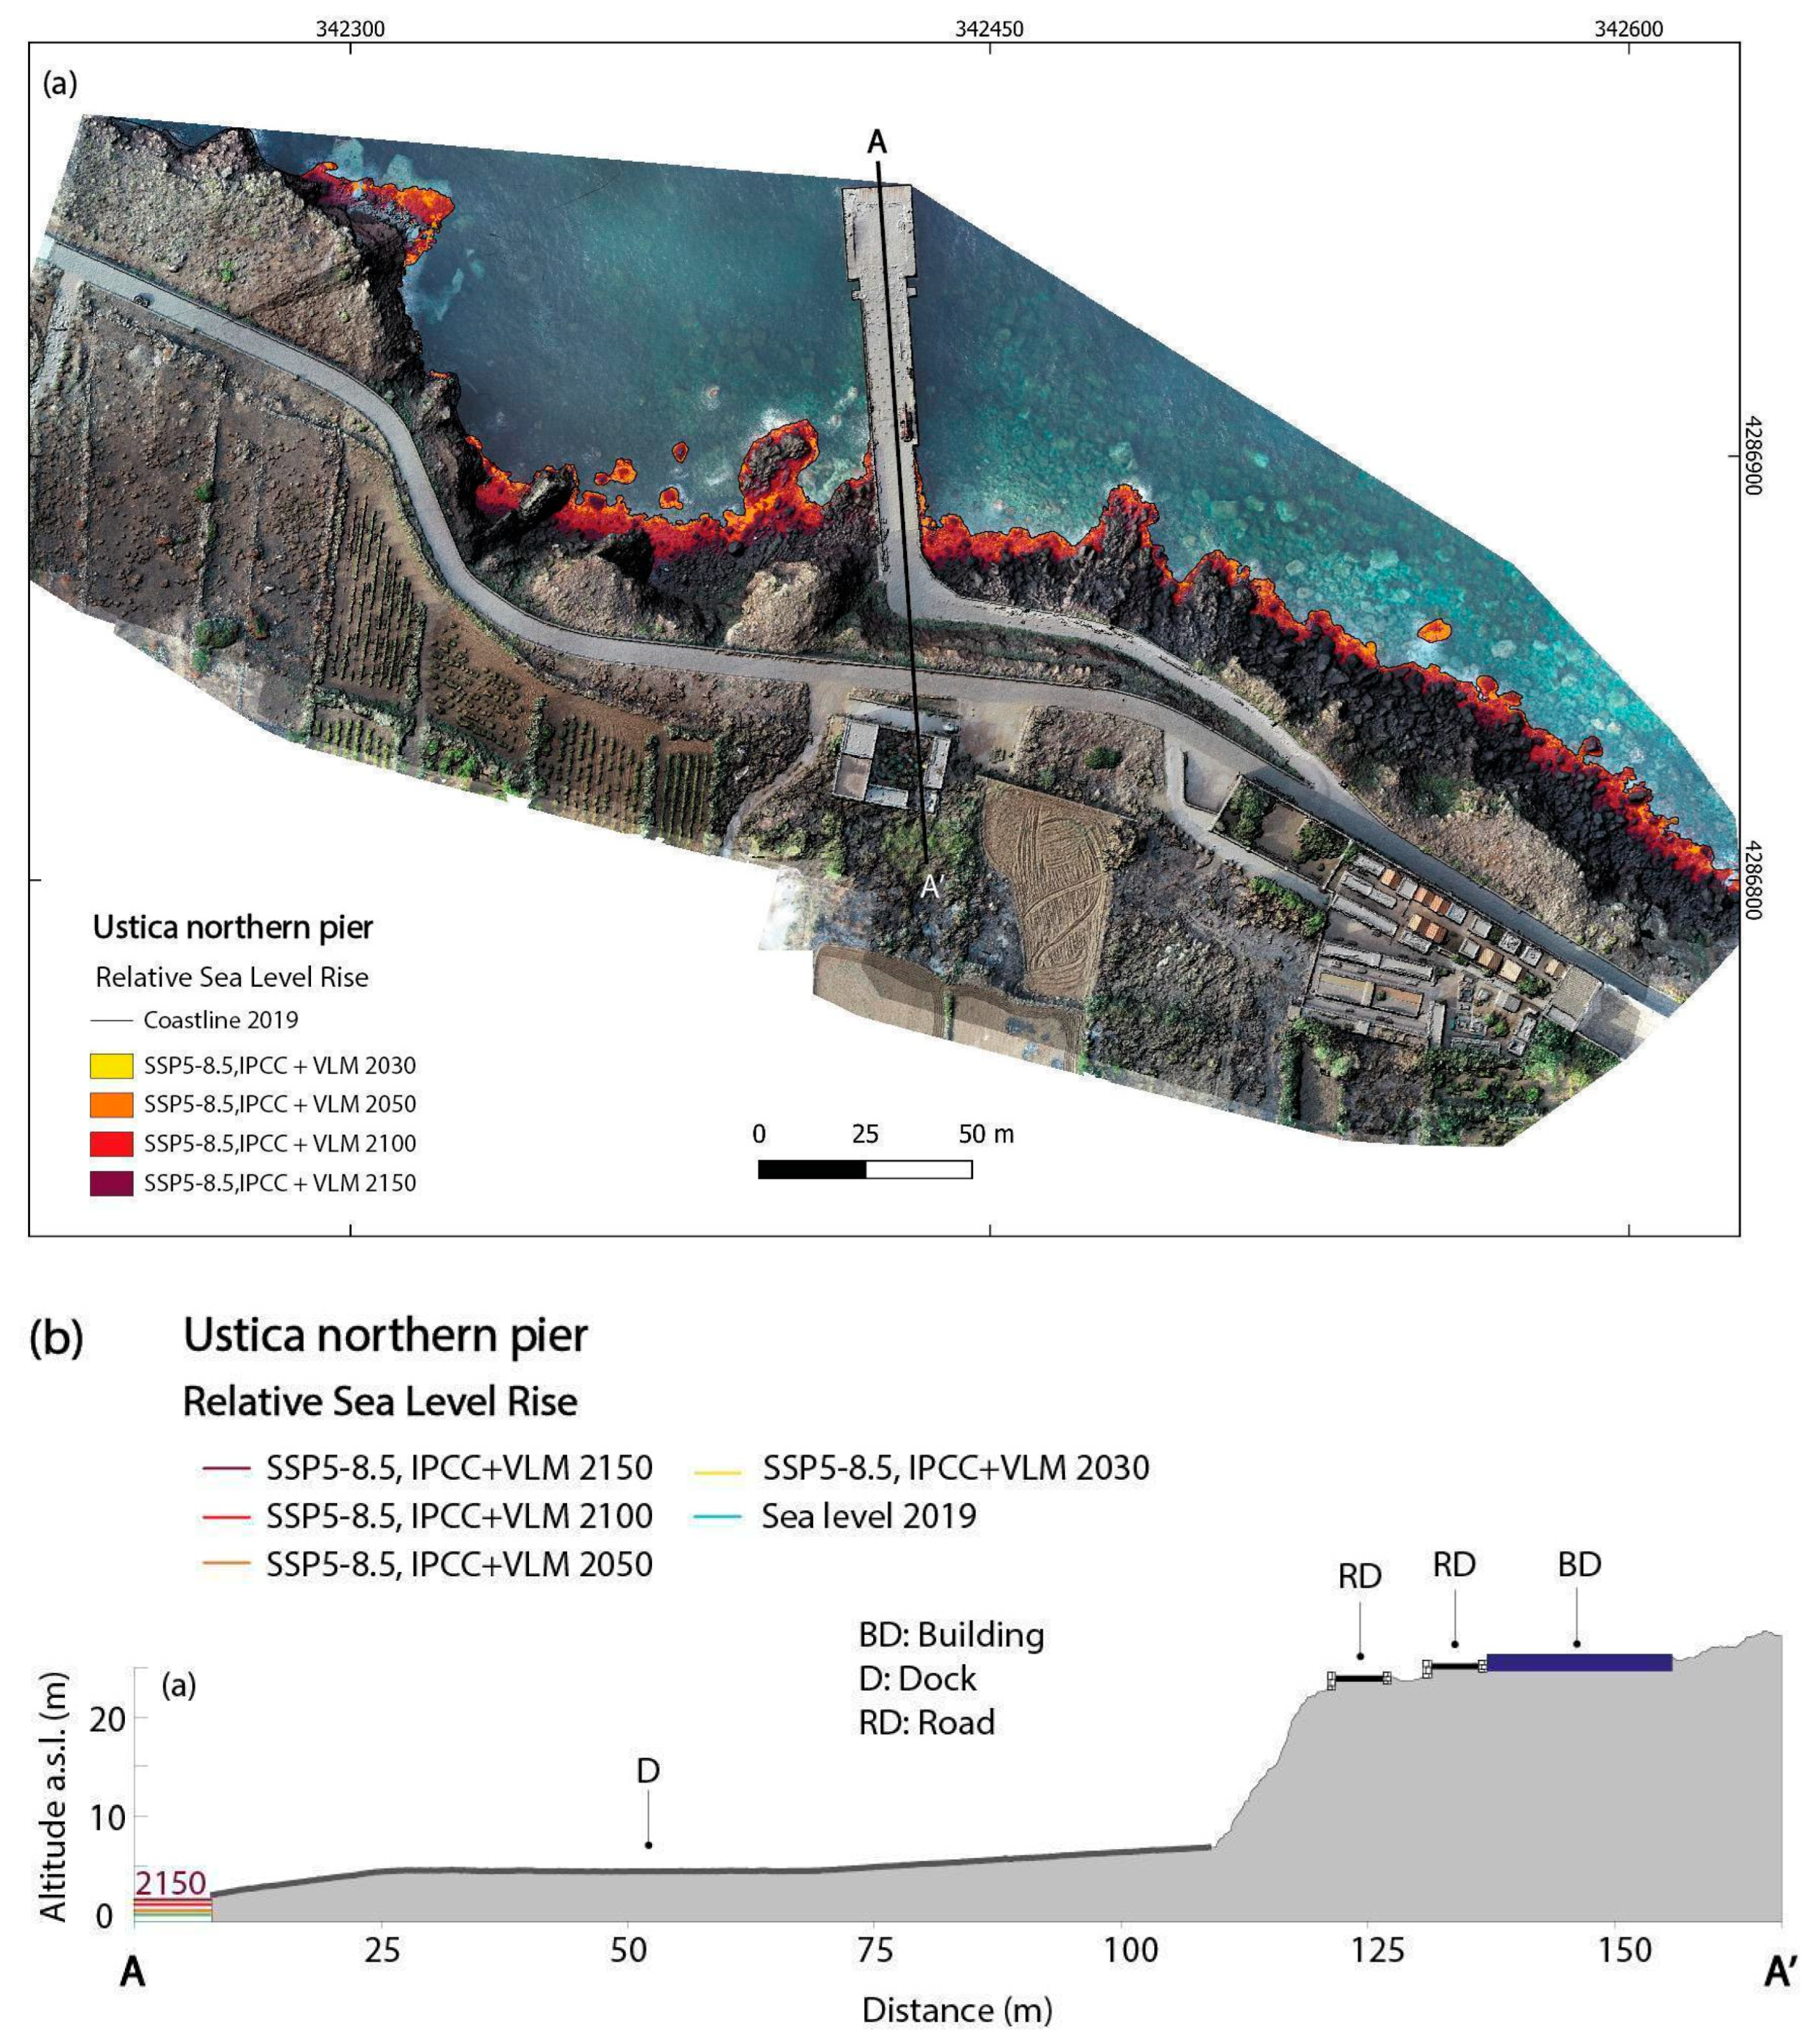
4.2. Northern Pier

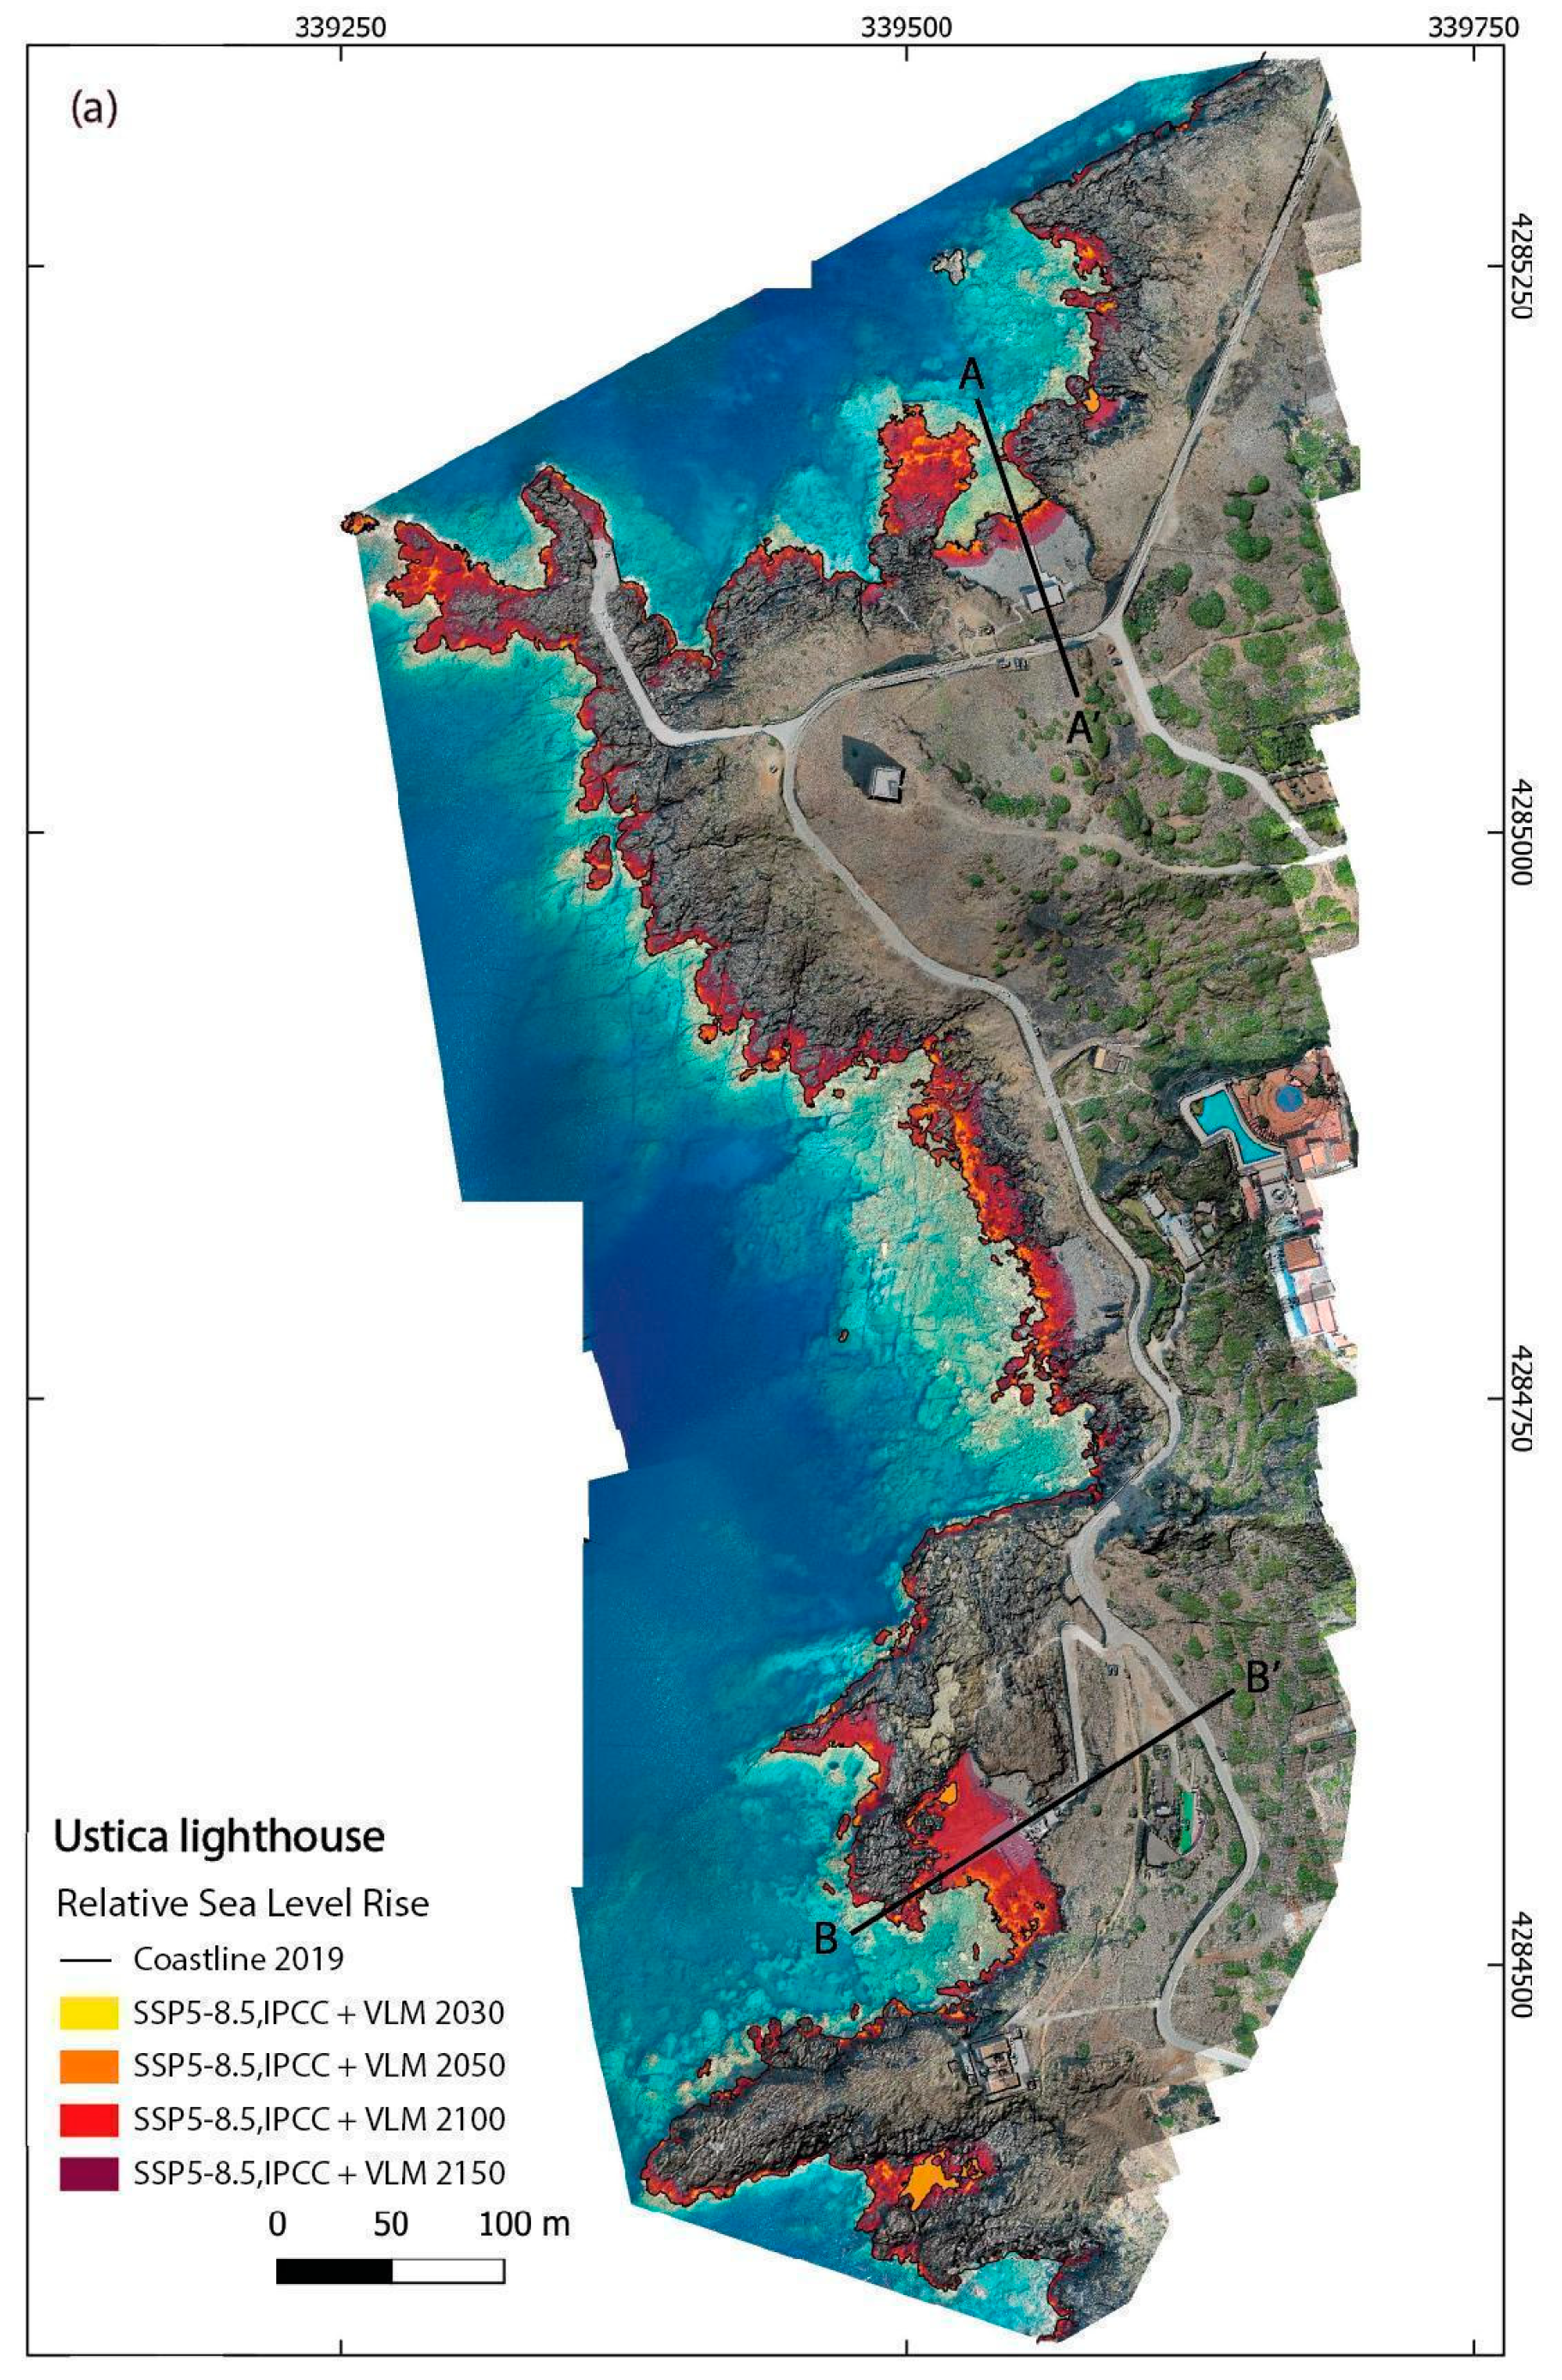
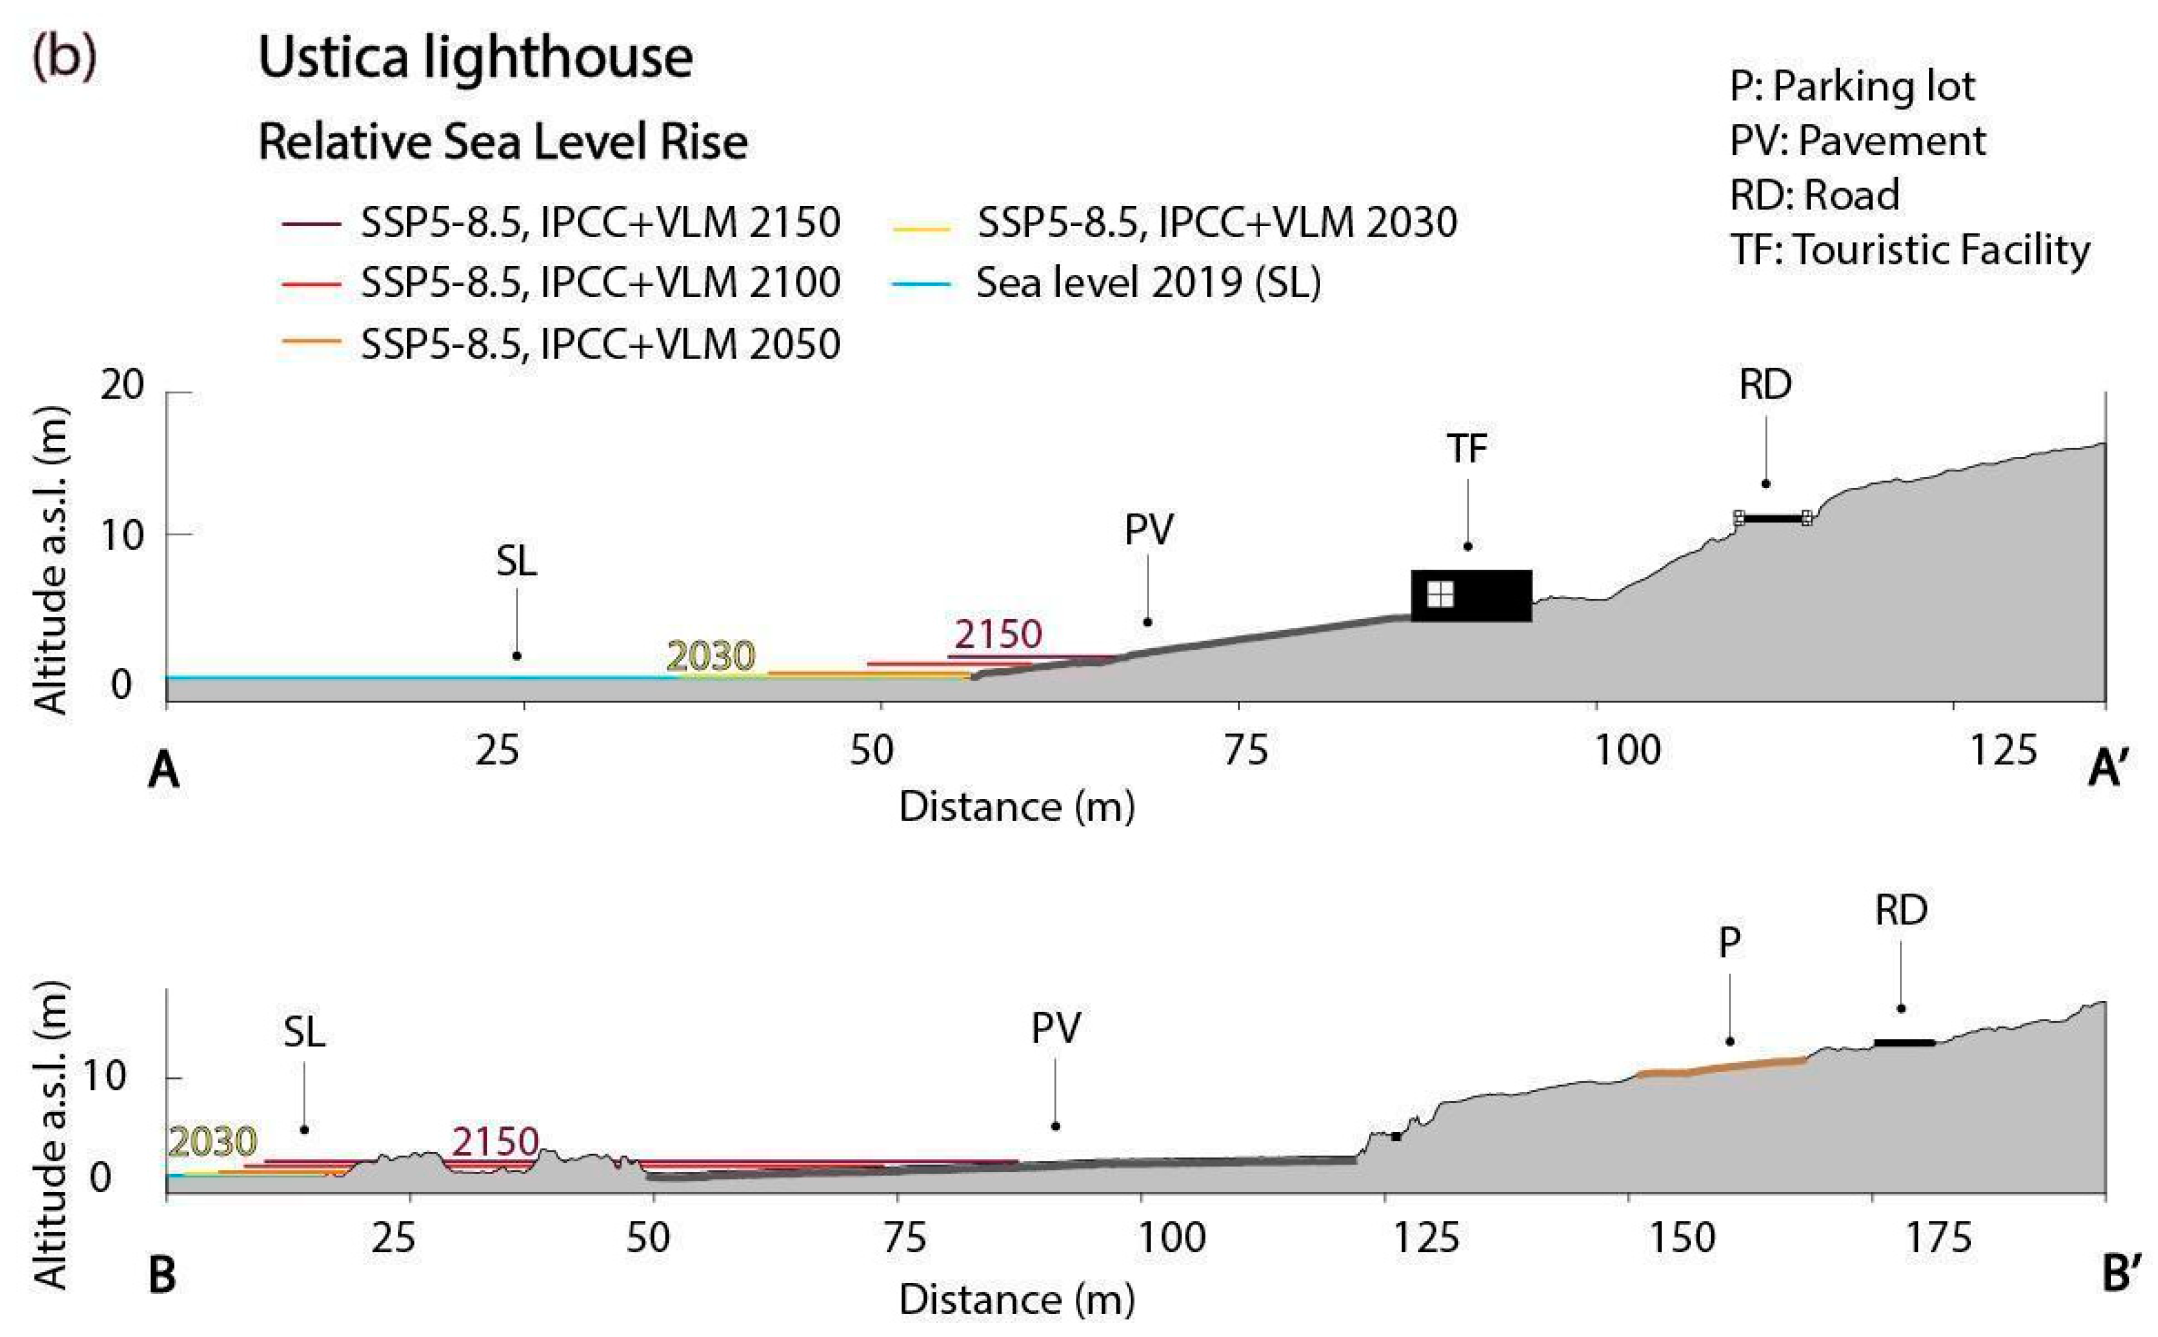
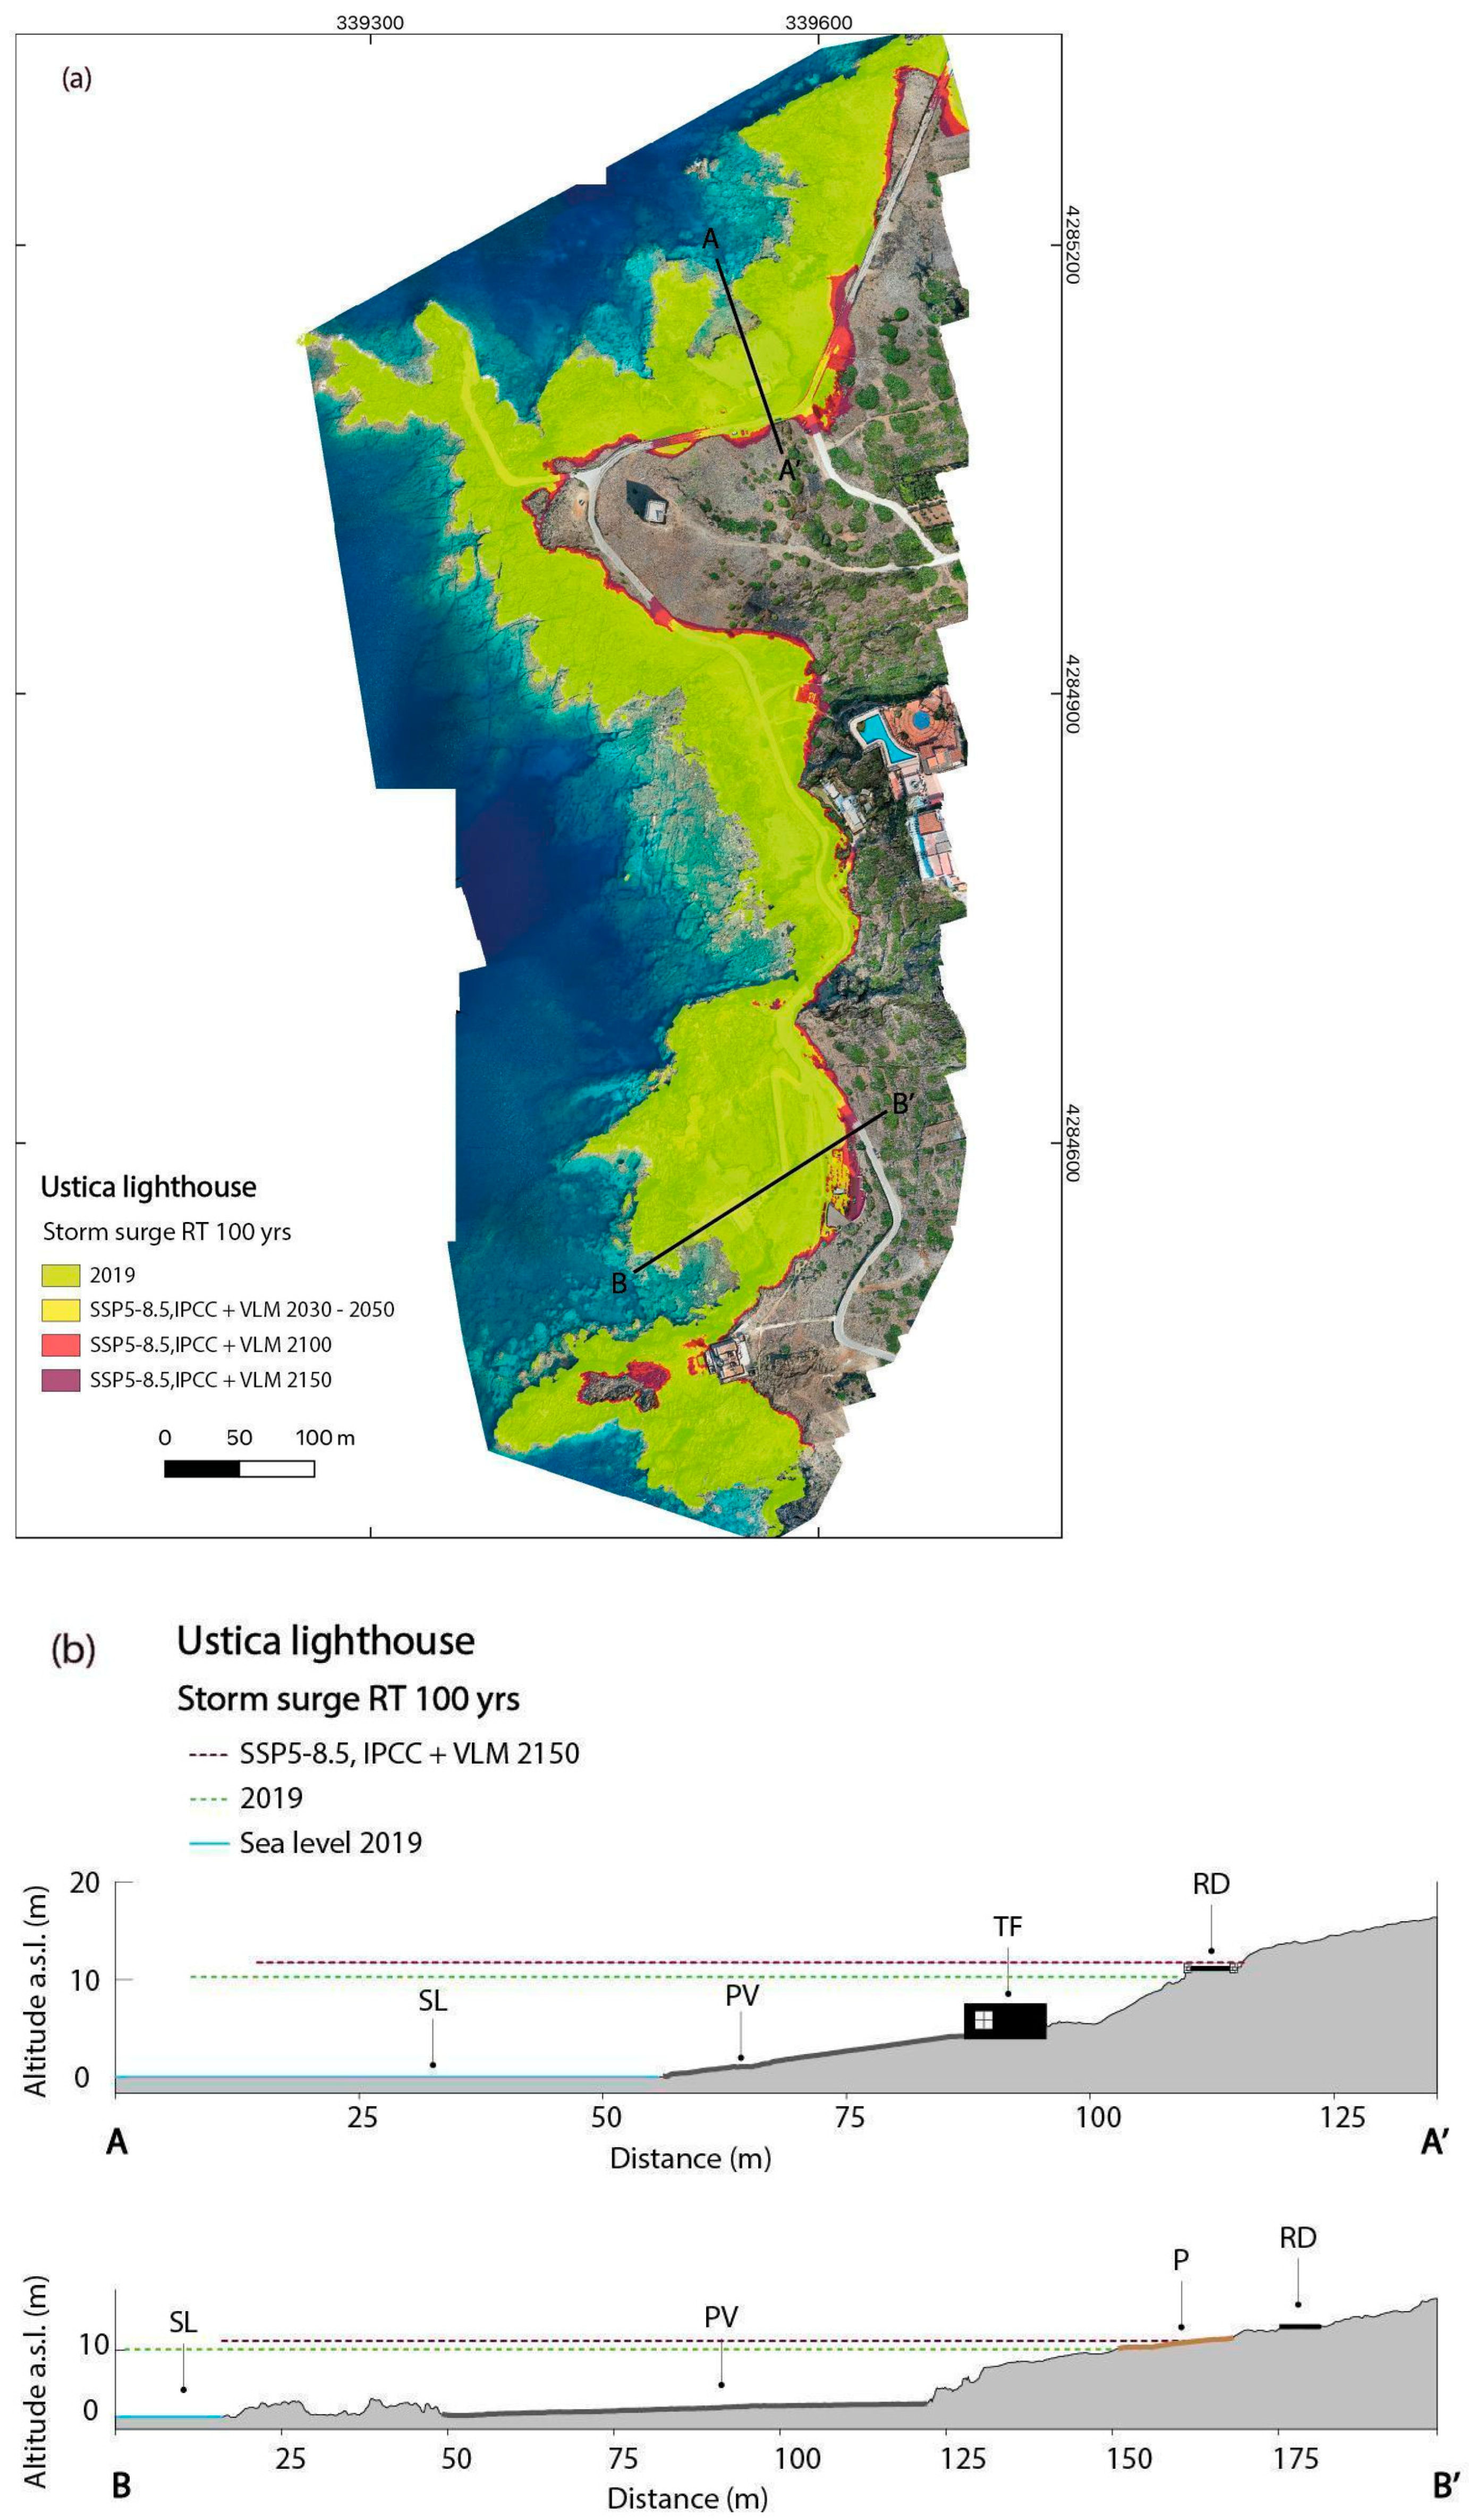
4.3. Punta Spalmatore Lighthouse


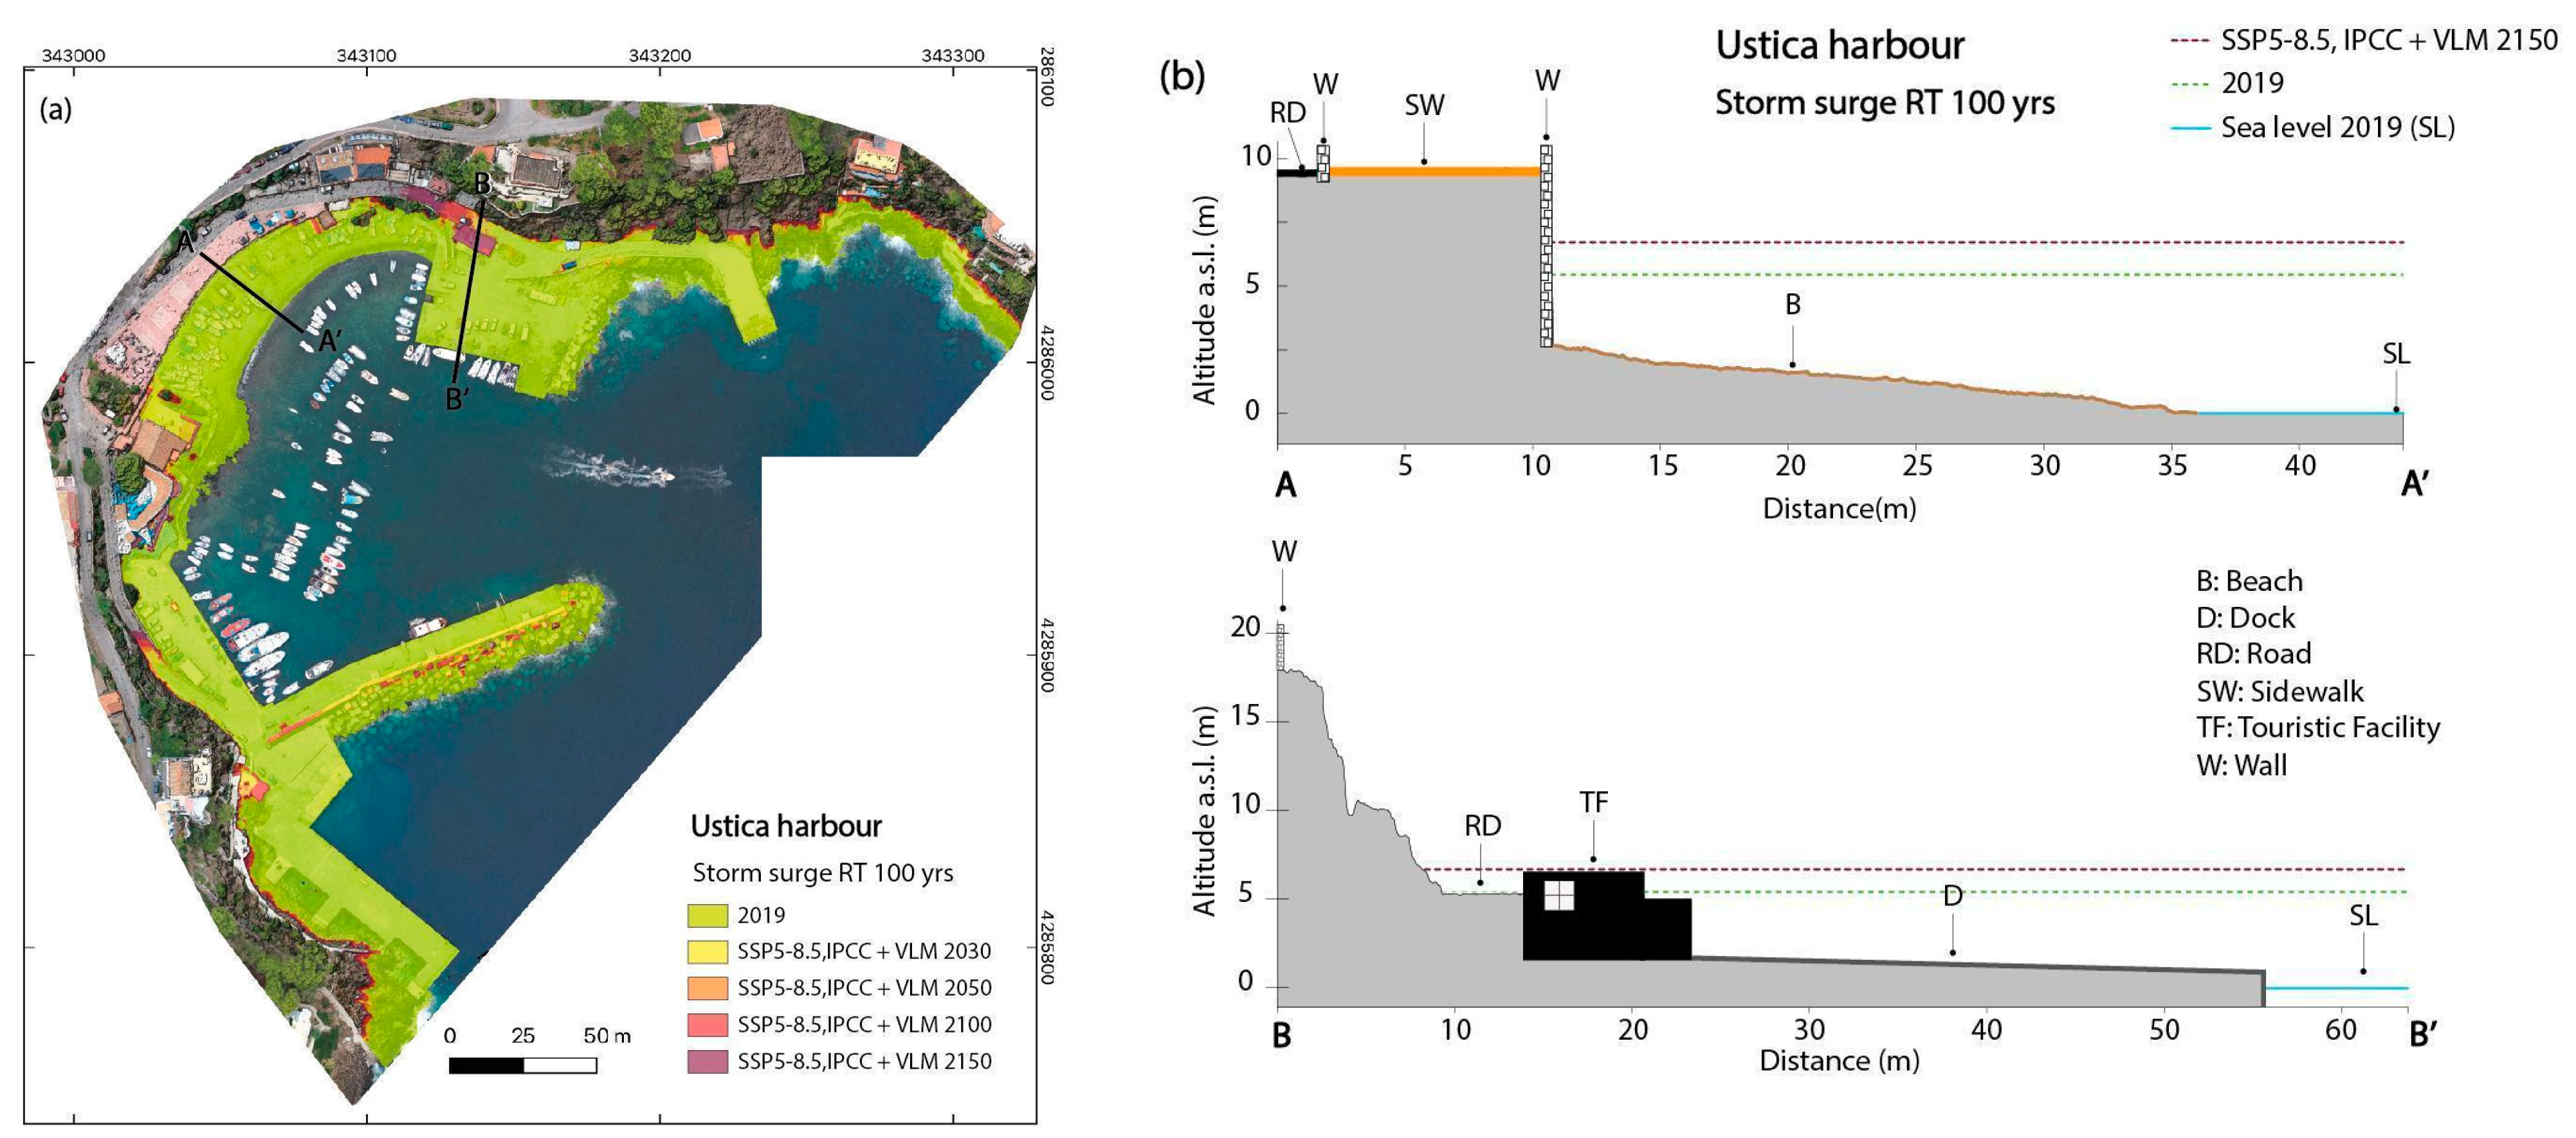
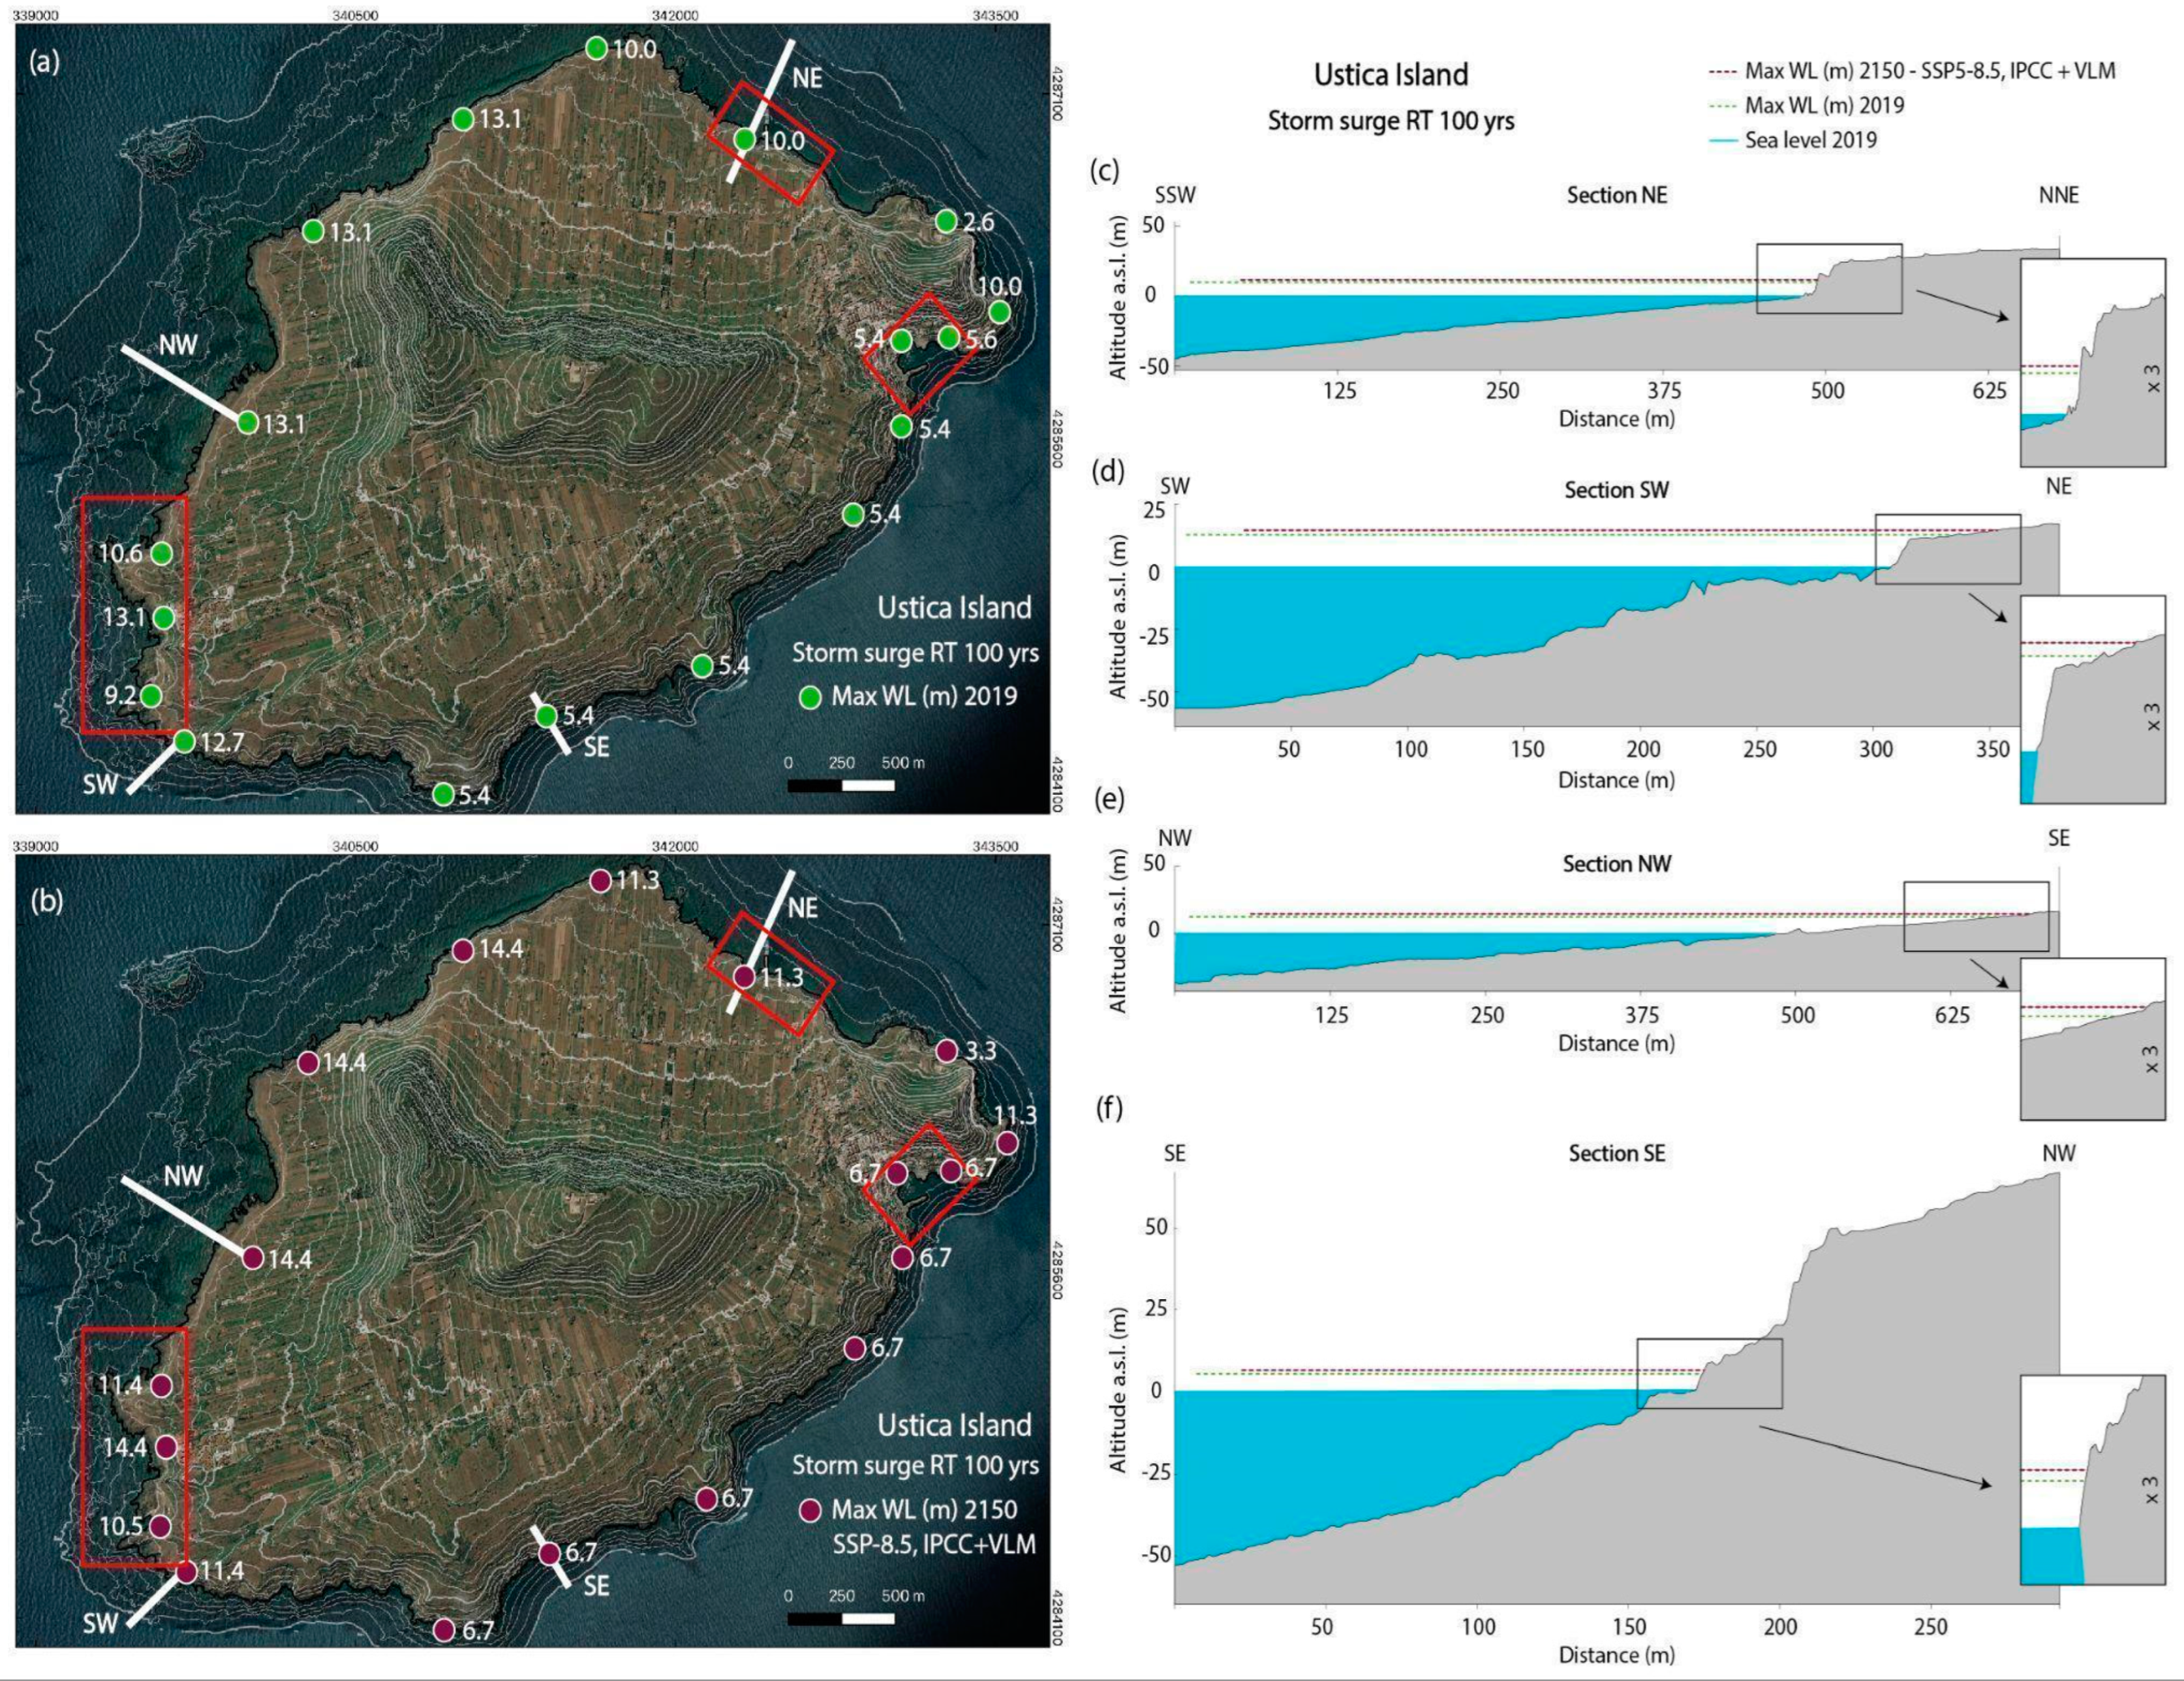
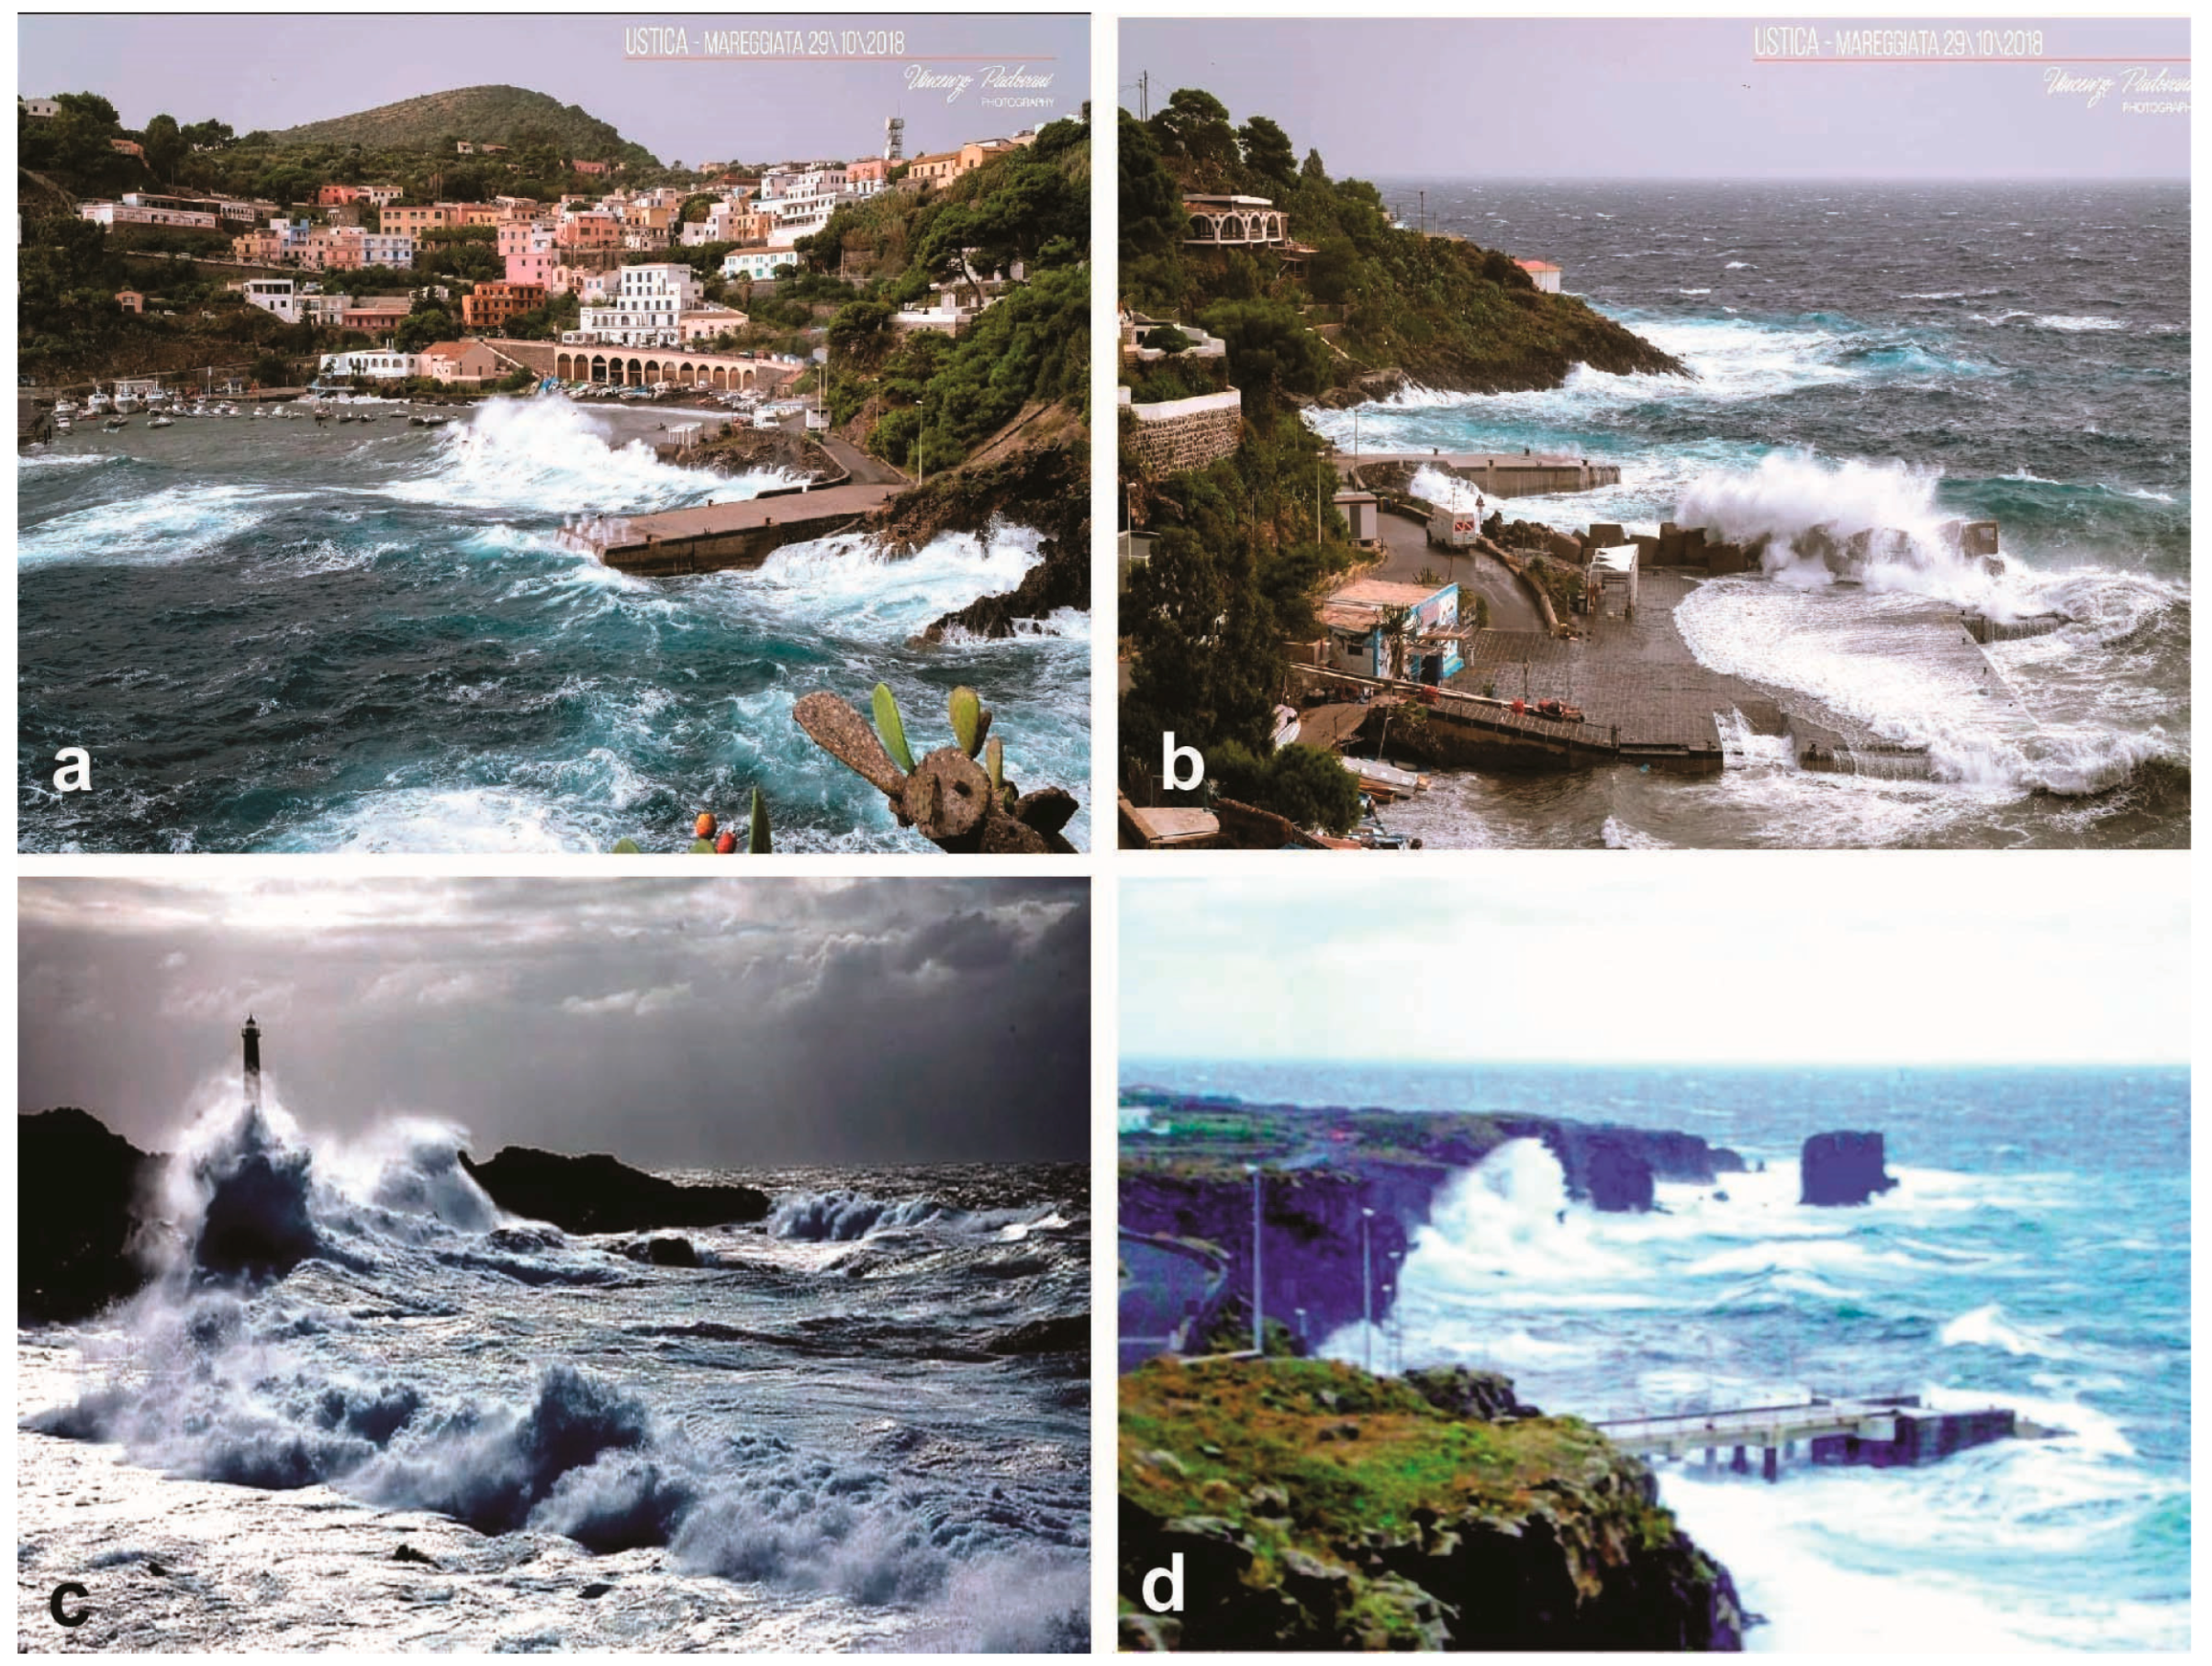
4.4. Storm Surge Scenarios


5. Conclusions
Supplementary Materials
Author Contributions
Funding
Informed Consent Statement
Data Availability Statement
Acknowledgments
Conflicts of Interest
References
- de Vita, S.; Guzzetta, G.; Orsi, G. Deformational features of the Ustica volcanic area in the Southern Tyrrhenian Sea (Italy). Terra Nova 1995, 7, 623–629. [Google Scholar] [CrossRef]
- Cinque, A.; Civetta, L.; Orsi, G.; Peccerillo, A. Geology and geochemistry of the island of Ustica (Southern Tyrrhenian Sea). Rend. Soc. It. Min. Petr. 1988, 43, 987–1002. [Google Scholar]
- de Vita, S.; Laurenzi, M.; Orsi, G.; Voltaggio, M. Application of 40Ar/39Ar and 230Th dating methods to the chronostratigraphy of Quaternary basaltic volcanic areas: The Ustica island case history. Quat. Int. 1998, 47/48, 117–127. [Google Scholar] [CrossRef]
- de Vita, S.; Martin, F.F. The palaeogeographic setting and the local environmental impact of the 130 ka Falconiera tuff-cone eruption (Ustica island, Italy). Ann. Geophys. 2017, 60, 2. [Google Scholar] [CrossRef]
- Sulli, A.; Zizzo, E.; Spatola, D.; Morticelli, M.G.; Agate, M.; Iacono, C.L.; Gargano, F.; Pepe, F.; Ciaccio, G. Growth and geomorphic evolution of the Ustica volcanic complex at the Africa-Europe plate margin (Tyrrhenian Sea). Geomorphology 2021, 374, 107526. [Google Scholar] [CrossRef]
- Furlani, S.; Antonioli, F.; Cavallaro, D.; Chirco, P.; Caldareri, F.; Martin, F.F.; Agate, M. Tidal notches, coastal landforms and relative sea-level changes during the Late Quaternary at Ustica Island (Tyrrhenian Sea, Italy). Geomorphology 2017, 299, 94–106. [Google Scholar] [CrossRef]
- Furlani, S.; Foresta Martin, F. Headland or stack? Paleogeographic reconstruction of the coast at the Faraglioni Middle Bronze Age Village (Ustica island, Italy). Ann. Geophys. 2019, 62, 1. [Google Scholar] [CrossRef]
- Fox-Kemper, B.; Hewitt, H.T.; Xiao, C.; Aðalgeirsdóttir, G.; Drijfhout, S.S.; Edwards, T.L.; Golledge, N.R.; Hemer, M.; Kopp, R.E.; Krinner, G.; et al. Ocean, cryosphere, and sea level change. In Climate Change: The Physical Science Basis. Contribution of Working Group I to the Sixth Assessment Report of the Intergovernmental Panel on Climate Change; Masson-Delmotte, V., Zhai, P., Pirani, A., Eds.; Cambridge University Press: Cambridge, UK, 2021. [Google Scholar]
- Oppenheimer, M.; Glavovic, B.; Hinkel, J.; van de Wal, R.; Magnan, A.K.; Abd-Elgawad, A.; Cai, R.; Cifuentes-Jara, M.; DeConto, R.M.; Gosh, T.; et al. Chapter 4: Sea level rise and implications for low lying islands, coasts and communities. In IPCC Special Report on the Ocean and Cryosphere in a Changing Climate; Pörtner, H.O., Roberts, D.C., Masson-Delmotte, V., Eds.; Cambridge University Press: Cambridge, UK, 2021. [Google Scholar]
- Barzaghi, R.; Borghi, A.; Carrion, D.; Sona, G. Refining the estimate of the Italian quasi-geoid. Boll. Geod. E Sci. Affin. 2017, 66, 145–159. [Google Scholar]
- Ullman, S. The interpretation of structure from motion. Proc. R. Soc. Lond. Ser. 1979, 203, 405–426. [Google Scholar]
- Colomina, I.; Molina, P. Unmanned aerial systems for photogrammetry and remote sensing: A review. ISPRS J. Photogramm. Remote Sens. 2014, 92, 79–97. [Google Scholar] [CrossRef]
- Serpelloni, E.; Cavaliere, A.; Martelli, L.; Pintori, F.; Anderlini, L.; Borghi, A.; Randazzo, D.; Bruni, S.; Devoti, R.; Perfetti, P.; et al. Surface Velocities and Strain-Rates in the Euro-Mediterranean Region: From Massive GPS Data Processing. Front. Earth Sci. 2022, 10, 907897. [Google Scholar] [CrossRef]
- Herring, T.A.; King, R.W.; McClusky, S.C. GAMIT Reference Manual, Release 10.4; Massachusetts Institute of Technology: Cambridge, MA, USA, 2010. [Google Scholar]
- Masson, C.; Mazzotti, S.; Vernant, P.; Doerflinger, E. Extracting Small Deformation beyond Individual Station Precision from Dense Global Navigation Satellite System (GNSS) Networks in France and Western Europe. Solid Earth. 2019, 10, 1905–1920. [Google Scholar] [CrossRef]
- Mentaschi, L.; Besio, G.; Cassola, F.; Mazzino, A. Developing and validating a forecast/hindcast system for the Mediterranean Sea. J. Coast. Res. 2013, 65, 1551–1556. [Google Scholar] [CrossRef]
- Mentaschi, L.; Pérez, J.; Besio, G.; Mendez, F.J.; Menendez, M. Parameterization of unresolved obstacles in wave modelling: A source term approach. Ocean. Model. 2015, 96, 93–102. [Google Scholar] [CrossRef]
- Lambeck, K.; Antonioli, F.; Anzidei, M.; Ferranti, L.; Leoni, G.; Scicchitano, G.; Silenzi, S. Sea level change along the Italian coast during the Holocene and projections for the future. Quat. Int. 2011, 232, 250–257. [Google Scholar] [CrossRef]
- Anzidei, M.; Bosman, A.; Carluccio, R.; Casalbore, D.; D’Ajello Caracciolo, F.; Esposito, A.; Nicolosi, I.; Pietrantonio, G.; Vecchio, A.; Carmisciano, C.; et al. Flooding scenarios due to land subsidence and sea-level rise: A case study for Lipari Island (Italy). Terra Nova 2017, 29, 44–51. [Google Scholar] [CrossRef]
- Anzidei, M.; Scicchitano, G.; Tarascio, S.; De Guidi, G.; Monaco, C.; Barreca, G.; Mazza, G.; Serpelloni, E.; Vecchio, A. Coastal retreat and marine flooding scenario for 2100: A case study along the coast of Maddalena Peninsula (southeastern Sicily). Geogr. Fis. Dinam. Quat. 2018, 41, 5–16. [Google Scholar]
- Ravanelli, R.; Riguzzi, F.; Anzidei, M.; Vecchio, A.; Nigro, L.; Spagnoli, F.; Crespi, M. Sea level rise scenario for 2100 A.D. for the archaeological site of Motya. Rend. Fis. Acc. Lincei 2019, 30, 747–757. [Google Scholar] [CrossRef]
- Anzidei, M.; Doumaz, F.; Vecchio, A.; Serpelloni, E.; Pizzimenti, L.; Civico, R.; Greco, M.; Martino, G.; Enei, F. Sea Level Rise Scenario for 2100 A.D. in the Heritage Site of Pyrgi (Santa Severa, Italy). J. Mar. Sci. Eng. 2020, 8, 64. [Google Scholar] [CrossRef]
- Antonioli, F.; De Falco, G.; Lo Presti, V.; Moretti, L.; Scardino, G.; Anzidei, M.; Bonaldo, D.; Carniel, S.; Leoni, G.; Furlani, S.; et al. Relative Sea-Level Rise and Potential Submersion Risk for 2100 on 16 Coastal Plains of the Mediterranean Sea. Water 2020, 12, 2173. [Google Scholar] [CrossRef]
- Anzidei, M.; Scicchitano, G.; Scardino, G.; Bignami, C.; Tolomei, C.; Vecchio, A.; Serpelloni, E.; De Santis, V.; Monaco, C.; Milella, M.; et al. Relative Sea-Level Rise Scenario for 2100 along the Coast of South Eastern Sicily (Italy) by InSAR Data, Satellite Images and High-Resolution Topography. Remote Sens. 2021, 13, 1108. [Google Scholar] [CrossRef]
- Scardino, G.; Anzidei, M.; Petio, P.; Serpelloni, E.; De Santis, V.; Rizzo, A.; Liso, S.I.; Zingaro, M.; Capolongo, D.; Vecchio, A.; et al. The Impact of Future Sea-Level Rise on Low-Lying Subsiding Coasts: A Case Study of Tavoliere Delle Puglie (Southern Italy). Remote Sens. 2022, 14, 4936. [Google Scholar] [CrossRef]
- Romagnoli, C.; Bosman, A.; Casalbore, D.; Anzidei, M.; Doumaz, F.; Bonaventura, F.; Meli, M.; Verdirame, C. Coastal Erosion and Flooding Threaten Low-Lying Coastal Tracts at Lipari (Aeolian Islands, Italy). Remote Sens. 2022, 14, 2960. [Google Scholar] [CrossRef]
- Loizidou, X.I.; Orthodoxou, D.L.; Loizides, M.I.; Petsa, D.; Anzidei, M. Adapting to sea level rise: Participatory, solution-oriented policy tools in vulnerable Mediterranean areas. Environ. Syst. Decis. 2023, 1–19. [Google Scholar] [CrossRef]
- Masselink, G.; Hughes, M.G. Introduction to Coastal Processes and Geomorphology; McCann, S.B., Ed.; Edward Arnold: London, UK, 2003; Volume 354, p. 1980. [Google Scholar]
- Chiocci, F.L.; Romagnoli, C.; Tommasi, P.; Bosman, A. The Stromboli 2002 tsunamigenic submarine slide: Characteristics and possible failure mechanisms. J. Geophys. Res. 2008, 113, B10102. [Google Scholar] [CrossRef]
- Komar, P.D.; Gaughan, M.K. Airy wave theory and breaker height prediction. In Proceedings of the 13th Coastal Engineering Conference; Americcan Society of Civil Engineers: Reston, VA, USA, 1973; pp. 405–418. [Google Scholar]
- Longuet-Higgins, M.S.; Stewart, R.W. A note on Wave setup. J. Mar. Res. 1963, 21, 4–10. [Google Scholar]
- Mase, H. Random wave runup height on gentle slope. J. Waterw. Port Coast. Ocean. Eng. 1989, 115, 649–661. [Google Scholar] [CrossRef]
- Mentaschi, L.; Besio, G.; Cassola, F.; Mazzino, A. Performance evaluation of WavewatchIII in the Mediterranean Sea. Ocean Modelling 2015, 90, 82–94. [Google Scholar] [CrossRef]
- Weggel, J.R. Maximum breaker height. J. Waterw. Harb. Coast. Eng. Div. 1972, 98, 529–548. [Google Scholar] [CrossRef]

| Survey Data | Northern Pier | Lighthouse | Harbor |
|---|---|---|---|
| number of images | 179 | 726 | 54 |
| flight altitude | 85 | 90 | 105 |
| GSD (cm/pixel) | 1.97 | 2.02 | 2.46 |
| covered area (m2) | 61,000 | 327,000 | 68,000 |
| land area (m2) | 42,017 | 181,582 | 28,457 |
| flight duration (min) | 10 | 45 | 5 |
| N.GCP (survey) | 6 | 11 | 9 |
| N.GCP (LiDAR GCP) | 24 | 40 | 10 |
| RMSE Z (m) compared to LiDAR | 0.12 | 0.11 | 0.06 |
| DEM resolution (m) | 0.3 | 0.3 | 0.3 |
| dense cloud points | 228,611,527 | 237,752,605 | 80,091,741 |
| exported CS | WGS84/UTM Zone 33N (EPSG: 32633) | ||
| ellipsoid | ITALGEO 05 | ||
| survey data | 21 September 2019 | 21 September 2019 | 22 September 2019 |
| Coastal Area | RSLR Scenario for 2150 SSP5-8.5 | RSLR Scenario for 2150 SSP5-8.5 | SS Scenario for 2150 SSP5-8.5 |
|---|---|---|---|
| Northern Pier | 5.4% | 18.4% | 19.2% |
| Lighthouse | 10.3% | 50.6% | 55.9% |
| Harbor | 13.3% | 50.1% | 56.2% |
Disclaimer/Publisher’s Note: The statements, opinions and data contained in all publications are solely those of the individual author(s) and contributor(s) and not of MDPI and/or the editor(s). MDPI and/or the editor(s) disclaim responsibility for any injury to people or property resulting from any ideas, methods, instructions or products referred to in the content. |
© 2023 by the authors. Licensee MDPI, Basel, Switzerland. This article is an open access article distributed under the terms and conditions of the Creative Commons Attribution (CC BY) license (https://creativecommons.org/licenses/by/4.0/).
Share and Cite
Anzidei, M.; Trippanera, D.; Bosman, A.; Martin, F.F.; Doumaz, F.; Vecchio, A.; Serpelloni, E.; Alberti, T.; Rende, S.F.; Greco, M. Relative Sea-Level Rise Projections and Flooding Scenarios for 2150 CE for the Island of Ustica (Southern Tyrrhenian Sea, Italy). J. Mar. Sci. Eng. 2023, 11, 2013. https://doi.org/10.3390/jmse11102013
Anzidei M, Trippanera D, Bosman A, Martin FF, Doumaz F, Vecchio A, Serpelloni E, Alberti T, Rende SF, Greco M. Relative Sea-Level Rise Projections and Flooding Scenarios for 2150 CE for the Island of Ustica (Southern Tyrrhenian Sea, Italy). Journal of Marine Science and Engineering. 2023; 11(10):2013. https://doi.org/10.3390/jmse11102013
Chicago/Turabian StyleAnzidei, Marco, Daniele Trippanera, Alessandro Bosman, Franco Foresta Martin, Fawzi Doumaz, Antonio Vecchio, Enrico Serpelloni, Tommaso Alberti, Sante Francesco Rende, and Michele Greco. 2023. "Relative Sea-Level Rise Projections and Flooding Scenarios for 2150 CE for the Island of Ustica (Southern Tyrrhenian Sea, Italy)" Journal of Marine Science and Engineering 11, no. 10: 2013. https://doi.org/10.3390/jmse11102013
APA StyleAnzidei, M., Trippanera, D., Bosman, A., Martin, F. F., Doumaz, F., Vecchio, A., Serpelloni, E., Alberti, T., Rende, S. F., & Greco, M. (2023). Relative Sea-Level Rise Projections and Flooding Scenarios for 2150 CE for the Island of Ustica (Southern Tyrrhenian Sea, Italy). Journal of Marine Science and Engineering, 11(10), 2013. https://doi.org/10.3390/jmse11102013