

Measurement of Turbidity and Total Suspended Matter in the Albufera of Valencia Lagoon (Spain) Using Sentinel-2 Images


Abstract
:1. Introduction
2. Materials and Methods
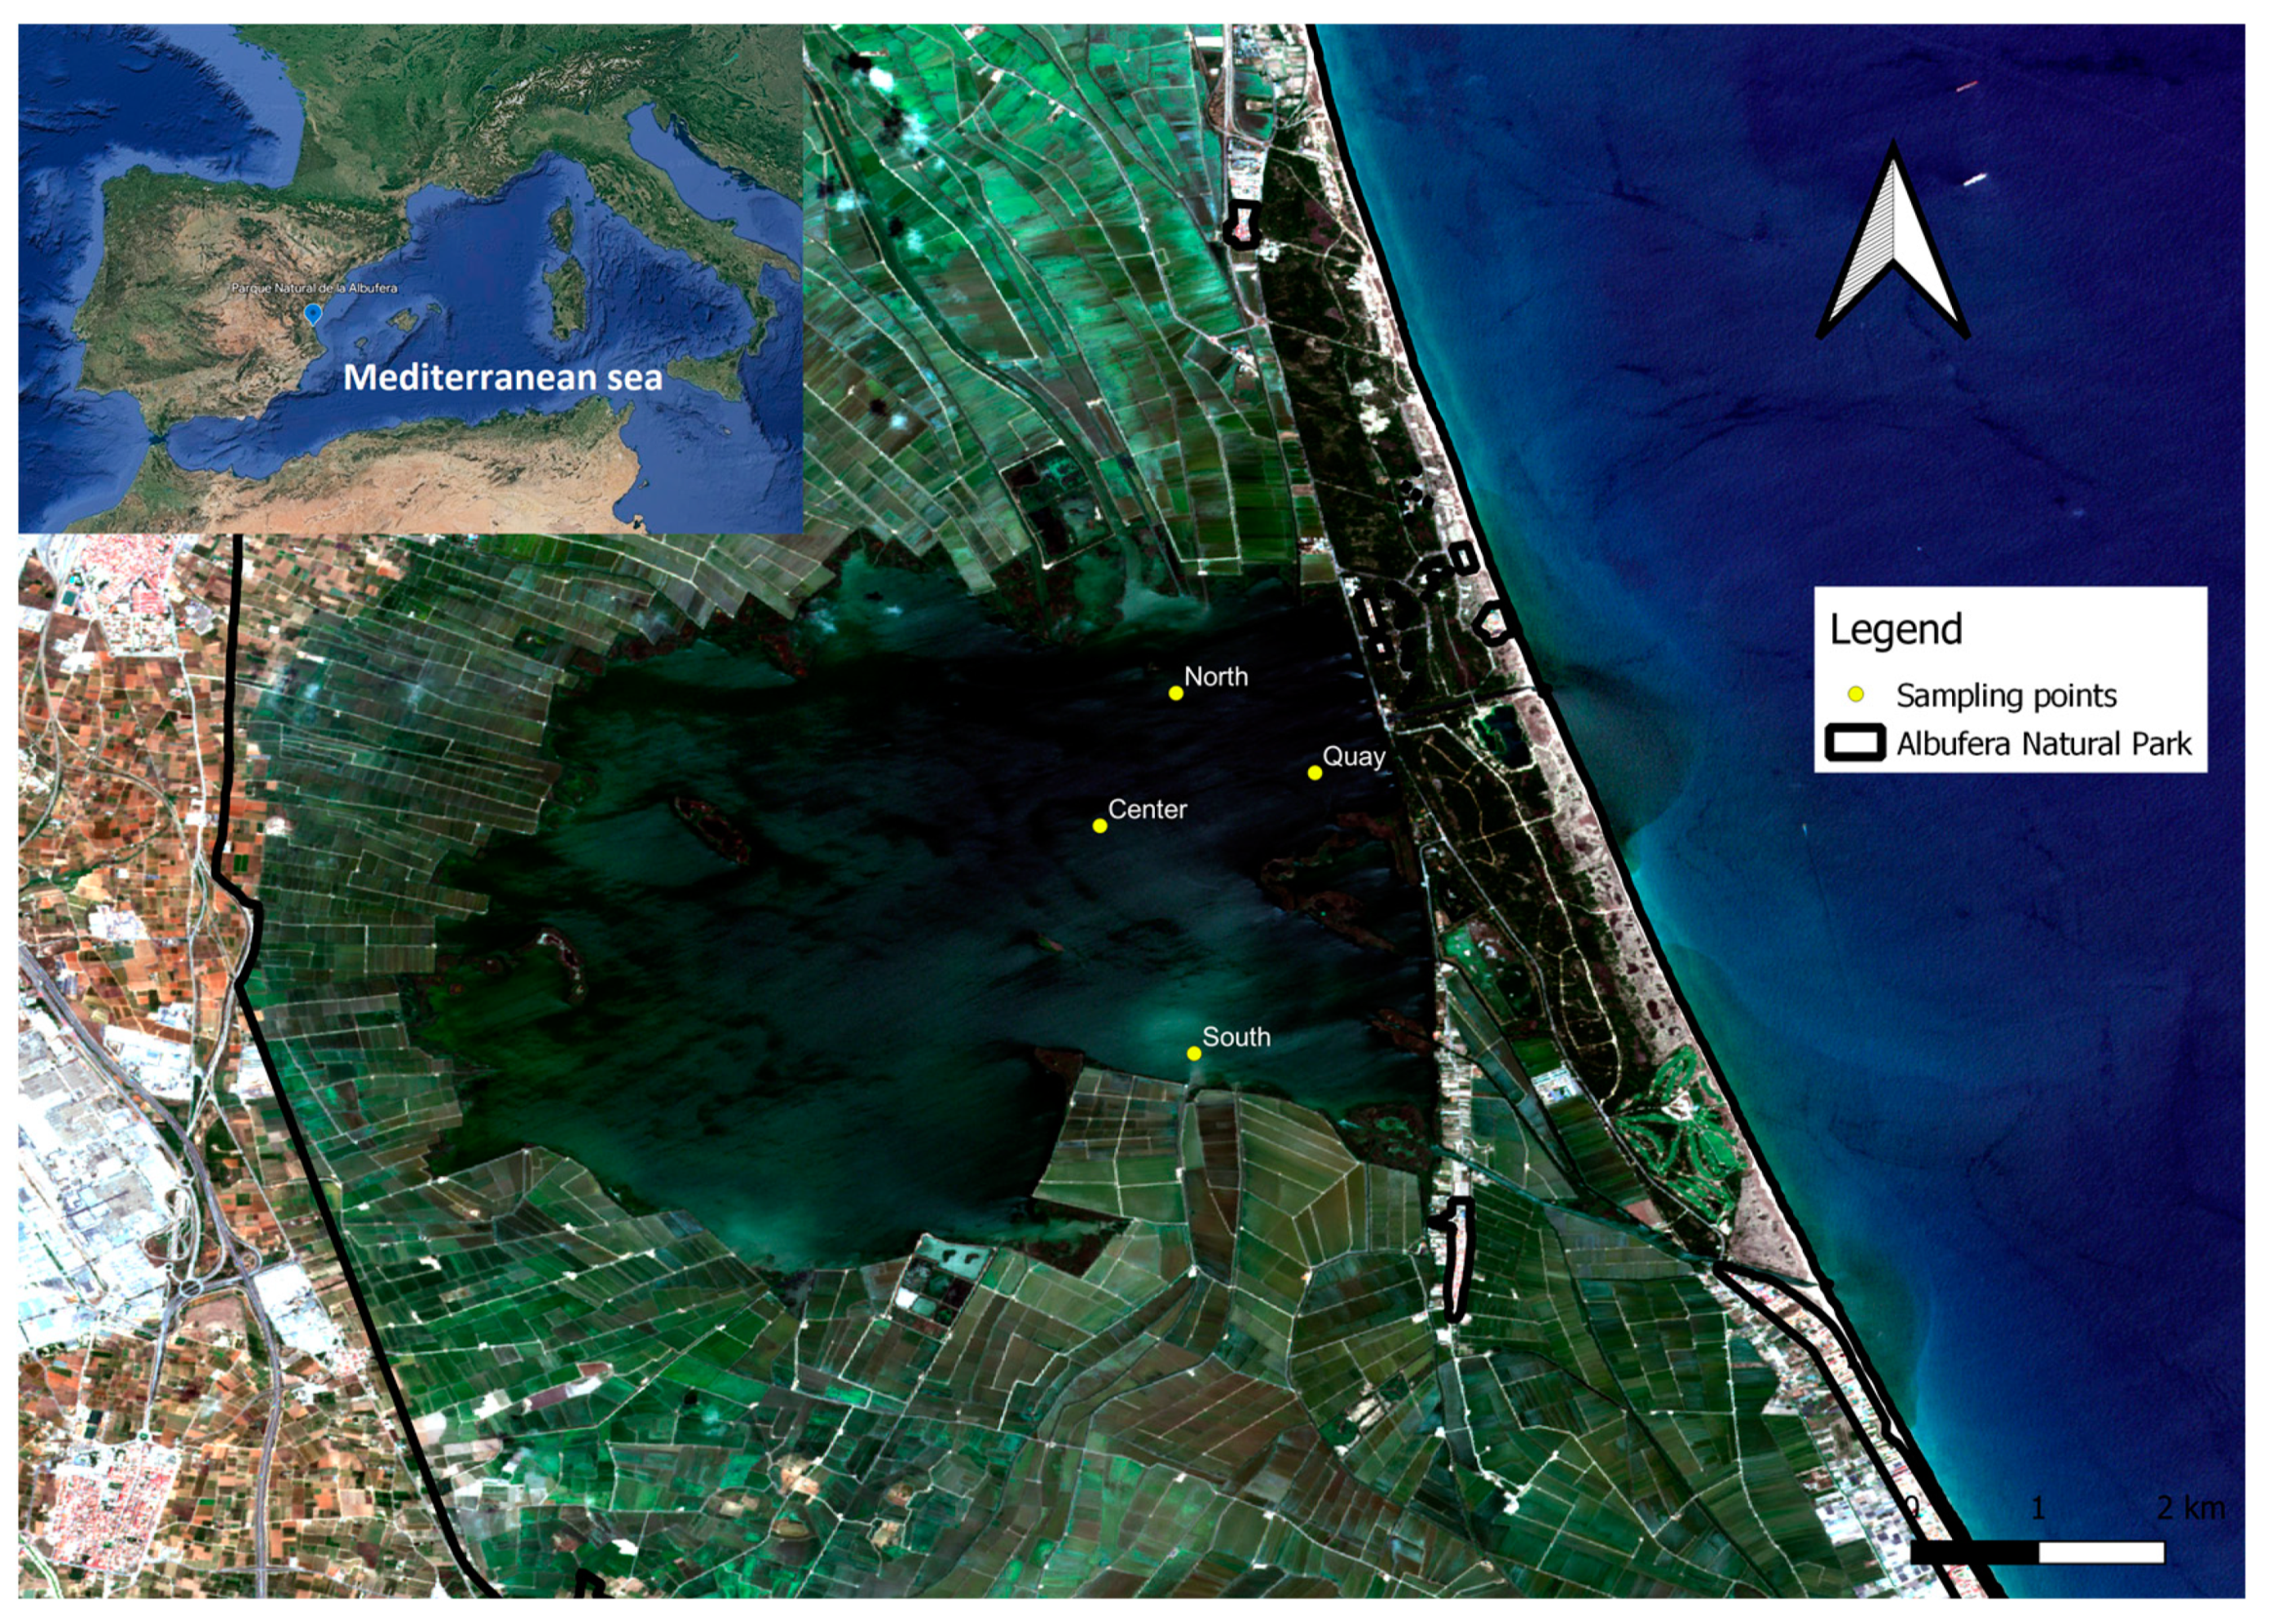
2.1. Study Area
2.2. Sampling and Laboratory Methods
2.3. Remote Sensing Imagery
2.4. Algorithm Retrieval
2.5. Data Analysis
3. Results
3.1. Field and Laboratory Data
3.2. Algorithm Retrieval and Validation
4. Discussion
5. Conclusions
Author Contributions
Funding
Institutional Review Board Statement
Informed Consent Statement
Data Availability Statement
Conflicts of Interest
References
- Dodds, W.K.; Whiles, M.R. Freshwater Ecology: Concepts and Environmental Applications of Limnology, 3rd ed.; Elsevier: Amsterdam, The Netherlands, 2020; 981p. [Google Scholar]
- Forman, R.T.; Alexander, L.E. Roads and their major ecological effects. Annu. Rev. Ecol. Syst. 1998, 29, 207–231. [Google Scholar] [CrossRef]
- Ryan, P.A. Environmental effects of sediment on New Zealand streams: A review. N. Z. J. Mar. Freshw. Res. 1991, 25, 207–221. [Google Scholar] [CrossRef]
- Matthews, M.W. A current review of empirical procedures of remote sensing in inland and near coastal transitional waters. Int. J. Remote Sens. 2011, 32, 6855–6899. [Google Scholar] [CrossRef]
- Noori, R.; Sabahi, M.S.; Karbassi, A.R.; Baghvand, A.; Zadeh, H.T. Multivariate statistical analysis of surface water quality based on correlations and variations in the data set. Desalination 2010, 260, 129–136. [Google Scholar] [CrossRef]
- Dekker, A.G.; Vos, R.J.; Peters, S.W.M. Analytical algorithms for lake water TSM estimation for retrospective analyses of TM and SPOT sensor data. Int. J. Remote Sens. 2002, 23, 15–35. [Google Scholar] [CrossRef]
- Miller, R.L.; McKee, B.A. Using MODIS Terra 250 m imagery to map concentrations of total suspended matter in coastal waters. Remote Sens. Environ. 2004, 93, 259–266. [Google Scholar] [CrossRef]
- Balasubramanian, S.V.; Pahlevan, N.; Smith, B.; Binding, C.; Schalles, J.; Loisel, H.; Gurlin, D.; Greb, S.; Alikas, S.; Randla, M.; et al. Robust algorithm for estimating total suspended solids (TSS) in inland and nearshore coastal waters. Remote Sens Environ. 2020, 246, 111768. [Google Scholar] [CrossRef]
- Sebastiá-Frasquet, M.-T.; Aguilar-Maldonado, J.A.; Santamaría-Del-Ángel, E.; Estornell, J. Sentinel 2 Analysis of Turbidity Patterns in a Coastal Lagoon. Remote Sens. 2019, 11, 2926. [Google Scholar] [CrossRef]
- Lindell, T.; Pierson, D.; Premazzi, G. Manual for Monitoring European Lakes Using Remote Sensing Techniques; Office for Official Publications of the European Communities: Luxembourg, 1999; 164p. [Google Scholar]
- European Spacial Agency (ESA). Sentinel-2: ESA’s Optical High-Resolution Mission for GMES Operational Services; Fletcher, K., Ed.; ESA Communications: Noordwijk, The Netherlands, 2012; 70p. [Google Scholar]
- Pereira-Sandoval, M.; Urrego, E.P.; Ruiz-Verdu, A.; Tenjo, C.; Delegido, J.; Soria-Perpinya, X.; Vicente, E.; Soria, J.M.; Moreno, J. Calibration and validation of algorithms for the estimation of chlorophyll-a concentration and Secchi depth in inland waters with Sentinel-2. Limnetica 2019, 38, 471–487. [Google Scholar] [CrossRef]
- Alvado, B.; Sòria-Perpinyà, X.; Vicente, E.; Delegido, J.; Urrego, P.; Ruíz-Verdú, A.; Soria, J.M.; Moreno, J. Estimating Organic and Inorganic Part of Suspended Solids from Sentinel 2 in Different Inland Waters. Water 2021, 13, 2453. [Google Scholar] [CrossRef]
- Romo, S.; Miracle, R. Long-term phytoplankton changes in a shallow hypertrophic lake, Albufera of Valencia (Spain). Hydrobiologia 1994, 275, 153–164. [Google Scholar] [CrossRef]
- Estrela-Segrelles, C.; Gómez-Martinez, G.; Pérez-Martín, M.Á. Risk assessment of climate change impacts on Mediterranean coastal wetlands. Application in Júcar River Basin District (Spain). Sci. Total Environ. 2021, 790, 148032. [Google Scholar] [CrossRef] [PubMed]
- Romo, S.; Villena, M.-J.; Sahuquillo, M.; Soria, J.M.; Giménez, M.; Alfonso, T.; Vicente, E.; Miracle, M.R. Response of a Shallow Mediterranean Lake to Nutrient Diversion: Does It Follow Similar Patterns as in Northern Shallow Lakes? Freshw. Biol. 2005, 50, 1706–1717. [Google Scholar] [CrossRef]
- Soria, J.M.; Miracle, M.R.; Vicente, E. Relations between physico–chemical and biological variables in aquatic ecosystems of the Albufera Natural Park (Valencia, Spain). SIL Proc. 2002, 28, 564–568. [Google Scholar] [CrossRef]
- Soria, J.; Vera-Herrera, L.; Calvo, S.; Romo, S.; Vicente, E.; Sahuquillo, M.; Sòria-Perpinyà, X. Residence Time Analysis in the Albufera of Valencia, a Mediterranean Coastal Lagoon, Spain. Hydrology 2021, 8, 37. [Google Scholar] [CrossRef]
- Onandia, G.; Gudimov, A.; Miracle, M.R.; Arhonditsis, G. Towards the development of a biogeochemical model for addressing the eutrophication problems in the shallow hypertrophic lagoon of Albufera de Valencia, Spain. Ecol. Inf. 2015, 26, 70–89. [Google Scholar] [CrossRef]
- Martín, M.; Hernández-Crespo, C.; Andrés-Doménech, I.; Benedito-Durá, V. Fifty years of eutrophication in the Albufera lake (Valencia, Spain): Causes, evolution and remediation strategies. Ecol. Eng. 2020, 155, 105932. [Google Scholar] [CrossRef]
- Scheffer, M.; Hosper, S.H.; Meijer, M.L.; Moss, B.; Jeppesen, E. Alternative equilibria in shallow lakes. Trends Ecol. Evol. 1993, 8, 275–279. [Google Scholar] [CrossRef]
- Romo, S.; García-Murcia, A.; Villena, M.J.; Sanchez, V.; Ballester, A. Phytoplankton trends in the lake of Albufera de Valencia and implications for its ecology, management, and recovery. Limnetica 2008, 27, 11–28. [Google Scholar] [CrossRef]
- Kutser, T. The possibility of using the Landsat image archive for monitoring long time trends in coloured dissolved organic matter concentration in lake waters. Remote Sens. Environ. 2012, 123, 334–338. [Google Scholar] [CrossRef]
- Wetzel, R.G.; Likens, G.E. Limnological Analyses, 3rd ed.; Springer: New York, NY, USA, 2000; 429p. [Google Scholar]
- Shoaf, W.T.; Lium, B.W. Improved extraction of chlorophyll a and b from algae using dimethyl sulfoxide. Limnol. Oceanogr. 1976, 21, 926–928. [Google Scholar] [CrossRef]
- Jeffrey, S.T.; Humphrey, G.F. New spectrophotometric equations for determining chlorophylls a, b, c1 and c2 in higher plants, algae and natural phytoplankton. Biochem. Physiol. Pflanz. 1975, 167, 191–194. [Google Scholar] [CrossRef]
- APHA. Standard Methods for the Examination of Water and Wastewater, 18th ed.; American Public Health Association: Washington, DC, USA, 1992; 558p. [Google Scholar]
- Saberioon, M.; Brom, J.; Nedbal, V.; Souček, P.; Císař, P. Chlorophyll-a and total suspended solids retrieval and mapping using Sentinel-2A and machine learning for inland waters. Ecol. Indic. 2020, 113, 106236. [Google Scholar] [CrossRef]
- Pereira-Sandoval, M.; Ruescas, A.; Urrego, P.; Ruiz-Verdú, A.; Delegido, J.; Tenjo, C.; Soria-Perpinyà, X.; Vicente, E.; Soria, J.; Moreno, J. Evaluation of Atmospheric Correction Algorithms over Spanish Inland Waters for Sentinel-2 Multi Spectral Imagery Data. Remote Sens. 2019, 11, 1469. [Google Scholar] [CrossRef]
- Koponen, S.; Pulliainen, J.; Kallio, K.; Hallikainen, M. Lake water quality classification with airborne hyperspectral spectrometer and simulated MERIS data. Remote Sens. Environ. 2002, 79, 51–59. [Google Scholar] [CrossRef]
- Maciel, D.; Novo, E.; Sander de Carvalho, L.; Babosa, C.; Flores Júnior, R.; Lobo, F.L. Retrieving total and inorganic suspended sediments in Amazon floodplain lakes: A multisensory approach. Remote Sens. 2019, 11, 1744. [Google Scholar] [CrossRef]
- Zhan, Y.; Delegido, J.; Erena, M.; Soria, J.M.; Ruiz-Verdú, A.; Urrego, P.; Sòria-Perpinyà, X.; Vicente, E.; Moreno, J. Mar Menor lagoon (SE Spain) chlorophyll-a and turbidity estimation with Sentinel-2. Limnetica 2022, 41, 1–19. [Google Scholar]
- Kallio, K.; Kutser, T.; Hannonen, T.; Koponen, S.; Pulliainen, J.; Vepslinen, J.; Puhlahti, T. Retrieval of water quality from airborne imaging spectrometry of various lake types in different seasons. Sci. Total Environ. 2001, 268, 5977. [Google Scholar] [CrossRef]
- Yuan, L.; Yulong, G.; Chunmei, C.; Yibo, Z.; Yaoduo, H.; Zhong, X.; Shun, B. Remote estimation of total suspended matter concentration in the Hangzhou Bay based on OLCI and its water color product applicability analysis. Haiyang Xuebao 2019, 41, 156–169. [Google Scholar]
- Soria, J.; Pérez, R.; Sòria-Pepinyà, X. Mediterranean Coastal Lagoons Review: Sites to Visit before Disappearance. J. Mar. Sci. Eng. 2022, 10, 347. [Google Scholar] [CrossRef]
- Doxaran, D.; Babin, M.; Leymarie, E. Near-infrared light scattering by particles in coastal waters. Opt. Express 2007, 15, 12834–12849. [Google Scholar] [CrossRef] [PubMed]
- Jiang, G.; Ma, R.; Loiselle, S.; Duan, H.; Su, W.; Cai, W.; Huang, C.; Yang, J.; Yu, W. Remote sensing of particulate organic carbon dynamics in a eutrophic lake (Taihu Lake, China). Sci. Total Environ. 2015, 532, 245–254. [Google Scholar] [CrossRef] [PubMed]
- Soria, J.M.; Jover, M.; Domínguez-Gómez, J.A. Influence of wind on suspended matter in the water of the Albufera of Valencia (Spain). J. Mar. Sci. Eng. 2021, 9, 343. [Google Scholar] [CrossRef]


| Band | Objective | Wavelength (nm) | Spatial Resolution (m) | ||
|---|---|---|---|---|---|
| Central | Wide | ||||
| B1 | Visible | Deep blue | 443 | 60 | 60 |
| B2 | Blue | 490 | 10 | 10 | |
| B3 | Green | 560 | 10 | 10 | |
| B4 | Red | 665 | 10 | 10 | |
| B5 | Red edge | 705 | 20 | 20 | |
| B6 | 740 | 20 | 20 | ||
| B7 | 783 | 20 | 20 | ||
| B8 | Near-infrared (NIR) | 842 | 115 | 10 | |
| B8a | 865 | 20 | 20 | ||
| B9 | 945 | 20 | 60 | ||
| B10 | Short-wavelength infrared (SWIR) | 1380 | 20 | 60 | |
| B11 | 1610 | 90 | 20 | ||
| B12 | 2190 | 180 | 20 | ||
| Model | Reference |
|---|---|
| R705 | Kallio et al. [33] |
| R705 × R705/R490 | Zhan et al. [32] |
| R783 × R705/R490 | |
| R783/R490 | Yuan et al. [34] |
| Variable | Average | Maximum | Minimum | Std. Dev. |
|---|---|---|---|---|
| Temperature (°C) | 23.3 | 30.3 | 11.5 | 5.8 |
| Conductivity (µS/cm) | 1870.4 | 3040.0 | 1031.0 | 574.6 |
| Turbidity (NTU) | 20.9 | 71.5 | 4.3 | 16.2 |
| Secchi disk depth (m) | 0.31 | 0.55 | 0.15 | 0.09 |
| Chlorophyll-a (mg/m3) | 164.3 | 376.0 | 21.0 | 88.5 |
| Total suspended solids (mg/L) | 75.1 | 250.8 | 22.6 | 41.0 |
| Particulate organic matter (mg/L) | 45.4 | 94.5 | 7.6 | 19.0 |
| Particulate inorganic matter (mg/L) | 29.8 | 156.3 | 2.9 | 27.2 |
| Variables | Model | Algorithm | R2 |
|---|---|---|---|
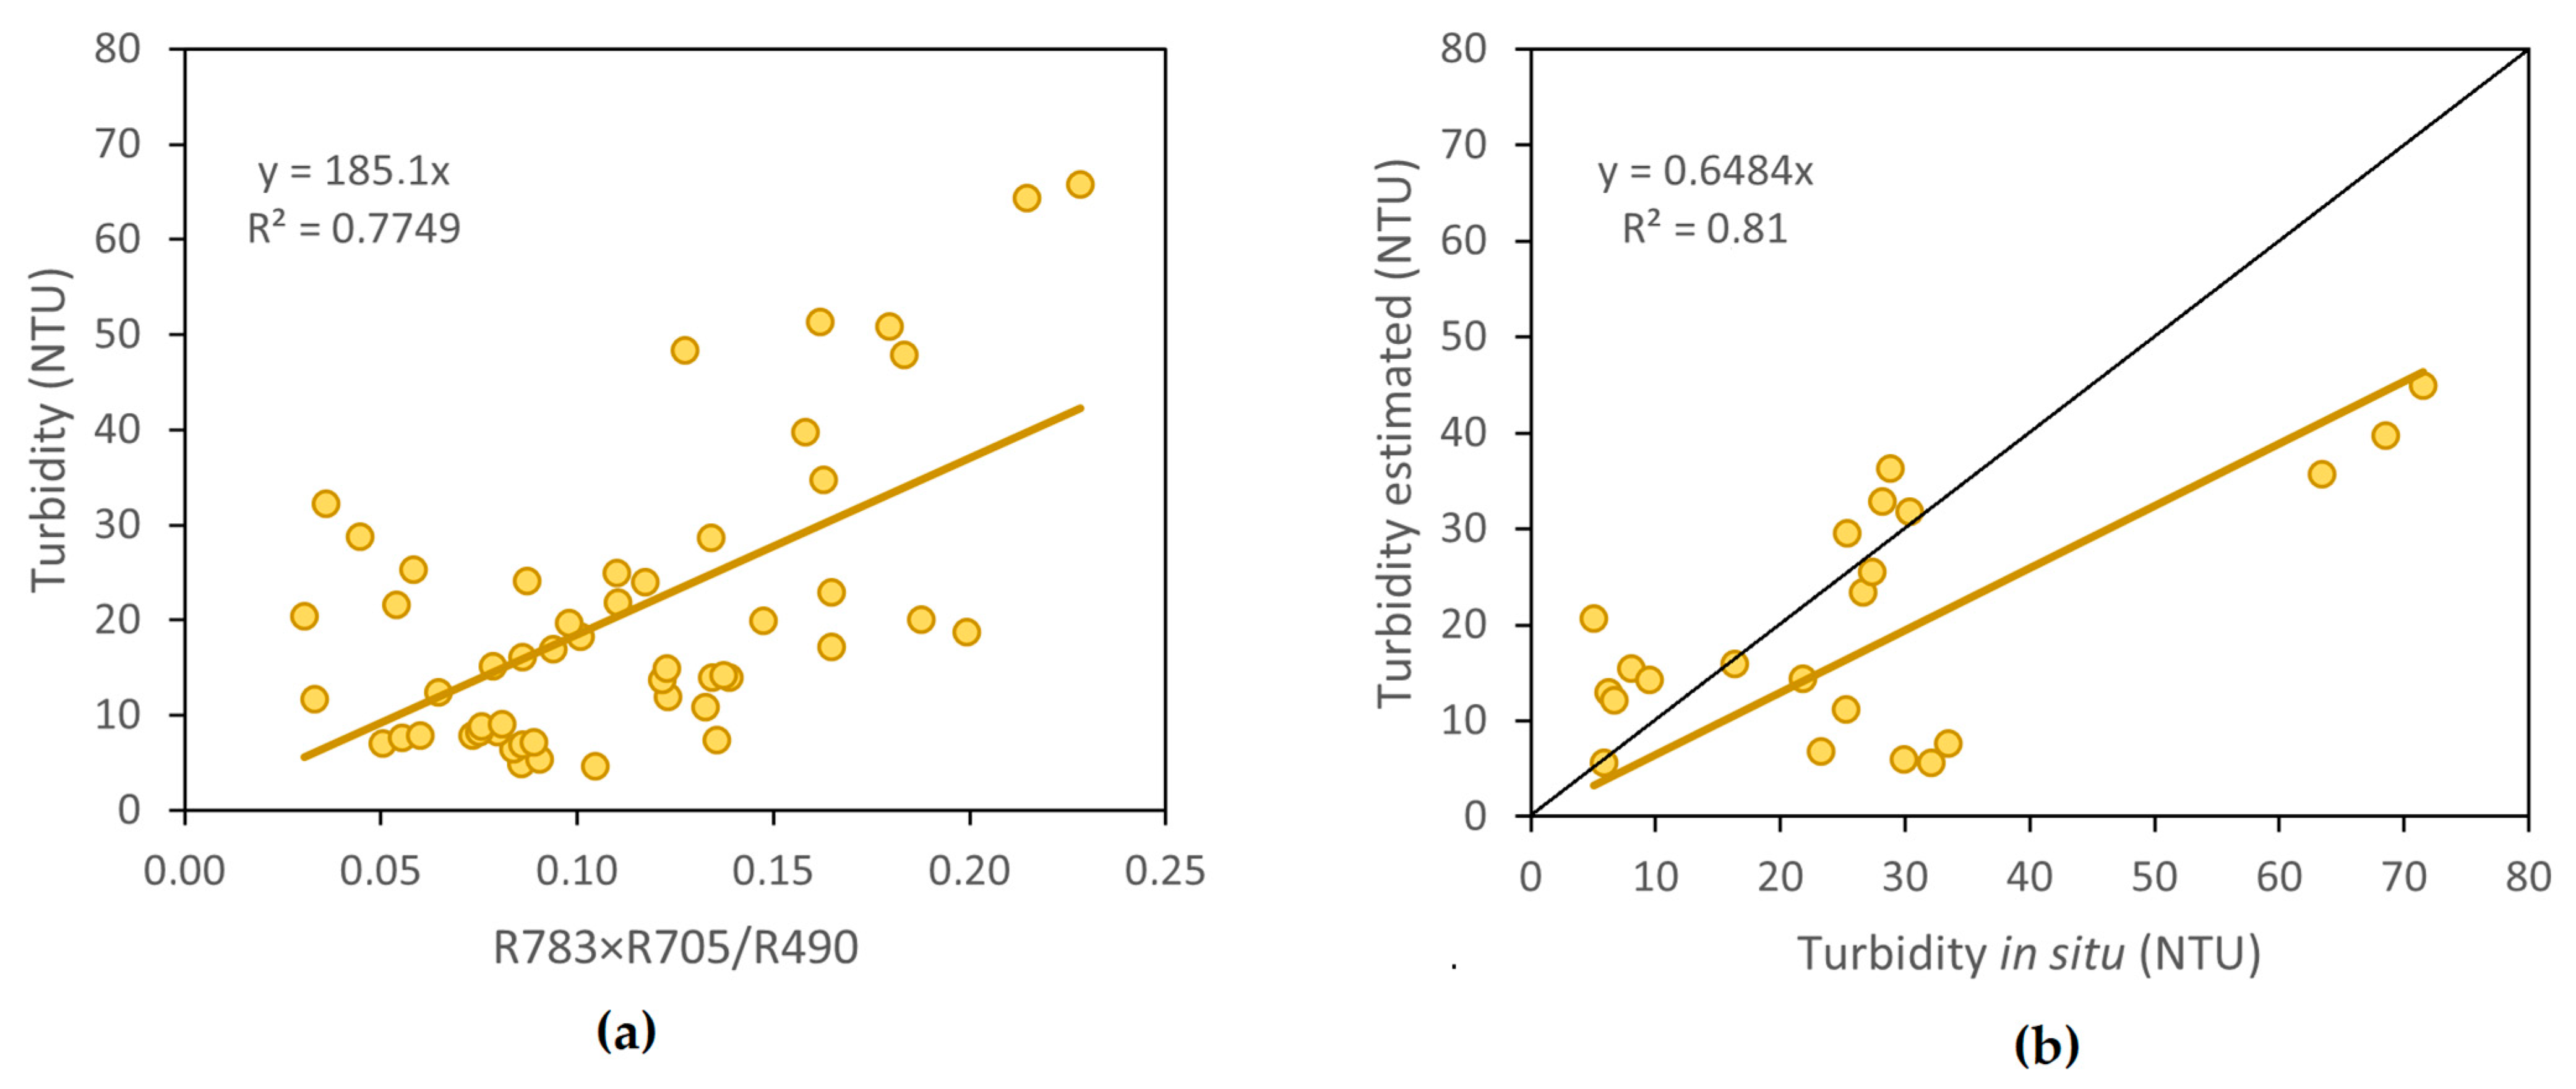
| Turbidity | R783 × R705/R490 (*) | y = 185.10x | 0.7749 |
| R705 | y = 233.13x | 0.7622 | |
| R705 × R705/R490 | y = 100.51x | 0.7189 | |
| R783/R490 | y = 16.95x | 0.6690 | |
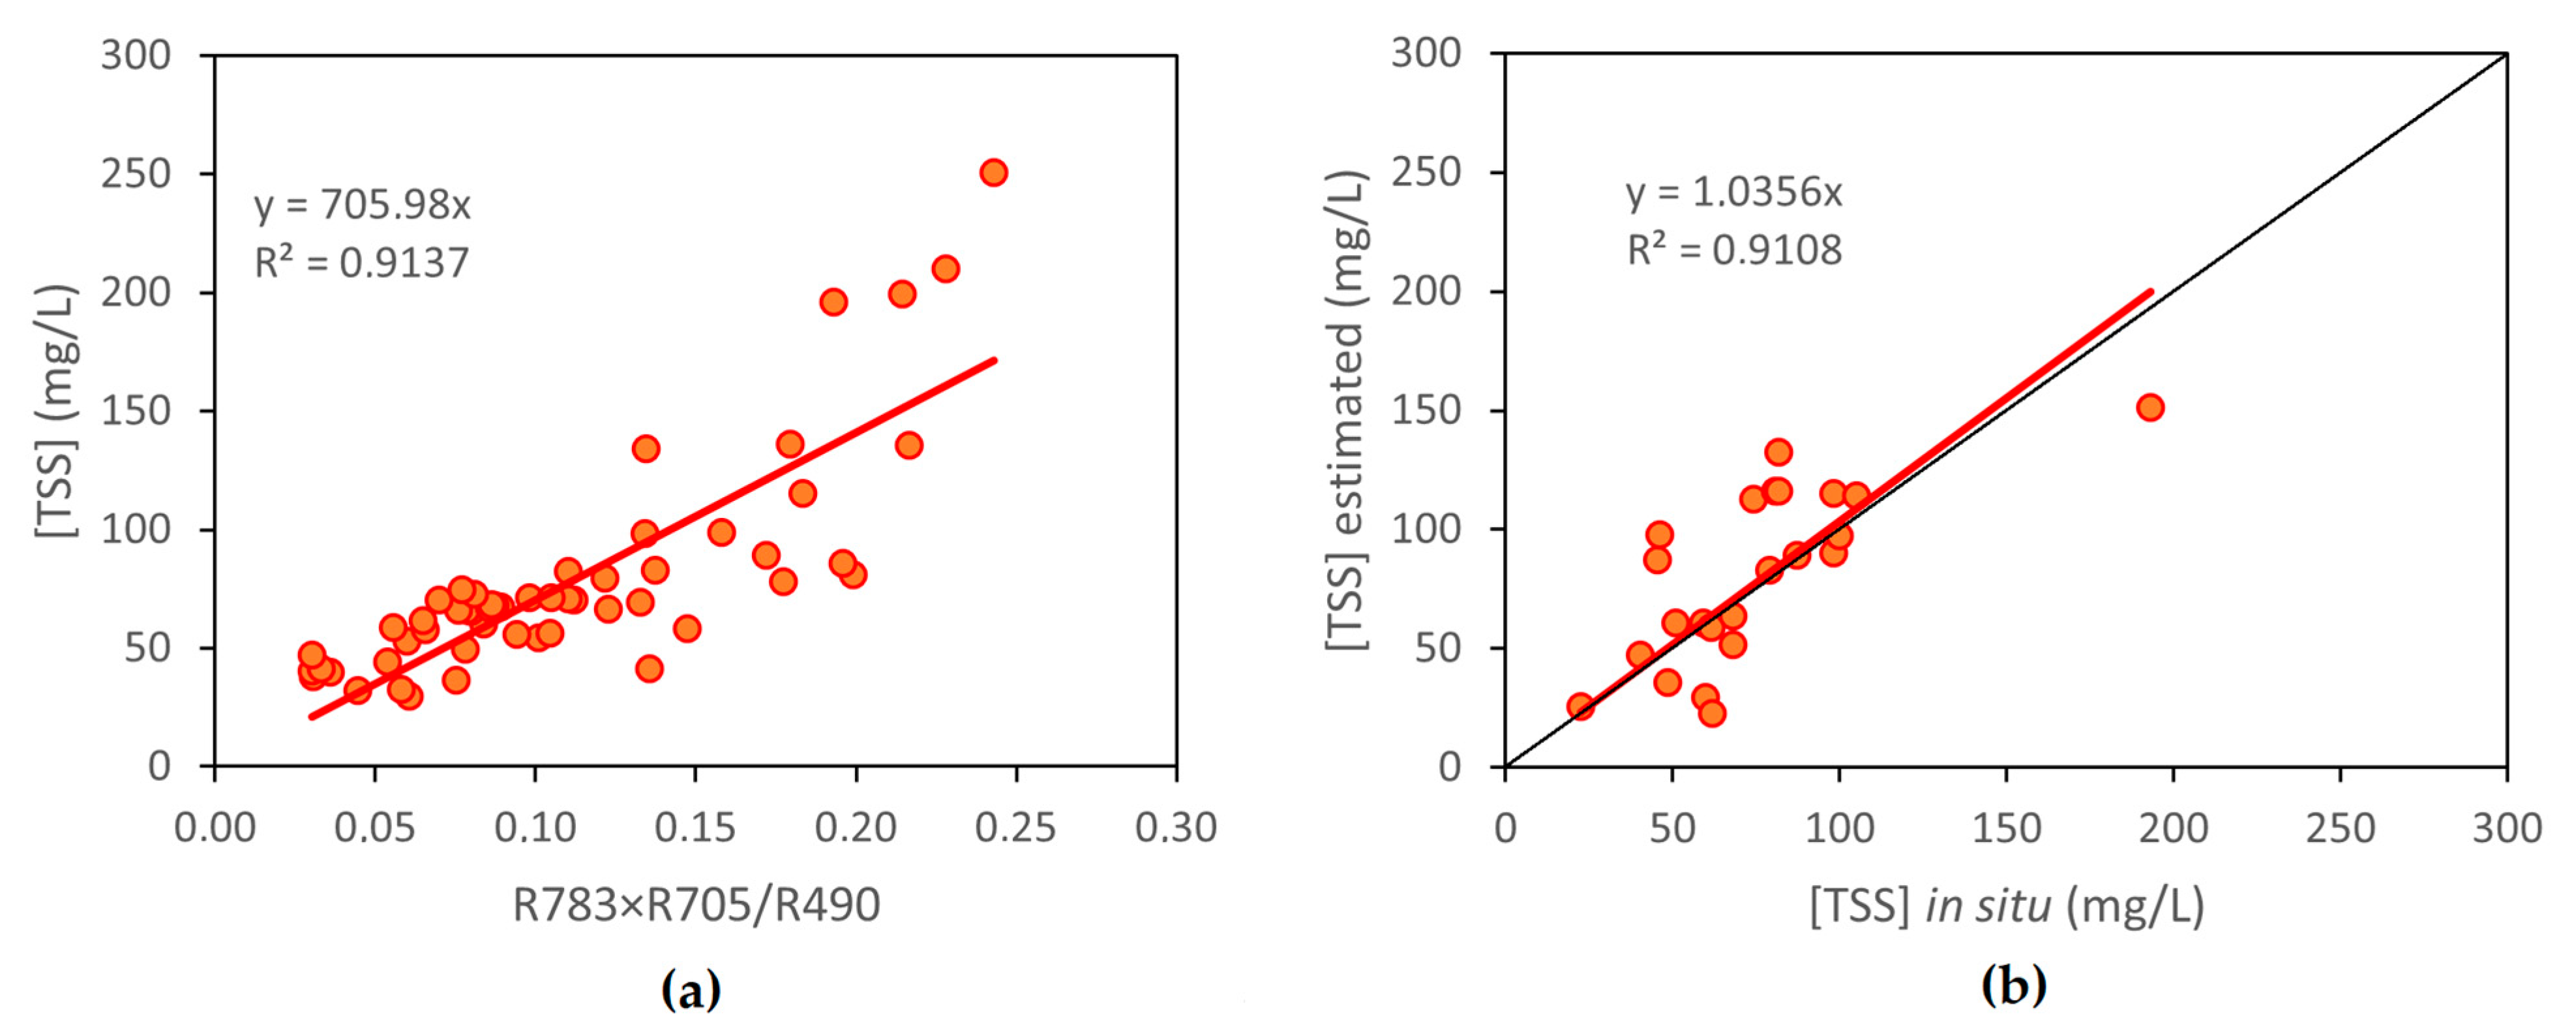
| [TSS] | R783 × R705/R490 (*) | y = 705.98x | 0.9137 |
| R705 × R705/R490 | y = 384.16x | 0.8964 | |
| R783/R490 | y = 69.70x | 0.8554 | |
| R705 | y = 872.37x | 0.8428 | |
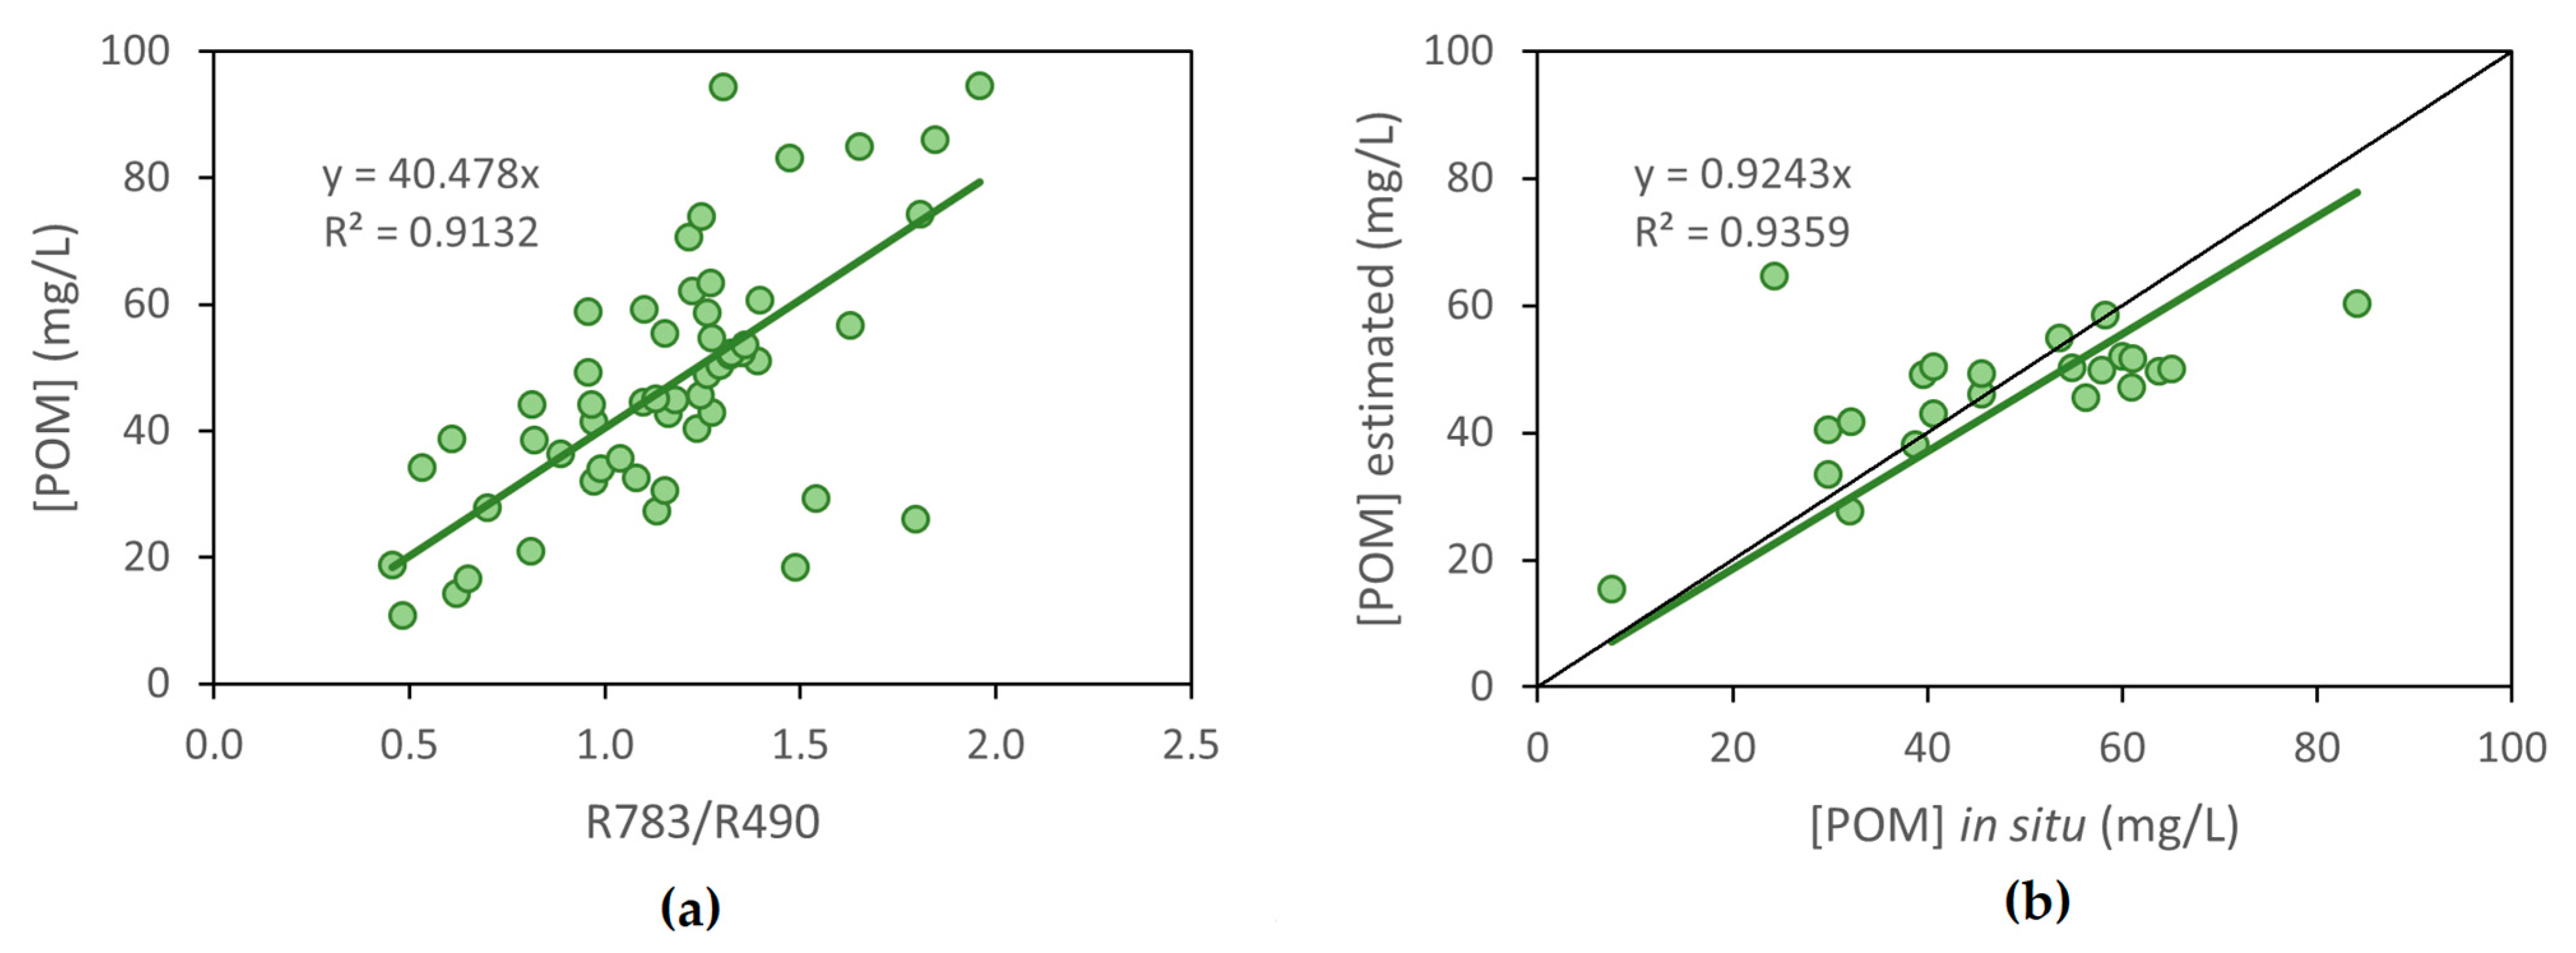
| [POM] | R783/R490 (*) | y = 40.48x | 0.9132 |
| R783 × R705/R490 | y = 395.80x | 0.9116 | |
| R705 × R705/R490 | y = 219.29x | 0.9078 | |
| R705 | y = 509.69x | 0.9035 | |
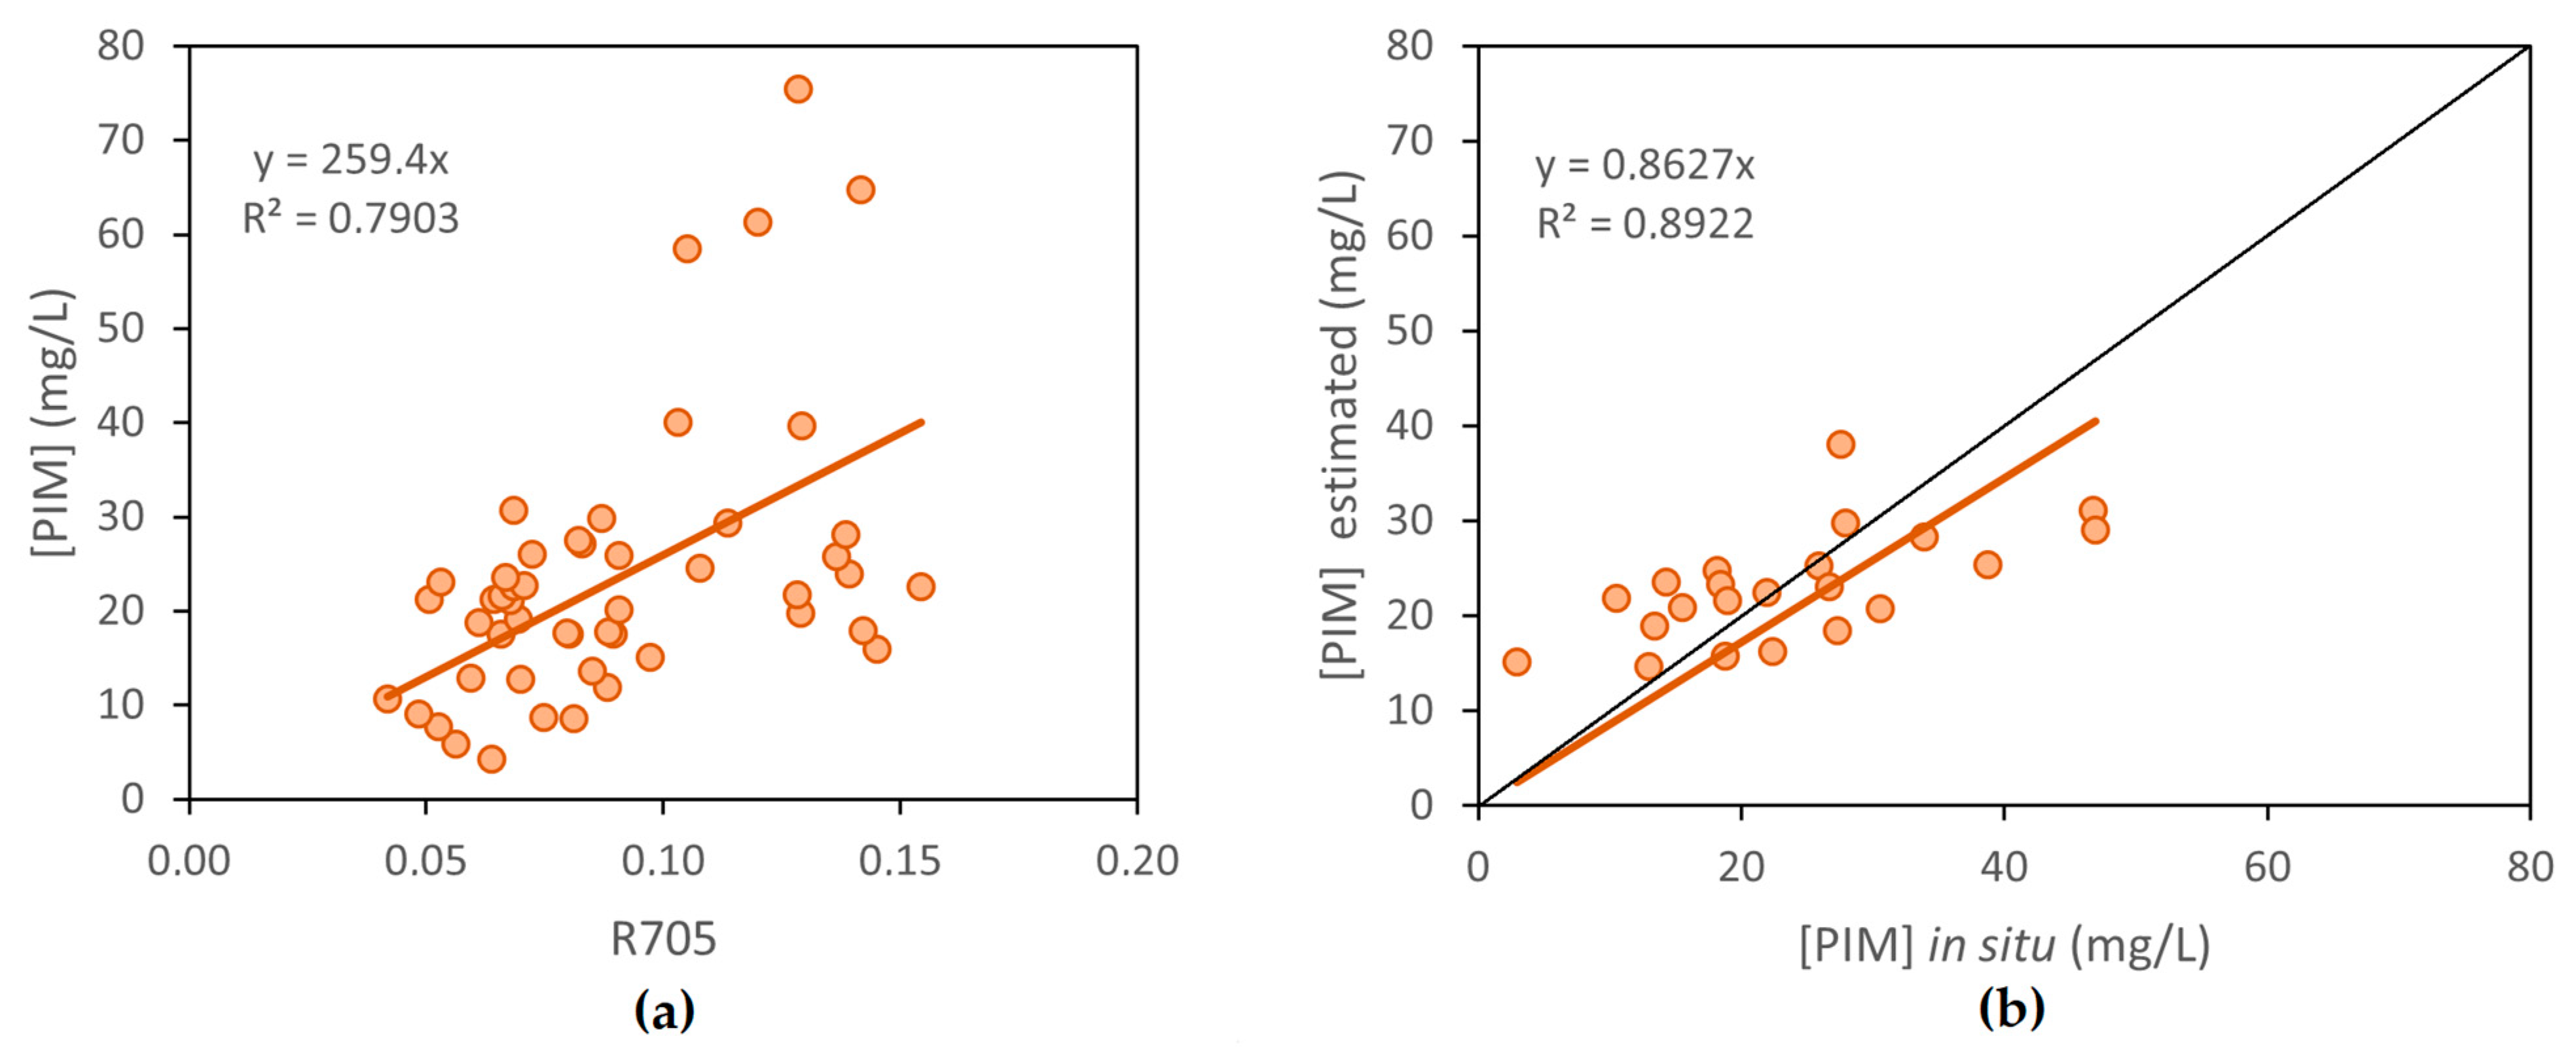
| [PIM] | R705 (*) | y = 259.40x | 0.7903 |
| R783 × R705/R490 | y = 214.42x | 0.7891 | |
| R705 × R705/R490 | y = 113.80x | 0.7665 | |
| R783/R490 | y = 20.66x | 0.7422 |
Disclaimer/Publisher’s Note: The statements, opinions and data contained in all publications are solely those of the individual author(s) and contributor(s) and not of MDPI and/or the editor(s). MDPI and/or the editor(s) disclaim responsibility for any injury to people or property resulting from any ideas, methods, instructions or products referred to in the content. |
© 2023 by the authors. Licensee MDPI, Basel, Switzerland. This article is an open access article distributed under the terms and conditions of the Creative Commons Attribution (CC BY) license (https://creativecommons.org/licenses/by/4.0/).
Share and Cite
Molner, J.V.; Soria, J.M.; Pérez-González, R.; Sòria-Perpinyà, X. Measurement of Turbidity and Total Suspended Matter in the Albufera of Valencia Lagoon (Spain) Using Sentinel-2 Images. J. Mar. Sci. Eng. 2023, 11, 1894. https://doi.org/10.3390/jmse11101894
Molner JV, Soria JM, Pérez-González R, Sòria-Perpinyà X. Measurement of Turbidity and Total Suspended Matter in the Albufera of Valencia Lagoon (Spain) Using Sentinel-2 Images. Journal of Marine Science and Engineering. 2023; 11(10):1894. https://doi.org/10.3390/jmse11101894
Chicago/Turabian StyleMolner, Juan V., Juan M. Soria, Rebeca Pérez-González, and Xavier Sòria-Perpinyà. 2023. "Measurement of Turbidity and Total Suspended Matter in the Albufera of Valencia Lagoon (Spain) Using Sentinel-2 Images" Journal of Marine Science and Engineering 11, no. 10: 1894. https://doi.org/10.3390/jmse11101894
APA StyleMolner, J. V., Soria, J. M., Pérez-González, R., & Sòria-Perpinyà, X. (2023). Measurement of Turbidity and Total Suspended Matter in the Albufera of Valencia Lagoon (Spain) Using Sentinel-2 Images. Journal of Marine Science and Engineering, 11(10), 1894. https://doi.org/10.3390/jmse11101894