Correlations between Petroleum Reservoir Fluid Properties and Amount of Evolved and Dissolved Natural Gas: Case Study of Transgressive–Regressive-Sequence Sedimentary Rocks


Abstract
:1. Introduction
2. Methodology
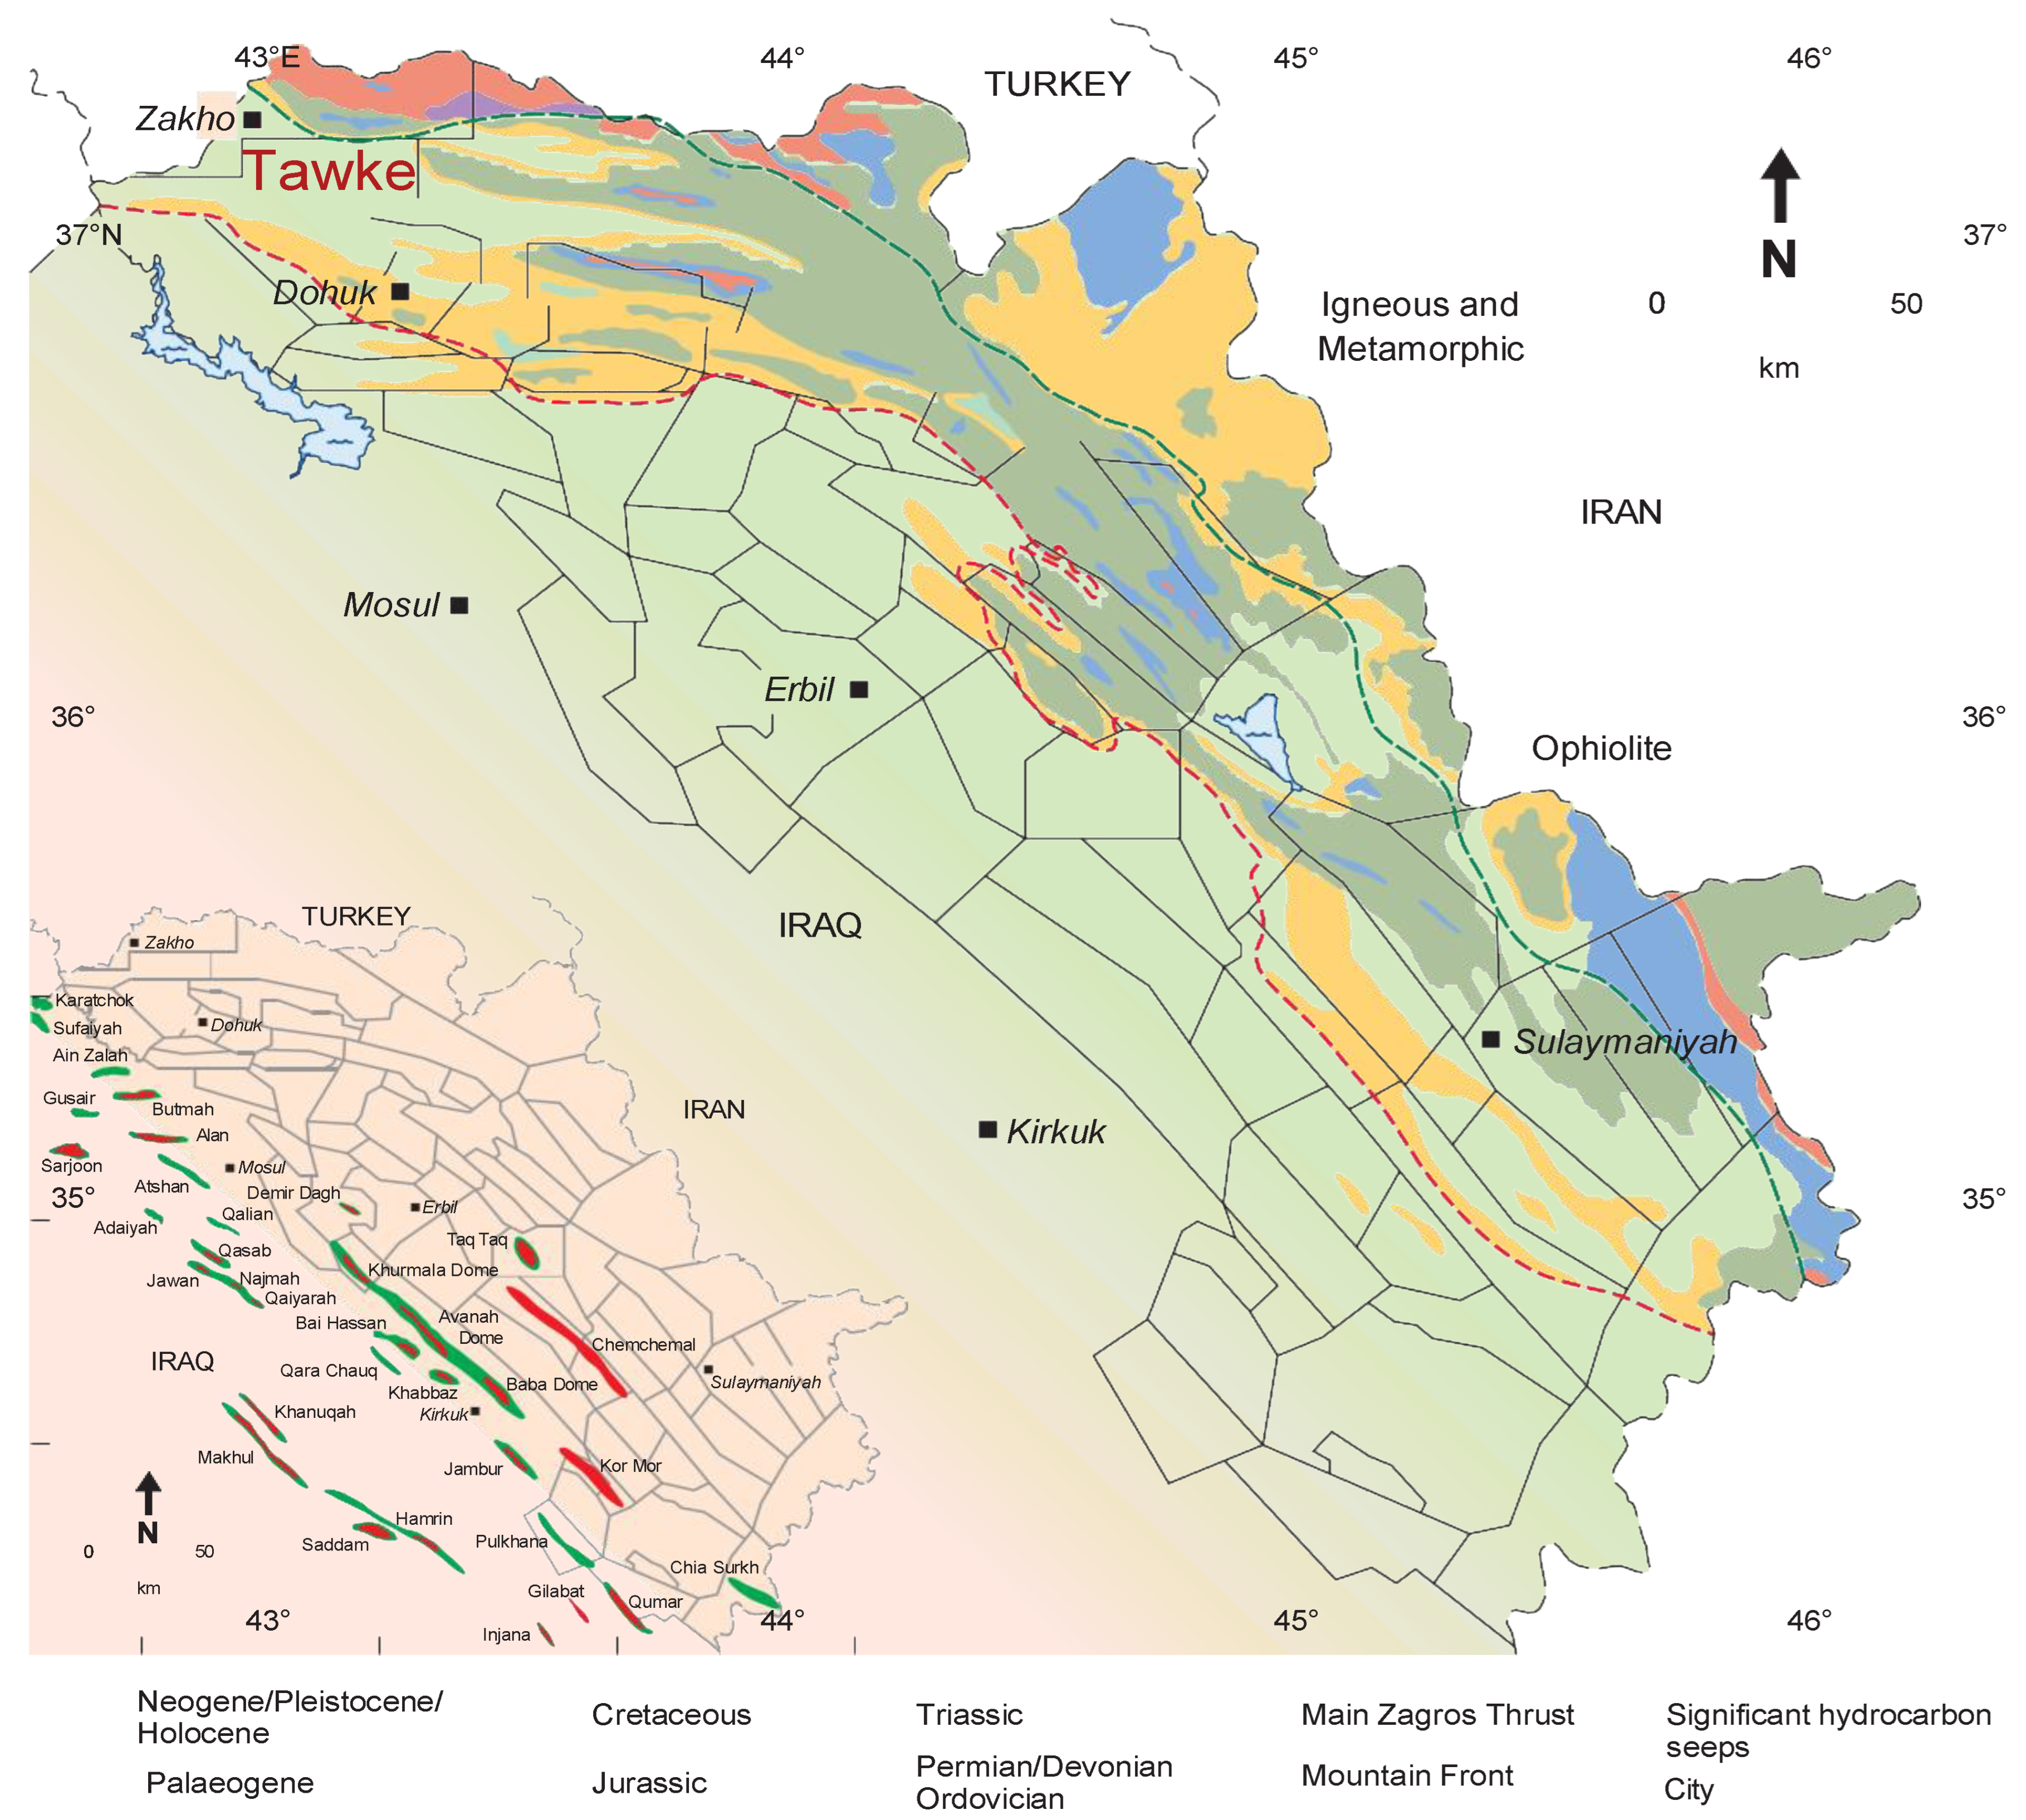
3. Geological Setting
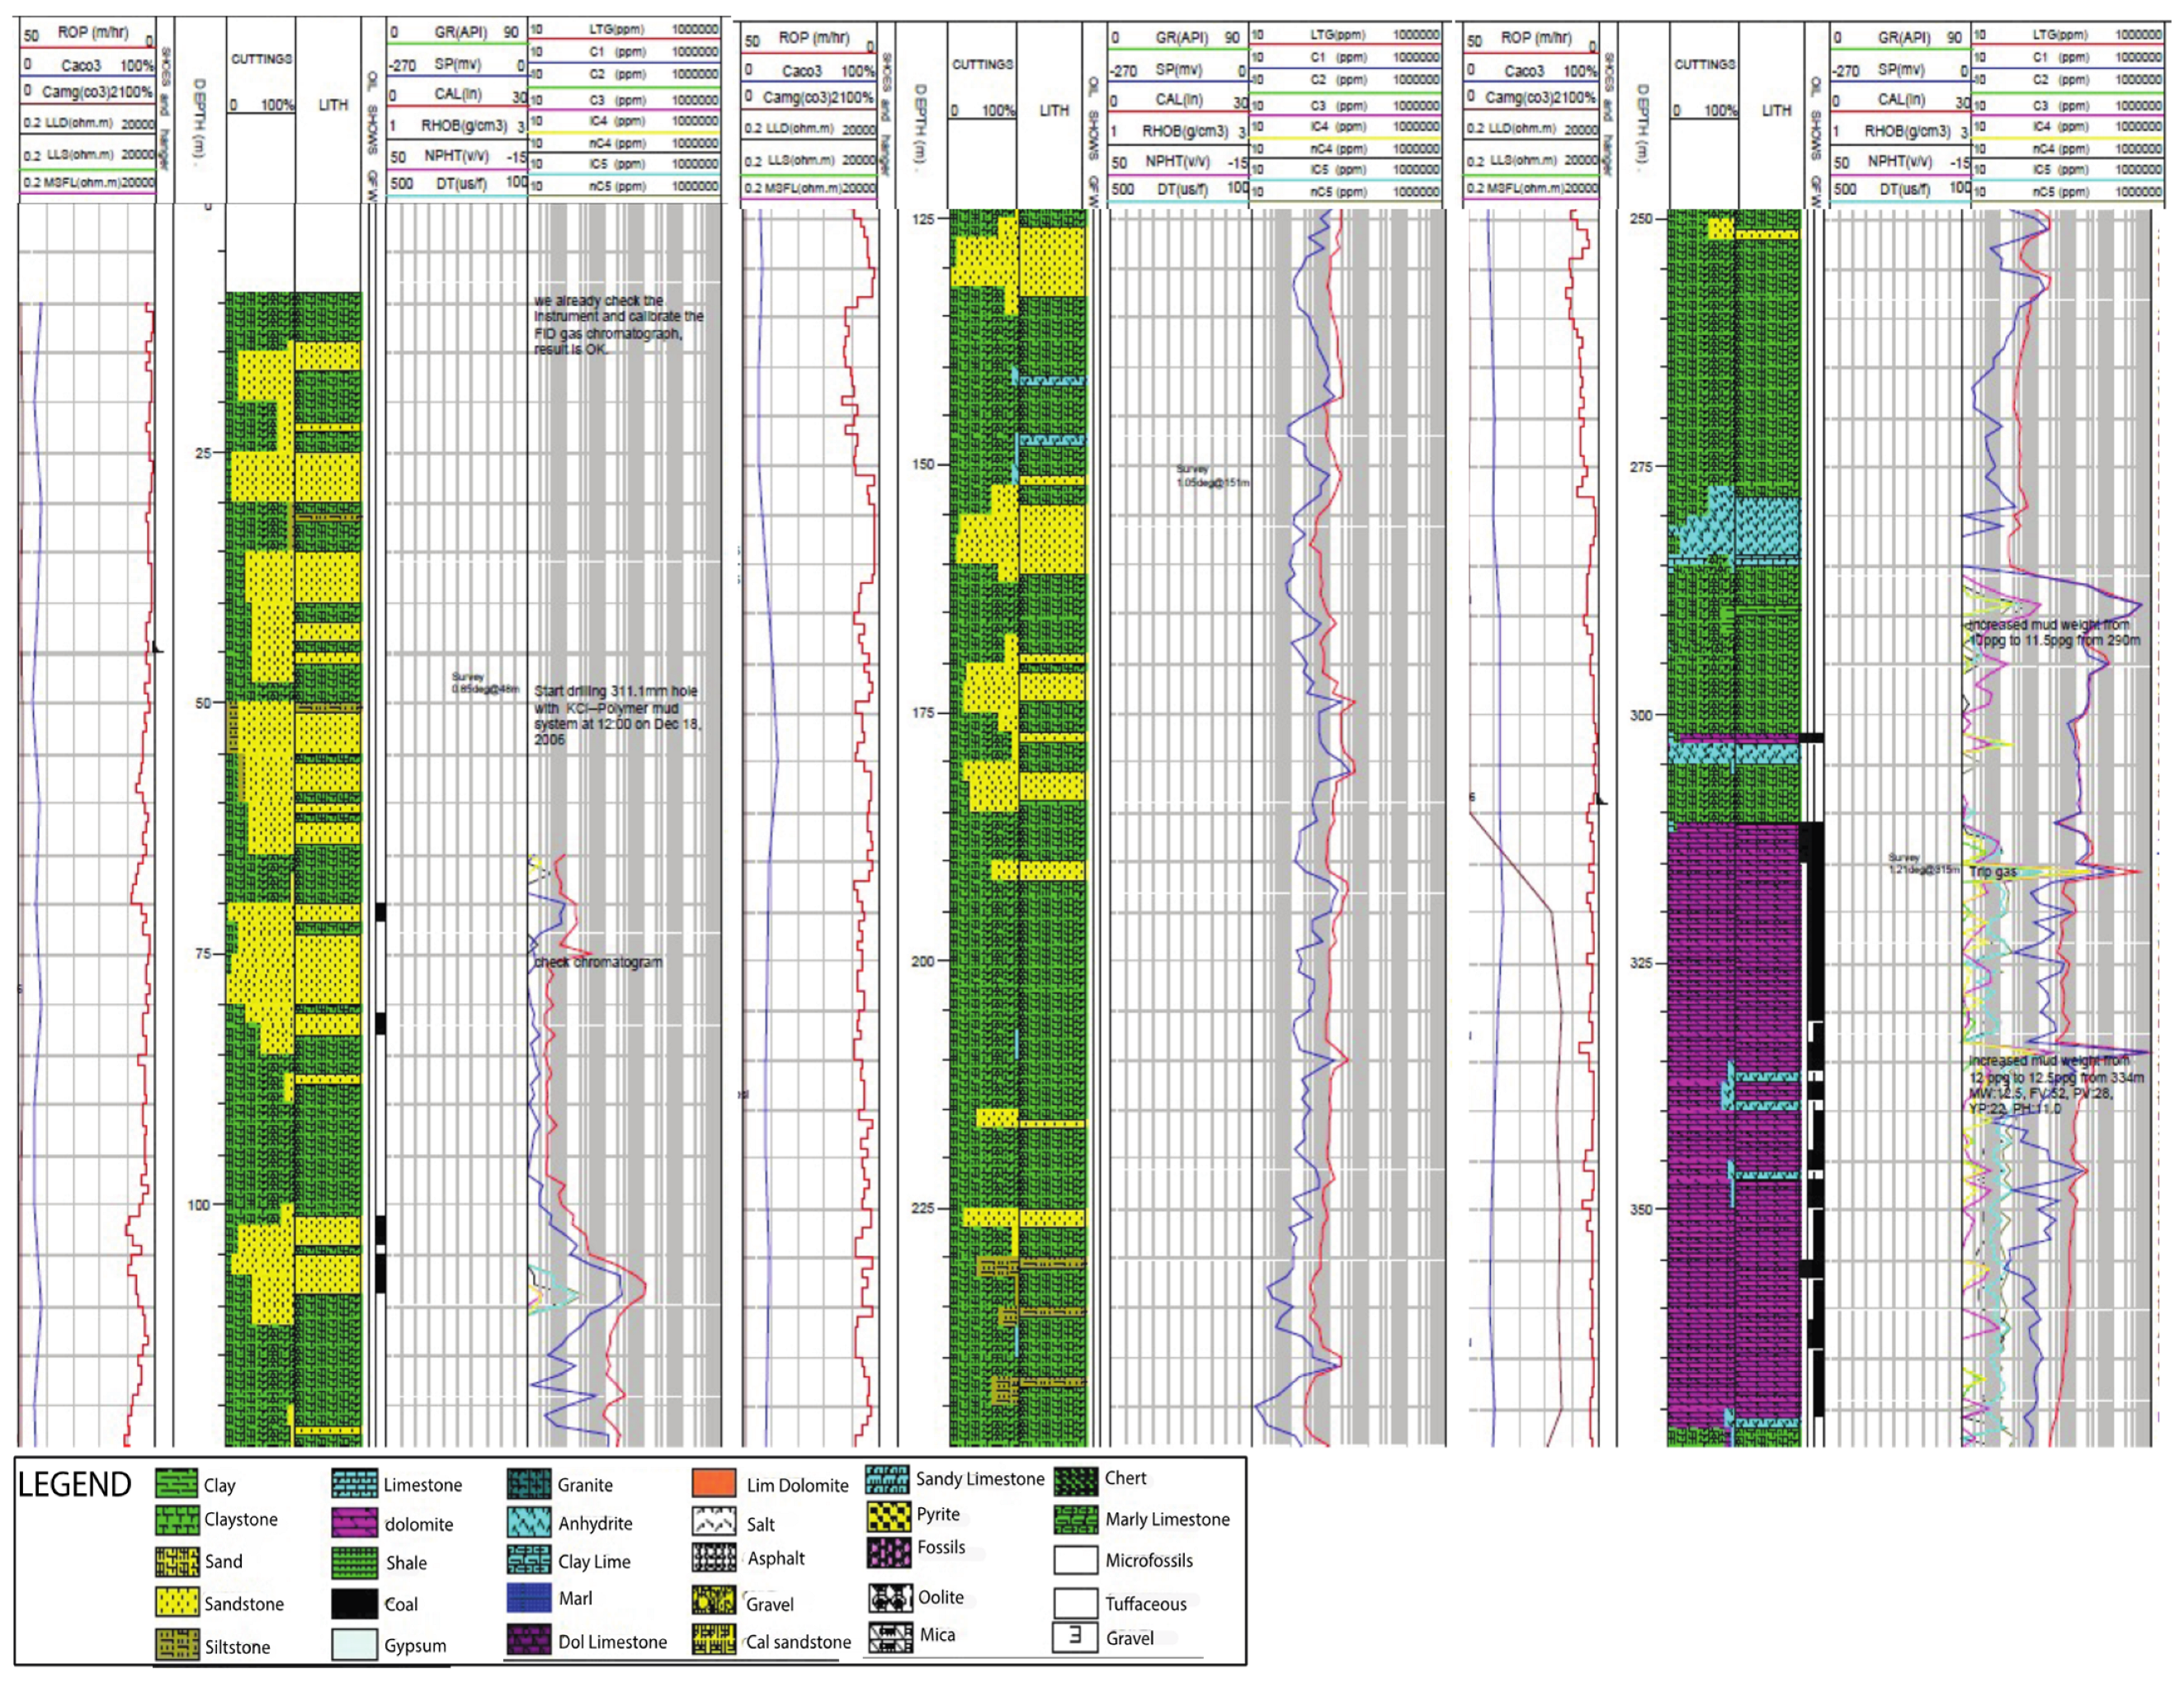
4. Lithological Indicators of the Oil Wells
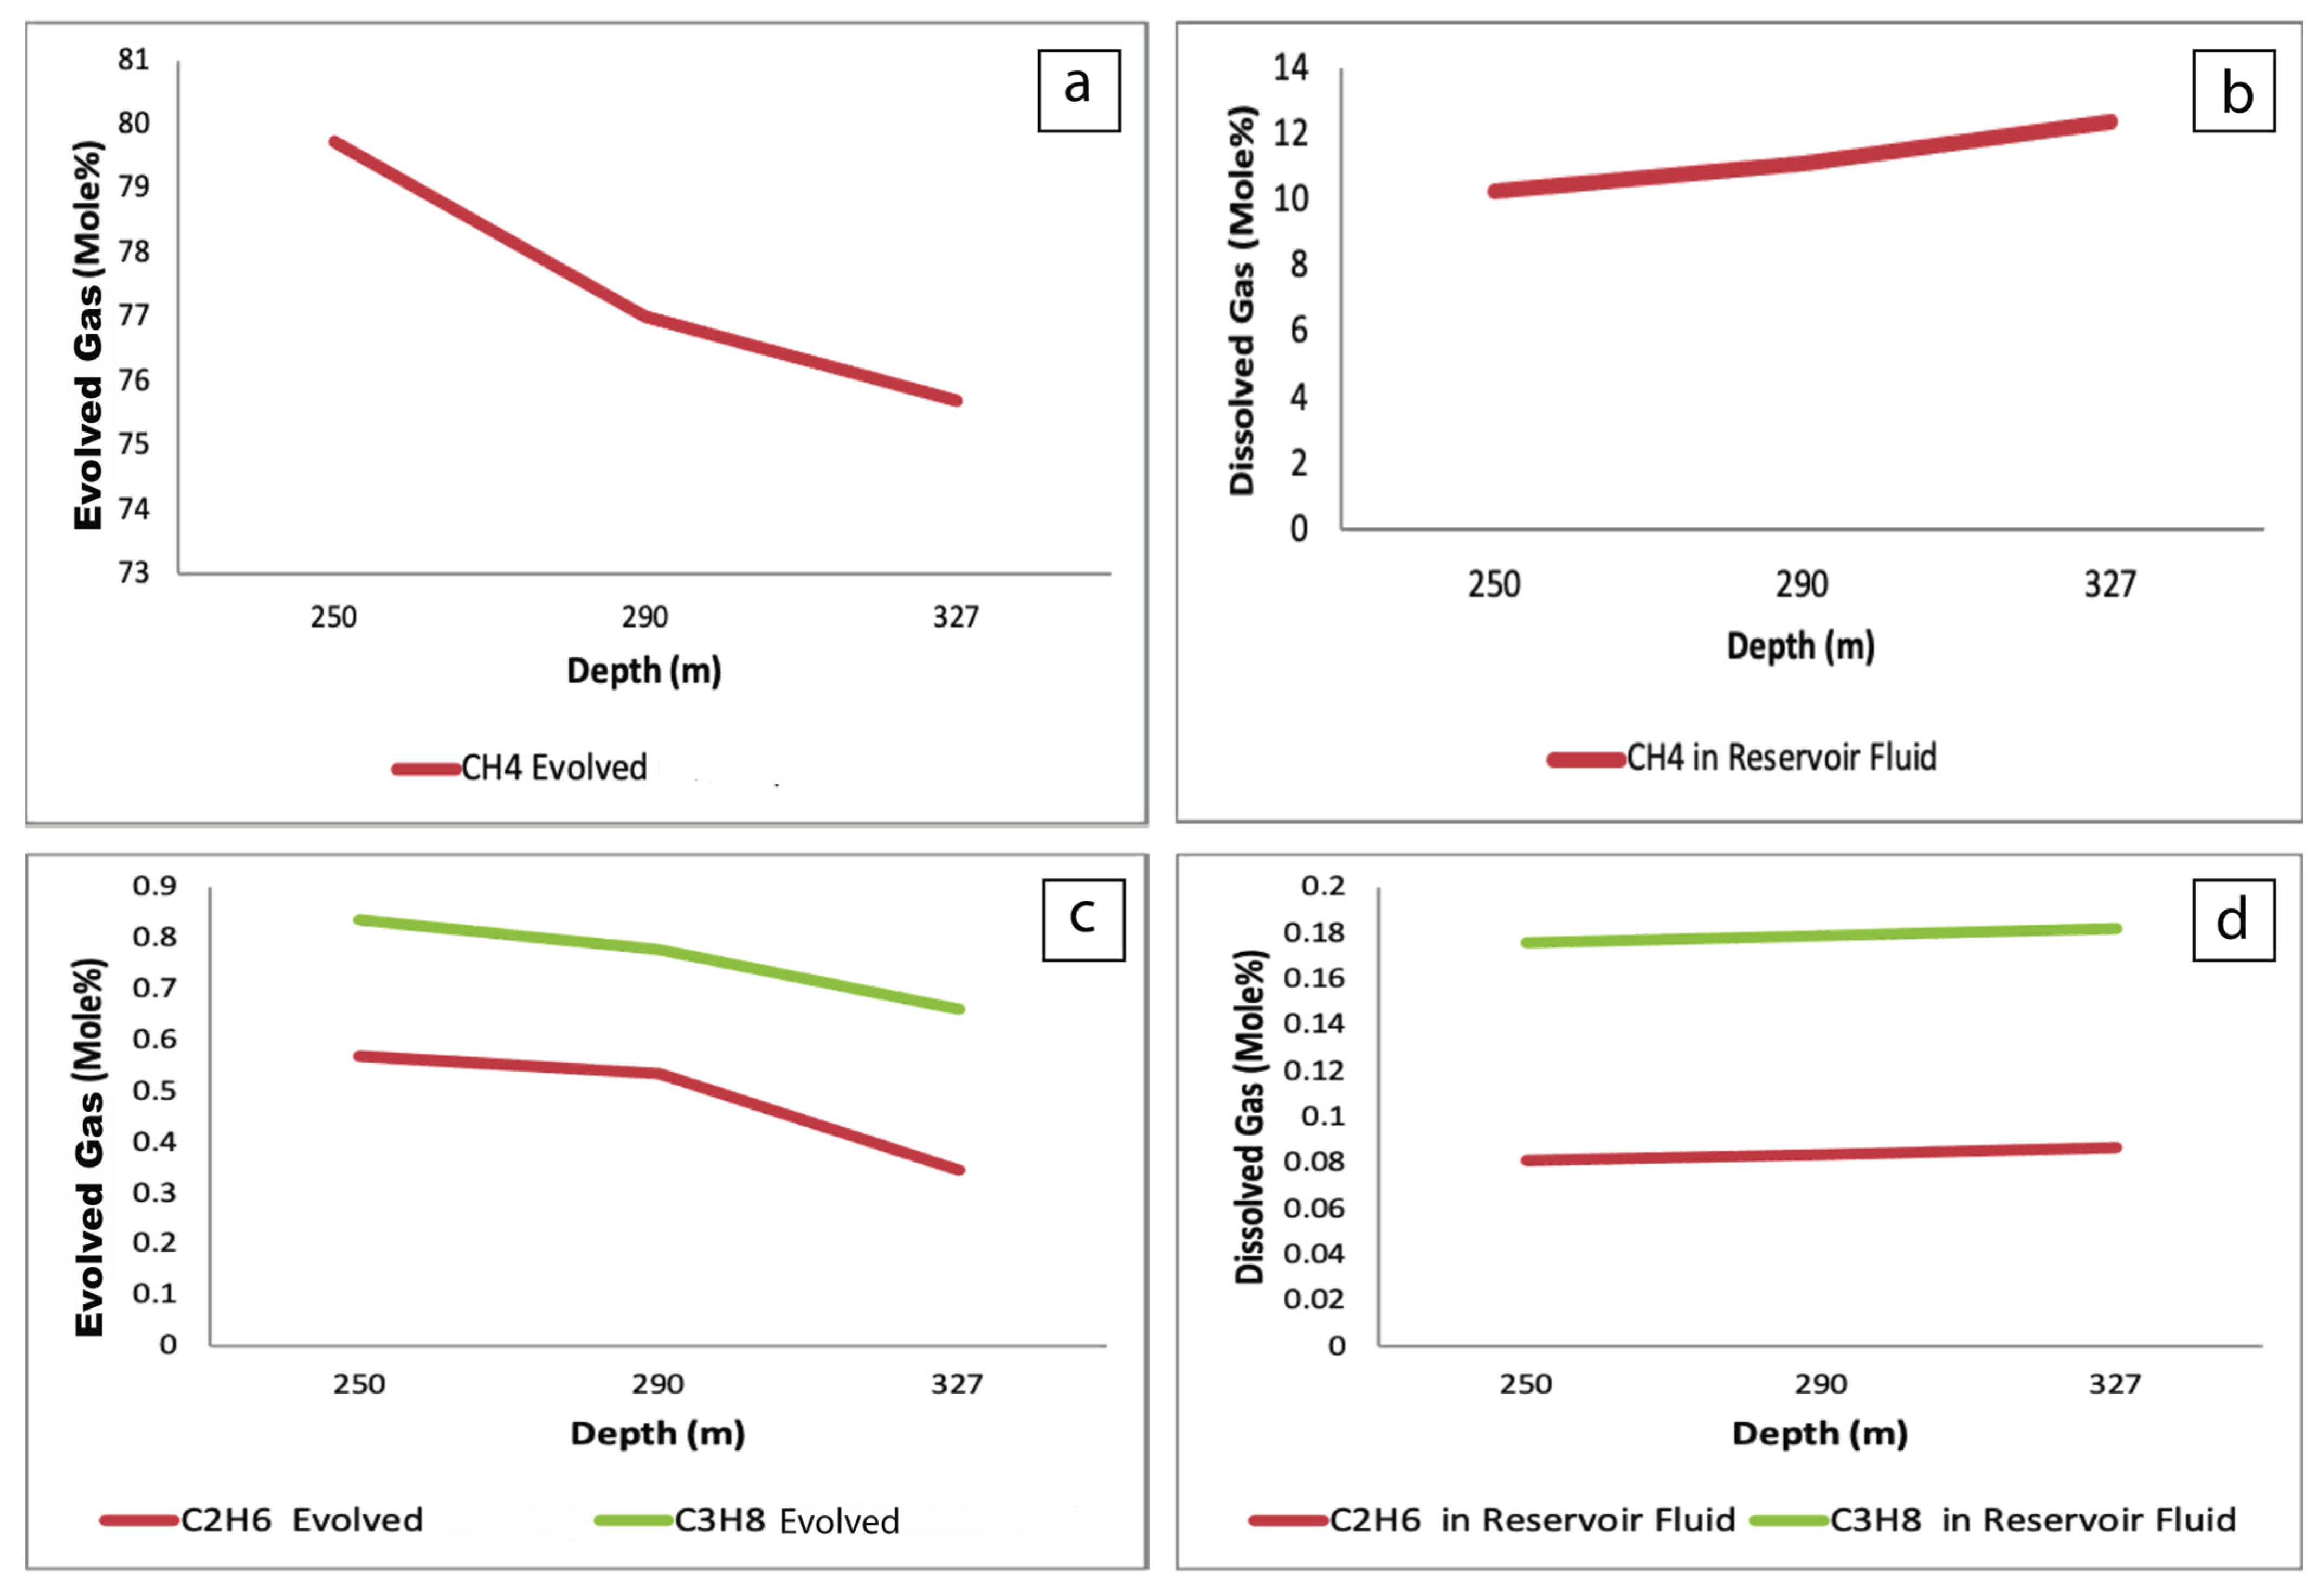
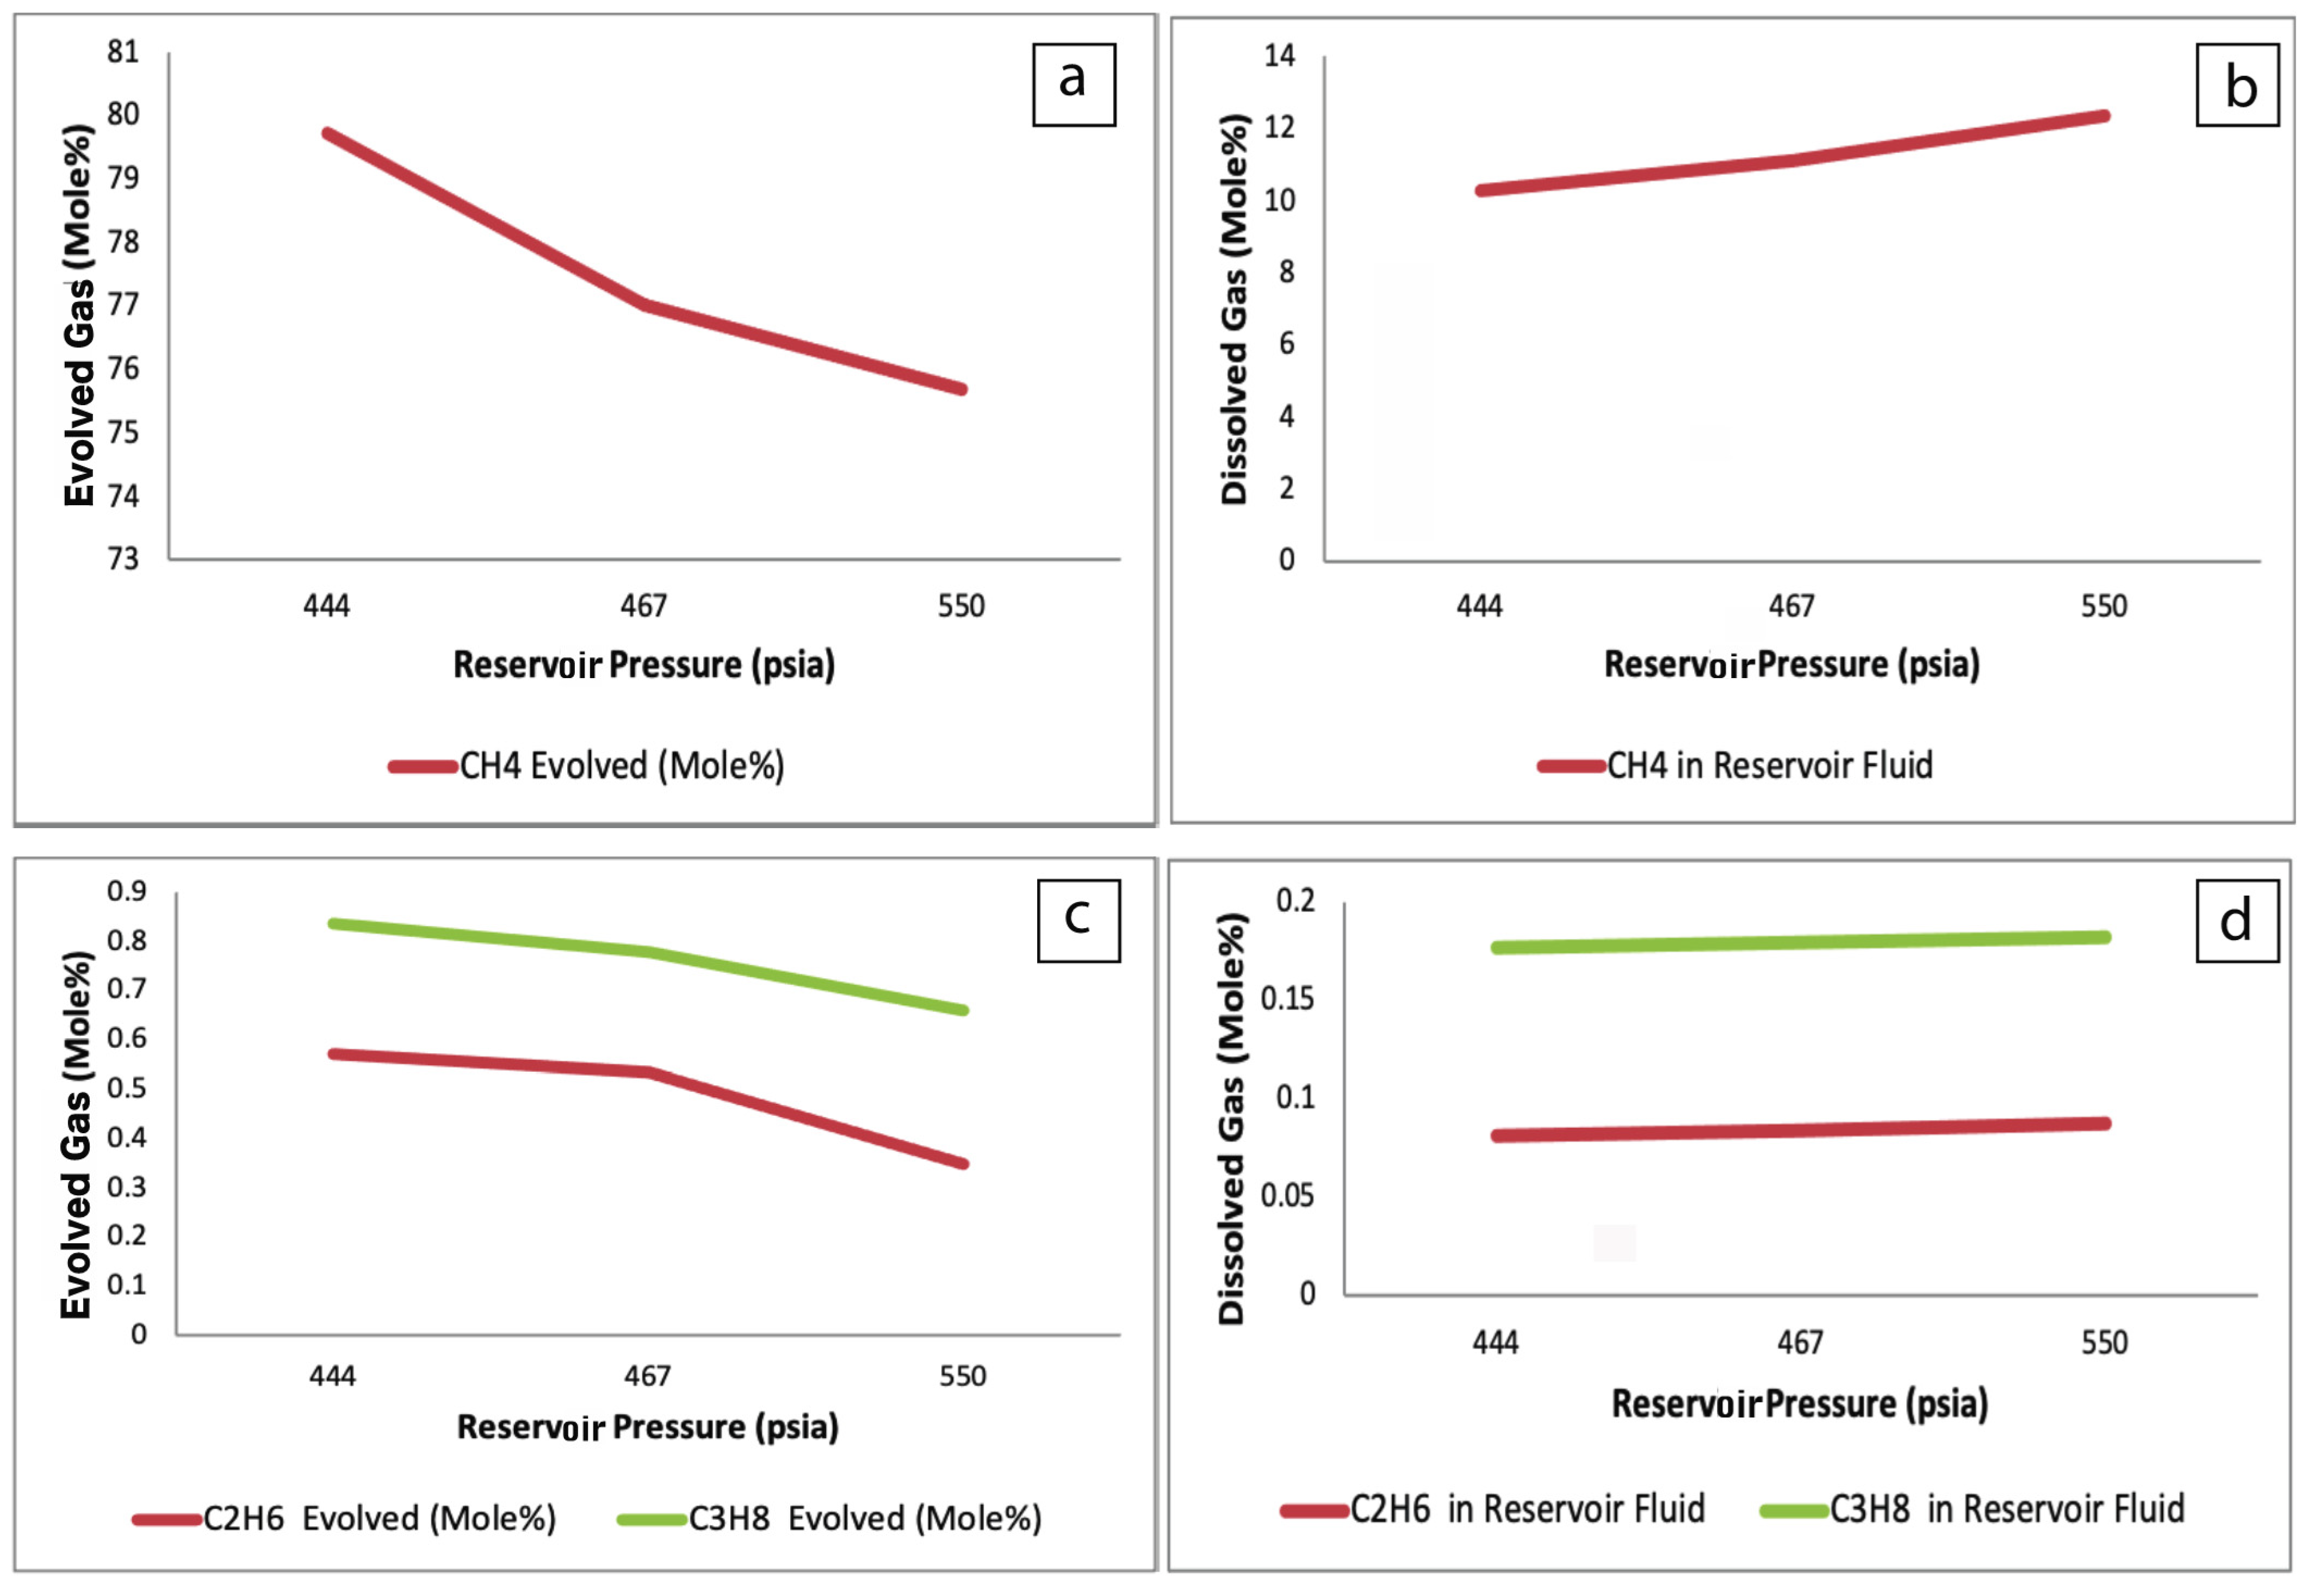
5. Results and Discussion
6. Conclusions
Author Contributions
Funding
Institutional Review Board Statement
Informed Consent Statement
Data Availability Statement
Acknowledgments
Conflicts of Interest
References
- Kayadelen, H.K. Effect of natural gas components on its flame temperature, equilibrium combustion products and thermodynamic properties. J. Nat. Gas Sci. Eng. 2017, 45, 456–473. [Google Scholar] [CrossRef]
- Liu, Q.; Wu, X.; Wang, X.; Jin, Z.; Zhu, D.; Meng, Q.; Huang, S.; Liu, J.; Fu, Q. Carbon and hydrogen isotopes of methane, ethane, and propane: A review of genetic identification of natural gas. Earth-Sci. Rev. 2009, 190, 247–272. [Google Scholar] [CrossRef]
- Dai, J. Chapter 7—In Coal-Derived Gas Fields and the Gas Sources of Offshore China. In Giant Coal-Derived Gas Fields and Their Gas Sources in China; Academic Press: Cambridge, MA, USA, 2017; pp. 447–549. [Google Scholar]
- Schoell, M. The hydrogen and carbon isotopic composition of methane from natural gases of various origins. Geochim. Cosmochim. Acta 1980, 44, 649–661. [Google Scholar] [CrossRef]
- Stoupakova, A.V.; Korobova, N.I.; Mordasova, A.V.; Sautkin, R.S.; Sivkova, E.D.; Bolshakova, M.A.; Voronin, M.E.; Suslova, A.A.; Karpushin, M.Y.; Kozhanov, D.D.; et al. Depositional environments as a framework for genetic classification of the basic criteria of petroleum potential. Georesursy 2023, 25, 75–88. [Google Scholar] [CrossRef]
- Behbahani, T.J.; Dahaghin, A.; JafariBehbahani, Z. Experimental Investigation and Thermodynamic Modeling of the Phase Behavior of Reservoir Fluids. Energy Sources Part A Recovery Util. Environ. Eff. 2014, 36, 1256–1265. [Google Scholar] [CrossRef]
- Shuster, V.L.; Dzyublo, A.D. Substantiation of the prospects to discover large oil and gas accumulations in the Jurassic and pre-Jurassian deposits on the Kara Sea shelf. Georesursy 2023, 25, 67–74. [Google Scholar] [CrossRef]
- Mansour, E.M.; Farag, A.B.; El-Dars, F.S.; Desouky, S.M.; Batanoni, M.H.; Mahmoud, M.R.M. Predicting PVT properties of Egyptian crude oils by a modified Soave–Redlich–Kowng equation of state. Egypt. J. Pet. 2013, 22, 137–148. [Google Scholar] [CrossRef]
- El-Hoshoudy, A.N. Numerical prediction of oil formation volume factor at bubble point for black and volatile oil reservoirs using non-linear regression models. Pet. Petrochem. Eng. J. 2018, 2, 11. [Google Scholar]
- El-Hoshoudy, A.; Desouky, S. PVT Properties of Black Crude Oil. In Processing of Heavy Crude Oils—Challenges and Opportunities; Gounder, R.M., Ed.; IntechOpen: London, UK, 2019. [Google Scholar] [CrossRef]
- Alher, A.A.; Aljawad, M.S.; Alyasery, A.A. Estimating the PVT Properties for Crude Oil from a Southern Iraqi Oil Field. IOP Conf. Ser. Mater. Sci. Eng. 2018, 433, 012076. [Google Scholar] [CrossRef]
- Kamal, I.; Amjadian, K.; Salih, N.; Ahmad, B.; Haidar, R. Modeling the Effect of Reservoir Fluid Properties on Abundance of (H2S) Evolved from Oil Wells and Dissolved in Reservoir Fluids. In Recent Researches in Earth and Environmental Sciences; Springer Proceedings in Earth and Environmental Sciences; Mustafa, Y., Sadkhan, S., Zebari, S., Jacksi, K., Eds.; Springer: Cham, Switzerland, 2019. [Google Scholar] [CrossRef]
- Ismayilov, G.G.; Fataliyev, V.M.; Iskenderov, E.K. Investigating the impact of dissolved natural gas on the flow characteristics of multicomponent fluid in pipelines. Open Phys. 2019, 17, 206–213. [Google Scholar] [CrossRef]
- Makertich, D.; Samarrai, A. History of hydrocarbon exploration in the Kurdistan Region of Iraq. GeoArabia 2015, 20, 181–220. [Google Scholar] [CrossRef]
- Black oil PVT analysis, report reference F1713, DNO, Iraq.
- Jiang, S. Clay minerals from the perspective of oil and gas exploration. In Clay Minerals in Nature—Their Characterization, Modification and Application; IntechOpen: London, UK, 2012. [Google Scholar] [CrossRef]
- Hao, F.; Zou, H.Y.; Lu, Y.C. Mechanisms of shale gas storage: Implications for shale gas exploration in China. AAPG Bull. 2013, 97, 1325–1346. [Google Scholar] [CrossRef]
- Kuila, U.; Prasad, M. Specific surface area and poresize distribution in clays and shales. Geophys. Prospect. 2013, 61, 341–362. [Google Scholar] [CrossRef]
- Buday, T. The Regional Geology of Iraq; Volume 1: Stratigraphy and Paleogeography; Publications of Geological Survey of Iraq: Baghdad, Iraq, 1980; 445p. [Google Scholar]
- Tamar-Agha, M.Y.; Al-Aslami, M.; Facies, O.J. Depositional Environment and Cyclicity of the Fatha Formation in East Baghdad Oil Field, Iraq. Iraqi J. Sci. 2023, 56, 2939–2952. [Google Scholar]
- Cross, S.; Pettigrew, R.P.; Priddy, C.L.; Zuchuat, V.; Dodd, T.J.H.; Mitten, A.J.; Clarke, S.M. The sedimentological expression of transgression–regression cycles upon aeolian–marine margins. Depos. Rec. 2023, 9, 335–362. [Google Scholar] [CrossRef]
- Xiong, J.; Liu, X.; Liang, L.; Wei, X.; Xu, P. Investigation of the factors influencing methane adsorption on illite. Energy Sci. Eng. 2019, 7, 3317–3331. [Google Scholar] [CrossRef]
- Pozoa, M.; Pino, D.; Bessieres, D. Effect of thermal events on maturation and methane adsorption of Silurian black shales (Checa, Spain). Appl. Clay Sci. 2017, 136, 208–218. [Google Scholar] [CrossRef]
- Ji, L.M.; Ma, X.X.; Xia, Y.Q.; Qiu, J. Relationship between methane adsorption capacity of clay minerals and micropore volume. Nat. Gas Geosci. 2014, 25, 141–152. [Google Scholar]
- Salih, N.M.; Thannoun, R.G.; Bety, A.K. Hydrocarbon seepage detection by integrating remotely sensed and geochemical data: Scanning the lithological alteration. Arab. J. Geosci. 2023, 16, 153. [Google Scholar] [CrossRef]
- Mahmoud, M. Effect of Gas Adsorption on the Estimation of Gas in Place (GIP) in Conventional and Unconventional Reservoirs. Arab. J. Sci. Eng. 2019, 44, 6205–6214. [Google Scholar] [CrossRef]
- Salih, N.; Préat, A.; Gerdes, A.; Konhauser, K.; Proust, J.-N. Tracking the Origin and Evolution of Diagenetic Fluids of Upper Jurassic Carbonate Rocks in the Zagros Thrust Fold Belt, NE-Iraq. Water 2021, 13, 3284. [Google Scholar] [CrossRef]
- Qian, J.Z.; Luo, M.H. Effects of Moisture and Salinity on Methane Adsorption in Kerogen: A Molecular Simulation Study. Energy Fuel 2019, 33, 5368–5376. [Google Scholar] [CrossRef]
- Rashid, M.; Luo, M.; Ashraf, U.; Hussain, W.; Ali, N.; Rahman, N.; Hussain, S.; Martyushev, D.A.; Vo Thanh, H.; Anees, A. Reservoir Quality Prediction of Gas-Bearing Carbonate Sediments in the Qadirpur Field: Insights from Advanced Machine Learning Approaches of SOM and Cluster Analysis. Minerals 2023, 13, 29. [Google Scholar] [CrossRef]
- Hunt, J.M. Petroleum Geochemistry and Geology; W.H. Freeman and Company: New York, NY, USA, 1996; p. 332. [Google Scholar]
- Santos, R.G.; Loh, W.; Bannwart, A.C.; Trevisan, O.V. An overview of heavy oil properties and its recovery and transportation methods. Braz. J. Chem. Eng. 2019, 31, 571–590. [Google Scholar] [CrossRef]
- Demirbas, A.; Al-Ghamdi, K. Relationships between Specific Gravities and Higher Heating Values of Petroleum Components. J. Pet. Sci. Technol. 2015, 33, 732–740. [Google Scholar] [CrossRef]
- Shafiei, M.; Kazemzadeh, Y.; Martyushev, D.A.; Dai, Z.; Riazi, M. Effect of chemicals on the phase and viscosity behavior of water in oil emulsions. Sci. Rep. 2023, 13, 4100. [Google Scholar] [CrossRef]
- Zheng, Z.-Y.; Zuo, Y.-H.; Wen, H.-G.; Li, D.M.; Luo, Y.; Zhang, J.Z.; Yang, M.H.; Zeng, J.C. Natural gas characteristics and gas-source comparisons of the Lower Triassic Feixianguan Formation, Eastern Sichuan Basin, China. Pet. Sci. 2023, 20, 1458–1470. [Google Scholar] [CrossRef]
- Martyushev, D.A.; Chalova, P.O.; Davoodi, S.; Ashraf, U. Evaluation of facies heterogeneity in reef carbonate reservoirs: A case study from the oil field, Perm Krai, Central-Eastern Russia. Geoenergy Sci. Eng. 2023, 227, 211814. [Google Scholar] [CrossRef]
- Yang, C.-Y.; Li, M.-J.; Wang, T.-G.; Zhong, N.N.; Fang, R.H.; Wen, L. Texture development of mesophase in reservoir pyrobitumen and the temperature-pressure converting of the gas reservoir in the Chuanzhong Uplift, Southwestern China. Pet. Sci. 2023, 20, 721–732. [Google Scholar] [CrossRef]
- Raupov, I.R.; Milic, J. Improvement of operational efficiency of high water-cut oil wells. IOP Conf. Ser. Earth Environ. Sci. 2022, 1021, 012077. [Google Scholar] [CrossRef]


| No. | Correlated Parameters | Mathematical Model | Regression Coefficient | |
|---|---|---|---|---|
| x | y | |||
| 1 | Depth of samples (m) | CH4 evolved (mole%) | y = 94.22e − 7 × 10⁻⁴x | R2 = 0.9717 |
| CH4 dissolved (mole%) | y = 5.5932e0.0024x | R2 = 0.9848 | ||
| C2H6 evolved (mole%) | y = −0.808ln(x) + 5.0559 | R2 = 0.8235 | ||
| C2H6 dissolved (mole%) | y = 8 × 10⁻⁵x + 0.0615 | R2 = 0.9995 | ||
| C3H8 evolved (mole%) | y = −0.0023x + 1.4112 | R2 = 0.9519 | ||
| C3H8 dissolved (mole%) | y = 8 × 10⁻⁵x + 0.1565 | R2 = 0.9995 | ||
| 2 | Reservoir Temp. | CH4 evolved (mole%) | y = 135.26e−0.007x | R2 = 0.6744 |
| CH4 dissolved (mole%) | y = 1.1509e0.0265x | R2 = 0.9043 | ||
| C2H6 evolved (mole%) | y = −0.0261x + 2.9923 | R2 = 0.9536 | ||
| C2H6 dissolved (mole%) | y = 0.0008x + 0.0136 | R2 = 0.8369 | ||
| C3H8 evolved (mole%) | y = −0.0358x + 3.5502 | R2 = 0.9981 | ||
| C3H8 dissolved (mole%) | y = 0.0008x + 0.1086 | R2 = 0.8369 | ||
| 3 | Reservoir pressure | CH4 evolved (mole%) | y = 94.811e−4E−04x | R2 = 0.7639 |
| CH4 dissolved (mole%) | y = 5.0536e0.0016x | R2 = 0.9547 | ||
| C2H6 evolved (mole%) | y = 5 × 10⁻⁵x + 0.0591 | R2 = 0.9035 | ||
| C2H6 dissolved (mole%) | y = 5 × 10⁻⁵x + 0.0591 | R2 = 0.9035 | ||
| C3H8 evolved (mole%) | y = −0.0016x + 1.5319 | R2 = 0.9863 | ||
| C3H8 dissolved (mole%) | y = 5 × 10⁻⁵x + 0.1541 | R2 = 0.9035 | ||
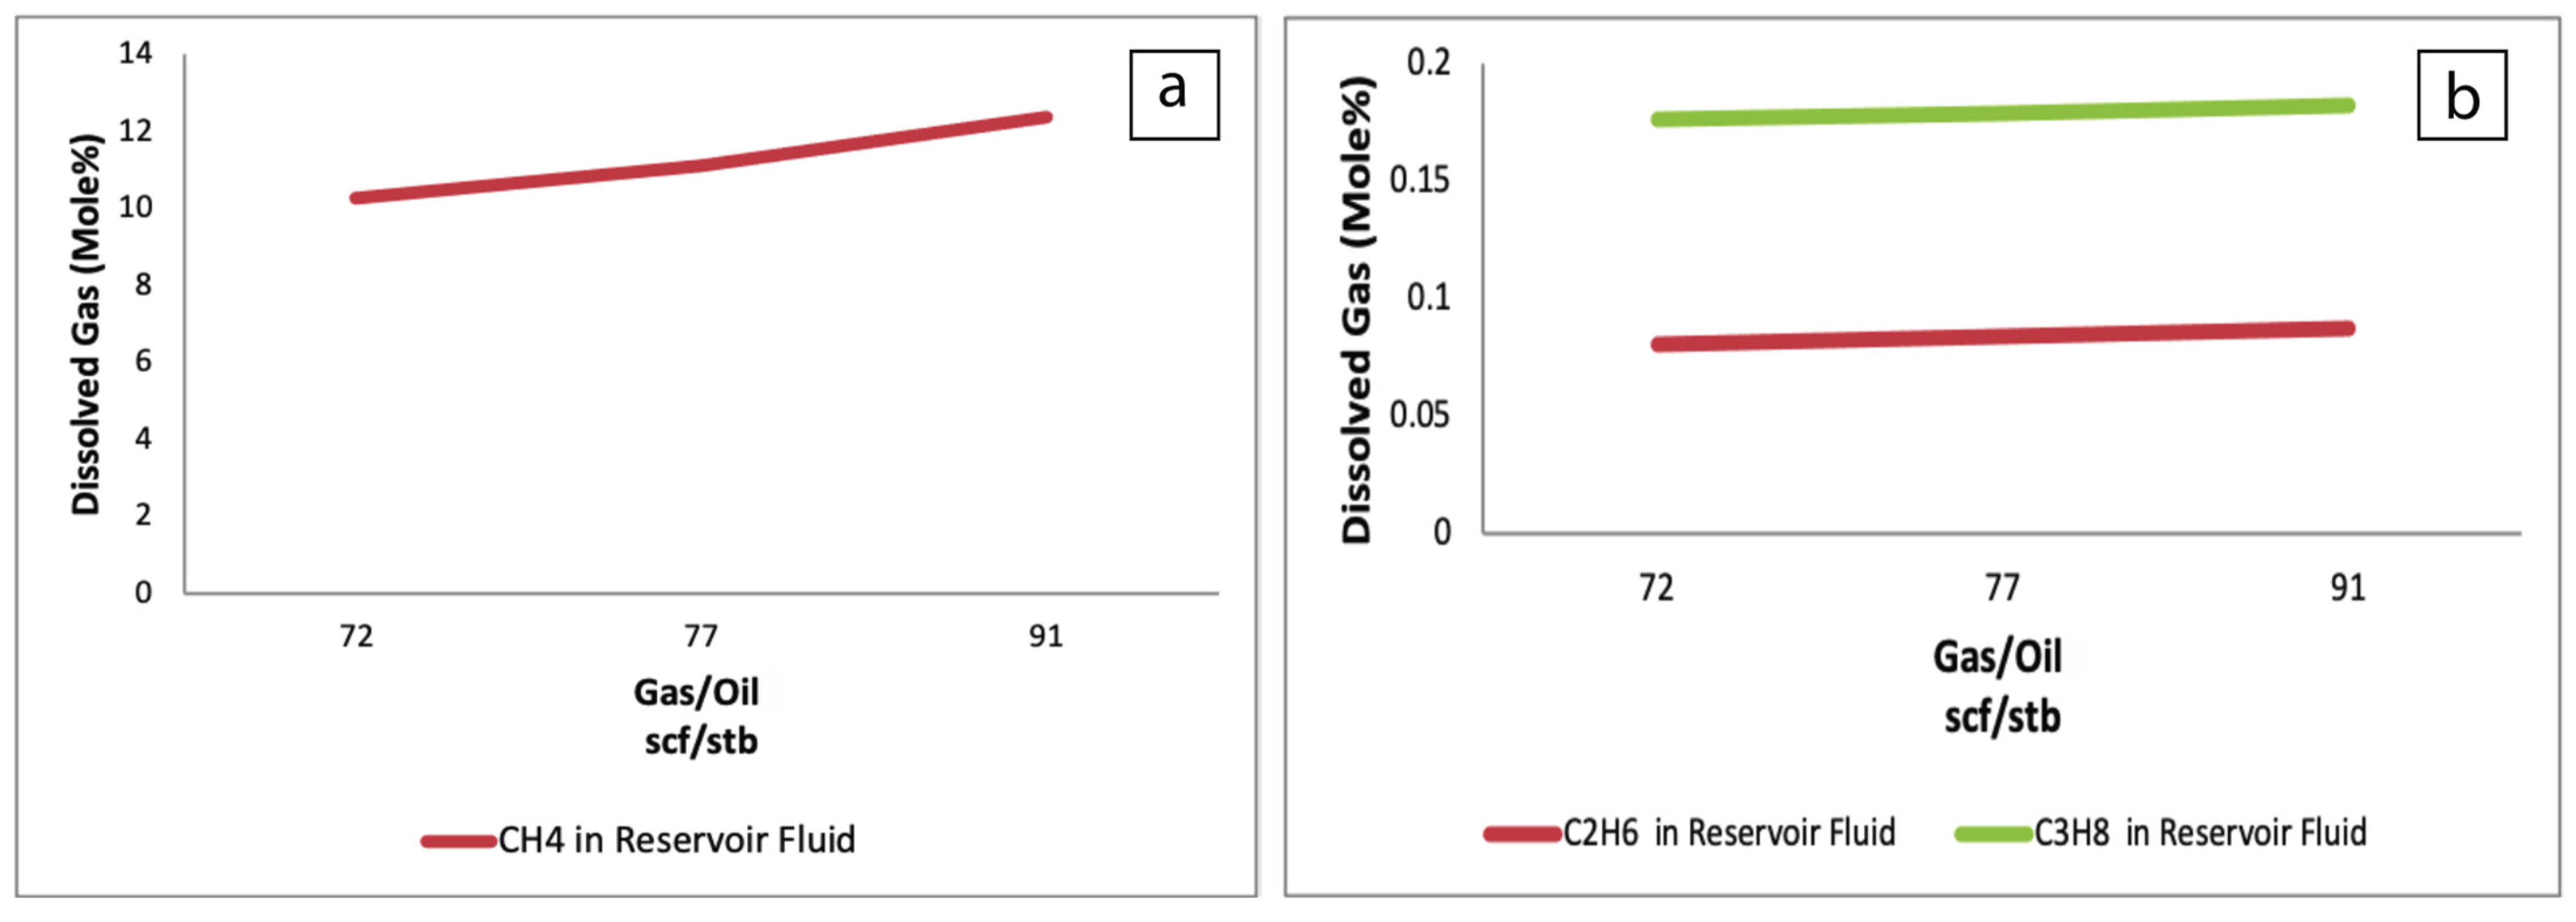
| 4 | Gas–oil ratio | CH4 dissolved (mole%) | y = 8.707ln(x) − 26.868 | R2 = 0.9869 |
| C2H6 dissolved (mole%) | y = 0.0003x + 0.0605 | R2 = 0.9304 | ||
| C3H8 dissolved (mole%) | y = 0.0003x + 0.1555 | R2 = 0.9304 | ||
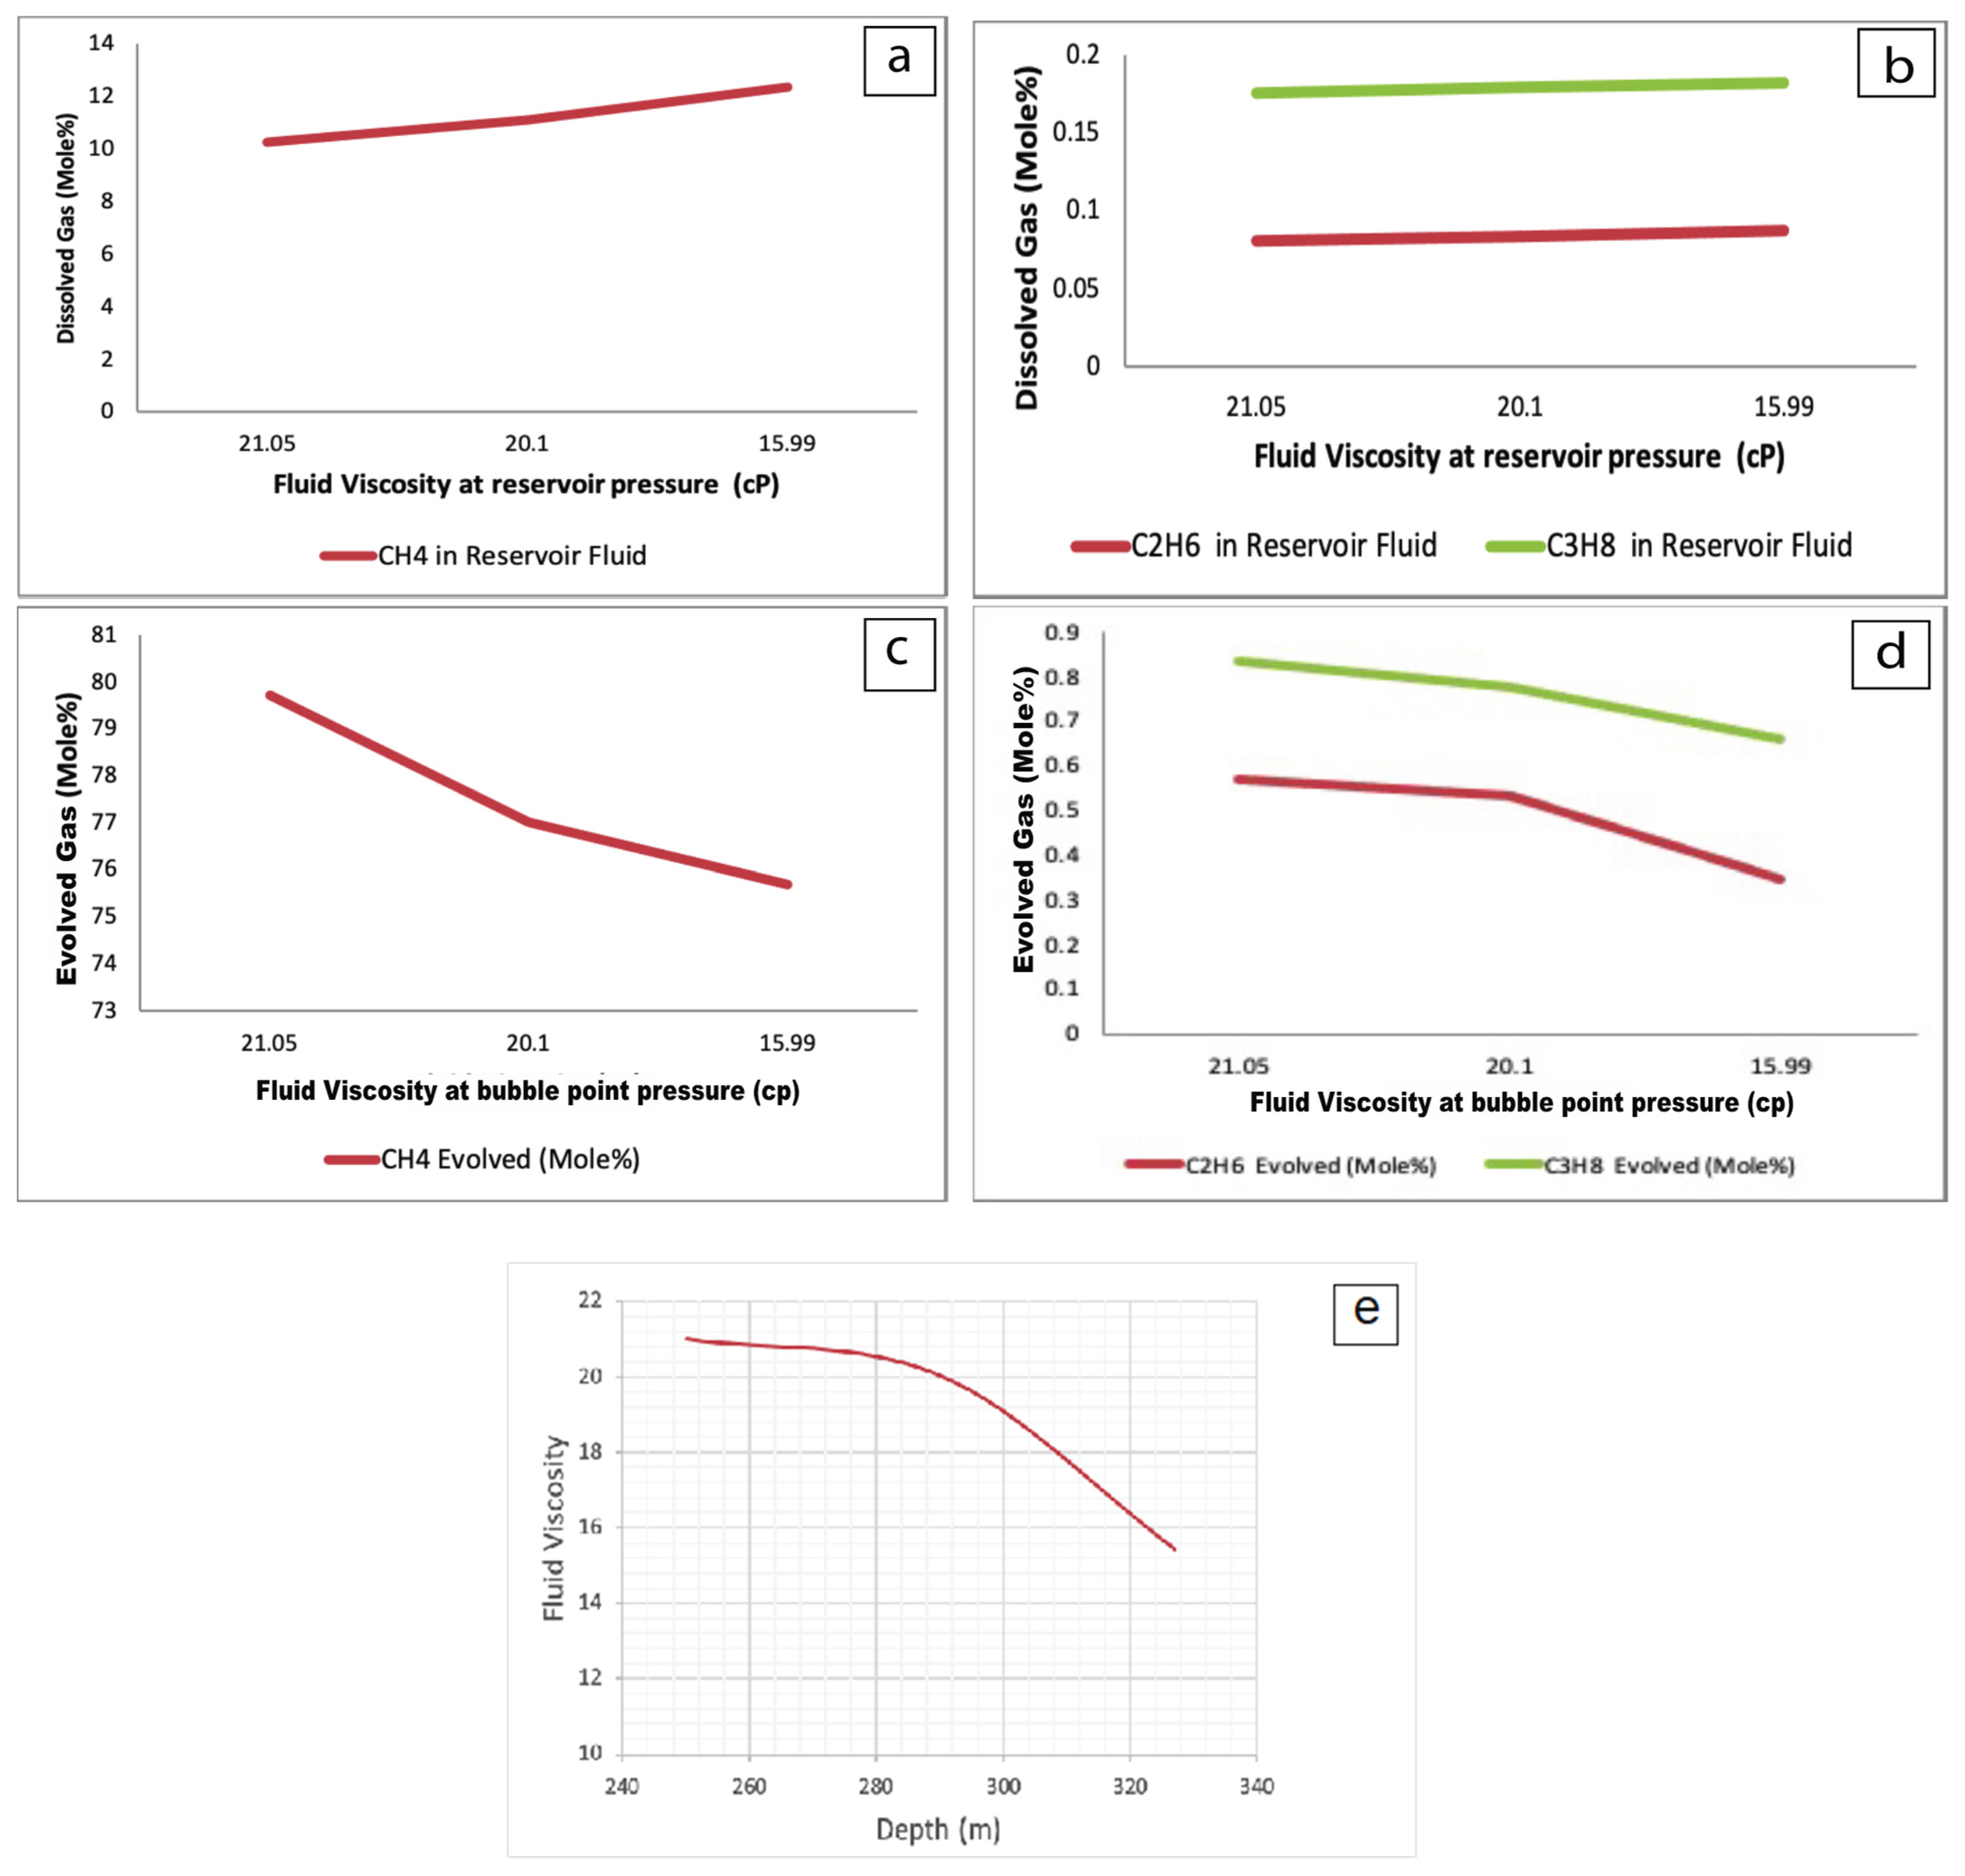
| 5 | Viscosity (cP) at reservoir pressure | CH4 dissolved (mole%) | y = −0.3836x + 18.55 | R2 = 0.9527 |
| C2H6 dissolved (mole%) | y = −0.001x + 0.104 | R2 = 0.885 | ||
| C3H8 dissolved (mole%) | y = −0.001x + 0.199 | R2 = 0.885 | ||
| Viscosity (cP) at bubble-point pressure | CH4 dissolved (mole%) | y = −0.3466x + 17.766 | R2 = 0.9461 | |
| C2H6 dissolved (mole%) | y = −0.0009x + 0.1018 | R2 = 0.8752 | ||
| C3H8 dissolved (mole%) | y = −0.0009x + 0.1968 | R2 = 0.8752 | ||
| Depth (m) | Viscosity (cP) at bubble point pressure | y = −0.0714x + 39.463 | R2 = 0.860 | |
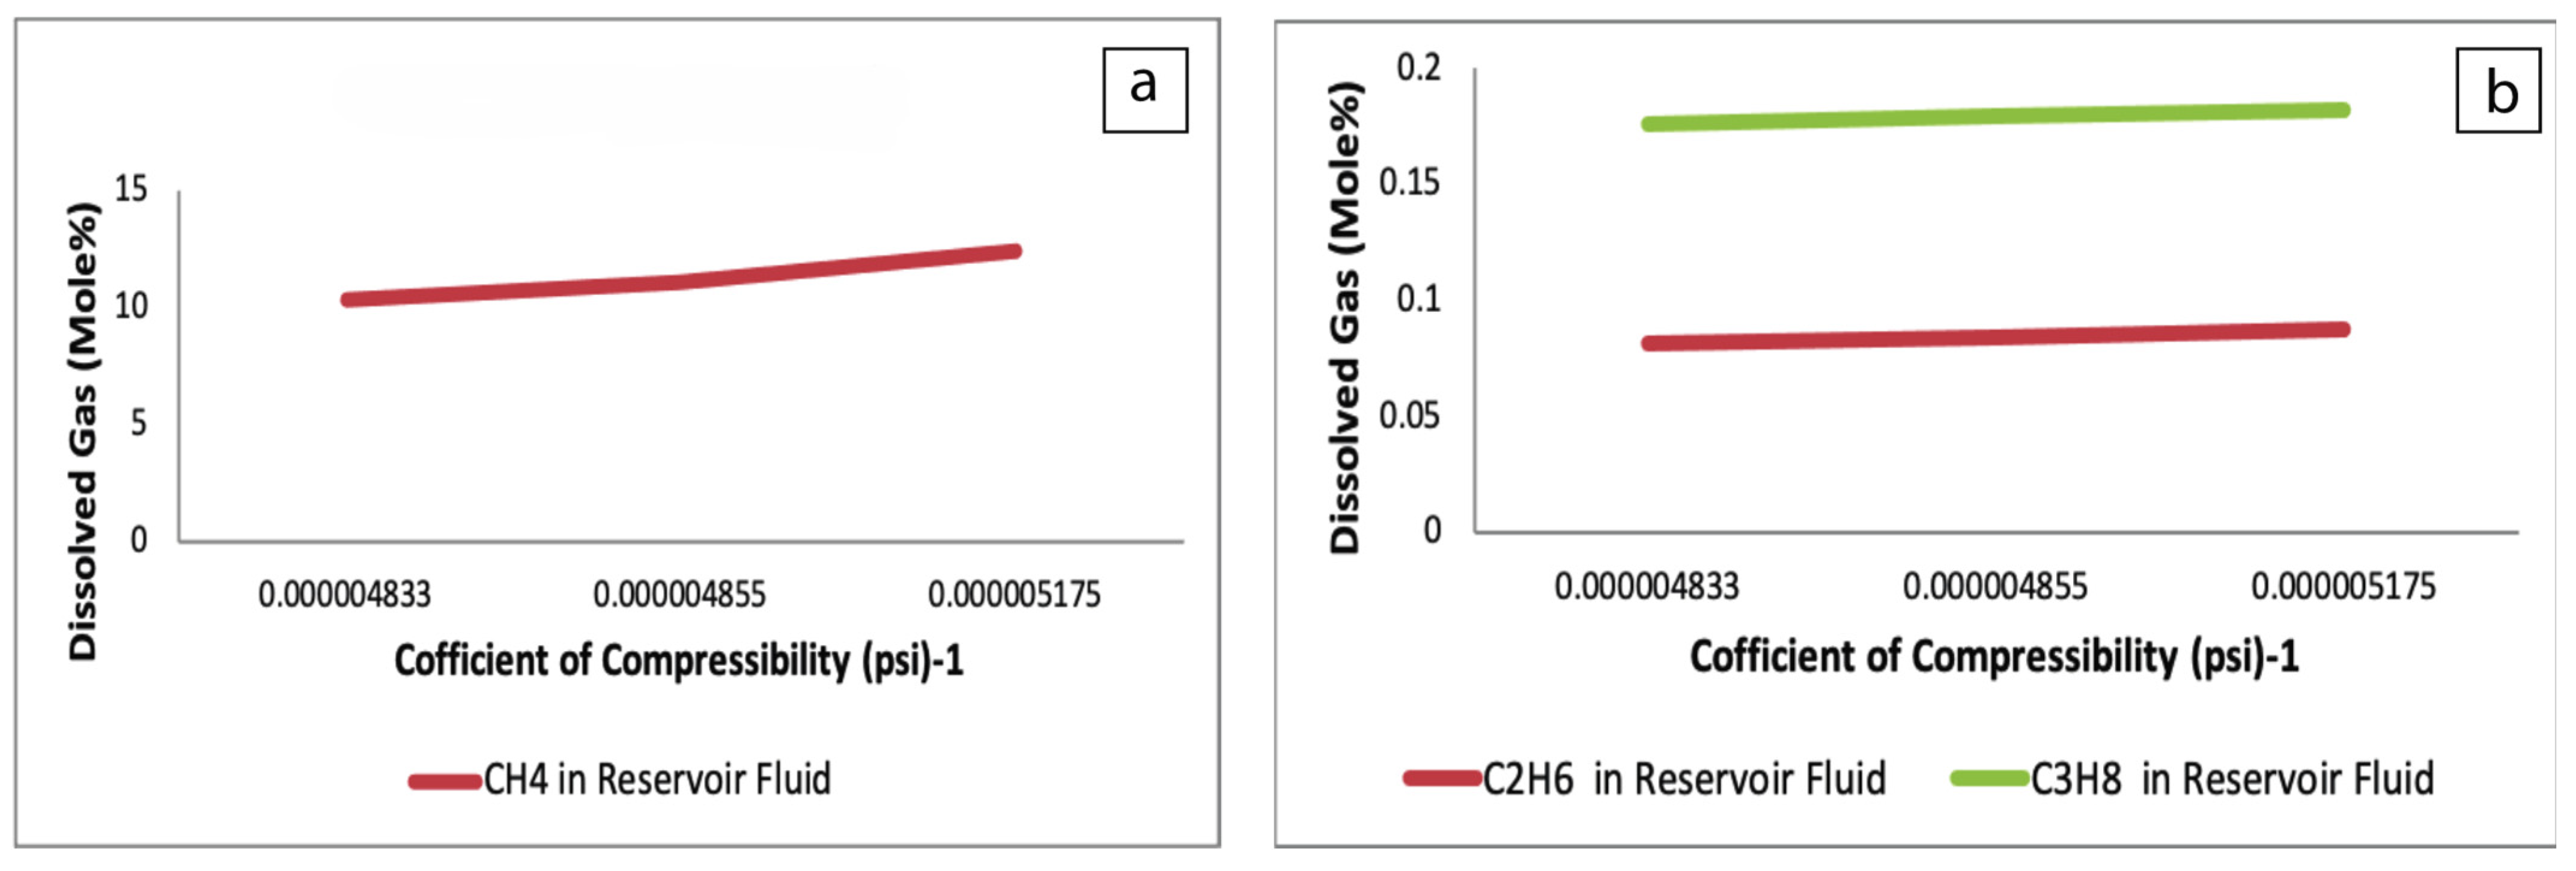
| 6 | Coefficient of compressibility at reservoir pressure | CH4 dissolved (mole%) | y = 5 × 10+6x − 14.554 | R2 = 0.8892 |
| C2H6 dissolved (mole%) | y = 14,001x + 0.0146 | R2 = 0.798 | ||
| C3H8 dissolved (mole%) | y = 14,001x + 0.1096 | R2 = 0.798 | ||
| 7 | °API | Fluid density | y = −0.0118x + 1.175 | R2 = 0.9981 |
| °API | CH4 dissolved (mole%) | y = 0.0014e0.3803x | R2 = 0.9773 | |
| C2H6 dissolved (mole%) | y = 0.012x − 0.1985 | R2 = 0.9376 | ||
| C3H8 dissolved (mole%) | y = 0.012x − 0.1035 | R2 = 0.9376 | ||
| 8 | Gross heating value | CH4 evolved (mole%) | y = 0.0016x + 10.64 | R2 = 0.9981 |
| C2H6 evolved (mole%) | y = 8 × 10⁻⁵x − 2.8784 | R2 = 0.7475 | ||
| C3H8 evolved (mole%) | y = 7 × 10⁻⁵x − 1.9633 | R2 = 0.8809 | ||
Disclaimer/Publisher’s Note: The statements, opinions and data contained in all publications are solely those of the individual author(s) and contributor(s) and not of MDPI and/or the editor(s). MDPI and/or the editor(s) disclaim responsibility for any injury to people or property resulting from any ideas, methods, instructions or products referred to in the content. |
© 2023 by the authors. Licensee MDPI, Basel, Switzerland. This article is an open access article distributed under the terms and conditions of the Creative Commons Attribution (CC BY) license (https://creativecommons.org/licenses/by/4.0/).
Share and Cite
Kamal, I.; Salih, N.M.; Martyushev, D.A. Correlations between Petroleum Reservoir Fluid Properties and Amount of Evolved and Dissolved Natural Gas: Case Study of Transgressive–Regressive-Sequence Sedimentary Rocks. J. Mar. Sci. Eng. 2023, 11, 1891. https://doi.org/10.3390/jmse11101891
Kamal I, Salih NM, Martyushev DA. Correlations between Petroleum Reservoir Fluid Properties and Amount of Evolved and Dissolved Natural Gas: Case Study of Transgressive–Regressive-Sequence Sedimentary Rocks. Journal of Marine Science and Engineering. 2023; 11(10):1891. https://doi.org/10.3390/jmse11101891
Chicago/Turabian StyleKamal, Ibtisam, Namam M. Salih, and Dmitriy A. Martyushev. 2023. "Correlations between Petroleum Reservoir Fluid Properties and Amount of Evolved and Dissolved Natural Gas: Case Study of Transgressive–Regressive-Sequence Sedimentary Rocks" Journal of Marine Science and Engineering 11, no. 10: 1891. https://doi.org/10.3390/jmse11101891
APA StyleKamal, I., Salih, N. M., & Martyushev, D. A. (2023). Correlations between Petroleum Reservoir Fluid Properties and Amount of Evolved and Dissolved Natural Gas: Case Study of Transgressive–Regressive-Sequence Sedimentary Rocks. Journal of Marine Science and Engineering, 11(10), 1891. https://doi.org/10.3390/jmse11101891