Abstract
Sea urchins play an important role in coastal marine ecosystems and are an economically valuable resource for their gonads (roe or uni). Increased demand by Asian and European countries caused overfishing of wild stocks resulting in a sharp decline of sea urchin populations. The increased efforts in developing cost-effective protocols are focused on larval development up to pre- and post-metamorphosis stages, as they are one of the main difficulties of echinoculture. This is a preliminary study to evaluate the influence of microalgal varying diet rationing on larval development, growth, and survivorship at pre-metamorphosis of Sphaerechinus granularis echinopluteus (30 days post-fertilization). Three microalgae diets based on Dunaliella tertiolecta and Rhodomonas marina and the combination of both species were tested. Each diet used three ration treatments: low ration (500–3000 cells⋅ml−1); medium ration (1000–6000 cells⋅ml−1); and high ration (4000–24,000 cells⋅ml−1), which were cell-density adjusted to larval development. Assays used three triplicated treatments in 8 L cylindrical–conical glass incubators. Results showed that the survival of S. granularis echinopluteus was positively influenced by diets of lower cellular densities and a combined microalgae diet. Adoption of this type of diet regime is expected to improve larval production and provide the groundwork for future research on S. granularis in aquaculture.
1. Introduction
Several species of sea urchins such as Paracentrotus lividus, Psammechinus miliaris, Strongylocentrotus droebachiensis, and Sphaerechinus granularis are exploited worldwide for their gonads (roe or uni) due to being highly regarded as a culinary delicacy. In regions such as Asia (with Japan as the principal consumer), Europe, Chile, and New Zealand, wild populations have been declining from over-exploitation [1,2,3].
Due to the unsustainable exploitation and crescent demand for seafood, aquaculture production is probably the best sustainable alternative to support the needs of global demand for uni [4,5]. Most aquaculture research in sea urchins focuses on the development and survival rates of larval planktonic stages up to post-metamorphosed juveniles, as they represent the major bottlenecks of echinoculture development [4,6,7,8].
The sea urchin S. granularis (Lamarck, 1816), commonly known as the purple or blunt sea urchin, is a common grazer and displays a typical covering behavior using shell fragments, pebbles, and algae [9]. They occur in the NE Atlantic, the Gulf of Guinea, and the Mediterranean Sea. This species can be found from the intertidal zone up to 130 m depth [3,9,10]. S. granularis has a life expectancy of 5 years and a high growth rate compared to other sea urchin species [11]. S. granularis urchins can attain 100 mm TD in 4 years, whereas P. lividus achieves 45–65 mm TD over the same 4-year duration in culture conditions [3,12,13].
Despite the increased importance of S. granularis as a fishery resource, the knowledge of its biology is still scarce [9]. Regarding aquaculture, research is needed to develop and optimize cost-effective methods to create protocols for rearing S. granularis under optimal conditions [13].
The establishment of an adequate diet to produce high-survival and good-quality larvae is a decisive step to support further research and development of aquaculture production methods for S. granularis. The algal species D. tertiolecta and R. marina have exhibited some of the highest survival rates in prior studies concerning the larval development of P. lividus echinopluteus [7,14]. Additionally, a connection has been established between the cellular size of microalgae and the mouth size of echinopluteus, as described in the literature [15]. For the echinopluteus larvae particles, 5 to 50 µm is noted to be the preferred size for feeding. This study focused on the evaluation of larval development, growth, and survivorship at pre-metamorphosis of S. granularis echinopluteus when fed with varying diet rations of microalgae.
2. Materials and Methods
2.1. Broodstock Collection and Rearing
Adult S. granularis broodstock (test size > 50 mm) were collected from local wild populations by snorkeling in the subtidal at east Madeira Island (Quinta-do-Lorde; 32°74′11.25″ N; 16°70′96.36″ W) in August 2021. The specimens were placed in 25 L containers with natural seawater and transported to Calheta Mariculture Center (CMC) where they were kept in two outdoor 750 L tanks with running ambient seawater and water flow of approximately 90 L per hour. The animals were fed Zea mays, at 0.7% of the biomass present in the rearing tanks three times a week, and before each feeding the uneaten food and feces were siphoned.
2.2. Spawning and Larval Rearing
Three assays were conducted. Each assay randomly selected three males and two females from the broodstock, using a total of 15 specimens with the following biometric measurements (average ± SD): humid body weight: 153.68 ± 23.92 g; body diameter: 68.36 ± 4.05 mm; and body height: 41.63 ± 2.53 mm. Sea urchins were cleaned with filtered and autoclaved seawater (20 µm; 121 °C, 15 min; hereafter referred to as FAS) and induced to spawn by agitation method [16]. Spawning urchins were placed individually with the oral side facing down in glass cubes with 1.5 L FAS for less than 30 min from the beginning of induction procedures. Eggs and sperm were pooled separately in 500 mL beakers, suspended in FAS. Egg and sperm densities were estimated with the Seggewick Rafter counting chamber and Malassez counting chamber, respectively, using a light microscope (Axioskop 2 plus, Carl Zeiss, Aalen, Germany). Egg fertilization was achieved by adding sperm volume that guaranteed the proportion of 500 spermatozoa: 1 oocyte [17]. Fertilization success (~95%) was calculated by counting the number of eggs featuring the fertilization envelope two hours after the fertilization procedure. The fertilized eggs were incubated in 6 L laboratory glass balloon bottles with FAS, at 16 ± 1 °C and medium aeration for 72 h [13].
The larval culture methods described were based on previous studies focused on development and survival in response to varying microalgae diet quantity and species [6,14,18]. For technical details, the larvae were transferred to nine 8 L cylindrical–conical glass incubators after reaching the two-arm (2 b) stage. The incubators were filled with 7 L filtered (20 µm) and ultraviolet sterilized seawater (hereafter referred to as FUVS) (AQUA—UV, De BARY, Frankfurt, Germany). Incubators were maintained partially submerged in a 200 L tank with a controlled temperature of 19 °C (water chiller HC 500A, Hailea, Chaozhou, China). The larvae were reared with a stocking density of 2 larvae⋅mL−1 in aerated, static FUVS and under fluorescent light for a constant photoperiod of 12 h light: 12 h dark.
Water quality parameters of oxygen (O2) (multiparametric meter HandyPolaris, Oxigard®, Farum, Denmark), pH (pH Checker, HANNA, Villafranca Padovana, Italy), and salinity (refractometer, H2Ocean, Stuart, FL, USA) were registered three times a week. Then, water changes (10% volume) were done in the incubators, and temperature was registered every hour (Logger HOBO MX2201, Onset, Cape Cod, MA, USA) for the duration of the assays. Ammonia concentration was monitored twice weekly (NH4/NH3 Test, SERA, Heinsberg, Germany) between water changes days.
2.3. Microalgae Culture
The microalgae Dunaliella tertiolecta (Chlamydomonales, CCAP 19/613) and Rhodomonas marina (Pyrenomonadales, CCAP 995/5), were grown in 5 L batch cultures [19] using a commercial culture medium (Nutribloom©, Necton, Olhão, Portugal). Fluorescent lights were used to keep a continuous photoperiod (24 h light) at 16 ± 1 °C and medium aeration. Microalgae were collected during the exponential growth phase and used in the assays.
2.4. Assays and Treatments
To study the influence of diet rationing, measured as algal cell density [18], three independent assays (D1, D2, and D3) were performed on the larval culture of S. granularis. The assays were performed sequentially between July and November 2022. Each assay used 126,000 larvae and a different microalga diet, i.e., assay D1 used a monospecific diet of D. tertiolecta, assay D2 used a monospecific diet of R. marina, and assay D3 used a combination of both algal species in the same proportion (D. tertiolecta + R. marina 1:1). Larval feeding was done three times a week on alternated days. Each assay D1, D2, and D3 used the following treatments: low ration (LR), medium ration (MR), and high ration (HR); the algal cell density treatments cells⋅ml−1 were adjusted accordingly with the larval stage (Table 1) following previous studies [14,18,20,21]. Three replicates for each treatment were used.

Table 1.
Microalgae cell density (cells⋅mL−1) used in the different treatments: low ration (LR); medium ration (MR); and high ration (HR) of assay D1 (Dunaliella tertiolecta), D2 (Rhodomonas marina), and D3 (D. tertiolecta + R. marina 1:1); and adjusted to the different larval stages: 2-arm pluteus (2 b); 4-arm pluteus (4 b); 6-arm pluteus (6 b); and 8-arm pluteus (8 b).
2.5. Development, Morphology, and Survival
Larval development was assessed by identification of the larval stages. Identification was performed twice weekly based on the formation of new pairs of arms in the echinopluteus larvae (Figure 1). Stages identified in the present study were: two-arm pluteus (2 b); four-arm pluteus (4 b); six-arm pluteus (6 b); eight-arm pluteus (8 b); and competent/pre-metamorphic larvae (Figure 1). Developmental stages used to perform the shift in the algal cell density within the same treatment (see Table 1) were established when the ratio of larvae at the corresponding stages was at least 75% (Figure 2) [2,13,17]. Observations were done using a light microscope (Axioskop 2 plus, Carl Zeiss, Aalen, Germany).
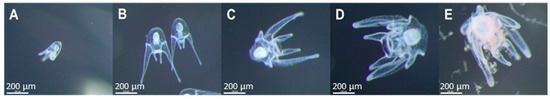
Figure 1.
Sphaerechinus granularis larval development by larvae stage. (A): two-arm pluteus (2 b); (B): four-arm pluteus (4 b); (C): six-arm pluteus (6 b); (D): eight-arm pluteus (8 b); (E): competent larvae/pre-metamorphic.
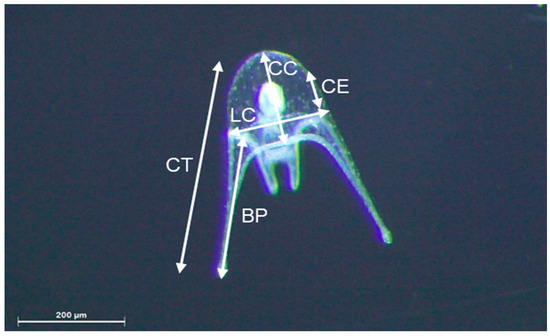
Figure 2.
Sphaerechinus granularis four-arm pluteus (4 b). Larvae biometric parameters: CT: total length; CC: body length; LC: body width; BP: post-oral arm length; CE: stomach length.
In addition to weekly larval stage assessment, the larvae were sampled (10% of the volume in the incubators) in all assays (D1, D2, and D3) at 10, 25, and 30 days post-fertilization (DPF) [14] to measure the following biometric parameters: total length (CT); body length (CC); body width (LC); post-oral arm length (BP); and stomach length (CE) following the method described by Kelly et al. [18] (Figure 2). Biometric parameters were represented as larvae stages pooled together, reflecting larval development.
Measurements were performed using a stereo microscope (M165 C, LEICA, Germany) coupled with a digital camera (IC90 E, LEICA, Munich, Germany) and image analysis software (LAS X, LEICA, Munich, Germany). Survival (percentage values) was calculated by dividing the initial number of larvae transferred to the cylindrical–conical incubators by the total number of living larvae at 30 DPF.
2.6. Statistical Analyses
Assays were statistically analyzed separately. Larval development analyses were performed within each age (10, 25, and 30 DPF); the ratio of each larval stage was analyzed separately as a dependent variable using the ration treatments as factors. Larval morphology analyses were done within each age (10, 25, and 30 DPF); each biometric parameter was analyzed separately as a dependent variable using the ration treatments as factors. Survival was analyzed considering survival values as dependent variables and the treatments as factors.
Statistical analyses were conducted using IBM SPSSTM Statistics 25 (IBM Corporation, AMONK, New York, NY, USA). All data were tested using the Shapiro–Wilk test for normality and Leven’s test for homogeneity. Parametric data were analyzed using one-way ANOVA (Fdf = value; significance level p) followed by the post hoc Bonferroni test. Nonparametric data were analyzed using the Kurskal–Wallis test (Hdf = value; significance level p) followed by the post hoc Games–Howell test [22]. Results were expressed as mean ± standard deviation (SD), and in all cases, the null hypothesis was rejected when p < 0.05 for all statistical analyses.
3. Results
3.1. Water Quality
Considering all assays, we maintained consistent water quality parameters for the duration of the trials with T = 19.23 ± 0.30 °C (n = 4784), dissolved O2 = 6.58 ± 0.22 mg·L−1 (n = 315), pH = 8.08 ± 0.03 (n = 315), salinity = 36 ± 0 (n = 315), and ammonia was 0 ± 0 (n = 189).
3.2. Larval Development
Assay D1: there were no significant differences in the larvae stage distribution among treatments (H1 = 0.000; p = 1.00) at 10 DPF. At this point, 100% (n = 422) of sampled larvae were at the development stage 4 b (Figure 3A). At 25 DPF, significant statistical differences were detected in the larvae stage distribution in the HR treatment when compared with LR and MR treatments (H1 = 3.319; p < 0.05) (Games–Howell tests; p < 0.05). In the LR treatment, 9.1% (n = 1) of the larvae were at the 2 b stage and 90.9% (n = 10) at the 4 b stage. In the MR treatment, 75% (n = 6) of the larvae were at the 4 b stage and 25% (n = 2) at the 6 b stage. The HR treatment showed that 100% (n = 2) of the sampled larvae were at the 8 b stage (Figure 3B). At 30 DPF, statistical analyses detected differences in the larvae stage distribution among treatments (H1 = 16.688; p < 0.05), these differences were significant among all treatments (Games–Howell tests; p < 0.05). In the LR treatment, 95.1 % (n = 77) of the larvae were at the 4 b stage and 4.9 % (n = 4) at stage 6 b. In the MR treatment, 71.1% (n = 54) of the larvae were at stage 4 b, 21.1% (n = 16) at the 6 b stage, and 7.9% (n = 6) at the 8 b stage. In the HR treatment 27% (n = 10) of the larvae were at the 4 b stage, 56.8% (n = 21) at the 6 b stage, and 16.2% (n = 6) at the 8 b stage (Figure 3C).
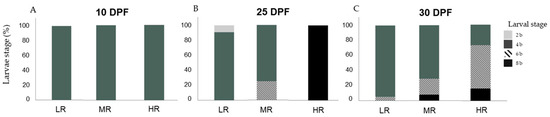
Figure 3.
Percentage (%) of Sphaerechinus granularis larvae stage by treatment (treatment conditions are defined in Table 1) at days post-fertilization (DPF): 10 (A), 25 (B), and 30 (C), in assay D1 (Dunaliella tertiolecta). Differences among treatments were considered significant at p < 0.05.
In assay D2, at 10 DPF no statistical differences were detected in the larvae stage distribution among treatments (H1 = 1.000; p = 1.00). One hundred percent of sampled larvae (n = 92) were at development stage 4 b (Figure 4A). At 25 DPF, statistical analyses found no statistical differences in the larvae stage distribution among treatments (H1 = 1.273; p = 0.259). In the LR treatment, 66.7% (n = 8) of the larvae were at 8 b and 33.3% (n = 4) at the pre-metamorphic stage. In the MR treatment, 100% (n = 3) of the larvae were at the 8 b stage. In the HR treatment, 60% (n = 3) of the larvae were at the 8 b stage and 40% (n = 2) at the pre-metamorphic stage (Figure 4B). At 30 DPF, statistical differences were detected in the larvae stage distribution among treatments (H1 = 4.673; p < 0.05). These differences were revealed to be significant when comparing the HR treatment with LR and MR treatments (Games–Howell tests; p < 0.05). In the LR treatment, 100% (n = 32) of the larvae were at the pre-metamorphic stage. In the MR treatment, 7.1% (n = 1) of the larvae were at the 6 b stage, 7.1% (n = 1) at the 8 b stage, and 85.7% (n = 12) at the pre-metamorphic stage. The HR treatment did not produce living larvae at this sampling point (Figure 4C).
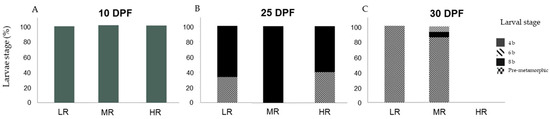
Figure 4.
Percentage (%) of Sphaerechinus granularis larvae stage by treatment (treatment conditions are defined in Table 1) at days post-fertilization (DPF): 10 (A), 25 (B) and 30 (C), in assay D2 (Rhodomonas marina). Differences among treatments were considered significant at p < 0.05.
In assay D3, at 10 DPF no significant differences were detected in the larvae stage distribution among treatments (H1 = 0.000; p = 1.00). One hundred percent of sampled larvae (n = 270) were at development stage 4 b (Figure 5A). At 25 DPF, statistical analyses found no statistical differences in the larvae stage distribution among treatments (H1 = 1.750; p = 0.186). In the LR treatment, 100% (n = 3) of the sampled larvae were at the 8 b stage. In the MR treatment, 25% (n = 1) were at stage 4 b, 25% (n = 1) at the 6 b stage, and 50% at the 8 b stage (Figure 5B). At 30 DPF, larvae stage distribution among treatments was statistically different among treatments (H1 = 9.085; p < 0.05). These differences were statistically significant when compared to the LR treatment with the MR treatment (Games–Howell tests; p < 0.05). In treatment LR 21.1% (n = 4) of the larvae were at the 4 b stage, 36.8% (n = 7) at the 6 b stage, and 42.1% (n = 8) at the 8 b stage. In the MR treatment, 3% (n = 1) of the larvae were at the 4 b stage, 15.2% (n = 5) at the 6 b stage, and 81.8% (n = 27) at the 8 b stage. In the HR treatment, 14.3% (n = 1) of the larvae were at the 4 b stage, 28.6% (n = 2) at the 6 b stage, and 57.1% (n = 4) at the 8 b stage (Figure 5C).
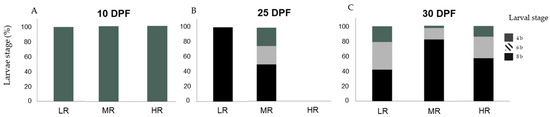
Figure 5.
Percentage (%) of Sphaerechinus granularis larvae stage by treatment (treatment conditions are defined in Table 1) at days post-fertilization (DPF): 10 (A), 25 (B), and 30 (C), in assay D3 (Dunaliella tertiolecta and Rhodomonas marina at a 1:1 cellular ratio). Differences among treatments were considered significant at p < 0.05.
3.3. Larval Morphology
In assay D1, at 10 DPF statistical analyses detected differences in the distribution in larvae biometric parameters CT (H2 = 85.092; p < 0.05); CC (H2 = 111.534; p < 0.05); BP (H2 = 106.940; p < 0.05); LC (H2 = 97.688; p < 0.05); and CE (H2 = 105.053; p < 0.05) among treatments (Figure 6). The distribution of CC (193.79 ± 30.39 µm); LC (173.38 ± 44.79 µm); and CE (106.97 ± 17.07 µm) were higher in the HR treatment and CT (501.57 ± 65.97 µm) and BP (352.57 ± 59.32 µm) were higher in the MR treatment (Games–Howell tests; p < 0.05) (Figure 6, column 10 DPF). At 25 DPF, differences were found in the distribution of larvae measurement LC (H2 = 9.270; p < 0.05). Statistical analysis showed these differences were not significant for LC (362.08 ± 130.18 µm) when comparing among treatments (Games–Howell tests; p < 0.05) (Figure 6K). At 30 DPF, statistical differences were detected in the distribution of the biometric parameters CC (H2 = 64.149; p < 0.05), LC (H2 = 91.519; p < 0.05), and CE (H2 = 58.490; p < 0.05). These differences were significant among treatments (LR, MR, HR) (Games–Howell tests; p < 0.05). The distribution of CC (246.17 ± 58.17 µm); LC (249.84 ± 77.47 µm); and CE (166.34 ± 44.41 µm) was higher in treatment HR (Figure 6F,M,P).
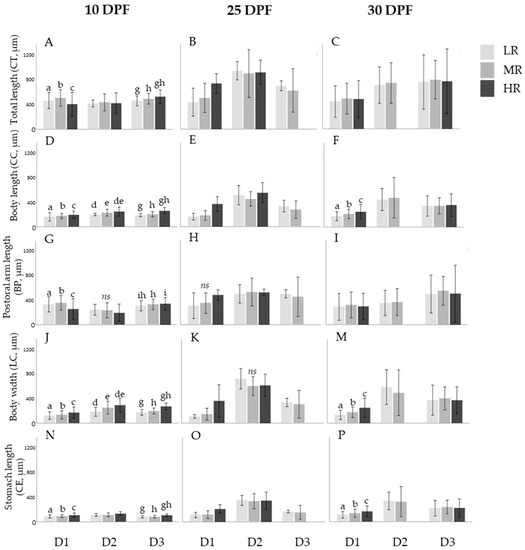
Figure 6.
Mean (± DP) of the distribution of the biometric parameters: total length (CT), body length (CC), body width (LC), post-oral arm length (BP), and stomach length (CE) in microns (µm) registered in S. granularis larvae by treatment (LR, MR, HR) at 10, 25, and 30 days post-fertilization (DPF) for assays D1 (D. tertiolecta), D2 (R. marina), and D3 (D. tertiolecta and R. marina at a 1:1 cellular ratio) organized in subfigures (A–P). Significant differences (p < 0.05) in the distribution of biometric parameters among treatments are represented by superscript letters (a–i and non-significant differences (p > 0.05) are represented as ns. The absence of superscript letters indicates that there were no significant or non-significant differences in the distribution of biometric parameters among treatments.
In assay D2, at 10 DPF differences were found in the distribution of larvae biometric parameters CC (H2 = 10.187; p < 0.05); BP (H2 = 1.114; p < 0.05); LC (H2 = 15.070; p < 0.05); and CE (H2 = 28.904; p < 0.05). The measurement CC (245.32 ± 36.42 µm) was significantly higher in the HR treatment and BP (233.28 ± 59.84 µm) showed to be higher in treatment MR as the biometric parameter LC (293.85 ± 55.29 µm) was significantly higher in treatment HR (Games–Howell tests; p < 0.05) (Figure 6D,G,J). The differences found in the distribution of the biometric parameter BP were not statistically significant among treatments (Games–Howell tests; p < 0.05) (Figure 6G). At 25 DPF, statistical analyses found differences in the distribution of larvae biometric parameter LC (H2 = 6.501; p < 0.05), these differences were not significant when comparing among treatments (Games–Howell tests; p < 0.05) (Figure 6K). At 30 DPF, there were no differences in the distribution of the biometric parameters (CC; CT; BP; LC; CE) among treatments (LR, MR, HR) (Games–Howell tests; p < 0.05) (Figure 6, column 30 DPF).
In assay D3, at 10 DPF statistical analyses found differences in the distribution of parameters CT (H2 = 74.940; p < 0.05); CC (H2 = 175.583; p < 0.05); BP (H2 = 223.119; p < 0.05); LC (H2 = 189.158; p < 0.05); and CE (H2 = 152.722; p < 0.05). The distribution of CT (523.04 ± 53.82 µm); CC (259.36 ± 25.33 µm); LC (273.07 ± 27.00 µm); and CE (105.71 ± 10.98 µm) was revealed to be significantly higher in the HR treatment (Games–Howell tests; p < 0.05) and the distribution of BP (304.88 ± 40.35 µm) showed to be significantly higher in treatment LR (Games–Howell tests; p < 0.05) (Figure 6, column 10 DPF). At 25 and 30 DPF, results showed no statistically significant differences in the distribution of all biometric parameters (CC; CT; BP; LC; CE) among treatments (LR; MR; HR) (Games–Howell tests; p < 0.05) (Figure 6, columns 25 and 30 DPF).
3.4. Larval Survival
In assay D1, statistical differences were detected in the survival distribution among treatments. Survival in the MR treatment (0.20 ± 0.05%) showed to be significantly lower when compared to the LR and HR treatments (0.25 ± 0.11 and 0.23 ± 0.05%, respectively) (H2 = 36.356; p < 0.05) (Games–Howell tests; p < 0.05) (Figure 7). In assay D2, there were significant differences in the survival distribution among all treatments (H2 = 37.780; p < 0.05), showing higher survival at LR (0.10 ± 0.02%). On the contrary, survival was negligible at HR (0.00 ± 0.00%) (Games–Howell tests; p < 0.05) (Figure 7). Assay D3 showed significantly higher survival in the LR and MR treatments (0.07 ± 0.03 and 0.07 ± 0.01%, respectively) when compared with the HR treatment (0.02 ± 0.01%) (H2 = 19.841; p < 0.05) (Games–Howell tests; p < 0.05) (Figure 7).
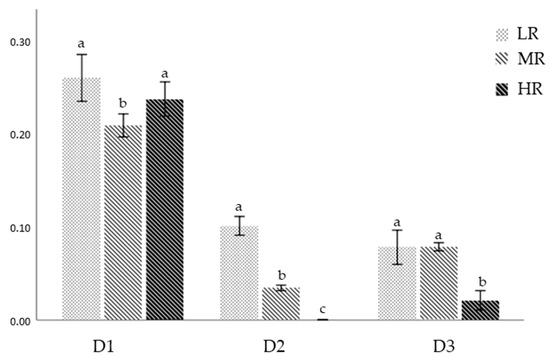
Figure 7.
Survival of S. granularis larvae at 30 DPF for assays D1 (D. tertiolecta), D2 (R. marina), and D3 (D. tertiolecta and R. marina at a 1:1 cellular ratio). Results showed as mean ± SD. Significant differences (p < 0.05) among treatments are represented by different letters (a–c).
4. Discussion
Previous studies have provided insights into the impact of diet rations and microalgae species on the survival and morphology of echinoid larvae in cultured conditions [17,21].
All conducted assays indicate that diet rationing significantly influenced larval development. For instance, in the case of S. granularis larvae, a monospecific diet of D. tertiolecta with a high ration (HR) facilitated faster development compared to treatments with lower cell density (LR, MR). At 25 days post-fertilization (DPF), most larvae were in the eight-arm pluteus stage. Similarly, during assay D1, the HR treatment led to a distribution of more advanced stages (6 b and 8 b pluteus), while the LR and MR treatments exhibited less-developed larvae (four-arm and six-arm pluteus). Notably, the D. tertiolecta HR treatment at 10 DPF resulted in higher biometric development in parameters such as body length (CC), body width (LC), and stomach length (CE), while the MR treatment promoted greater post-oral arm length (BP) development. At 30 DPF, the larvae in assay D1 demonstrated a consistent biometric development pattern, aligning with higher values for post-oral arm length (BP) in the MR treatment, as seen in previous studies involving E. esculentus, P. lividus, and P. miliaris. Survival rates in assay D1 were highest for the LR treatment, in line with findings from other authors [6,18,21].
When it comes to a monospecific diet of R. marina, no significant differences in larval stage development were observed among various ration treatments. Results showed consistent developmental stage distributions across treatments throughout the assay. While the higher cell density treatment (HR) promoted better biometric development in parameters such as CC, LC, and BP, the lower cell density treatments (LR, MR) excelled in promoting post-oral arm length (BP) development. Survival rates at 30 DPF were notably higher for the LR and MR treatments compared to the HR treatment. However, it is worth noting that survival rate results in this assay (D2) might not be linked to inadequate diet rationing but instead to accelerated stage progression, resulting in larvae completing metamorphosis in the incubators. It is worth noting that water quality parameters remained consistent throughout the trials, with no detection of ammonia.
In assays involving a combined diet of D. tertiolecta and R. marina at a 1:1 cellular ratio, comparable larval development was evident when comparing LR and MR treatments up to 25 DPF. By 30 DPF, it became evident that the combined microalgae diet supported larval development up to the 8 b stage. All treatments exhibited similar distributions of advanced larval stages and survival rates. In this context, the HR treatment fostered higher biometric development in parameters such as CT, CC, LC, and CE, while the LR treatment led to greater BP development. Notably, LR and MR treatments demonstrated the highest survival rates.
Regarding the larval development of S. granularis, there is limited literature on the larval stage and biometric dimensions. However, it is established that the species follows a conventional development into planktotrophic and morphologically intricate larvae that require around 30 to 40 days in aquaculture conditions to reach competence [13,23]. This study underscores the influence of diet rationing and lower cell density diets on larval development and survival rates, aligning with findings from studies involving P. lividus, P. miliaris, and S. droebachiensis [2,14,17,18,24]. Notably, changes in biometric parameters during larval development, such as post-oral arm length (BP) and body width (LC), hold importance in assessing larval response to specific diet rations.
It has been demonstrated that microalgae diets with lower cellular density tend to yield better survival rates in Echinus esculentus [21], P. lividus [2], and P. miliaris [18] larvae. Research by Jimmy et al. [21] on E. esculentus suggests that higher food rations can be disadvantageous for developing echinopluteus larvae, leading to decreased metamorphosis numbers and survivorship. While apparent physiological impairments are not evident, other factors such as algal metabolites might impact larvae fed high-ration diets. Similar observations were made by Kelly et al. [18] in P. miliaris larvae fed a high-ration diet, resulting in shortened post-oral arms when fed microalgae Pleurocrysis elongata. This indicates that different species exhibit diverse development patterns despite similar survivorship outcomes.
Within the present study, a monospecific diet of D. marina fostered larval survivorship but slowed development, with no specimens reaching the pre-metamorphic stage by 30 DPF. This suggests that D. marina sustains S. granularis larvae but does not promote rapid stage progression and only supports larval development up to the 8 b stage in 30 DPF. Kelly et al. [18] highlight that D. marina lacks long-chain polyunsaturated fatty acids (PUFAs) such as 20:5n − 3 (eicosapentaenoic) and 22:6n − 3 (docosahexaenoic), and while these PUFAs might not be essential for P. miliaris development, the impact of these and other biochemical components on larval, juvenile, or broodstock diets remains unexplored.
Conversely, a monospecific diet of R. marina resulted in faster development up to the pre-metamorphic stage by 30 DPF, albeit with poorer larval survivorship. A combination of both microalgae species diets yielded improved survival compared to a monospecific R. marina diet, although no specimens reached the pre-metamorphic stage by 30 DPF. Although the combination of both microalgae species seems better suited to the echinopluteus development of S. granularis, it is important to acknowledge that larvae survival in all assays was less than 1%, suggesting that further studies using other microalgae species and cellular equivalence are needed.
Considering the imperative of a dependable source of high-quality juveniles for sustainable aquaculture development, enhancing larval development and survival rate up to competence under aquaculture conditions is paramount. Having established in this preliminary work that a combination of both microalgae species seems a more appropriate diet for S. granularis larvae, it is crucial for future studies to assess the impact of factors such as temperature, salinity, and water quality ranges, which significantly influence water quality maintenance and successful larval production. Additionally, investigations should delve into diet regimes, comparing various microalgae species and their biochemical components, given their substantial influence on larval development and survival.
Author Contributions
Conceptualization, R.L.; Formal analysis, R.L.; Funding acquisition, C.A.; Investigation, R.L.; Methodology, R.L., R.J. and J.C.; Project administration, C.A.; Supervision, C.A.; Writing—original draft, R.L.; Writing—review and editing, C.A. All authors have read and agreed to the published version of the manuscript.
Funding
This study was performed under the project ISLANDAP ADVANCED “R + D + i Towards Aquaponic Development in the UP islands and the Circular Economy. Interregional forward challenges (ISLANDAP ADVANCED, MAC2/1. 1ª/299)” founded by FEDER under the INTERREG MAC 2014-2020 Program.
Institutional Review Board Statement
The present work did not involve vertebrates or protected or endangered species. All experimental procedures on sea urchins were conducted in compliance with the Portuguese law and Directive 2010/63/EU.
Informed Consent Statement
Not applicable.
Data Availability Statement
The data that support the findings of this study are available from the corresponding author upon reasonable request.
Acknowledgments
The authors also would like to thank the Centro de Maricultura da Calheta technicians, especially António Abreu, for their assistance in the conception and assembly of the systems for broodstock maintenance and larval assays.
Conflicts of Interest
The authors declare no conflict of interest.
References
- Andrew, N.; Agatsuma, Y.; Ballesteros, E.; Bazhin, A.; Creaser, E.; Barnes DK, A.; Botsford, L.W.; Bradbury, A.; Campbell, A.; Dixon, J.D.; et al. Status and management of world sea urchin fisheries. Oceanogr. Mar. Biol. 2002, 40, 343–425. [Google Scholar] [CrossRef]
- Brundu, G.; Monleón, L.V.; Vallainc, D.; Carboni, S. Effects of larval diet and metamorphosis cue on survival and growth of sea urchin post-larvae (Paracentrotus lividus, Lamarck, 1816). Aquaculture 2016, 465, 265–271. [Google Scholar] [CrossRef]
- Lourenço, S.; José, R.; Neves, P.; Gois, A.; Cordeiro, N.; Andrade, C.; Ribeiro, C. Population Density, Reproduction Cycle and Nutritional Value of Sphaerechinus granularis (Echinodermata: Echinoidea) in an Oceanic Insular Ecosystem. Front. Mar. Sci. 2022, 8, 699942. [Google Scholar] [CrossRef]
- Brundu, G.; Vallainc, D.; Baroli, M.; Figus, A.M.; Pinna, A.; Carboni, S. Effects of on-demand feeding on sea urchin larvae (Paracentrotus lividus: Lamarck, 1816), development, survival and microalgae utilization. Aquac. Res. 2017, 48, 1550–1560. [Google Scholar] [CrossRef]
- Martínez-Pita, I.; Sànchez-Espana, A.I.; García, F.J. Gonadal growth and reproduction in the sea urchin Sphaerechinus granularis (Lamarck 1816) (Echinodermata: Echinoidea) in southern Spain. Sci. Mar. 2008, 72, 603–611. [Google Scholar] [CrossRef]
- Carboni, S.; Kelly, M.S.; Hughes, A.D.; Vignier, J.; Atack, T.; Migaud, H. Evaluation of flow through culture technique for commercial production of sea urchin (Paracentrotus lividus) larvae. Aquac. Res. 2012, 1, 5. [Google Scholar] [CrossRef]
- Castilla-Gavilán, M.; Buzin, F.; Cognie, B.; Dumay, J.; Turpin, V.; Decottignies, P. Optimizing microalgae diets in sea urchin Paracentrotus lividus larviculture to promote aquaculture diversification. Aquaculture 2018, 490, 251–259. [Google Scholar] [CrossRef]
- McEdward, L.R. Morphometric and metabolic analysis of the growth and form of an echinopluteus. J. Exp. Mar. Biol. Ecol. 1984, 82, 259–287. [Google Scholar] [CrossRef]
- Vafidis, D.; Antoniadou, C.; Ioannidi, V. Population density, size structure, and reproductive cycle of the comestible sea urchin Sphaerechinus granularis (Echinodermata: Echinoidea) in the Pagasitikos gulf (Aegean Sea). Animals 2020, 10, 1506. [Google Scholar] [CrossRef] [PubMed]
- Subasinghe, R.P.; Bondad-Reantaso, M.G.; McGladdery, S.E. Aquaculture development, health and wealth. In Aquaculture in the Third Millennium. Technical Proceedings of the Conference on Aquaculture in the Third Millennium, Bangkok, Thailand, 20–25 February 2001; Subasinghe, R.P., Bueno, P., Phillips, M.J., Hough, C., McGladdery, S.E., Arthur, J.R., Eds.; NACA: Bangkok, Thailand; FAO: Rome, Italy, 2001; pp. 167–191. [Google Scholar]
- Guillou, M.; Lumingas, L.J.L. The reproductive cycle of the ‘blunt’ sea urchin. Aquac. Int. 1998, 6, 147–160. [Google Scholar] [CrossRef]
- Boudouresque, C.F.; Verlaque, M. Ecology of Paracentrotus lividus. Dev. Aquac. Fish. Sci. 2007, 37, 243–285. [Google Scholar]
- González-Suárez, D.; Hernández, J.C. Early developmental stages of the sea urchin Sphaerechinus granularis (Lamarck, 1816) (Echinoidea: Toxopneustidae). Mar. Biol. Res. 2022, 18, 266–277. [Google Scholar] [CrossRef]
- Azad, A.K.; Pearce, C.M.; McKinley, R.S. Influence of microalgal species and dietary rations on larval development and survival of the purple sea urchin, Strongylocentrotus purpuratus (Stimpson, 1857). Aquaculture 2011, 322, 210–217. [Google Scholar] [CrossRef]
- McEdward, L.R.; Miner, B.G. Echinoid larval ecology. Dev. Aquac. Fish. Sci. 2007, 37, 71–93. [Google Scholar] [CrossRef]
- Gago, J.; Luís, O.J. Comparison of spawning induction techniques on Paracentrotus lividus (Echinodermata: Echinoidea) broodstock. Aquac. Int. 2011, 19, 181–191. [Google Scholar] [CrossRef]
- Gomes, A.; Lourenço, S.; Santos, P.M.; Raposo, A.; Mendes, S.; Gonçalves, S.C.; Ferreira SM, F.; Pombo, A. Effects of single and mixed-diatom diets on growth condition, and survival of larvae of the sea urchin Paracentrotus lividus (Lamarcj, 1816). Aquac. Int. 2021, 29, 1069–1090. [Google Scholar] [CrossRef]
- Kelly, M.S.; Hunter, A.J.; Scholfield, C.L.; McKenzie, J.D. Morphology and survivorship of larval Psammechinus miliaris (Gmelin) (Echinodermata: Echinoidea) in response to varying food quantity and quality. Aquaculture 2000, 183, 223–240. [Google Scholar] [CrossRef]
- Ferreira, P.M.P. Manual de Cultivo e Bioencapsulação da Cadeia Alimentar Para a Larvicultura de Peixes Marinhos; Instituto Nacional de Recursos Biológicos IP: Lisbon, Portugal, 2009; p. 235. ISBN 978-972-9372-37-7. [Google Scholar]
- Cárcamo, P.F. Massive production of larvae and seed of the sea urchin Loxechinus albus. In Sea Urchins Fisheries and Ecologgy; Lawrence, J.M., Guzmán, O., Eds.; DEStech Publications Inc.: Lancaster, PA, USA, 2004; pp. 299–306. [Google Scholar]
- Jimmy, R.A.; Kelly, M.S.; Beumont, A.R. The effect of diet type and quantity on the development of common sea urchin larvae Echinus esculentus. Aquaculture 2003, 220, 261–275. [Google Scholar] [CrossRef]
- Zar, J.H. Biostatistical Analysis, 5th ed.; Prentice-Hall/Pearson: Upper Saddle River, NJ, USA, 2010. [Google Scholar]
- Guillou, M.; Michel, C. Reproduction and growth of Sphaerechinus granularis (echinodermata: Echinoidea) in southern Brittany. J. Mar. Biol. Assoc. United Kingd. 1993, 73, 179–192. [Google Scholar] [CrossRef]
- Fenaux, L.; Cellario, C.; Etienne, M. Variations in the ingestion rate of algal cells with morphological development of larvae of Paracentrotus lividus (Echinodermata: Echinoidea). Mar. Ecol. Prog. Ser. 1985, 24, 161–165. [Google Scholar] [CrossRef]
Disclaimer/Publisher’s Note: The statements, opinions and data contained in all publications are solely those of the individual author(s) and contributor(s) and not of MDPI and/or the editor(s). MDPI and/or the editor(s) disclaim responsibility for any injury to people or property resulting from any ideas, methods, instructions or products referred to in the content. |
© 2023 by the authors. Licensee MDPI, Basel, Switzerland. This article is an open access article distributed under the terms and conditions of the Creative Commons Attribution (CC BY) license (https://creativecommons.org/licenses/by/4.0/).