Abstract
As a novel type of mineral resource, gas hydrate has received a considerable amount of attention worldwide. This seismic detection method can detect abnormal phenomena such as the BSR, blank zones, velocity anomalies and polarity inversion of gas hydrate and become an important method of gas hydrate detection. The occurrence area of gas hydrate in the South China Sea is usually buried deep beneath the seabed. The current method cannot meet the needs of the shape and structure detection of gas hydrate deposits. With the support of the National Key R&D Program of China, some key technologies have led to developmental breakthroughs, such as ultra-high-energy plasma sources, small-group-interval high-resolution seismic streamers, and distributed three-dimensional seismic acquisition. The seismic profile obtained north of the South China Sea shows that the stratum penetration depth reaches nearly 1000 m at a depth of 1500 m, and the vertical resolution is better than 1.5 m. This system can serve the needs of high-resolution exploration of gas hydrate resources.
1. Introduction
Gas hydrate is considered as a strategic alternative energy source for sustainable human development for the 21st century. At present, more than 30 countries and regions are engaging in the research, investigation and exploration of gas hydrate. More than 230 sites globally have been found recovered or inferred to contain gas hydrates, and 97% of them are distributed in the continental margin of the oceans, with only a few distributed in the continental permafrost regions (Figure 1).
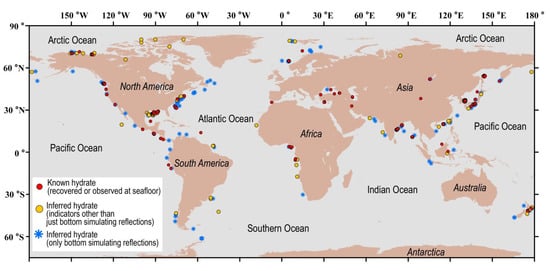
Figure 1.
Global map of recovered and inferred gas hydrates (from the Woods Hole Coastal and Marine Science Center, 2020).
It is difficult to quantify the number of gas hydrate reservoirs in permafrost sediments via conventional seismic techniques due to the almost identical acoustic properties of hydrates and ice. A coupled geophysical–geothermal scheme is developed to predict hydrate saturation in gas-hydrate-bearing permafrost sediments by utilizing their geophysical and geothermal responses [1,2].
On the other hand, owing to its advantages of high efficiency and high precision, marine seismic exploration technology is commonly used in the field of gas hydrate exploration and has great application potential. The United States first discovered the phenomenon of bottom simulating reflection (BSR) through seismic investigation at the Black Submarine Platform in the Gulf of Mexico. Subsequent ocean drilling confirmed the presence of submarine gas hydrate in this area and proved that the seismic investigation method is an effective means to determine the existence of gas hydrate [3,4,5,6,7]. Since then, Canada, Japan, Germany, India, Belgium, Russia and other countries have successively carried out investigations of and research on gas hydrate on the continental margin of Cascadia, Nankai Trough of Japan, the continental margin of India, the Black Sea, Lake Baikal, the Caspian Sea and various other places. Without exception, seismic investigation methods were used in these works, and remarkable results were subsequently obtained [3,4,5,6,7,8,9,10,11,12,13,14,15,16,17,18,19,20,21,22,23,24].
In the early exploration of gas hydrates, the four major seismic anomalies of gas hydrate (i.e., BSR, blank zone, velocity anomaly and polarity reversal) were mainly discovered through two-dimensional seismic detection [25]. With the deepening of exploration, seismic technology has been gradually developed to detect the occurrence and internal structure of gas hydrate ore bodies by 3D exploration to accurately delineate natural gas hydrate ore bodies, estimate their reserves and optimize drilling targets. Therefore, high-resolution 3D seismic exploration has become the main technical means of gas hydrate exploration. In Japan, the Ministry of Finance and the Ministry of Economy, Trade and Industry presided over the exploration and development of gas hydrate in Japan’s sea areas and conducted a large number of high-resolution 3D seismic exploration efforts in the Sea of Japan and Nankai Trough [26,27,28]. The adopted detection system included a pair of tuned air gun arrays; the capacity of a single gun array was 1158 in3, and eight 192-channel seismic streamers were used, with a channel spacing of 12.5 m and a streamer spacing of 100 m. In 2004, the University of Tromsø in Norway, the National Marine Science Center in Southampton in the UK and Kiel University in Germany jointly developed the P-Cable system [29,30]. In 2008, Bangs et al., (2011) carried out high-resolution 3D seismic data acquisition in the Gulf of Mexico using the P-Cable system. In total, ten 30-m long seismic streamers were used for the operation, with a distance of 12.5 m between the streamers, a combination of two Sercel GI guns as the source, and a total capacity of 150 in3. Singhroha et al., (2016) and Kunath et al., (2020) applied the P-Cable system to investigate gas hydrate in the Arctic region and the southwest sea area off Taiwan Island of China. The results show that the P-Cable system has a good bandwidth (20–300 Hz) and can detect gas hydrate and free gas through the seismic quality factor Q. [31,32,33].
Since 1999, China has conducted gas hydrate investigations and research in the Xisha Trough in the South China Sea and the Dongsha Islands, the Shenhu and Qiongdongnan areas, and the Okinawa Trough in the East China Sea. Using seismic detection technology, the China Geological Survey carried out a preliminary experimental investigation of natural gas hydrate in the Xisha Trough area of the South China Sea, made a breakthrough, and found the BSR seismic marker of natural gas hydrate in the China Sea. From 2005 to 2009, the R/V FENDOUSIHAO carried out numerous multichannel seismic acquisitions in the northern South China Sea [34,35,36]. A series of abnormal signs of natural gas hydrate were found in many regions, which preliminarily confirmed the existence of gas hydrate in the China Seas. Its resource prospect is promising [25,37,38,39,40,41,42]. In May 2007, the China Geological Survey drilled physical samples of natural gas hydrate at three stations in the Shenhu area of the South China Sea. In 2017 and 2020, China successfully carried out two rounds of trial production of gas hydrate in the Shenhu area of the South China Sea.
In the early 21st century, China’s gas hydrate seismic survey mainly adopted high-resolution two-dimensional seismic exploration or quasi-3D seismic exploration collected by a single-source and single cable or double-source and single cable. The multichannel seismic system adopted was a single streamer with a trace spacing of 12.5 m and a record number of 192~240 channels. The excitation source was provided from a gun array composed of BOLT or GI guns, with a peak energy bandwidth between 50–120 Hz, and the total capacity of the gun array ranged from hundreds to thousands of cubic inches [43,44,45,46,47].
In 2018, the Shanghai Offshore Petroleum Bureau carried out a high-resolution and high-density 3D seismic survey of three sources and twelve cables in the South China Sea [48,49]. Adopting 12 seismic cables with a length of 5100 m and a distance of 12.5 m and a working mode of alternating excitation of three sources, the acquisition binning reached 6.25 × 12.5 m. Subsequently, the Guangzhou Marine Geological Survey conducted a successful “rake cable” acquisition test with the R/V HAIYANGDIZHIBAHAO in the northern waters of the South China Sea in 2020. Using acquisition methods such as multisource acquisition, the combination of one long cable and multiple short cables, and continuous recording, the seismic acquisition of a 6.25 × 1.5625 m ultrasmall area with a 100 Hz main frequency has been achieved [50].
Equipment and acquisition parameters are summarized in Table 1 for several 3D seismic explorations mentioned previously. Without exception, all seismic explorations used air guns as sources. In this paper, we introduce a new technology for gas hydrate detection by using ultra-high-energy plasma as the source.

Table 1.
Main institutions engaged in the seismic detection of gas hydrate and the technical characteristics of their methods.
2. Methods
With the support of the National 863 Program, Chinese institutes have successively carried out research and development of a series of high-resolution multichannel seismic detection technologies for oil, gas, and gas hydrate detection. Great progress has been made in the evaluation of plasma sources, digital seismic acquisition streamers and multichannel seismic data recording systems. Related instruments and equipment have been successfully developed, and a high-resolution multichannel seismic detection system for shallow strata in shallow water to deep water has been established [51,52,53,54,55,56,57].
The gas hydrate occurrence areas in China are usually in water deeper than 1000 m and deeply buried below the seafloor [37,38,39,40,58]. With the development of more refined gas hydrate exploration, the existing seismic detection methods and means cannot meet the needs of the high-resolution exploration of hydrates and fine descriptions of ore bodies. We developed a set of high-resolution 3D seismic detection equipment, include an ultrahigh-energy plasma source with two transmitting array, two small-group-interval digital seismic streamers and 3D seismic acquisition system. The results showed that it can penetrate the stratum deeper than 500 m with vertical resolutions better than 1.5 m.
2.1. Ultrahigh-Energy Plasma Source
Bubbles generated by a pulsed discharge in water can emit extensive pulsed acoustic waves, which have applications in oceanic high-resolution seismic exploration. However, with the increase in discharge energy, a single electrode will produce a bubble effect. In order to achieve ultra-high-energy discharge, multi-electrode combination is usually used [59,60,61,62,63].
The ultra-high-energy plasma source system adopts a dual-output structure (Figure 2). The system includes two energy modules. Each module has a maximum output of 25,000 J, and bear the same structure. The main circuit adopts the mode of rectification-inverting-boosting-rectification-storage-discharging. Each module is equipped with a set of pulse transmission cables and transmitting electrodes, and the two modules communicate with the source upper controller through optical fibers. The upper controller of the source controls the start–stop and energy level of each module and controls the trigger output of each module through the external trigger input.
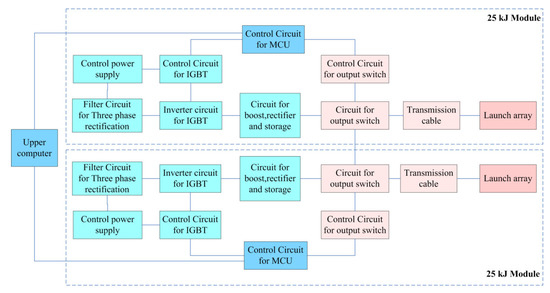
Figure 2.
Structure diagram of the ultra-high-energy plasma source.
The source-transmitting array comprises two sets of independent arrays, each of which has 2080 electrodes. Bipolar electrode discharge technology is adopted to increase the circuit impedance, which can improve the energy efficiency and effectively reduce the loss of the transmitting electrode. To ensure that the quantum shocks can maintain a constant distance during offshore operations, the twin arrays are fixed with a link frame, which can keep the distance between the two subquakes at 3.2 m during operation; a relative GPS (RGPS) device and a battery module are installed above the link frame (Figure 3).
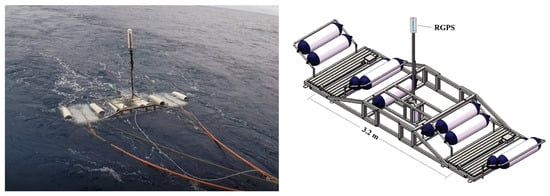
Figure 3.
Plasma source array.
The verified standard hydrophone is used to measure the source wavelet at different sinking depths and different emission energies and calculate the sound source level of the source. The results show that under an emission energy of 25,000 J, the sound source level of the source can reach 240 dB. The frequency is approximately 380 Hz (Figure 4).
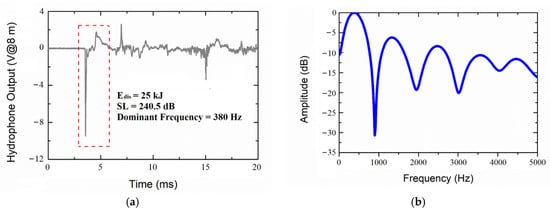
Figure 4.
Results of the source wavelet test. (a) oscillogram of source wavelet; (b) frequency spectrum of source wavelet.
2.2. High-Resolution Seismic Streamer
A small-group-interval high-resolution seismic streamer consists of a leading section, a photoelectric conversion unit, a front elastic section, a data transmission unit, a working section, a rear elastic section, and a trailing transition section.
The leading section is an armored photoelectric composite cable, which transmits commands and signals through optical fibers and supplies power to each part of the cable through electrical wires; the photoelectric conversion unit converts the optical signal commands of the multichannel seismic data acquisition unit into electrical signals and transmits them to the working section. The collected electrical signals are converted into optical signals and transmitted to the streamer controller and the multichannel seismic data acquisition unit; the front elastic section connects the leading section and the working section to reduce the influence of ship vibration on the working section; the data transmission unit is located in the elastic section before the connection segment and between two work sections. The data transmission unit is used to collect the artificial reflection seismic signals collected in the working section and send them to the photoelectric conversion unit; the working section consists of multiple sets of hydrophone combinations and digital acquisition units, each digital acquisition unit controls 4 acquisition channels, and each acquisition channel consists of 4–6 hydrophones connected in series or in parallel. The digital acquisition unit digitizes the artificial reflection seismic signal collected by the hydrophone and sends it to the data transmission unit; the rear elastic section is used to connect the working section and the tail mark. The function is to reduce the influence of tail mark drag vibration and noise on the working section; the front end of the tail mark adapter section is connected with the rear elastic section through a swivel ring, and the rear end is connected with the tail mark. The swivel ring is used to eliminate the influence of the torque generated by the tail mark vibration on the working section.
2.3. Seismic Acquisition System
The seismic acquisition system takes the network switch as the center, including a multichannel data acquisition unit, streamer controller, acquisition control server, quality monitoring server, disk array, plotter and client, to achieve the requirements of massive data transmission, storage, arrangement, real-time monitoring and control, linear hydrophone array geometry and data acquisition.
3. Data Acquisition and Analysis
In 2020, an acquisition experiment was carried out in the northern South China Sea using an ultrahigh-energy plasma source, a small-group-interval high-resolution seismic streamer, and a 3D seismic acquisition system. The test adopted the observation system of dual-source and dual-cable configuration for acquisition (Figure 5). Two 240-channel seismic streamers were used, with a cable spacing of 12.8 m at the depth of 5 m. The two pulse transmitting arrays were alternately excited with 25 kJ of emission energy, the shot interval was 12.5 m, at the depth was 0.5 m. The acquisition binning is 1.6 × 1.5625 m. Table 2 summarizes the acquisition parameters of 3D seismic acquisition experiment.

Figure 5.
Design of the high-resolution 3D seismic detection system.

Table 2.
Acquisition parameters for high-resolution seismic acquisition experiment.
3.1. Detection Depth Analysis
Figure 6 shows the two-way reflection profile obtained in the shallow water area studied. The bottom reflection time T1 = 0.2710 s and the deepest stratum reflection time T2 = 1.55 s are read from Figure 6a. From the velocity map shown in Figure 6b, the seawater velocity at T1 is approximately 1500 m/s, and the average velocity at T2 is 1550 m/s. When the seabed depth is 205 m, the stratum penetration depth is approximately 1347 m.

Figure 6.
Seismic profiles obtained in shallow water north of the South China Sea. (a) Seismic profile; (b) Velocity spectrum.
Figure 7 shows the two-way reflection profile obtained in the deep water area studied. The seabed reflection time T1 = 2.0 s and the deepest stratigraphic reflection time T2 = 2.950 s are read from Figure 7a. From the velocity map shown in Figure 7b, the seawater velocity at T1 is approximately 1495 m/s, and the average velocity at T2 is 1666 m/s. The penetration depth when the bottom depth is 1495 m was calculated to be approximately 962 m.
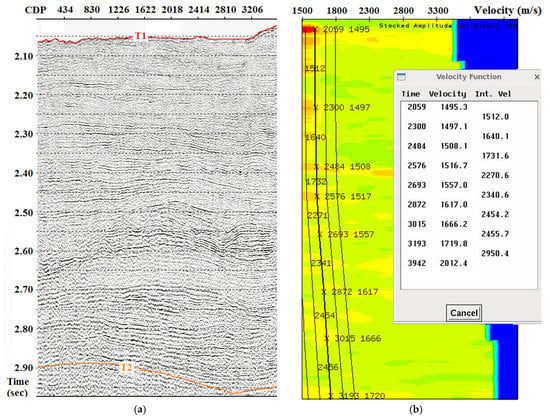
Figure 7.
Seismic profiles obtained in deep water north of the South China Sea (a) Seismic profile; (b) Velocity spectrum.
3.2. Vertical Resolution Analysis
The spectrum scanning analysis was carried out on the seismic profile obtained in the deep water area of the South China Sea. From the spectrum scanning diagram of a single shot (Figure 8), there is almost no effective reflection signal at 0–80 Hz, and there are mainly interference and few reflection signals above 700 Hz. The frequency band of the reflection signal is 80–700 Hz. From the spectrogram of the reflection profile (Figure 9), it can be seen that the effective frequency band is 70–650 Hz and that the main frequency is 100–500 Hz. Taking the center frequency of 300 Hz and the speed of 1600–1800 m/s for calculation, the highest resolution obtained is 1.3–1.5 m.
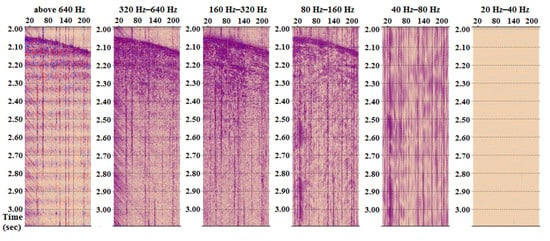
Figure 8.
Spectrum scanning diagram of a single shot.
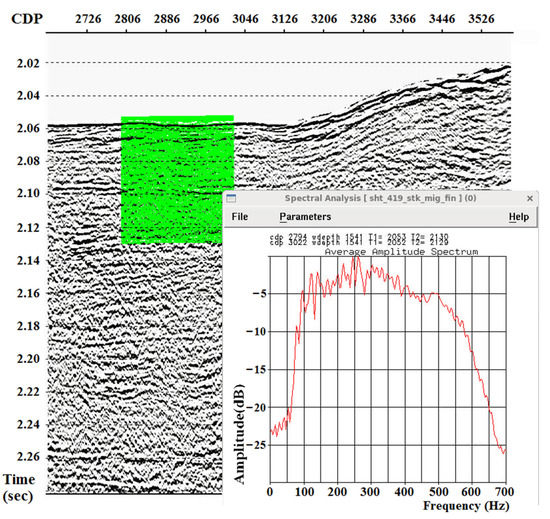
Figure 9.
Reflection profile in deep water and spectrum diagram of shallow strata.
4. Results
After years of accumulative technical improvements, a high-precision 3D seismic detection system for gas hydrate was successfully developed, which includes a 50 kJ ultrahigh-energy plasma source, two high-resolution digital seismic streamers with a group interval of 3.125 m, and a seismic acquisition system. The acquisition test carried out in the northeastern part of the South China Sea shows that this system has obvious advantages in terms of the frequency band range and the minimum acquisition binning. The seismic profile obtained at a water depth of 205 m has a stratum penetration depth approximately 1347 m. The seismic profile obtained at a water depth of 1495 m and has a stratum penetration depth of approximately 962 m. The main frequency of profile is 100–500 Hz and the vertical resolution is better than 1.5 m. The acquisition binning is 1.6 × 1.5625 m.
5. Discussions
Compared with an air gun source, ultrahigh-energy plasma source can provide higher dominant frequency and stratigraphic resolution. If discharged with small energy, the shooting interval of plasma source can measure less than 1 s. Thus, the plasma source can provide higher folds than the air gun source. Furthermore, this approach can provide technical support for the highly targeted exploration and development of gas hydrates and a fine description of ore bodies.
Author Contributions
Conceptualization, B.L. and K.Y.; methodology, C.L. and Q.Z. (Qingxian Zhao); software, X.L. and Z.L.; validation, Y.L., Z.C. and Y.P.; formal analysis, X.L.; investigation and resources, Q.Z. (Qingxian Zhao) and X.L.; writing—original draft preparation, C.L.; writing—review and editing, C.L.; visualization, Q.Z. (Qingjie Zhou). All authors have read and agreed to the published version of the manuscript.
Funding
This work was supported by the Major Scientific and Technological Innovation Project of Shandong Province (No. 2019JZZY010803), the Basic Scientific Fund for National Public Research Institutes of China (2021Q03) and the National Key R&D Program of China (2017YFC0307400).
Institutional Review Board Statement
Not applicable.
Informed Consent Statement
Not applicable.
Data Availability Statement
Not applicable.
Acknowledgments
Data acquisition was supported by cruises R/V “XiangYangHong 01” and R/V “HaiYangDiZhiBaHao”, funded by the National Key R&D Program of China.
Conflicts of Interest
The authors declare no conflict of interest.
References
- Farahani, M.V.; Hassanpouryouzband, A.; Yang, J.; Tohidi, B. Development of a coupled geophysical-geothermal scheme for quantification of hydrates in gas hydrate-bearing permafrost sediments. Phys. Chem. Chem. Phys. PCCP 2021, 23, 24249–24264. [Google Scholar] [CrossRef] [PubMed]
- Farahani, M.V.; Hassanpouryouzband, A.; Yang, J.; Tohidi, B. Insights into the climate-driven evolution of gas hydrate-bearing permafrost sediments: Implications for prediction of environmental impacts and security of energy in cold regions. RSC Adv. 2021, 11, 14334–14346. [Google Scholar] [CrossRef] [PubMed]
- Markl, R.G.; Bryan, G.M.; Ewing, J.I. Structure of the Blake-Bahama outer ridge. J. Geophys. Res. Atmos. 1970, 75, 4539–4555. [Google Scholar] [CrossRef]
- Shipley, T.H.; Houston, M.H.; Buffler, R.T.; Shaub, F.J.; Mcmillen, K.J.; Laod, J.W.; Worzel, J.L. Seismic evidence for widespread possible gas hydrate horizons on continental slopes and rises. AAPG Bull. 1979, 63, 2204–2213. [Google Scholar] [CrossRef]
- Holbrook, W.S.; Hoskins, H.; Wood, W.T.; Stephen, R.A.; Lizarralde, D. Methane hydrate and free gas on the blake ridge from vertical seismic profiling. Science 1996, 273, 1840–1843. [Google Scholar] [CrossRef]
- Hornbach, M.J.; Saffer, D.M.; Holbrook, W.S.; Van Avendonk, H.J.; Gorman, A.R. Three-dimensional seismic imaging of the Blake Ridge methane hydrate province: Evidence for large, concentrated zones of gas hydrate and morphologically driven advection. J. Geophys. Res. 2008, 113, B07101. [Google Scholar] [CrossRef]
- Collett, T.S.; Johnson, A.H.; Knapp, C.C.; Boswell, R. Natural gas hydrates—A review. Brows. Collect. 2009, 89, 146–219. [Google Scholar] [CrossRef]
- Hyndman, R.D.; Spence, G.D. A seismic study of methane hydrate marine bottom simulating reflectors. J. Geophys. Res. 1992, 97, 6683–6698. [Google Scholar] [CrossRef]
- Hobro, J.W.; Minshull, T.A.; Singh, S.C. Tomographic seismic studies of the methane hydrate stability zone in the Cascadia Margin. Geol. Soc. Lond. Spec. Publ. 1998, 137, 133–140. [Google Scholar] [CrossRef]
- Riedel, M. Three-Dimensional Seismic Investigations of Northern Cascadia Marine Gas Hydrates. Ph.D. Thesis, School of Earth and Ocean Science, University of Kiel, Kiel, Germany, 1998. [Google Scholar]
- Kvenvolden, K.A.; Lorenson, T.D. The global occurrence of natural gas hydrate: Natural gas hydrates: Occurrence, distribution, and detection. Am. Geophys. Union 2001, 124, 3–18. [Google Scholar] [CrossRef]
- Riedel, M.; Spence, G.D.; Chapman, N.R.; Hyndman, R.D. Deep-sea gas hydrates on the northern Cascadia margin. Lead. Edge 2001, 20, 87–109. [Google Scholar] [CrossRef]
- Vanneste, M.; De Batist, M.; Golmshtok, A.; Kremlev, A.; Versteeg, W. Multi-frequency seismic study of gas hydrate-bearing sediments in Lake Baikal, Siberia. Mar. Geol. 2001, 172, 1–21. [Google Scholar] [CrossRef]
- Ashi, J.; Tokuyama, H.; Taira, A. Distribution of methane hydrate BSRs and its implication for the prism growth in the Nankai Trough. Mar. Geol. 2002, 187, 177–191. [Google Scholar] [CrossRef]
- Van Rensbergen, P.; De Batist, M.; Klerkx, J.; Hus, R.; Poort, J.; Vanneste, M.; Granin, N.; Khlystov, O.; Krinitsky, P. Sublacustrine mud volcanoes and methane seeps caused by dissociation of gas hydrates in Lake Baikal. Geology 2002, 30, 631–634. [Google Scholar] [CrossRef]
- Zillmer, M.; Flueh, E.R.; Petersen, J. Seismic investigation of a bottom simulating reflector and quantification of gas hydrate in the Black Sea. Geophys. J. R. Astron. Soc. 2005, 161, 662–678. [Google Scholar] [CrossRef]
- Popescu, I.; Lericolais, G.; Panin, N.; De Batist, M.; Gillet, H. Seismic expression of gas and gas hydrates across the western Black Sea. Geo-Mar. Lett. 2007, 27, 173–183. [Google Scholar] [CrossRef]
- Petersen, C.J.; Bünz, S.; Hustoft, S.; Mienert, J.; Klaeschen, D. High-resolution P-Cable 3D seismic imaging of gas chimney structures in gas hydrated sediments of an Arctic sediment drift. Mar. Pet. Geol. 2010, 27, 1981–1994. [Google Scholar] [CrossRef]
- Riedel, M.; Collett, T.S.; Kumar, P.; Sathe, A.V.; Cook, A. Seismic imaging of a fractured gas hydrate system in the Krishna–Godavari Basin offshore India. Mar. Pet. Geol. 2010, 27, 1476–1493. [Google Scholar] [CrossRef]
- Giavarini, C.; Hester, K. Gas Hydrates: Immense Energy Potential and Environmental Challenges; Springer: London, UK, 2011. [Google Scholar]
- Matsumoto, R.; Ryu, B.J.; Lee, S.R.; Lin, S.; Wu, S.; Sain, K.; Pecher, I.; Riedel, M. Occurrence and exploration of gas hydrate in the marginal seas and continental margin of the Asia and Oceania region. Mar. Pet. Geol. 2011, 28, 1751–1767. [Google Scholar] [CrossRef]
- Sain, K.; Gupta, H. Gas hydrates in India: Potential and development. Gondwana Res. 2012, 22, 645–657. [Google Scholar] [CrossRef]
- Mishra, C.K.; Dewangan, P.; Sriram, G.; Kumar, A.; Dakara, G. Spatial distribution of gas hydrate deposits in Krishna-Godavari offshore basin, Bay of Bengal. Mar. Pet. Geol. 2019, 112, 104037. [Google Scholar] [CrossRef]
- Gerivani, H.; Putans, V.A.; Merklin, L.R.; Modarres, M.H. Characteristics of features formed by gas hydrate and free gas in the continental slope and abyssal plain of the Middle Caspian Sea. Mar. Georesour. Geotechnol. 2020, 39, 419–430. [Google Scholar] [CrossRef]
- Zhang, G.; Huang, Y.; Chen, B. Seismology of Gas Hydrate in the Sea; Ocean Press: Beijing, China, 2003. [Google Scholar]
- Nagakubo, S.; Kobayashi, T.; Fujii, T.; Inamori, T. Fusion of 3D seismic exploration and seafloor geochemical survey for methane hydrate exploration. Explor. Geophys. 2007, 38, 37–43. [Google Scholar] [CrossRef]
- Saeki, T.; Hayashi, M.; Furukawa, T.; Inamori, T.; Asakawa, E. 3D seismic velocity structure below mounds and pockmarks in the deep water southwest of the Sado Island. J. Geogr. 2009, 118, 93–110. (In Japanese) [Google Scholar] [CrossRef]
- Otsuka, H.; Morita, S.; Tanahashi, M.; Ashi, J. Foldback reflectors near methane hydrate bottom-simulating reflectors: Indicators of gas distribution from 3D seismic images in the eastern Nankai Trough. Isl. Arc 2015, 24, 145–158. [Google Scholar] [CrossRef]
- Planke, S.; Berndt, C. Apparatus for Seismic Measurements. US7221620, 22 May 2007. [Google Scholar]
- Planke, S.; Eriksen, F.N.; Berndt, C.; Mienert, J.; Masson, D.G. P-cable high-resolution seismic. Oceanography 2009, 22, 85. [Google Scholar] [CrossRef]
- Bangs, N.L.; Hornbach, M.J.; Berndt, C. The mechanics of intermittent methane venting at South Hydrate Ridge inferred from 4D seismic surveying. Earth Planet. Sci. Lett. 2011, 310, 105–112. [Google Scholar] [CrossRef]
- Singhroha, S.; Bünz, S.; Plaza-Faverola, A.; Chand, S. Gas hydrate and free gas detection using seismic quality factor estimates from high-resolution P-cable 3D seismic data. Interpretation 2016, 4, SA39–SA54. [Google Scholar] [CrossRef]
- Kunath, P.; Chi, W.C.; Berndt, C.; Chen, L.; Liu, C.S.; Kläschen, D.; Muff, S. A shallow seabed dynamic gas hydrate system off SW Taiwan: Results from 3-D seismic, thermal, and fluid migration analyses. J. Geophys. Res. Solid Earth 2020, 125, e2019JB019245. [Google Scholar] [CrossRef]
- Wu, Z. Study of source in 3-D seismic and OBS exploration of marine gas hydrate. J. Trop. Oceanogr. 2011, 30, 49–60. [Google Scholar] [CrossRef]
- Sun, Y. Time-frequency signature extraction and recognition of unconsolidated sediments containing gas hydrate and free gas in Shenhu area, northern South China Sea. Prog. Geophys. 2013, 28, 2155–2163. [Google Scholar] [CrossRef]
- Zhang, G.; Xu, H.; Liu, X.; Zhang, M.; Wu, Z.; Liang, J.; Wang, H.; Sha, Z. The acoustic velocity characteristics of sediment with gas hydrate revealed by integrated exploration of 3D seismic and OBS data in Shenhu area. Chin. J. Geophys. 2014, 57, 1169–1176. [Google Scholar] [CrossRef]
- Fu, X.; Yang, M.Z.; Wen, P.F.; Xu, H.N. Seismic data processing and characteristics for gas hydrates in South China Sea. Geol. Sci. Technol. Inf. 2001, 20, 33–36. [Google Scholar]
- Yao, B. The forming condition and distribution characteristics of the gas hydrate in the South China Sea. Mar. Geol. Quat. Geol. 2005, 25, 81–90. [Google Scholar] [CrossRef]
- Wu, B.; Zhang, G.; Zhu, Y.; Lu, Z.; Chen, B. Progress of gas hydrate investigation in China offshore. Earth Sci. Front. 2003, 10, 177–189. [Google Scholar] [CrossRef]
- Wu, S.; Zhang, G.; Huang, Y.; Liang, J.; Wong, H.K. Gas hydrate occurrence on the continental slope of the northern South China Sea. Mar. Pet. Geol. 2005, 22, 403–412. [Google Scholar] [CrossRef]
- Zhang, H.; Zhang, H.; Xu, Z. Gas hydrates in China. Geol. Surv. China 2014, 1, 1–6. [Google Scholar] [CrossRef]
- Liang, J.; Zhang, W.; Lu, J.; Wei, J.; Kuang, Z.; He, Y. Geological occurrence and accumulation mechanism of natural gas hydrates in the eastern Qiongdongnan Basin of the South China Sea: Insights from site GMGS5-W9-2018. Mar. Geol. 2019, 418, 106042. [Google Scholar] [CrossRef]
- Zhao, Q. The Investigation of Exploration Technology about Gas-Hydrate Semi-Three Dimension Datum; Jilin University: Changchun, China, 2009. [Google Scholar]
- Xu, H.; Shu, H.; Li, L.; Zhang, M.; Zhang, G. 3-D seismic data processing technique for gas hydrate by single-source and single-cable acquisition method. Prog. Geophys. 2009, 24, 1801–1806. [Google Scholar] [CrossRef]
- Zhang, X.; Wen, P.; Xu, Y.; Zhang, B. Footprint analysis and suppress processing of dual-source and single cable 3D seismic data for gas hydrate. Mar. Geol. Front. 2015, 31, 55–61. [Google Scholar] [CrossRef]
- Li, L.; Liu, H.; Zhang, X.; Lei, X.; Sha, Z. BSRs, estimated heat flow, hydrate-related gas volume and their implications for methane seepage and gas hydrate in the Dongsha region, northern South China Sea. Mar. Pet. Geol. 2015, 67, 785–794. [Google Scholar] [CrossRef]
- Zhang, W.; Liang, J.; Wei, J.; Lu, J.; Su, P.; Lin, L.; Huang, W.; Guo, Y.; Deng, W.; Yang, X.; et al. Geological and geophysical features of and controls on occurrence and accumulation of gas hydrates in the first offshore gas-hydrate production test region in the shenhu area, northern south china sea. Mar. Pet. Geol. 2020, 114, 104191. [Google Scholar] [CrossRef]
- Li, B.; Gu, Y.; Huang, F.; Feng, Q. Application of three-source and Multi-cable high-density seismic acquisition for gas hydrate in offshore China. Offshore Oil. 2021, 41, 1–7. [Google Scholar] [CrossRef]
- Yang, P.; Li, B.; Shao, W.; Gu, Y.; Huang, F.; Wang, W. The key technique of 3D seismic processing for gas hydrate. Offshore Oil 2021, 41, 1–7. [Google Scholar] [CrossRef]
- Wen, P.; Liu, B.; Xu, Y.; Xue, H.; Yang, Z.; Li, Y.; Meng, D.; Lu, Y. A novel seismic exploration technique targeting fine characterization of marine gas hydrates: Rake-like seismic exploration. Prog. Geophys. 2020, 36, 2215–2221. [Google Scholar] [CrossRef]
- Pei, Y.; Wang, K.; Yan, K. Study of deep-sea high-resolution multi-channel seismic exploring system. Adv. Mar. Sci. 2010, 28, 244–249. [Google Scholar] [CrossRef]
- Wang, K.; Huang, Y.; Lian, Y.; Zhang, X. Technology and Application of High-Resolution Multi-Channel Seismic Detection in Shallow Water; Ocean Press: Beijing, China, 2011. [Google Scholar]
- Yan, H.; Huang, Y.; Pei, Y.; Liu, Z.; Wang, K.; Liu, B.; Yan, K. Plasma seismic source and its application in oceanic seismic exploration. High Volt. Eng. 2012, 38, 1711–1718. [Google Scholar] [CrossRef]
- Lei, X. Study of Key Technologies of High-Precision Marine Multichannel Seismic Survey; Ocean University of China: Qingdao, China, 2012. [Google Scholar]
- Pei, Y.; Liu, B.; Lian, Y.; Liu, C.; Xie, Q. Marine high resolution multi-channel digital seismic streamer and its application in the ocean engineering. Prog. Geophys. 2013, 28, 3280–3286. [Google Scholar] [CrossRef]
- Hao, X.; Zhao, Q.; Pei, Y. Large-energy plasma source for gas hydrate exploration. J. Trop. Oceanogr. 2017, 36, 35–40. [Google Scholar] [CrossRef]
- Liu, Z.; Guan, X.; Zhang, L.; Zhang, Y.; Pei, Y.; Liu, C.; Zhou, H.; Liu, B.; Yan, K. Investigations of dynamics of a single spark-induced bubble in saline water. J. Phys. D Appl. Phys. 2021, 54, 075203. [Google Scholar] [CrossRef]
- Xu, H.; Yang, S.; Zheng, X.; Wang, M.; Wang, J. Seismic identification of gas hydrate and its distribution in Shenhu area, South China Sea. Chin. J. Geophys. 2010, 53, 1691–1698. [Google Scholar] [CrossRef]
- Parkinson, R. High Resolution Site Surveys; CRC Press: London, UK, 2000. [Google Scholar]
- Huang, Y.; Zhang, L.; Zhang, X.; Liu, Z.; Yan, K. The plasma-containing bubble behavior under pulsed discharge of different polarities. IEEE Trans. Plasma Sci. 2014, 43, 567–571. [Google Scholar] [CrossRef]
- Huang, Y.; Zhang, L.; Yan, H.; Zhu, X.; Liu, Z.; Yan, K. Experimental study of the electric pulse-width effect on the acoustic pulse of a plasma sparker. IEEE J. Ocean. Eng. 2016, 41, 724–730. [Google Scholar] [CrossRef]
- Pei, Y.; Zhang, L.; Huang, Y.; Yan, H.; Zhu, X.; Liu, Z.; Yan, K.P. Discharge electrode configuration effects on the performance of a plasma sparker. Plasma Sci. Technol. 2017, 19, 095401. [Google Scholar] [CrossRef]
- Pei, Y.; Kan, G.; Zhang, L.; Huang, Y.; Liu, Z.; Liu, B.; Yan, K. Characteristics of source wavelets generated by two sparkers. J. Appl. Geophys. 2019, 170, 103819. [Google Scholar] [CrossRef]
Disclaimer/Publisher’s Note: The statements, opinions and data contained in all publications are solely those of the individual author(s) and contributor(s) and not of MDPI and/or the editor(s). MDPI and/or the editor(s) disclaim responsibility for any injury to people or property resulting from any ideas, methods, instructions or products referred to in the content. |
© 2022 by the authors. Licensee MDPI, Basel, Switzerland. This article is an open access article distributed under the terms and conditions of the Creative Commons Attribution (CC BY) license (https://creativecommons.org/licenses/by/4.0/).