
Composite Springs for Mooring Tensioners: A Systematic Review of Material Selection, Fatigue Performance, Manufacturing, and Applications

 ,
,  , ,
, ,  and
and
Abstract
1. Introduction
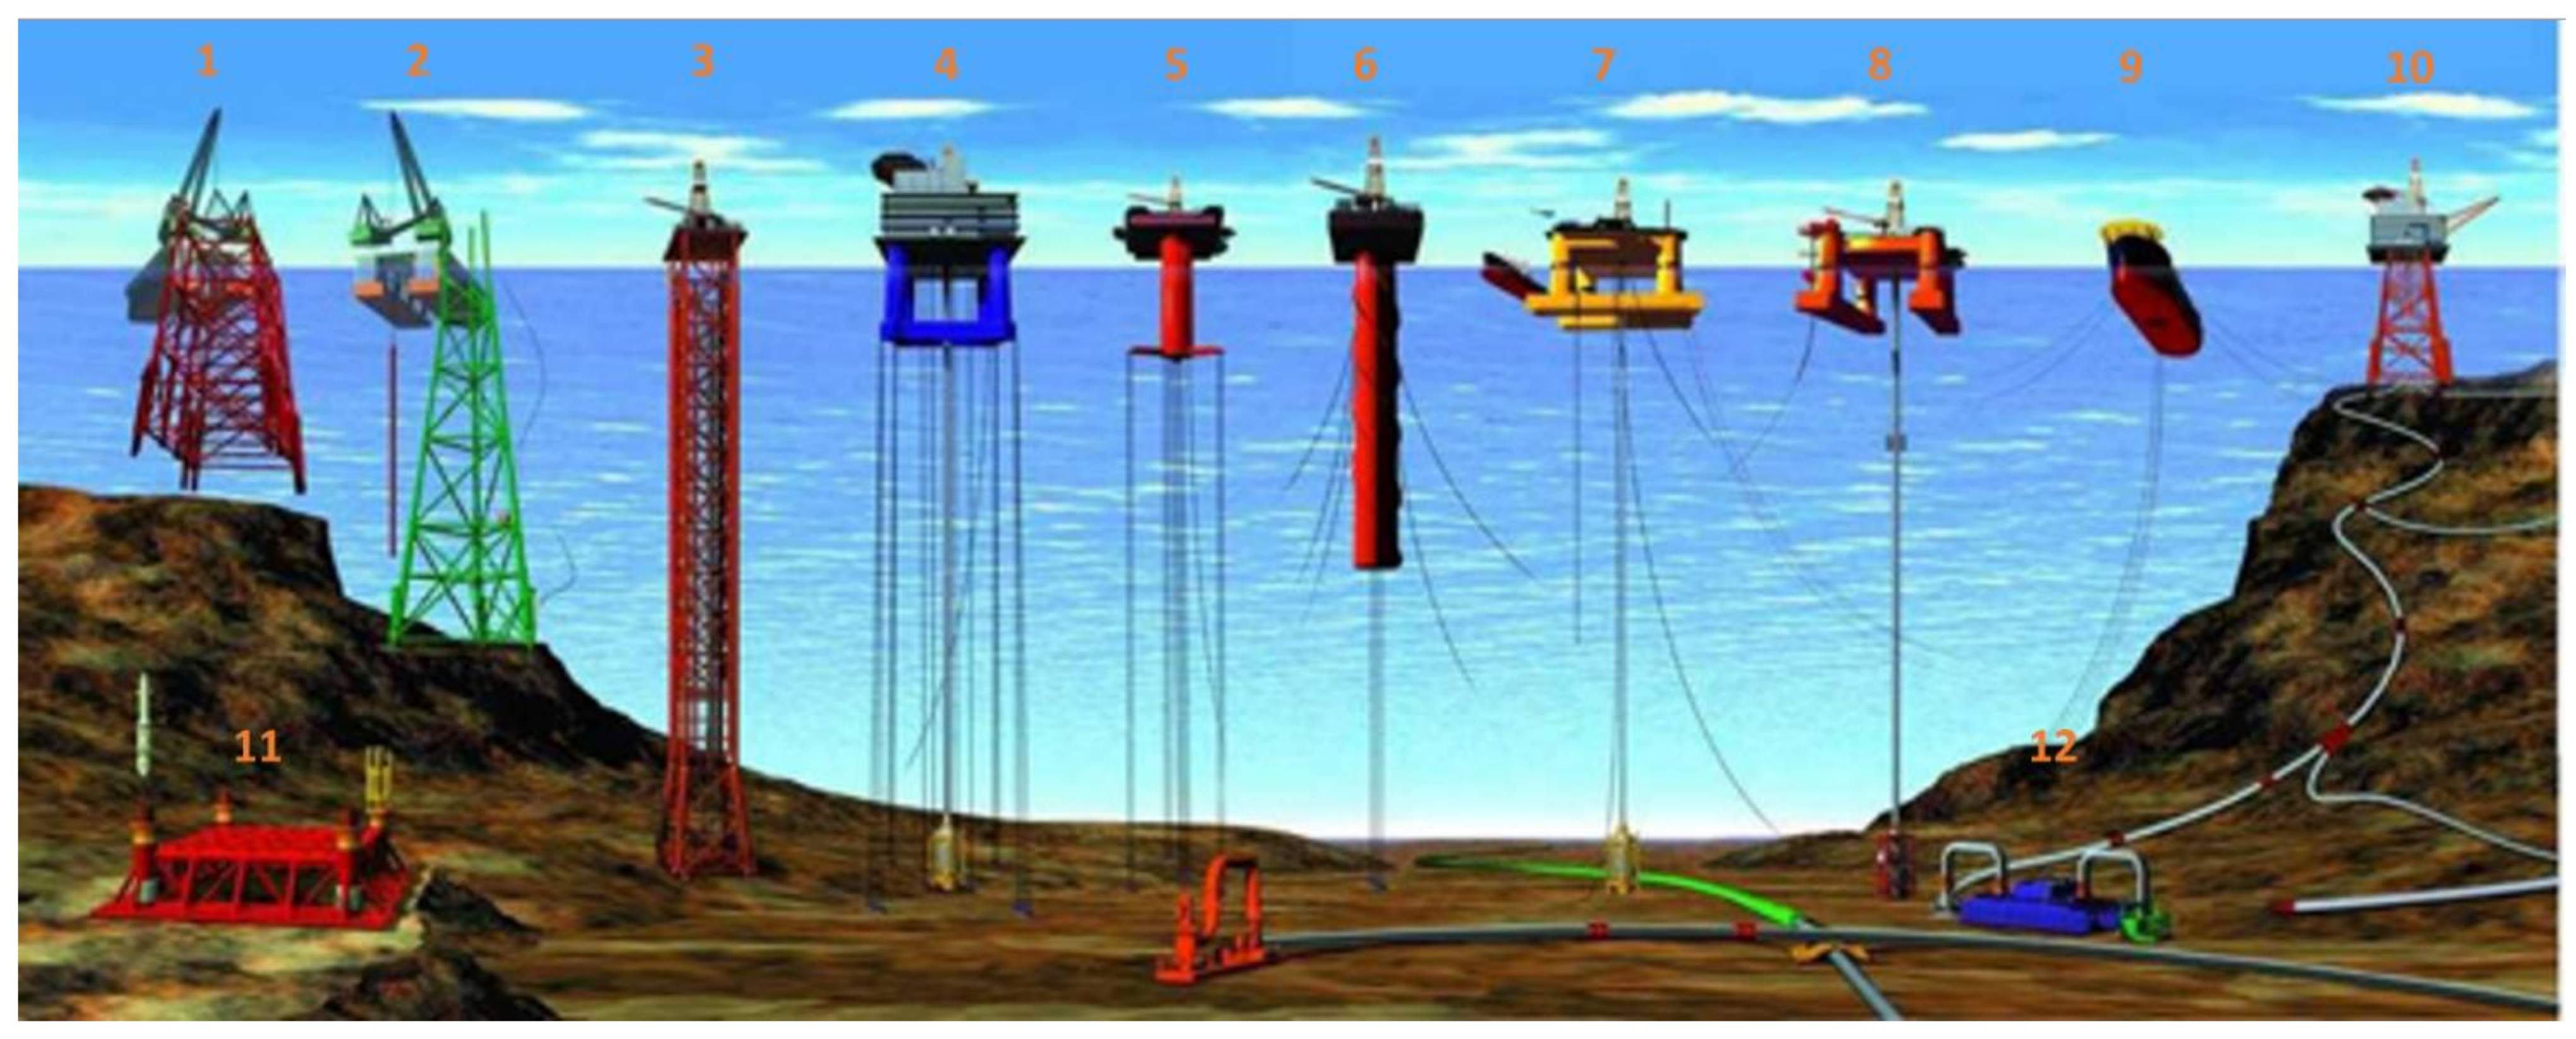
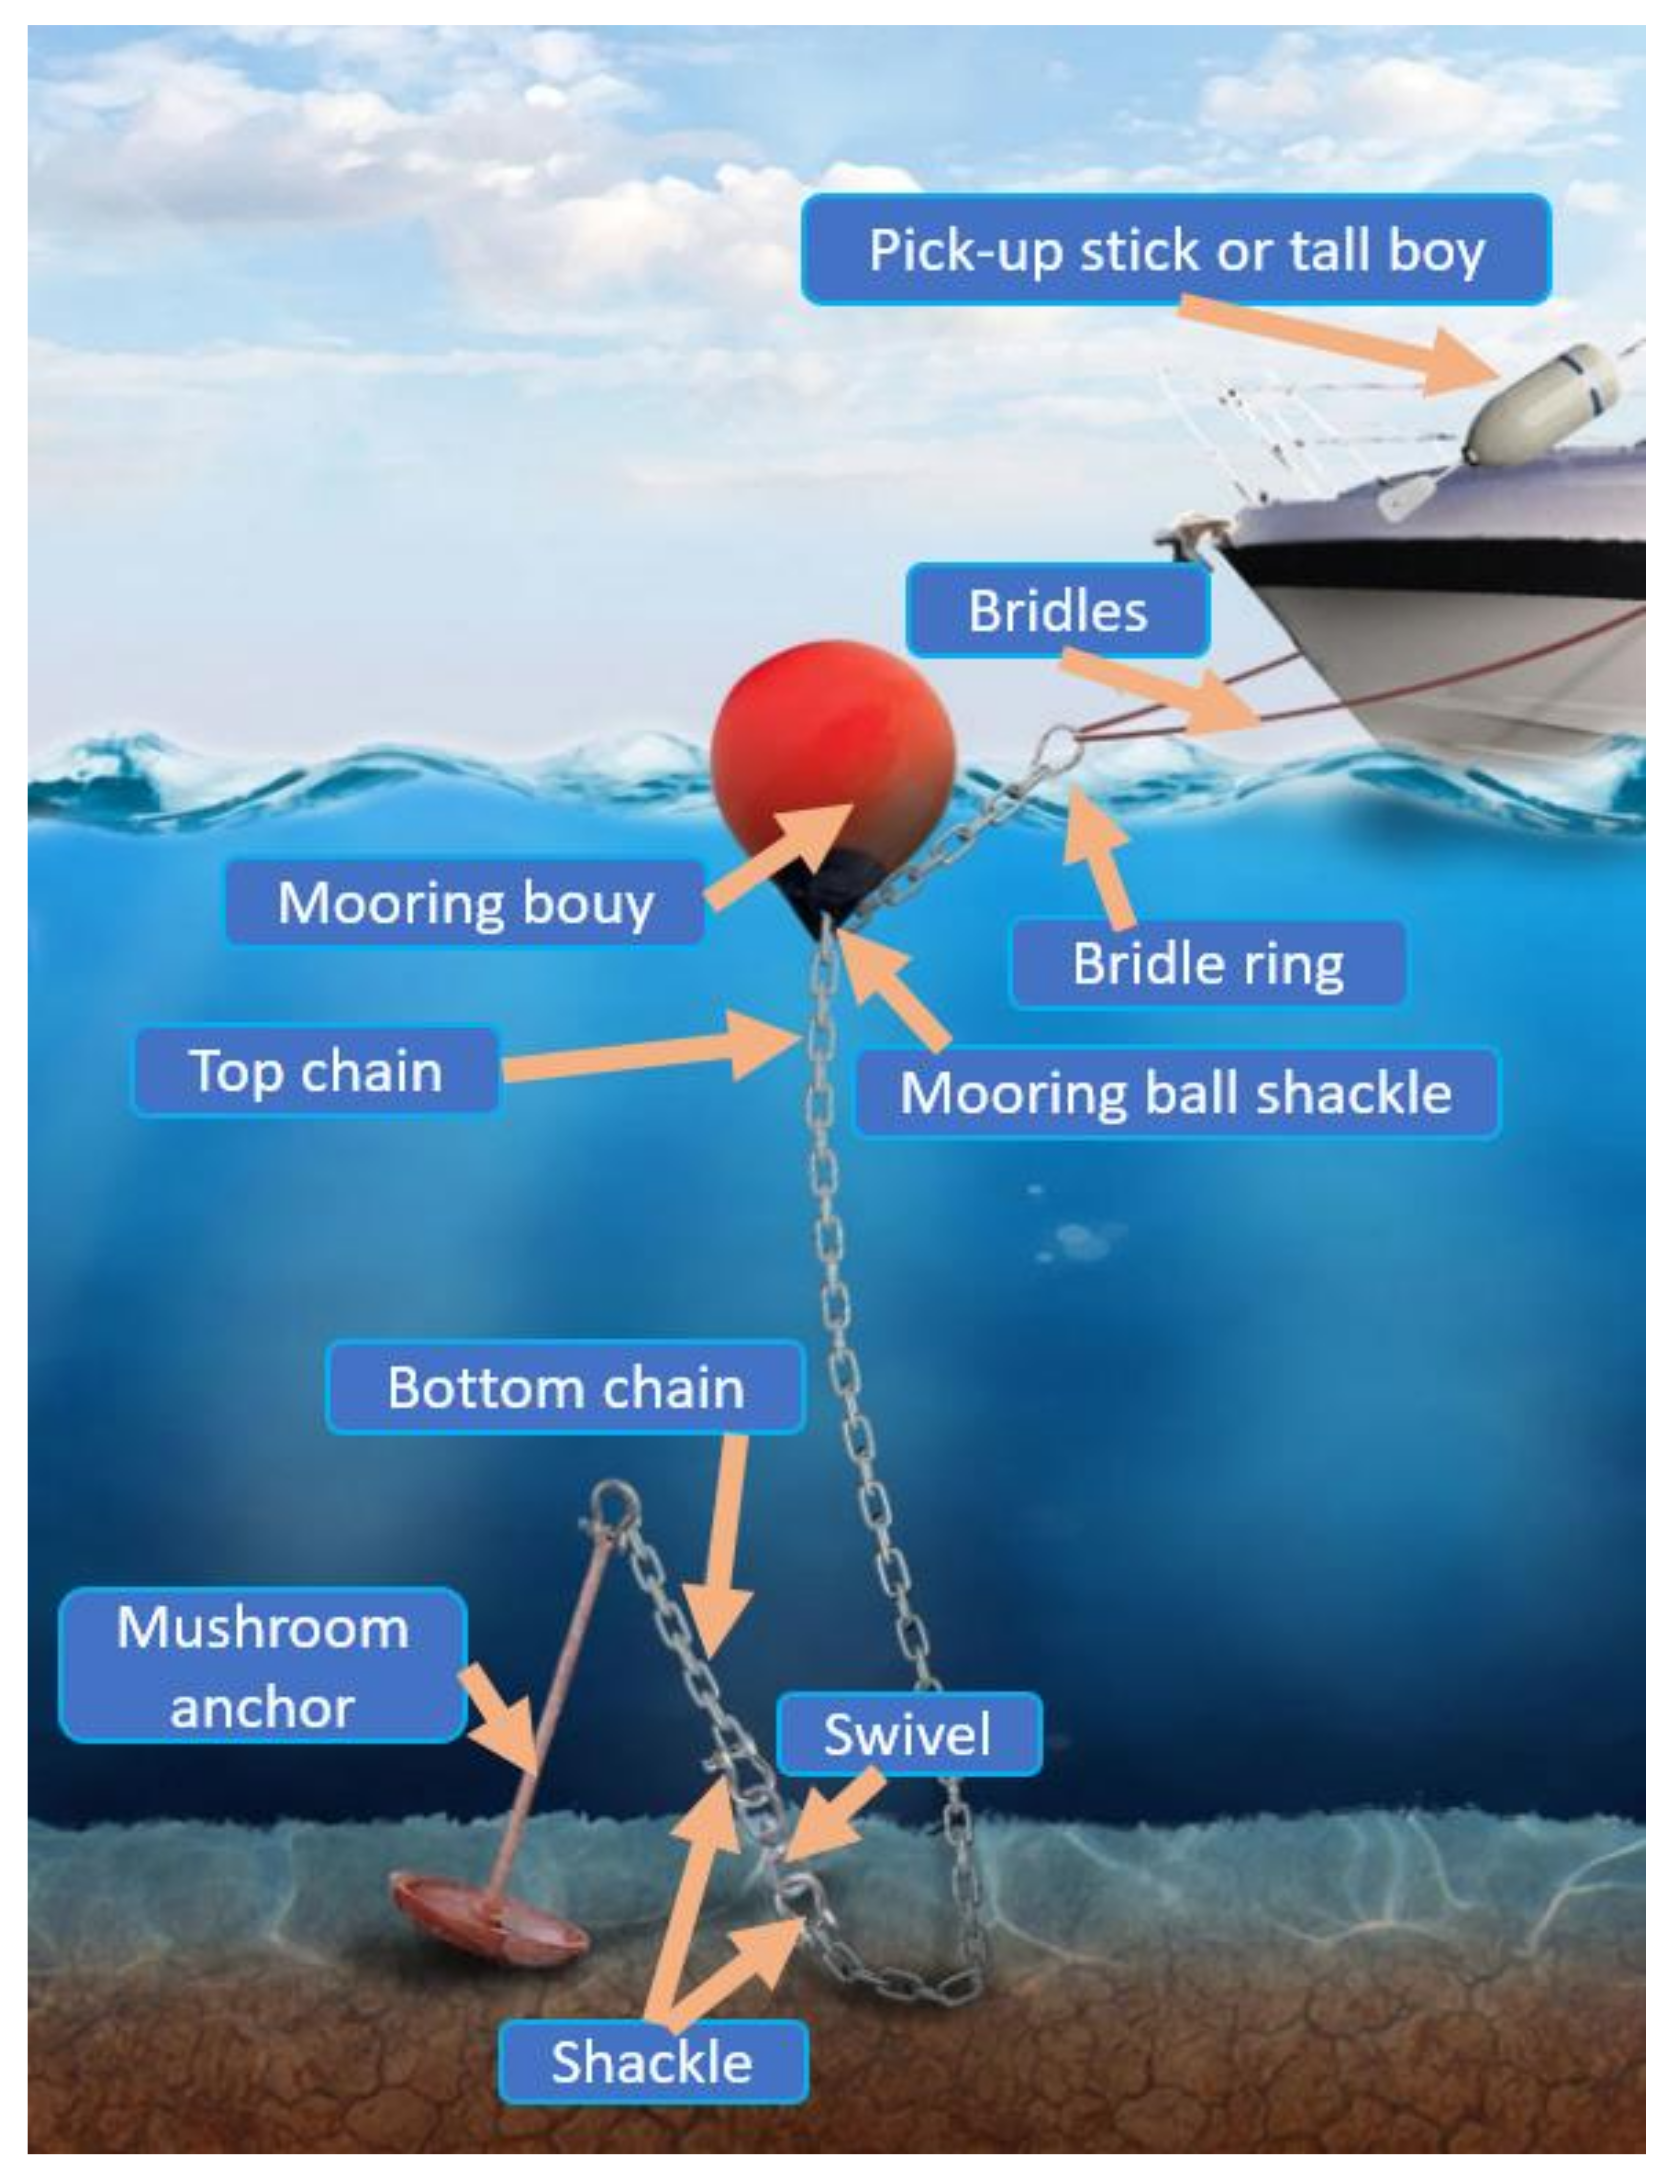
2. Mooring Systems and Mechanical Mooring Tensioners
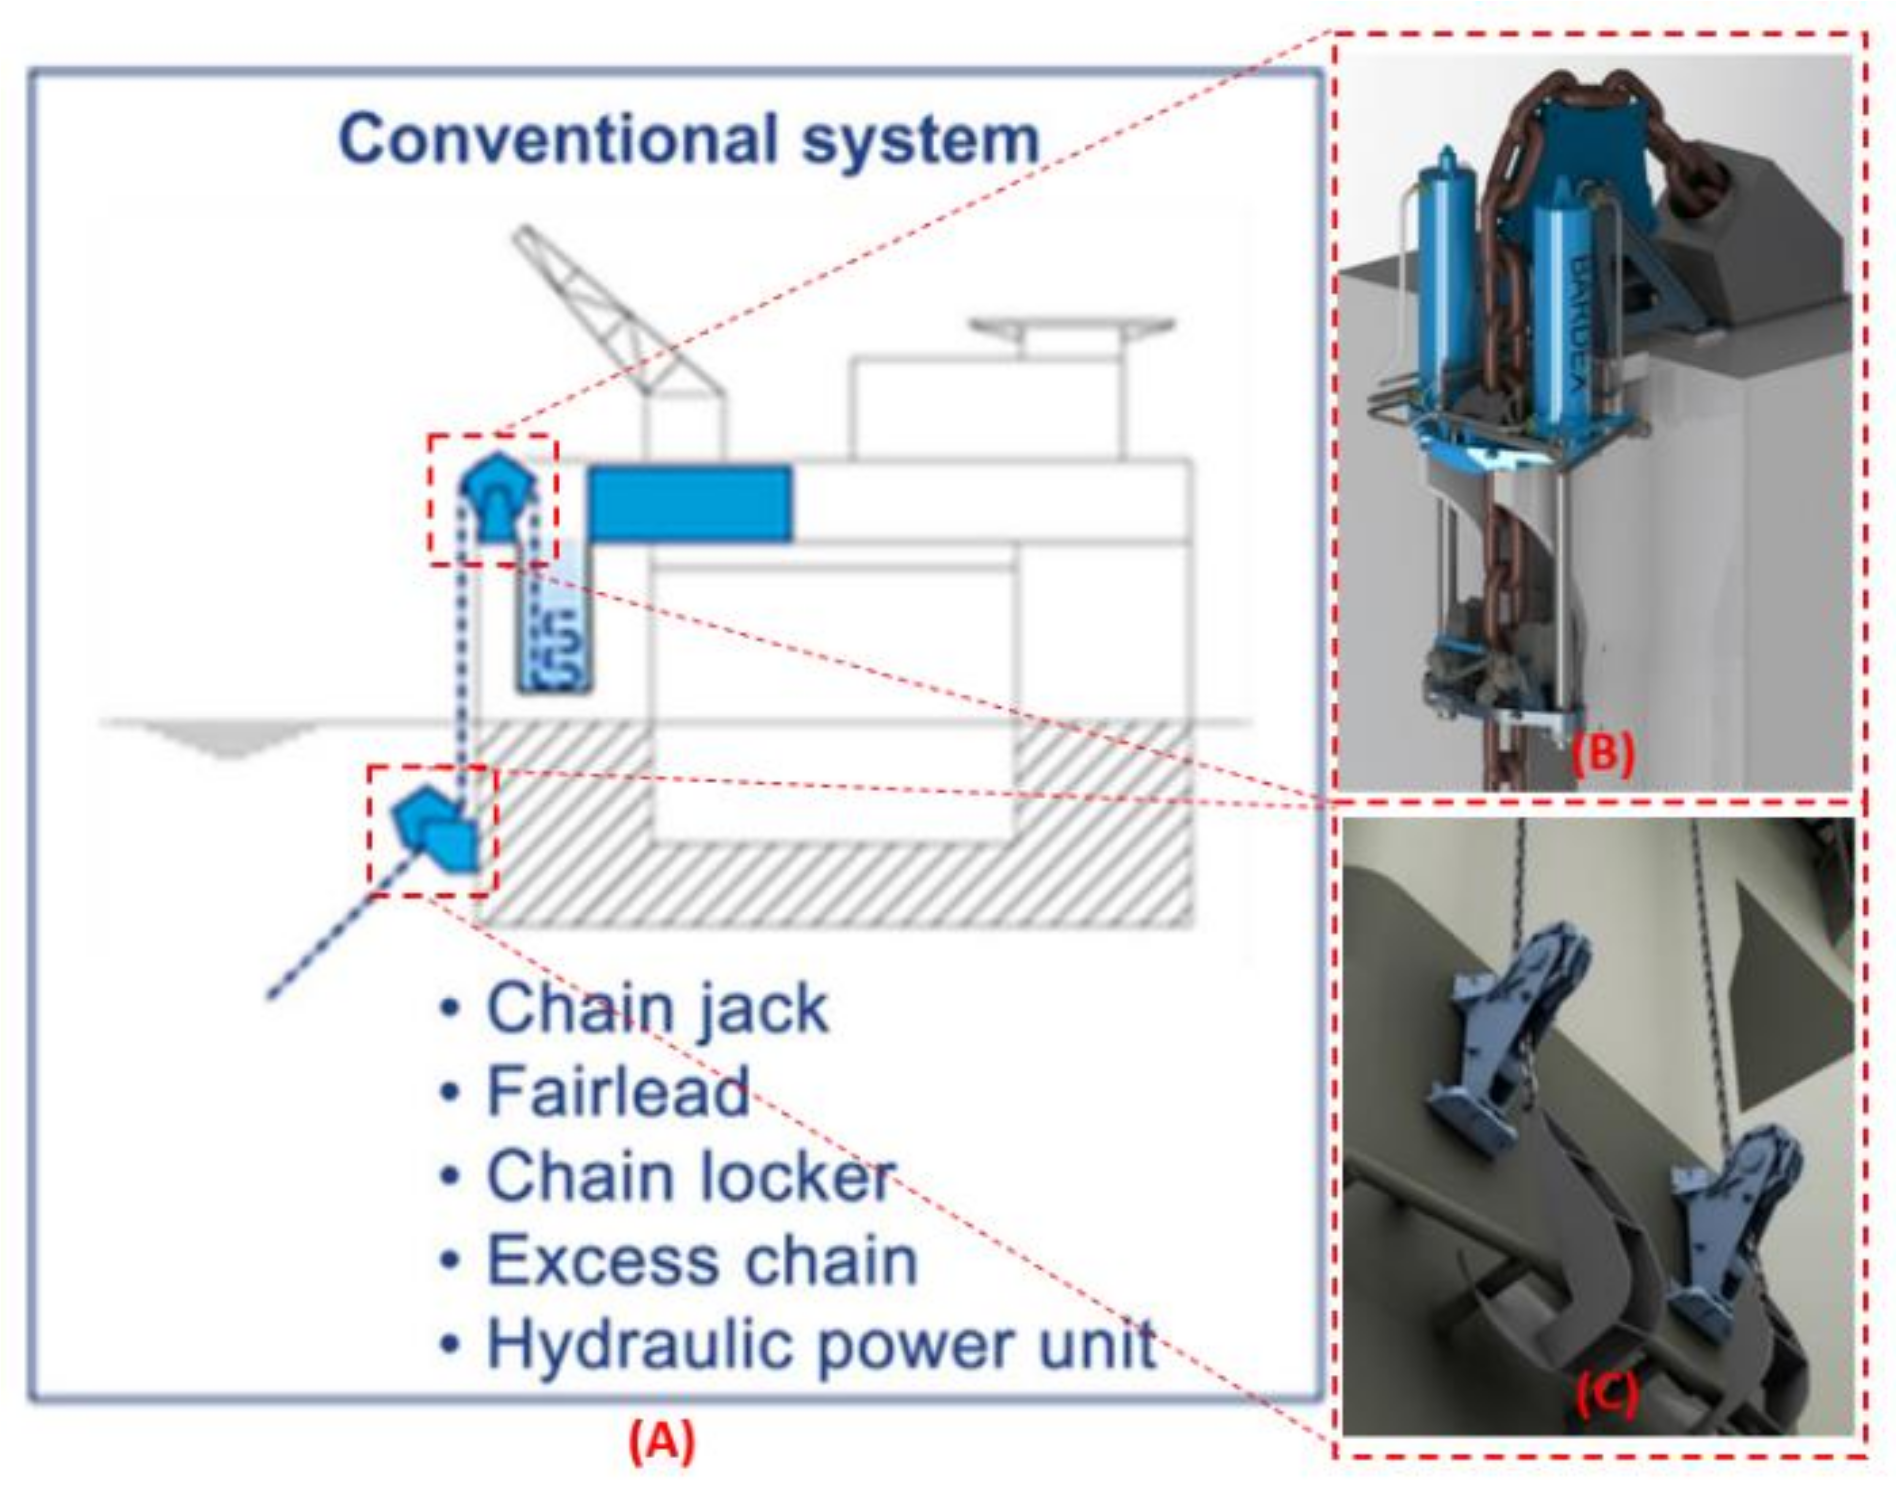
2.1. Current Configuration of Mooring Tensioners
2.2. Failures of Current Mooring Systems
- Manufacturing defects: the strength of the manufactured component is lower than the designed value, which can cause failures.
- Wear and corrosion: steel catenary chains experience wear and corrosion at different rates in different water conditions. Corrosion caused by sulfate-reducing bacteria (SRB) and the interlink wear of steel chains can accelerate the corrosion and wear rate by up to 10 times [12].
- Fatigue loading: interlink rotation is inhibited by the friction and yielding between the links of chains because the frictional forces are proportional to the applied tension force. As a result of this friction, out-of-plane bending fatigue has caused failures such as the taut-moored CALM buoy in West Africa [13].
- Installation damage: the designed installation procedures have not been strictly followed, which causes twists and the wear of mooring lines during installation.
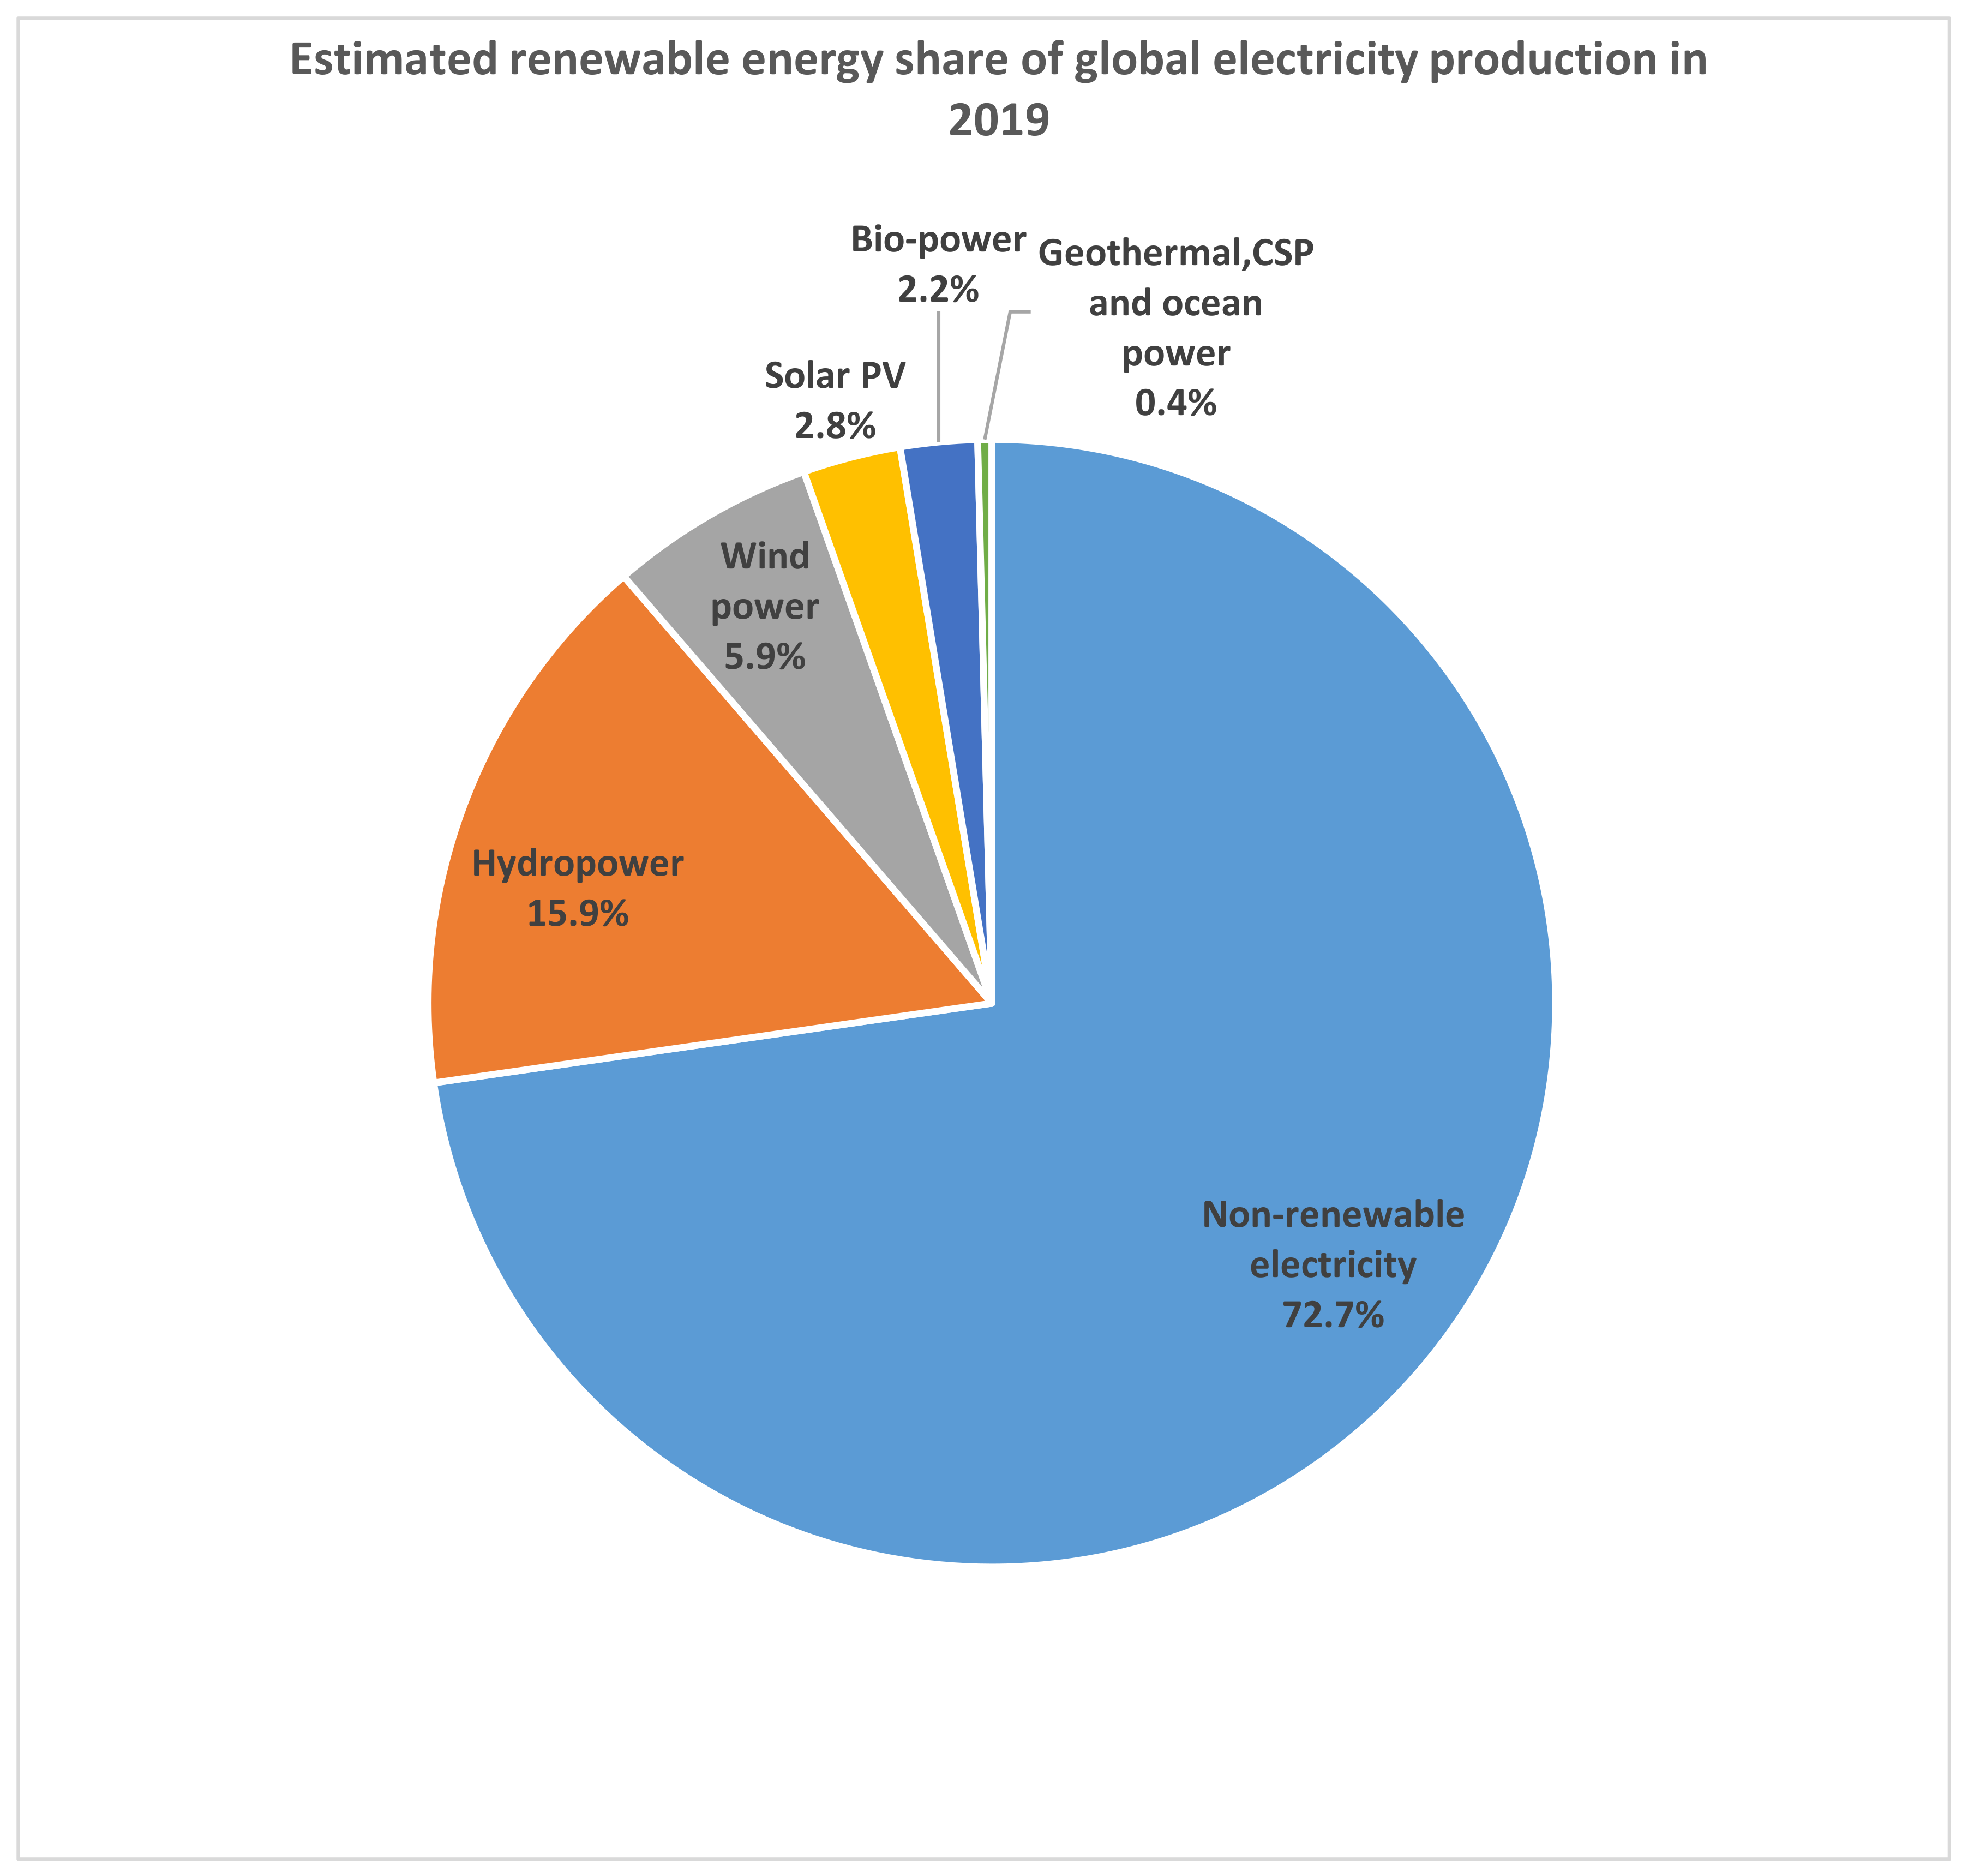
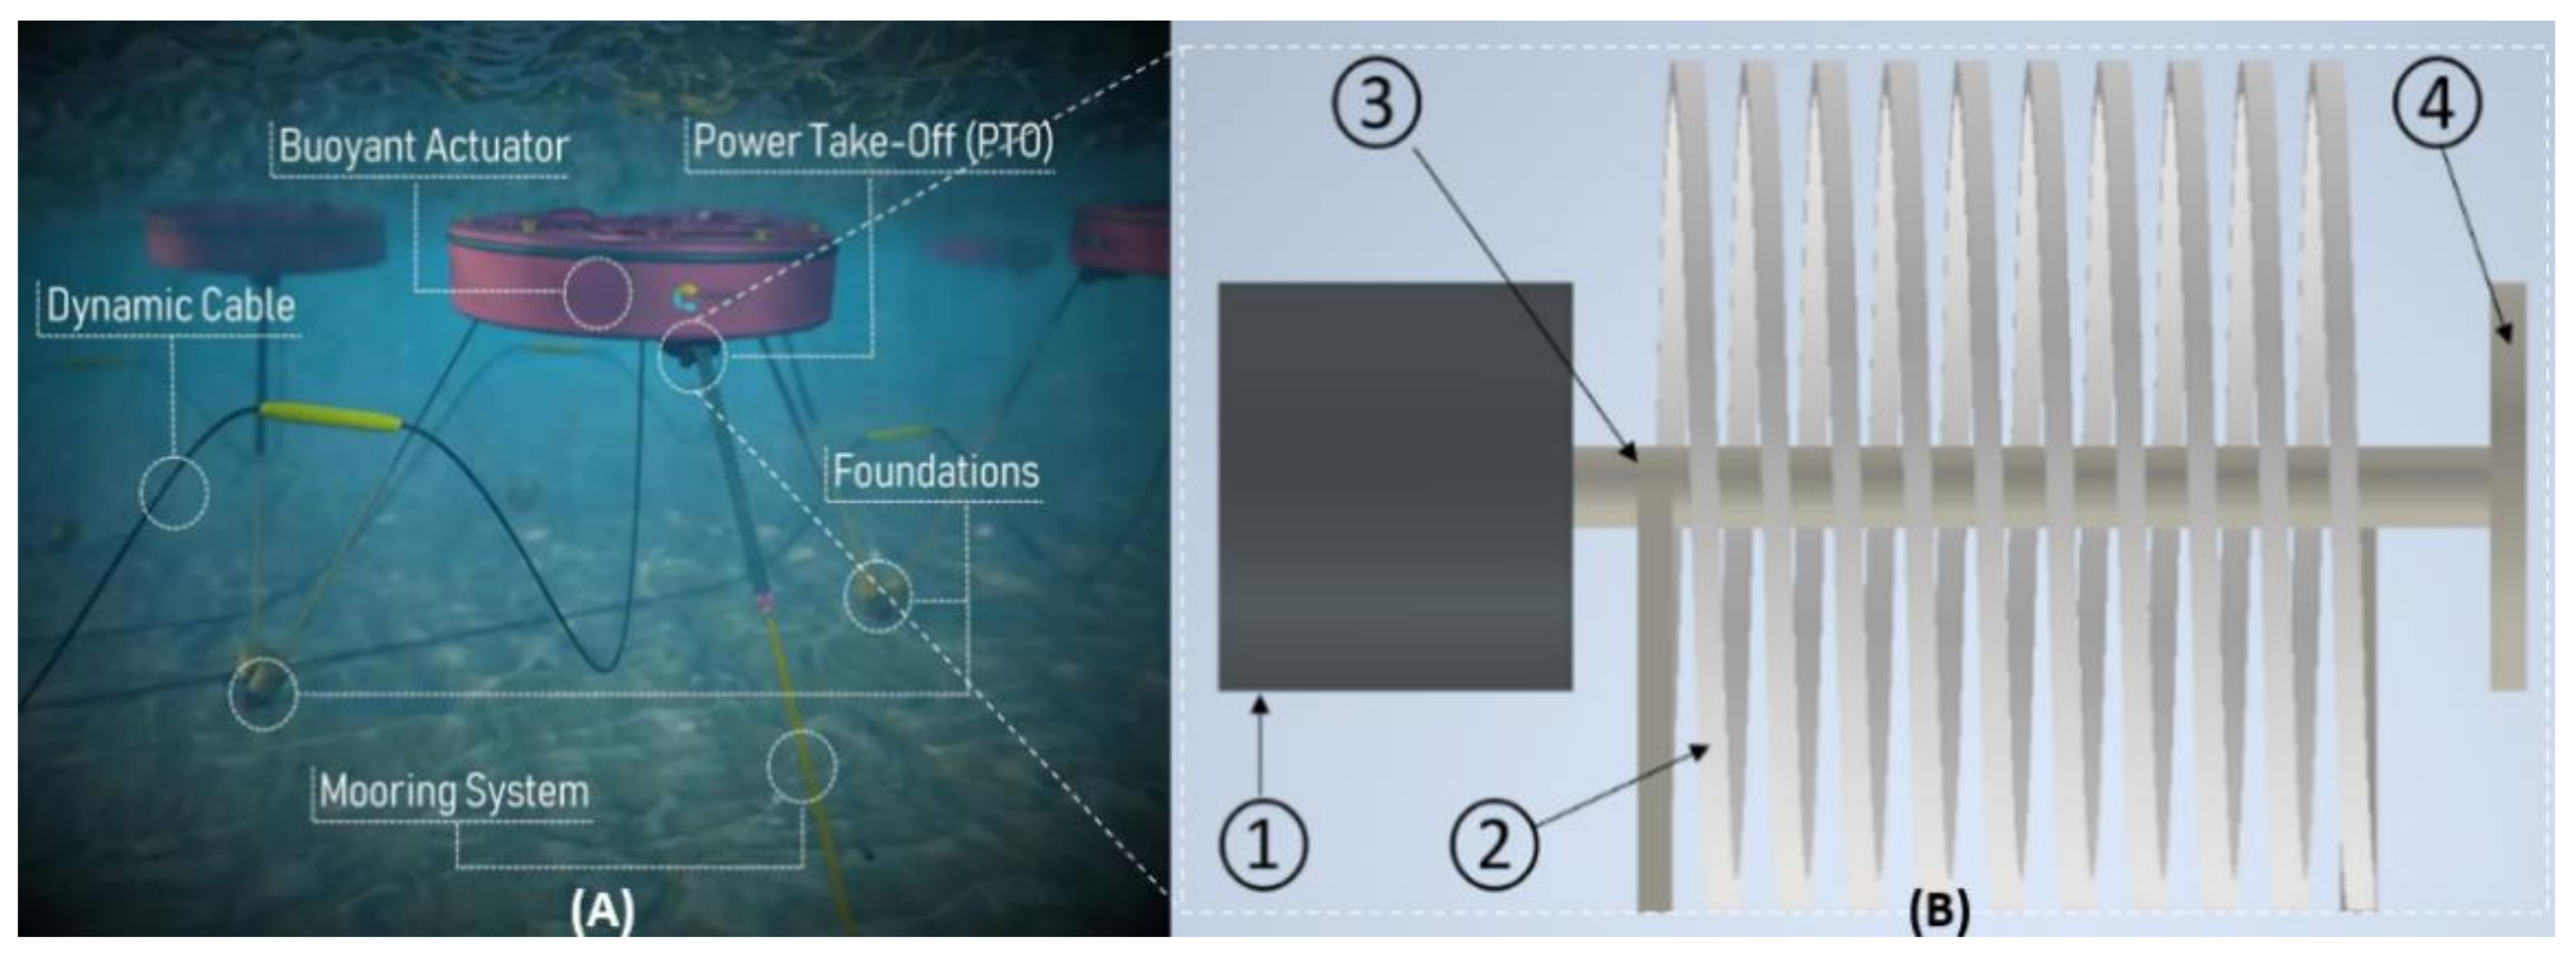
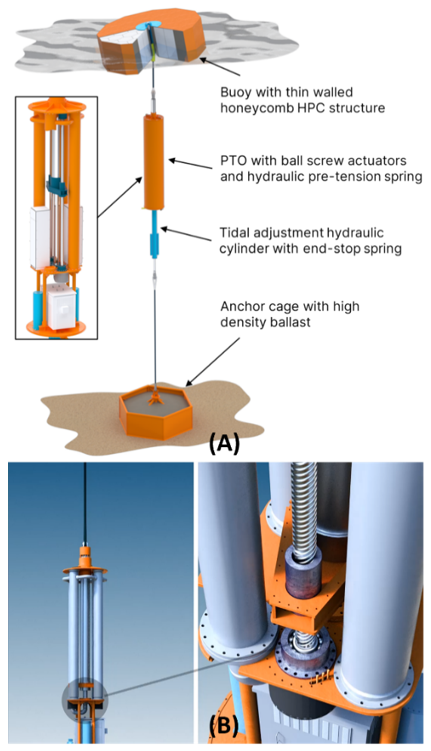
2.3. Mooring System of Wave Energy Converters


2.4. Potential Innovation of Mooring Systems
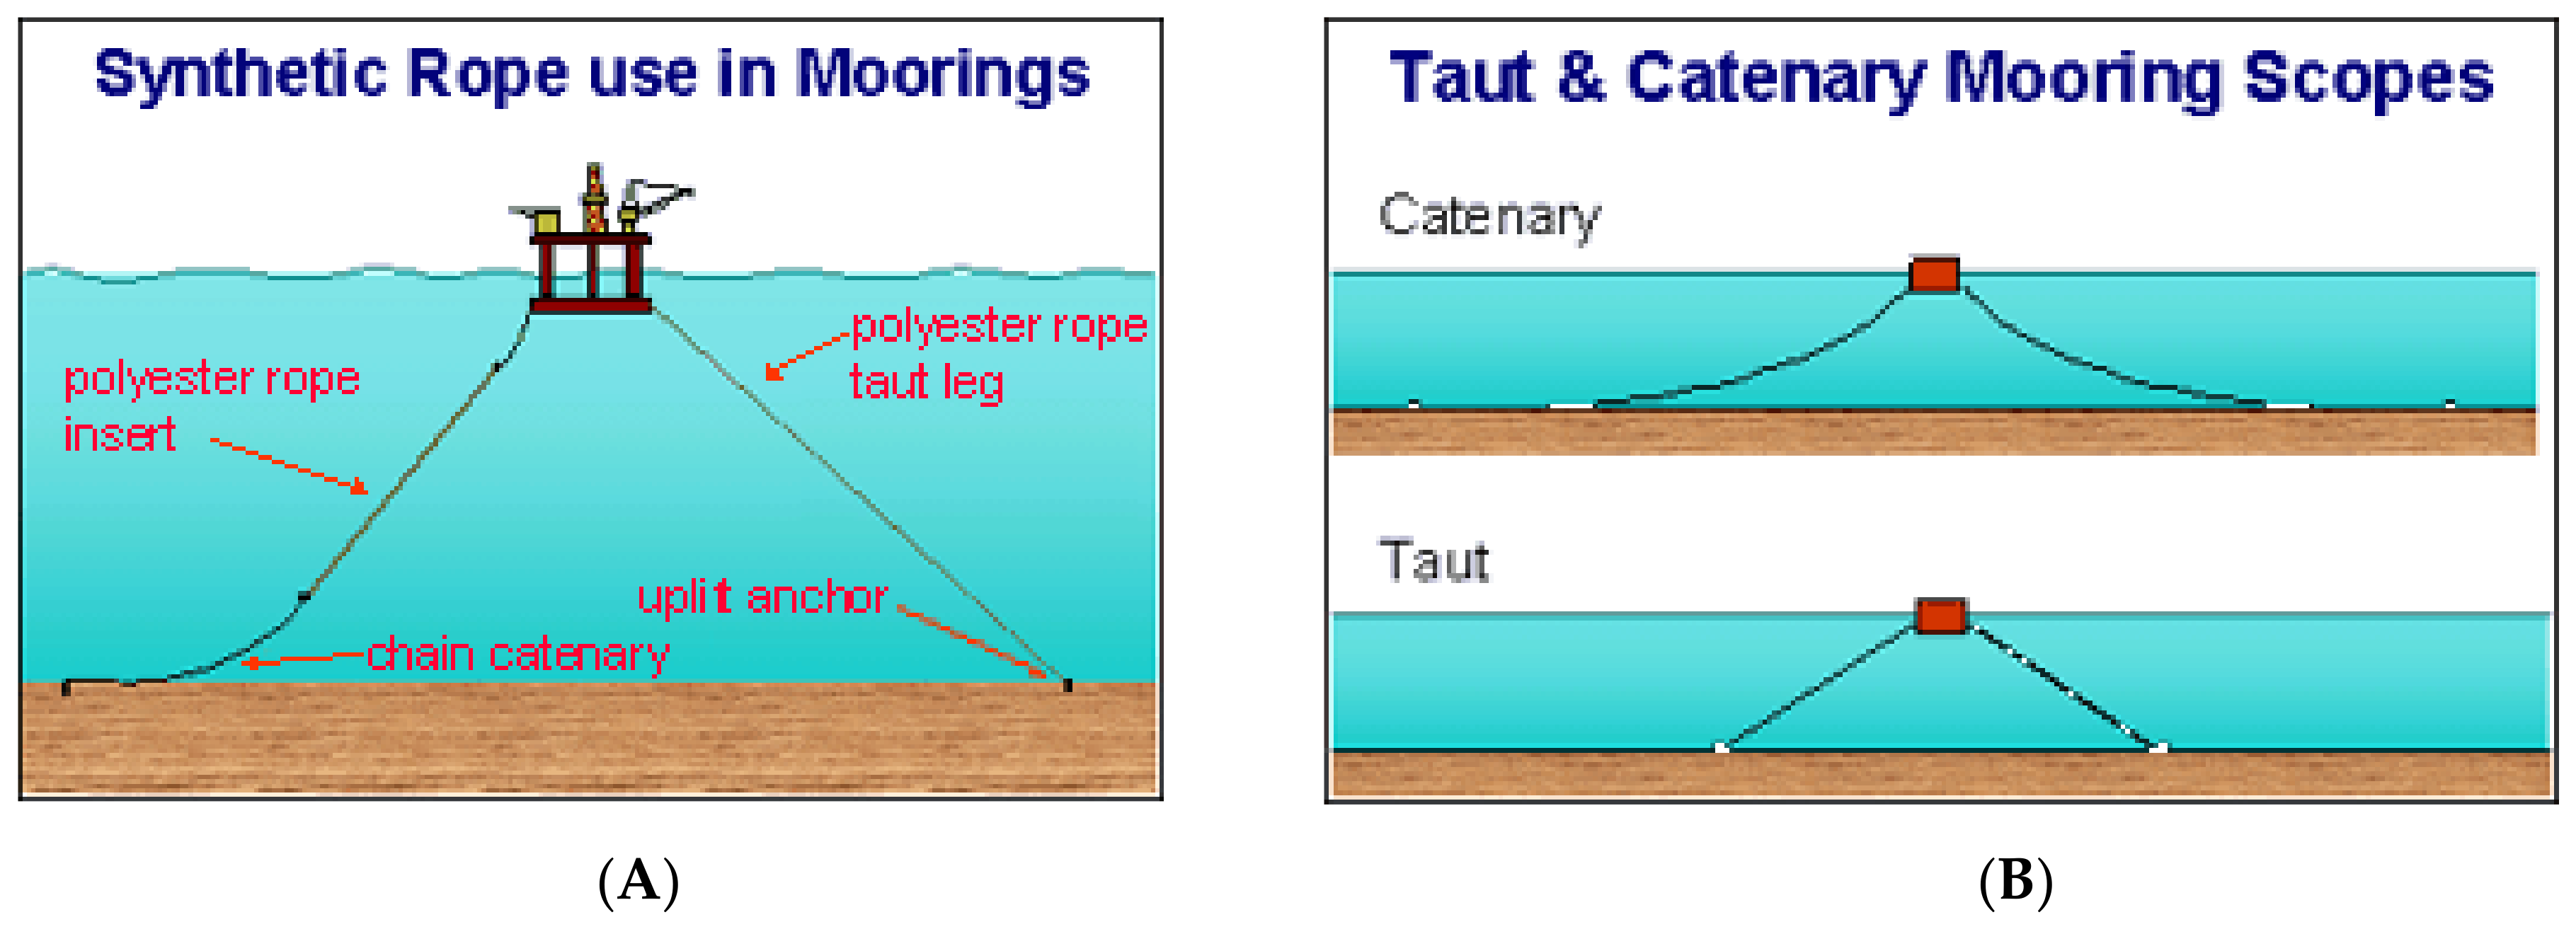
- The taut-leg mooring system requires adequate elasticity to absorb energy generated by the motion of the float caused by waves.
- The current taut-leg mooring systems can only be implemented at locations with low wave energy.

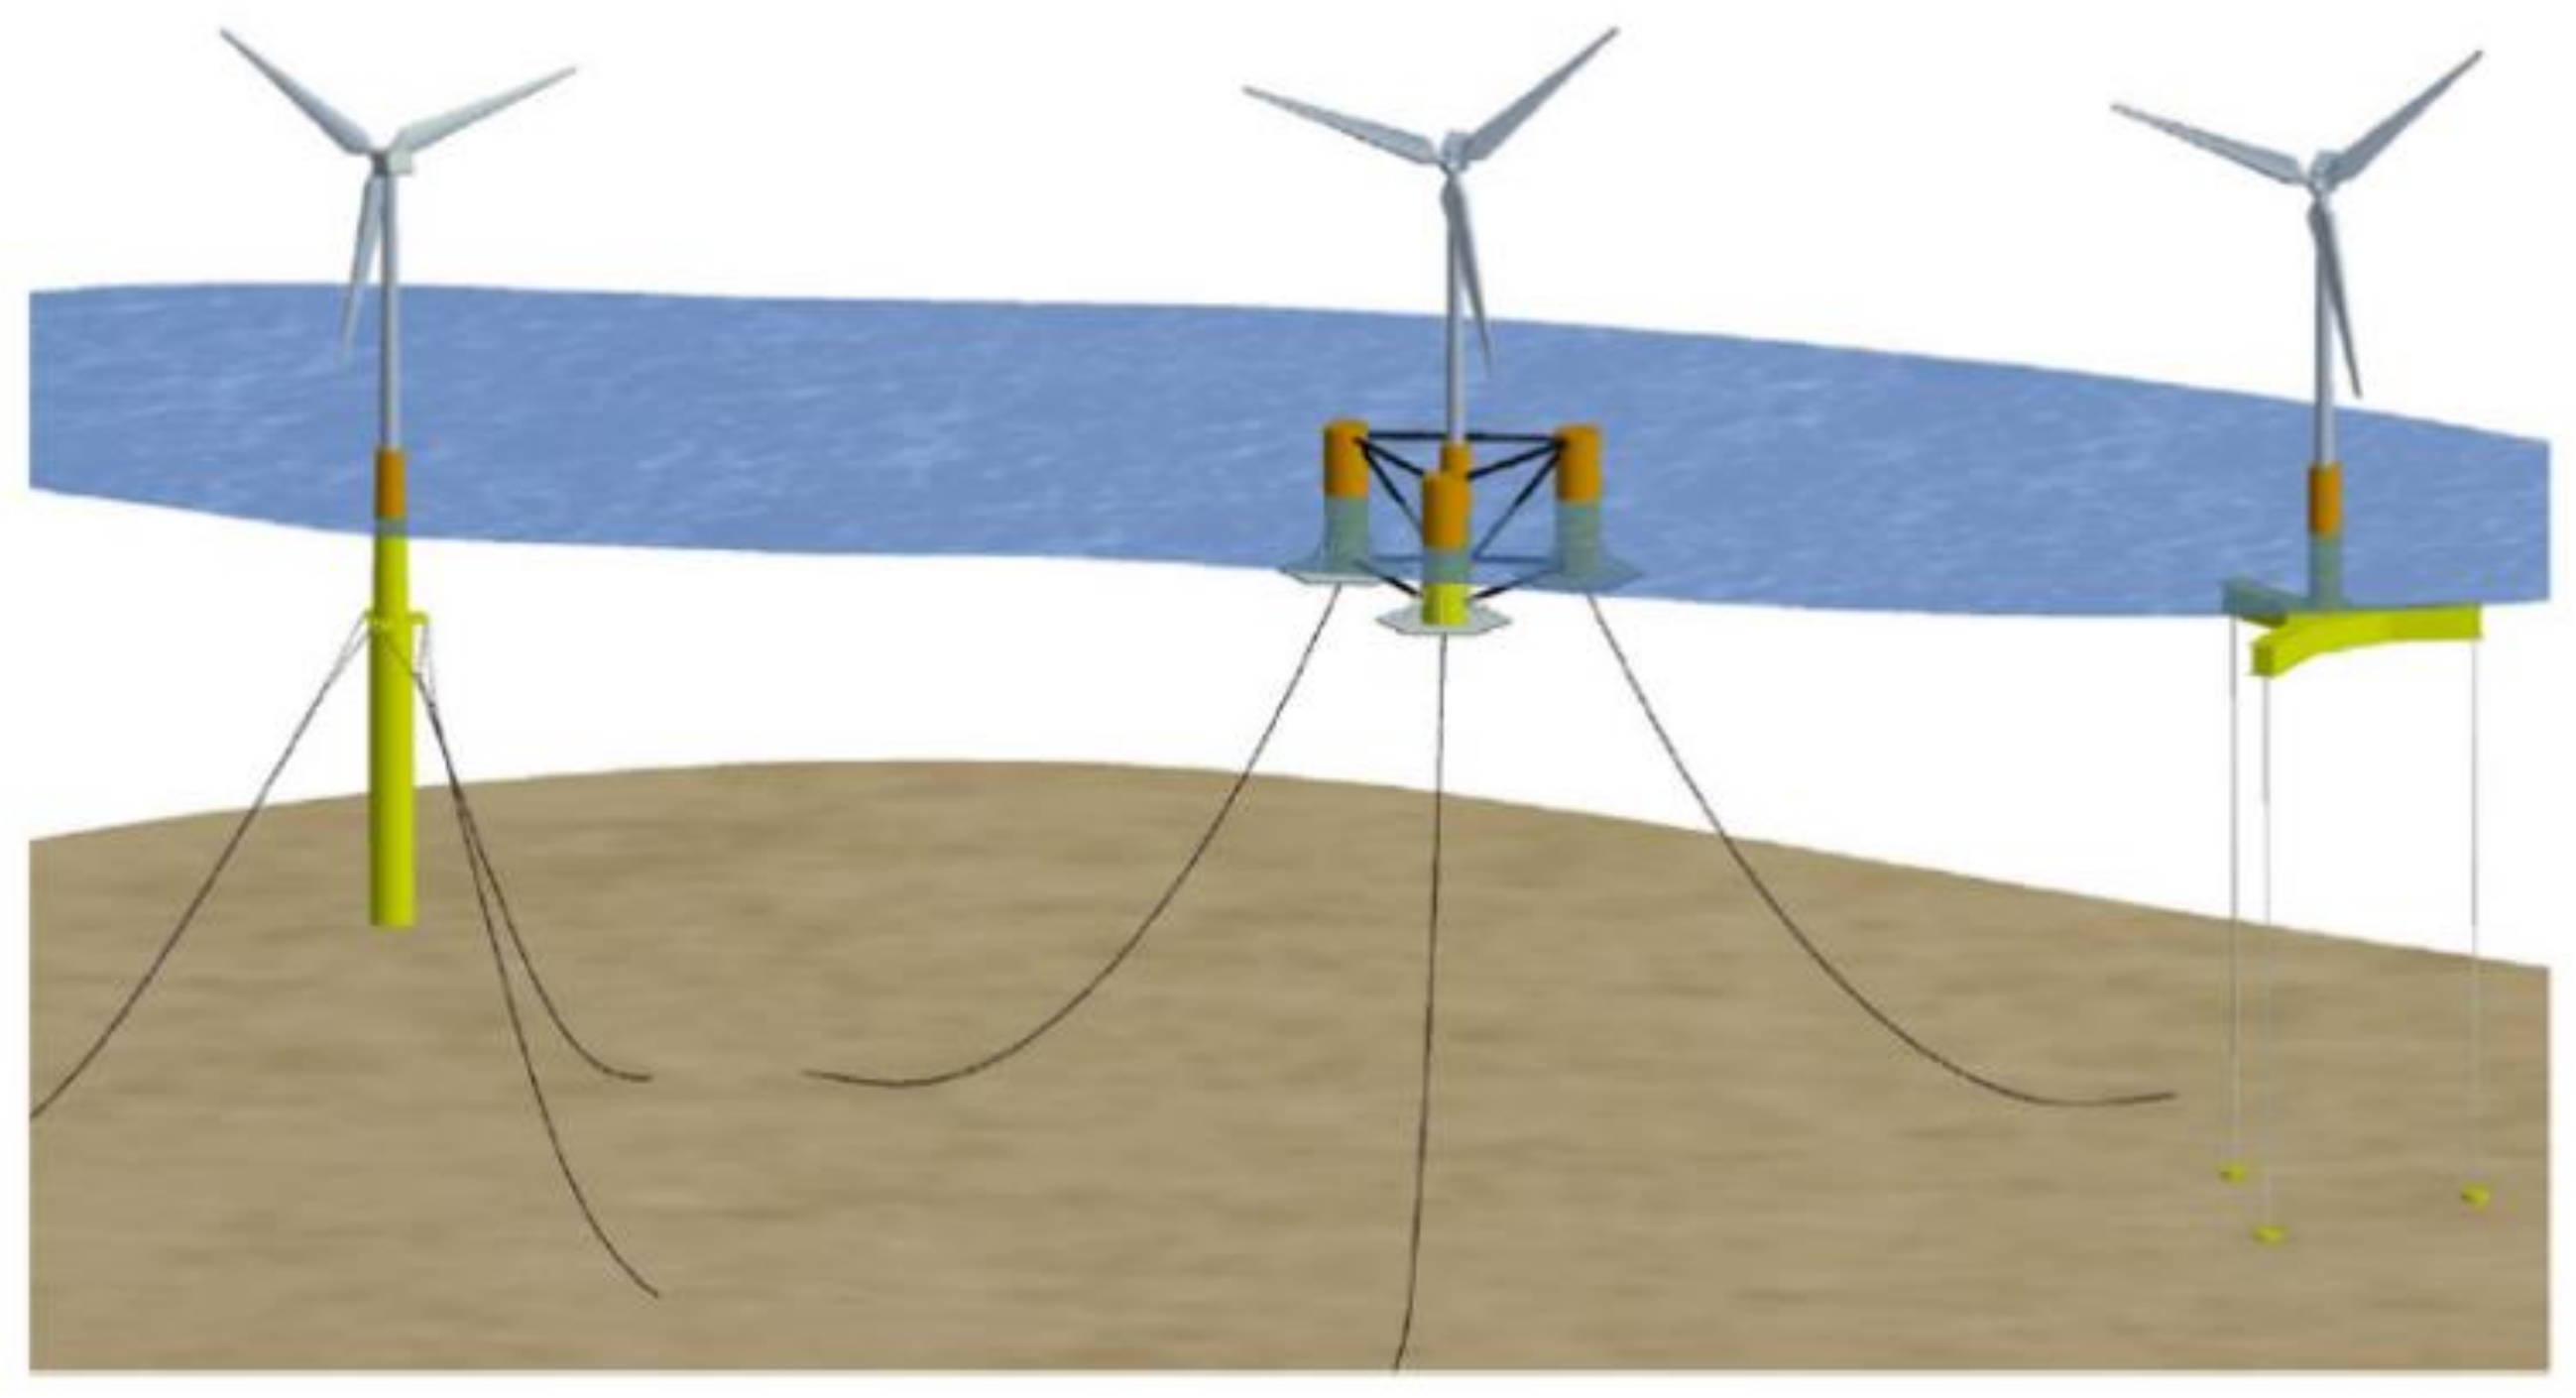
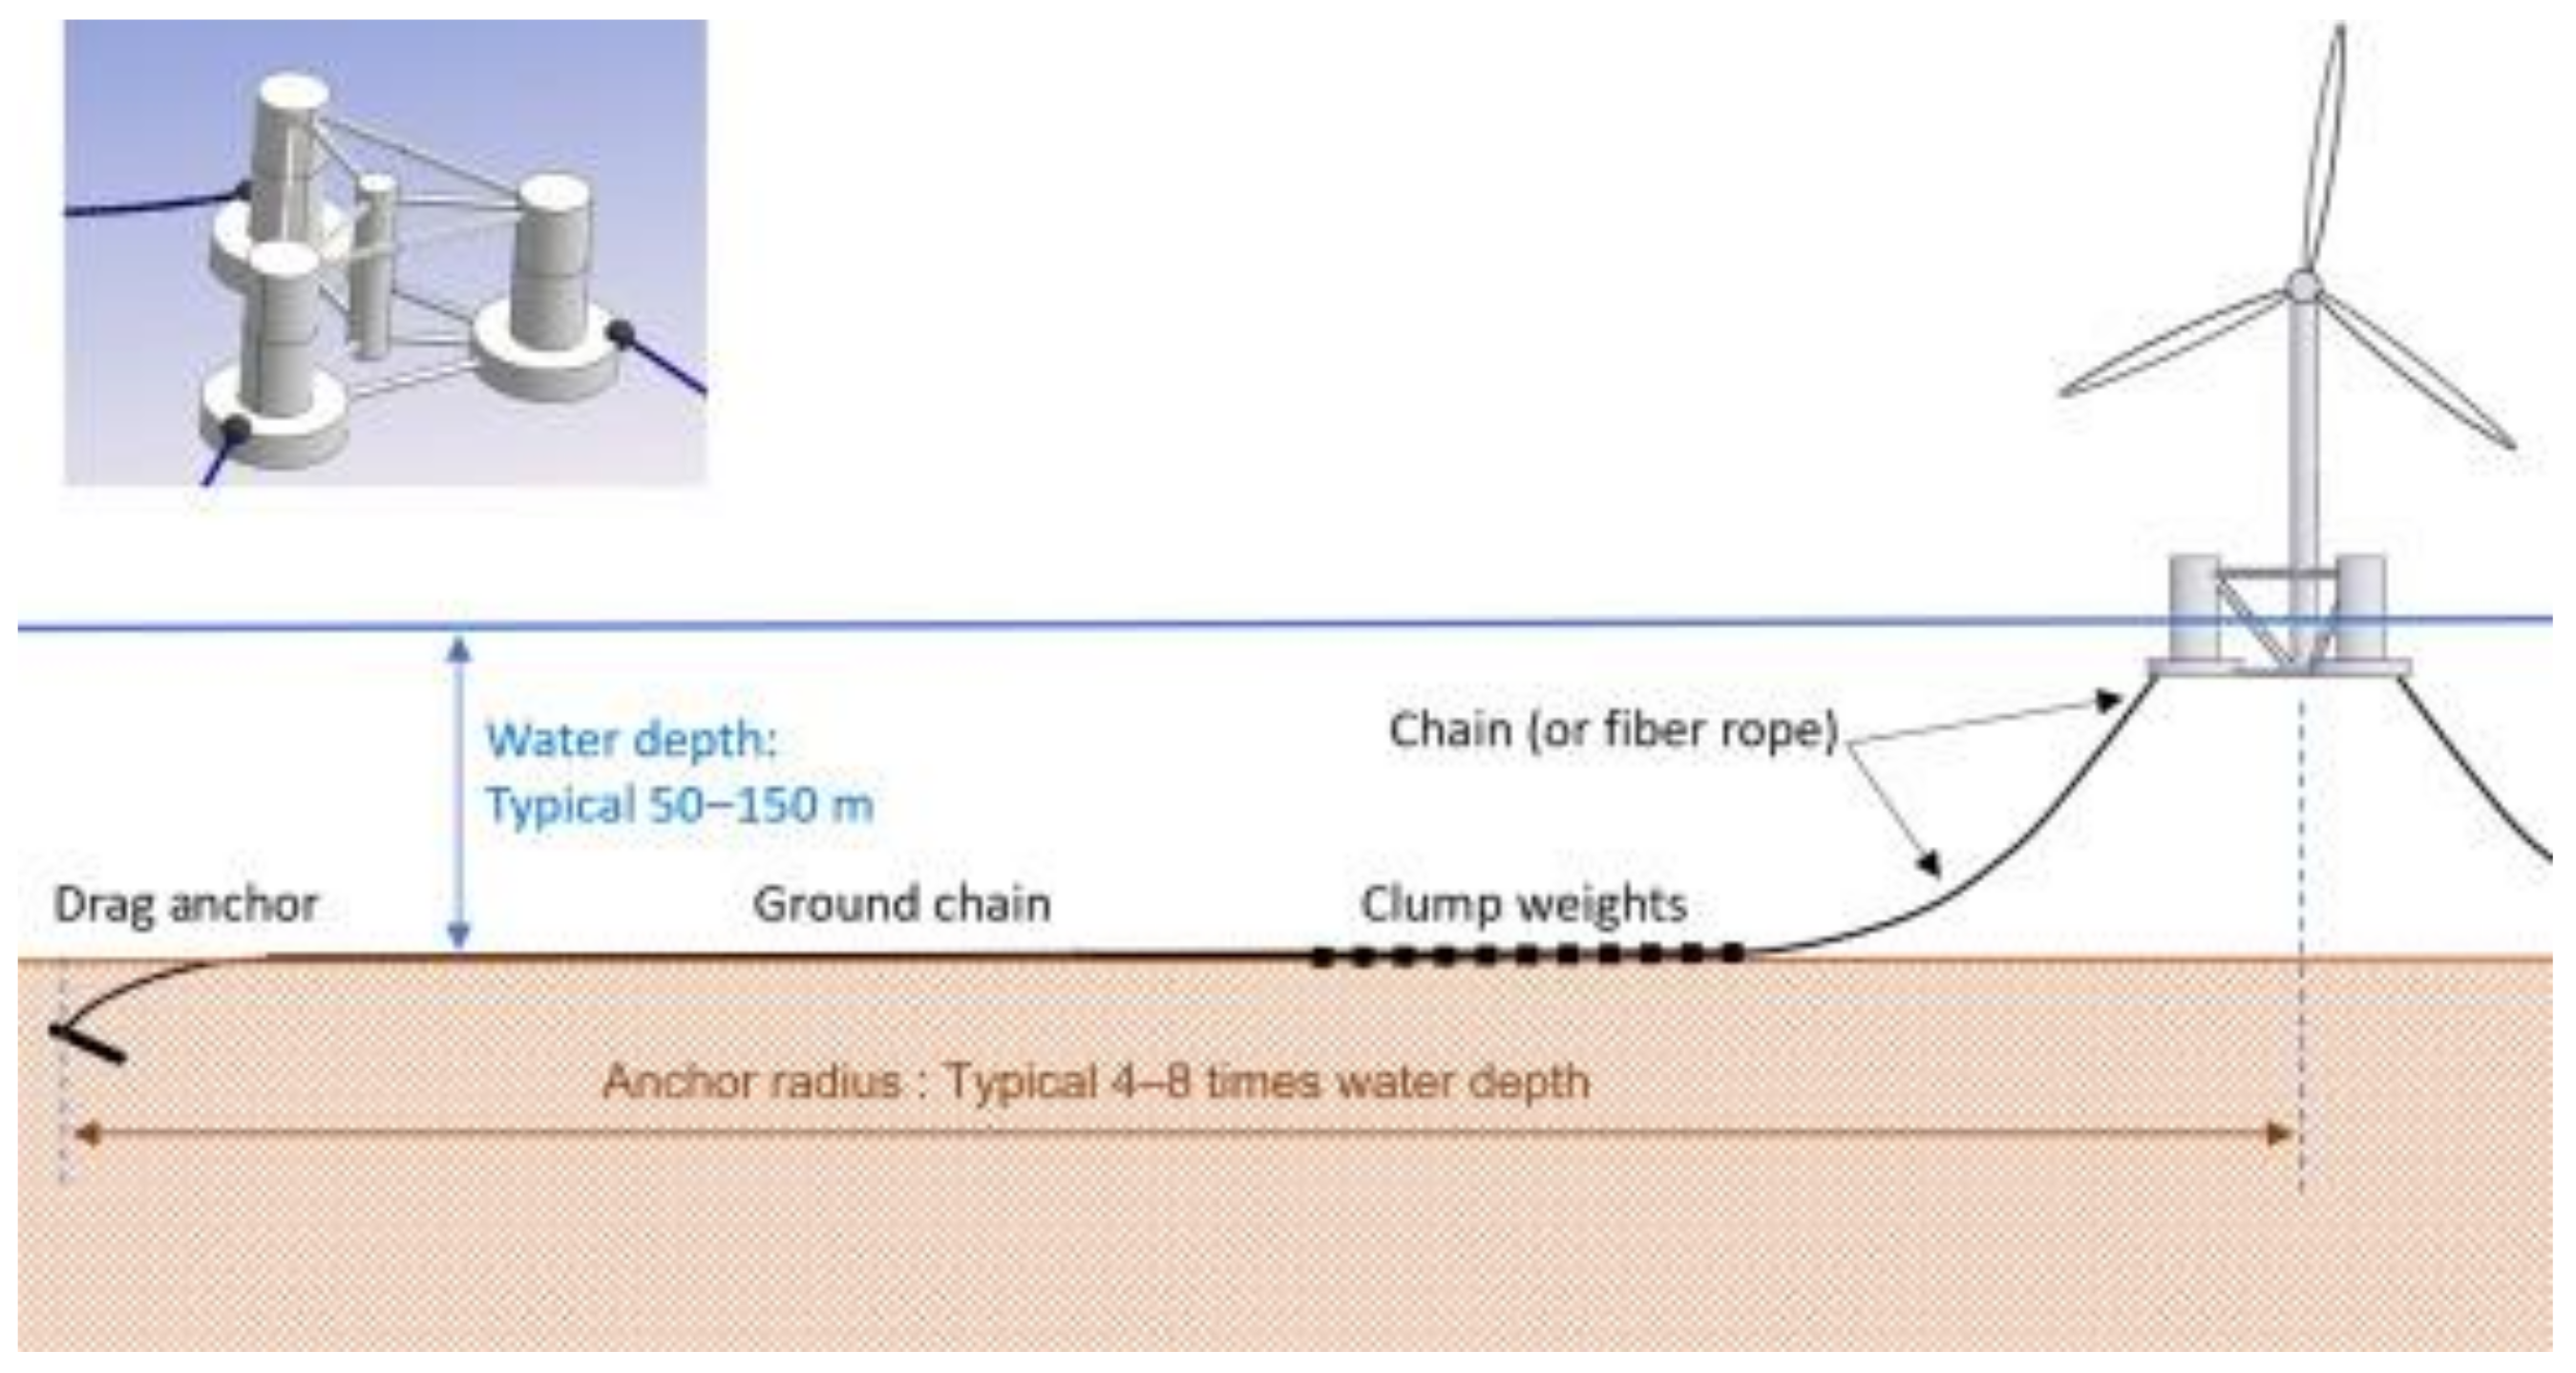
2.4.1. Potential Taut-Leg Mooring System for Offshore Wind Turbines


2.4.2. Potential Taut-Leg Mooring System for Marine Vessels
3. Material Selection
3.1. Loading Conditions of Mooring Tensioner
3.2. Adjustment of Spring Constant

| Type of Material | Fiber Volume Fraction | Tensile Modulus (GPa) | Ultimate Tensile Strength (MPa) | Density (g/cm3) | Fatigue Strength at 106 Cycles (MPa) |
|---|---|---|---|---|---|
| Copper wire (Phosphor Bronze Grade A ASTM B 159) [25] | N/A | 128 | 724 | 8.86 | 241 [26] |
| Stainless-steel wire (17–7 PH ASTM A 313 (631)) [25] | N/A | 203 | 1620 | 7.92 | 842.4 1 |
| High-carbon spring steel (Hard Drawn ASTM A 227) [25] | N/A | 207 | 1014 | 7.85 | 920 [27] |
| Gurit SparPreg unidirectional E glass/epoxy [28] | 68% | 44 | 935 | 2.14 2 | 420.8 3 |
| Gurit SparPreg unidirectional carbon fiber/epoxy [28] | 66% | 140 | 2234 | 1.55 | 720.6 4 |
| AGY unidirectional S-2 glass/epoxy [29] | 57–63% | 53–59 | 1590–2000 | 1.96–2.02 | 552.0 |
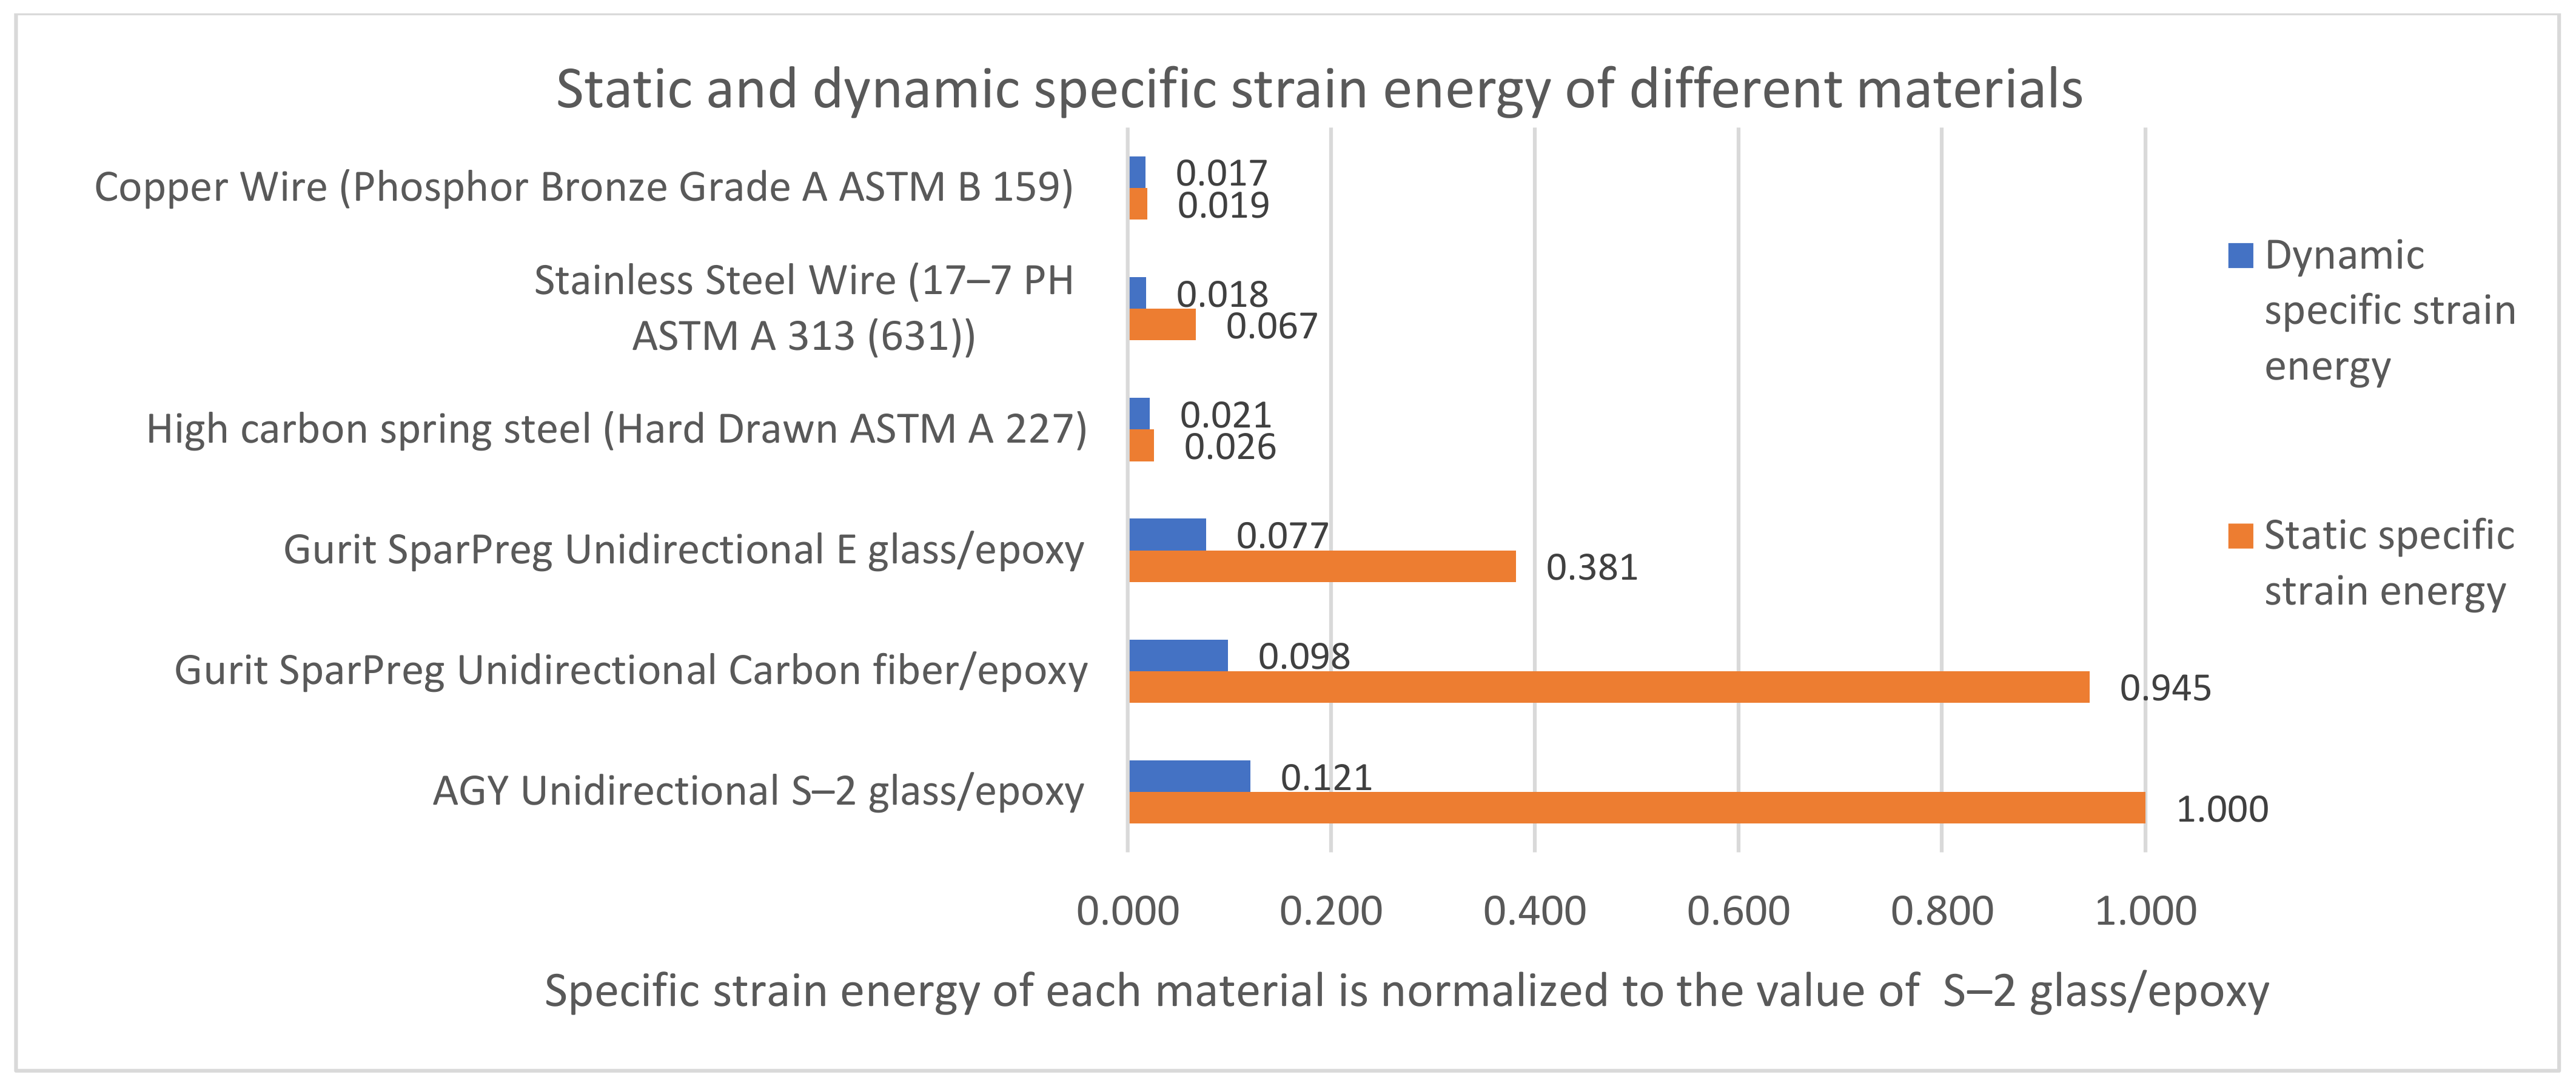
3.3. Specific Strain Energy
3.4. Static Strength
3.5. Fatigue Performance
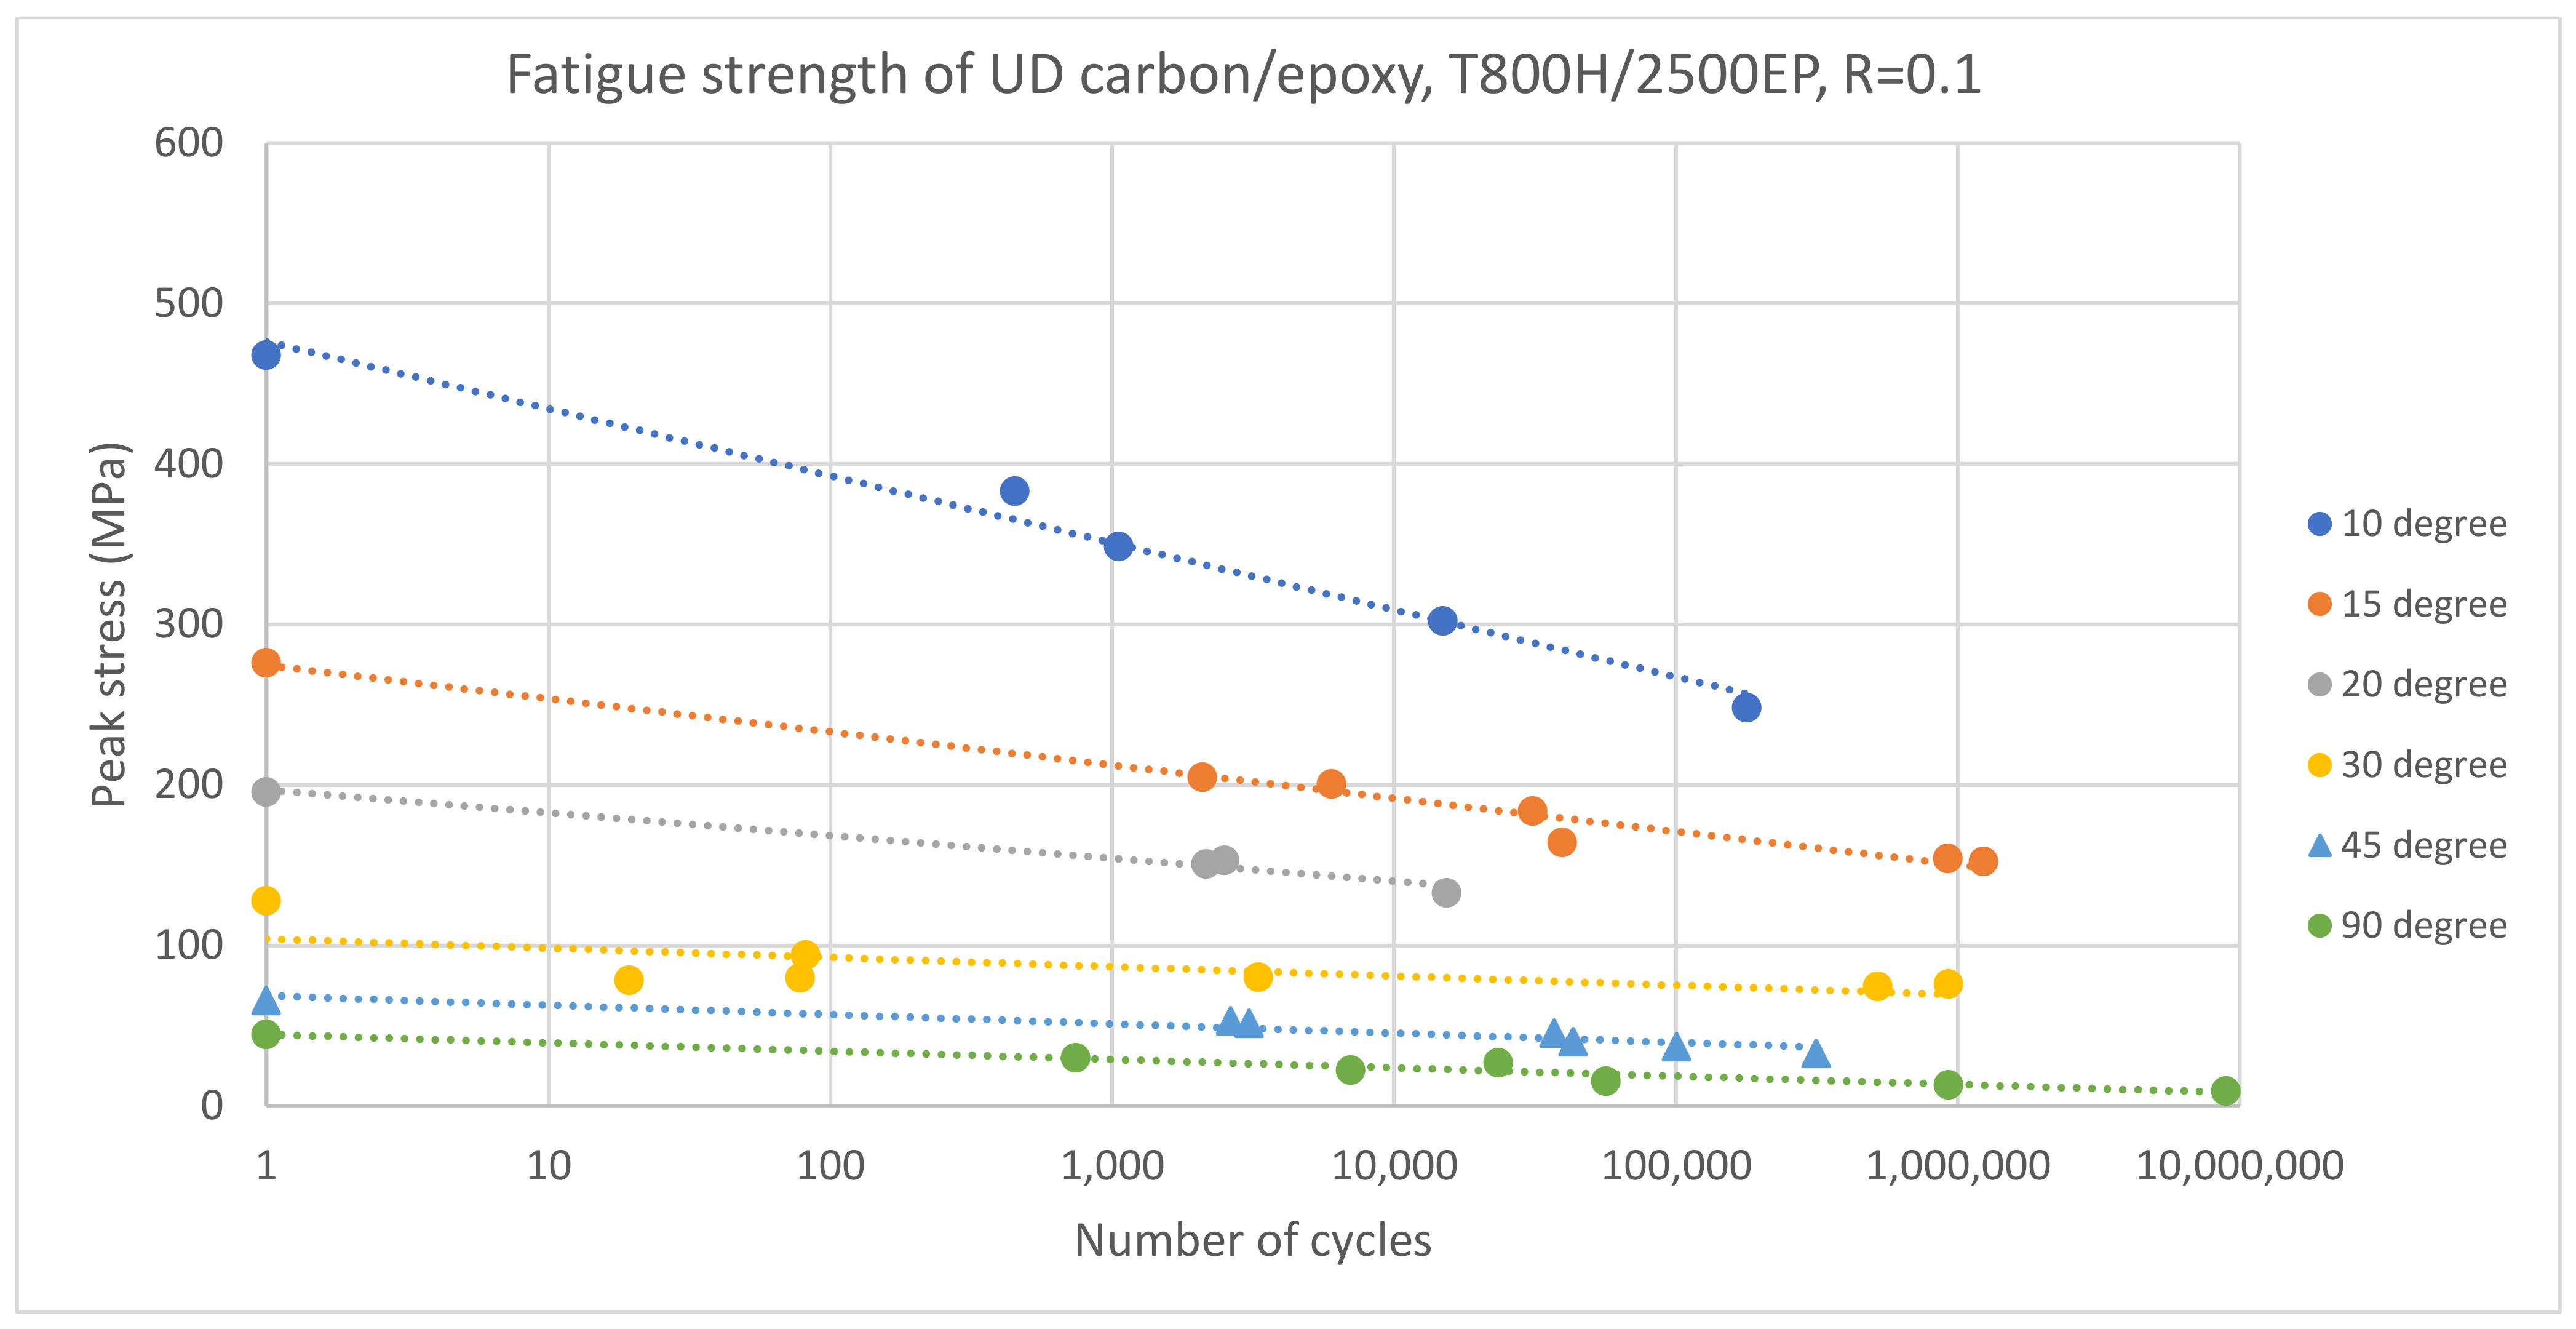
3.5.1. Effect of Fiber Orientation on Fatigue Strength of Composites


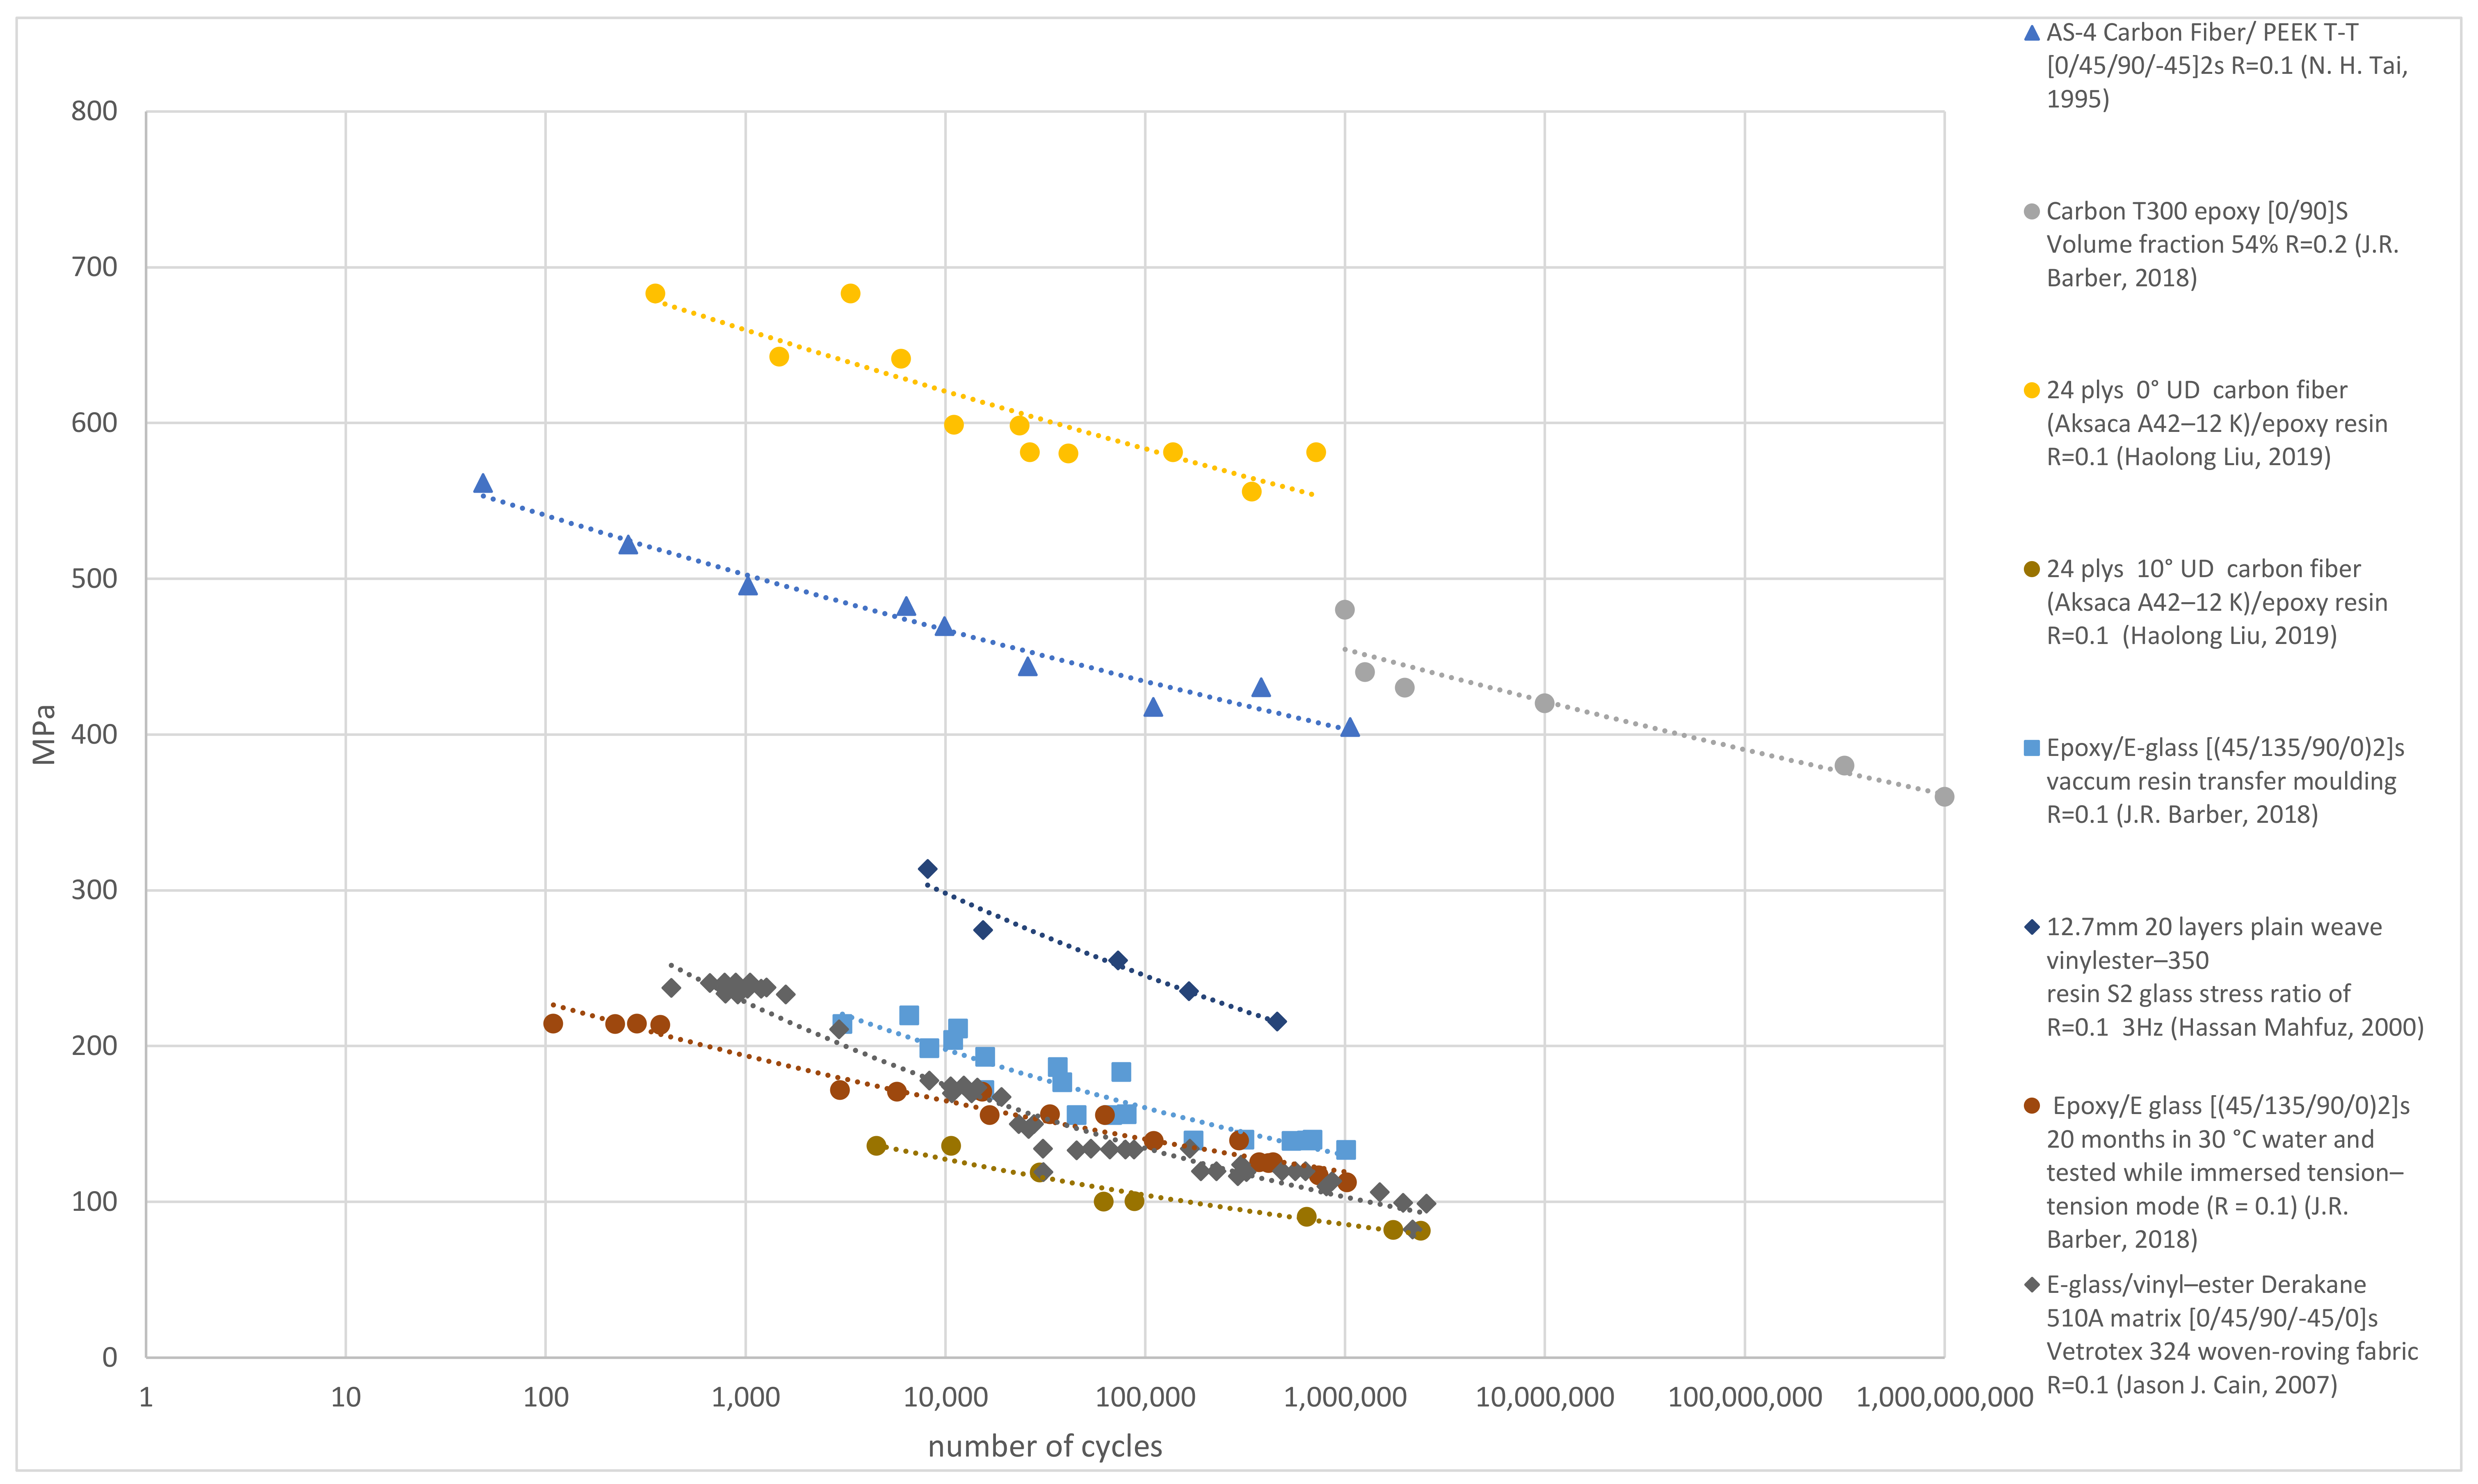
3.5.2. Effect of Stress Ratios on Fatigue Strength of Composites
3.5.3. Effect of Fiber Volume Fraction on Fatigue Strength of Composites
3.6. Comparison of Mechanical Properties between Different Types of Fibers and Matrices in Dry and Seawater Conditions
3.6.1. Comparison of Different Fibers in Dry Conditions
3.6.2. Comparison of Different Fibers in Seawater Conditions
3.6.3. Comparison of Different Matrices in Seawater Conditions

| Type of Composite | Saturation and Leaching Conditions | Change in Mechanical Properties | |||||
|---|---|---|---|---|---|---|---|
| Max Water Uptake % at Immersion Time | Leaching Conditions | Duration of Immersion Test | Reference | Flexural Strength at Duration of Seawater Immersion (MPa) | Flexural Strength under Dry Conditions (MPa) | Reference | |
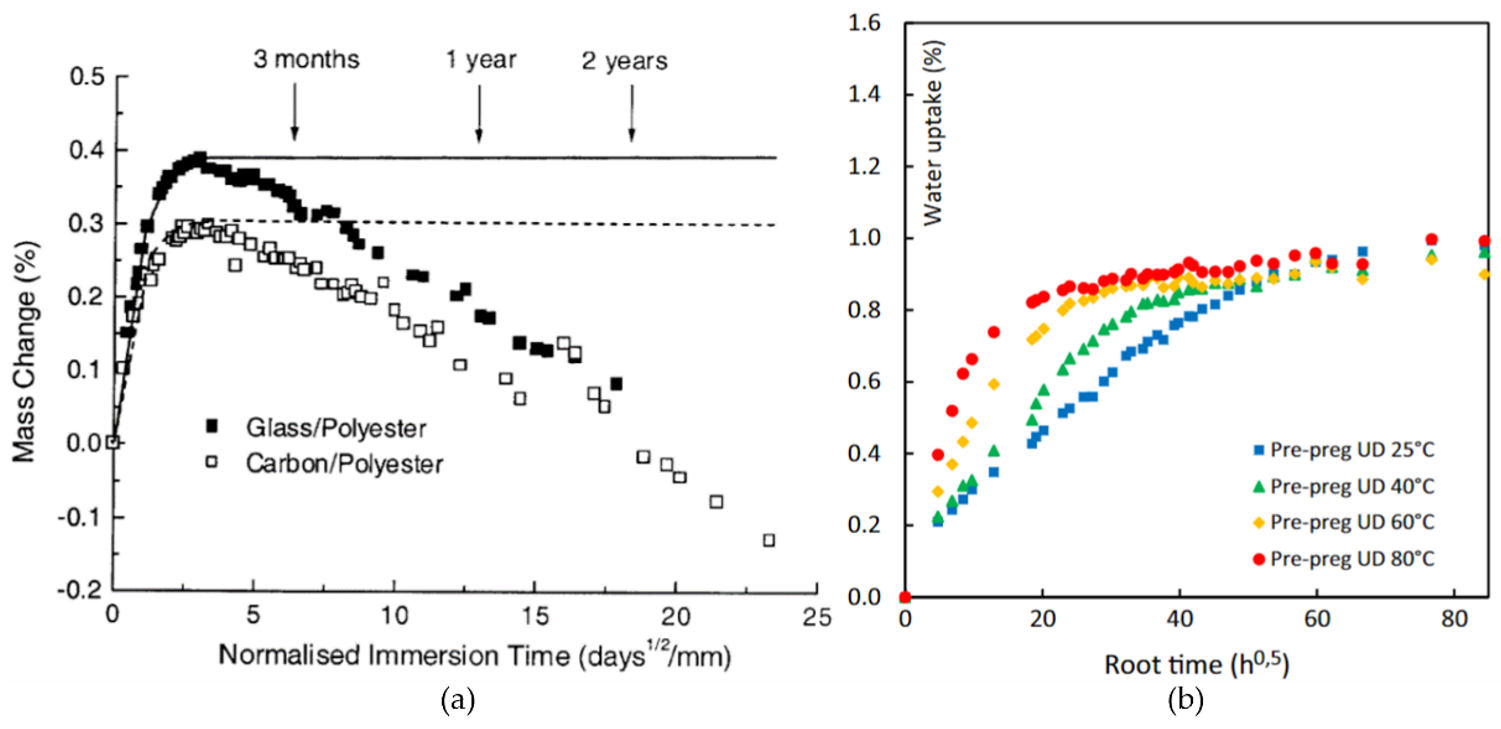
| Carbon/polyester 88% cured | 0.3 at 2 months | Leaching after max saturation | 3 years | [74] | 624 at 52 days 1 [74] | 833 | [79] |
| E glass/polyester 88% cured | 0.4 at 2 months | Leaching after max saturation | 3 years | [74] | 72 at 52 days 1 [74] | 120 | [80] |
| Carbon/vinyl ester 88% cured | 0.55 at 12 months | Does not leach out | 2 years | [74] | 150 at 450 days | 280 | [81] |
| E glass/vinyl ester 88% cured | 0.55 at 3 months | Does not leach out | 2 years | [74] | 62 at 450 days | 80 | [81] |
| Carbon/epoxy | 0.9 at around 150 days | Does not leach out | 267 days | [77] | 180 at 450 days | 260 | [81] |
| E glass/epoxy | 0.88 at around 365 days | Does not leach out | 450 days | [81] | 55 at 450 days | 85 | [81] |
| Carbon/acrylic | 0.8 at around 70 days | Does not leach out | 540 days | [78] | N/A | N/A | |
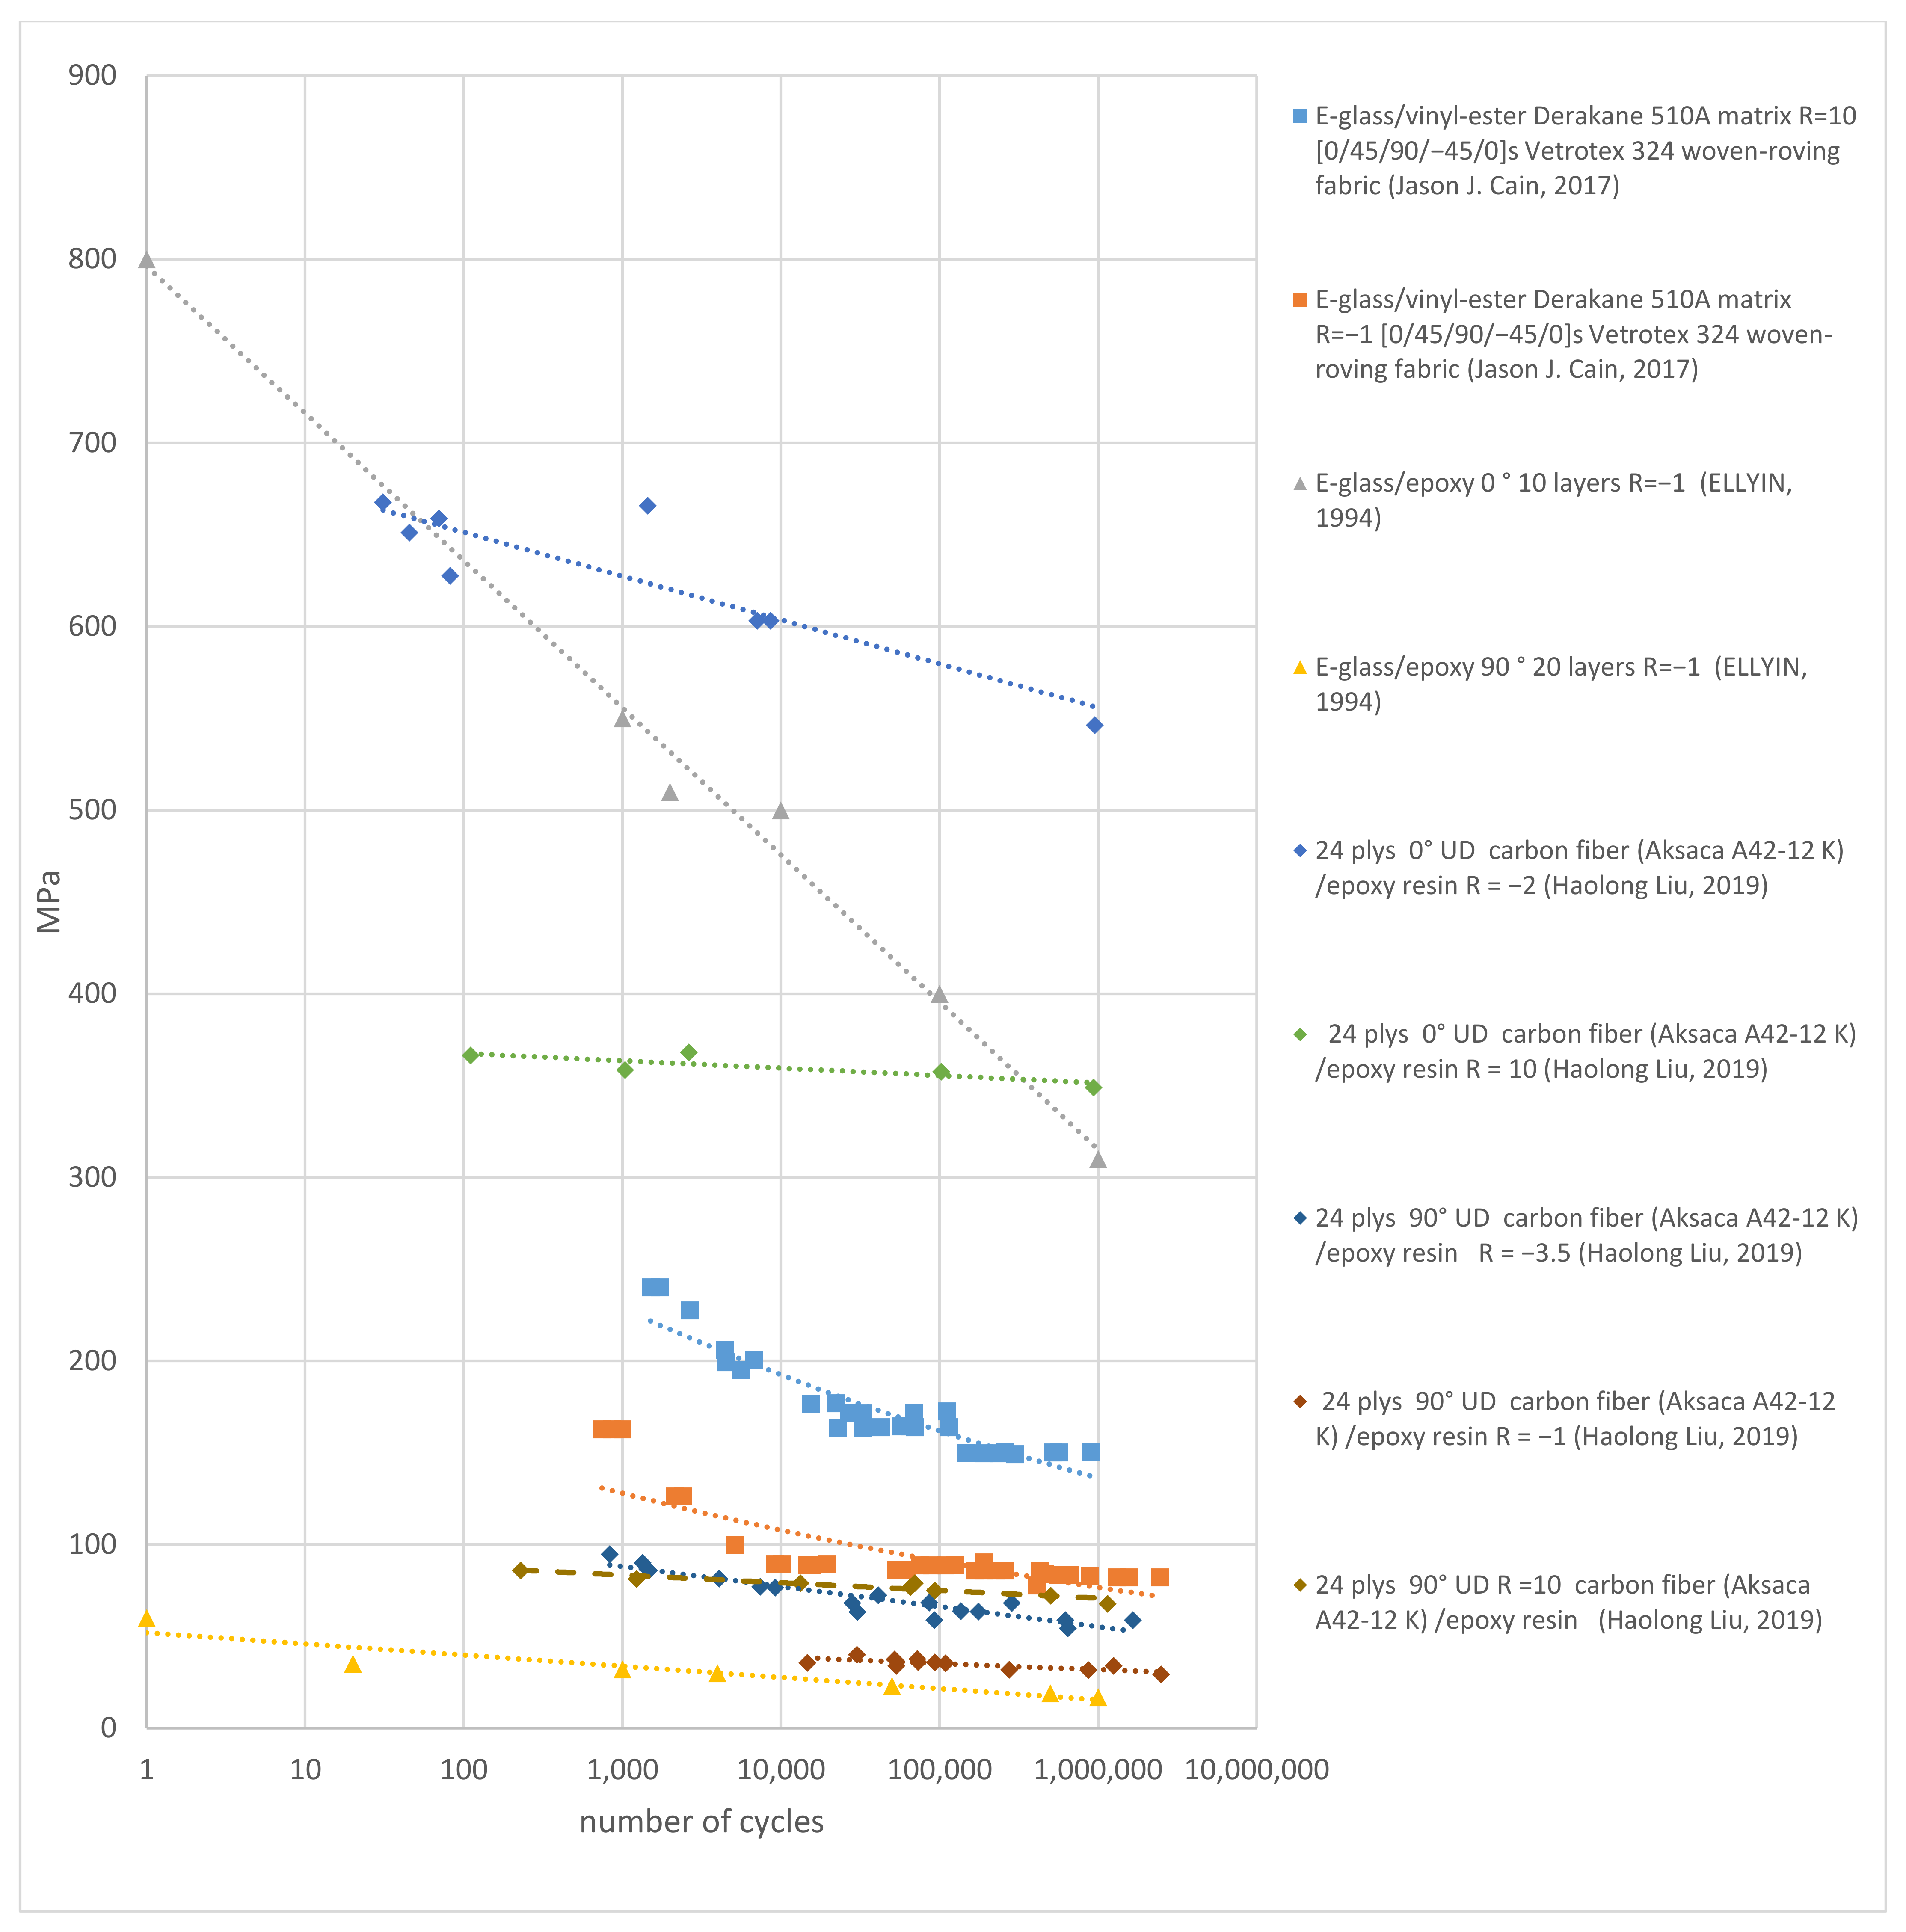
3.7. Effect of Moisture on the Fatigue Strength of Composites
| Reference | Fiber/Matrix Type | Laminates | Conditions | UTS MPa | Fatigue Strength at 106 Cycles MPa | Load Conditions | Fatigue Strength Reduction for the Range of Cycles |
|---|---|---|---|---|---|---|---|
| [31] | E glass/epoxy 3 M Type 1003 | 0° UD 10 layers | Dry/room temperature | 800 | 350 | Tension–compression, R = −1 | −55% (from UTS to 106) |
| [43] | E glass/epoxy Ahlstrom#42,007 | [(45°/135°/90°/0°)2] s | Dry | N/A | 130 | T–T, R = 0.1 | −43% (from 102 to 106) |
| [43] | E glass/epoxy Ahlstrom#42,007 | [(45°/135°/90°/0°)2] s | 20 months immersed 30 °C water | N/A | 115 | T–T, R = 0.1 | −50% (from 102 to 106) |
| [39] | E glass/vinyl-ester Derakane 510 A matrix and Vetrotex 324 woven-roving fabric | [0/45/90/−45/0] s | Dry/room temperature | N/A | 100 | T–T, R = 0.1 | −58% (from 103 to 106) |
| [41] | S2 glass vinylester-350 resin | 12.7 mm thickness, 20 layers plain weave | Dry/room temperature | N/A | 210 | T–T, R = 0.1 | −33% (from 104 to 106) |
| [40] | Carbon fiber/epoxy resin Aksaca A–42 | 24 ply 0° UD | Dry/room temperature | N/A | 510 | T–T, R = 0.1 | −26% (from 102 to 106) |
| [40] | Carbon fiber/epoxy resin Aksaca A–42 | 24 ply 0° UD | Dry/room temperature | N/A | 450 | T–C, R = −2 | −33% (from 102 to 106) |
| [42] | AS-4 carbon fiber/PEEK | [0/45/90/−45]2 s | Dry/room temperature | N/A | 406 | T–T, R = 0.1 | −22% (from 102 to 106) |
3.8. Comparison between Composites and Metal Materials
4. Overview of Spring Types and Manufacturing Methods
5. Conclusions and Recommendations for Future Studies
5.1. Conclusions
- The fatigue strength of composite materials is affected by the type of fiber and matrix, the fiber volume fraction, and the fiber orientation. A fiber volume fraction of 45–60% provides superior fatigue strength. The fatigue strength starts to decrease when the fiber fraction is greater than 70%.
- Carbon fiber has superior seawater resistance and does not react with seawater. However, carbon fibers with a relatively high modulus might not be suitable for applications requiring high elasticity.
- It is not recommended to use E-glass-reinforced composites in submerged seawater conditions due to their low chemical resistance and seawater resistance.
- It was found that R glass and S glass have a higher strength and seawater resistance than E glass. Thus, glass fibers such as AR glass, R glass, and S glass could be the desired material options for applications requiring high elasticity in offshore environments.
- Epoxy, acrylics, and vinyl esters reached saturation conditions and did not leach out within the experimental duration in water-immersion conditions.
- Polyester was found to leach out organic species after it reached maximum weight gain at around 2 months immersed in seawater at room temperature. Leaching could cause the severe degradation of the mechanical properties of composites, and therefore polyester may not be suitable for applications in seawater for long-term service.
- Potential composite mooring tensioner manufacturing methods such as the vacuum-assisted resin infusion of composite multistrand springs, high-pressure resin transfer molding, filament winding, and automated fiber placement may be suitable manufacturing methods for large composite springs.
5.2. Recommendations for Future Studies
- The comparison of mechanical property degradation for E-glass-, S-glass-, AR-glass, and R-glass-reinforced epoxy in seawater immersion conditions. Understanding how R glass, S glass, AR glass fiber/epoxy perform in fatigue loading under seawater immersion.
- The development of toughening methods for the matrix to increase the fatigue strength of composite materials in seawater environments.
- The development of an efficient and durable composite mechanical tensioner to provide a desired specific strain energy and compact configuration for offshore applications.
- Additive manufacturing methods are gaining popularity across many industries. With respect to the manufacture of composite spring elements discussed in this paper, a potential benefit of additive composite manufacture is the ability to produce large structures without the need for large molds. This research area is still in its infancy, and currently the structural properties of additively manufactured composites cannot compete with those of traditional manufacturing processes. Consequently, research efforts are required to develop new additive composite manufacturing properties targeting the manufacture of high-quality large structures.
Author Contributions
Funding
Institutional Review Board Statement
Informed Consent Statement
Data Availability Statement
Acknowledgments
Conflicts of Interest
References
- Amaechi, C.V.; Chesterton, C.; Butler, H.O.; Gillet, N.; Wang, C.; Ja’e, I.A.; Reda, A.; Odijie, A.C. Review of Composite Marine Risers for Deep-Water Applications: Design, Development and Mechanics. J. Compos. Sci. 2022, 6, 96. [Google Scholar] [CrossRef]
- Saad, P.; Salama, M.M.; Jahnsen, O. Application of Composites to Deepwater Top Tensioned Riser Systems. In Proceedings of the ASME 2002 21st International Conference on Offshore Mechanics and Arctic Engineering, Oslo, Norway, 23–28 June 2002. [Google Scholar]
- Ke, J.; Wu, Z.; Chen, X.; Ying, Z. A review on material selection, design method and performance investigation of composite leaf springs. Compos. Struct. 2019, 226, 2–14. [Google Scholar] [CrossRef]
- Wu, L.; Chen, L.; Fu, H.; Jiang, Q.; Wu, X.; Tang, Y. Carbon fiber composite multistrand helical springs with adjustable spring constant: Design and mechanism studies. J. Mater. Res. Technol. 2020, 9, 5067–5076. [Google Scholar] [CrossRef]
- Huang, C.-C.; Tang, H.-J.; Liu, J.-Y. Dynamical analysis of net cage structures for marine aquaculture: Numerical simulation and model testing. Aquac. Eng. 2006, 35, 258–270. [Google Scholar] [CrossRef]
- Carnegie Clean Energy. CETO Technology. 2020. Available online: https://www.carnegiece.com/ceto-technology/ (accessed on 13 June 2021).
- Amaechi, C.V.; Reda, A.; Butler, H.O.; Ja’e, I.A.; An, C. Review on fixed and floating offshore structures. Part I: Types of platforms with some applications. J. Mar. Sci. Eng. 2022, 10, 1074. [Google Scholar] [CrossRef]
- Ma, K.-T.; Luo, Y.; Kwan, C.-T.T.; Wu, Y. Mooring System Engineering for Offshore Structures; Gulf Professional Publishing: Houston, TX, USA, 2019. [Google Scholar]
- Wu, Y.; Wang, T.; Ma, K.-T.; Heyl, C.; Garrity, R.; Shelton, J. Mooring Tensioning Systems for Offshore Platforms: Design, Installation, and Operating Considerations. In Proceedings of the Offshore Technology Conference, Houston, TX, USA, 30 April–3 May 2018. [Google Scholar]
- D’Souza, R.; Majhi, S. Application of Lessons Learned From Field Experience to Design, Installation and Maintenance of FPS Moorings. In Proceedings of the Offshore Technology Conference, Houston, TX, USA, 6–9 May 2013. [Google Scholar]
- Ma, K.-T.; Shu, H.; Smedley, P.; L’Hostis, D.; Duggal, A. A Historical Review on Integrity Issues of Permanent Mooring Systems. In Proceedings of the Offshore Technology Conference, Houston, TX, USA, 6–9 May 2013. [Google Scholar]
- ExxonMobil. Mooring Rapid Response Plan Front End Study; Granherne: Houston, TX, USA, 2010. [Google Scholar]
- Brown, M.G.; Hall, T.D.; Marr, D.G.; English, M.; Snell, R.O. Floating Production Mooring Integrity JIP—Key Findings. In Proceedings of the Offshore Technology Conference, Houston, TX, USA, 2–5 May 2005. [Google Scholar]
- RRD Team. Renewables 2020 Global Status Report; 2020. Available online: https://www.ren21.net/wp-content/uploads/2019/05/gsr_2020_full_report_en.pdf (accessed on 12 May 2021).
- Al Shami, E.; Zhang, R.; Wang, X. Point Absorber Wave Energy Harvesters: A Review of Recent Developments. Energies 2019, 12, 47. [Google Scholar] [CrossRef]
- Leverette, S.J.; Pollack, J. In-Line Mooring Connector and Tensioner. U.S. Patent 2014/0026796, 30 January 2014. [Google Scholar]
- Taylor, R. Mooring Tensioner and Methods Thereof. U.S. Patent 10,974,792, 13 April 2017. [Google Scholar]
- Lisland, T. Mooring Pulley Tensioning System. U.S. Patent 10,577,056, 3 March 2017. [Google Scholar]
- Bauer, T.C. Systems and Methods for Tensioning Mooring Lines at the Seafloor. U.S. Patent 9,487,272, 8 November 2015. [Google Scholar]
- Technologies, O.H. Introduction to InfinityWEC. Available online: https://www.oceanharvesting.com/infinitywec-technology/ (accessed on 10 February 2022).
- CorPower Ocean. Corpower’s Wave Energy Concept. 2019. Available online: https://www.corpowerocean.com/technology/ (accessed on 18 September 2021).
- Tension Technology International. Marine Mooring System Services. Available online: https://www.tensiontech.com/services/mooring (accessed on 21 February 2022).
- Two C’s Marine. Moorings 101. 2020. Available online: https://www.twocsmarine.com/moorings-101/ (accessed on 12 August 2021).
- Mahmoudi, A.; Soong, W.L.; Pellegrino, G.; Armando, E. Efficiency maps of electrical machines. In Proceedings of the IEEE Energy Conversion Congress and Exposition (ECCE), Montreal, QC, Canada, 20–24 September 2015. [Google Scholar]
- Ace Wire Spring & Form. Properties of Common Spring Materials. 2005. Available online: https://www.tribology-abc.com/calculators/properties_of_common_spring_materials.pdf (accessed on 28 August 2021).
- Copper Development Association Inc. 2013. Available online: https://www.copper.org/applications/industrial/DesignGuide/performance/fatigue03.html#:~:text=The%20standard%20fatigue%20strength%20for,withstand%20more%20cycles%20before%20failure (accessed on 28 April 2021).
- Hayes, M. Fatigue of Springs. In Fatigue and Fracture; ASM International: Almere, The Netherlands, 1996. [Google Scholar]
- Gurit. Carbon & Glass SparPregTM UD Prepreg Spar Solution. 2019. Available online: https://www.gurit.com/-/media/gurit/datasheets/sparpreg.pdf (accessed on 28 August 2021).
- AGY. High Strength Glass Fibers; AGY: 1996. Available online: https://www.agy.com/wp-content/uploads/2014/03/Advanced_Materials_Brochure-Technical.pdf (accessed on 28 July 2021).
- Akiniwa, Y.; Stanzl-Tschegg, S.; Mayer, H.; Wakita, M.; Tanaka, K. Fatigue strength of spring steel under axial and torsional loading in the very high cycle regime. Int. J. Fatigue 2008, 30, 2057–2063. [Google Scholar] [CrossRef]
- El Kadi, H.; Ellyin, F. Effect of stress ratio on the fatigue of unidirectional glass fibre/epoxy composite laminae. Composites 1994, 25, 917–924. [Google Scholar] [CrossRef]
- Brunbauer, J.; Pinter, G. Effects of mean stress and fiber volume content on the fatigue-induced damage mechanisms in CFRP. Int. J. Fatigue 2015, 75, 28–38. [Google Scholar] [CrossRef]
- Yu, W.-J.; Kim, H.-C. Double tapered FRP beam for automotive suspension leaf spring. Compos. Struct. 1988, 9, 279–300. [Google Scholar] [CrossRef]
- Chiu, C.-H.; Hwan, C.-L.; Tsai, H.S.; Lee, W.P. An experimental investigation into the mechanical behaviors of helical composite springs. Compos. Struct. 2007, 77, 331–340. [Google Scholar] [CrossRef]
- Amiri, N.; Shaterabadi, M.; Reza Kashyzadeh, K.; Chizari, M. A Comprehensive Review on Design, Monitoring, and Failure in Fixed Offshore Platforms. J. Mar. Sci. Eng. 2021, 9, 1349. [Google Scholar] [CrossRef]
- Du, J.; Wang, H.; Wang, S.; Song, X.; Wang, J.; Chang, A. Fatigue damage assessment of mooring lines under the effect of wave climate change and marine corrosion. Ocean. Eng. 2020, 206, 107303. [Google Scholar] [CrossRef]
- Kawai, M.; Yajima, S.; Hachinohe, A.; Takano, Y. Off-Axis Fatigue Behavior of Unidirectional Carbon Fiber-Reinforced Composites at Room and High Temperatures. J. Compos. Mater. 2001, 35, 545–576. [Google Scholar] [CrossRef]
- Bernasconi, A.; Davoli, P.; Basile, A.; Filippi, A. Effect of fibre orientation on the fatigue behaviour of a short glass fibre reinforced polyamide-6. Int. J. Fatigue 2007, 29, 199–208. [Google Scholar] [CrossRef]
- Cain, J.J.; Post, N.L.; Case, S.W.; Lesko, J.J. R-Ratio Effects on Glass-Reinforced Polymer Composite Life and Remaining Strength. In Proceedings of the 16th International Conference on Composite Materials, Kyoto, Japan, 8–13 July 2007. [Google Scholar]
- Liu, H.; Ojha, A.; Li, Z.; Engler-Pinto, C.C.; Su, X.; Sun, Q.; Kang, H.; Wen, W.; Cui, H. Fatigue modeling for carbon/epoxy unidirectional composites under various stress ratios considering size effects. Int. J. Fatigue 2019, 120, 184–200. [Google Scholar] [CrossRef]
- Mahfuz, H.; Zaman, K.; Haque, A.; Foy, C.; Mohamed, H.; Jeelani, S. Fatigue Life Prediction of Thick-Section S2-Glass/Vinyl-Ester Composites Under Flexural Loading. J. Eng. Mater. Technol. 2000, 122, 402–408. [Google Scholar] [CrossRef]
- Tai, N.H.; Ma, C.C.M.; Wu, S.H. Fatigue behaviour of carbon fibrePEEK laminate composites. Composites 1994, 26, 551–559. [Google Scholar] [CrossRef]
- Barber, A.A.J.R. Durability of Composites in a Marine Environment; Springer: Berlin/Heidelberg, Germany, 2018. [Google Scholar]
- Ansari, M.T.A.; Singh, K.K.; Azam, M.S. Fatigue damage analysis of fiber-reinforced polymer composites—A review. J. Reinf. Plast. Compos. 2018, 37, 636–654. [Google Scholar] [CrossRef]
- Munoz-Guijosa, J.M.; Zapico, G.F.; de la Peña, J.; Echávarri, J. Using FRPs in elastic regime for the storage and handling of mechanical energy and power: Application in spiral springs. Compos. Struct. 2019, 213, 317–327. [Google Scholar] [CrossRef]
- DowAksa. Continuous Carbon Fiber Properties. 2020. Available online: https://www.dowaksa.com/aksaca/ (accessed on 3 May 2021).
- Toray. Toray Composite Materials Datasheet. 2020. Available online: www.toraycma.com (accessed on 28 April 2021).
- AGY. AGY Advanced Materials Datasheet. Available online: https://www.agy.com/wpcontent/uploads/2014/03/Advanced_Materials_Brochure-Technical.pdf (accessed on 28 April 2021).
- Wu, Z.; Wang, X.; Iwashita, K.; Sasaki, T.; Hamaguchi, Y. Tensile fatigue behavior of FRP and hybrid FRP sheets. Compos. B Eng. 2010, 41, 396–402. [Google Scholar] [CrossRef]
- Michel, S.A.; Kieselbach, R.; Martens, H.J. Fatigue strength of carbon fibre composites up to the gigacycle regime. Int. J. Fatigue 2006, 28, 261–270. [Google Scholar] [CrossRef]
- Toray. Toray T700S Datasheet. Available online: www.toraycma.com (accessed on 28 April 2021).
- Department Of Defense Handbook. Composite Materials Handbook, Polymer Matrix Composites Materials Properties; U.S. Government Bookstore: Washington, DC, USA, 1999; p. 2.
- Toray. Datasheet Toray T800H. Available online: www.toraycma.com (accessed on 28 April 2021).
- Siriruk, A.; Penumadu, D. Degradation in fatigue behavior of carbon fiber–vinyl ester based composites due to sea environment. Compos. Part B Eng. 2014, 61, 94–98. [Google Scholar] [CrossRef]
- APCM. DA 4518U/E-Glass Unidirectional E-glass epoxy prepreg. Available online: http://www.prepregs.com/wp-content/uploads/2016/06/da4518eglassdatasheet.pdf (accessed on 18 June 2021).
- Koricho, E.G.; Belingardi, G.; Beyene, A.T. Bending fatigue behavior of twill fabric Eglass/epoxy composite. Compos. Struct. 2014, 111, 169–178. [Google Scholar] [CrossRef]
- Mandell, J.F.; Samborsky, D.D. DOE/MSU Composite Material Database, Version 19.0. Master’s Thesis, Montana State University, Bozeman, MT, USA, 2010. [Google Scholar]
- AGY. High Strength Glass Fibes. In R2 AGY Technical Paper; AGY: Aiken, SC USA, 2006. [Google Scholar]
- Kinsella, M.; Murray, D.; Crane, D.; Mancinelli, J.; Kranjc, M. Mechanical properties of polymeric composites reinforced with high strength glass fibers. In Proceedings of the 33th International SAMPE Technical Conference, Seattle, WA, USA, 5–8 November 2001. [Google Scholar]
- Mandell, J.F. Recent Fatigue Test Result For Blade Materials. In 2008 Wind Turbine Blade Workshop; Department of Chemical and Biological Engineering, Montana State University: Bozeman, MT, USA, 2008. [Google Scholar]
- HiPer-tex. HiPer-texTM W2020 Rovings. 2019. Available online: https://www.3b-fibreglass.com/sites/default/files/products-data-sheets/TDS-HiPer-tex-W-2020-Rovings-for-Epoxy-Resin-2015-sans-trame-LR.pdf (accessed on 18 May 2021).
- Wilson ML, J.G. Comparison of Flexural Properties of Aramid-Reinforced Pultrusions Having Varied Matrices, Pretreatments and Postcures. In NASA Tech Memorandum; University of Michigan Library: Ann Arbor, MI, USA, 1997. [Google Scholar]
- Matmatch. JIS G3561 Grade SWOSC-V Oil Tempered. 2021. Available online: https://matmatch.com/materials/minfm40680-jis-g3561-grade-swosc-v-oil-tempered?utm_term=&utm_medium=ppc&utm_campaign=%5BSD%5D+Materials+Generic&utm_source=adwords&hsa_grp=61532612146&hsa_cam=918492904&hsa_src=g&hsa_net=adwords&hsa_tgt=aud-421245424252:dsa-19959388920&hsa_ad=311442906172&hsa_mt=b&hsa_kw=&hsa_ver=3&hsa_acc=2813184419&gclid=Cj0KCQjwi7yCBhDJARIsAMWFScOMRWLAF7rUbksfRLNVQ74hC06617oBZ0-TDVCdvjRCGESv4V6pnaQaAqbWEALw_wcB (accessed on 19 May 2021).
- Pico, D.; Wilms, C.; Seide, G.; Gries, T.; Kleinholz, R.; Tiesler, H. Glass Fibers. In Ullmann’s Encyclopedia of Industrial Chemistry; Wiley-VCH: Hoboken, NJ, USA, 2012. [Google Scholar]
- Broughton, W. Environmental Induced Failure in Fibre-Reinforced Plastics; Woodhead Publishing Limited: Sawston, UK, 2012; pp. 393–432. [Google Scholar]
- Fitzer, E.; Kleinholz, R.; Tiesler, H.; Stacey, M.H.; de Bruyne, R.; Lefever, I.; Foley, A.; Frohs, W.; Hauke, T.; Heine, M.; et al. Fibers, 5. Synthetic Inorganic. In Ullmann’s Encyclopedia of Industrial Chemistry; Wiley-VCH: Hoboken, NJ, USA, 2008; Volume 10, pp. 13–15. [Google Scholar]
- Gao, S.-L.; Mäder, E.; Abdkader, A.; Offermann, P. Sizings on Alkali-Resistant Glass Fibers: Environmental Effects on Mechanical Properties. Langmuir 2003, 19, 2496–2506. [Google Scholar] [CrossRef]
- Kwana, W.H.; Cheah, C.B.; Ramli, M.; Chang, K.Y. Alkali-resistant glass fiber reinforced high strength concrete in simulated aggressive environment. Mater. Construcción 2016, 68, 1988–3226. [Google Scholar] [CrossRef]
- Roy, C.; Tim, J. Marine Geochemistry; John Wiley & Sons: Hoboken, NJ, USA, 2012. [Google Scholar]
- Yang, S.; Yu, M.; Dong, K.; Yang, Y. Properties of Alkali-Resistant Glass Fiber Reinforced Coral Aggregate Concrete. Materials 2020, 13, 3450. [Google Scholar] [CrossRef]
- Oh, H.S.; Moon, D.Y.; Kim, S.D. An investigation on durability of mixture of resistant glass and epoxy for civil engineering application. Procedia Eng. 2011, 14, 2223–2229. [Google Scholar] [CrossRef][Green Version]
- Eiras, J.N.; Kundu, T.; Bonilla, M.; Payá, J. Nondestructive Monitoring of Ageing of Alkali Resistant Glass Fiber Reinforced Cement. J. Nondestruct. Eval. 2013, 32, 300–314. [Google Scholar] [CrossRef]
- Tobler, R.L.; Read, D.T. Fatigue Resistance of a Uniaxial S-Glass/Epoxy Composite at Room and Liquid Helium Temperatures. J. Compos. Mater. 1976, 10, 32–43. [Google Scholar] [CrossRef]
- Kootsookos, A.; Mouritz, A.P. Seawater Durability of Glass- and Carbon-Polymer Composites. Compos. Sci. Technol. 2004, 64, 1503–1511. [Google Scholar] [CrossRef]
- Prabhakar, P.; Garcia, R.; Imam, M.A.; Damodaran, V. Flexural fatigue life of woven carbon/vinyl ester composites under sea water saturation. Int. J. Fatigue 2020, 137, 105641. [Google Scholar] [CrossRef]
- Alderliesten, R.C. Critical review on the assessment of fatigue and fracture in composite materials and structures. Eng. Fail. Anal. 2013, 35, 370–379. [Google Scholar] [CrossRef]
- Tual, N.; Carrere, N.; Davies, P.; Bonnemains, T.; Lolive, E. Characterization of sea water ageing effects on mechanical properties ofcarbon/epoxy composites for tidal turbine blades. Composites 2015, 78, 380–389. [Google Scholar] [CrossRef]
- Davies, P.; Le Gac, P.Y.; Le Gall, M. Influence of Sea Water Aging on the Mechanical Behaviour of Acrylic Matrix Composites. Appl. Compos. Mater. 2016, 24, 97–111. [Google Scholar] [CrossRef]
- Stevanović, M.M.; Stecenko, T.B. Mechanical behaviour of carbon and glass hybrid fibre reinforced polyester composites. J. Mater. Sci. 1992, 27, 941–946. [Google Scholar] [CrossRef]
- El-Wazery, M.; El-Elamy, M.; Zoalfakar, S. Mechanical properties of glass fiber reinforced polyester composites. Int. J. Appl. Sci. Eng. 2017, 14, 121–131. [Google Scholar]
- Murthy, H.N.; Sreejith, M.; Krishna, M.; Sharma, S.; Sheshadri, T. Seawater Durability of Epoxy/Vinyl Ester Reinforced with Glass/Carbon Composites. J. Reinf. Plast. Compos. 2010, 29, 1491–1499. [Google Scholar] [CrossRef]
- Davies, P.; Rajapakse, Y.D. Durability of Composites in a Marine Environment; Springer: Berlin/Heidelberg, Germany, 2014; Volume 208. [Google Scholar]
- Meng, M. Effects of Marine Environment Exposure on the Static and Fatigue Mechanical Properties of Carbon Fibre-Epoxy Composite. Master’s Thesis, University of Plymouth, Plymouth, UK, January 2016. [Google Scholar]
- Thomasnet. Types of Spring Materials. 2021. Available online: https://www.thomasnet.com/articles/metals-metal-products/types-of-spring-materials/ (accessed on 21 June 2021).
- Murphey, T.; Pellegrino, S. A Novel Actuated Composite Tape-Spring For Deployable Structures; American Institute of Aeronautics and Astronautics: Reston, VA, USA, 2004. [Google Scholar]
- Mahdi, E.; Hamouda, A. An experimental investigation into mechanical behavior of hybrid and nonhybrid composite semi-elliptical springs. Mater. Des. 2013, 52, 504–513. [Google Scholar] [CrossRef]
- Abu Talib, A.R.; Ali, A.; Goudah, G.; Che Lah, N.A.; Golestaneh, A.F. Developing a composite based elliptic spring for automotive applications. Mater. Des. 2009, 31, 475–484. [Google Scholar] [CrossRef][Green Version]
- Ekanthappa, J.; Basavarajappa, S.; Shankar, G.S.S. Fabrication & Experimentation of the Glass-Epoxy Helical Spring Reinforced With Graphite Powder. Adv. Mater. Manuf. Manag. Therm. Sci. 2016, 4, 11034–11038. [Google Scholar]
- Shams, S.; Yang, P.; Elhajjar, R. Damage Initiation and Fatigue Behavior of Carbon-Fiber Composite Disk Springs. SAE Int. J. Mater. Manuf. 2016, 9, 181–186. [Google Scholar] [CrossRef]
- Mahanthi, D.L.; Siva Murali, C.V. Design and Analysis of Composite Leaf Spring for Light Weight Vehicle. Int. J. Adv. Eng. Res. Sci. 2017, 4, 147–152. [Google Scholar] [CrossRef]
- Agrawal, H. Manufacturing & Testing of Composite Hybrid Leaf Sprign for Automotive Applications. Master’s Thesis, Purdue University, West Lafayette, IN, USA, 2019. [Google Scholar]
- Waldhart, C. Analysis of Tow-Placed, Variable-Stiffness Laminates. Master’s Thesis, Virginia Polytechnic Institute and State University, Blacksburg, VA, USA, 1996. [Google Scholar]
- Nagendra, S.; Kodiyalam, S.; Davis, J.; Parthasarathy, V. Optimization of tow fiber paths for composite design. In Proceedings of the AIAA/ASME/ASCE/AHS/ASC Structures, Structural Dynamics, and Materials Conference, New Orleans, LA, USA, 10–13 April 1995; pp. 1031–1041. [Google Scholar]
- Blom, A.W.; Abdalla, M.M.; Gürdal, Z. Optimization of course locations in fiber-placed panels for general fiber angle distributions. Compos. Sci. Technol. 2010, 70, 564–570. [Google Scholar] [CrossRef]
- Lopes, C.S.; Camanho, P.P.; Gürdal, Z.; Tatting, B.F. Progressive failure analysis of tow-placed, variable-stiffness composite panels. Int. J. Solids Struct. 2007, 44, 8493–8516. [Google Scholar] [CrossRef]
- Blom, A.W.; Stickler, P.B.; Gurdal, Z. Design and Manufacture of a Variable-Stiffness Cylindrical Shell. In Proceedings of the SAMPE Europe 30th International Conference, Bristol, UK, 17–18 September 2009. [Google Scholar]
- Wu, K.; Tatting, B.; Smith, B.; Stevens, R.; Occhipinti, G.; Swift, J.; Achary, D.; Thornburgh, R. Design and Manufacturing of Tow-Steered Composite Shells Using Fiber Placement. In Proceedings of the 50th AIAA/ASME/ASCE/AHS/ASC Structures, Structural Dynamics, and Materials Conference, Palm Springs, CA, USA, 4–7 May 2009. [Google Scholar]
- Tatting, B.; Gurdal, Z.; Jegley, D. Design and Manufacture of Elastically Tailored Tow Placed Plates. 2002. Available online: https://www.researchgate.net/publication/24326440_Design_and_Manufacture_of_Elastically_Tailored_Tow_Placed_Plates (accessed on 21 July 2021).
- Fagiano, C. Computational Modeling of Tow-Placed Composite Laminates with Fabrication Features. 2010. Available online: https://repository.tudelft.nl/islandora/object/uuid%3A2167995f-ee67-49f2-bbbb-e6787399f822 (accessed on 1 July 2021).
- Blom, A.W.; Lopes, C.; Kromwijk, P.J.; Gurdal, Z.; Camanho, P. A Theoretical Model to Study the Influence of Tow-drop Areas on the Stiffness and Strength of Variable-stiffness Laminates. J. Compos. Mater. 2009, 43, 403–425. [Google Scholar] [CrossRef]
- Nash, N.H.; Young, T.; McGrail, P.; Stanley, W. Inclusion of a thermoplastic phase to improve impact and post-impact performances of carbon fibre reinforced thermosetting composites—A review. Mater. Des. 2015, 85, 582–597. [Google Scholar] [CrossRef]
- Zhang, J.; Xie, X. Influence of addition of silica particles on reaction-induced phase separation and properties of epoxy/PEI blends. Compos. Part B Eng. 2011, 42, 2163–2169. [Google Scholar] [CrossRef]


| Inventors | Title of Patent | Pub. No. | Functions | Applicable to Point-Absorber WECs |
|---|---|---|---|---|
| Steven John Leverette, Richmond; Jack Pollack, Camarillo [16] | In-line mooring connector and tensioner | US 2014/0026796 A1 | Improvement of mooring systems for offshore vessels, enabling the adjustment of the length and tension of the mooring lines. | No |
| Richard Taylor [17] | Mooring tensioner and methods thereof | WO2018025018A1 | Improvement of mooring systems for offshore structures to avoid costly and time-intensive installation of a winch on each structure. | No |
| Lisland Torkjell [18] | Mooring pulley tensioning system | EP3251942B1 | The aim of this patent application was to provide arrangements and methods with little or no requirement for equipment on the deck of the vessel that are still be able to perform installation, tensioning, re-tensioning, repositioning, and replacement operations. | No |
| Thomas C. Bauer [19] | Systems and methods for tensioning mooring lines at the seafloor | US9487272B2 | Systems and methods are disclosed for deploying one or more anchor piles on the seafloor using submersible line tensioning systems and techniques to achieve the tensioning of mooring lines at the seafloor rather than at the conventional vessel deck level. | No |
| Design Criteria of Mooring Tensioner | Applications of Mooring Tensioner | ||||
|---|---|---|---|---|---|
| Offshore WEC | Offshore Wind Farm | Offshore Oil Rig and Platform | Boat | Fish Cage | |
| Importance of minimizing cost | Moderate | Moderate | Moderate | Very important | Very important |
| Specific strain energy | High specific strain energy to maximize efficiency of electricity generation. | Suitable specific strain energy to dissipate wave energy and increase the durability of the mooring system. | |||
| Durability | Good durability is required due to relatively large loads and difficult access to mooring system for maintenance. | Cost effectiveness is prioritized because of relatively lighter loads and easy access to mooring system for maintenance. | |||
| Type of Fiber in UD Epoxy Composite | Fiber Volume Fraction for Static Properties | Density | Price | Young’s Modulus | Static Ultimate Strength (MPa) | Fiber Volume Fraction for Fatigue Properties | Fatigue Strength under Dry Conditions at 300,000 Cycles (MPa) | Fatigue Strength under Dry Conditions at 106 cycles (MPa) | |||||||
|---|---|---|---|---|---|---|---|---|---|---|---|---|---|---|---|
| % | kgm−3 | $/kg | Axial GPa | Bending GPa | Tension | Compression | Reference | % | R = 0 | R = 10 | Reference | R = 0 | R = 10 | Reference | |
| Aksaca A–42 carbon fiber | N/A 4 | 1568 1 | N/A | 145.4 1 | N/A | 2547 1 | N/A | [46] | N/A | 560 R = 0.1 | 360 | [40] | 550 R = 0.1 | 350 | [40] |
| T1000G | 60 | 1550 | 65 | 165 | 145 | 3040 | 1570 | [40,47] | N/A | 2430 | 1260 | [48,49,50] | N/A | N/A | [45] |
| T700S | 60 | 1530 | 50 | 135 | 120 | 2550 | 1470 | [51,52] | N/A | 2040 | 1180 | [48,49,50] | N/A | N/A | [45] |
| T800H | 60 | 1550 | 60 | 160 | 150 | 2840 | 1570 | [52,53] | N/A | 2270 | 1260 | [48,49,50] | N/A | N/A | [45] |
| E Glass | 60 | 2000 | 6 | 44.1 | 43 | 1030 | 750 | [54,55] | 63.4 [56] | 350 | 200 | [56,57] | 320 | N/A | [31] |
| S2 Glass | 57–63 [48] | 1990 | 20 | 56 | 47 | 1800 | 950 | [58,59] | 57–63 [48] | 550 | 475 | [48,60] | 540 (R = 0.05) | N/A | [48] |
| R Glass | 60 | 1945 1 | N/A | 54 | 46.6 2 | 1420 3 | N/A | [61] | N/A | N/A | N/A | [61] | N/A | N/A | [61] |
| Aramid | 41 | 1284 1 | 40 | 65 | 65 5 | 1250 | 230 | [62] | N/A | 650 | 120 | [48,49,50] | N/A | N/A | [48,49,50] |
| Spring steel | N/A | 7810 | 2 | 210 | 210 | 1600 | 1600 | [45,63] | N/A | 800 | 800 | [30,45] | N/A | N/A | [30,45] |
| Type of Composite | Conditions of Immersion | Typical Modulus of Elasticity (GPa) | Degradation of Fiber Mechanical Properties in Seawater | Theories of Degradation in Seawater |
|---|---|---|---|---|
| E-glass/epoxy | Seawater | 73 [66] | Very high | Alkali ions (such as NaOH–) are leached out from the fiber surface and replaced by protons (such as H+ ions). This results in alkali oxides being leached out and the formation of surface microcracks in E-glass in seawater [65]. |
| S-glass/epoxy | 85.5 [66] | Moderate | Higher strength and better alkaline resistance than E-glass [65]. | |
| R-glass/epoxy | 86 [66] | Moderate | Higher strength and better alkaline resistance than E-glass [65]. | |
| Alkali resistant (AR) glass fiber/epoxy [67] | 5wt% NaOH aqueous solution [67] | 76 [66] | N/A (no comparison with other fibers) | Alkaline resistance of AR glass fiber is higher than that of E-glass because it contains more than 10% zirconia (ZrO2) as a component of its molecular structure [68]. |
| ECR-glass/epoxy | Seawater | 72 [66] | Moderate | Superior acid resistance compared to E-glass, but only slightly more resistant to alkalis [66]. |
| Carbon fiber/epoxy | 140 [28] | Low | Carbon fibers do not react with seawater and their properties do not change for the temperature range of −60 °C to 200 °C [43]. |
| Reference | Type of Spring | Type of Composite | Manufacturing Method | Applications | Advantages |
|---|---|---|---|---|---|
| [45] | Composite spiral springs. | S2 glass/epoxy UD and T700S carbon fiber/epoxy UD prepreg. | S2 glass/epoxy spiral spring was constructed by manual impregnation. Carbon fiber/epoxy spiral spring was constructed by prepreg layup and autoclave cure. | Energy storage and power handling systems. | Can store mechanical energy. |
| [86,87] | Composite semi-elliptical and elliptical springs. | Woven roving glass/epoxy and carbon fiber/epoxy composite. | Woven roving fabric passed through a resin bath and was then applied onto a wooden mandrel to form a semi-elliptical spring. Cured at room temperature for 24 h. | Novel automotive suspension spring design instead of existing leaf or coil composite spring. | The failure is dominated by the compressive and tensile loading of fibers instead of being dominated by the matrix like a leaf spring. |
| [4] | Composite helical springs. | Carbon fiber tow (Toray®, T300-3K)/epoxy resin. | Vacuum-assisted resin infusion method. | Automotive suspension spring. | Adjustable spring constant can be achieved by changing volume fraction of fiber, type of fibers and matrices, and geometry of spring. |
| [88] | Composite helical springs. | Glass/epoxy with addition of graphite powder. | Filament-winding technique. | Automotive suspension spring. | Weight reduction and fuel saving for car users. Filament-winding method minimizes the labor cost. |
| [89] | Disk Springs. | Carbon fiber/epoxy composite. | Hand lay up of prepreg, cured at 121 °C. | Automotive suspension spring. | Superior mechanical properties under flexural loading conditions. |
| [85] | Tape springs. | Carbon fiber/epoxy composite. | Fabrication of curved lamina, fabrication of coiled lamina, and fabrication of lamina bonding. | N/A. | Novel conceptual design. |
| [3,90,91] | Composite leaf springs. | E glass fiber/epoxy composite. | High-pressure resin transfer molding and hand layup of the unidirectional prepreg on mold. | Automotive suspension spring. | Superior specific strength and stiffness, strong load carrying capacity and fatigue characteristics. |
| Manufacturing Method of Composite Springs | Advantages | Disadvantages | Limitations |
|---|---|---|---|
| Vacuum-assisted resin infusion |
|
|
|
| High-pressure resin transfer molding (RTM) |
|
|
|
| Filament winding |
|
|
|
| Automated fiber placement (AFP) |
|
|
|
Publisher’s Note: MDPI stays neutral with regard to jurisdictional claims in published maps and institutional affiliations. |
© 2022 by the authors. Licensee MDPI, Basel, Switzerland. This article is an open access article distributed under the terms and conditions of the Creative Commons Attribution (CC BY) license (https://creativecommons.org/licenses/by/4.0/).
Share and Cite
Cai, Y.; Bazli, M.; Basnayake, A.P.; Veidt, M.; Heitzmann, M.T. Composite Springs for Mooring Tensioners: A Systematic Review of Material Selection, Fatigue Performance, Manufacturing, and Applications. J. Mar. Sci. Eng. 2022, 10, 1286. https://doi.org/10.3390/jmse10091286
Cai Y, Bazli M, Basnayake AP, Veidt M, Heitzmann MT. Composite Springs for Mooring Tensioners: A Systematic Review of Material Selection, Fatigue Performance, Manufacturing, and Applications. Journal of Marine Science and Engineering. 2022; 10(9):1286. https://doi.org/10.3390/jmse10091286
Chicago/Turabian StyleCai, Yuanzhen, Milad Bazli, Asanka P. Basnayake, Martin Veidt, and Michael T. Heitzmann. 2022. "Composite Springs for Mooring Tensioners: A Systematic Review of Material Selection, Fatigue Performance, Manufacturing, and Applications" Journal of Marine Science and Engineering 10, no. 9: 1286. https://doi.org/10.3390/jmse10091286
APA StyleCai, Y., Bazli, M., Basnayake, A. P., Veidt, M., & Heitzmann, M. T. (2022). Composite Springs for Mooring Tensioners: A Systematic Review of Material Selection, Fatigue Performance, Manufacturing, and Applications. Journal of Marine Science and Engineering, 10(9), 1286. https://doi.org/10.3390/jmse10091286