Article

Primary Factors Affecting the Efficiency of Thermoelectric Power Generation Sheets for Waste-Heat Recovery from the Ship’s Exhaust Gas

Merchant Marine College, Shanghai Maritime University, Shanghai 201306, China
*
Author to whom correspondence should be addressed.
J. Mar. Sci. Eng. 2022, 10(9), 1281; https://doi.org/10.3390/jmse10091281
Submission received: 30 August 2022 / Accepted: 8 September 2022 / Published: 11 September 2022
(This article belongs to the Special Issue Sustainable Development Goals — Marine Renewable Energy)

Abstract

:
In order to investigate the effect of different influencing factors on the application of temperature differential power generation in the ship exhaust gas and to explore the potential of waste heat recovery and the utilization of exhaust gas during ship travel, an experimental system based on the temperature differential power generation of ship exhaust gas in the marine environment was established. The maximum output power and the maximum efficiency of each temperature-difference power generation module were theoretically calculated. The results showed that the insulation material and the salt water (seawater) had little effect on the efficiency of the temperature differential power generation modules. Conversely, the installation pressure, the heat transfer oil, the cooling water temperature (seawater temperature), and the heat source temperature (exhaust gas pipe temperature) had a great influence on the open-circuit voltage and the maximum output power. The thermally conductive silicone grease and the cooling water temperature of 10 °C increased the open-circuit voltage by 31.54% and 18.95%, respectively, and increased the maximum output power by 82.05% and 51.79%, respectively. The maximum output of a single temperature differential power generator reached 63.5% when using an installation pressure of 3 bar, a cooling water temperature of 20 °C, double-layer aluminum insulation, and thermally conductive silicone grease. Finally, this study provides relevant data support for using temperature differential power generation devices for ship exhaust gas.

1. Introduction

As one of the main modes of transportation in world trade, ships have less than 50% energy utilization efficiency. Therefore, the recycling of a ship’s waste heat is one of the effective ways to improve energy utilization efficiency and reduce carbon emissions [1].
Many researchers investigated the use of an Organic Rankine Cycle (ORC) system to recover heat from the exhaust gases of diesel engines in a passenger car over a Real Driving Emissions (RDE) cycle [2,3,4,5]. Ng and Tam [6] reported that PTG–STG combined systems (power turbine generator (PTG) and steam turbine generator (STG) combined systems) were installed onboard more than 100 ships. Ding Luo et al. [7] designed a thermoelectric generator for recovering waste engine heat. The results showed that the design of the inclination angle significantly improved the Reynolds number, the convective heat transfer coefficient of the exhaust gas, and the hot side temperature of the thermoelectric module. Lim et al. [8,9,10,11] constructed an ORC system using the jacketed cooling water of a high-pressure dual-fuel (ME-GI) engine as a heat source and the cold energy of LNG as a heat sink. They tested R170, R134a, R290, and R123 working fluids, with the highest thermal efficiency achieved with the working substance R123.
Kober et al. [12] used the World Light Vehicle Test Program (WLTP) cycle, finding that hybrid vehicles have the greatest potential for waste heat recovery. Kober M. [13] demonstrated that the higher the efficiency of the internal combustion engine, the higher the energy in the exhaust gas of the Hybrid Electrical Vehicles (HEVs), and the higher the efficiency of power generation. Ezzitouni S. et al. [14] proposed a model to predict the power generation efficiency of automotive thermoelectric generators at different operating points. However, under heterogeneous thermal surface conditions, the interconnection of thermoelectric modules negatively affects electrical energy by more than 17%. Heber et al. [15] designed a radially distributed heat exchanger and tested it on a 1.8L diesel engine with a maximum thermoelectric power output of 40 W.
Thermoelectric power generation is one of the ways to improve the economy of marine power plants. In this paper, a temperature differential power generation sheet was designed and the effects of different influencing factors on its performance were analyzed, simulating the conditions of a ship’s tailpipe application. For the first time, the effect of aluminum foil insulation paper and TS thermal conductive silicone grease on the performance of this temperature-difference power generation sheet was measured. In addition, the better power generation and efficiency were derived to lay the foundation for the actual application in the ship’s tailpipe.

2. Theory

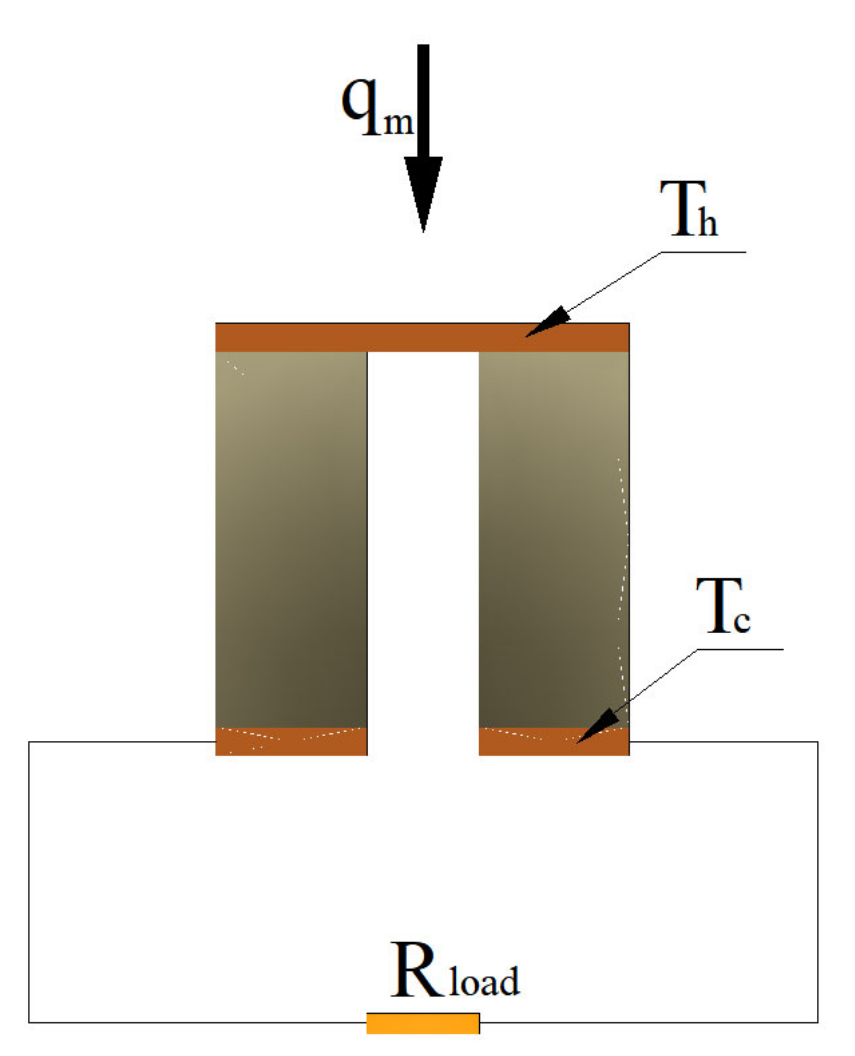
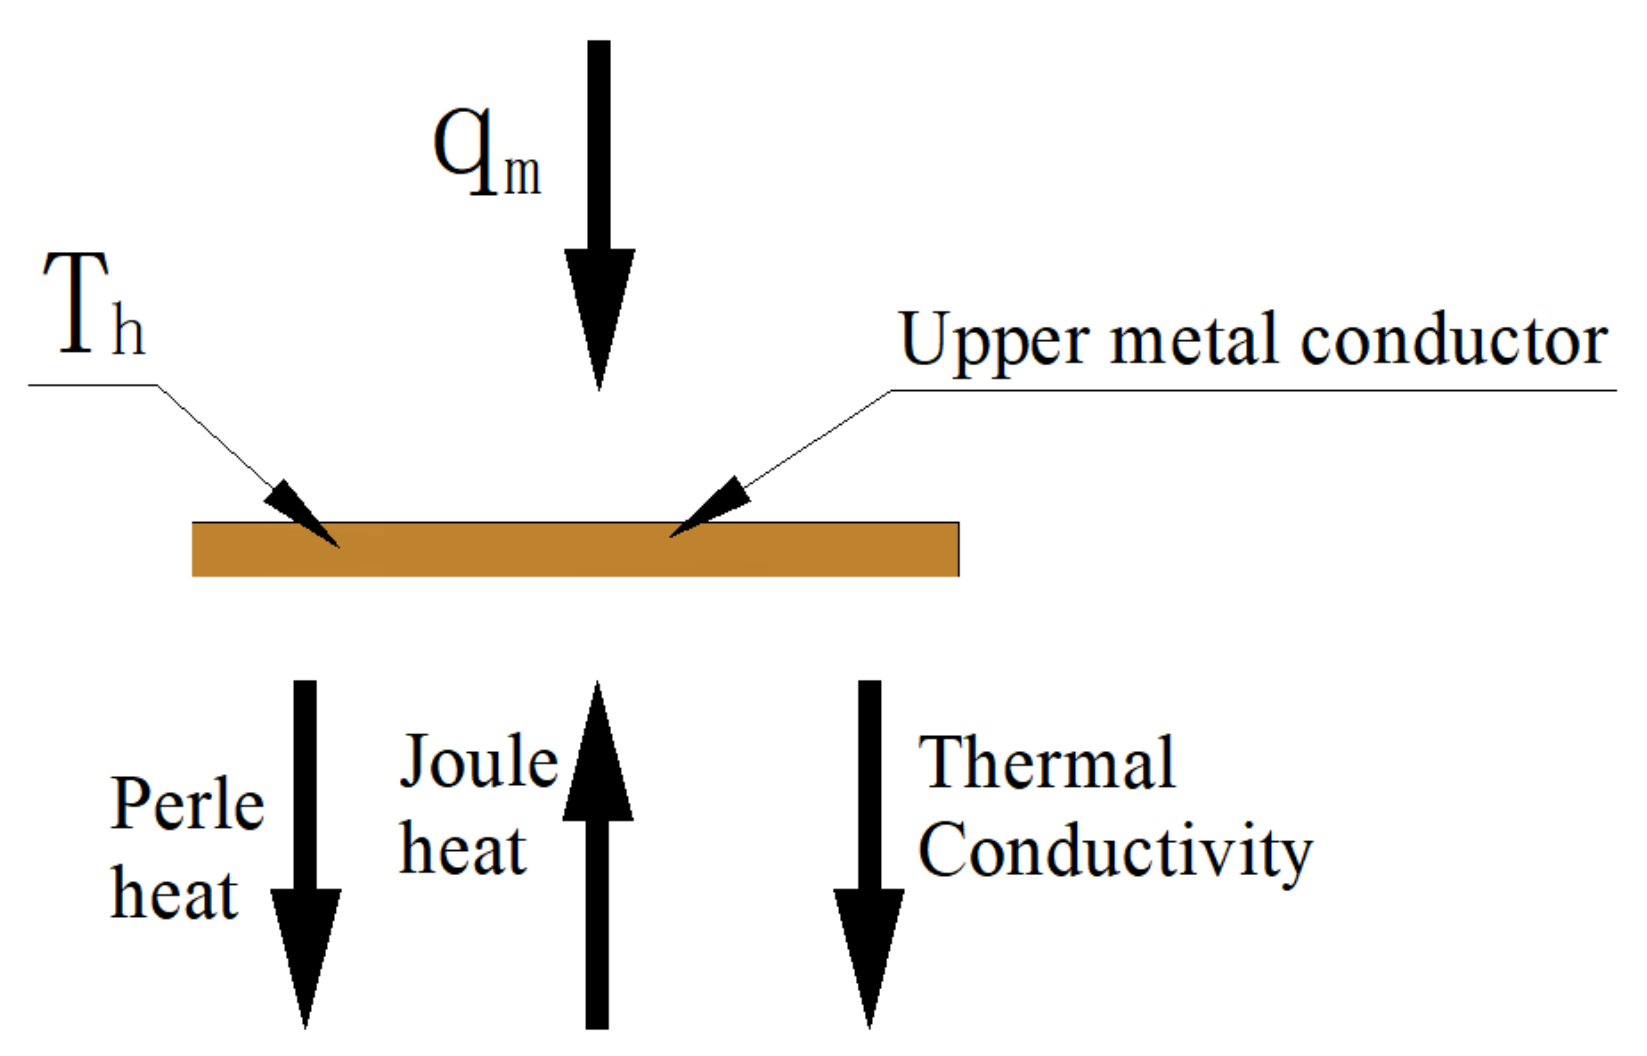
2.1. Theoretical Foundations

Assuming that Tc is the temperature at the cold end of the temperature differential generator and Th is the temperature at the hot end, the temperature difference between the cold end and the hot end of the temperature differential generator is defined as:
Δ T = T h T c
The electric potential of this temperature difference can be expressed as:
U = α m · Δ T
α m = α P α N
where αP is the Seebeck coefficient for P-type semiconductor materials, αN is the Seebeck coefficient for N-type semiconductor materials, and αm is the Seebeck coefficient for temperature differential generation in the unit of V/K.
The thermoelectric properties of a material are generally expressed in terms of the thermoelectric formula of merit Z.
Z = S 2 σ k
where σ is the electrical conductivity, k is the thermal conductivity, and S is the Seebeck coefficient. The thermoelectric properties of material vary at different ambient temperatures.
The maximum power output is obtained when the external resistance Rload is equal to the resistance Rint inside the temperature-difference generating sheet [16].
R l o a d = R i n t
In the actual experimental process, with the increasing temperature difference between the hot and cold ends, the maximum output power point will appear when the internal resistance of the temperature-difference generator is not equal to the load and the difference between the basic load resistance and the internal resistance will have a maximum value within 15%. Due to the limitations of the experimental conditions, the load resistance is manually adjusted within this range to observe the change in output power and record the maximum output power value; the maximum value of output power displayed by the power tester is the maximum output power.

2.2. Theoretical Models and Calculations

The internal structure of a temperature differential power generation sheet is shown in Figure 1. The temperature differential power generation sheet consists of P-type and N-type semiconductors, cold-end and hot-end ceramic sheets, and metal conductors. Npn pairs of P-type and N-type semiconductors are connected in series. Moreover, the P-type and the N-type semiconductors are connected to each other with a metal conductor. The metal conductors are covered with ceramic sheets on the outside.
In this paper, the thermal resistance of the cold-end ceramic sheet, the hot-end ceramic sheet, and the metal conductor were ignored so that Th is the upper metal conductor temperature and Tc is the lower metal conductor temperature. qh is the amount of heat extracted per unit time using a temperature differential power module for Nm pairs of P-type and N-type semiconductors. In addition, qh/Nm represents the average amount of heat flowing into each pair of semiconductors per unit of time. The following model is developed for a pair of P-type and N-type semiconductors.
A pair of P-type and N-type semiconductors are connected to a load of resistance Rload to form a simple temperature differential power generation device circuit as shown in Figure 2.
qm represents the heat flowing into a metal conductor per unit of time and Rint represents the internal resistance of the P-type and N-type semiconductors. According to Equations (1) and (2), a pair of P-type and N-type semiconductors produce a voltage of:
U = α m Δ T = α m ( T h T c )
where αm is the Seebeck coefficient of the temperature differential power unit in V/K. The current I in the circuit is defined as:
I = U R l o a d + R i n t = α m ( T h T c ) R l o a d + R i n t
The output power Pm of a pair of P-type and N-type semiconductors is calculated as follows:
P m = I 2 R l o a d = [ α m ( T h T c ) R l o a d + R i n t ] 2 R l o a d
The energy analysis of the upper metal conductor is shown in Figure 3.
The Joule heat qJ is the energy per unit of time entering a metallic conductor while qm is the heat transferred into a metallic conductor. Moreover, the Perle heat qp represents the energy flowing out of a metallic conductor and qc,o represents the heat carried away by the heat conduction. Then, there is:
q m = q p + q c , o q J
For the Joule heat generated in the loop, half of it flows into the hot end and the other half flows into the cold end. Therefore, the Joule heat flowing into the upper metal conductor is:
q J = 1 2 I 2 R i n t = 1 2 [ α m ( T h T c ) R l o a d + R i n t ] 2 R i n t
The rate of exothermic Q is related to the Perle heat coefficient of the conductor and the current in the circuit and is defined as:
Q = π m I
where πm is the Perle heat factor in W/A and I is the current in A.
Thomson established the link between the Seebeck and the Perle heat effects as a Kelvin relationship, as follows:
α m = π m T h
By combining Equations (7), (11), and (12), the Perle heat post can be obtained.
q p = α n T h I = α m 2 ( T h T c ) T h R l o a d + R i n t
where αn is the Seebeck coefficient for the relative cells of P-type and N-type semiconductors, V/K.
The heat removed per unit time with thermal conduction is calculated as follows:
q c , o = ( T h T c ) R n
where Rn (K/W) is the thermal resistance of P-type and N-type semiconductors.
Substituting Equations (10), (13), and (14) with Equation (9) gives the following equation:
q m = α m 2 ( T h T c ) T h R l o a d + R i n t + T h T c R n 1 2 α m ( T h T c ) R l o a d + R i n t 2 R i n t
When the internal resistance and the external resistance are equal, the output power reaches its maximum value. That is, when Rload = Rint, the output power is maximum and equal to:
P m , m a x = α m ( T h T c ) R l o a d + R i n t 2 R l o a d = α m 2 ( T h T c ) 2 4 R i n t
At this point, qm,max is the amount of heat per unit time flowing into the deflector:
q m , m a x = α m 2 ( T h T c ) T h 2 R i n t + T h T c R n α m 2 ( T h T c ) 2 8 R i n t
Similarly, for a temperature differential power generation piece made of Nm pairs of P-type and N-type semiconductors connected in series, its internal resistance and external resistance are equal when the external resistance is: R = Nm × Rint. PT is the maximum output power of a temperature differential piece:
P T = N m P m , m a x = N m α m 2 T h T c 2 4 R i n t
qT is the heat flow per unit time into the temperature differential generator:
q T = N m × q m , m a x = N m × α m 2 ( T h T c ) T h 2 R i n t + N m ( T h T c ) R n N m × α m 2 ( T h T c ) 2 8 R i n t
when PT is the maximum output power. At this point, ηT is the maximum efficiency of the temperature-difference power generator.
η T = P T q T

2.3. The Temperature-Difference Power Module

The type of temperature-difference power generation sheet selected is TGM-336-1.4-1.5. Its length, width, and height are 54, 62, and 4.2 mm, respectively. It is composed of 199 pairs of P-N junctions connected in series. It has a maximum operating temperature of 200 °C, an internal resistance of 4.6 Ω at 22 °C, an output voltage of 12.2 V, an output current of 1.65 A, an output power of 20.13 W, a thermoelectric conversion efficiency of 5.1%, and a thermal resistance of 0.85 W/K. The temperature-difference power generation sheet is shown in Figure 4.

3. Performance of the Influencing Factors

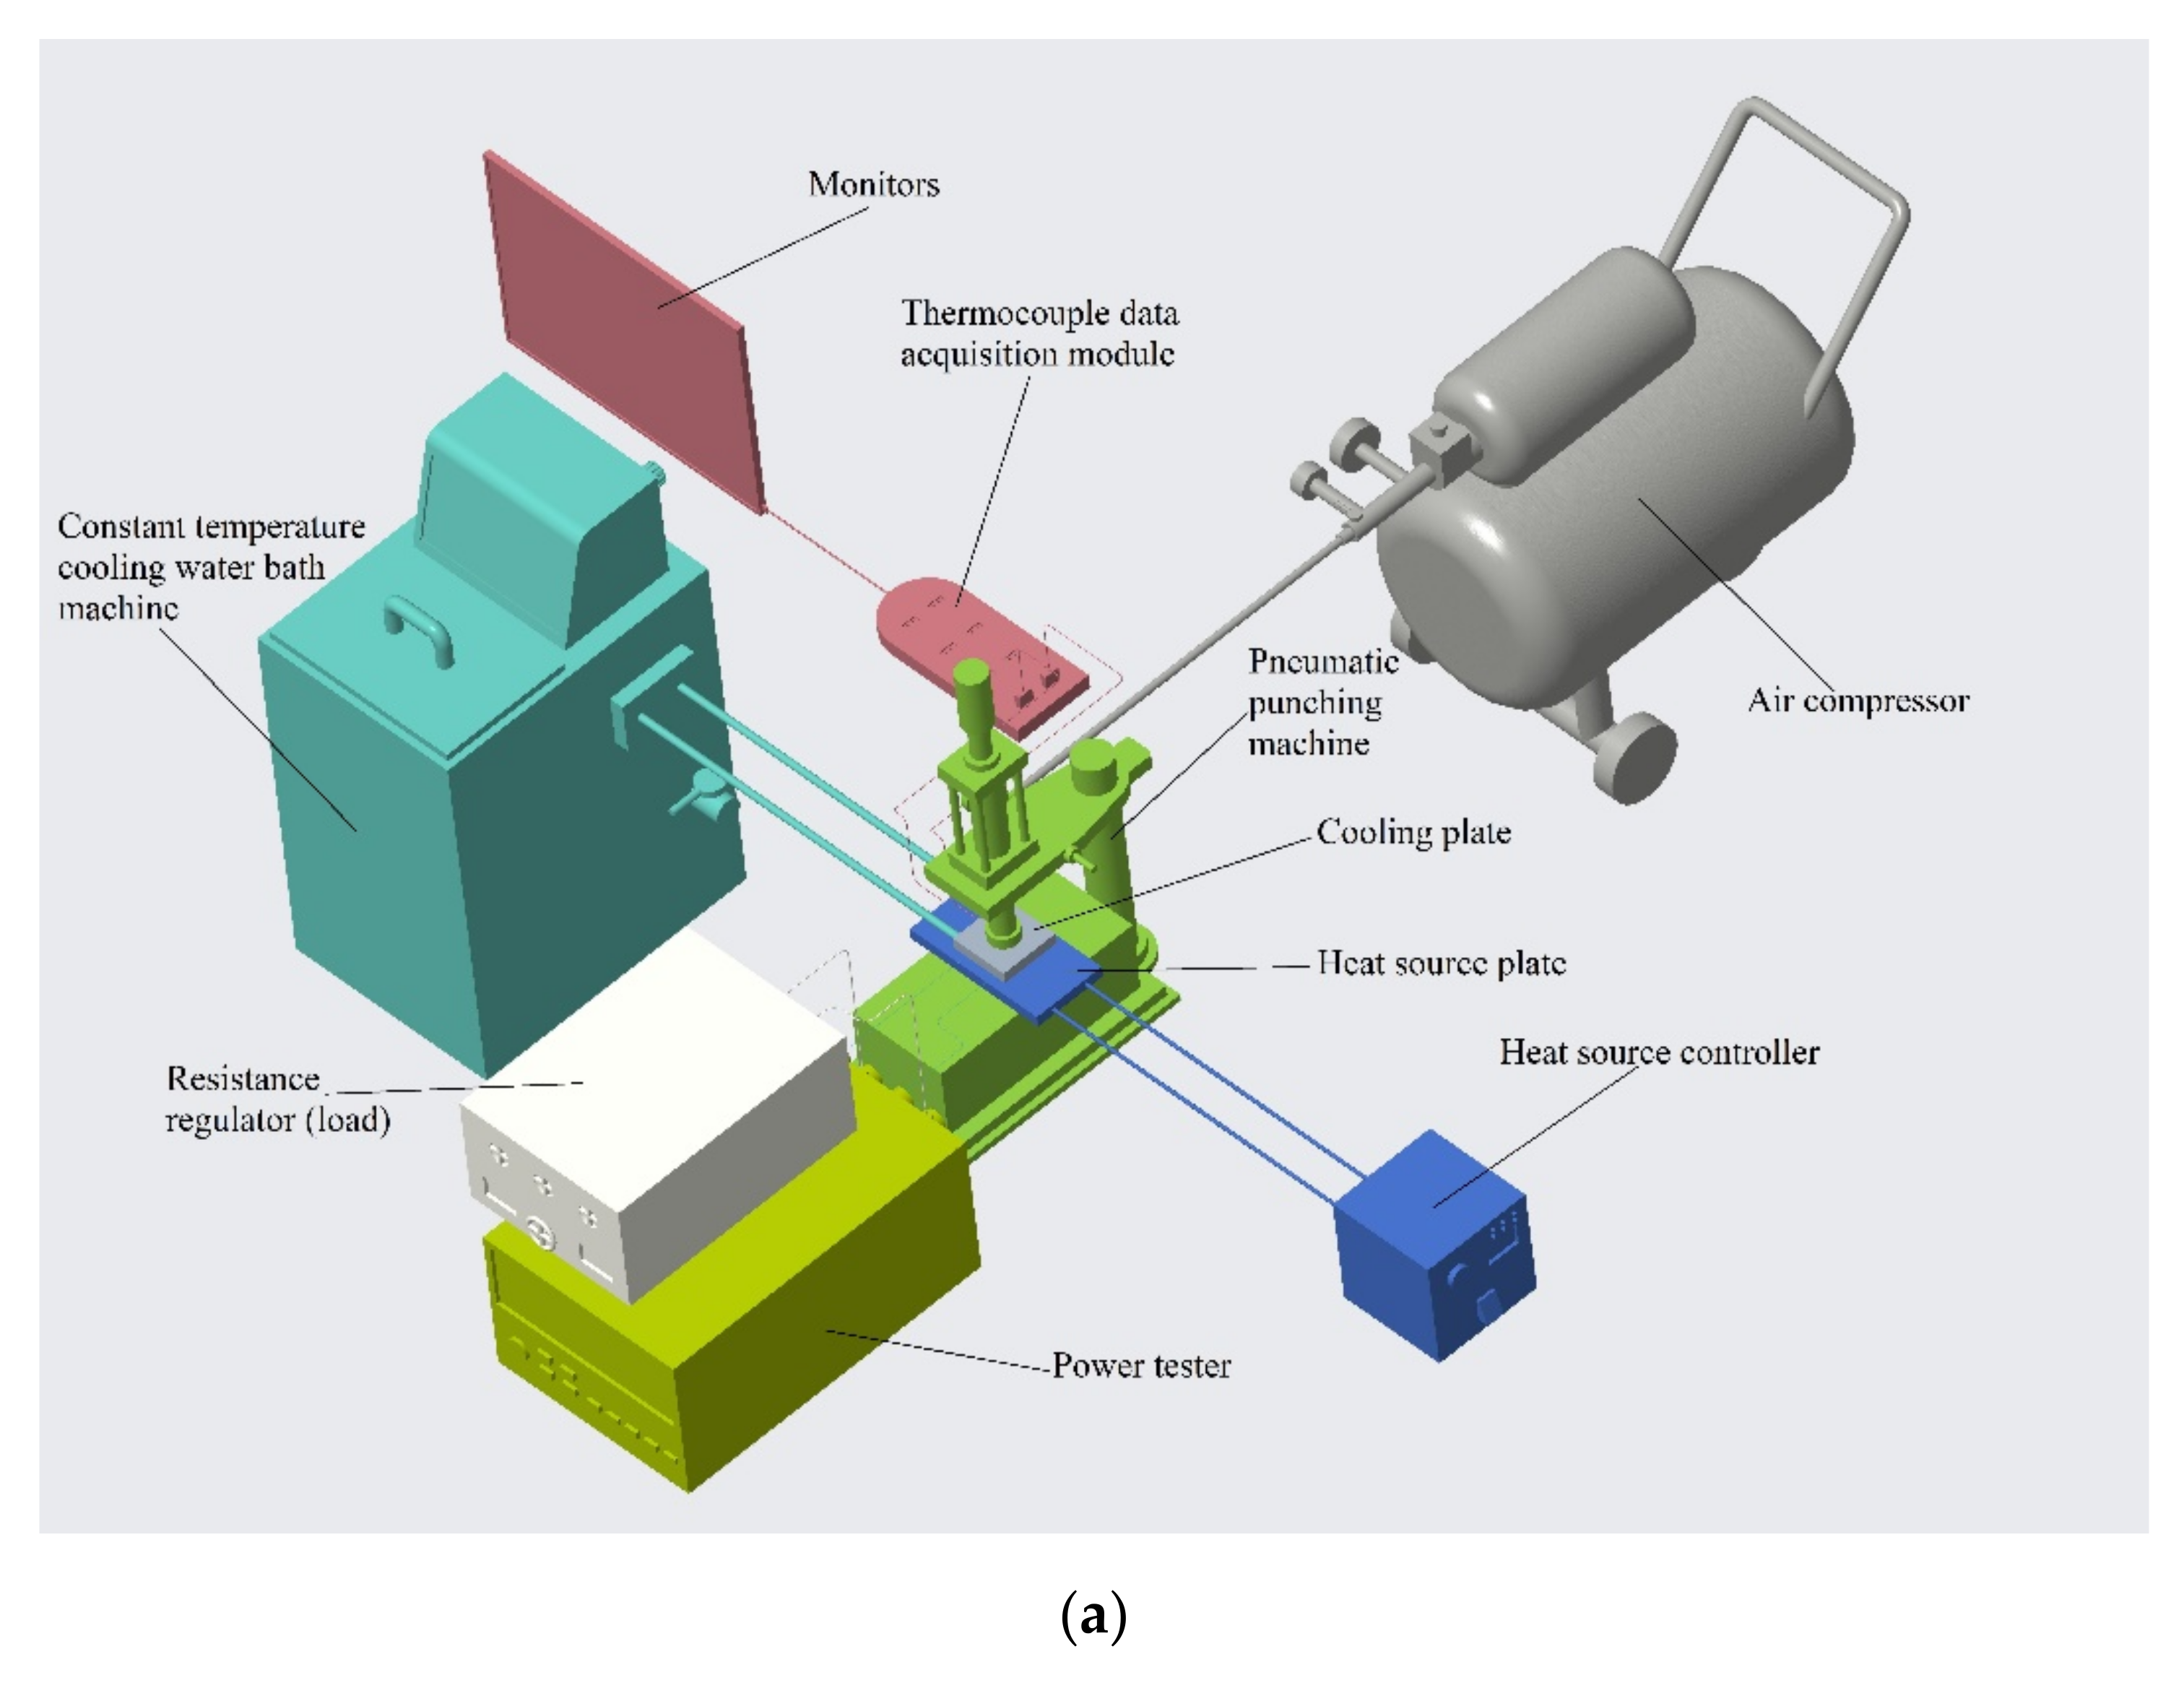
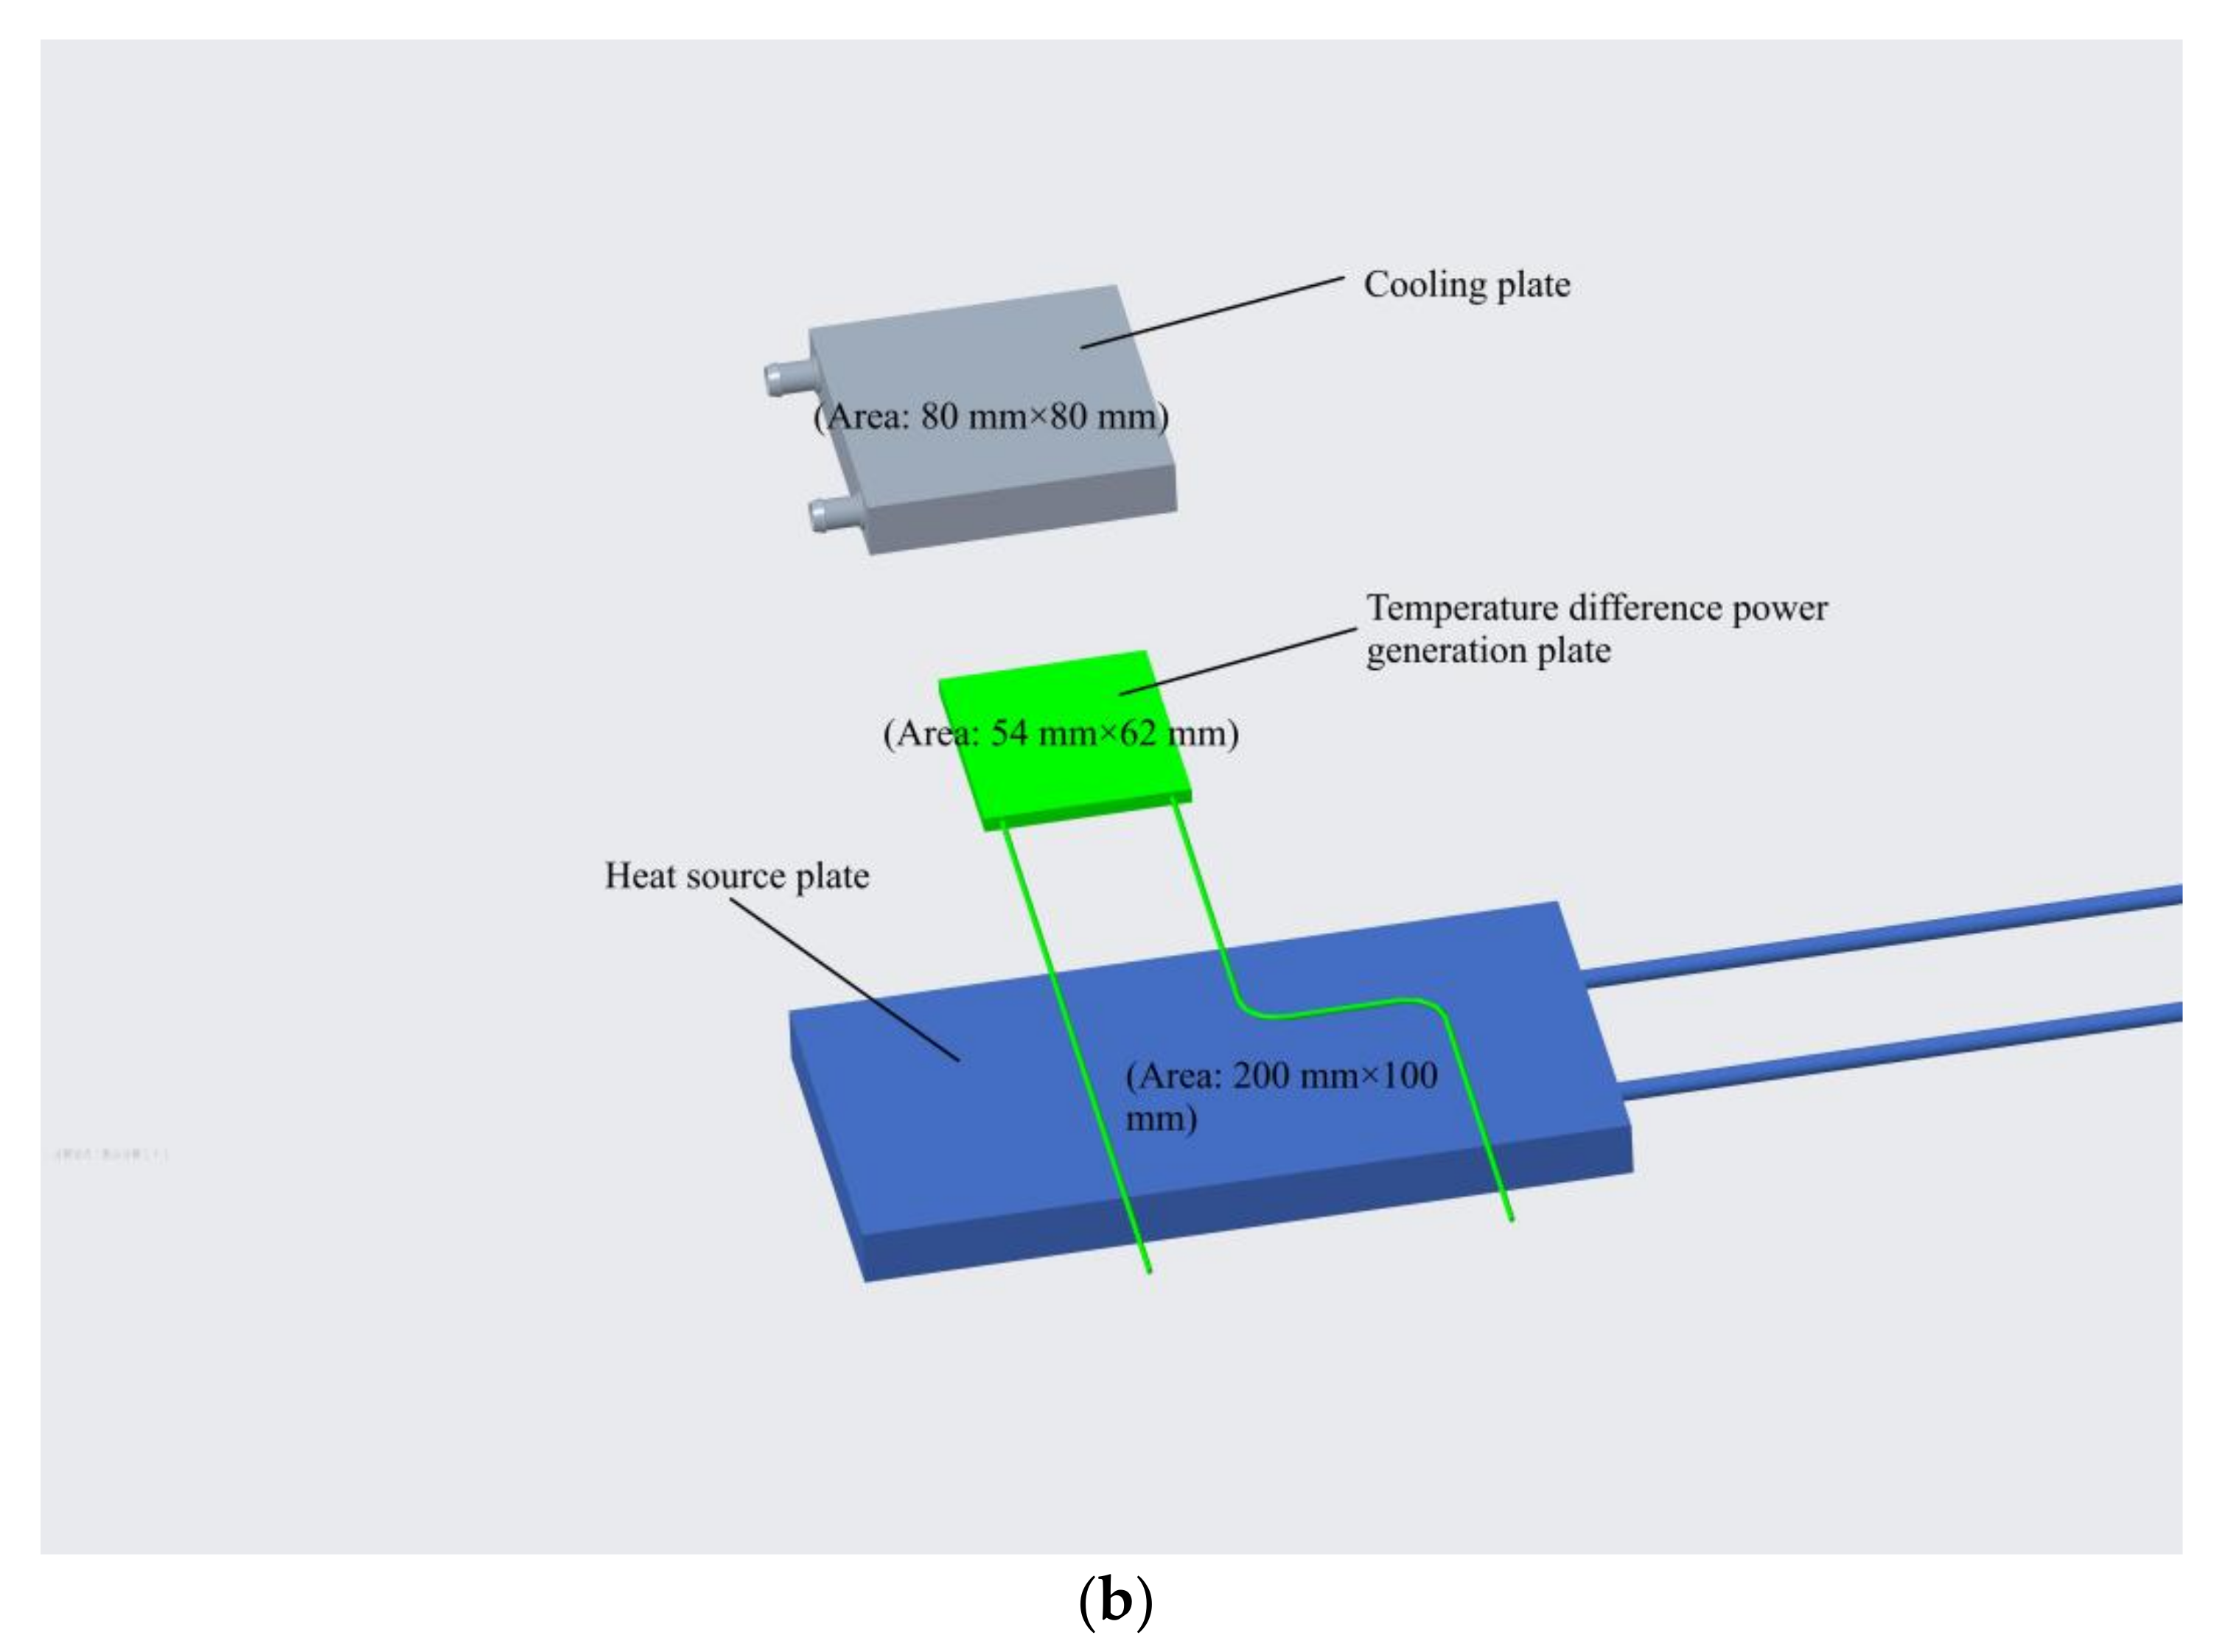
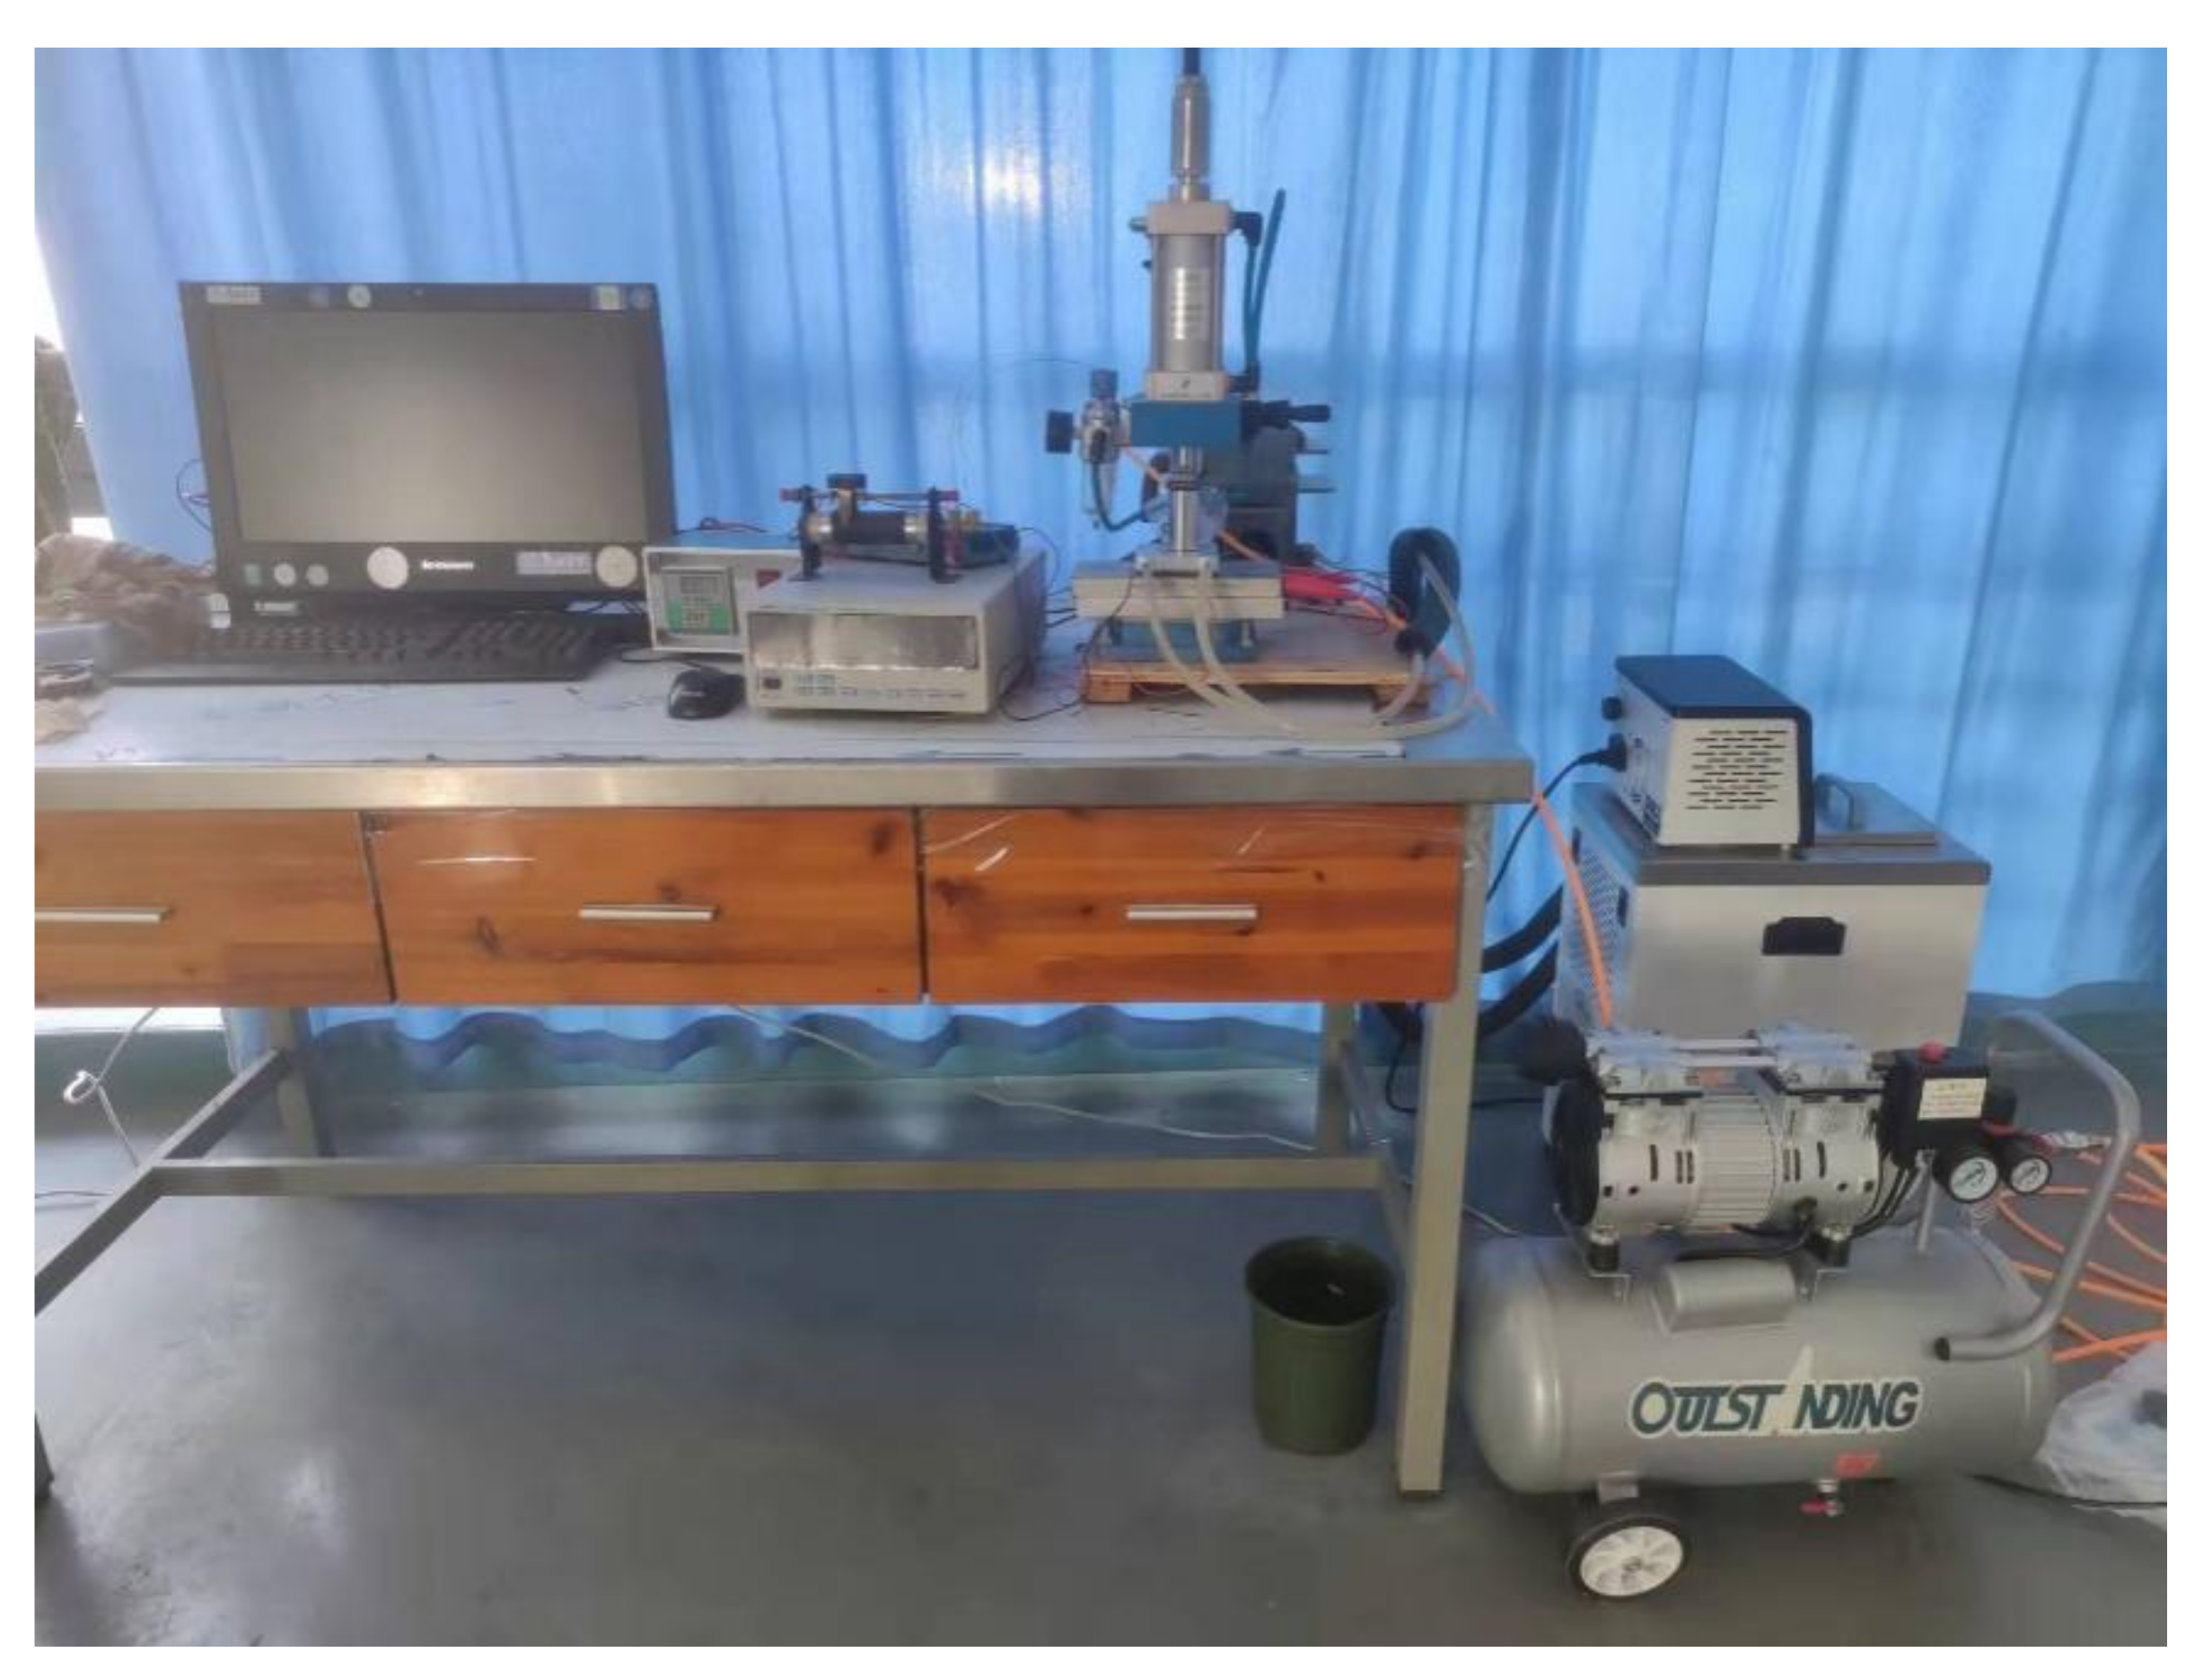
3.1. Experimental Platform

The temperature differential power generation module efficiency test platform consists of a temperature differential power generation module, a heat source device, a cold source device, an installation pressure regulator, an output current measurement device, an output voltage measurement device, an output power measurement device, an external load regulator, and a temperature measurement device. The overall schematic diagram of the experimental platform is shown in Figure 5a.
Figure 5b shows the relationship between the position and area of the temperature-difference generation sheet, the cooling plate, and the heat source plate. The ratio of the area of the temperature-difference generator, cooling plate, and heat source plate is 80 mm × 80 mm:54 mm × 62 mm:200 mm × 100 mm = 1.91:1:5.97.
The thermoelectric power generation sheet is fixed on a platform. The cooling plate and the heat source plate on both sides of the thermoelectric power generation sheet are used to study the effects of different temperatures on power generation. The application of thermal conductive silicone grease on the upper and lower surfaces of the thermoelectric power generation sheet is aimed at measuring the thermal conductivity and investigating its influence on power generation. Different layers of thermal insulation materials are placed between the cooling plate and the heat source plate to test the effects of different thermal insulation materials. Moreover, the air compressor is connected to the air pneumatic press platform through the air pipe to adjust the pressure. The different pressures between the hot plate and the cold plate are used to test pressure influences on power generation. The power tester is connected to the positive and negative poles of the thermoelectric power generation sheet through wires to measure its current, voltage, and power. A realistic testbed is shown in Figure 6.
In this paper, the temperatures of the heat source plate and the cooling plate are measured using a thermocouple collection module, where the temperature of the upper surface of the heat source plate is considered as the heat source temperature and the temperature of the side of the cooling plate is considered as the cooling plate temperature.
Ships are basically using the organic Rankine cycle to generate electricity from the exhaust gas waste heat. However, few people use temperature-difference power generation units to generate electricity. This paper explores the use of temperature-difference power generation for energy recovery, which not only saves energy but also reduces carbon emissions and has a greater development prospect. Each of the different parameters of the temperature-difference power generation sheet including the temperature, the open-circuit voltage, and the output power were measured 10 times after the stabilization of each experiment and then the average value was calculated. The experimental error was less than 1%.

3.2. Experimental Conditions

The experimental setup was designed to measure the power generation performance of temperature-difference power modules under different external conditions including installation pressure, thermal insulation, thermal grease, cooling water temperature, and heat source temperature. The installation pressure was selected as 1, 2, and 3 bar while the thermal insulation was selected as 1 and 2 layers. Moreover, five different cooling water temperatures were chosen including 50, 40, 30, 20, and 10 °C. Moreover, the heat source temperature was selected as 200, 240, and 280 °C. The installation pressure was adjusted using a pneumatic punch. The effect of interfacial heat transfer on the performance of the temperature-difference power module was investigated during the experiments according to whether thermal grease was applied or not.
The internal resistance of the temperature differential power generator varies with temperature. Moreover, the maximum output power is obtained when the internal resistance and the load resistance of the temperature differential power generator are equal. Therefore, the maximum output power is obtained when the internal and external resistance values are equal when the temperature difference changes [16]. In this paper, the temperature difference between the hot and cold ends is kept constant and the load resistance is adjusted locally at around 15% of the internal resistance so that the maximum output power of the temperature-difference generator can be obtained.

3.3. Experimental Results and Analysis

According to the theory of temperature-difference generators, the output power and the open-circuit voltage of a temperature-difference generator are proportional to the temperature difference between its two ends, and the temperature difference is the most important factor affecting the power generation performance of the module.
The experiments were completed in a sealed room (25 °C). The effect of installation pressure, thermally conductive silicone grease, and cold and heat source temperature on the performance of temperature differential power film were studied by many researchers. However, the application of the temperature differential power sheet in the previous literature and the obtained results are not the same as the present work. The experimental work in this paper will investigate the effects of these influencing factors (with the effect of the thermal insulation layer as a new research object), on the performance of temperature differential power generation sheet, and further will lay the foundation for subsequent research on the performance of the temperature-difference power sheet. The heat source device used in the experiment is a common heat source plate control device, which can control the temperature range of the heat source plate in the range of 100–300 °C. The cold source device uses a constant temperature cooling water bath machine, which can achieve 0–99.9 °C temperature control. Moreover, the pressure device consists of a pneumatic press and air compressor while the voltage and power test device is a PM 9816 cross-direct electric parameter measuring instrument.

3.3.1. Effect of Thermal Insulation

A single or double layer of thermal insulation was used in this experiment, while the other parameters of cooling water temperature, heat source temperature, and installation pressure were fixed at 20 °C, 200 °C, and 20 bar, respectively. Aluminum paper with a length, width, and height of 220 × 120 × 0.1 (mm3) was used as the thermal insulation material. The aluminum paper is placed around the temperature-difference-generation piece, basically not in contact with the heat source plate and the cooling plate. It is located between the heat source plate and the cooling plate to reduce the radiation from the heat source to the cooling source (the heat source will produce thermal radiation to the cold end).
The cooling plate temperature is in a constant state of decline as the number of aluminum insulation layers increases. The cooling plate temperature is maximum and equal to 33 °C in the absence of the insulation layer and then drops to 29 and 28 °C in the presence of a single insulation layer and double insulation layers, respectively. Compared to the case with no insulation layers, the cooling plate temperature decreases by 12.12% once a single insulation layer is applied and 15.15% once double insulation layers are used.
Figure 7b shows that increasing the number of aluminum insulation layers increases the open-circuit voltage. The open-circuit voltage of the generating module increases from 12.7 V in the case of no insulation layers to 12.8 and 13 V with single and double insulation layers. This means an increase in the open-circuit voltage by 0.79% for single aluminum insulation and 2.36% for double aluminum insulation compared to the case without insulation layers. Similarly, increasing the number of insulation layers increases the maximum output power of the power generation module from 3.7 W without insulation layers to 3.8 W with single-layer insulation and 3.9 W with double-layer insulation as shown in Figure 7c. The maximum output power of the device increases by 2.70% with single-layer insulation and 5.41% with double-layer insulation compared to the case without insulation layers.
Due to the close distance between the heat source and the cold source, there are heat transfer between the heat source and the cold source. Adding thermal insulation between the cooling plate and the heat source platen in this paper aimed at reducing the influence between the heat source and the cold source to increase the temperature difference between the hot and cold ends and finally increase the output power of temperature-difference power generation. However, the experimental results show that with the addition of thermal insulation paper between the heat source plate and the cooling plate, only a small efficiency change occurs, which is negligible. In addition, it also proves that the aluminum foil thermal insulation paper has no effect on the temperature-difference power generation performance.

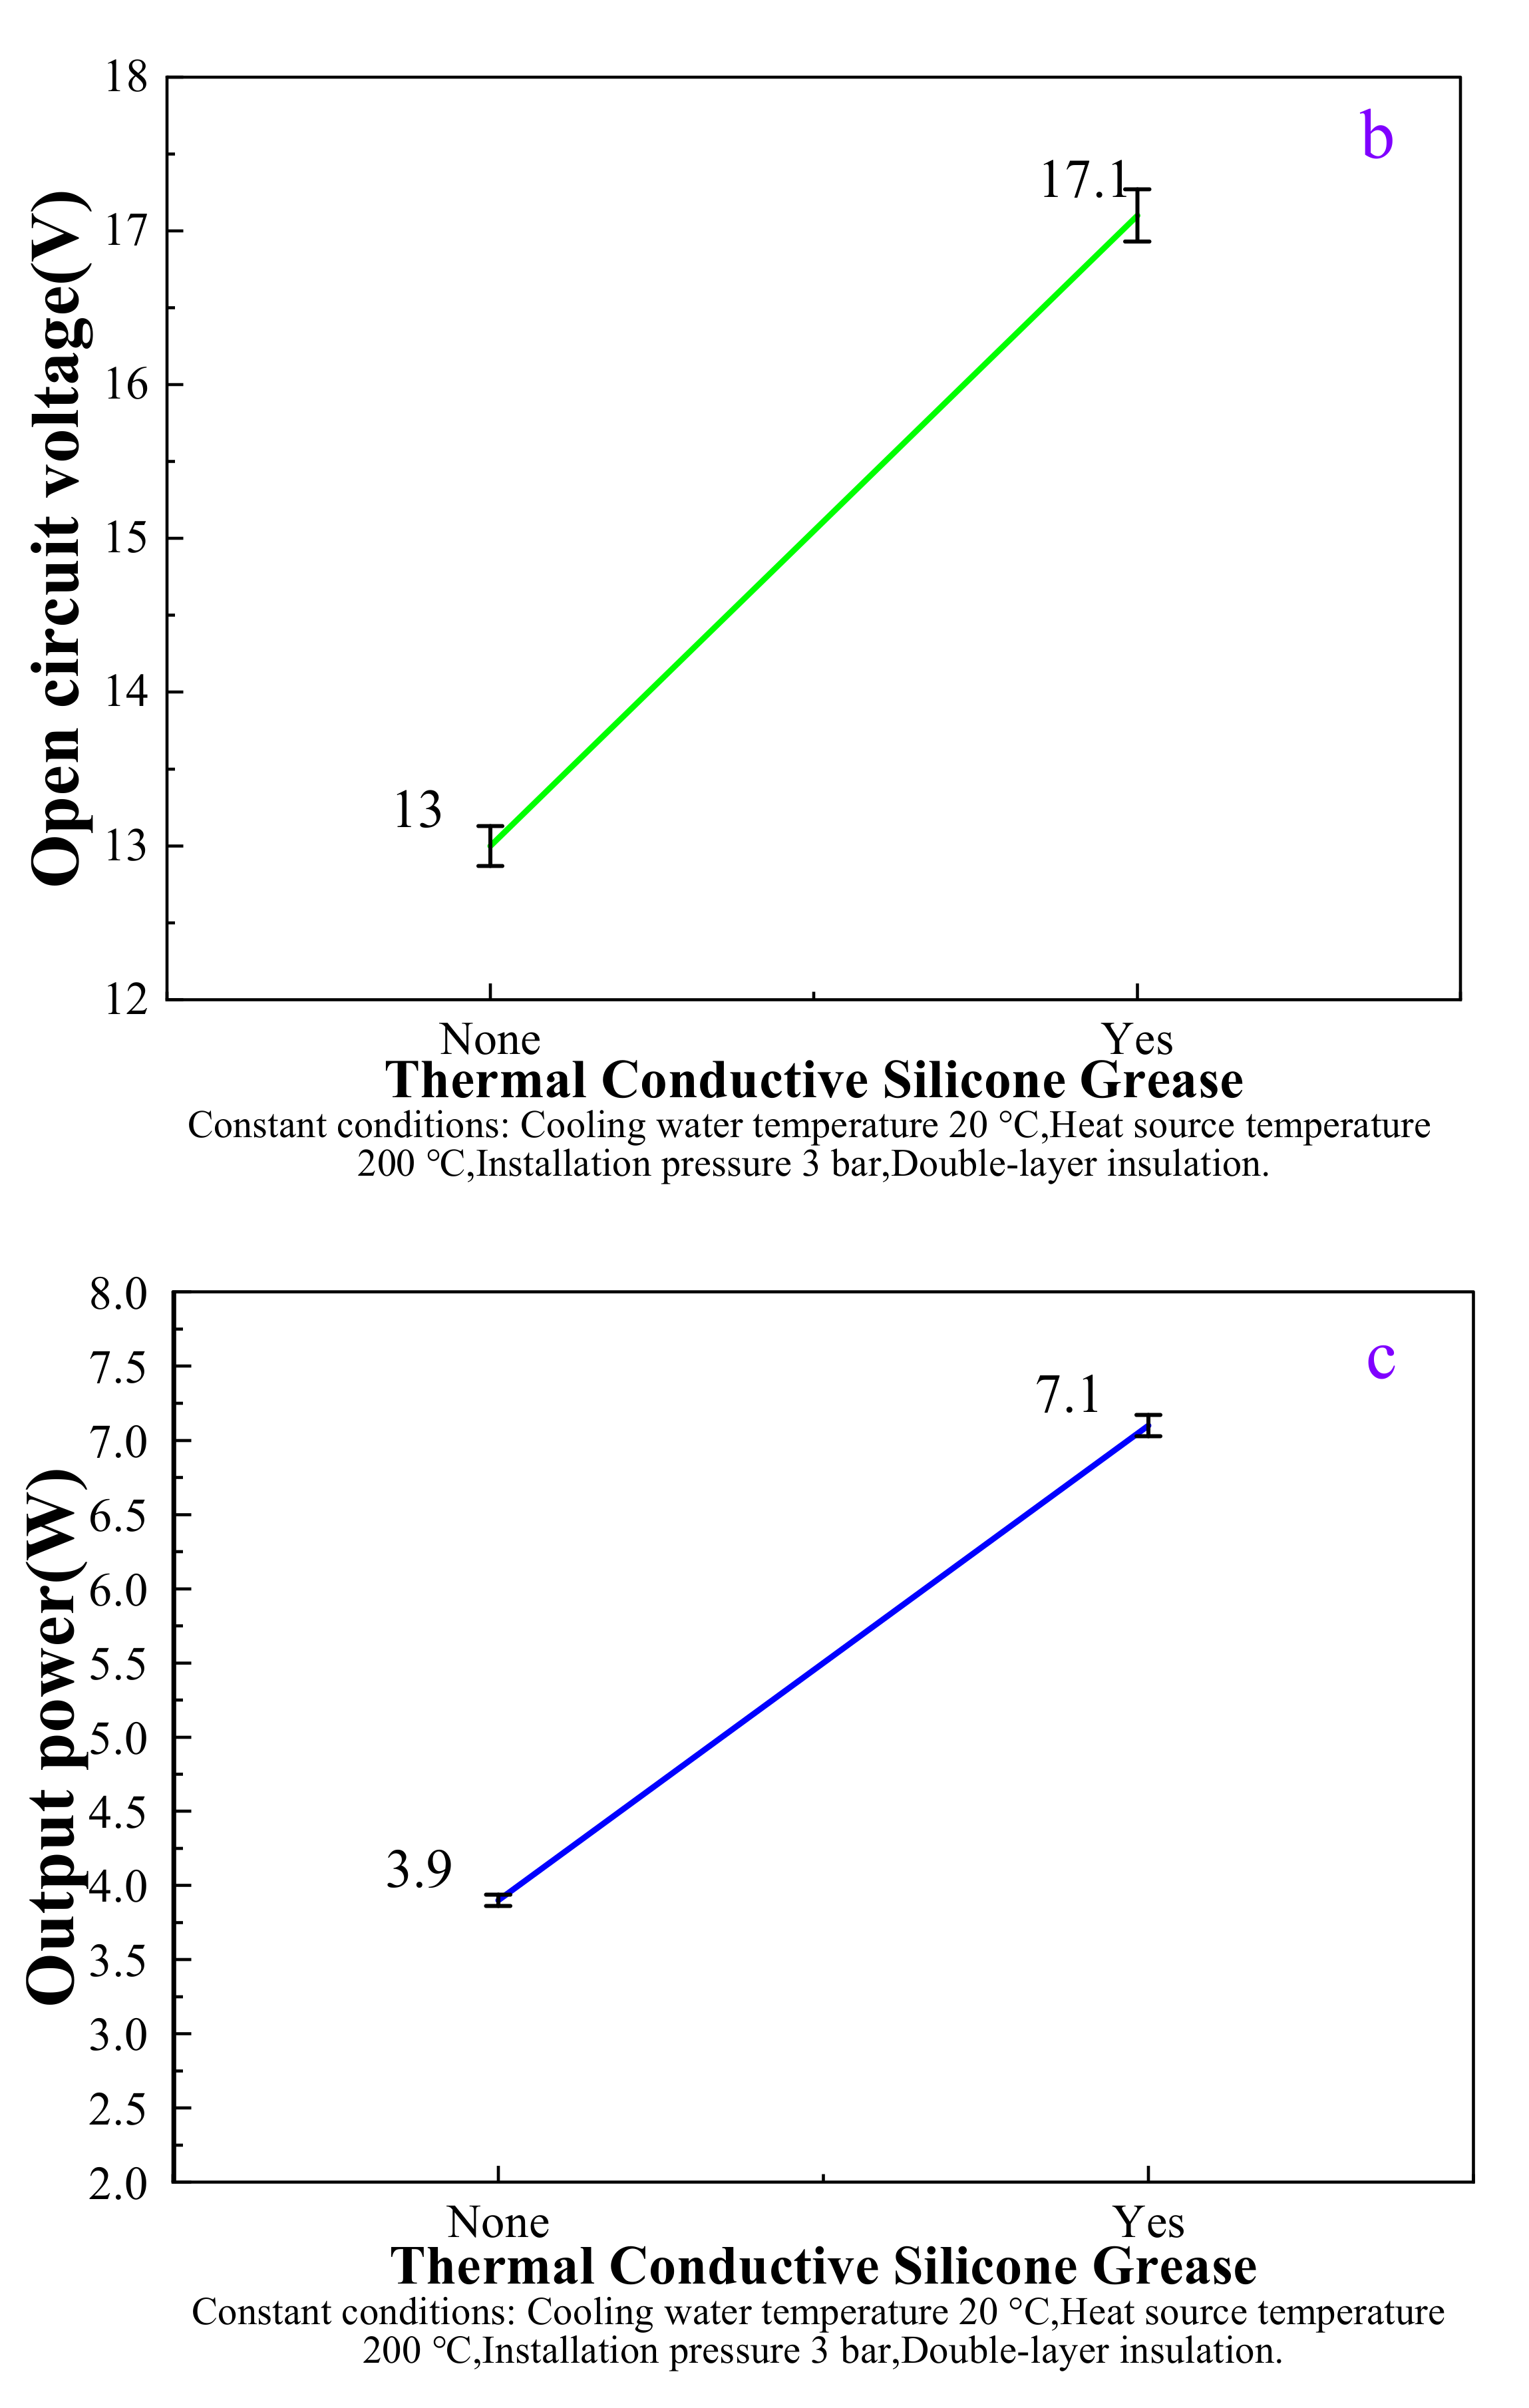
3.3.2. Effects of Installation Pressure and Thermal Grease

At different installation pressures, the cooling plate temperature is essentially stable, as shown in Figure 8a. The growth rate of the cooling plate temperature is 70% at 2 bar and 65% at 3 bar as compared to the cooling water temperature of 20 °C. The increase in installation pressure increases the open-circuit voltage of the power generation module from 11.9 V at 1 bar to 12.4 V at 2 bar and 12.7 V at 3 bar. Compared to the installation pressure of 1 bar, the open-circuit voltage increases by 4.20% and 6.72% at 2 and 3 bar, respectively. Likewise, the maximum output power of the temperature differential generation unit increases with increasing installation pressure. At installation pressures of 1, 2, and 3 bar, the maximum output power of the unit is 3.2, 3.5, and 3.7 W, respectively, which means an increase in the maximum output power by 9.38% at 2 bar and 15.63% at 3 bar as compared to the value at 1 bar. Due to the increased installation pressure, the heat transfer effect at the interface between the temperature differential power module and the cold and heat sources increases. Therefore, it widens the temperature difference between the hot and cold ends of the module, which in turn increases the open-circuit voltage and the output power.
To study the effect of thermal grease on the performance of temperature differential power generation, a thermally conductive silicone grease (TS—Thermally Conductive Silicone Grease) was used. This kind of heat-conducting silicone grease has a high heat transfer efficiency, is cheap, and is widely used. This experiment was completed with and without application of a thermally conductive silicone grease. In the process of applying the thermally conductive silicone grease, a layer of thermally conductive silicone grease was evenly applied to the cold and hot ends of the temperature differential power generation sheet to increase its thermal conductivity.
As shown in Figure 9a, the temperature of the cooling plate increases in the presence of thermally conductive silicone grease. The growth rate of the cooling plate temperature is 7.14% with the use of thermally conductive silicone grease compared to the case without using it. The presence of thermally conductive silicone grease causes the open-circuit voltage to rise as shown in Figure 9b. The open-circuit voltage of the power generation module increased from 13 V without the application of thermal grease to 17.1 V with the application of thermal grease, which means an open-circuit voltage growth of 31.54%. Likewise, the maximum output power of the temperature differential power generation unit increased to 7.1 W after the application of the thermal grease, which means that the maximum output power increased by 82.05% compared to the case without using thermal grease (3.9 W). The heat transfer effect of the thermally conductive silicone grease accelerates the heat transfer between the heat source, the cold source, and the temperature differential power generation unit, thus, increasing the open-circuit voltage and output power of the unit.

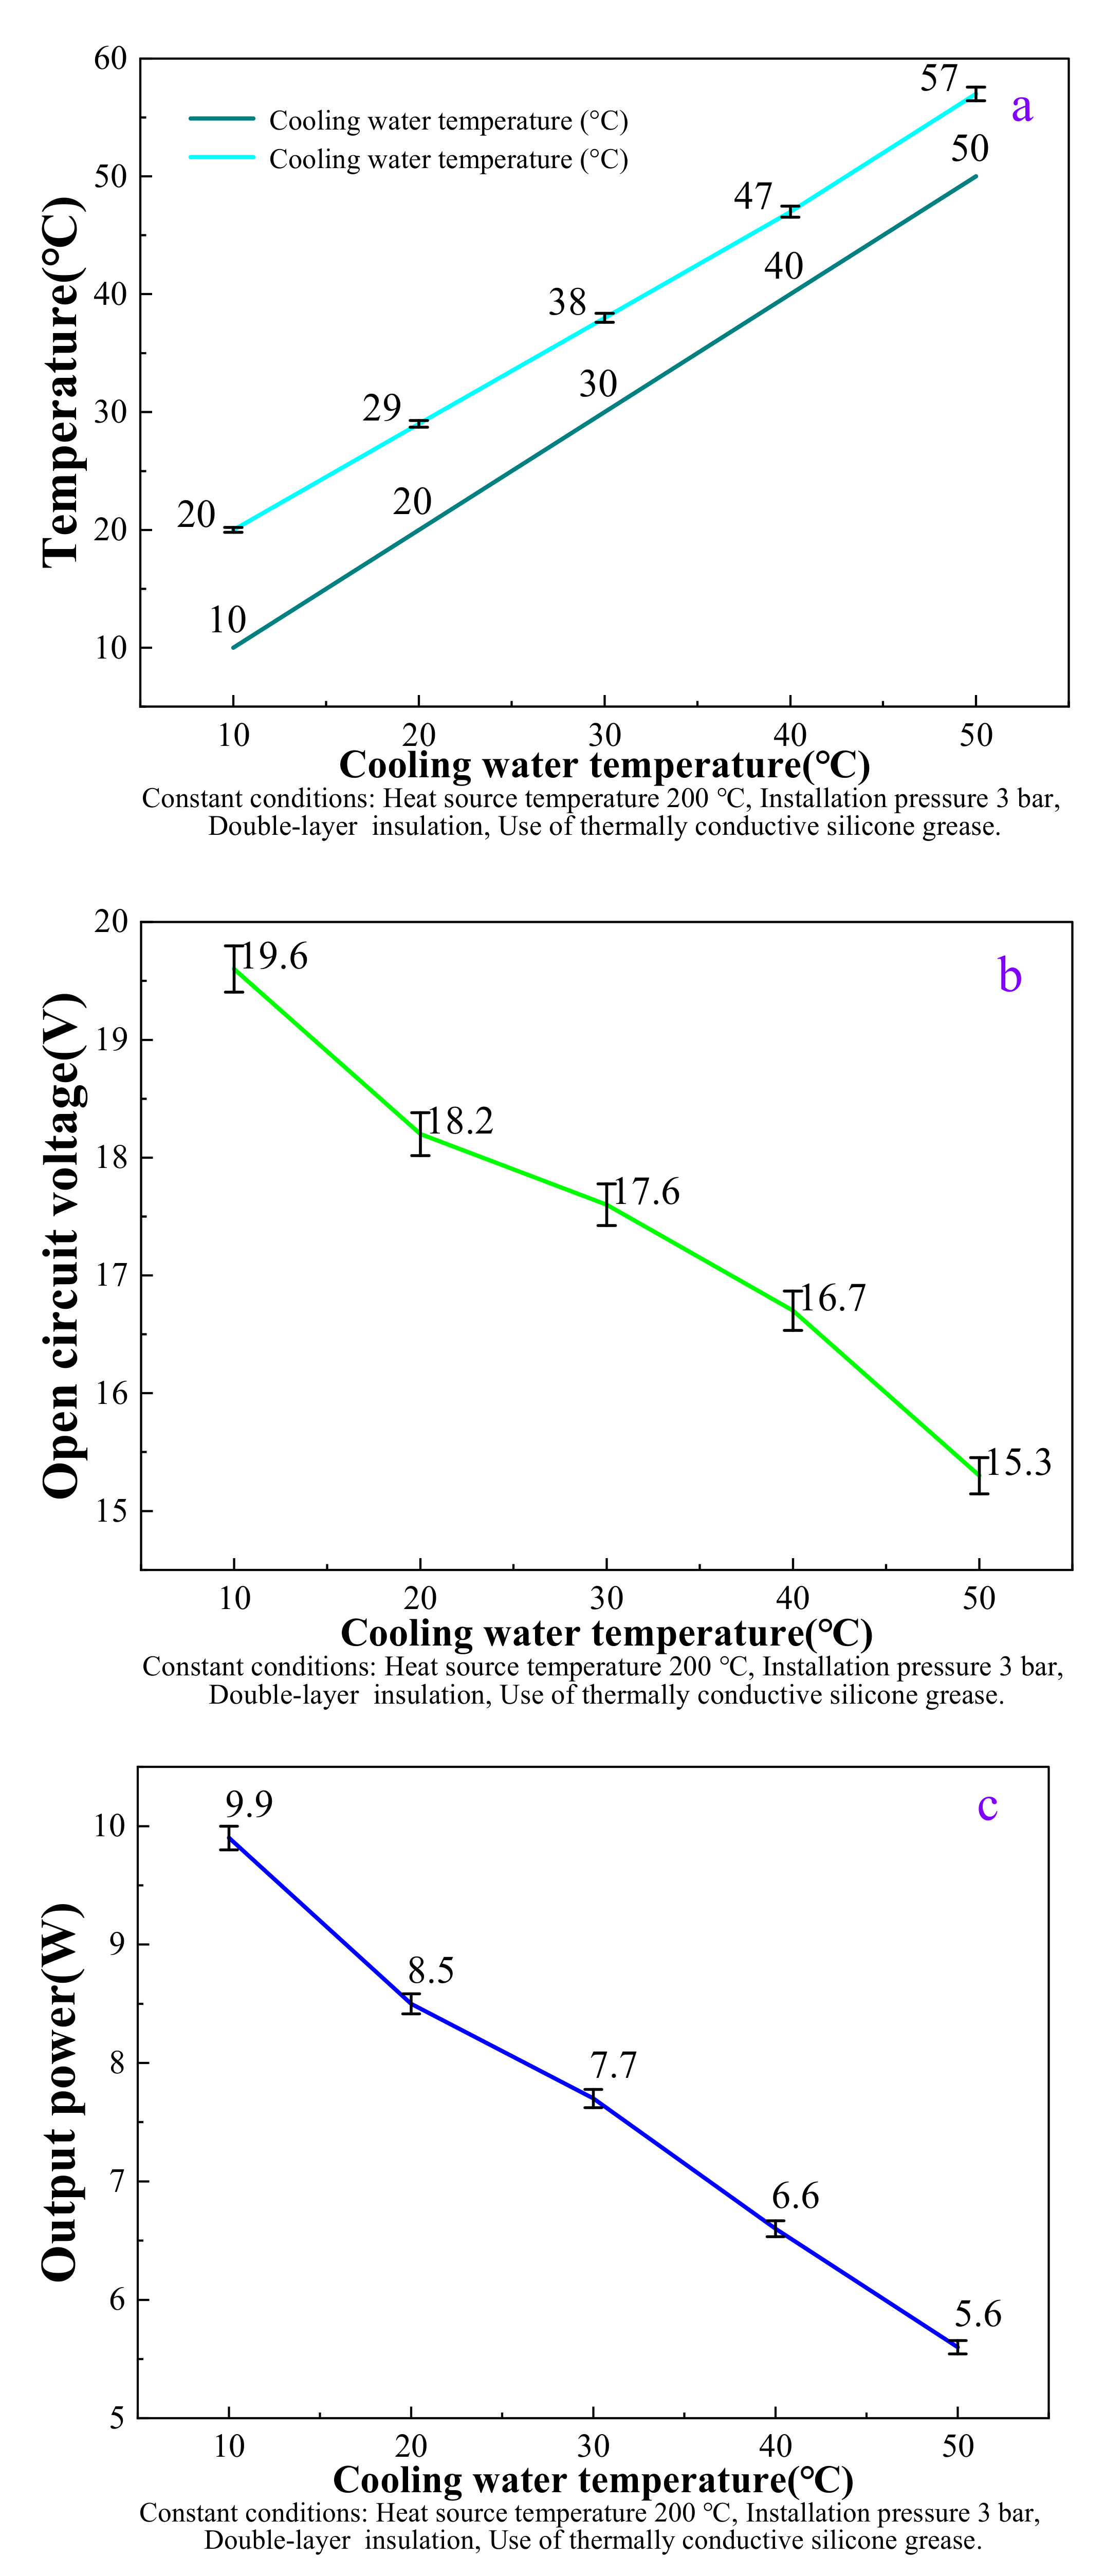
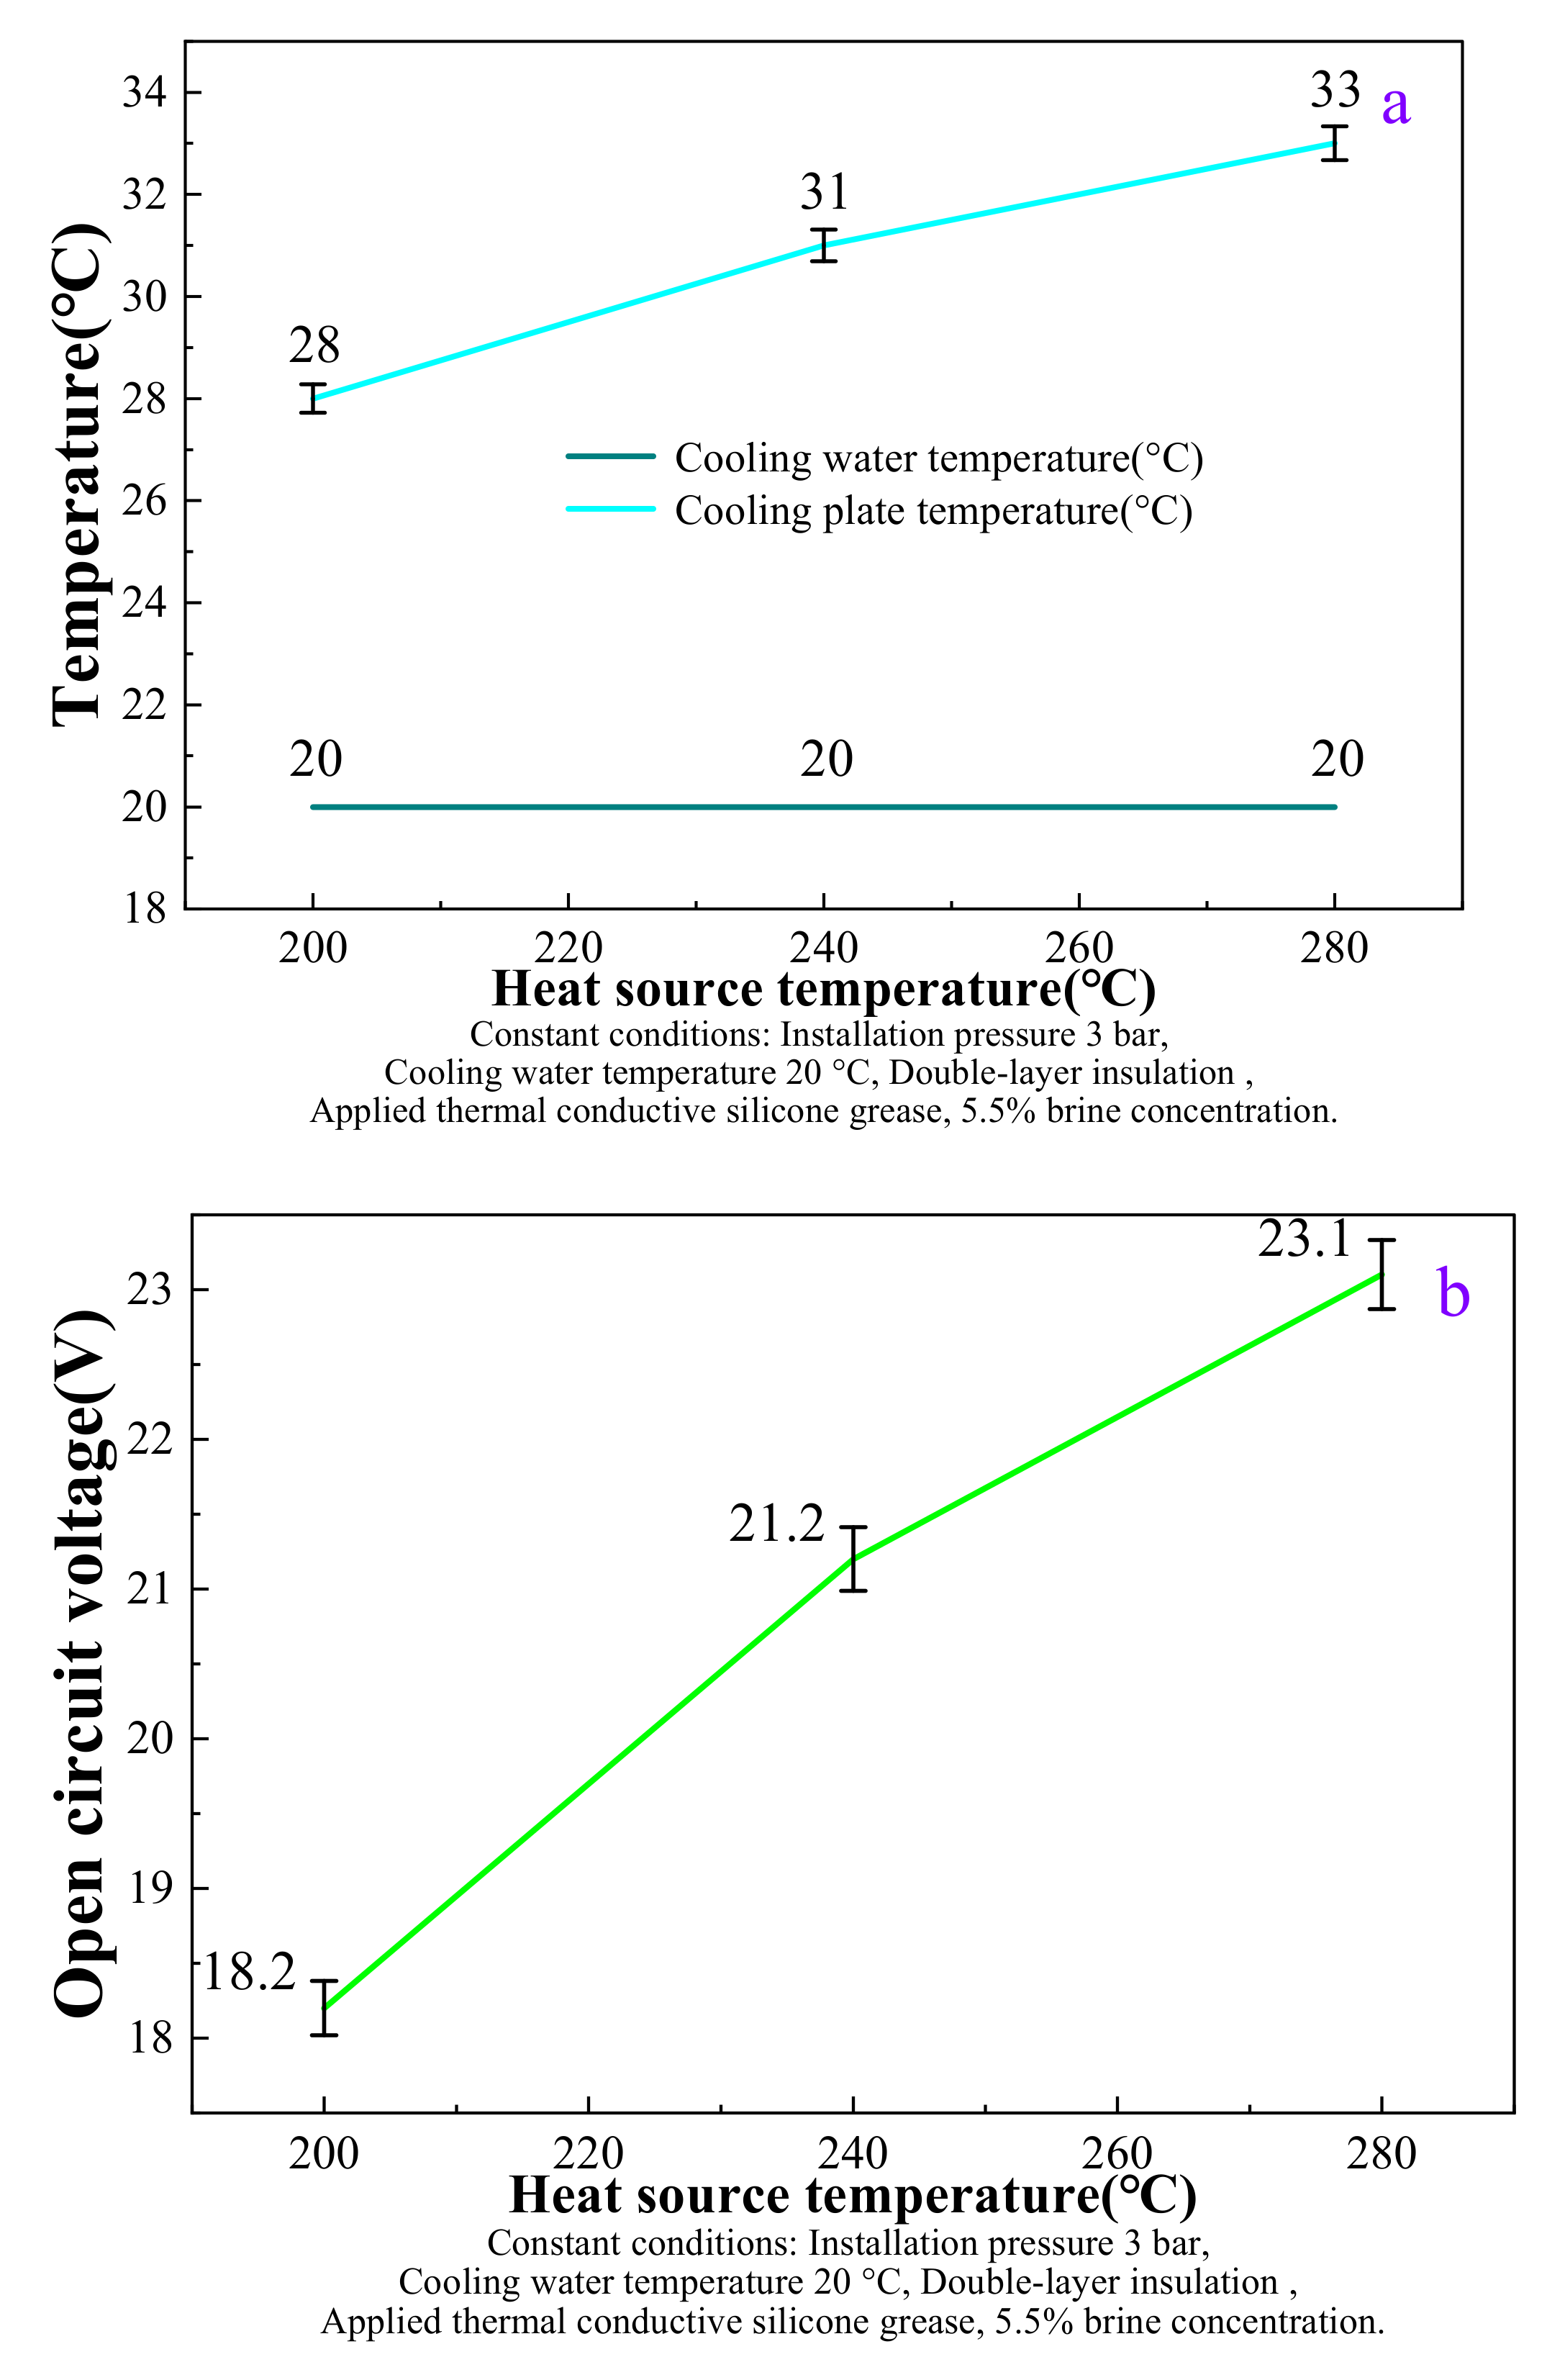
3.3.3. Effects of Cooling Water Temperature and Heat Source Temperature

As shown in Figure 10, the cooling plate temperature is in a continuous state of reduction under the condition of cooling water temperature reduction. The temperature chosen for this set of experiments was based on the temperature of seawater throughout the year. Cooling water temperatures of 50, 40, 30, 20, and 10 °C correspond to cooling plate temperatures of 57, 47, 38, 29, and 20 °C, respectively, with growth rates of 14, 17.5, 26.67, 45, and 50%, respectively. As the cooling water temperature decreases, the growth rate of the cooling plate temperature gradually increases. Under the condition of decreasing cooling water temperature, the open-circuit voltage is on a continuous rise. For cooling water temperatures of 50, 40, 30, 20, and 10 °C, the open-circuit voltage is 15.3, 16.7, 17.6, 18.2, and 19.6 V, respectively, which means an open-circuit voltage growth rate of 9.15, 15.03, 18.95, and 28.10%, respectively. Similarly, the maximum output power of the temperature differential power generator increases as the cooling water temperature decreases. For cooling water temperatures of 50, 40, 30, 20, and 10 °C, the maximum output power reaches 5.6, 6.6, 7.7, 8.5, and 9.9 W, respectively, with growth rates of 17.86, 37.5, 51.79, and 76.79%, respectively. This is because as the cooling water temperature continues to decrease, the temperature difference between the hot and cold sources increases, which continues to increase the open-circuit voltage and the output power of the unit.
In this study, the temperature of the heat source was recorded with a temperature logger and used as the heat source temperature for the experiment. Three temperatures of 200, 240, and 280 °C were set in the experiment because the temperature of the vessel’s exhaust gas wall is around 240 °C, which is close to the vessel’s exhaust gas temperature.
The cooling plate temperature is in a continuous increase when increasing the heat source temperature, as shown in Figure 11a. When the heat source temperature is 200, 240, and 280 °C, the cooling plate temperature is 28, 31, and 33 °C, respectively, with growth rates of 14.29% and 17.85%, respectively. As the heat source temperature increases, the open-circuit voltage of the cooling plate gradually increases. The open-circuit voltage rises from 18.2 V at 200 °C to 21.2 V at 240 °C and 23.1 V at 280 °C, which means an increase in the open-circuit voltage growth rate by 16.48% at 240 °C and by 26.92% at 280 °C. Likewise, the maximum output power of the temperature differential power generator increases with the increasing heat source temperature. At heat source temperatures of 200, 240, and 280 °C, the maximum output power reaches 8.5, 11, and 12.7 W, respectively. In addition, the maximum output power growth rate increased by 29.41% at 240 °C and 49.41% at 280 °C compared to the 200 °C heat source temperature. This is due to the increased heat source temperature, which increases the temperature difference between the two ends of the temperature differential power generation sheet, thus, improving the power generation performance of the temperature differential power generation sheet.

4. Conclusions

In this study, the effects of thermal insulation, installation pressure, thermally conductive silicone grease, cooling water temperature, and heat source temperature on the cooling plate temperature, the open-circuit voltage, and the output power of a single temperature differential power generation sheet were thoroughly investigated. The main conclusions are as follows:
(1)
The use of single-layer and double-layer thermal insulation improved the open-circuit voltage by 0.79% and 2.36%, respectively, and improved the maximum output power by 2.70% and 5.41%, respectively, compared to the case when no insulation layers were used.
(2)
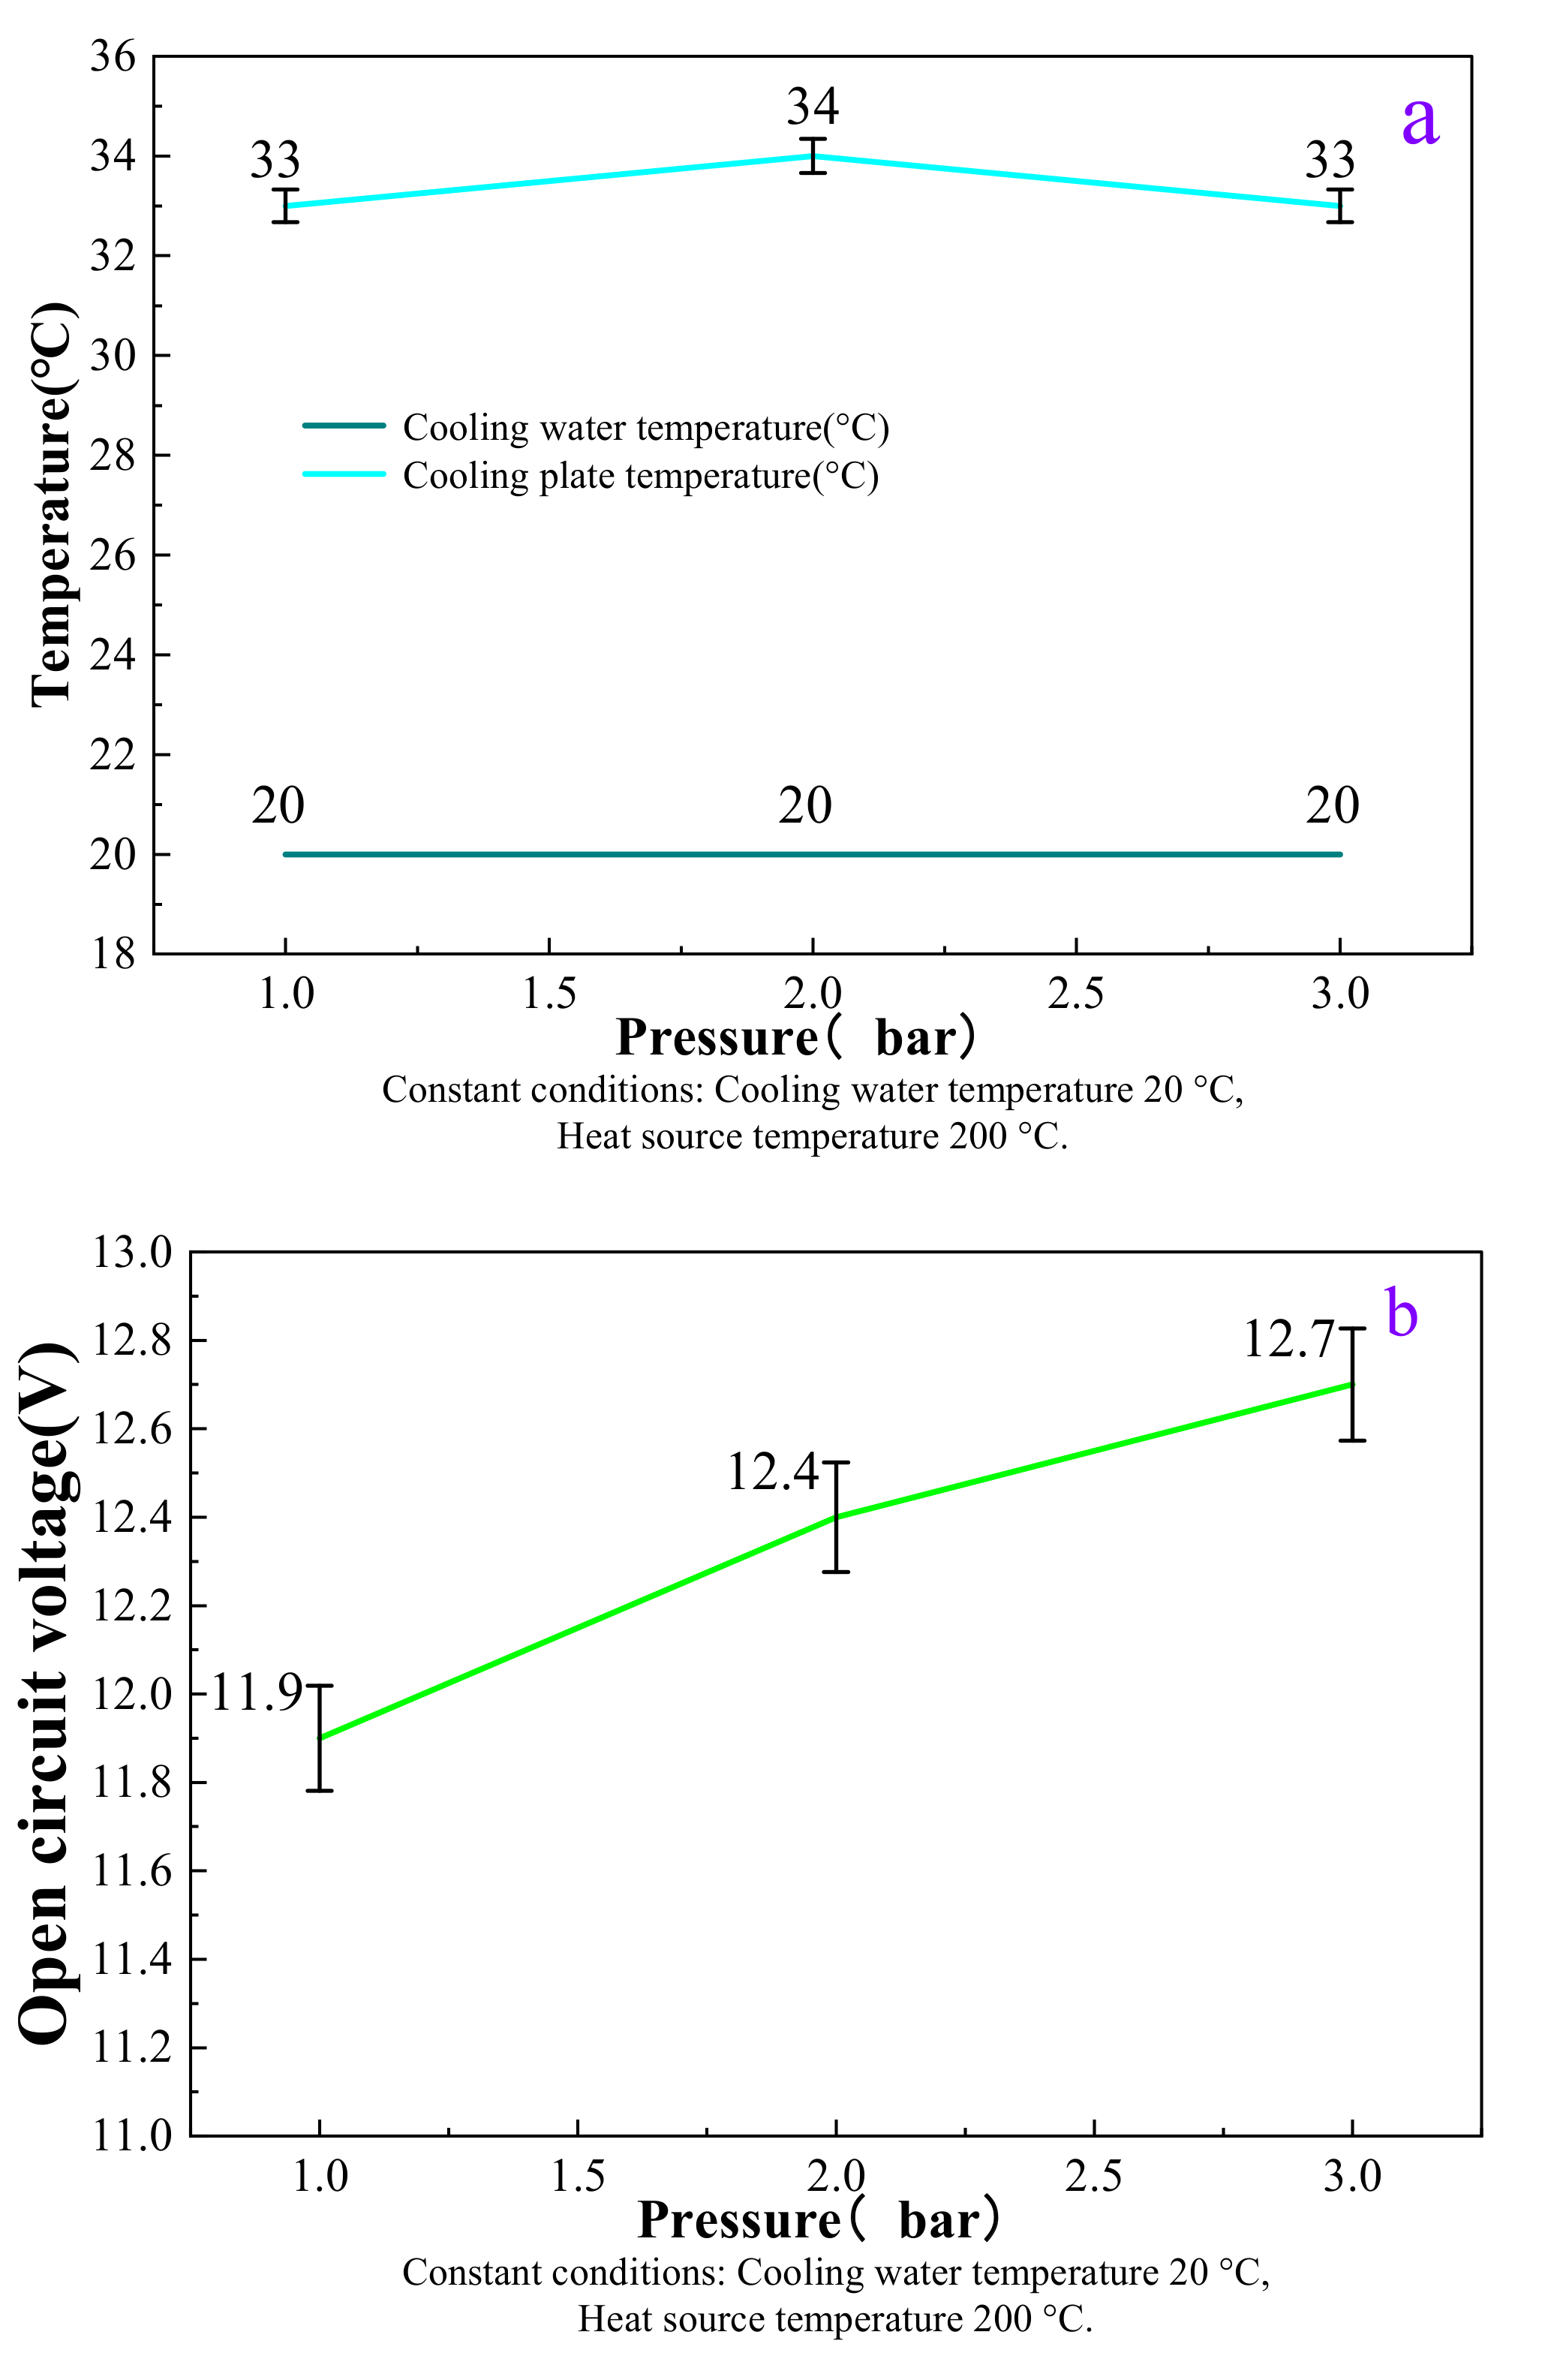
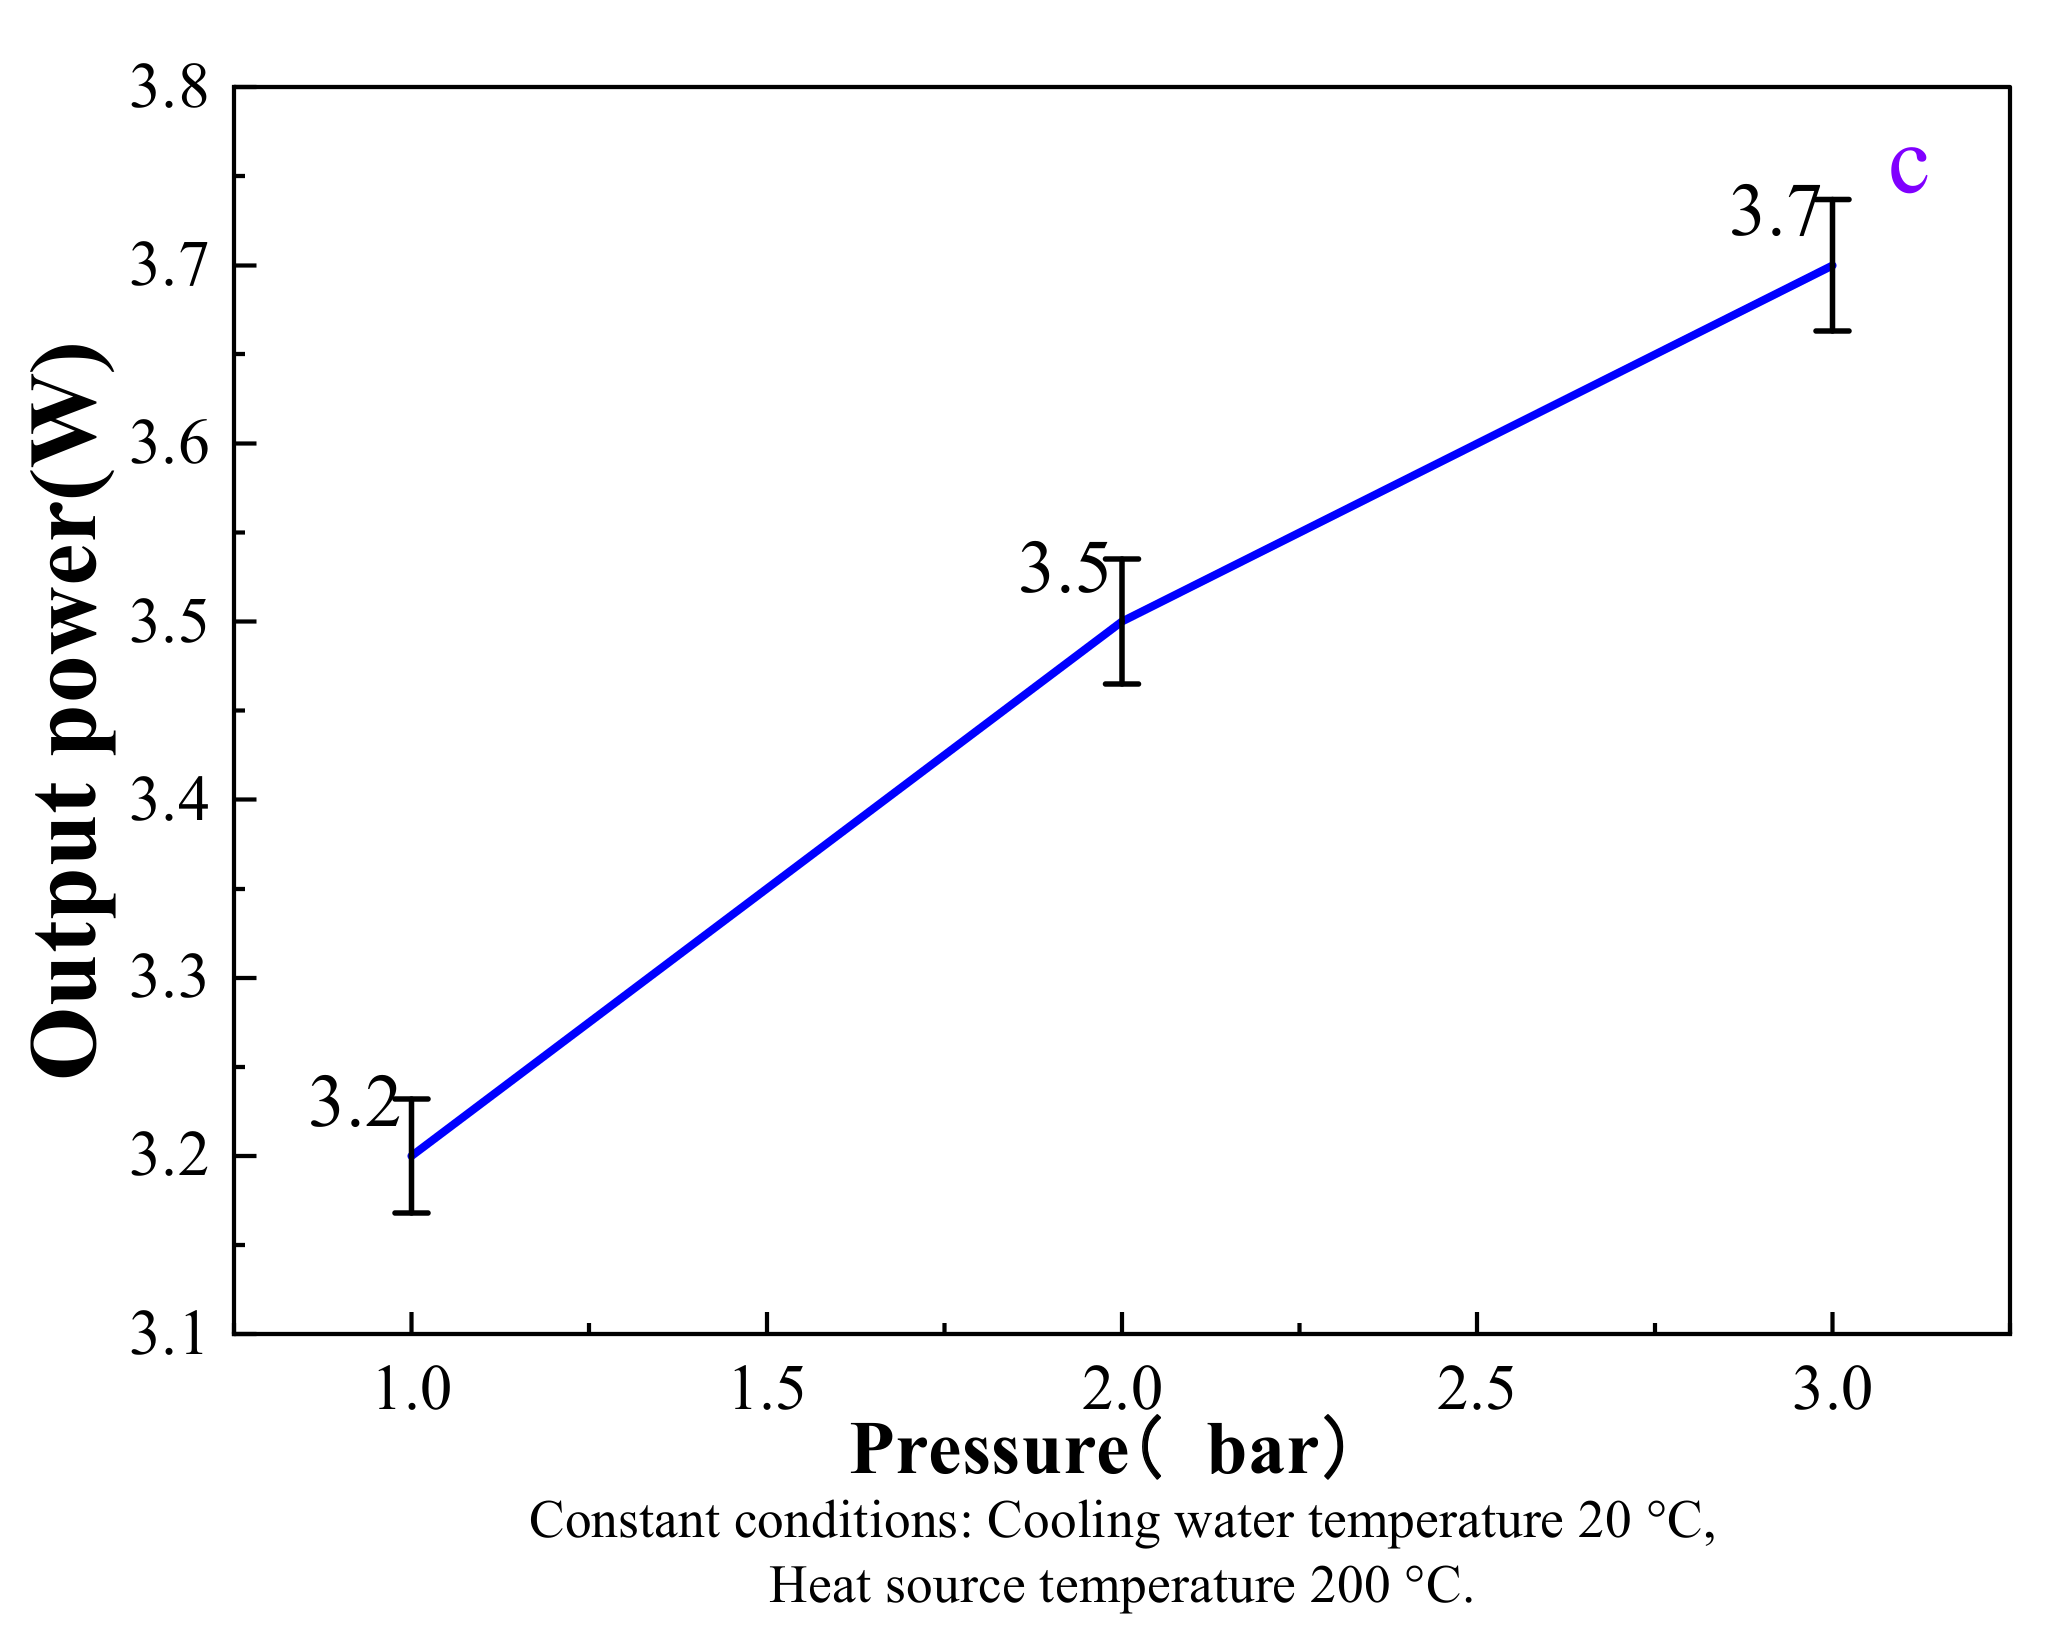
Increasing the installation pressure to 2 and 3 bar increased the open-circuit voltage by 4.20% and 6.72% and the maximum output power by 9.38% and 15.63%, respectively, as compared to the case when 1 bar installation pressure was used.
(3)
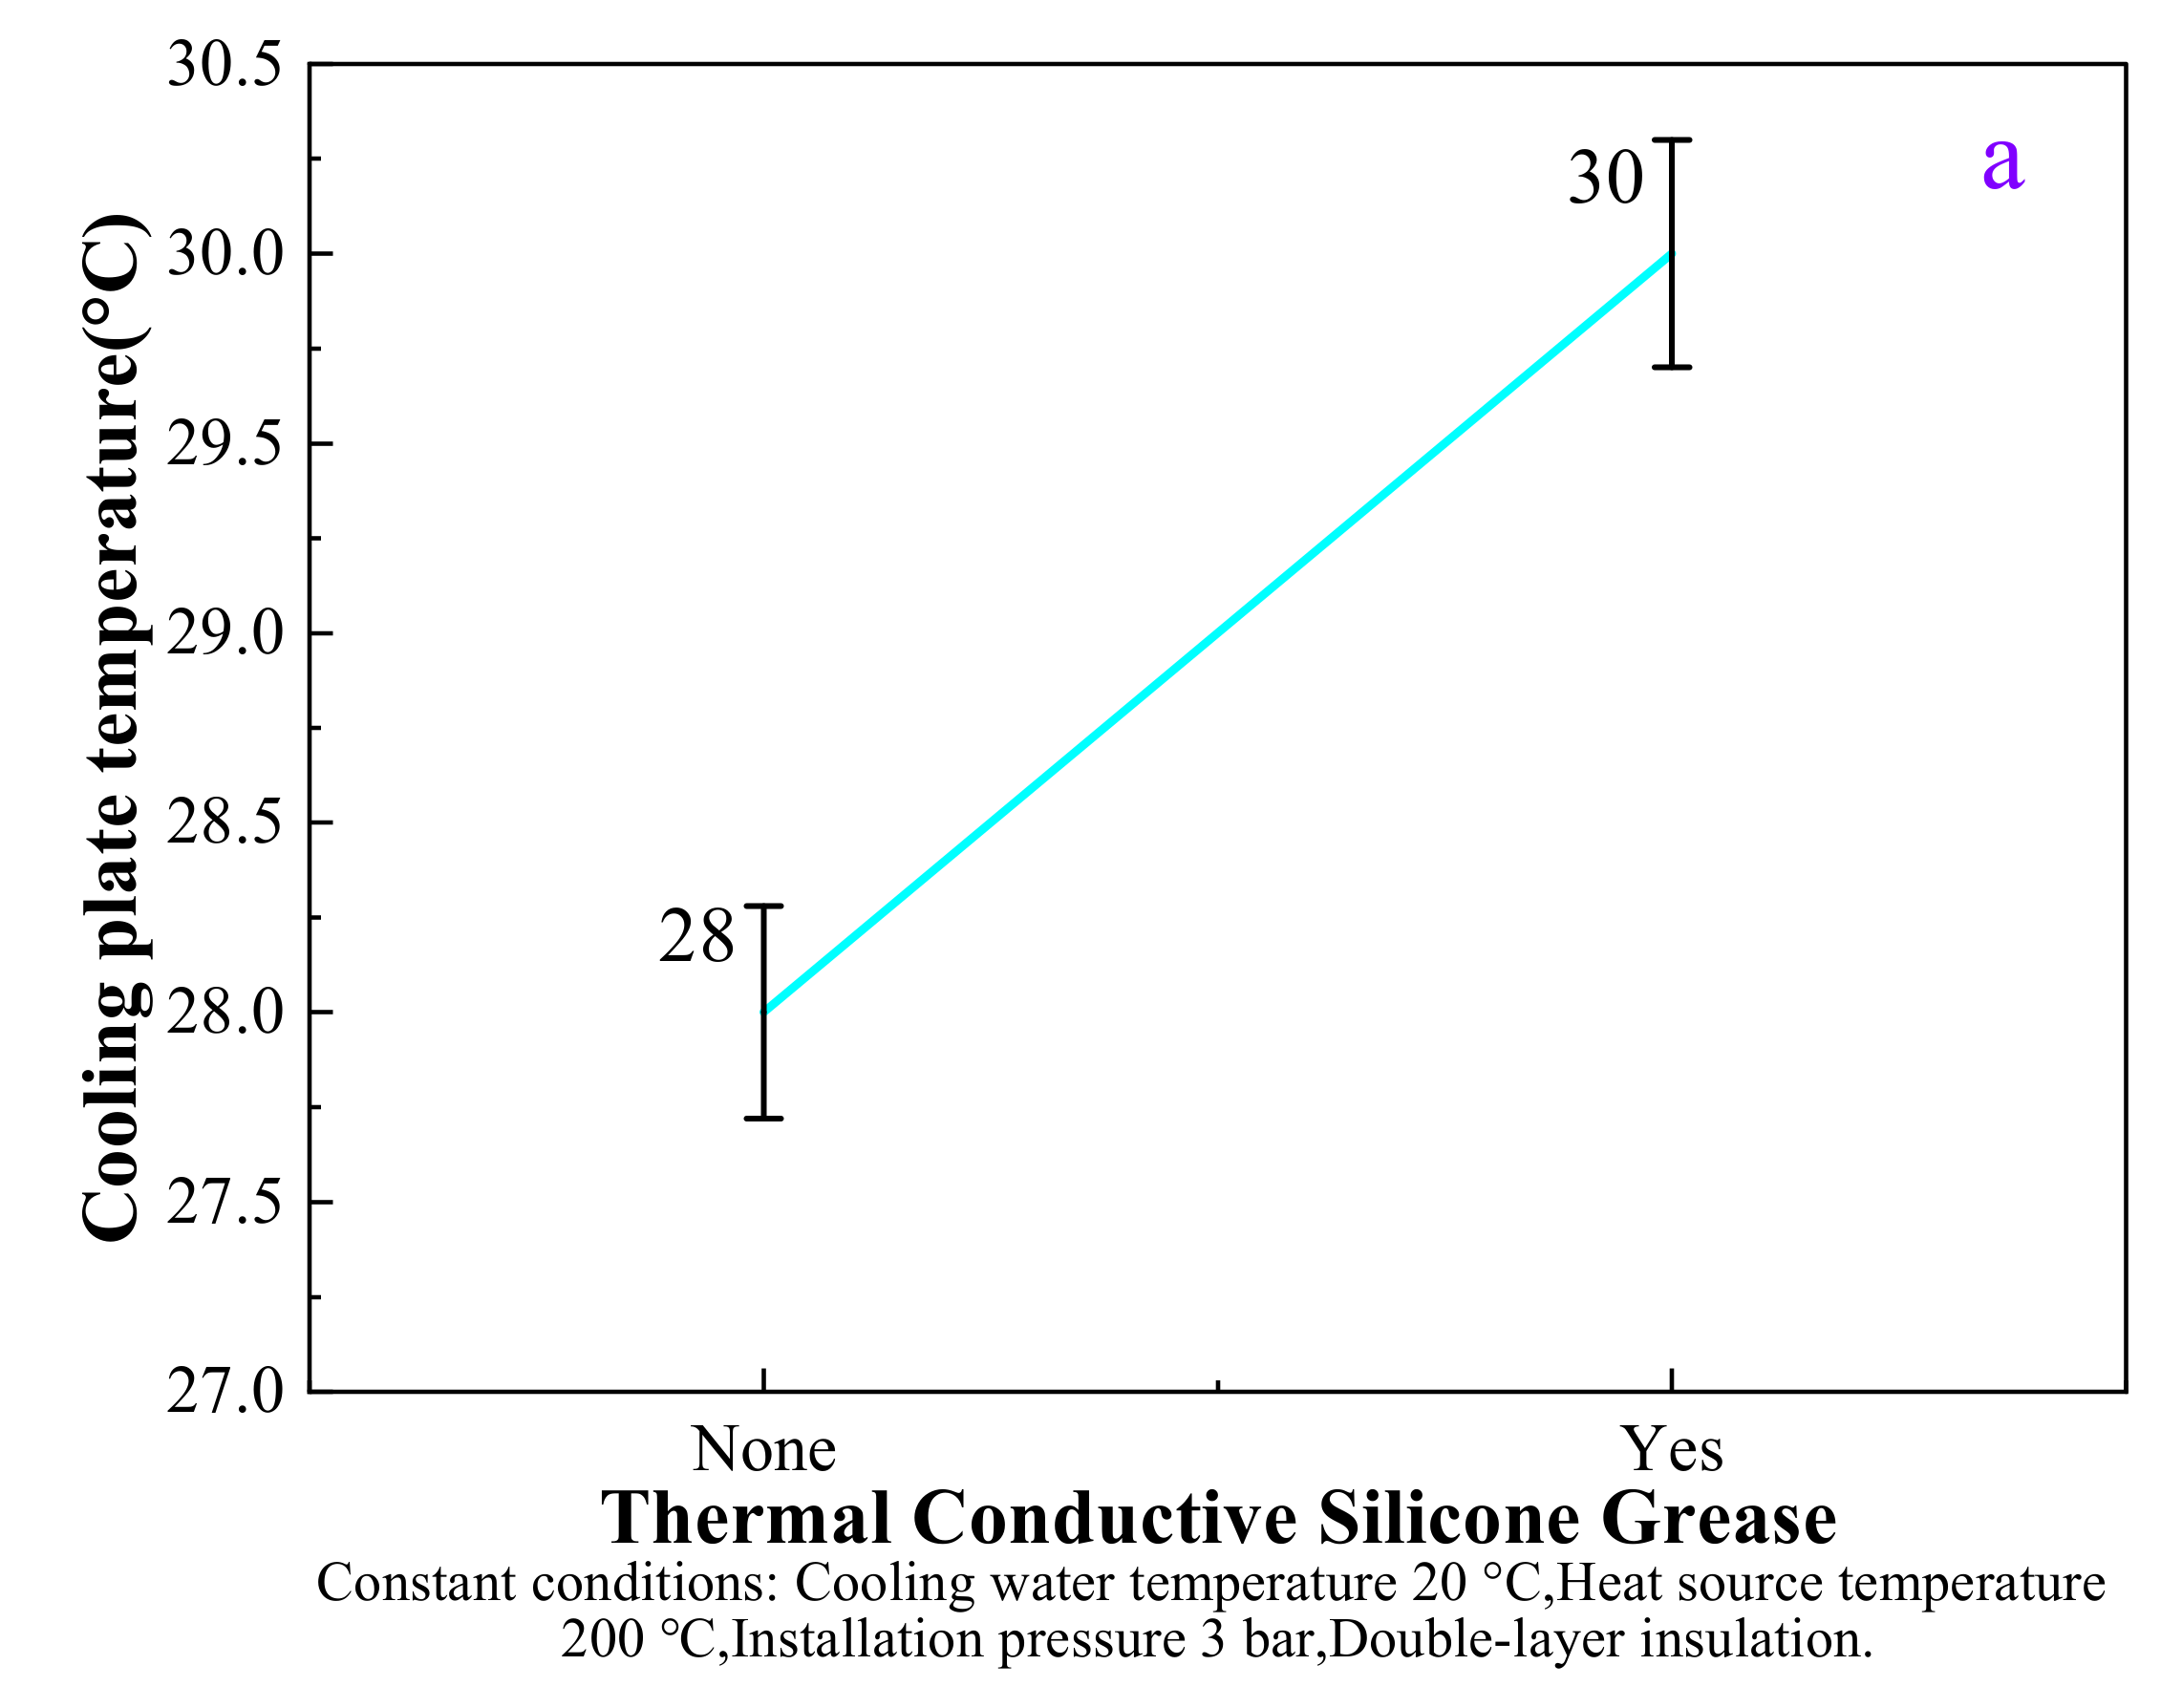
Applying the thermally conductive silicone grease enhanced the open-circuit voltage by 31.54% and the output power of the temperature differential power generation unit by 82.05%.
(4)
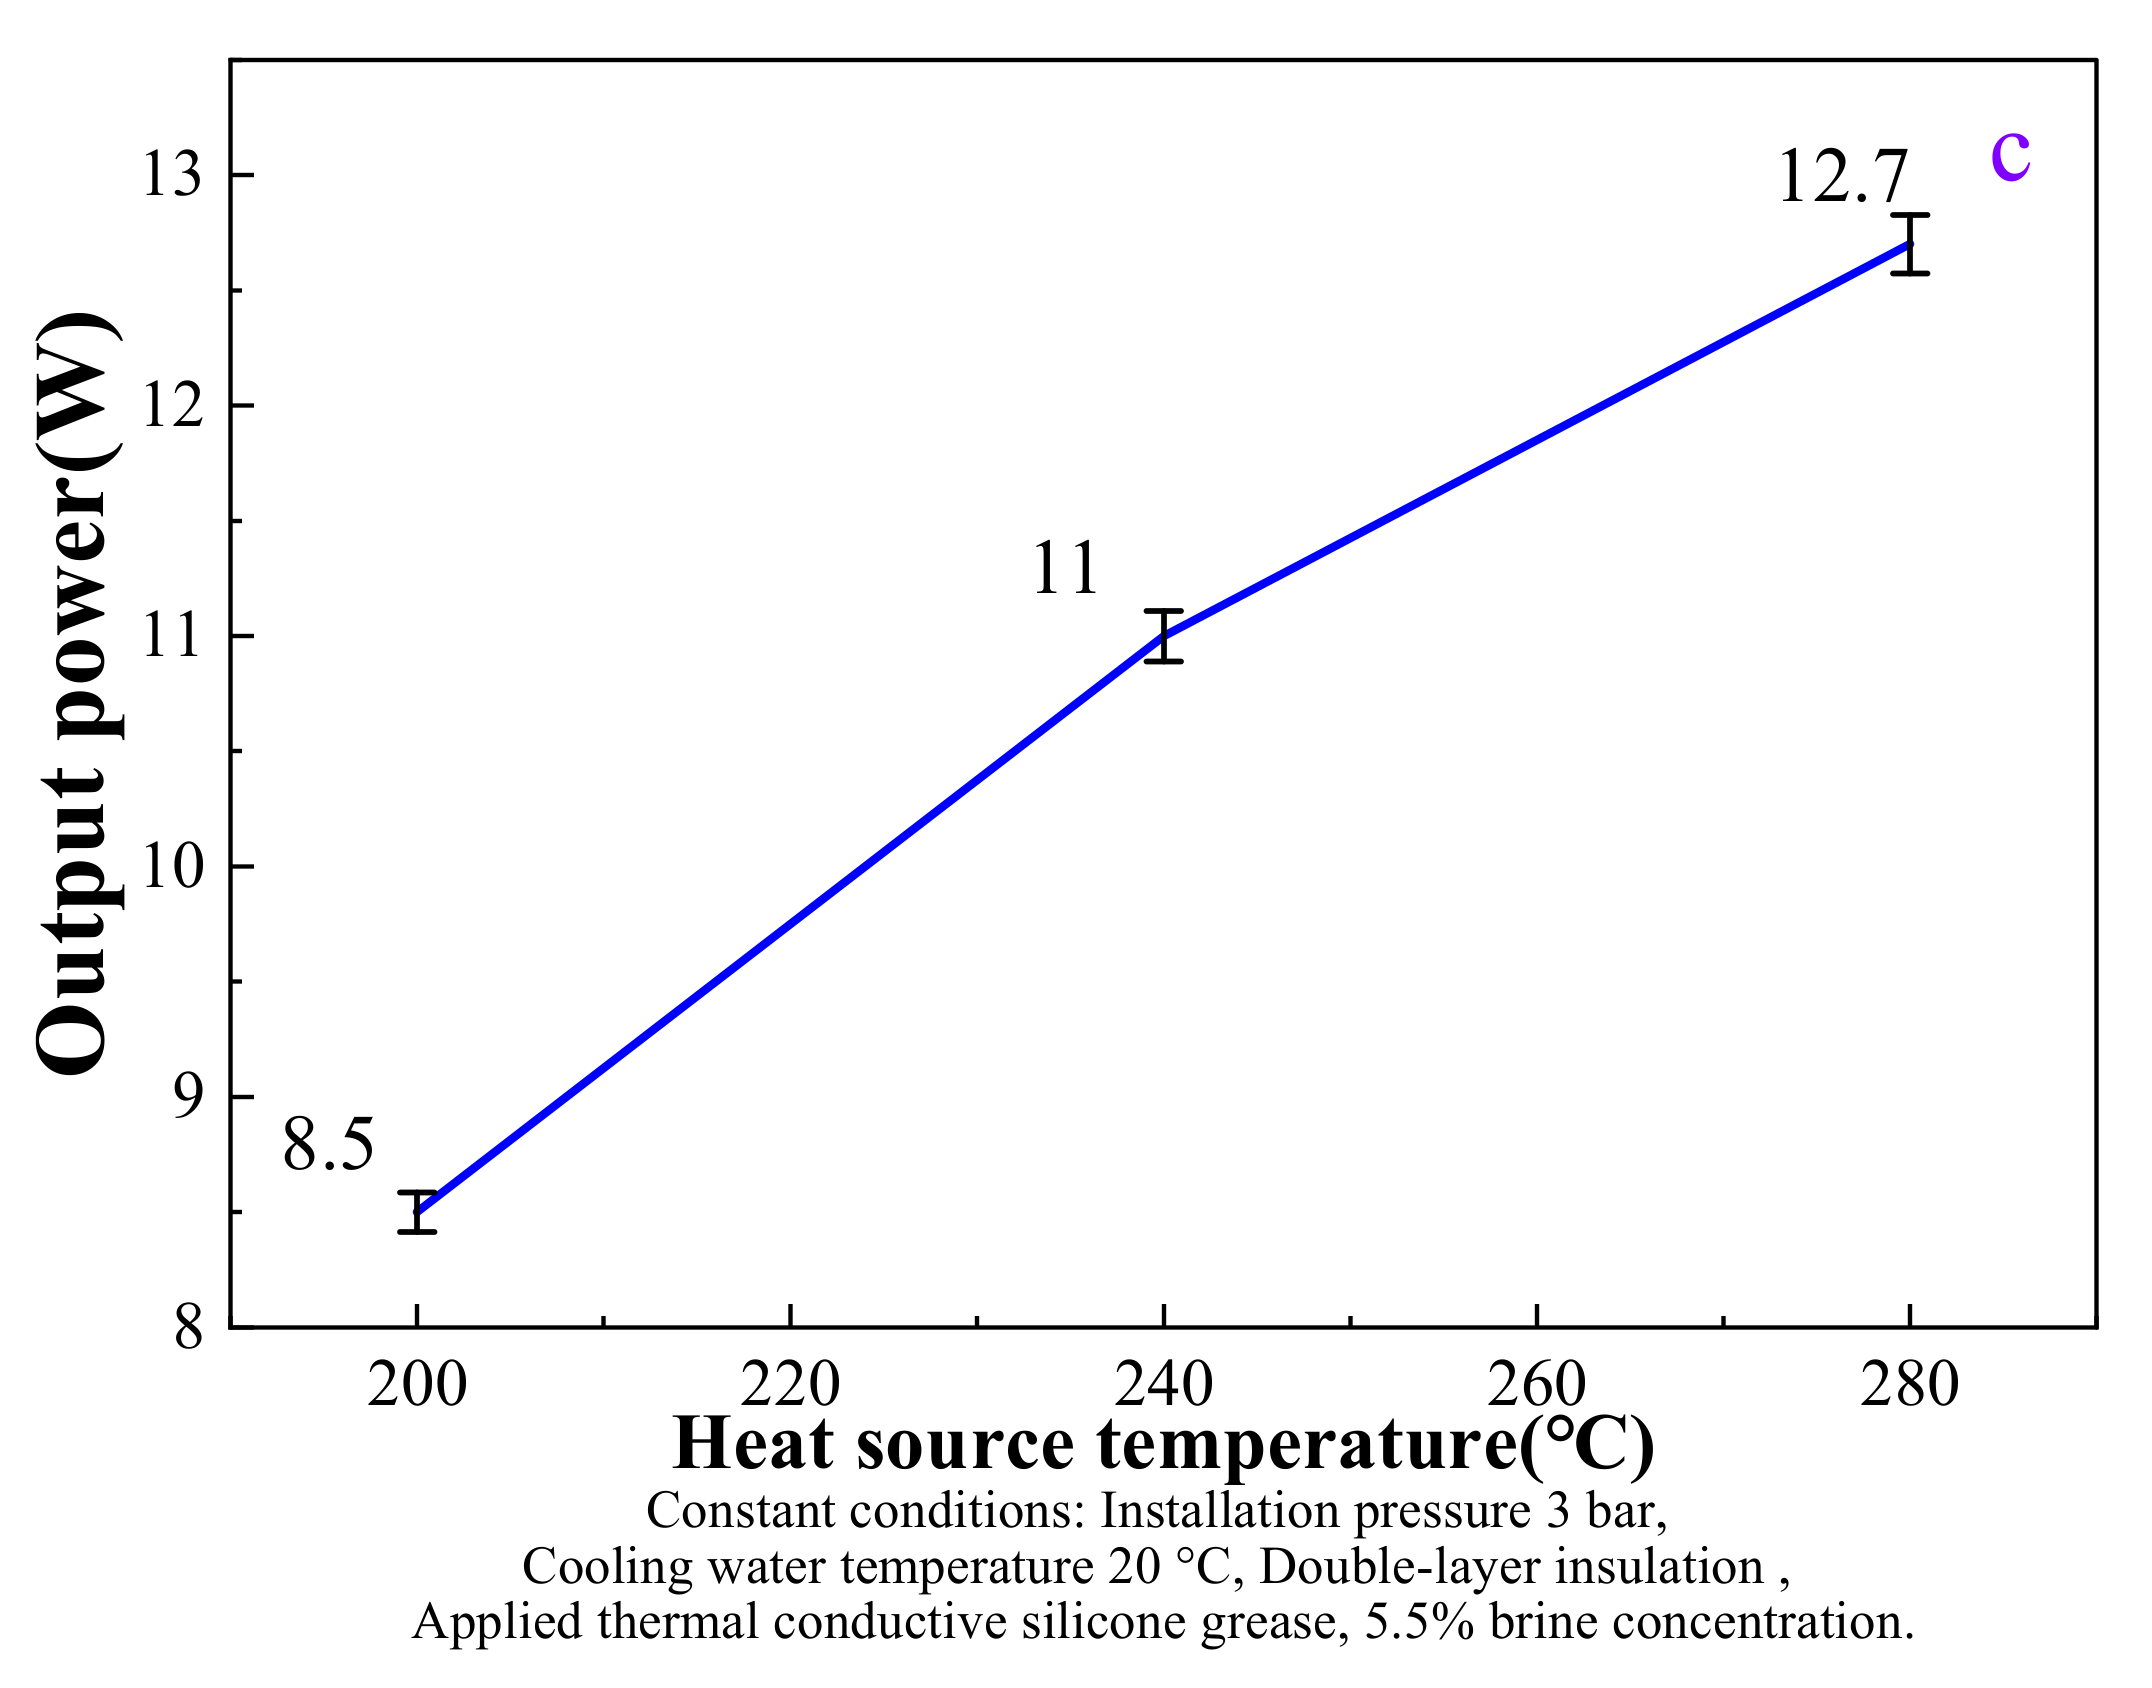
Decreasing the cooling water temperature from 50 to 10 °C increased the open-circuit voltage growth rate from 9.15% to 28.10% and escalated the maximum output power growth rate from 17.86% to 76.79%. Increasing the heat source temperature from 200 to 280 °C enhanced the open-circuit voltage growth rate by 26.92% and the maximum output power growth rate by 49.41%.
(5)
Finally, the maximum output power of this temperature differential power generator reached 12.7 W when using an installation pressure of 3 bar, a cooling water temperature of 20 °C, double-layer aluminum insulation, and a thermally conductive silicone grease.
Since the performance of the device was measured in a simulated environment, this device can be applied to a real ship in terms of waste-heat recovery from the tailpipe and carbon emission reduction.

Author Contributions

X.L. and C.Z. conceived and designed the experiments; C.Z. performed the experiments; H.G. and Z.W. analyzed the data; Z.W. contributed materials/analysis tools; X.L. and C.Z. wrote the paper. All authors have read and agreed to the published version of the manuscript.

Funding

This work was supported by the Science and Technology Commission of Shanghai Municipality and Shanghai Engineering Research Center of Ship Intelligent Maintenance and Energy Efficiency under Grant 20DZ2252300.

Institutional Review Board Statement

Not applicable.

Informed Consent Statement

Not applicable.

Data Availability Statement

Not applicable.

Conflicts of Interest

The author declares that there is no conflict of interest regarding the publication of this paper.

Nomenclature

TcThe temperature at the cold end (°C)
ThThe temperature at the hot end (°C)
T (°C)The temperature difference (°C)
αPThe Seebeck coefficient for P-type semiconductor materials (V/K)
αNThe Seebeck coefficient for N-type semiconductor materials (V/K)
αmThe Seebeck coefficient for temperature differential generation (V/K)
ZThe thermoelectric figure of merit (K−1)
σThe electrical conductivity (S/m)
KThe thermal conductivity (W/m·k)
SThe Seebeck coefficient (mV/K)
TThe average temperature of the material (°C)
RloadThe external resistance (Ω)
RintThe resistance (Ω)
qhThe amount of heat extracted per unit time (J)
qmHeat flow per unit time per pair of semiconductors into the metal conductor (J)
qJEnergy per unit time of a pair of semiconductors entering a metallic conductor (J)
qpEnergy of a pair of semiconductors flowing out of a metal conductor (J)
qc,oThe heat carried away by the heat conduction (J)
QThe Peltier coefficient of the conductor (J)
πmThe Peltier factor (W/A)
IElectric current (A)
αnThe Seebeck coefficient (V/K)
RnThe thermal resistance of P-type and N-type semiconductors (K/W)
Pm,maxThe output power is maximum (W)
qm,maxThe amount of heat per unit time flowing into the deflector (J)
PTThe maximum output power (K/W)
qTThe heat flow per unit time into the temperature differential generator (J)
ηTThe maximum efficiency (%)

References

  1. Ye, W.; Liu, C.; Liu, J.; Wang, H.; Yang, S.; Pan, X. Research on TEG–ORC Combined Bottom Cycle for Cascade Recovery from Various Vessel Waste Heat Sources. Arab. J. Sci. Eng. 2022, 47, 3151–3161. [Google Scholar] [CrossRef]
  2. Jayswal, R.S.; Pandit, D.; Prakashbhai, S.N.; Bhavsar, U.N.; Prajapati, R.G. Review Paper on Inverted Brayton Cycles. J. Sci. Technol. 2020, 5, 78–84. [Google Scholar] [CrossRef]
  3. Zhu, S.; Zhang, K.; Deng, K. A review of waste heat recovery from the marine engine with highly efficient bottoming power cycles. Renew. Sustain. Energy Rev. 2020, 120, 109611. [Google Scholar] [CrossRef]
  4. Mariani, A.; Mastellone, M.L.; Morrone, B.; Prati, M.V.; Unich, A. An organic Rankine cycle bottoming a diesel engine powered passenger car. Energies 2020, 13, 314. [Google Scholar] [CrossRef]
  5. Omam, S.H. Exhaust waste energy recovery using Otto-ATEG-Stirling engine combined cycle. Appl. Therm. Eng. 2021, 183, 116210. [Google Scholar] [CrossRef]
  6. Ng, P.S.C.W.; Tam, I. Overview of Waste Heat Recovery Technologies for Maritime Applications. Soc. Nav. Archit. Mar. Eng. Singap. 2019, 64. Available online: http://snames.org.sg/wp-content/uploads/38thAnnualJournal.pdf#page=64 (accessed on 29 August 2022).
  7. Luo, D.; Wang, R.; Yu, W.; Sun, Z.; Meng, X. Modelling and simulation study of a converging thermoelectric generator for engine waste heat recovery. Appl. Therm. Eng. 2019, 153, 837–847. [Google Scholar] [CrossRef]
  8. Lim, T.-W.; Choi, Y.-S. Thermal design and performance evaluation of a shell-and-tube heat exchanger using LNG cold energy in LNG fuelled ship. Appl. Therm. Eng. 2020, 171, 115120. [Google Scholar] [CrossRef]
  9. Tian, Z.; Zeng, W.; Gu, B.; Zhang, Y.; Yuan, X. Energy, exergy, and economic (3E) analysis of an organic Rankine cycle using zeotropic mixtures based on marine engine waste heat and LNG cold energy. Energy Convers. Manag. 2021, 228, 113657. [Google Scholar] [CrossRef]
  10. Yuan, T.; Song, C.; Zhang, R.; Zhang, X.; Zhang, N.; Bao, J. Energy and Economic Optimization of the Multistage Condensation Rankine Cycle That Utilizes LNG Cold Energy: Considerations on Working Fluids and Cycle Configurations. ACS Sustain. Chem. Eng. 2019, 7, 13505–13516. [Google Scholar] [CrossRef]
  11. Yu, H.; Kim, D.; Gundersen, T. A study of working fluids for Organic Rankine Cycles (ORCs) operating across and below ambient temperature to utilize Liquefied Natural Gas (LNG) cold energy. Energy 2019, 167, 730–739. [Google Scholar] [CrossRef]
  12. Kober, M.; Knobelspies, T.; Rossello, A.; Heber, L. Thermoelectric Generators for Automotive Applications: Holistic Optimization and Validation by a Functional Prototype. J. Electron. Mater. 2020, 49, 2902–2909. [Google Scholar] [CrossRef]
  13. Kober, M. The high potential for waste heat recovery in hybrid vehicles: A comparison between the potential in conventional and hybrid powertrains. J. Electron. Mater. 2020, 49, 2928–2936. [Google Scholar] [CrossRef]
  14. Ezzitouni, S.; Fernández-Yáñez, P.; Sánchez Rodríguez, L.; Armas, O.; de las Morenas, J.; Massaguer, E.; Massaguer, A. Electrical modelling and mismatch effects of thermoelectric modules on performance of a thermoelectric generator for energy recovery in diesel exhaust systems. Energies 2021, 14, 3189. [Google Scholar] [CrossRef]
  15. Heber, L.; Schwab, J. Modelling of a thermoelectric generator for heavy-duty natural gas vehicles: Techno-economic approach and experimental investigation. Appl. Therm. Eng. 2020, 174, 115156. [Google Scholar] [CrossRef]
  16. Lesage, F.J.; Pagé-Potvin, N. Experimental analysis of peak power output of a thermoelectric liquid-to-liquid generator under an increasing electrical load resistance. Energy Convers. Manag. 2013, 66, 98–105. [Google Scholar] [CrossRef]
Figure 1. The internal structure of the temperature differential power generation sheet.
Jmse 10 01281 g001
Figure 2. A pair of semiconductor models for temperature differential power generation.
Jmse 10 01281 g002
Figure 3. Energy analysis of the upper metal conductor.
Jmse 10 01281 g003
Figure 4. Temperature-difference power generation sheet.
Jmse 10 01281 g004
Figure 5. (a) Experimental platform overall structure diagram. (b) Schematic diagram of the temperature-difference power generation sheet arrangement and area.
Jmse 10 01281 g005aJmse 10 01281 g005b
Figure 6. Experimental platform.
Jmse 10 01281 g006
Figure 7. The effect of insulation on the performance of temperature differential power generation. (a) Effect of insulation material on cooling plate temperature; (b) Effect of insulation material on open circuit voltage; (c) Effect of insulation material on output power.
Jmse 10 01281 g007
Figure 8. The effect of pressure on the performance of temperature differential power generation. (a) Influence of temperature differential generation sheet installation pressure on cooling plate temperature; (b) Effect of installation pressure of temperature differential power generation sheet on open circuit voltage; (c) Effect of installation pressure of temperature differential power generator on output power.
Jmse 10 01281 g008aJmse 10 01281 g008b
Figure 9. The effect of thermally conductive silicone grease on the performance of temperature differential power generation. (a) Effect of the presence or absence of thermally conductive silicone grease on the temperature of the cooling plate; (b) Influence of open circuit voltage with or without thermal conductive silicone grease; (c) Influence of the output power with or without thermal grease.
Jmse 10 01281 g009aJmse 10 01281 g009b
Figure 10. Effect of cooling water temperature on the performance of temperature differential power generation. (a) Influence of cooling water temperature on cooling plate temperature; (b) The effect of cooling water temperature on open circuit voltage; (c) Effect of cooling water temperature on output power.
Jmse 10 01281 g010
Figure 11. The effect of heat source temperature on the performance of temperature differential power generation. (a) the effect of heat source temperature on the cooling plate temperature; (b) the effect of heat source temperature on the open circuit voltage; (c) the effect of heat source temperature on the output power.
Jmse 10 01281 g011aJmse 10 01281 g011b
Publisher’s Note: MDPI stays neutral with regard to jurisdictional claims in published maps and institutional affiliations.

