Article

Distribution Characteristics and Ecological Risk Assessment of Heavy Metals in Marine Sediments of Binhai County, Jiangsu Province

1
School of Marine Science and Engineering, Nanjing Normal University, Nanjing 210023, China
2
Sea Area Use Dynamic Surveillant and Monitoring Center of Jiangsu Province, Nanjing 210023, China
*
Author to whom correspondence should be addressed.
J. Mar. Sci. Eng. 2022, 10(9), 1242; https://doi.org/10.3390/jmse10091242
Submission received: 26 July 2022 / Revised: 31 August 2022 / Accepted: 31 August 2022 / Published: 3 September 2022
(This article belongs to the Special Issue Chemical Contamination on Coastal Ecosystems)

Abstract

:
In recent years, research on heavy metals has become very popular, because the status of heavy metals can reflect the marine environment of a region. Based on this, this paper carries out the evaluation and analysis of heavy metals in marine sediments. Based on the content of the heavy metals in the coastal sediments of Binhai, Jiangsu, from coastal waters in the autumns of 2012, 2015, and 2018, the environmental quality was quantitatively evaluated using the geoaccumulation index and potential ecological risk. The sources of the heavy metals were identified by a multivariate analysis, and the changes over the years and the distribution characteristics were analyzed. Hg and Cr were at a clean grade, while other heavy metals contents indicated mild-to-moderate pollution in the three sets of monitoring data. The comprehensive ecological risk index assessment showed that Hg and Cd were at a moderate ecological risk level in the three sets of monitoring data. Overall, the study area exhibited a mild-to-moderate ecological risk level, with a continuously increasing trend. The overall content of heavy metal in this sea area is greatly affected by human activities, with high values occurring in ports, estuaries, and outer seas.

1. Introduction

As important transition zones connecting land and sea, coastal zones are under great pressure from the development of coastal cities and human activities and are prone to various environmental issues. As a huge transfer pump, seawater connects countries around the world. These environmental pollutions will eventually enter the ocean and continue to affect other regions. Therefore, from the perspective of globalization, it is necessary to carry out research on the regional marine environment and take corresponding measures. Pollution in coastal zones mainly originates from land-based pollutant emissions, marine engineering and construction emissions, mariculture, and atmospheric deposition [1]. Sediment is a key carrier of heavy metals. Heavy metal elements in seawater attach to particles in the water body through absorption, accumulation, and flocculation, settle into the sediment, and eventually cause harm to living organisms and humans through the food chain [2,3]. When the external environment is suitable, heavy metals in the sediment will re-enter the water body and threaten the water environment [4,5]. Therefore, research into the sources, spatial distribution, and ecological risks of heavy metals in coastal sediments can provide an effective reference and basis for environmental quality assessment and the development and utilization of coastal zones.
The coastal waters located in the mid-north part of Jiangsu feature a port area with deep water close to the shore. The port area has a long coastline, open land area, a stable seabed, and a stable geological structure. These features are promising for the future development of the Jiangsu port industry [6]. With the increasing demand for economic development and utilization in coastal areas, the construction and development of coastal port areas have entered a period of unprecedented vigorous growth. At present, the coastal waters of Binhai feature a coastal port area, a port industrial zone, and large-scale offshore wind farms. With the development of the port industry, nearshore development and construction activities are increasing day by day, negatively impacting the local environment. The pollution status of the marine environment can be reflected in the contents of the heavy metals in the sediment, and the sources of heavy metals can be inferred based on the changes in their distribution over the years so as to conduct targeted environmental control measures [7,8].
Scholars have conducted relevant research on the heavy metal pollution in the coastal areas of Jiangsu. However, most of the existing research is limited to a certain area at a specific time of year. The ecological risk assessment, the sources, and changes in the heavy metal content in the coastal sediments of Binhai County have not yet been reported. Taking the coastal waters of Binhai County as the study area, this paper evaluated the content of the heavy metals in the surface sediments using autumn sediment survey data from 2012, 2015, and 2018. The objectives of this study were as follows: (1) to conduct a quantitative analysis of the content, pollution degree, and ecological risk of the heavy metals in the ocean sediments; (2) to determine the possible sources and spatial distribution characteristics of the heavy metals by means of a correlation analysis and cluster analysis; and (3) to obtain the changes and trends in the heavy metal in the coastal sediments by comparing the three monitoring results. This study discussed the pollution of heavy metal and its sources in the coastal area of Binhai County. These findings can provide a scientific basis for the development, utilization, and environmental protection of the Binhai area.

2. Materials and Methods

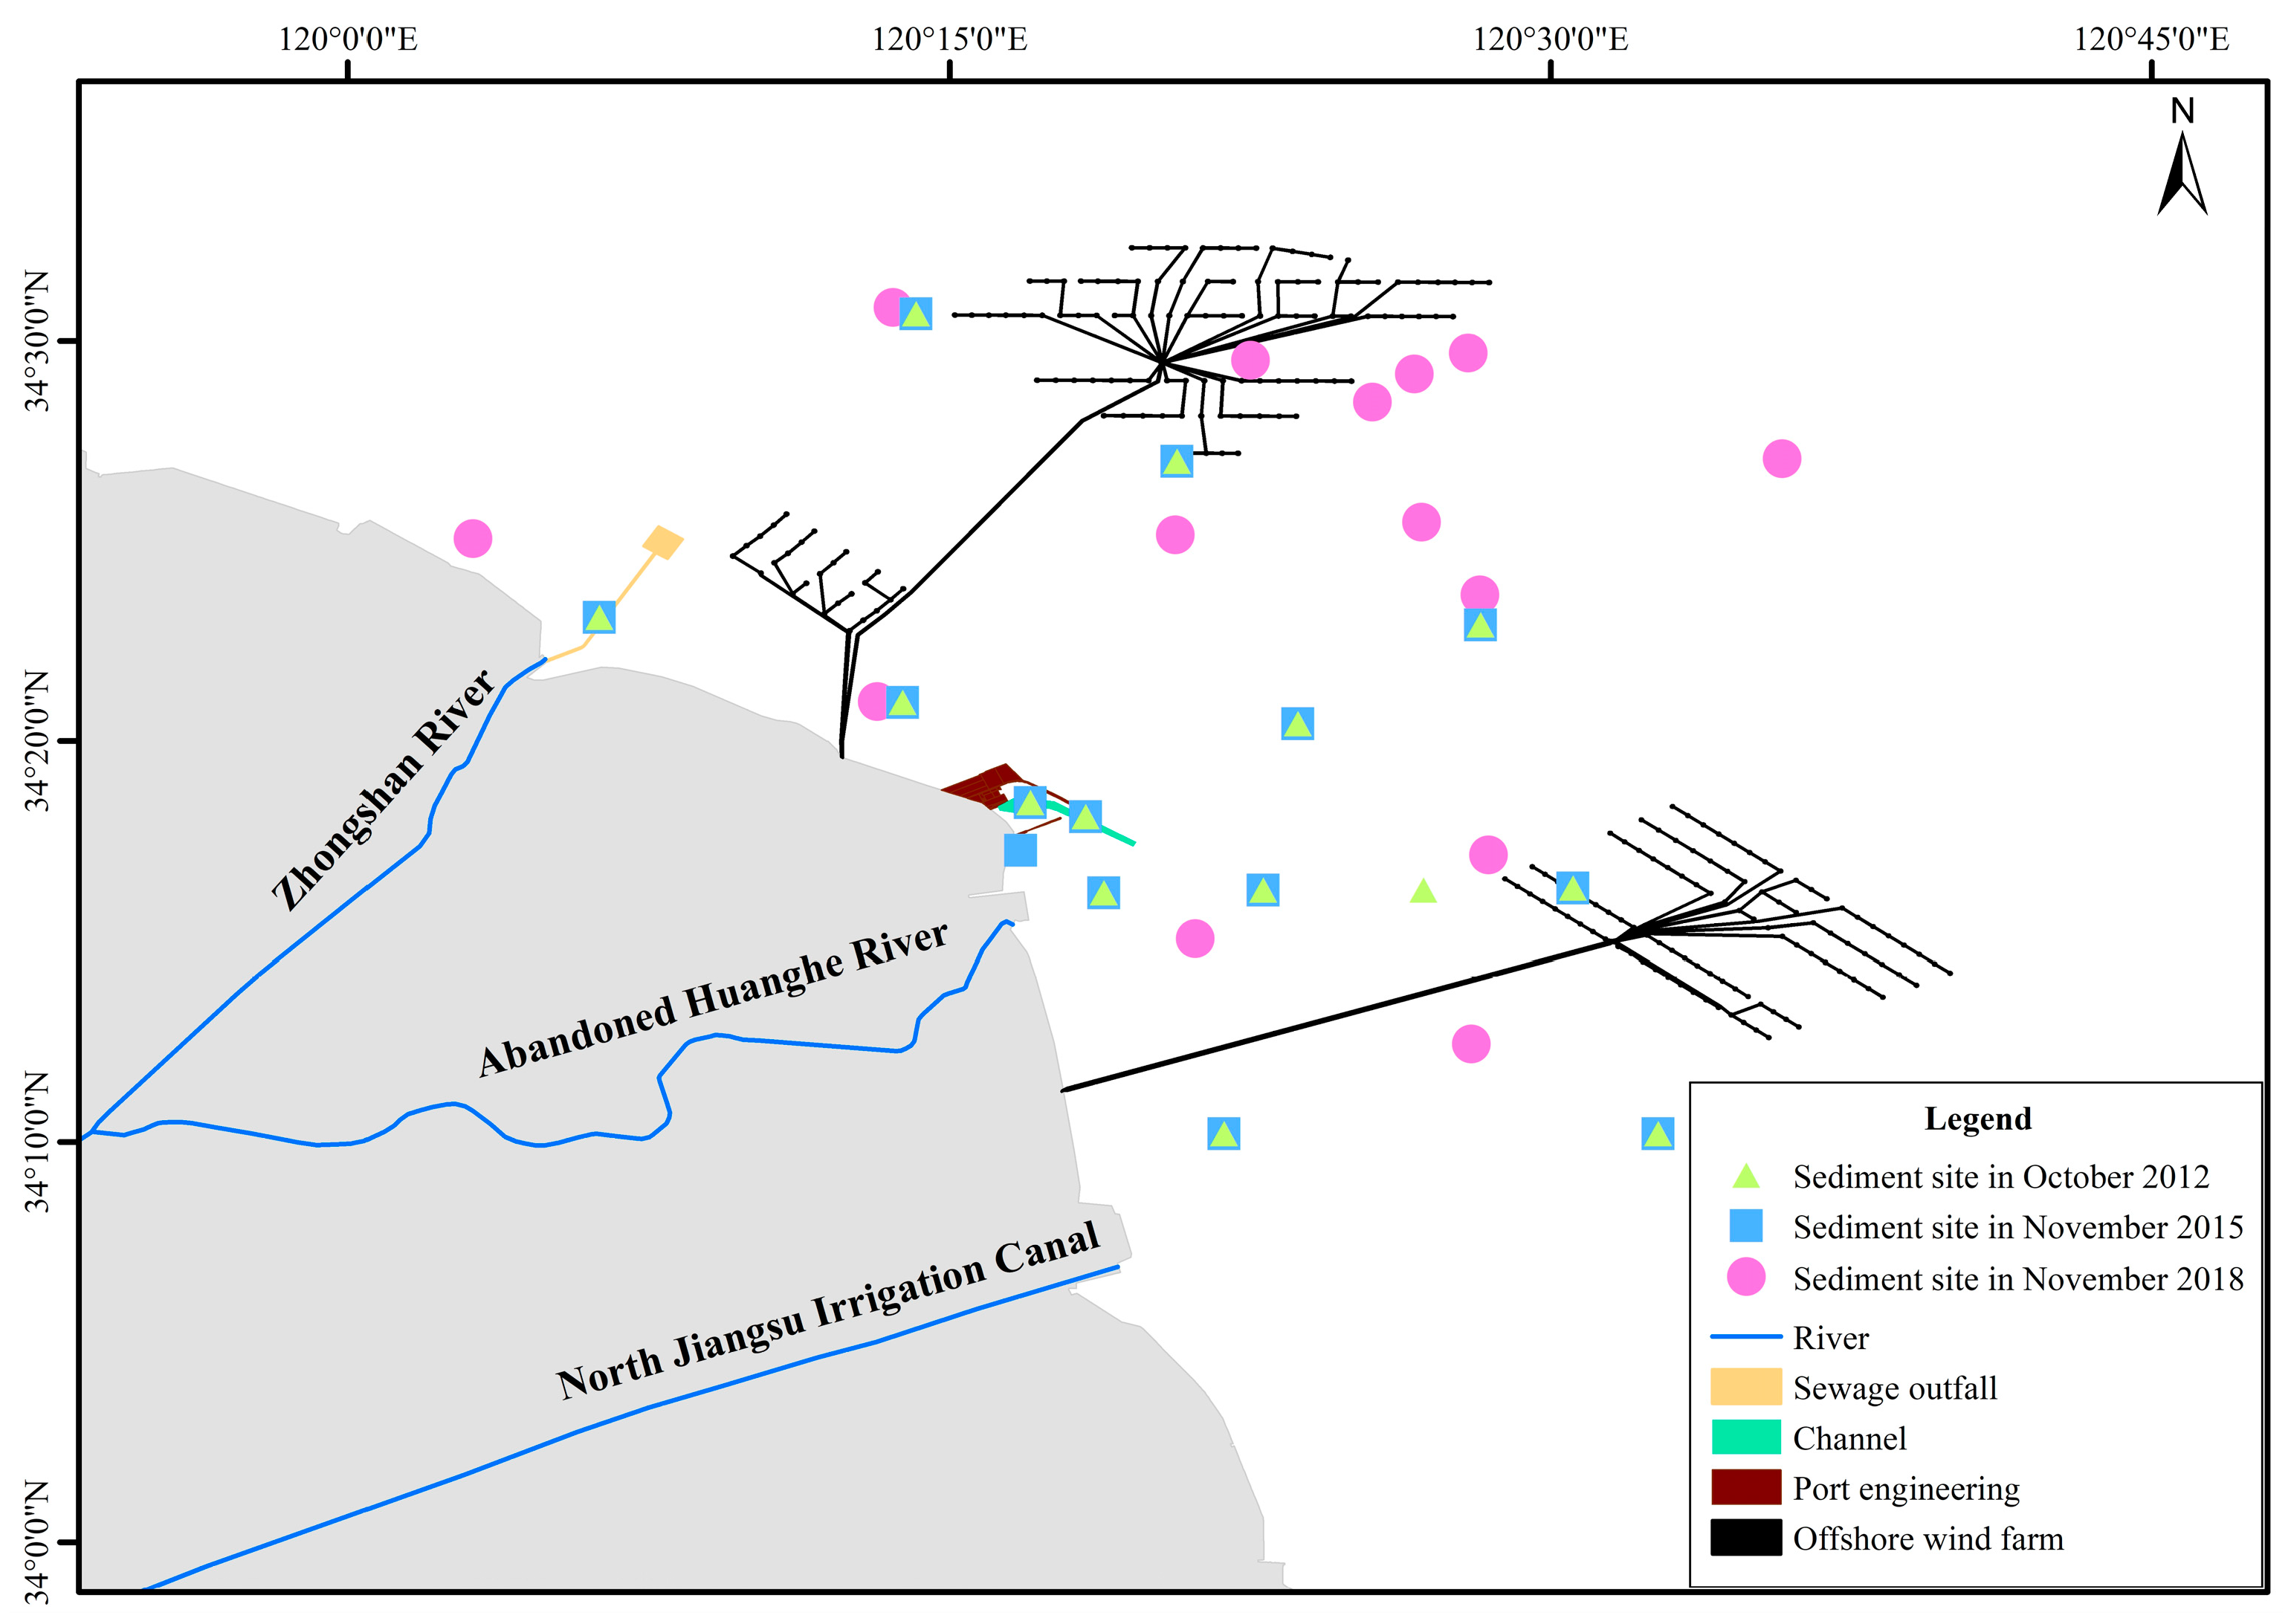
2.1. Study area Overview

The study area belongs to Binhai County, Jiangsu Province, and faces the Yellow Sea to the east. Binhai County belongs to the Huang–Huai alluvial plain, which is part of the northern Jiangsu Plain. The terrain is flat. The coastline trend changes from NW–SE to S–N, with an erosive, silty, and muddy coast [9].
The sediment distribution is zonal in coastal waters. Waves in shallow waters with a depth of 5 m or more exert relatively strong effects on the seabed. The surface sediment is correspondingly coarse, with a median particle size of 0.1–0.16 mm. The median particle size of the sediment is 0.01–0.1 mm in waters with depths of 5 to 10 m. The median particle size in 10 to 15 m deep waters is generally less than 0.03 mm, and it consists of clayey silt. The median particle size in 15 to 20 m deep waters increases to 0.03–0.06 mm, which is sandy silt. It can be considered that the particle size of sediments changes from coarse to fine from nearshore to offshore. In addition, the sediment changes from silty to clayey [10]
The main types of marine development in the region include port, sewage discharge, aquaculture, and wind electricity activities. The Binhai port is a strategic location for Jiangsu Province to develop major port industrial projects. At present, the Binhai port consists of a 100,000-ton port with a supporting industrial park. Industrial wastewater is discharged into the sea through a sewage outlet 6 km downstream of the Zhongshan River estuary. A pond aquaculture area is located south of the industrial park. Aquaculture wastewater is discharged through the coastal gate. There are three main rivers entering the sea in the study area, and three large-scale wind farms have been built.

2.2. Sample Collection and Processing

The sampling times used in the field survey were October 2012, November 2015, and November 2018. Fourteen surface sediment samples were collected for each survey. The site layout is shown in Figure 1. A total of seven heavy metals were surveyed, including Cu, Hg, Pb, As, Zn, Cr, and Cd. The on-site sampling method used was in accordance with the relevant technical regulations. Sediment samples were collected by a grapple-type mud collector, loaded into polyethylene bags or ground-glass wide-mouth bottles, placed in a cool location, and stored in a refrigerator at 4 °C. After the samples were naturally air-dried, any gravel and large grains of plant and animal remains were removed. The samples were put into an agate bowl and ground through a 160-mesh sieve. After being fully mixed, the samples were taken for elemental analysis.

2.3. Main Methods

2.3.1. Heavy Metal Pollution Assessments

  • Geoaccumulation index
The pollution degree of heavy metals was quantitatively evaluated by the geoaccumulation index (Igeo) in this study. Geoaccumulation index assessment [11] is a commonly used method to evaluate heavy metal pollution. It takes into account the background value changes caused by human activities and natural geological processes. Equation (1) is:
I g e o = l o g 2 C n 1.5 B n
where Cn represents the measured value of an element, n ; Bn represents the background value of element n. The element contents in Jiangsu coastal soil measured by Chen et al. [12] in the 1980s were used as the background values. Table 1 shows the classification standard of the geoaccumulation index.
  • Potential ecological risk assessment
Swedish environmentalist, Hakanson, proposed the potential ecological risk index method to evaluate the ecological harm of heavy metals in soil and sediment in 1980. The method not only considers the content of heavy metals, but it also integrates the potential toxicity and environmental reactions. This paper conducted weighted assessment on heavy metals.
C f i = C i / C n i , E r i = T r t × C f i , R I = ( E r i ) ,
where C f i is the pollution index of heavy metal i ; Eir represents the potential ecological risk index of heavy metal i; RI is the comprehensive potential ecological risk index of various heavy metals; C i is the measured value of i ; C n i is the background value of i ; T r t is the toxicological coefficient of a certain element. The toxicity coefficients of Zn, Cr, Pb, Cu, As, Cd, and Hg were 1, 2, 5, 5, 10, 30, and 40, respectively. Table 1 displays the classification standard of each index [13].

2.3.2. Multivariate Statistical Analysis

The combination of correlation analysis and cluster analysis is an effective means to identify heavy metal sources. In this paper, SPSS26 software was used for correlation analysis and cluster analysis to analyze the sources of heavy metals. The Pearson correlation coefficient and two-tailed test were used for correlation analysis. Surfer and ArcGIS were used to draw the maps.

3. Results

3.1. Statistical Results of Heavy Metal Content in Sediments

The statistical results of the heavy metal contents in the surface sediments of the study area are shown in Table 2. The average contents of the Pb, Cu, As, Zn, and Cd over the three years exceeded the background values. The overall quality in 2015 was less compared with the values in 2012 and 2018. According to the site data, the highest heavy metal contents in 2012 appeared in the sea off the abandoned Yellow River estuary, the Binhai port, and its outer waters. In 2015, high values of Cu appeared in the sea off the abandoned Yellow River estuary. High values of Zn appeared in waters from the south of the Zhongshan estuary to the north of the abandoned Yellow River estuary. High values of Pb, As, and Hg appeared in the Zhongshan estuary, outside of the Binhai port, and in the sea off the North Jiangsu Main Irrigation Canal. High values of Cd appeared near the estuaries. In 2018, high values of As appeared in the northern study area and the south side of the abandoned Yellow River estuary. High values of Cu and Hg were detected in the outer waters of the Binhai port to the North Jiangsu Main Irrigation Canal estuary. The Pb content was high in the south side of the abandoned Yellow River estuary. The Zn content was high in the nearshore sea area. Moreover, high values of Cd appeared on both sides and in the offshore of the Zhongshan estuary. In general, the distribution pattern of the heavy metal in the study area was relatively consistent. The content of the Cr was lower than the background value, while other elements had high value zones in the ports, estuaries, and outer waters.

3.2. Assessment of Heavy Metal Pollution

3.2.1. Geoaccumulation Index

The statistical results of the geoaccumulation index are shown in Table 3. By comparing the mean values of each factor in the three assessment results, it was found that the Hg and Cr levels were low enough to be considered clean and pollution free in the three sets of monitoring data. Furthermore, the Cu, Zn, and As levels ranked from a clean grade to mild pollution. The geoaccumulation index of the Cd showed a significant upward trend. In 2018, the Cd pollution was moderate, while the pollution degree of Pb declined to mild-to-moderate pollution.

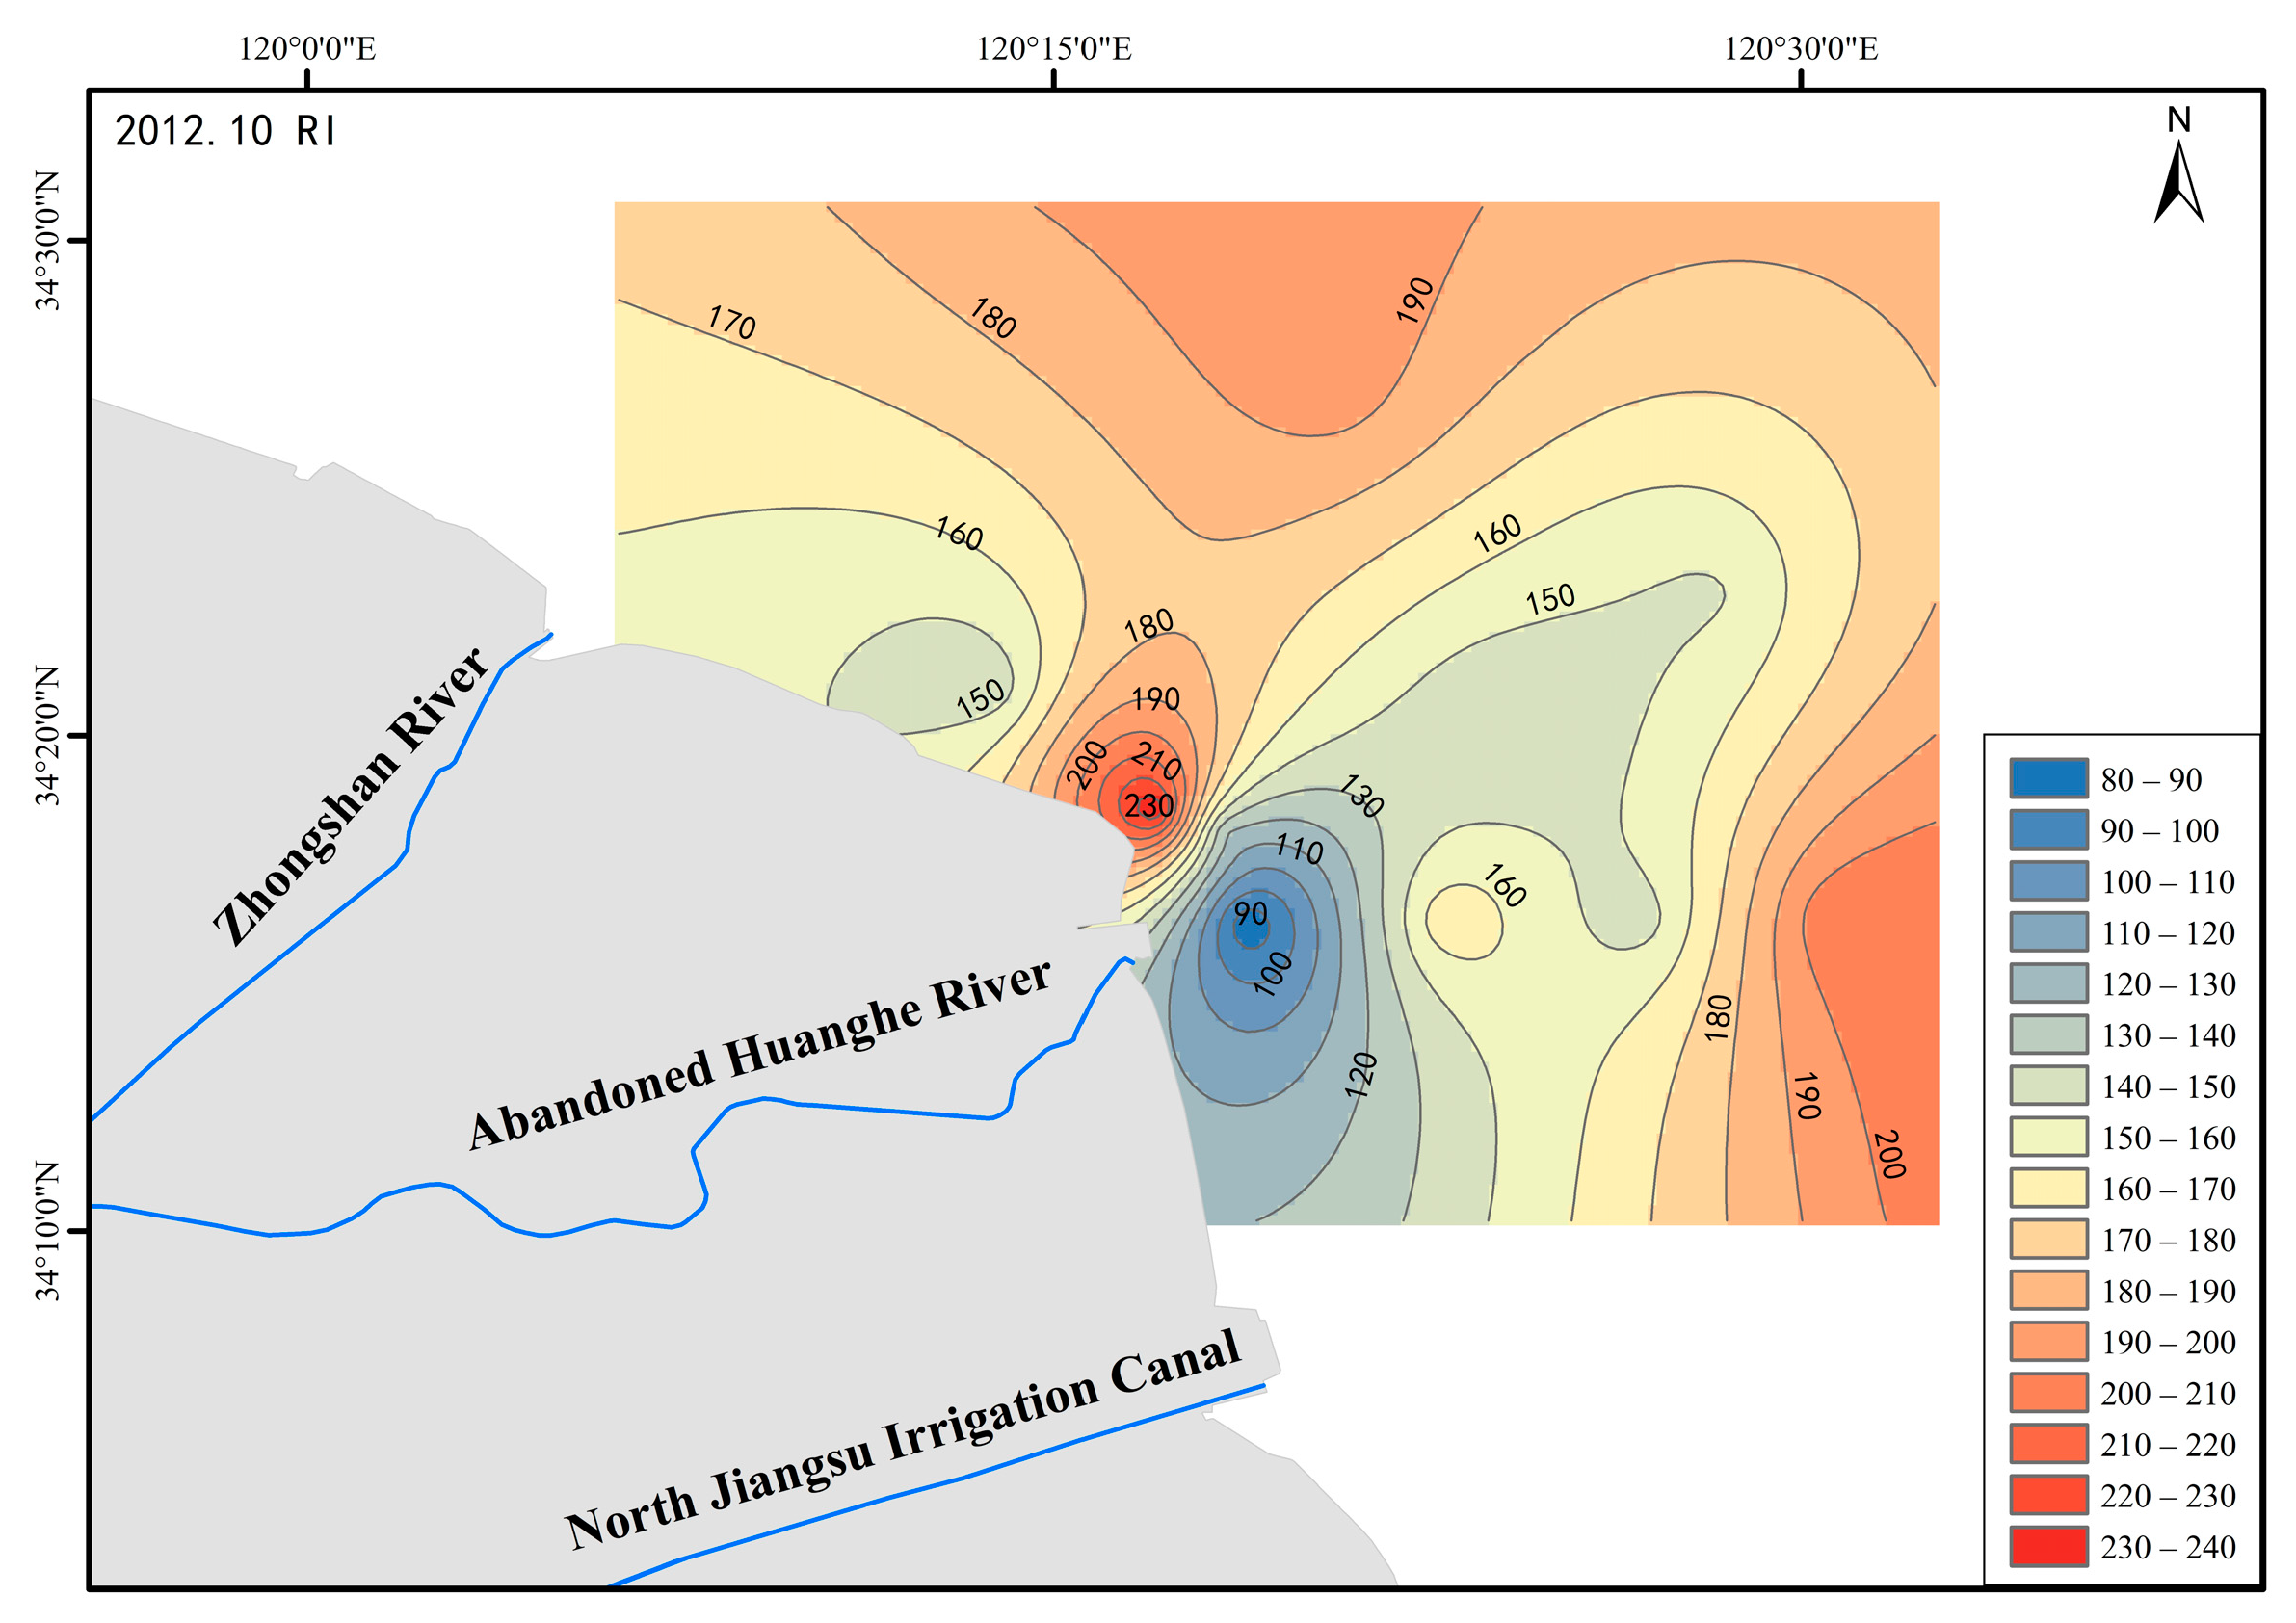
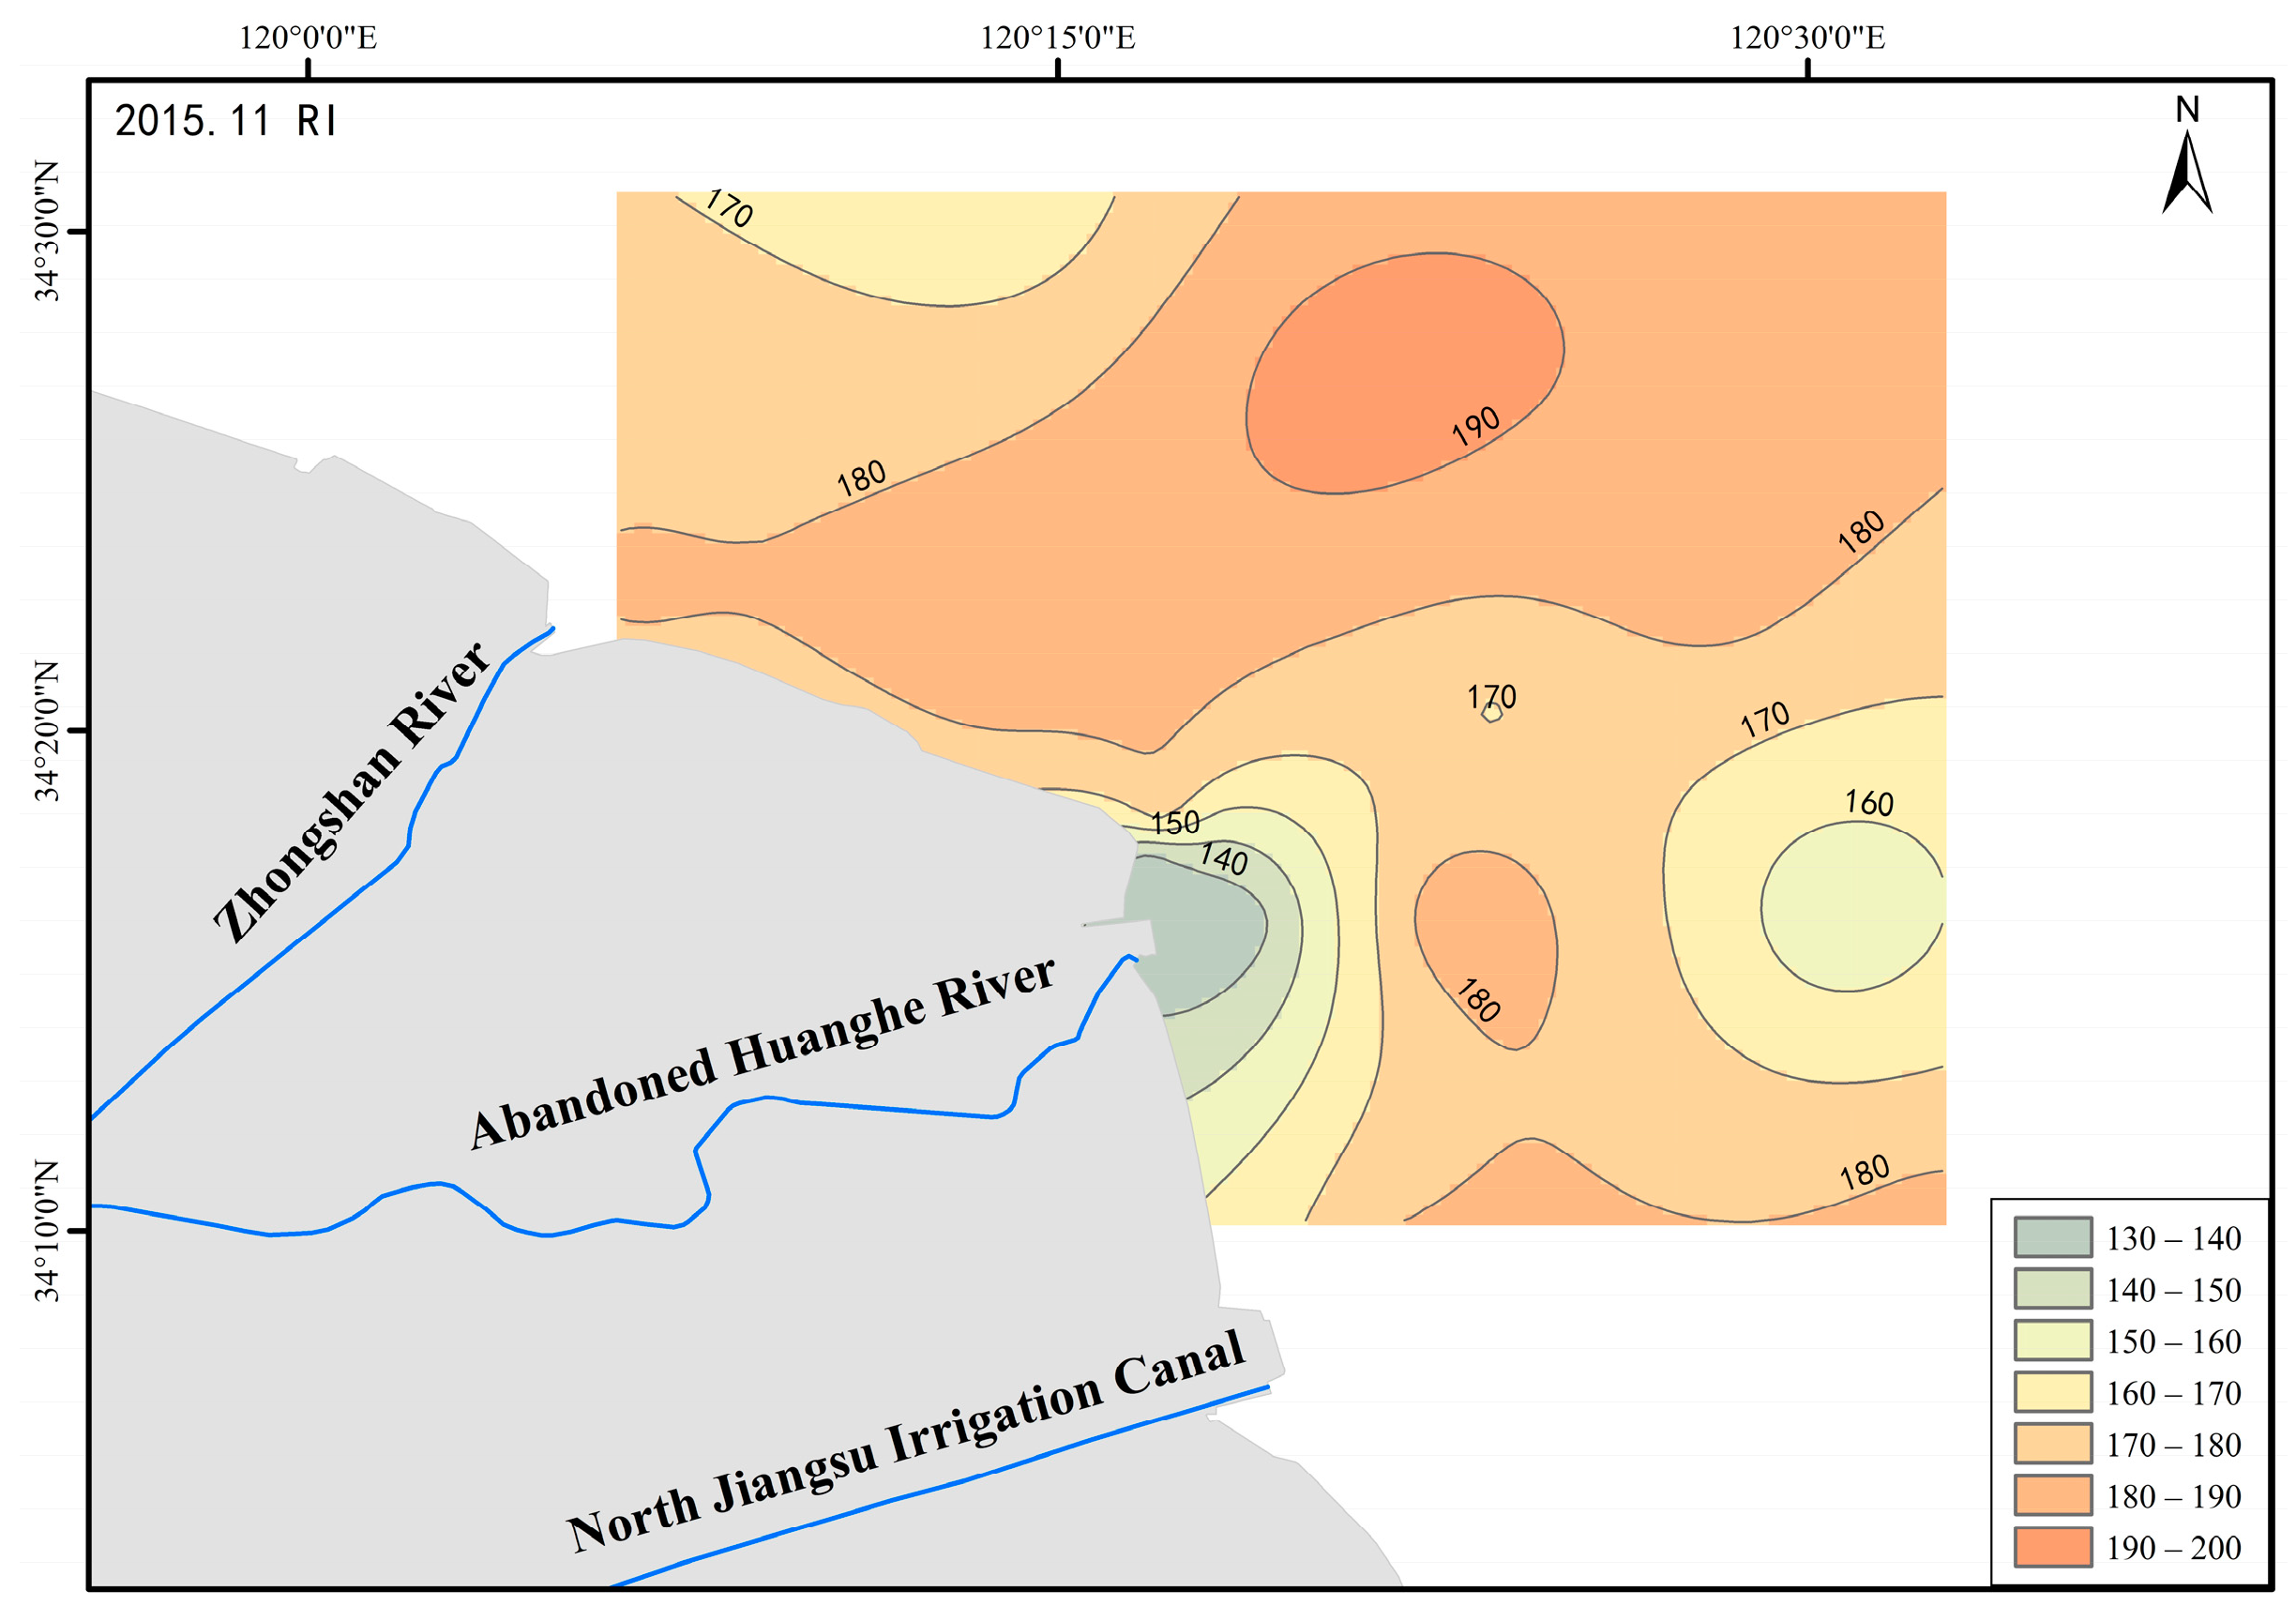
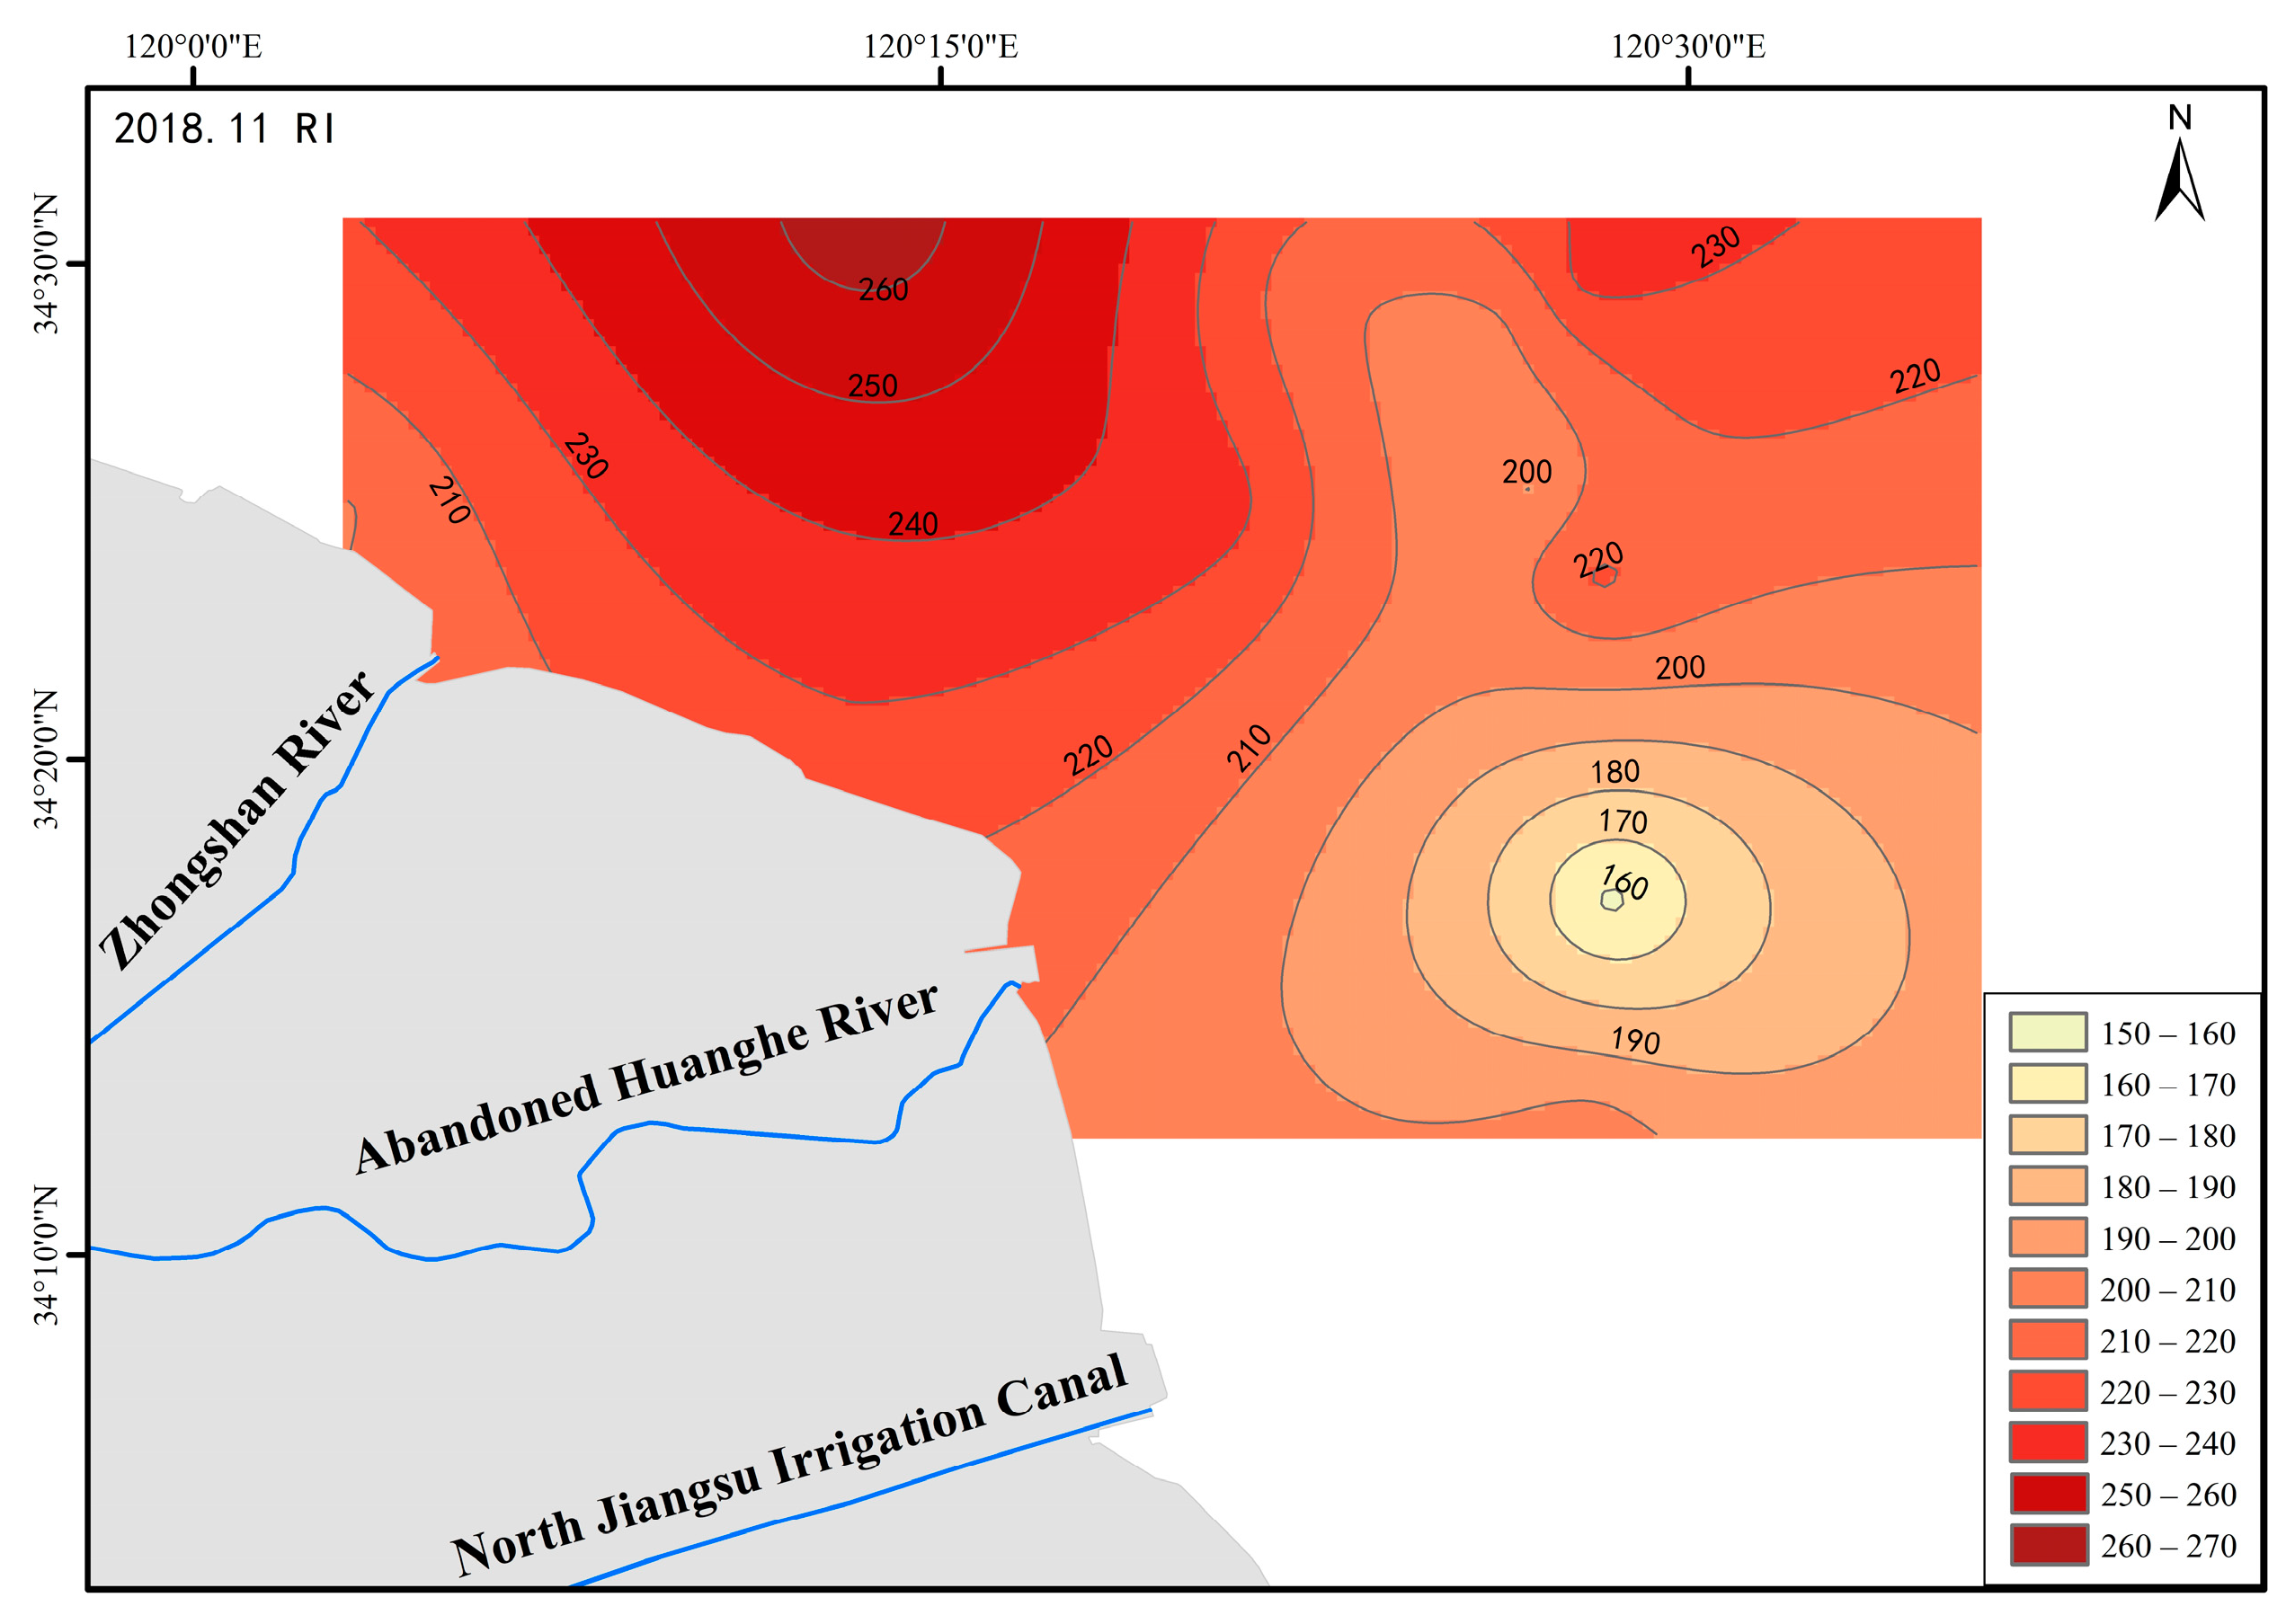
3.2.2. Potential Ecological Risk Index

The statistical results (Table 4) showed that the average value of the potential ecological risk of the heavy metals was Cd, Hg, As, Pb, Cu, Zn, and Cr in descending order. The ecological risks of Cd and Hg were high. The mean value of Cd was at a moderate-to-high ecological risk level. The mean value of Hg was at a moderate risk level. Other elements were at a low ecological risk level. The mean values of the comprehensive index were at a moderate level in all three periods. In addition, the mean values over the years displayed an upward trend. Cd and Hg were major contributors to the potential ecological risk. Figure 2, Figure 3 and Figure 4 show the distribution of the comprehensive ecological risk index values for the three monitoring periods. In 2012, the comprehensive risk index showed a trend of increasing from nearshore to offshore areas, with high values in the Zhongshan estuary, the abandoned Yellow River estuary, and the Binhai port and its outer waters. The spatial trend of the comprehensive potential ecological risk index in 2015 was basically consistent with that in 2012. The overall risk index of the study area was higher in 2018, gradually increasing from the south to the north of the outer sea area.

3.3. Analysis of Heavy Metal Sources and Changes Based on Multivariate Statistics

3.3.1. Correlation Analysis

The three sets of monitoring data were analyzed separately in order to obtain variable correlations. The Pearson correlation matrix is shown in Table 5, Table 6 and Table 7. The results revealed that Cu was significantly positively correlated with Pb, Zn, As, Hg, and Cd in 2012. In 2015, Hg was significantly positively correlated with As, while Cr was significantly negatively correlated with As. In addition, Zn was significantly positively correlated with Cd, while Cu was significantly negatively correlated with Cr in 2018.

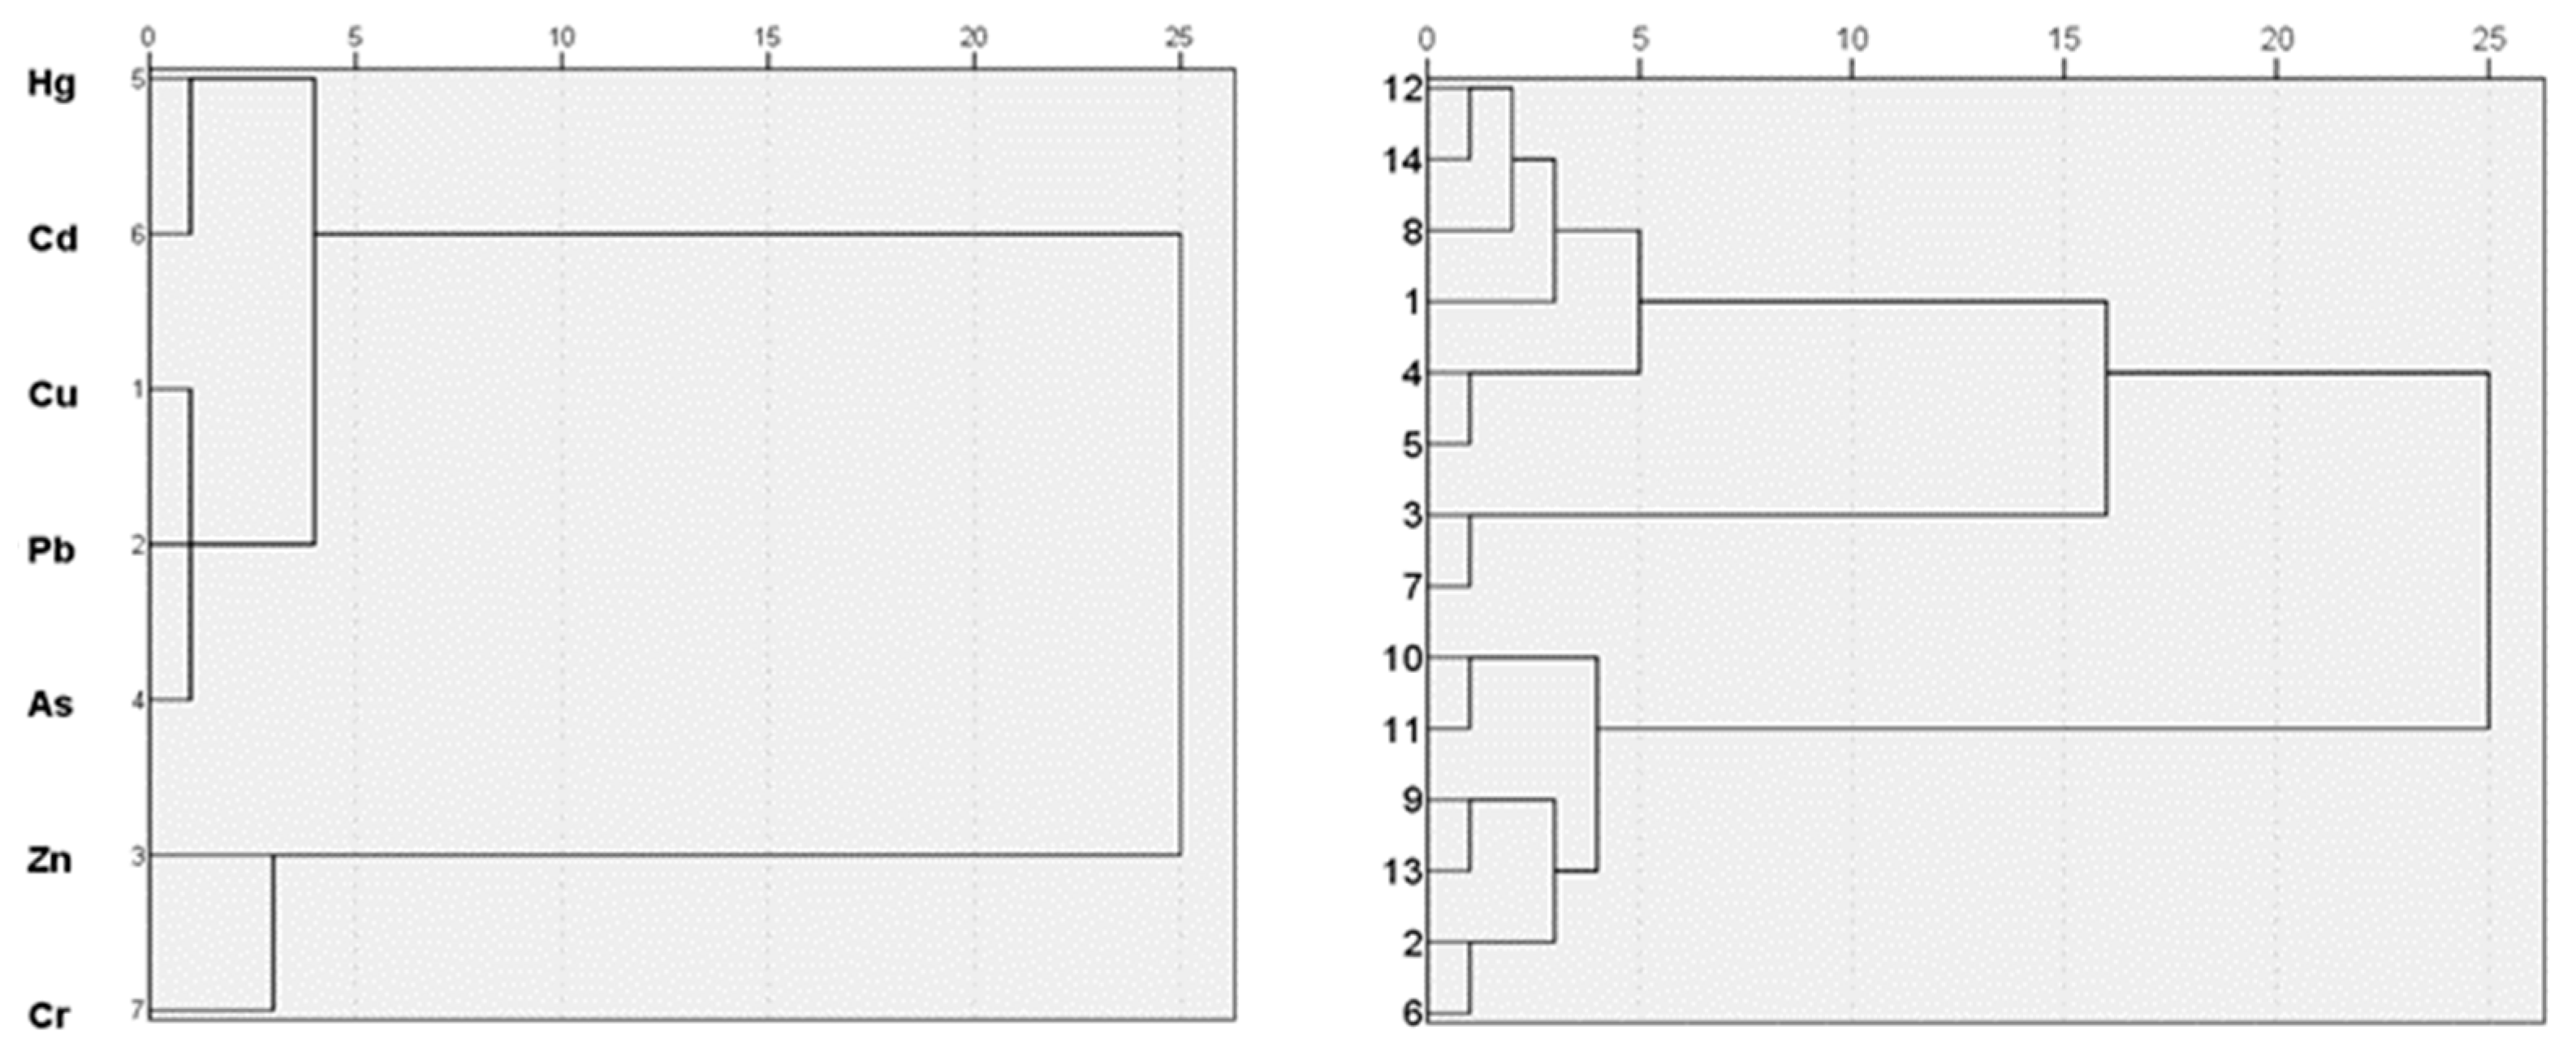
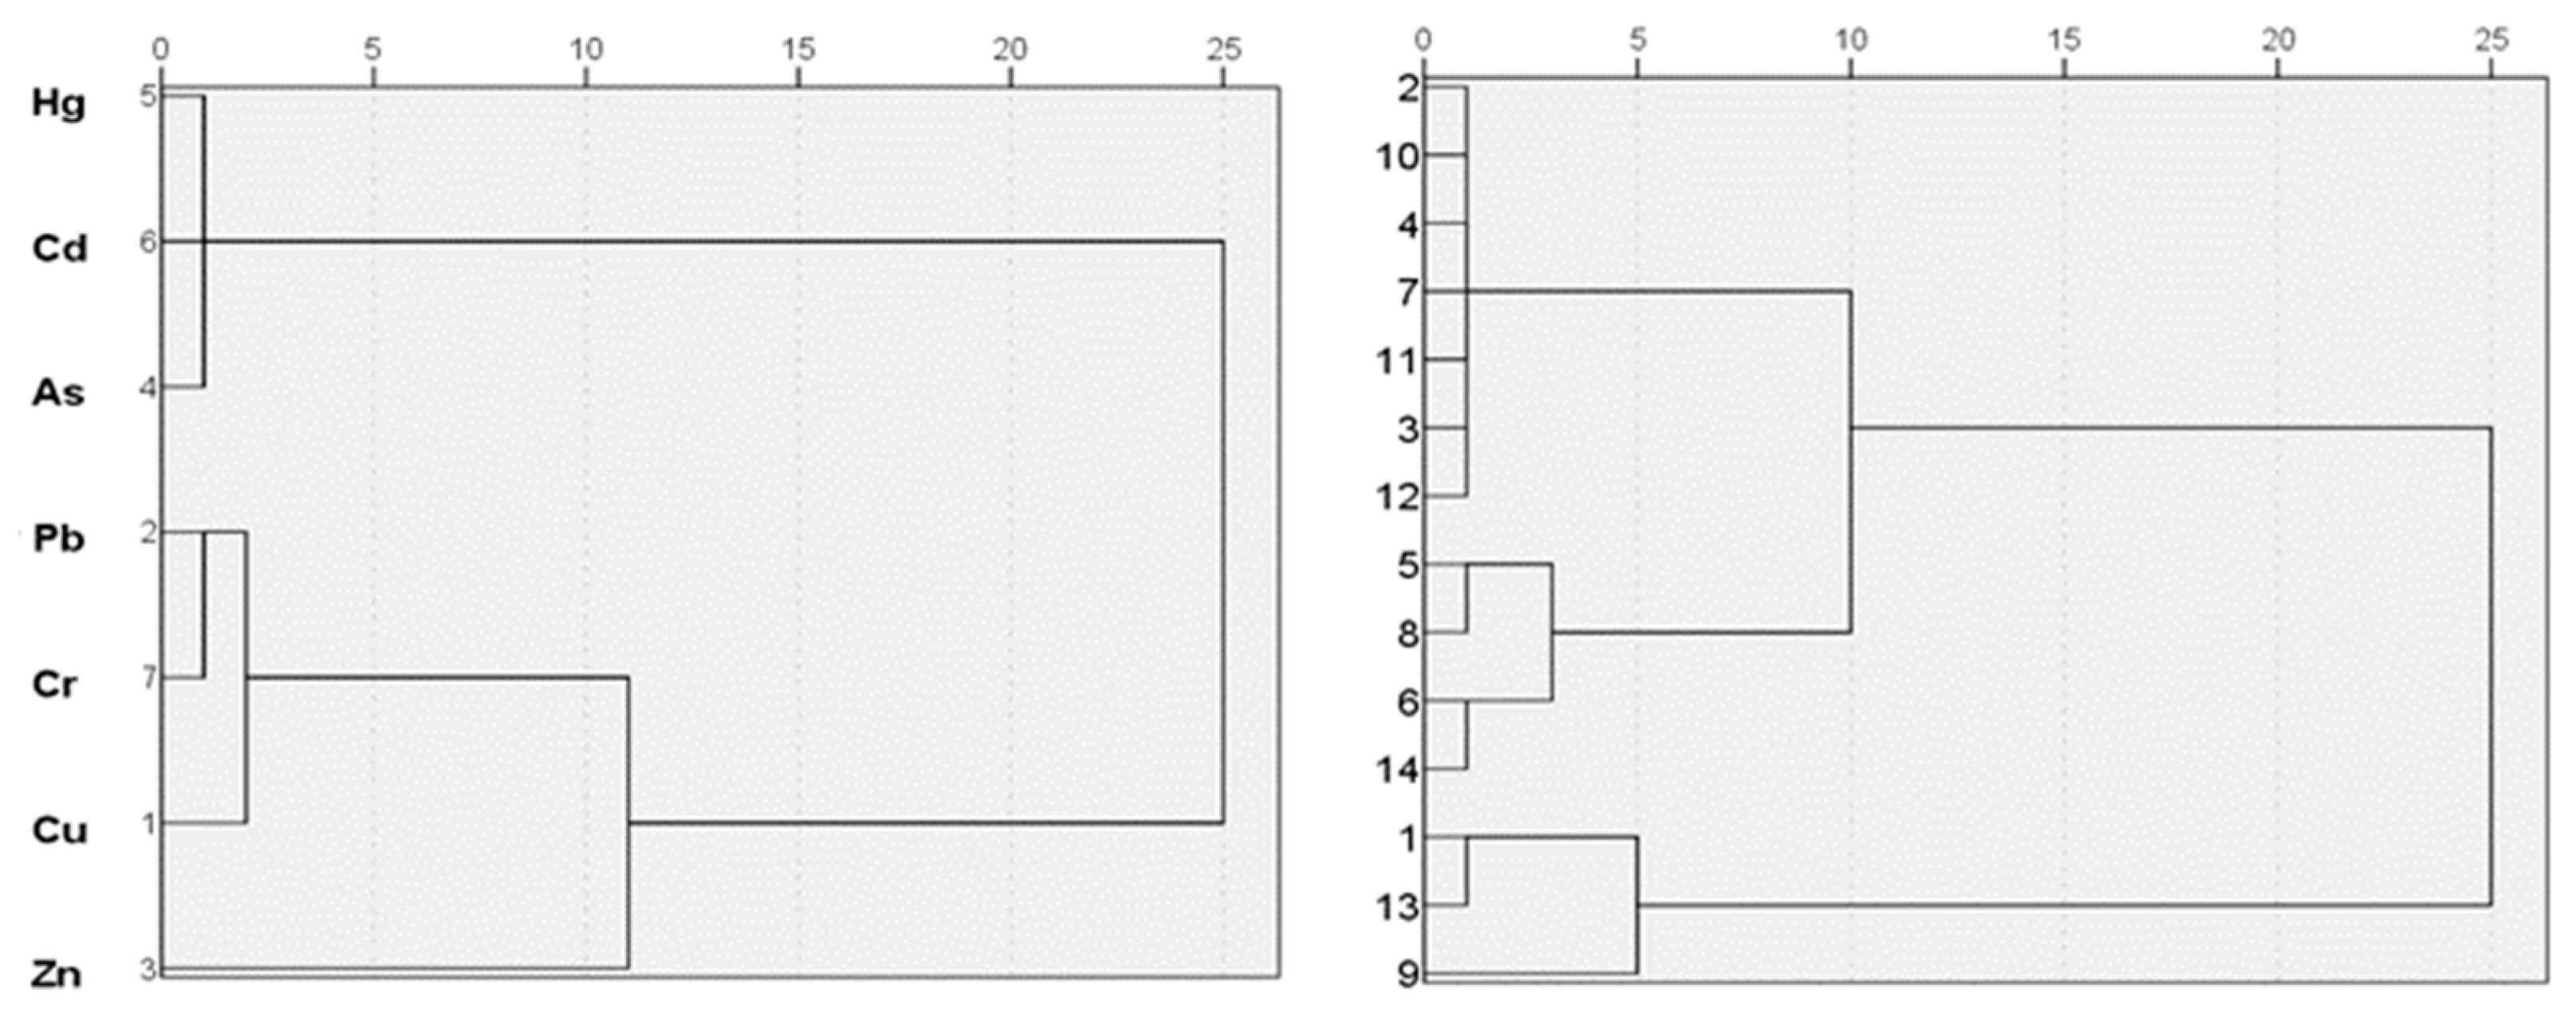
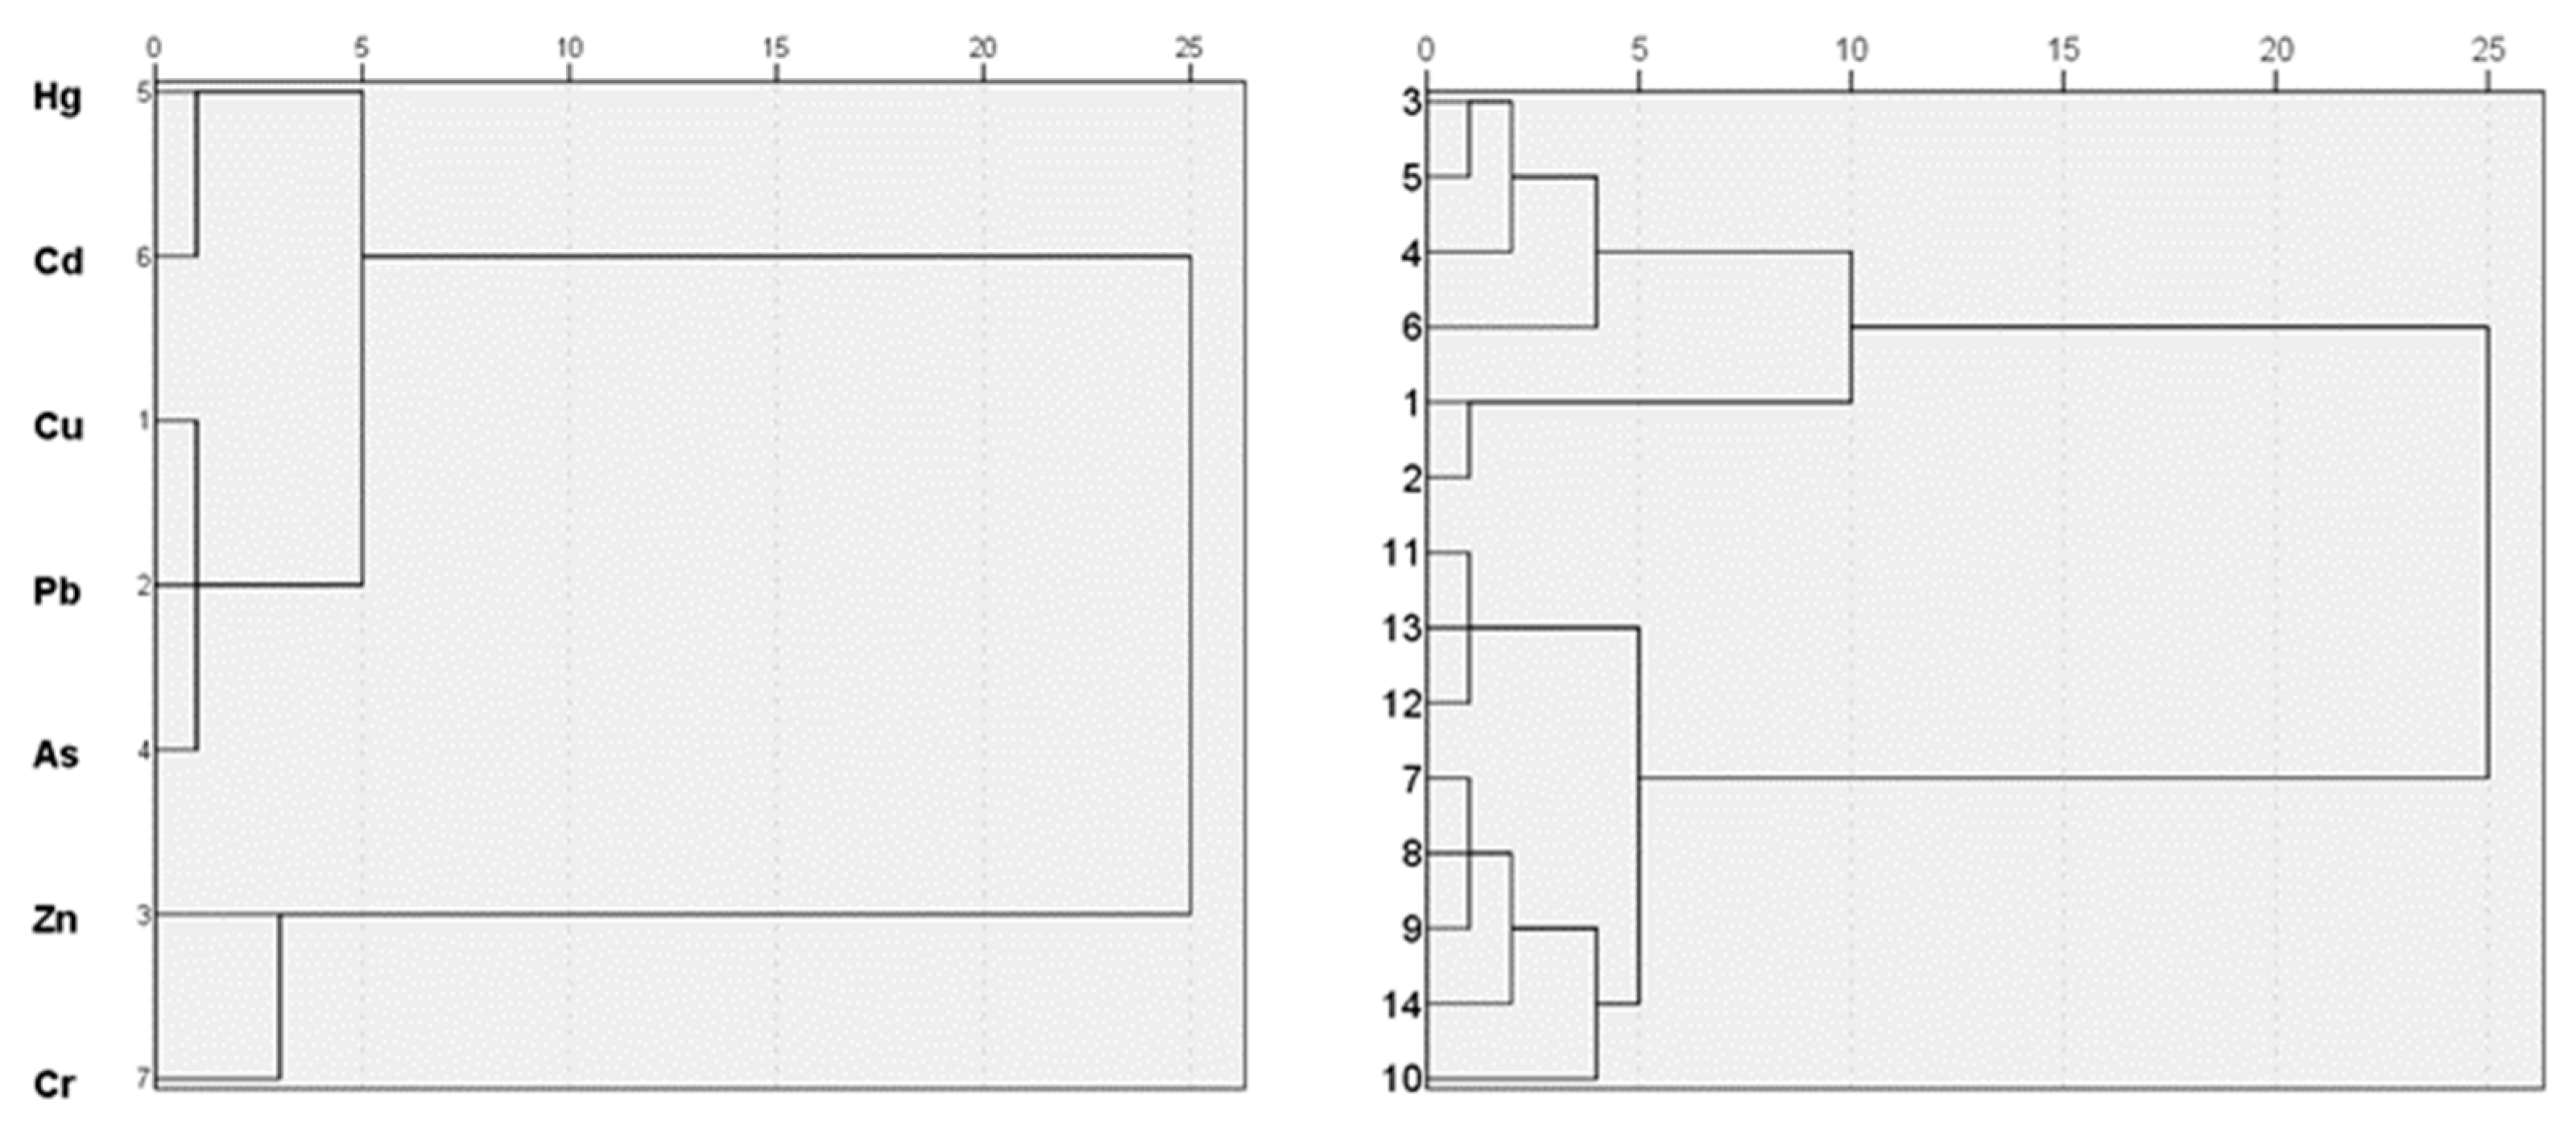
3.3.2. Cluster Analysis

A cluster analysis was carried out on the sediment data of seven heavy metals and 14 sites from three sets of monitoring data (Figure 5, Figure 6 and Figure 7). The results showed that heavy metals in 2012 could be divided into two categories: Hg, Cd, and As were classified as one category, while Cu, Pb, Zn, and Cr were in the second category. Combined with the results of the correlation analysis, the findings reflected that Cu had high homology with Zn and Pb, while Hg had high homology with As. The monitoring sites could be divided into two clusters: stations 2, 3, 4, 5, 6, 7, 8, 10, 11, 12, and 14 made up one cluster and were distributed in the vicinity of the Binhai port and the outer waters of the study area; stations 1, 9, and 13 made up the second cluster and were distributed in the nearshore waters of the Zhongshan estuary, the abandoned Yellow River estuary, and the North Jiangsu Main Irrigation Canal estuary, respectively.
The heavy metals in 2015 could be divided into two categories: Hg, Cd, Cu, Pb, and As were classified as one category, while Zn and Cr were in the second category. Combined with the results of the correlation analysis, the findings showed that the sources of Hg and As were similar. The cluster analysis results of the sites showed that stations 1, 2, 3, 4, 5, and 6 made up one cluster. These sites were distributed in the abandoned Yellow River estuary and nearshore. The other sites made up the second cluster and were distributed in the nearshore and outer waters between the abandoned Yellow River estuary and the North Jiangsu Main Irrigation Canal estuary.
The cluster analysis results in 2018 were basically consistent with those obtained in 2015 and slightly different from the correlation analysis results. The cluster analysis results showed that stations 2, 6, 9, 10, 11, and 13, which were distributed in the nearshore and outer waters in the middle of the study area, belonged to one category. The remaining sites belonged to another cluster and were distributed in the outer waters.

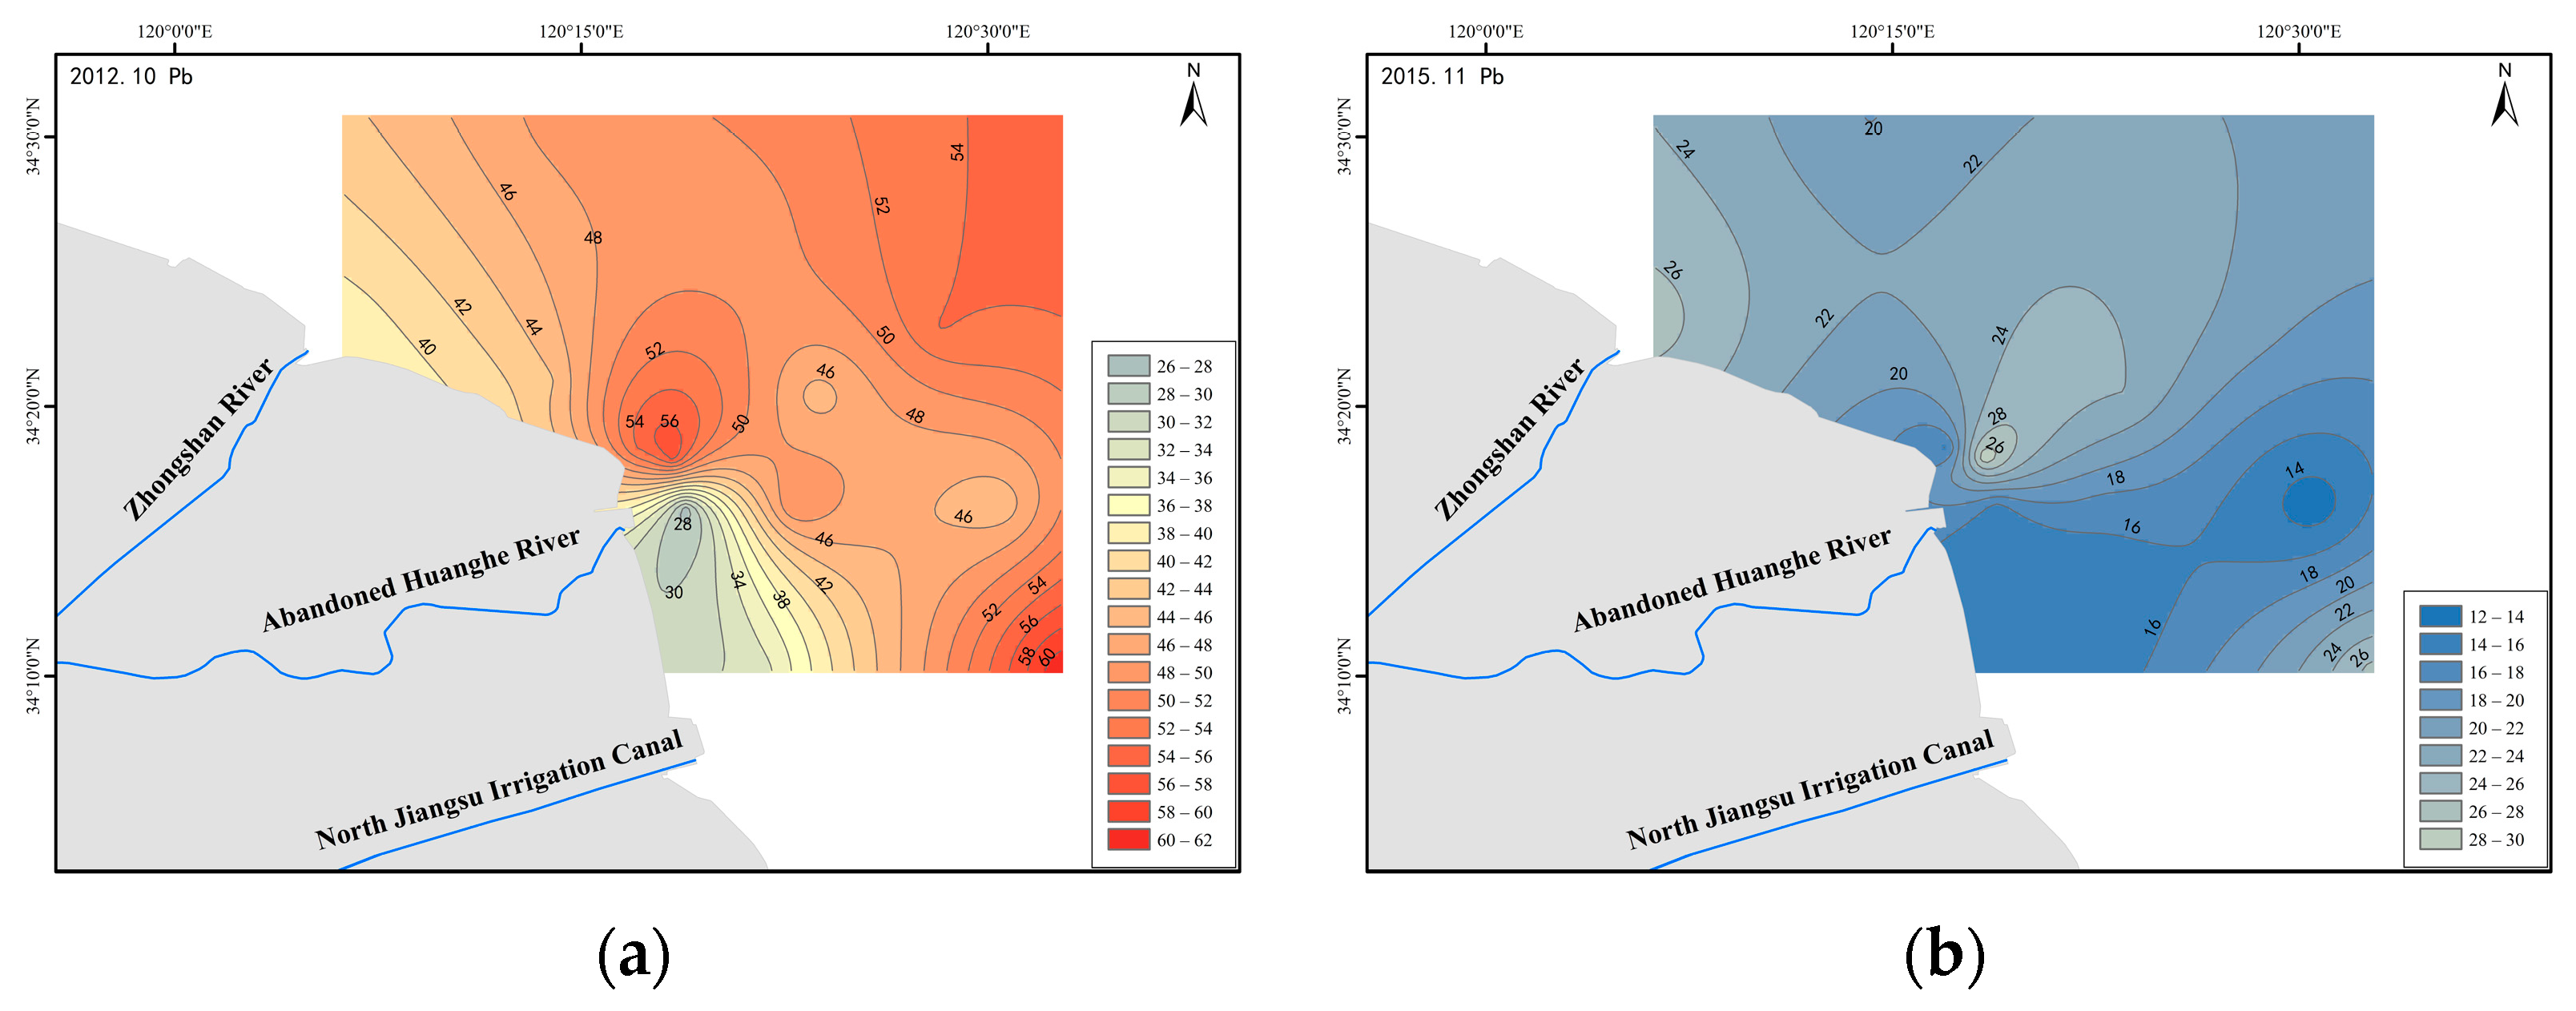
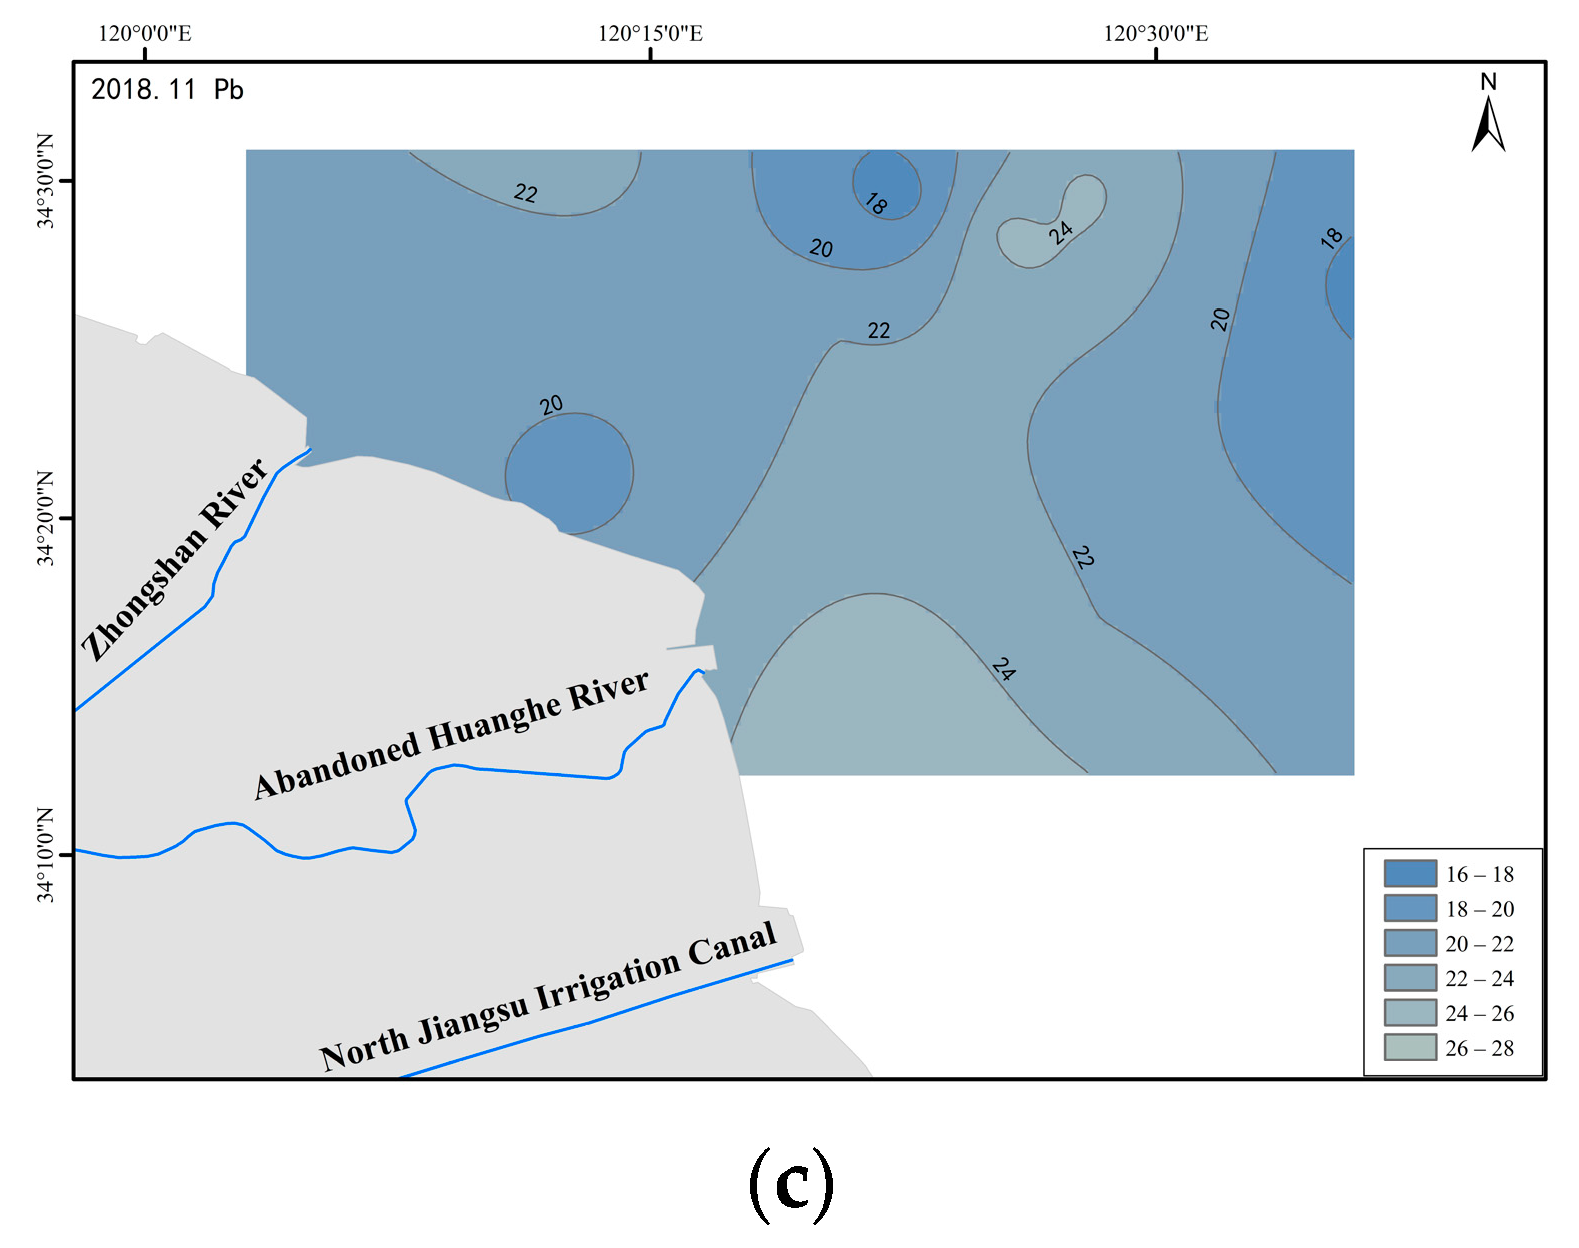
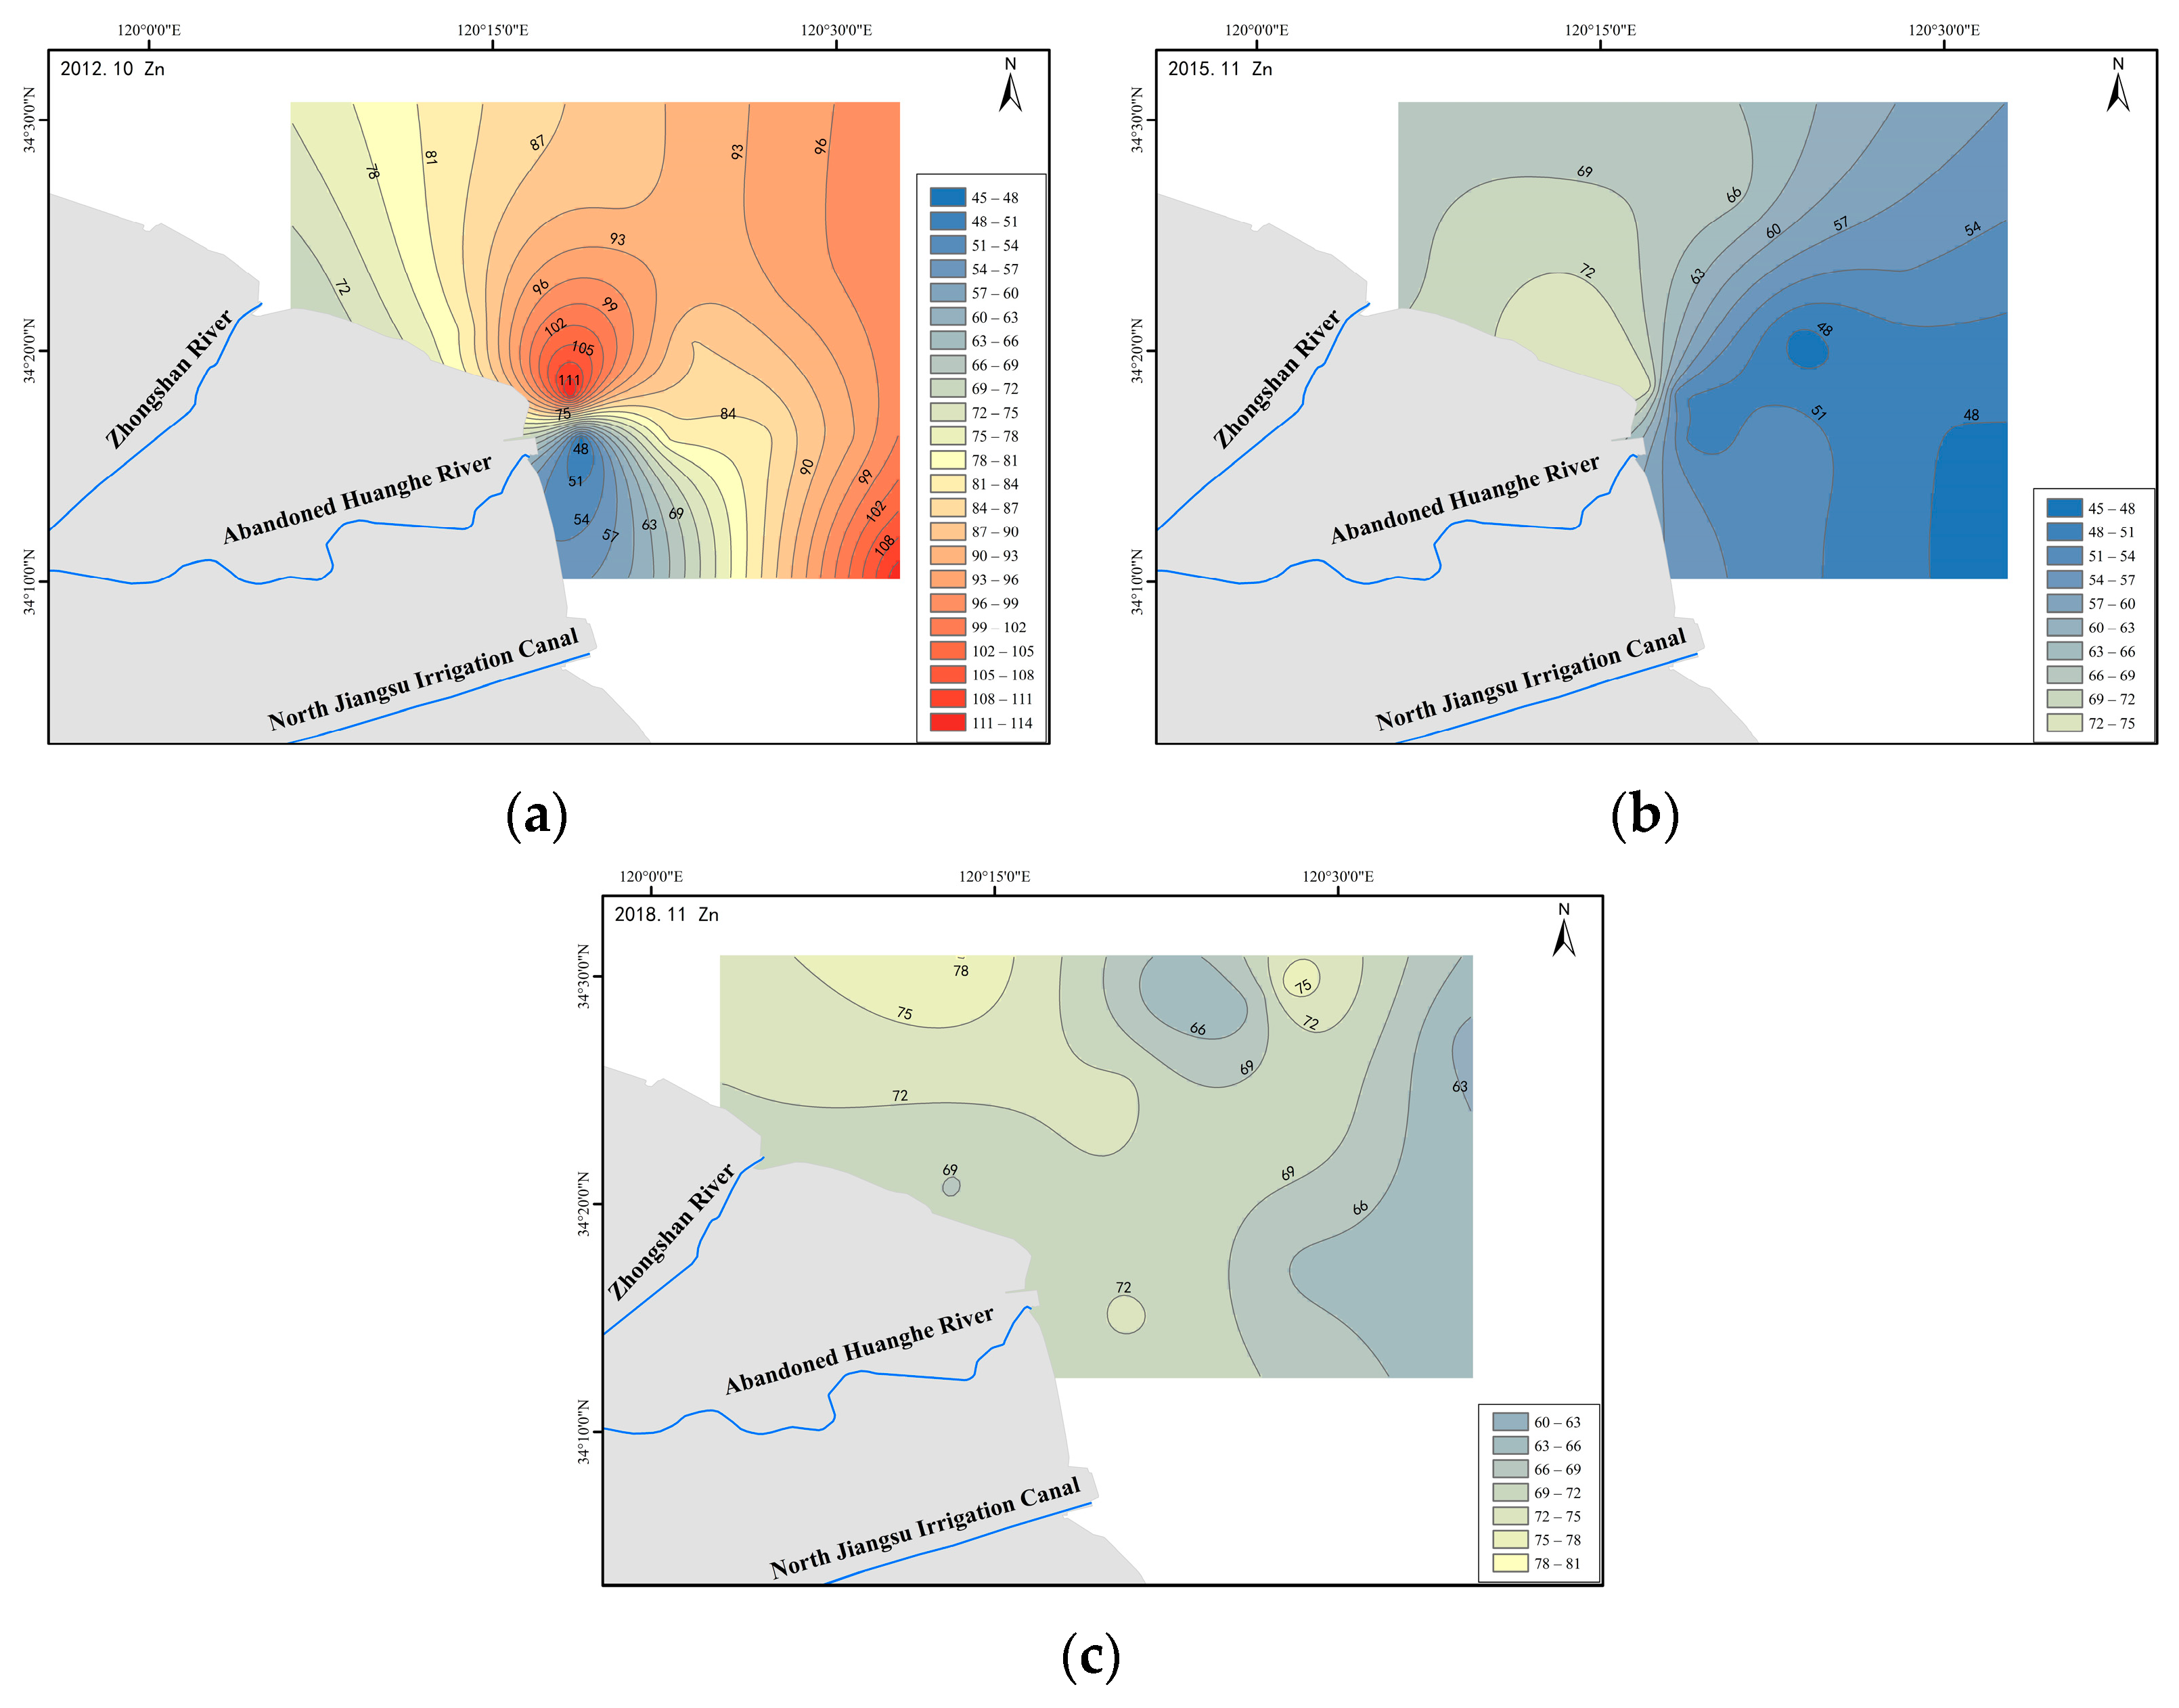
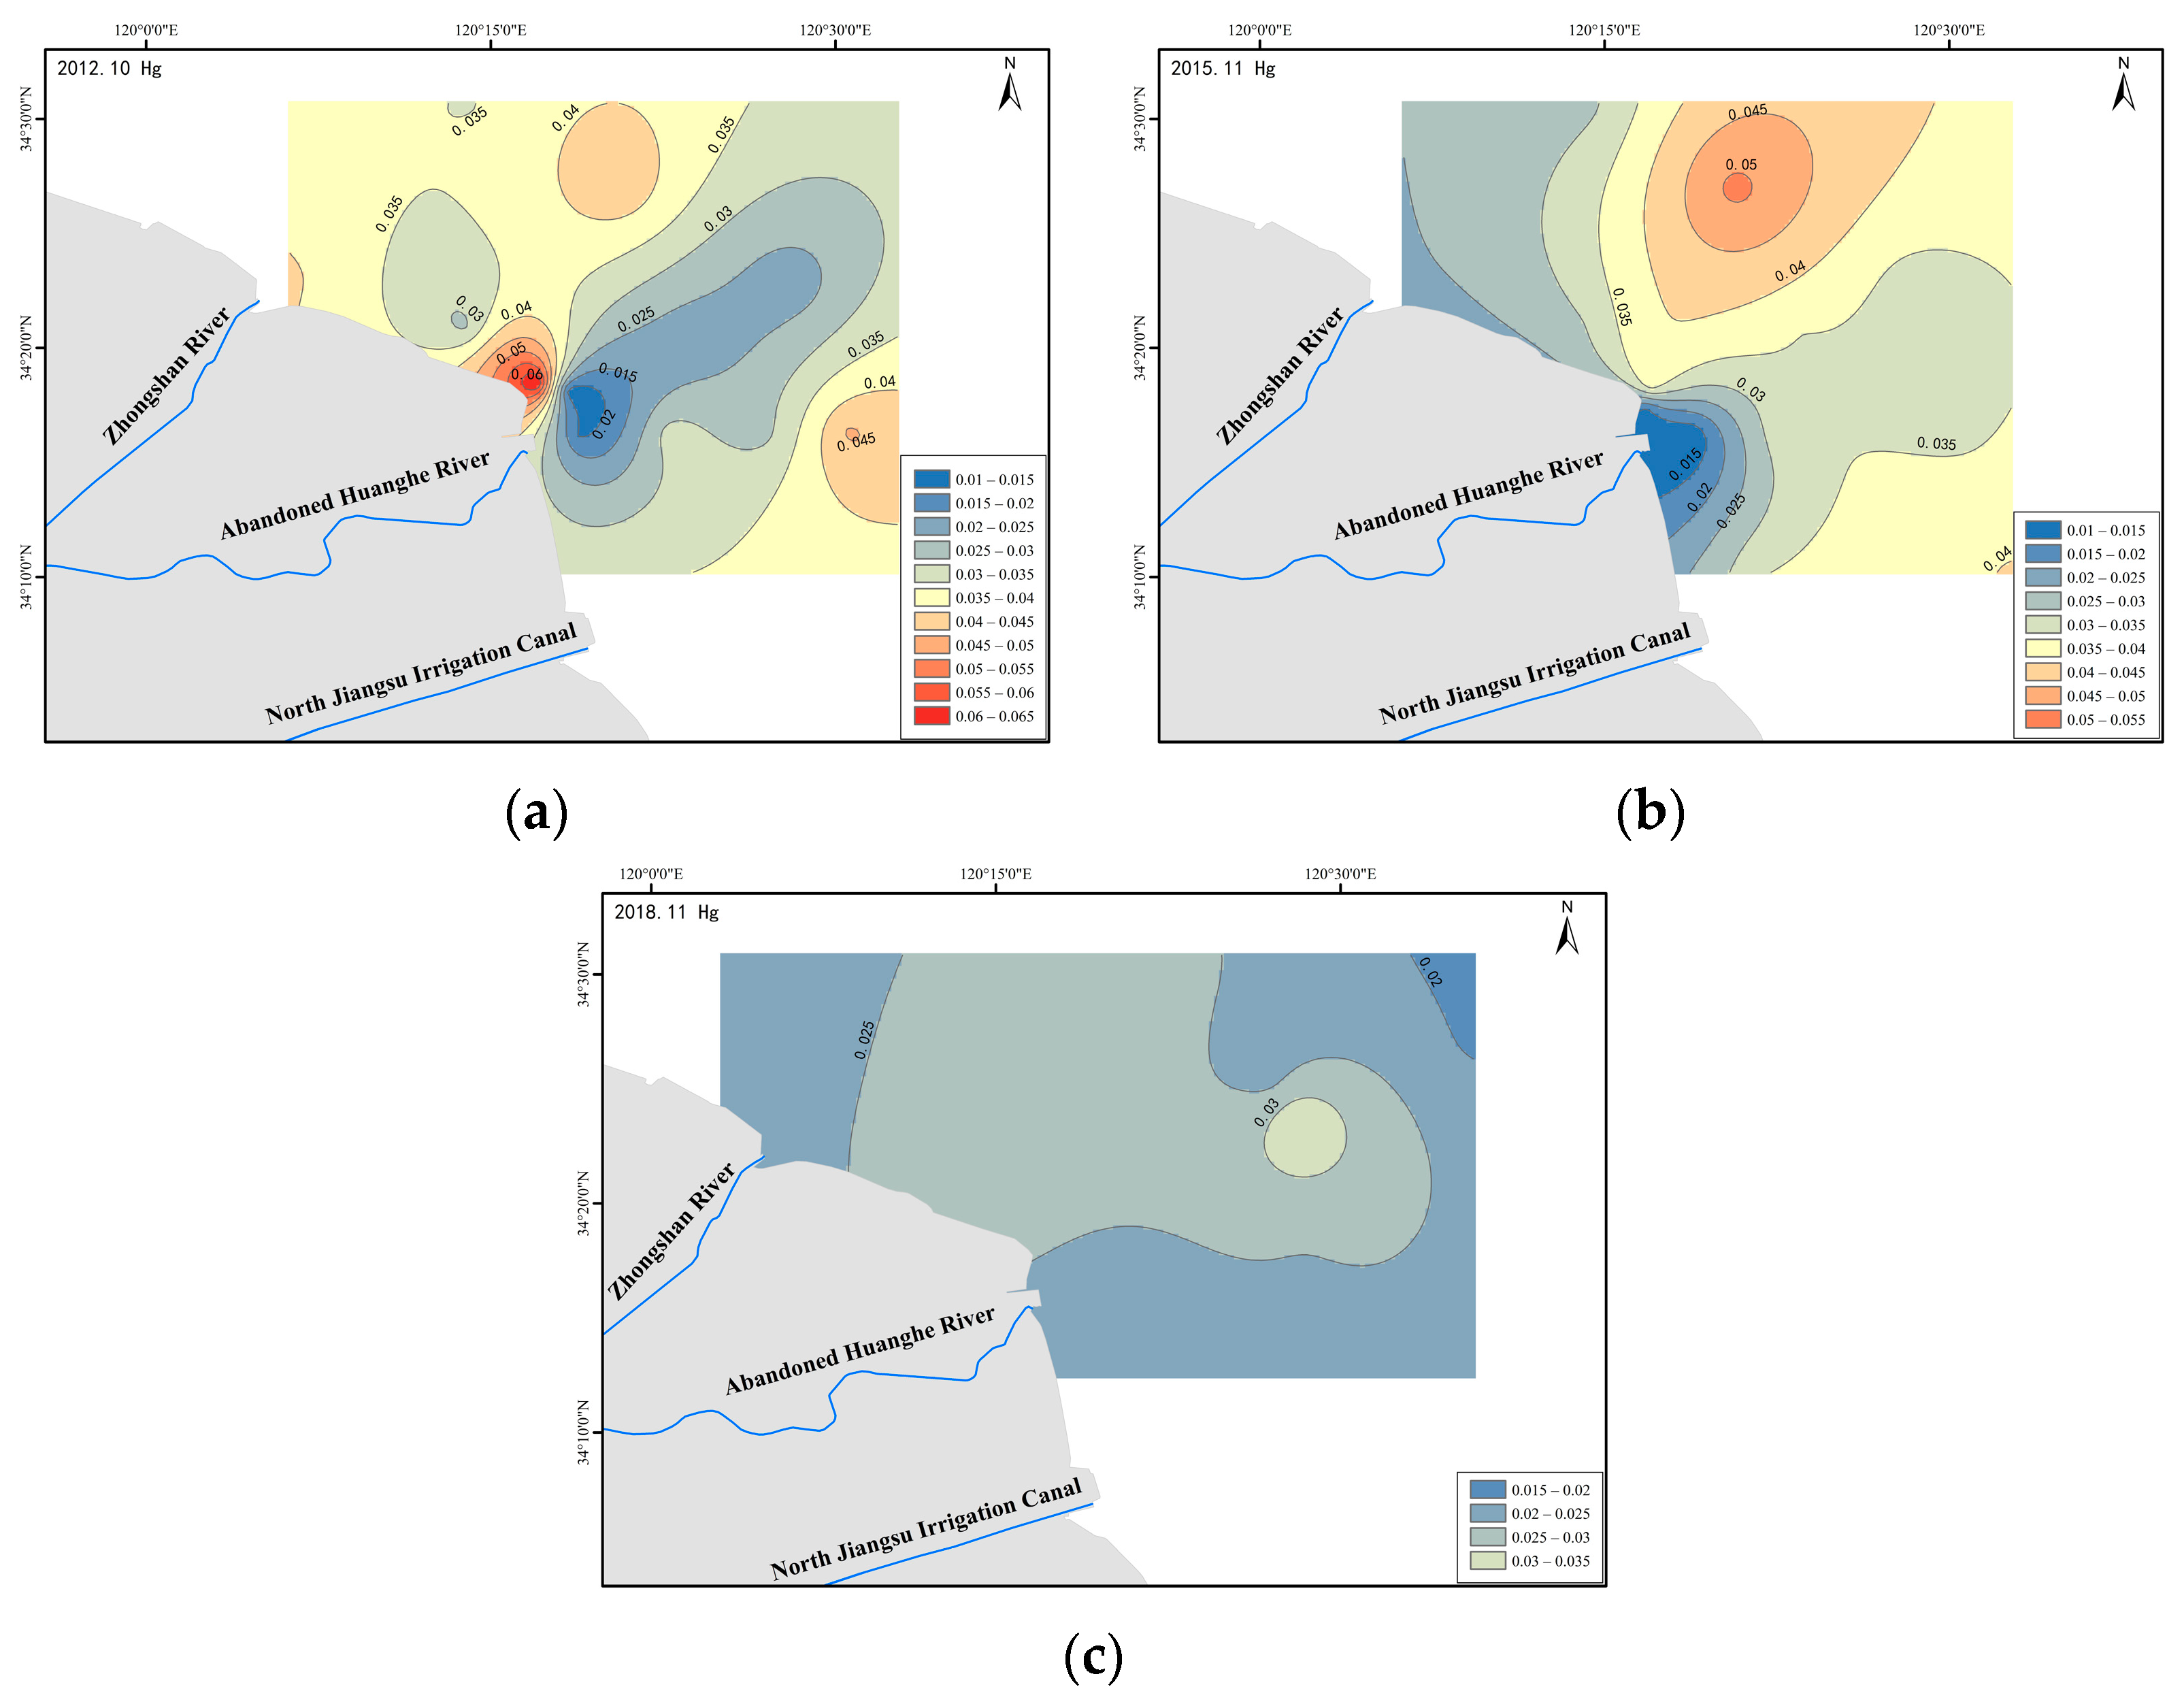
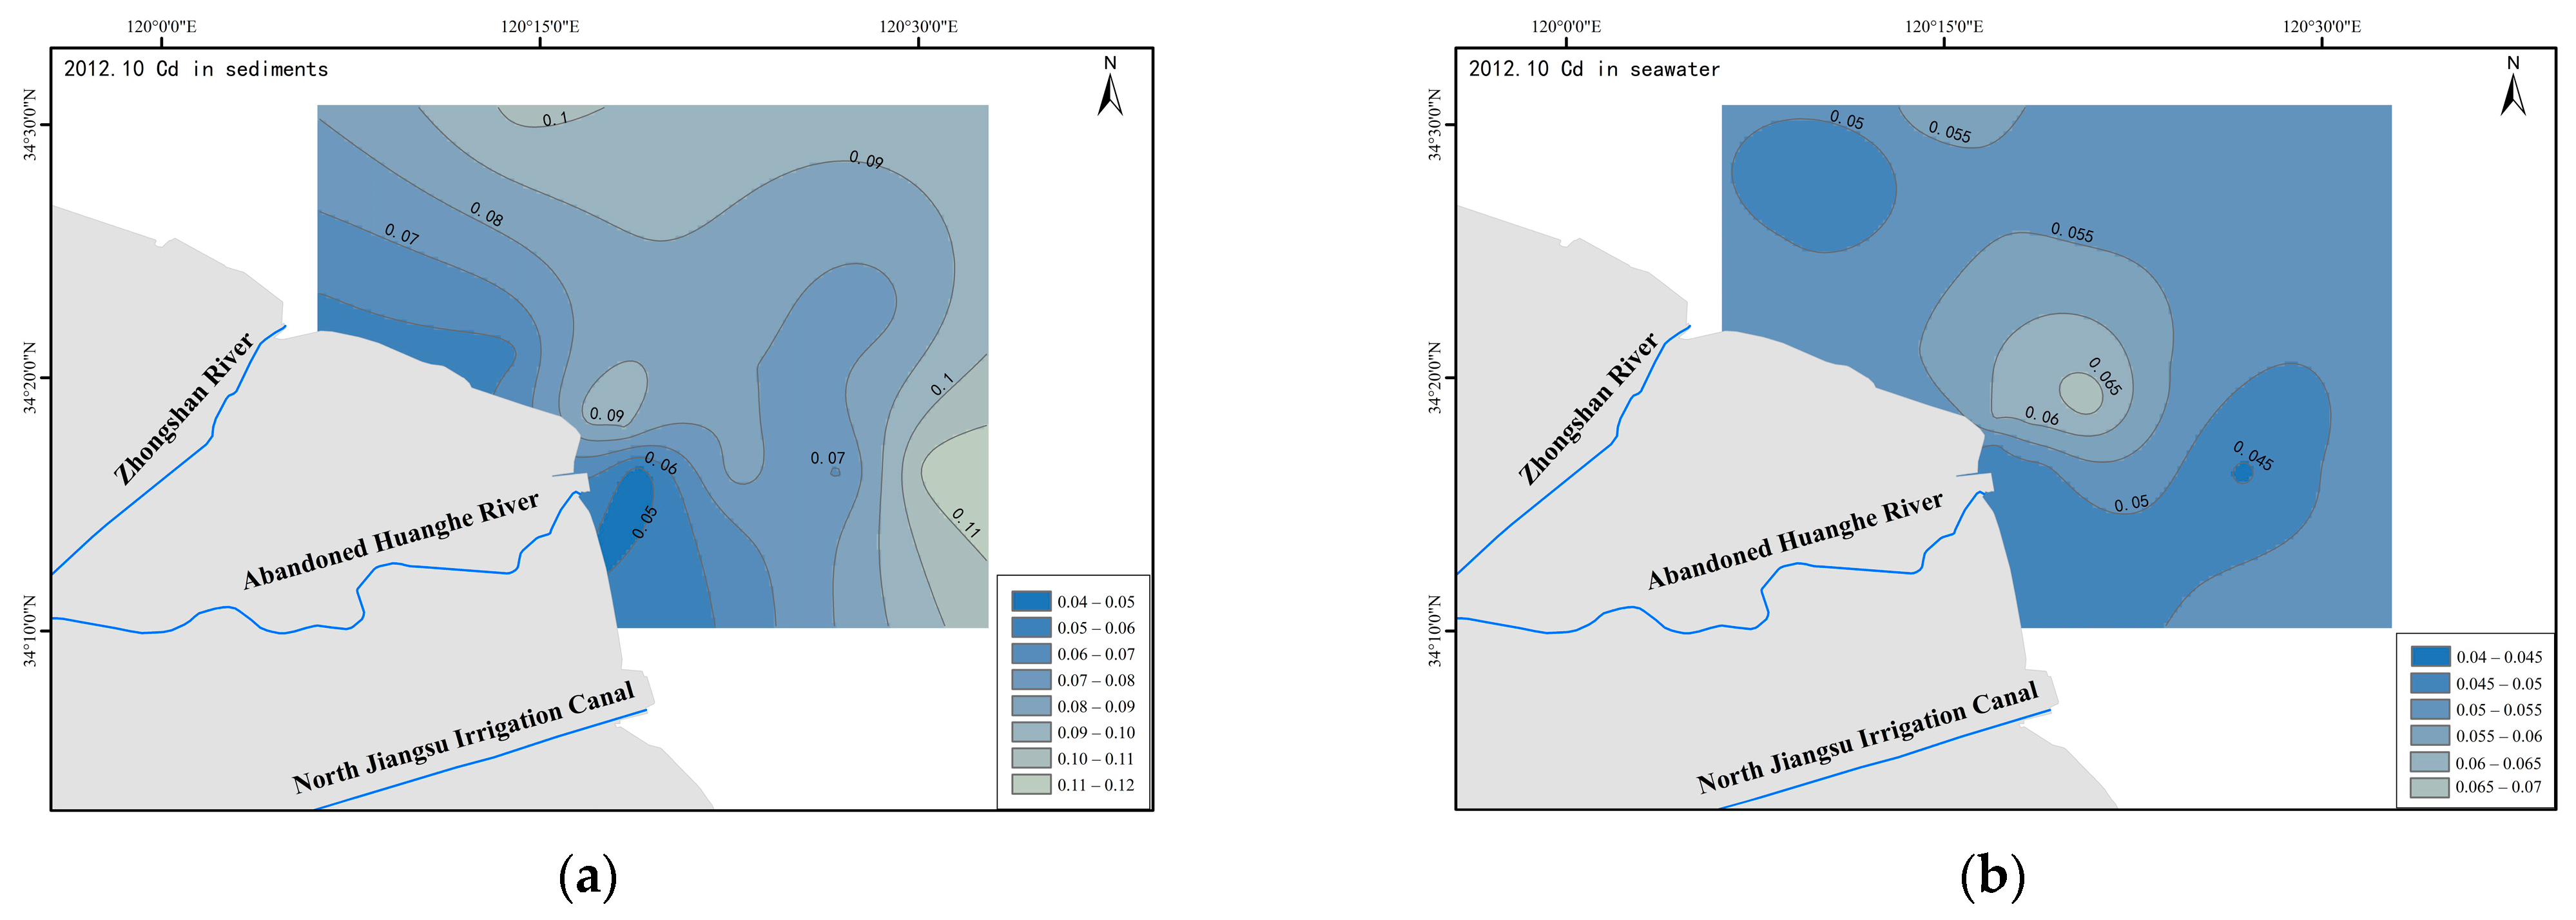
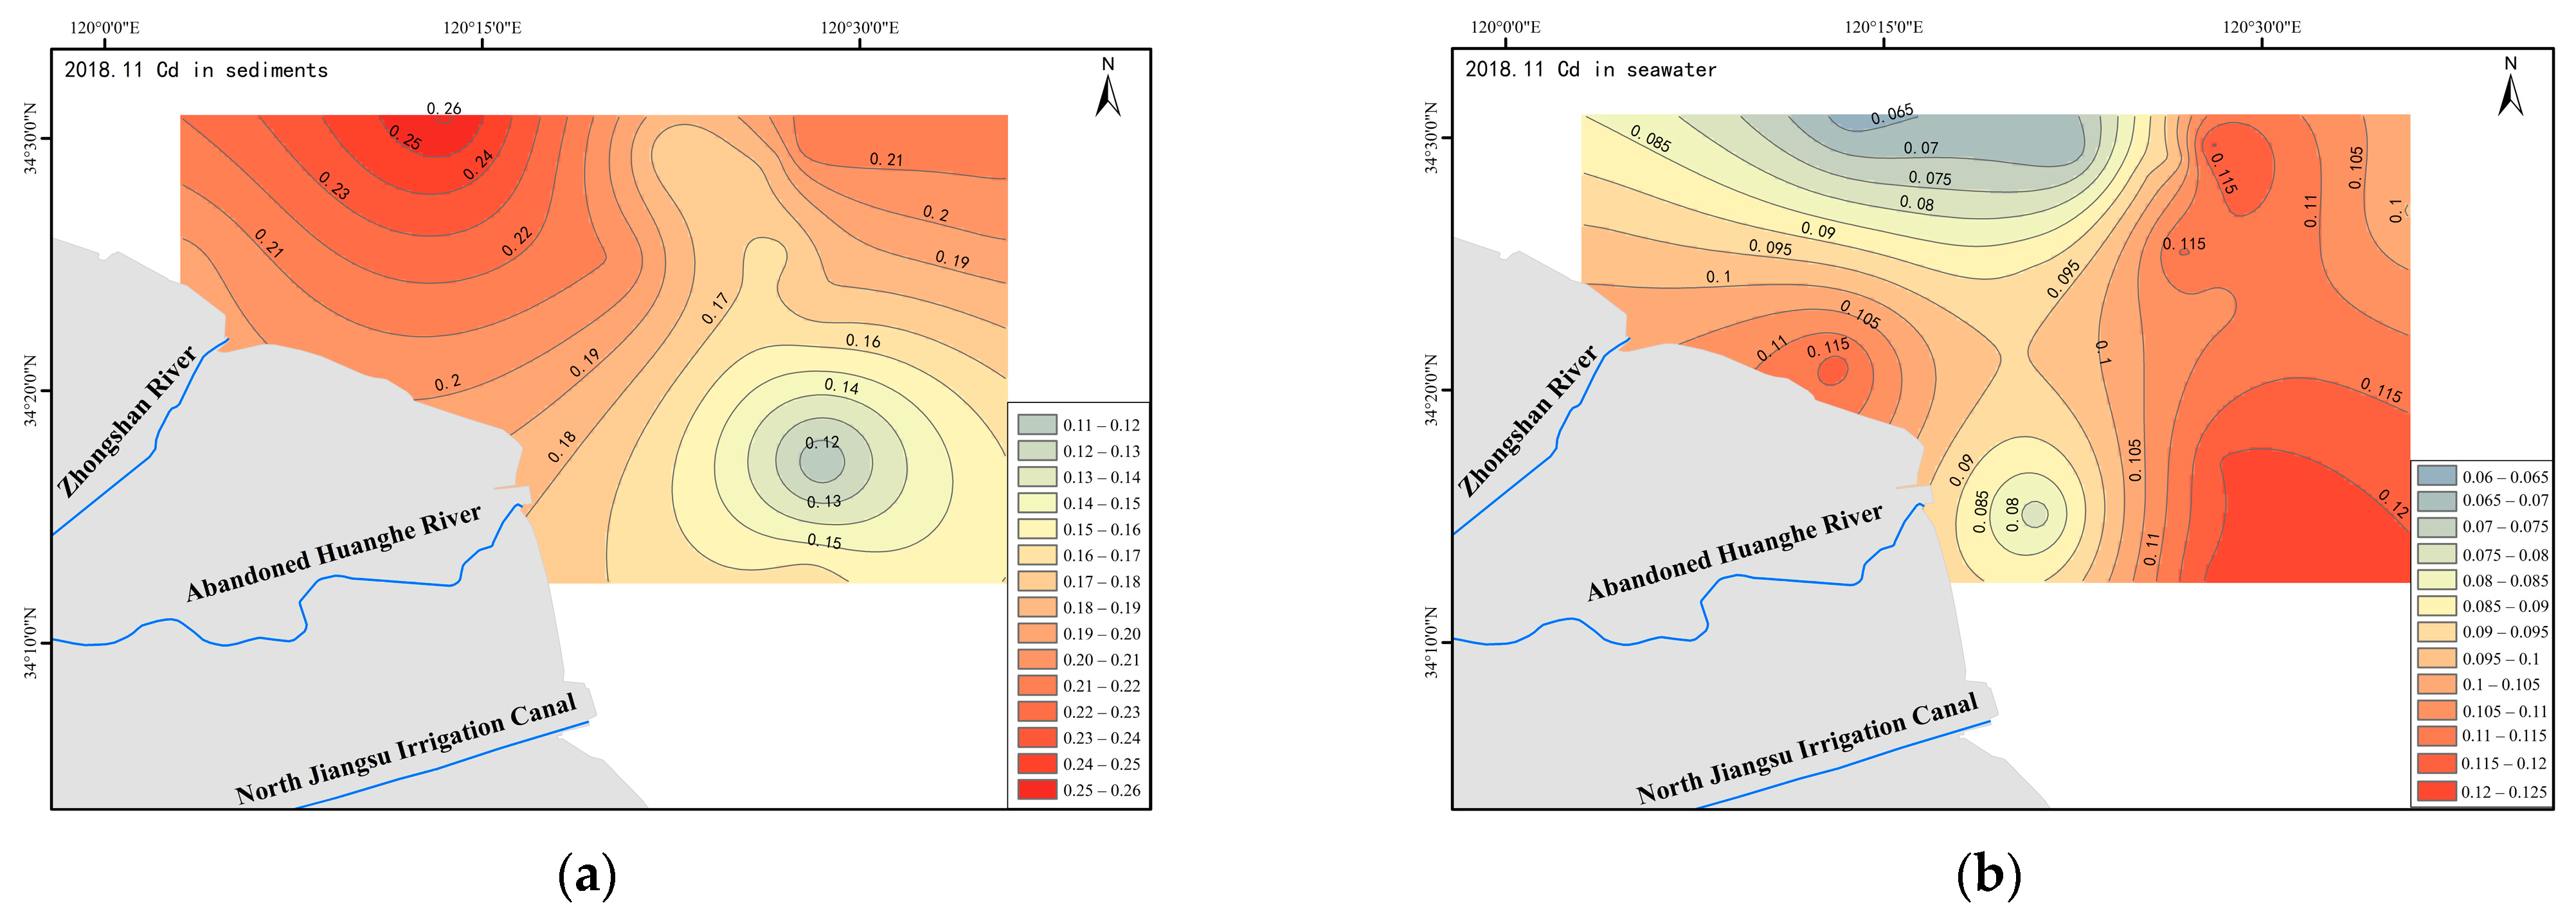
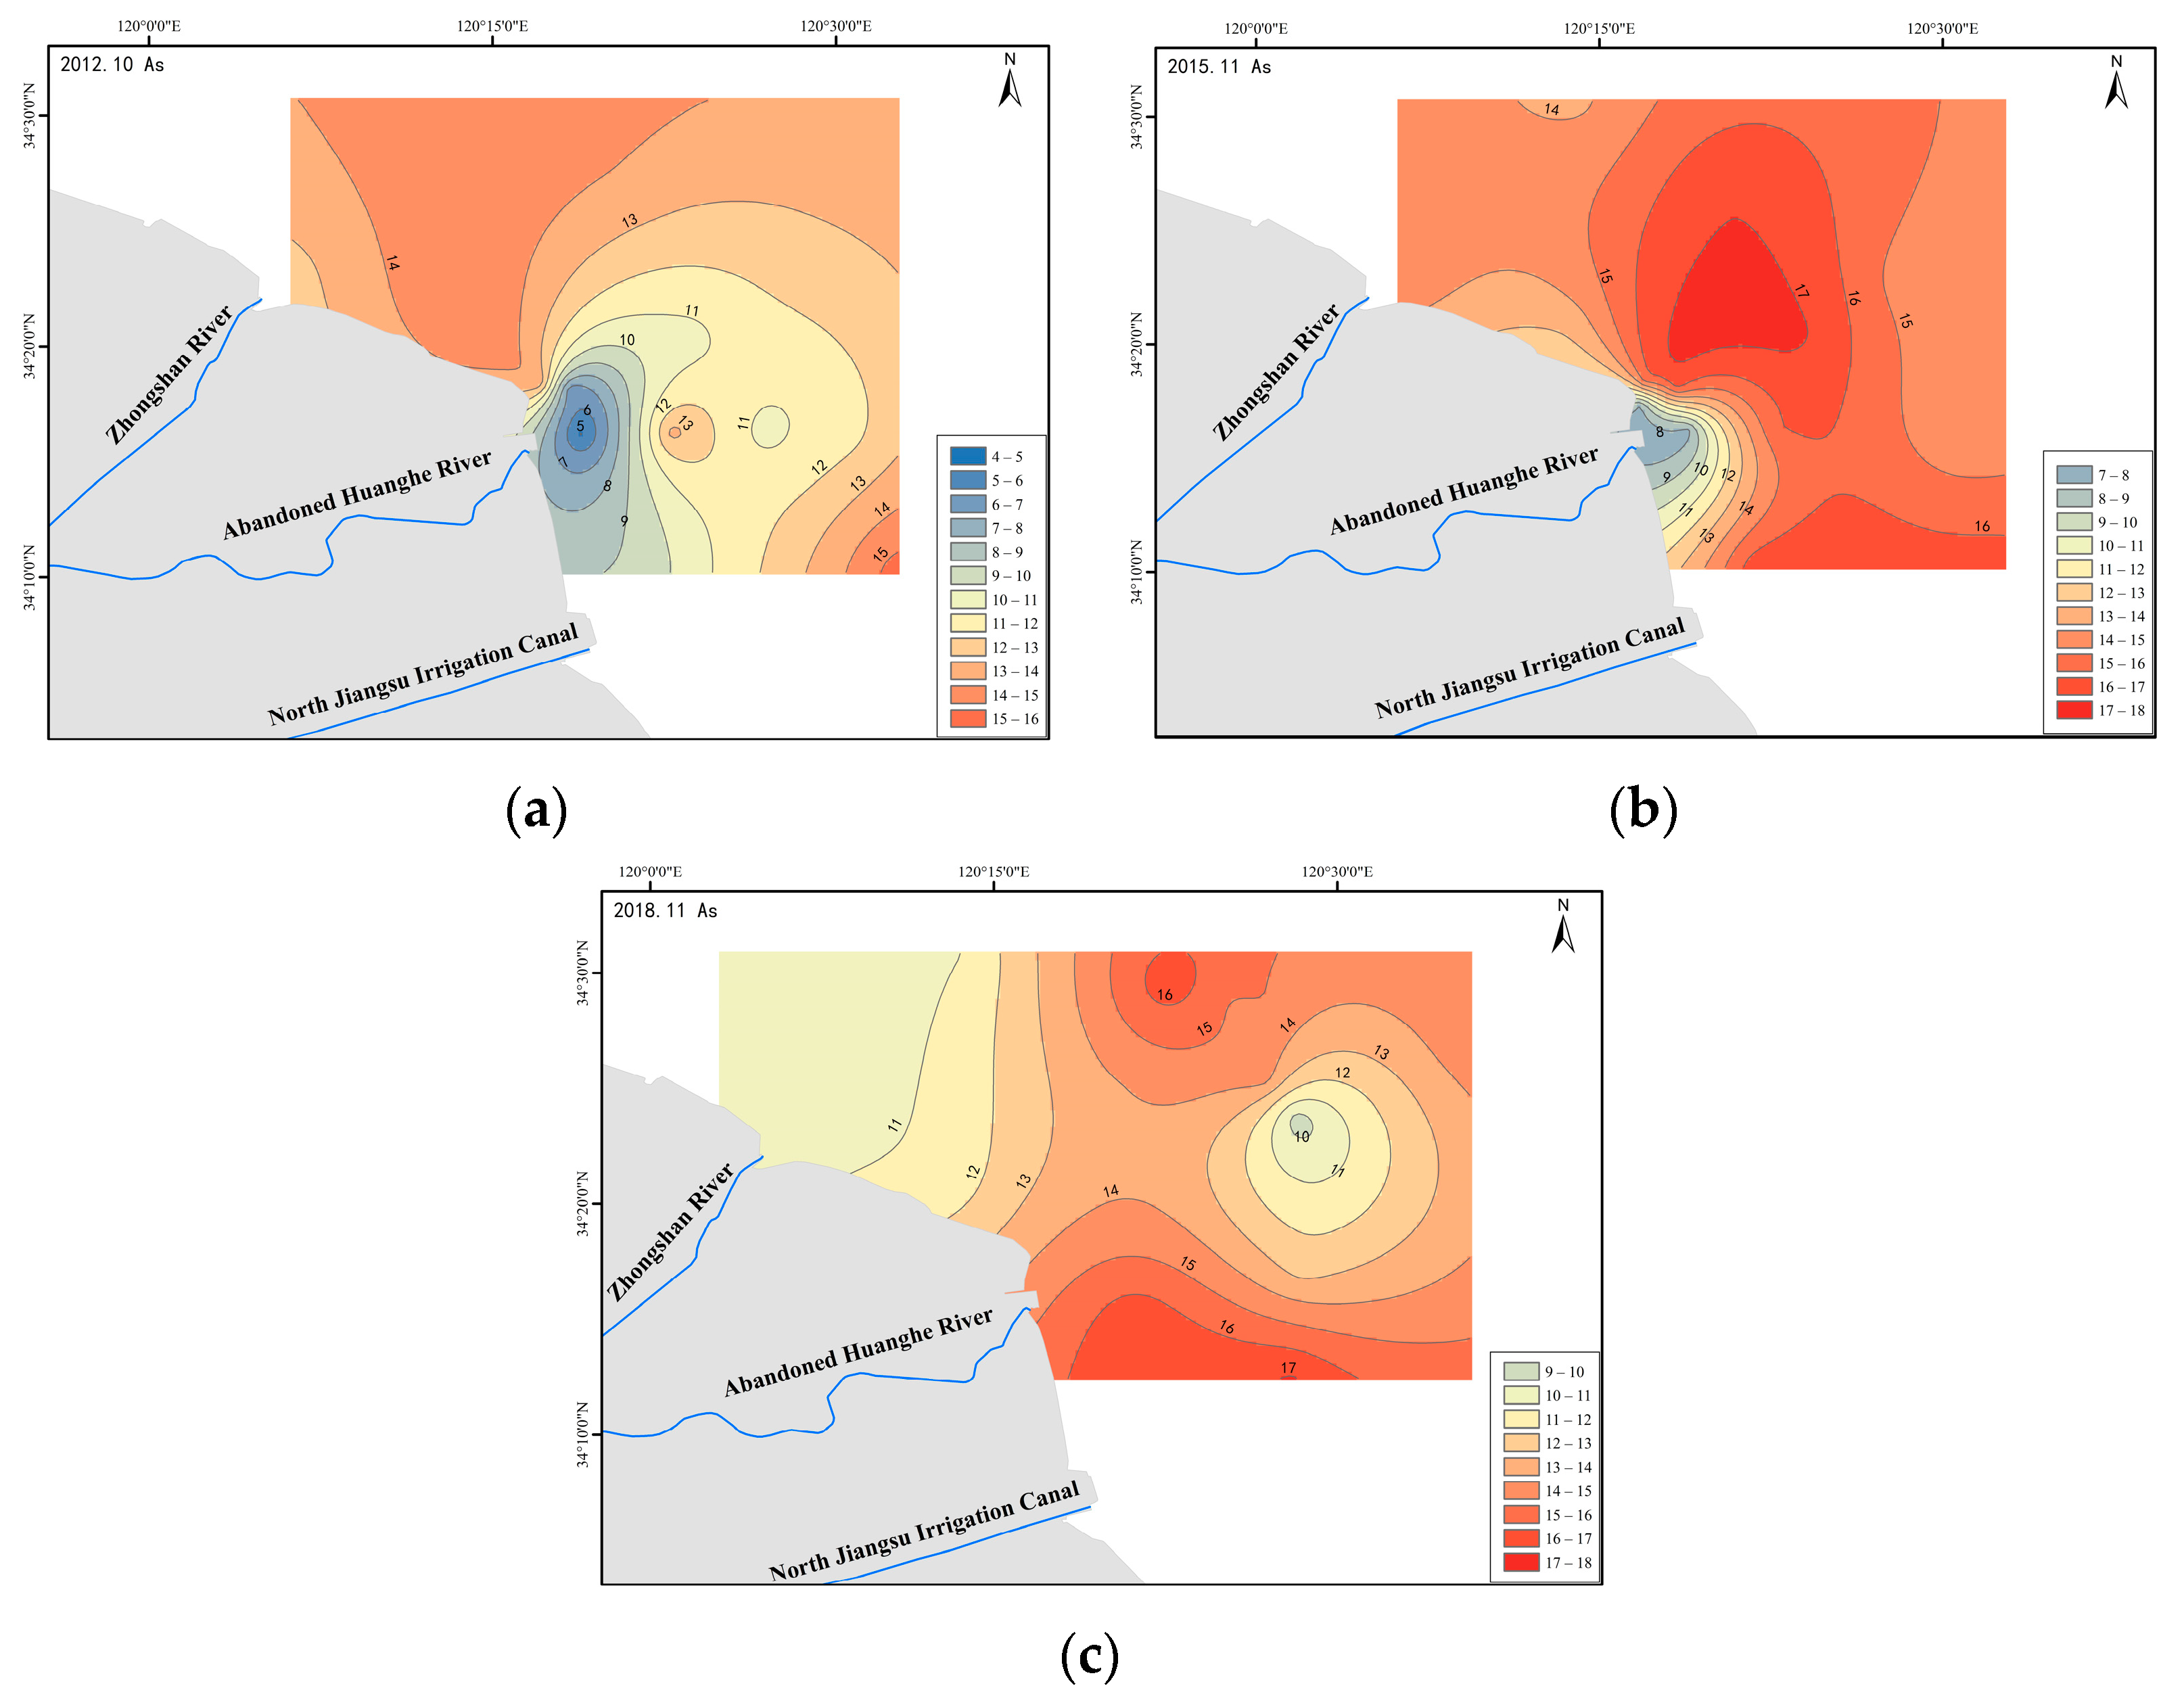
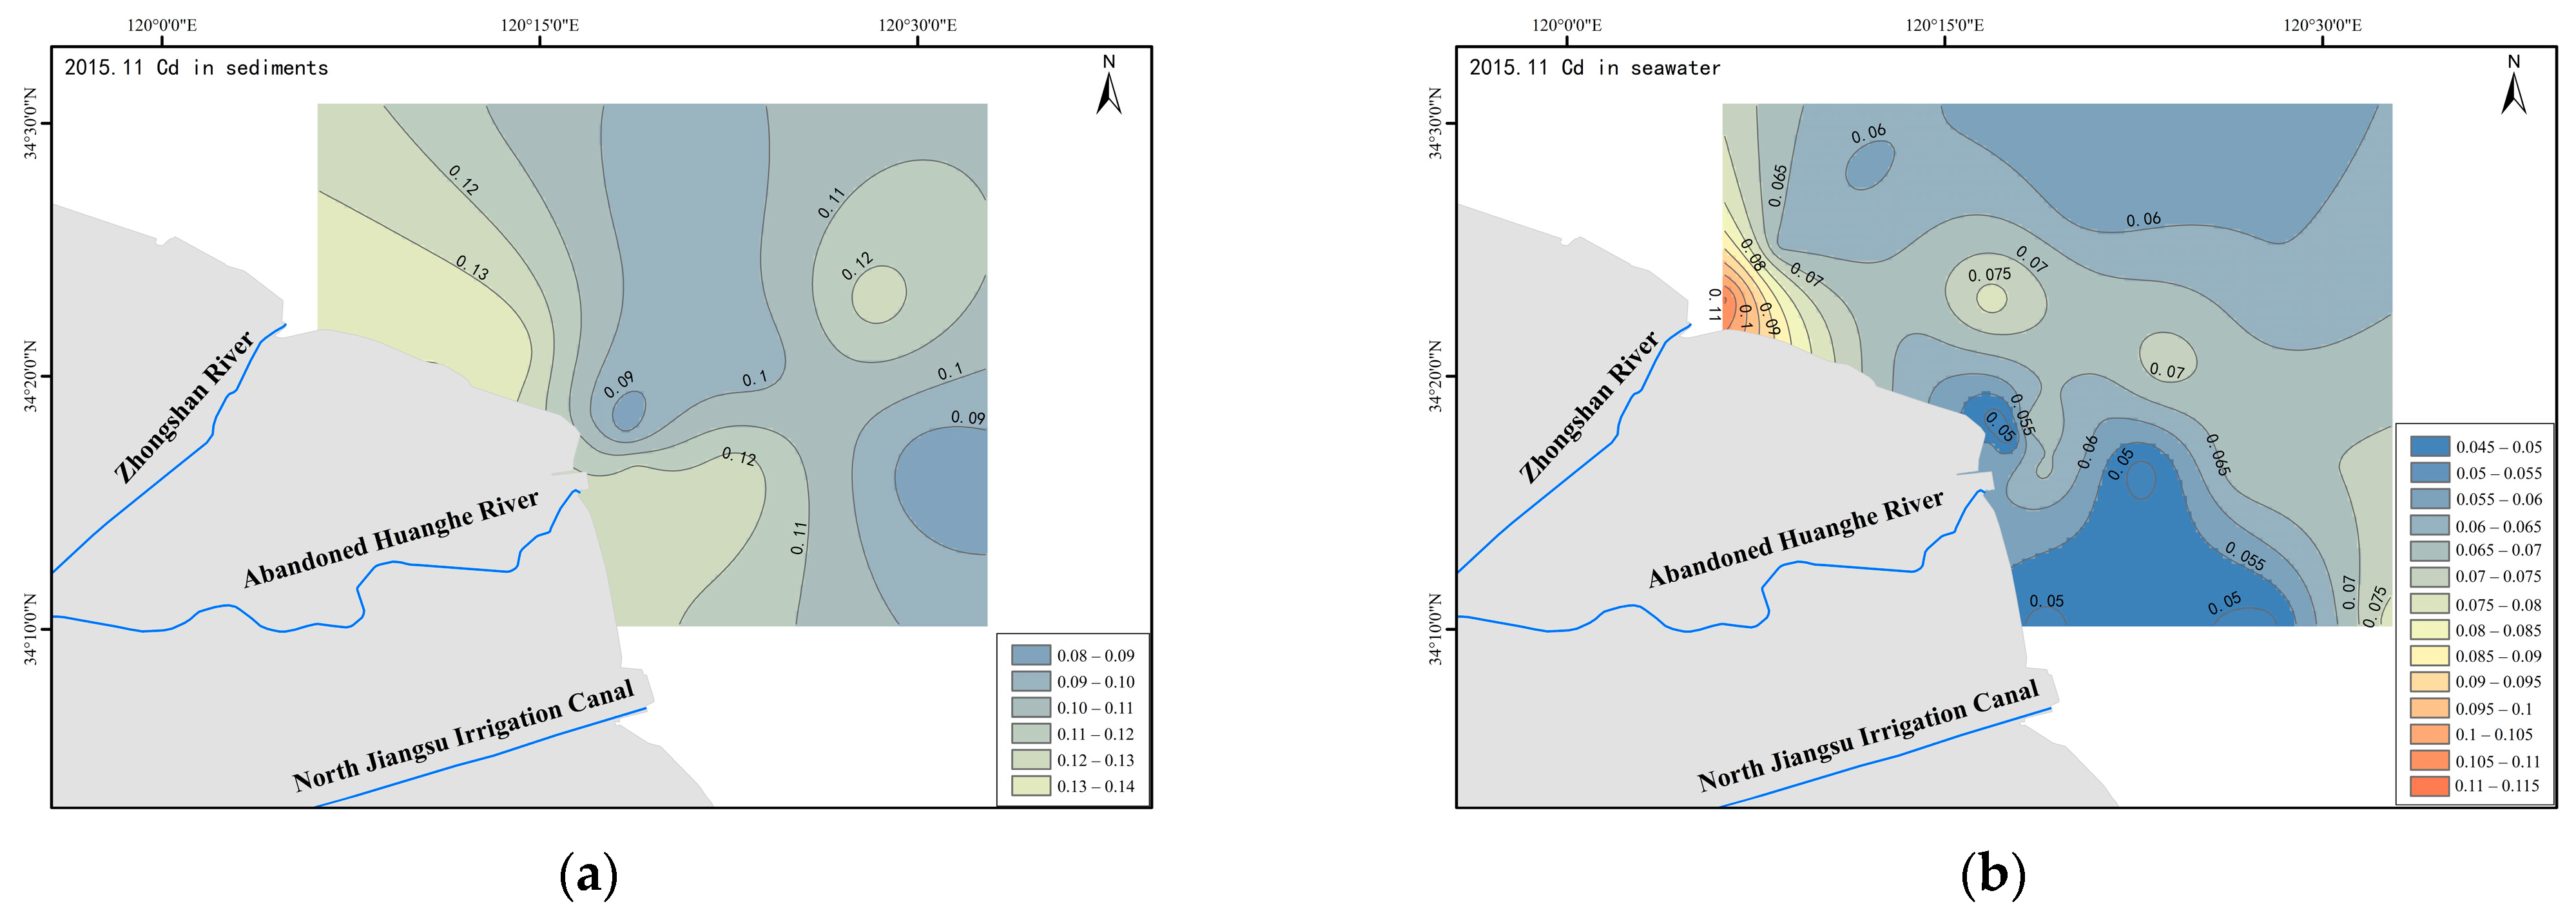
3.3.3. Spatial Variation of Heavy Metals in Sediments

From 2012 to 2018, the contents of many heavy metals either declined or remained at the same level as that detected in previous years. However, Cd showed a significant upward trend. The content of Cr was low during the monitoring periods and mainly originated from natural sources. There were high values of Cu and Pb in the Binhai port and its outer waters (Figure 8). The pollution in the study area was serious in 2012, improved in 2015, and the high-value zone expanded in 2018, which may have been related to the increase in the development activities of the Binhai port and the large number of ships in recent years.
The high-value zone of Zn had a significant expanding trend in the three sets of monitoring data, which was consistent with the distribution of the wind farm area (Figure 9). There are three wind farms in Binhai, including H1 and H2 in the north, and two southern Binhai wind farms. The construction of the nearshore H1 wind farm began earliest, starting in 2015. H2 and the southern Binhai wind farms began construction in 2017.
Hg and As showed consistency in both the cluster analysis and spatial distribution, with similar sources. The high values of these heavy metals were mainly found in the outer estuary (Figure 10 and Figure 11).
The content of Cd increased significantly in the three sets of monitoring data (Figure 12, Figure 13 and Figure 14). The main contributing factor to the potential ecological risk index was Cd. Compared with the background value, the Cd content was significantly higher, indicating a strong impact due to the fact of human activities. Moreover, the spatial distribution and variation trend of Cd in the sediments and seawater are consistent.

4. Discussion

4.1. Influencing Factors of Heavy Metal Content and Spatial Distribution

The cluster analysis results of the monitoring sites showed that the sites deployed in the nearshore waters and those in the outer waters were mostly not from the same cluster sites, which may have been influenced by a combination of human factors and the natural environment. The coastal heavy metal contents were high due to the fact of human activities. In recent years, economic development activities in this area have gradually increased. During this process, discharge from land and pollution from the sea have resulted in the increase in heavy metal content in the sediments. In addition, due to the zonal nature of the sediments in this area, the sediment particle size changed from west to east and from coarse to fine [14,15,16]. The sediments with fine particle sizes easily absorbed heavy metals. Therefore, the high-value zone of heavy metals also appeared in the outer waters. Because of strong erosion in the abandoned Yellow River estuary, fine particles were carried away in large quantities. The sediment particle size was coarse, with low heavy metal contents [17], so the heavy metal contents were low in the abandoned Yellow River estuary. Therefore, the type of sediment can greatly affect the content of heavy metals.

4.2. Heavy Metal Source Analysis

Correlation analysis and cluster analysis methods have been used to test the similarity between heavy metal elements and stations, and some elements similar in spatial distribution and chemical properties may have the same origin.
The content of Cu and Pb may have been greatly affected by port development activities, and the pollution situation has improved in recent years. A possible explanation for this finding may be the increased protection of the marine environment over the past few years, thus reducing the pollution degree [18,19].
Before the construction of wind power farms, Zn was mainly distributed near the Binhai port. The expansion of the Zn high-value zone in 2015 and 2018 may have been due to the adoption of the corrosion protection technique of sacrificial anodes for offshore wind power, leading to an increase in Zn content in the sediments [20,21].
The content of Hg and As is affected to a certain extent by the pollution of inlet rivers and port development activities. Industrial wastewater is one of the main sources of Hg, while As is a major component of pesticides and fertilizers [4,22,23,24]. The residues of pesticides and fertilizers containing As used in agricultural production activities can enter the ocean through surface runoff [25]. Consequently, Hg and As may mainly originate from sewage discharge and agricultural pollution from inlet rivers.
The high values of Cd were mainly distributed in ports, estuaries, and outer waters, indicating that Cd in the study area mainly originated from land-based sources of pollution. Cd is a key industrial raw material [26] with important applications in the semiconductor, phosphor, atomic reactor, aviation, and navigation fields [27] and is widely used in industrial production. In addition, there was a considerable amount of Cd in galvanized metals, vulcanized tires, phosphate fertilizer, and sludge [28,29,30,31]. Therefore, the port development activities and sewage discharge from land-based industrial parks and inlet rivers in this marine area may be the cause for the significant increase in Cd content.
All the above reasons have caused the fluctuation of heavy metal content in sediments. Most of these fluctuations are accompanied by the transformation of the material form, which makes the heavy metals dissolve in the seawater in the ionic state. In addition, smaller particles in the sediment can enter the organisms, which together aggravate the enrichment of heavy metals, even the artificial aquaculture carried out near the shore is inevitably affected by it. In this way, it enters the human body through the food chain, which increases the harm and hidden danger to human health [32]. In other words, the accumulation of heavy metals not only threatens the ecological environment but also affects the survival of animals and humans.

5. Conclusions

The pollution assessment and spatial distribution analysis were carried out by collecting and organizing the data on the heavy metals in the coastal sediments in 2012, 2015, and 2018. The following conclusions were drawn:
(1)
The spatial distribution of the seven heavy metals was uneven. The average contents of the Pb, As, Zn, Cd, and Cu over the years exceeded the background values of the Jiangsu coastal waters. The heavy metal contents in the marine sediments in 2015 were lower than that in the other two years.
(2)
The geoaccumulation index assessment showed that the Hg and Cr pollution was very low, with both heavy metals considered to have a clean grade. Cu, Zn, and As had a clean grade to mild pollution. The geoaccumulation index of Cd displayed a significant increasing trend, indicating moderate pollution. The pollution degree of Pb decreased to mild-to-moderate pollution.
(3)
The evaluation results of the potential ecological risk index showed that the average value of the index in the 3 years were at a moderate level with an upward trend. The main contributors to the ecological risk were the Cd and Hg in this area. The areas with higher ecological risks are estuaries, ports, and outer waters. The difference was that the contents of the Hg and other heavy metals decreased or remained the same in the three sets of monitoring data, while the Cd increased significantly. The overall ecological risk of the study area was high in 2018.
(4)
The Cr in the marine sediments of the study area mainly originated from natural sources, while the other elements were influenced by human activities. In general, the heavy metal pollution of the sediments in the estuaries, ports, and the outer sea area between the Zhongshan estuary and the abandoned Yellow River estuary was relatively serious, mainly affected by the inlet rivers, offshore sewage discharge, port construction, and wind electricity construction activities.
In conclusion, based on the analysis of the changes in the heavy metals in the sediments in the sea area of Binhai County, we can conclude that the changes in the heavy metal content in this sea area are largely influenced by human activities. According to the research results, people can control pollutants in a targeted manner, formulate corresponding plans, and take appropriate methods. Therefore, it is necessary to strengthen the guidance and control of development and utilization activities in this area in the future to ensure that heavy metal pollution will not increase.

Author Contributions

Conceptualization, J.W. and B.L.; methodology, J.W.; software, S.C.; formal analysis, Z.W.; investigation, Z.W.; data curation, L.L. and J.W.; writing—original draft preparation, S.C.; writing—review and editing, J.W.; project administration, L.L., J.W., and M.X.; supervision, D.C.; funding acquisition, D.C., J.W., and M.X. All authors have read and agreed to the published version of the manuscript.

Funding

This work was supported by the special fund for natural resources development of Jiangsu Province (Marine Science and Technology Innovation) (no. JSZRHYKJ202004 and JSZRHYKJ202103) and the National Natural Science Foundation of China (Grant No. 42006183).

Institutional Review Board Statement

Not applicable.

Informed Consent Statement

Not applicable.

Data Availability Statement

Data are available from the corresponding author upon reasonable request.

Conflicts of Interest

The authors declare no conflict of interest.

References

  1. Shen, F.; Mao, L.J.; Deng, X.Q.; Sun, C.L.; Zhu, Z.R.; Ding, M. Reanalysis of distribution characteristics and contamination evaluation of heavy metals in coastal sediments of Jiangsu province. J. Cap. Norm. Univ. Nat. Sci. Ed. 2018, 39, 62–71. [Google Scholar]
  2. Sheng, W.K.; Hou, Q.Y.; Yang, Z.F.; Yu, T.; Yuan, J.X.; Dai, G.L.; Tang, Z.M. Distribution characteristics and ecological risk assessment of heavy metals in sediments from Xiang River. China Environ. Sci. 2019, 39, 2230–2240. [Google Scholar]
  3. Song, H.; Liu, J.; Yin, P.; Zhang, Y. Distribution, enrichment and source of heavy metals in Rizhao offshore area, southeast Shandong Province. Mar. Pollut. Bull. 2017, 119, 175–180. [Google Scholar] [CrossRef]
  4. Jia, L.; Liu, W.T.; Tang, D.H.; Cai, P.J.; Cui, Z.A. Distribution characteristics and ecological risk assessment of heavy metals in surface sediments in Sanya Bay and surrounding waters. Mar. Geol. Front. 2020, 36, 22–31. [Google Scholar]
  5. Duan, Y.Y.; Pei, S.F.; Liao, M.W.; Zhai, S.K.; Zhang, H.B.; Xu, G.; Yuan, H.M. Spatial distribution of heavy metals in the surface sediments of Laizhou Bay and their sources and pollution assessment. Mar. Geol. Quat. Geol. 2021, 41, 67–81. [Google Scholar]
  6. Hu, J. East China Normal University Coastal Evolution Process and Nearshore Suspended Sediment Research of the Abandoned Yellow River Delta. M. D. Thesis, East China Normal University, Shanghai, China, 2014. [Google Scholar]
  7. Gu, Y. Heavy metal fractionation and ecological risk implications in the intertidal surface sediments of Zhelin Bay, South China. Mar. Pollut. Bull. 2018, 129, 905–912. [Google Scholar] [CrossRef]
  8. Qiu, J.; Liu, J.; Li, M.; Wang, S.; Bai, W.; Zhang, D. Assessment of heavy metal contamination in surface sediments from the nearshore zone, southern Jiangsu Province, China. Mar. Pollut. Bull. 2018, 133, 281–288. [Google Scholar] [CrossRef]
  9. Wang, J.; Zhang, Y.M.; Xu, M.; Liu, B.Q. Heavy metal pollution of surface sediments in the northern waters of the abandoned yellow river delta in Jiangsu Province of China and ecological risk assessment. Appl. Ecol. Environ. Res. 2019, 17, 14867–14882. [Google Scholar] [CrossRef]
  10. Lv, J.S. The environmental geochemistry of heavy metals in soils and sediments in typical regions of Jiangsu coastal zone, Eastern China. M. D. Thesis, Nanjing University, Nanjing, China, 2015. [Google Scholar]
  11. Muller, G. Index of geoaccumulation in sediments of the Rhine River. Geojournal. 1969, 2(3), 108–118. [Google Scholar]
  12. Chen, B.B.; Hu, R.Q.; Chen, M.D. Natural background values of environmental elements in coastal soil in Jiangsu. J. Nanjing Agric. Univ. 1985, 8, 54–60. [Google Scholar]
  13. Hakanson, L. An ecological risk index for aquatic pollution control. A sedimentological approach. Water Res. 1980, 14, 975–1001. [Google Scholar] [CrossRef]
  14. Chen, B.; Liu, J.; Qiu, J.; Zhang, X.; Wang, S.; Liu, J. Spatio-temporal distribution and environmental risk of sedimentary heavy metals in the Yangtze River Estuary and its adjacent areas. Mar. Pollut. Bull. 2017, 116, 469–478. [Google Scholar] [CrossRef] [PubMed]
  15. Zhang, L. The Coastal Erosion-Deposition Evolution and Controlling Factors of the Abandoned Yellow River delta in northern Jiangsu province. Ph.D. Thesis, East China Normal University, Shanghai, China, 2016. [Google Scholar]
  16. Xu, G.; Liu, J.; Pei, S.; Kong, X.; Hu, G. Distribution and source of heavy metals in the surface sediments from the near-shore area, north Jiangsu Province, China. Mar. Pollut. Bull. 2014, 83, 275–281. [Google Scholar] [CrossRef] [PubMed]
  17. Hu, G.; Bi, S.; Xu, G.; Zhang, Y.; Mei, X.; Li, A. Distribution and assessment of heavy metals off the Changjiang River mouth and adjacent area during the past century and the relationship of the heavy metals with anthropogenic activity. Mar. Pollut. Bull. 2015, 96, 434–440. [Google Scholar] [CrossRef]
  18. Jahan, S.; Strezov, V. Comparison of pollution indices for the assessment of heavy metals in the sediments of seaports of NSW, Australia. Mar. Pollut. Bull. 2018, 128, 295–306. [Google Scholar] [CrossRef]
  19. Liu, M.; Zhang, A.; Liao, Y.; Chen, B.; Fan, D. The environment quality of heavy metals in sediments from the central Bohai Sea. Mar. Pollut. Bull. 2015, 100, 534–543. [Google Scholar] [CrossRef]
  20. Jiang, S.X.; Zhai, F.J.; Zhang, C.; Wang, M.M.; Shan, B.Q. Speciation distribution and risk assessment of heavy metals in sediments from the Yitong River city area. Environ. Sci. 2020, 41, 2653–2663. [Google Scholar]
  21. Lan, Q.J.; Wu, Y.; Yan, B.; Zhang, H.C.; Chen, L.; Pan, J.; Fu, C. Contamination assessments and sources analysis of heavy metals in sediments from water-level fluctuating zone along Wanzhou section, Three Gorges reservoir area. Environ. Eng. 2018, 36, 193–197. [Google Scholar]
  22. Liang, X.; Song, J.; Duan, L.; Yuan, H.; Li, X.; Li, N.; Qu, B.; Wang, Q.; Xing, J. Source identification and risk assessment based on fractionation of heavy metals in surface sediments of Jiaozhou Bay, China. Mar. Pollut. Bull. 2018, 128, 548–556. [Google Scholar] [CrossRef]
  23. Wang, M.; Tong, Y.; Chen, C.; Liu, X.; Lu, Y.; Zhang, W.; Lin, Y. Ecological risk assessment to marine organisms induced by heavy metals in China’s coastal waters. Mar. Pollut. Bull. 2018, 126, 349–356. [Google Scholar] [CrossRef]
  24. Thrush, S.F.; Hewitt, J.E.; Cummings, V.J.; Ellis, J.I.; Hatton, C.; Lohrer, A.; Norkko, A.; Naturvetenskapliga, F. Muddy waters; elevating sediment input to coastal and estuarine habitats. Front. Ecol. Environ. 2004, 2, 299–306. [Google Scholar] [CrossRef]
  25. Li, Y.; Feng, Z.H.; Li, G.Q.; Yan, B.L. The estimation of source of Heavy Metal contamination and assessment in marine sediments in Lianyungang area. Oceanol. et Limnol. Sin. 2010, 41, 829–833. [Google Scholar]
  26. Lu, R.K.; Xiong, L.M.; Shi, Z.Y. Research on Cadmium in Soil-crop Ecosystem. Soils 1992, 3, 129–132, 137. [Google Scholar]
  27. Guo, D.F. Sources of lead and cadmium in the environment and their hazards to humans and animals. Prog. Environ. Sci. 1994, 3, 71–76. [Google Scholar]
  28. Zhang, P.; Hu, R.; Zhu, L.; Wang, P.; Yin, D.; Zhang, L. Distributions and contamination assessment of heavy metals in the surface sediments of western Laizhou Bay: Implications for the sources and influencing factors. Mar. Pollut. Bull. 2017, 119, 429–438. [Google Scholar] [CrossRef] [PubMed]
  29. Zhu, A.M.; Zhang, H.; Cui, J.J.; Hu, N.J.; Liu, J.H. Environmental quality assessment and influence factor of heavy metals in the surface sediments from the Bohai Sea. Haiyang Xuebao 2019, 41, 134–144. [Google Scholar]
  30. Yang, M.; Tian, X.D.; Niu, Y.; Zhang, L.; Dong, J.; Wang, L.J.; Niu, Y.; Yu, H. Response relationship between accumulation characteristic of heavy metals in sediments and regional economic development. Environ. Eng. 2019, 37, 52–58. [Google Scholar]
  31. Zhang, J.F.; Gao, X.L. Heavy metals in surface sediments of the intertidal Laizhou Bay, Bohai Sea, China: Distributions, sources and contamination assessment. Mar. Pollut. Bull. 2015, 98, 320–327. [Google Scholar] [CrossRef]
  32. Phillips, D.P.; Human, L.R.D.; Adams, J.B. Wetland plants as indicators of heavy metal contamination. Mar. Pollut. Bull. 2015, 92, 227–232. [Google Scholar] [CrossRef]
Figure 1. Location of the sample sites and development and utilization of sea areas.
Jmse 10 01242 g001
Figure 2. Distribution map of the comprehensive potential ecological risk index in 2012.
Jmse 10 01242 g002
Figure 3. Distribution map of the comprehensive potential ecological risk index in 2015.
Jmse 10 01242 g003
Figure 4. Distribution map of the comprehensive potential ecological risk index in 2018.
Jmse 10 01242 g004
Figure 5. Cluster analysis results in 2012.
Jmse 10 01242 g005
Figure 6. Cluster analysis results in 2015.
Jmse 10 01242 g006
Figure 7. Cluster analysis results in 2018.
Jmse 10 01242 g007
Figure 8. Spatial distribution of Pb in sediments. (a) 2012; (b) 2015; (c) 2018.
Jmse 10 01242 g008aJmse 10 01242 g008b
Figure 9. Spatial distribution of Zn in sediments. (a) 2012; (b) 2015; (c) 2018.
Jmse 10 01242 g009
Figure 10. Spatial distribution of Hg in the sediments. (a) 2012; (b) 2015; (c) 2018.
Jmse 10 01242 g010
Figure 11. Spatial distribution of As in the sediments. (a) 2012; (b) 2015; (c) 2018.
Jmse 10 01242 g011
Figure 12. Spatial distribution of Cd in the sediment (a) and seawater (b) in 2012.
Jmse 10 01242 g012
Figure 13. Spatial distribution of Cd in the sediment (a) and seawater (b) in 2015.
Jmse 10 01242 g013
Figure 14. Spatial distribution of Cd in the sediment (a) and seawater (b) in 2018.
Jmse 10 01242 g014
Table 1. Classification of Geoaccumulation Index and Potential Ecological Risks Index.
I g e o Pollution Level E r i Risk Grade R I Risk Grade
≤0Clean<40Low<150Low
0~1Mild40~80Medium150~300Medium
1~2Mild–Medium80~160Medium–High300~600High
2~3Medium160~320High≥600Extremely High
3~4Medium–Heavy≥320Extremely High
4~5Heavy
>5Severe
Table 2. Statistical results of the heavy metal content in the sediments.
CuPbZnAsHgCdCr
Fall 2012Maximum36.161.8114.15.50.06600.11656.0
Minimum9.6227.046.74.940.01270.043929.9
Mean26.446.785.611.80.03320.080846.5
Fall 2015Maximum28.229.774.317.20.05160.14058.6
Minimum15.312.646.37.720.01120.080429.3
Mean19.720.458.814.40.03120.11039.9
Fall 2018Maximum26.825.578.117.10.03440.26256.6
Minimum17.516.861.59.520.01920.11035.3
Mean22.722.069.513.80.02460.18744.3
Background values15.011.447.27.380.02300.042060.1
Table 3. Statistical Results of the Geoaccumulation Index.
CuPbZnAsHgCdCr
Fall 2012Maximum0.6801.850.6890.4860.9360.881−0.687
Minimum−1.230.659−0.599−1.16−1.44−0.521−1.59
Mean0.1641.420.2420.0283−0.1810.309−0.973
Fall 2015Maximum0.3240.7960.07110.6360.5811.15−0.622
Minimum−0.558−0.441−0.611−0.520−1.620.352−1.62
Mean−0.2150.212−0.2890.336−0.2420.777−1.20
Fall 2018Maximum0.2500.5770.1430.6270.004192.06−0.672
Minimum−0.364−0.0255−0.202−0.218−0.8450.804−1.35
Mean0.001960.352−0.02800.292−0.5051.54−1.04
Table 4. Statistical results of the potential ecological risk index evaluation.
CuPbZnAsHgCdCrRI
Fall 2012Maximum12.027.12.4221.011582.91.86240
Minimum3.2011.80.9906.6922.131.40.99581.1
Mean8.7820.51.8216.057.757.71.55164
Fall 2015Maximum9.3913.01.5823.389.7100.1.95197
Minimum5.095.530.98210.519.557.40.975131
Mean6.548.971.2519.554.378.31.33170
Fall 2018Maximum8.9211.21.6623.259.8187.1.88267
Minimum5.837.371.3012.933.478.61.17158
Mean7.559.641.4718.742.81331.47215
Table 5. The 2012 Pearson matrix of sediment heavy metal variables correlation.
CuPbZnAsHgCd
Pb0.847 **
Zn0.742 **0.953 **
As0.789 **0.5000.371
Hg0.541 *0.1980.1860.607 *
Cd0.648 *0.716 **0.752 **0.4420.438
Cr0.1410.4290.368−0.247−0.4280.150
* Significantly correlated (bilateral) at the 0.05 level. ** Significantly correlated (bilateral) at the 0.01 level.
Table 6. The 2015 Pearson matrix of sediment heavy metal variables correlation.
CuPbZnAsHgCd
Pb0.087
Zn−0.4870.011
As0.2680.346−0.171
Hg0.3880.151−0.0240.856 **
Cd−0.205−0.1090.350−0.331−0.449
Cr−0.254−0.1400.273−0.644 *−0.3590.046
* Significantly correlated (bilateral) at the 0.05 level. ** Significantly correlated (bilateral) at the 0.01 level.
Table 7. The 2018 Pearson matrix of sediment heavy metal variables correlation.
CuPbZnAsHgCd
Pb0.399
Zn0.2450.509
As−0.1480.190−0.359
Hg0.171−0.3570.075−0.382
Cd−0.238−0.0580.569 *−0.277−0.028
Cr−0.562 *−0.4340.0390.1210.1270.385
* Significantly correlated (bilateral) at the 0.05 level.
Publisher’s Note: MDPI stays neutral with regard to jurisdictional claims in published maps and institutional affiliations.

