Article

Effects of Salinity on Growth and In Vitro Ichthyotoxicity of Three Strains of Karenia mikimotoi

by
Winnie Lam
1,
Emily Man-Shan Cheung
1,
Nora Fung-Yee Tam
1,2,
Thomas Chun-Hung Lee
1,
Celia Sze-Nga Kwok
1,
Kaze King-Yip Lai
1,
Steven Jingliang Xu
1 and
Fred Wang-Fat Lee
1,2,*
1
School of Science and Technology, Hong Kong Metropolitan University, Hong Kong, China
2
State Key Laboratory of Marine Pollution, City University of Hong Kong, Kowloon, Hong Kong, China
*
Author to whom correspondence should be addressed.
J. Mar. Sci. Eng. 2022, 10(9), 1236; https://doi.org/10.3390/jmse10091236
Submission received: 23 July 2022 / Revised: 30 August 2022 / Accepted: 31 August 2022 / Published: 3 September 2022
(This article belongs to the Special Issue Marine Harmful Algae)

Abstract

:
Karenia mikimotoi is one of the most damaging ichthyotoxic dinoflagellate species commonly found in China. However, its growth and ichthyotoxicity responses to salinity changes are still largely unknown. In this study, the growth and ichthyotoxicity of three K. mikimotoi strains, Hong Kong strain KMHK, Japanese strain NIES2411 and New Zealand strain CAWD133, under different salinities (25 to 35 ppt), initial algal densities (5 to 40 thousand cells) and growth phases were investigated. Results indicated that the optimum salinity for all three strains was 30 ppt. The Japanese strain achieved the highest maximum cell densities (cells mL−1) and the New Zealand strain achieved the highest specific growth rate. The Hong Kong and New Zealand strains could not tolerate the low salinity at 25 ppt and the algal cells burst after 3 days of exposure. The average cell widths of all three algal strains in 35 ppt salinity were significantly larger than that in 30 ppt. The acute toxicity test performed on Oncorhynchus mykiss gill cell line RTgill-W1 revealed that the median lethal times for KMHK and NIES2411 were 66.9 and 31.3 min, respectively, and their ichthyotoxicity was significantly affected by algal cell density and growth phase. Nevertheless, CAWD133 did not pose any ichthyotoxicity. The gill cell viability levels at 30 min were reduced from 96 to 61% and 95 to 39% for KMHK and NIES2411, respectively, when the algal cell density increased from 5 × 10³ to 4 × 10⁴ algal cells mL−1. Both KMHK and NIES2411 at stationary phase also had higher toxicity than at log phase, with a 27% reduction of gill cell viability, and exerted higher toxicity to the gill cells under extremely low (28 ppt) or high (35 ppt) salinity. These findings demonstrated that the growth–ichthyotoxicity response of Karenia mikimotoi to salinity was not only strain-specific but also depended on its density and growth phase. Study on the effects of salinity on the growth and toxicity of K. mikimotoi is greatly limited. Results from the present study provide valuable insight on the growth and toxicity of different K. mikimotoi strains, which is important in understanding their occurrence of algal bloom and fish-killing action.

1. Introduction

Dinoflagellates are one of the key causative agents of harmful algal blooms (HABs) and have enormous negative impacts on the ecosystem [1,2]. Karenia mikimotoi (Dinophyceae: Kareniaceae), formerly known as Gyrodinium aureolum and Gymnodinium mikimotoi, is one of the most damaging bloom-forming dinoflagellates found worldwide, especially in China and Japan [3]. This globally distributed species is widely known for its fish-killing ability [1]. This leads to significant economic losses in fish and shellfish farming industries [4], even though Karenia mikimotoi itself is non-toxic to humans [5]. In recent decades, blooms of K. mikimotoi have occurred almost every year in the East and South China Seas. In 2012, blooms of K. mikimotoi caused massive mortality of the abalone Haliotis discus hannai in Fujian, China, and affected nearly 300 thousand m2 of area, resulting in an economic loss of more than USD 330 million [6,7]. In 2016, blooms of K. mikimotoi killed nearly 200 tons of fish in eight fish culture zones near Tolo Harbour and the waters of the northeast region of Hong Kong [8]. Blooms of K. mikimotoi have been regularly reported in Tolo Harbour, Hong Kong, since the 1980s (Figure A1) [9]. The size of a large-scale algal bloom is usually over 100 km2. For example, the blooms of K. mikimotoi that occur in China could be up to 17,000 km2 [6,7]. In contrast, the blooming scale of K. mikimotoi in Hong Kong was relatively small, ranging from 1 × 10⁻⁵ km2 up to 1.51 × 10⁻² km2, and the algal cell density can reach as high as 5 × 10⁴ cells mL−1 (Table A1).
Environmental conditions play a major role in the growth of dinoflagellates and trigger harmful algal bloom [10,11]. Previous studies have demonstrated that salinity is one of the major factors to affect the growth and toxicity of HAB species [12,13,14]. HAB species differ in their adaptability and tolerance to different salinities. Hamasaki’s group reported that extreme salinities (13 and 38 ppt) decreased cell growth but enhanced toxicity of the dinoflagellate Alexandrium tamarense [12]. Another study demonstrated that optimal growth of an Alexandrium ostenfeldii strain could be maintained within a wide salinity range from 6 to 34 ppt [10]. An increase in cell sizes and a higher cellular content of paralytic shellfish toxins (PSTs) were observed at the highest and lowest salinities. Similar results were reported by another group in their study on Alexandrium minutum in salinities ranging from 12 to 37 ppt [15]. A study investigated the correlation between salinity and the occurrence of algal bloom of Karenia spp. in the northern Gulf of Mexico [16]. Interestingly, the field data showed that the bloom of Karenia spp. occurred frequently in low salinities over the 50 years between 1954 and 2004. The author found that the Karenia cells maintained their growth in low salinity, ranging from 17.5 to 20 ppt, and the highest level of toxin production was recorded during the stationary growth phase. Populations of Heterocapsa circularisquama were affected by varying salinity due to vertical migration and horizontal dispersion [17]. Therefore, salinity is thought to be an important biogeographical determinant for the blooms of H. circularisquama. Apart from cell growth and ichthyotoxicity, changes in salinity can also affect other physiological parameters, such as the motility and cell size of algal cells [18]. For instance, reduction in the upward swimming speed of Heterosigma akashiwo was observed when the salinity changed from 28 to 8 ppt [18]. Sandoval-Sanhueza et al. have conducted a study to investigate the combined effect of temperature and salinity on growth and ichthyotoxicity of Heterosigma akashiwo and Pseudochattonella verruculosa [19]. Their study demonstrated that salinity could be an important determinant to affect the growth and ichthyotoxicity of both species. The effect of salinity changes on the growth and toxicity of HAB species has been well studied. However, no conclusive results have been achieved, particularly on the growth and toxicity of Karenia mikimotoi at different growth phases.
Karenia mikimotoi is one of the most damaging ichthyotoxic dinoflagellate species [2], but growth and toxicity varied among strains originating from different geographical locations. The growth and ichthyotoxicity of different strains of the same species, particularly their responses to salinity, have never been compared. There was no comprehensive study investigating the effects of cell density and growth phases, salinity, and/or their combination on the growth and toxicity of different K. mikimotoi strains. Moreover, taxonomy, growth and toxicity of the strain isolated from blooming water in Hong Kong (KMHK) have never been reported. The present study therefore aims to evaluate and compare the growth and ichthyotoxicity of the Hong Kong K. mikimotoi strain KMHK to the Japanese strain NIES2411 and the New Zealand strain CAWD133 under different degrees of salinity. The responses of these three strains to salinity changes under different algal cell densities and growth phases were also investigated. Phylogenetic analysis was performed to determine the origin of the Hong Kong strain and its relationships to other K. mikimotoi strains. Since fish farming is a major aquaculture industry in Hong Kong and fish-killing incidents have been reported regularly in the aquaculture zone near Tolo Harbour because of K. mikimotoi bloom [9], it is of paramount importance to study how these factors affect the growth and ichthyotoxicity of this deadly HAB species. Results from the present study provide systematized and scientific information on the growth and toxicity of K. mikimotoi strains that is important in understanding the occurrence of algal blooms and their fish-killing action.

2. Materials and Methods

2.1. Karenia Mikimotoi Strains and Cell Cutivation Conditions

Karenia mikimotoi strain KMHK was isolated from water samples collected from Yim Tin Tsai Fish Culture Zone in Tolo Harbour (22°27′ N, 114°13′ E) during an algal bloom caused by K. mikimotoi in 2016 (Figure A1). A monoalgal culture of KMHK was established and kept in the Environmental Laboratory at Hong Kong Metropolitan University. Species identification of KMHK was determined based on the morphological features and DNA sequencing analysis of the internal transcribed spacer 1-5.8S ribosomal RNA gene—internal transcribed spacer 2 (ITS1-5.8S-ITS2). The monoalgal culture was cultivated in L1 medium without silicate at a salinity of 30 ppt [20] and maintained in a growth chamber (MLR-352H-PA, PHCbi, Wood Dale, IL, USA) at 22 °C under a 12:12 h light/dark cycle at a light intensity of 50 μmoL photons m−2 s−1 provided by cool white fluorescent tubes. Algal cells that reached log phase were sub-cultured in a ratio of 1:10 (v/v of cell suspension/fresh L1 medium).
The New Zealand strain CAWD133 and the Japanese strain NIES2411 were purchased from the Cawthron Institute’s Culture Collection of Micro-algae and the Microbial Culture Collection at the National Institute for Environmental Studies, respectively. Both strains were cultivated in the same growing conditions as KMHK. Dunaliella tertiolecta (STK-2) was isolated from water samples collected from Sha Tau Kok (22°32′ N, 114°13′ E) during an algal bloom caused by Dunaliella tertiolecta in 2012. Monoculture of STK-2 was established and kept in the Environmental Laboratory at Hong Kong Metropolitan University.

2.2. DNA Extraction, PCR Conditions and Phylogenetic Analysis

Algal culture in mid-log phase with 1 × 10⁶ cells was harvested by centrifugation for 10 min (4000× g at 20 °C). Total genomic DNA was extracted from the algal cell pellets with the DNeasy Plant Pro Kit (69204, Qiagen, Hilden, Germany). The quality and quantity of extracted DNA were examined by agarose gel electrophoresis and a NanodropTM 1000 spectrophotometer (Thermo Scientific, Labtech International Ltd., East Sussex, UK), respectively. PCR amplification was processed with three pairs of primers targeting three DNA regions, namely ribosomal DNA large subunit (LSU), internal transcribed spacer 1–5.8S ribosomal RNA gene—internal transcribed spacer 2 (ITS1-5.8S-ITS2) and ribulose-1,5 bisphosphate carboxylase large subunit gene (rbcL). Detailed information on the primers is summarized in Table A3. The amplification conditions adopted the method reported in previous studies [21,22,23,24].
Phylogenetic analysis was performed according to a previous study [24]. Both KMHK and CAWD133 were included in the phylogenetic analysis. However, NIES2411 was excluded due to limitations of the study. Briefly, DNA sequences of LSU rDNA, ITS1-5.8S-ITS2 and rbcL of KMHK were concatenated. Alignment of sequences was conducted using BioEdit. Neighbor-joining algorithm between the concatenated sequences was constructed using PHYLIP version 3.69 with 1000 replicates as the bootstrapping option for the neighbor-joining analyses [25,26]. Karenia selliformis (CAWD79) and Karenia bidigitata (CAWD92 and CAWD81) were used as outgroups to root the phylogenetic tree. Sequence data of Karenia mikimotoi species used in the phylogenetic study are summarized in Table A4.

2.3. Growth Curves

Algal cells were inoculated into L1 medium to yield an initial cell density of 1 × 10³ cells mL−1. The growth curve experiment was conducted over 21 days. Cells (1 mL) were collected daily and fixed with 10 μL of Lugol’s solution. Algal density was measured by direct cell counting under an optical microscope using a Sedgewick Rafter cell counting chamber (PRSER-SGI). The mean cell density with three replicates was measured for each data point on a growth curve. The specific growth rate (µ, in day−1) at log phase was calculated as µ = ln(N’1 cell/mL) − ln(N1 cell/mL)]/t, where N’1 is the final cell count, N1 is the initial cell count, and t is the sampling time (days).

2.4. Effects of Salinity on Growth and Cell Width

L1 media at five salinities (25, 28, 30, 33 and 35 ppt) were prepared by adjusting the amount of sea salt and deionized water. To determine the salinity effects, roughly 1 × 10⁴ algal cells mL−1 were inoculated into different L1 media to yield an initial cell density of 1 × 10³ cells mL−1. For each algal strain, 1 mL cell samples were collected at lag, log and stationary growth phases (Table A2). Cell numbers of each sample were determined by cell counting under a light microscope using a Sedgwick Rafter cell counter.
Algal cell width and morphology were determined. Measurements were performed using a digital system connected to an optical microscope (ECLIPSE Ts2, Nikon, Tokyo, Japan) with 200X magnification. Samples for analysis were taken from log phase cultures. Measurements were calibrated with a micrometer. For each sample, the mean of cell width was measured from at least 30 cells picked randomly from the culture. Relative mobility of cells compared to normal vegetative K. mikimotoi cells in each sample was also recorded. Each data point in all experiments was expressed as the mean of three replicates of measurements.

2.5. Fish Gill Cell Line and Culturing Condition

The gill cell line RTgill-W1 (CRL-2523) isolated from gill filaments of rainbow trout Oncorhynchus mykiss was purchased from the American Type Culture Collection (ATCC). Cells were routinely cultured in 75 cm2 culture-treated flasks (431464U, Corning, Corning, NY, USA) with Leibovitz’s L-15 medium (11415114, Gibco, Waltham, MA, USA) supplemented with 10% (v/v) heat-deactivated fetal bovine serum (FBS, 16000036, Gibco) and an antibiotic–antimycotic mixture (15240096, Gibco) containing 10 units per mL of penicillin, 10 µg per mL of streptomycin and 0.025 µg per mL of amphotericin B. Detached cells were collected in L-15 medium and centrifuged for 10 min at 875× g at 18 °C to 21 °C. Sub-culturing of cells with L-15 medium was replaced twice in one week to generate an adherent monolayer at the bottom of the flask. The whole flask with cell cultures was stored at 19 °C in the dark. Sub-cultures were usually performed twice per week at a ratio of 1:4 (v/v of cell suspension: L-15 medium). A total of 0.25% Trypsin-EDTA solution (25200072, Gibco) was used for cell dissociation and routine cell culture passaging. Microbial contamination was regularly checked by light microscopy with DAPI (4’,6-diamidino-2-phenylindole) staining to ensure no contamination.

2.6. Ichthyotoxicity of K. Mikimotoi Strains on Fish Gill Cells

The laboratory culture of the dinoflagellate K. mikimotoi at log phase with final cell density of 4 × 10⁴ cells mL−1 was exposed to the gill cell line RTgill-W1 following the method reported previously [27,28]. Briefly, one confluent 75 cm2 cell culture flask of RTgill-W1 80% full of monolayer adherent cells was applied. Gill cells mixed with 0.4% Trypan Blue Solution (15250061, Gibco) were counted with a cell counting hemacytometer (41100000, Marien Field). The gill cell line was adjusted to 3.5 × 10⁴ gill cells mL−1. A total of 100 μL adjusted cell line culture was seeded into each well on 96-well clear flat-bottom microplates (3599, Corning). The outermost wells and alternative wells were filled with phosphate-buffered saline (PBS) to avoid evaporation and light scattering by fluorescence signal. The 96-well plates were covered with aluminum foil and incubated at 19 °C for 24 h. Two control groups were set up in the experiments. The first control group comprised the gill cell line exposed to 30 ppt L1 algal medium without any algal cells. We noticed that the viability of the gill cells in the control group dropped below 80% after 180 min from the effect of high salinity. Therefore, the duration of the cell exposure was confined to 120 min to maintain the good reproducibility of the assay. The gill cell line exposed to the non-toxic algal species Dunaliella tertiolecta (STK-2) was treated as another control. When compared to the first control, no mortality of the gill cells was observed after exposure to D. tertiolecta for the 120 min (data not shown). Phosphate-buffered saline (PBS) solution was used as solvent blank. All experiments were repeated three times and three replicate wells were measured for each sample (including treatment groups and control groups).
A 100 μL algal cell sample was transferred to each well at the start of exposure. Next, 1% (v/v) L-15/exposure (L-15/ex) solution with 0.2 μm membrane filtered, which consisted of L-15 inorganic salts (L5520, Sigmaaldrich), galactose (G5388, Sigmaaldrich) and pyruvate (P5280, Sigmaaldrich) dissolved in sterilize Milli-Q water, was added to each well [29]. The salinity was not changed in an additional L-15/ex solution. The well plate was incubated in the growth chamber for 30–120 min. The ichthyotoxicity of the three K. mikimotoi strains at different initial algal densities (5 to 40 × 103 cells mL−1), various growth phases (lag, log and stationary phase), various exposure times (30, 60, 90 and 120 min) and various salinities (28, 30, 33 and 35 ppt) was investigated.
Ichthyotoxicity of the algal cells was indicated by the measurement of the cytotoxic effect of the algal cells to the fish gill cells using AlamarBlue assay. Before the cell viability measurements, gill cells in the 96-well plate (92096, Techno Plastic Products, Trasadingen, Switzerland) were observed with inverted microscopy (ECLIPSE Ts2, Nikon) to evaluate the gill cell detachment condition. A 5% (v/v) amount of AlamarBlue in PBS was prepared fresh and protected from light. After the sample in each well was removed and washed with 100 μL PBS, 100 μL of the AlamarBlue working solution was added. For the instrumental blank, 5% (v/v) AlamarBlue in 1% L-15/ex solution was applied in the empty well at the end of the experiment to check the background signal caused by the instrument. The plates were covered with aluminum foil and incubated at 19 °C for 2 h. The fluorescence signal of AlamarBlue was measured (excitation: 530 nm, emission: 595 nm) with the fluorescence plate reader (SpectraMax iD3, Molecular devices). The percentage (%) of viability (metabolic activity) of the gill cell line was calculated as: (reading of sample—reading of instrumental blank) * 100/(reading of method blank—reading of blank instrumental blank).

2.7. Statistical Analyses

The data on the cell widths of the three K. mikimotoi strains were analyzed using parametric one-way analysis of variance (ANOVA). The effects of initial algal density (5 to 40 × 103 cells mL−1), growth phases (lag, log and stationary phases), exposure times (30, 60, 90 and 120 min) and salinities (28, 30, 33 and 35 ppt) on the growth and ichthyotoxicity of K. mikimotoi were analyzed using a parametric two-way analysis of variance (ANOVA), with strains and treatments as the two sources of variations. If the interaction between two sources was significant, one-way ANOVA was conducted to test the treatment effect in each strain, as well as the strain effect in each treatment. If the ANOVA result was significant at p ≤ 0.05, a post hoc analysis, Tukey’s multiple comparison test (SPSS version 22, Chicago, USA), was performed to determine where differences were. Normality and homogeneity of variances were assessed and confirmed by the Kolmogorov–Smirnov method and Levene’s test. No data transformation was needed for the parametric test. All graphs were processed using GraphPad Prism 9 software (GraphPad, Inc., San Diego, CA, USA).

3. Results and Discussion

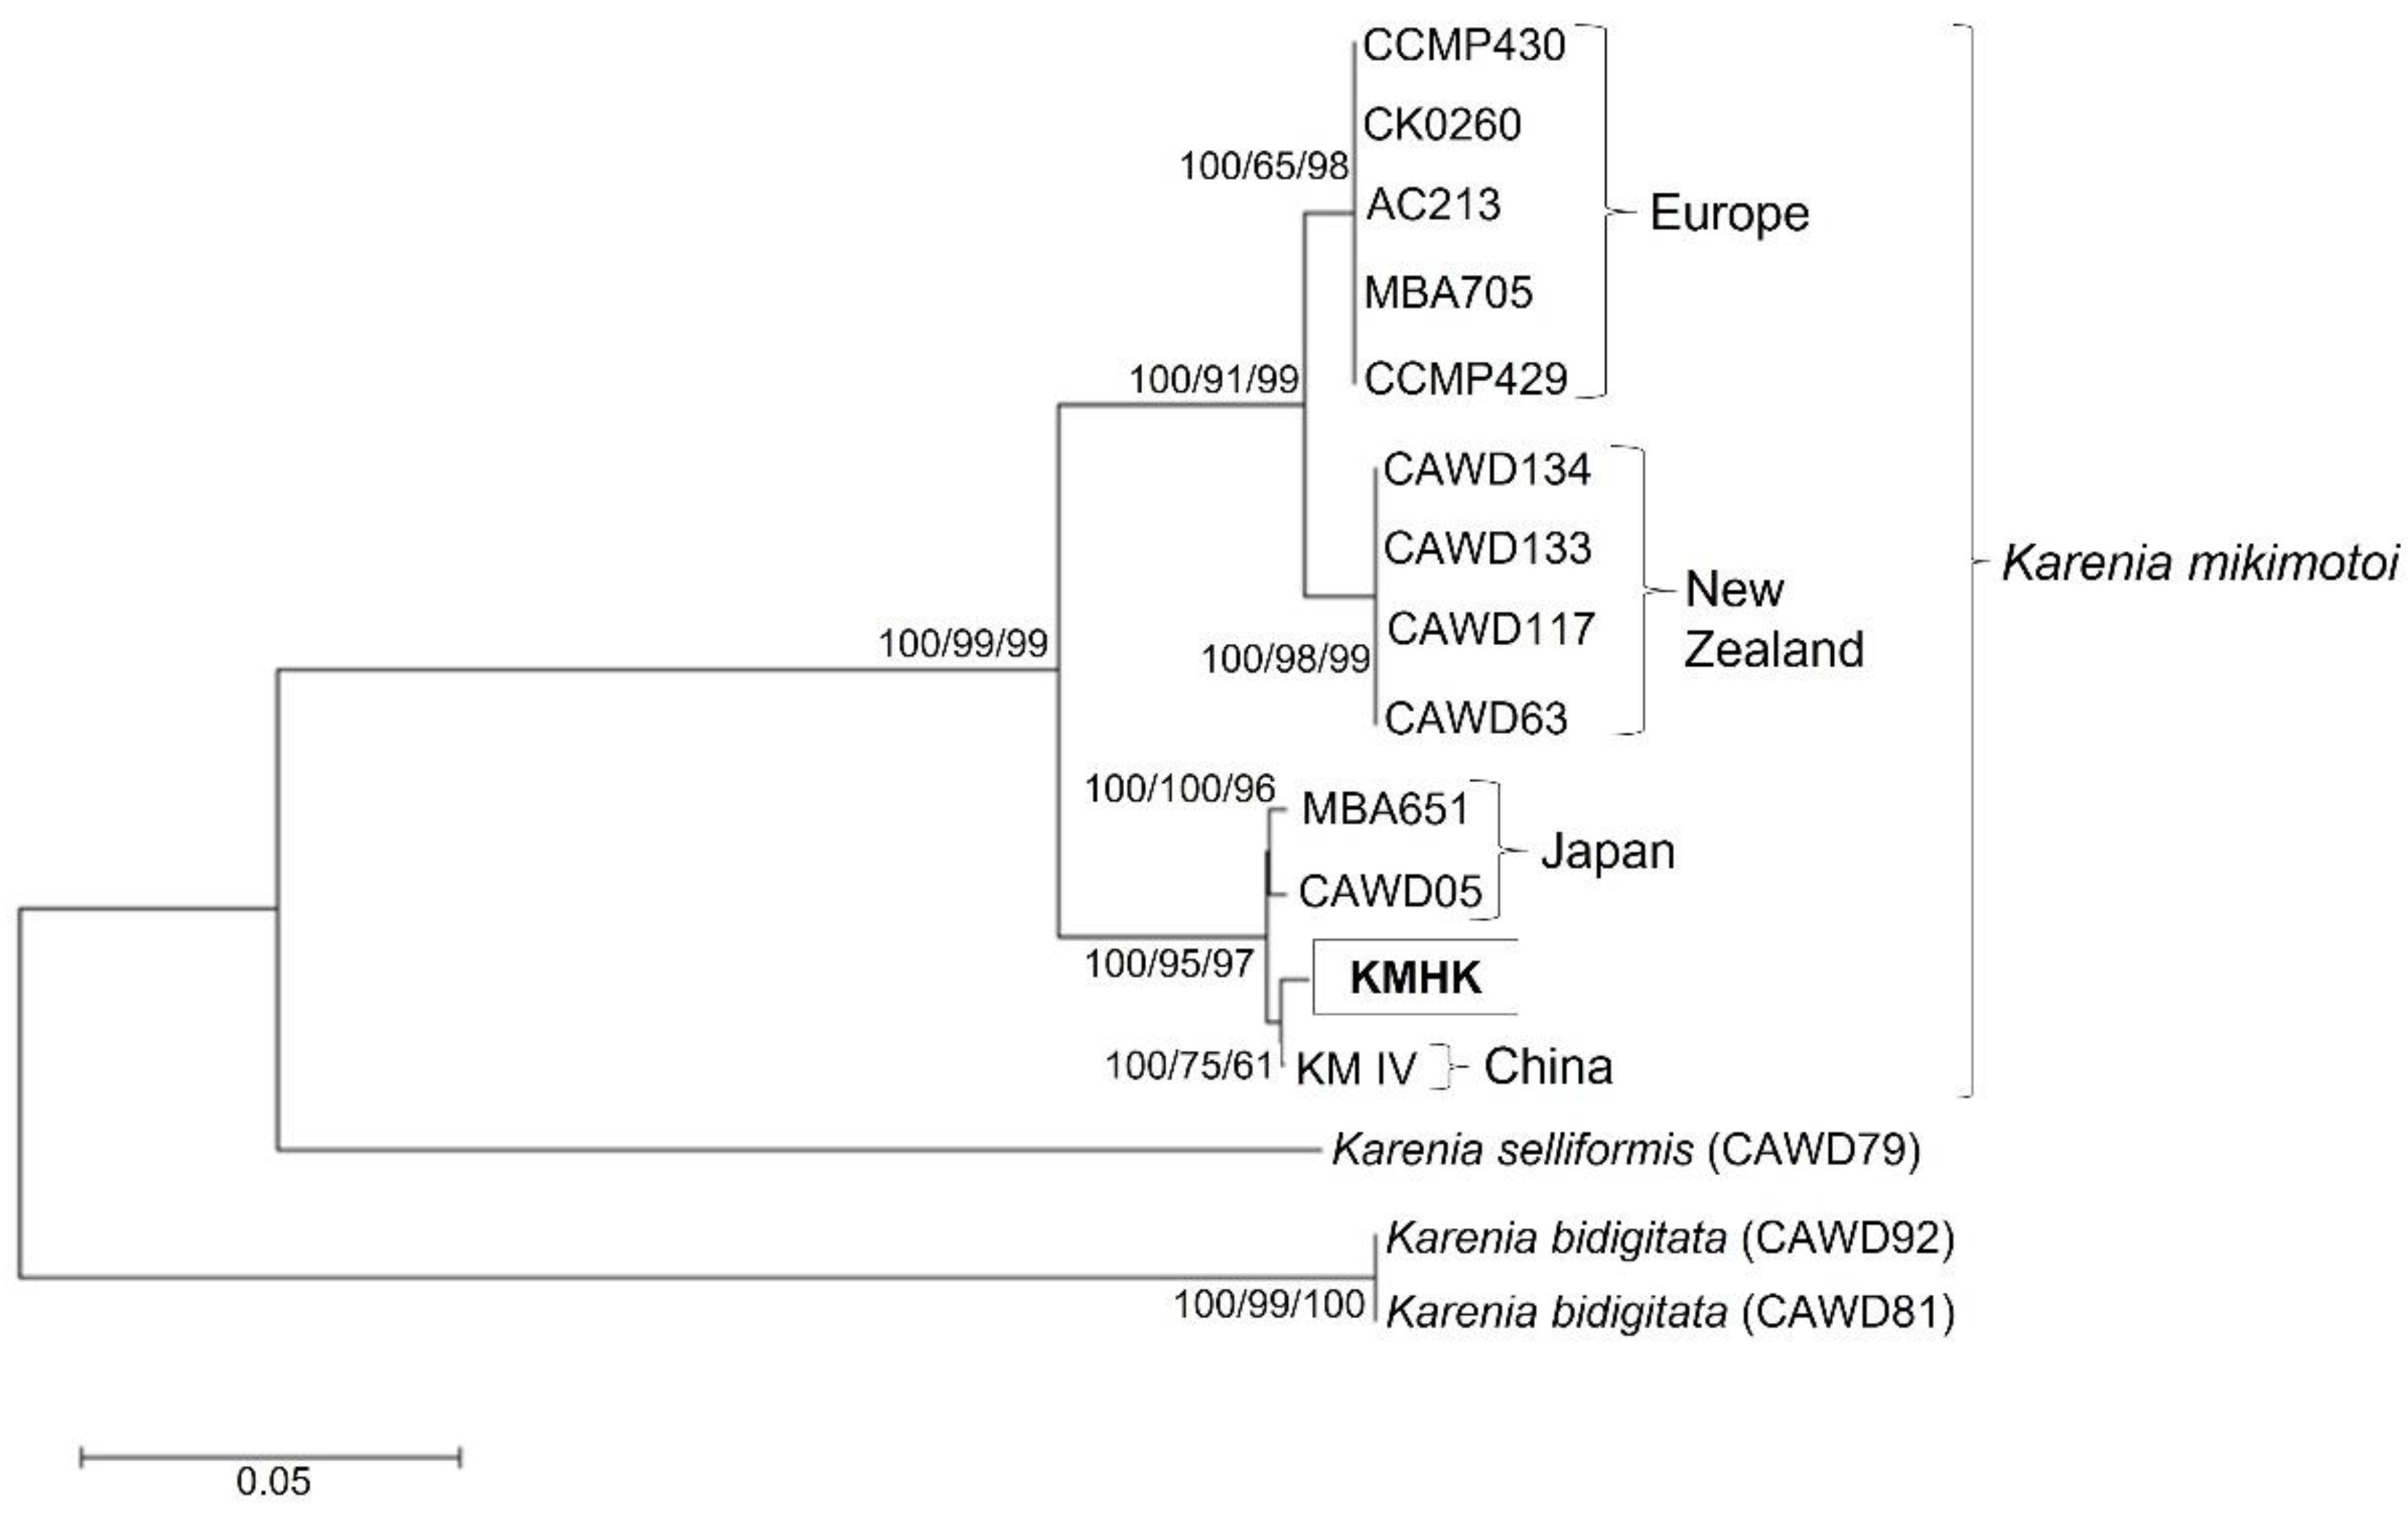
3.1. Phylogenetic Analysis of KMHK

A previous phylogenetic study demonstrated that strains of K. mikimotoi could be separated into three different ribotype clusters based on geographical origins that included Europe, New Zealand, and Japan [24]. Figure 1 shows the phylogenetic tree generated through the analysis of three DNA sequences (LSU rDNA: large subunit ribosomal DNA, ITS1-5.8S-ITS2: internal transcribed spacer 1–5.8S ribosomal RNA gene—internal transcribed spacer 2 and rbcL: ribulose-1,5 bisphosphate carboxylase large subunit gene partial sequence) of different K. mikimotoi strains, and the tree topology is highly similar to what was previously reported [24]. Most clades in the phylogenetic tree received high bootstrap values. To the best of our knowledge, this is the first formal molecular characterization of a K. mikimotoi strain isolated from a massive bloom that occurred in 2016 in Hong Kong. Our results indicated that KMHK clusters within the Japanese and Chinese clade (with >98% identities) and the genetic distance of KMHK were closely affiliated to the KM IV strains isolated from the South China Sea (Figure 1). It is not surprising that HAB species can be carried by shipping activities from one place to another [1,30]. The Chinese origin of the KMHK strain suggested that the two taxa may be conspecific, and the Hong Kong strain may possibility have been transported to Hong Kong waters through shipping activities or naturally dispersed from the South China Sea.

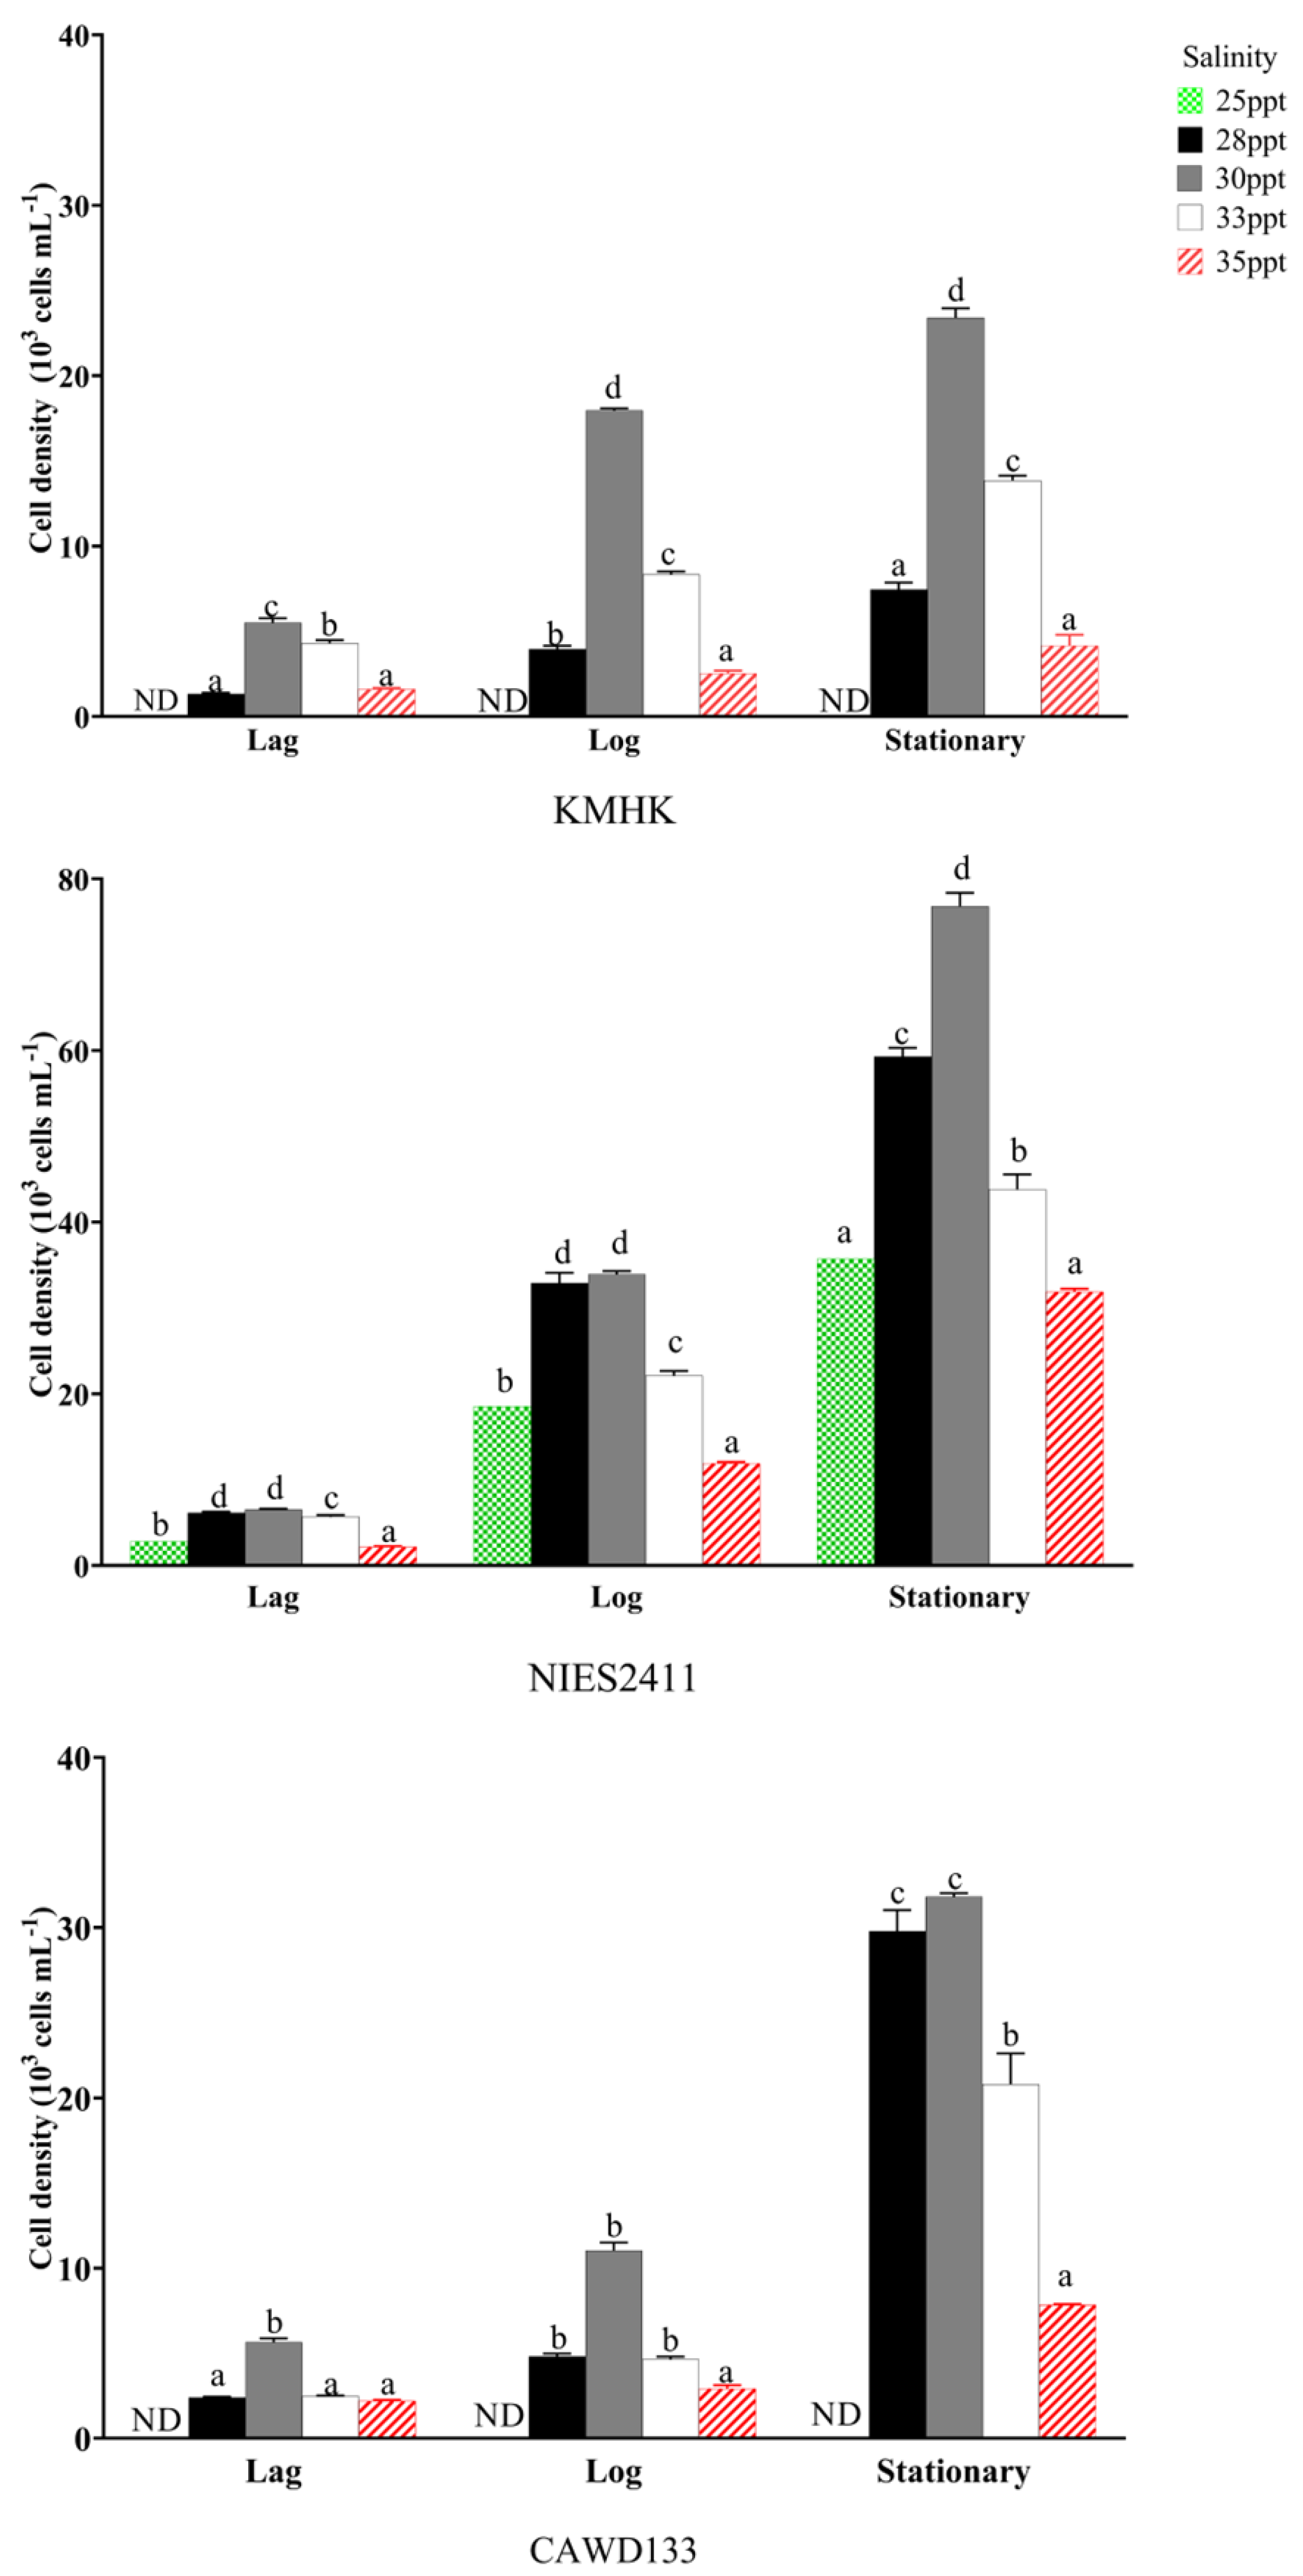
3.2. Growth of K. Mikimotoi Strains

Growth of the three stains in standardized L1 algal medium and 30 ppt salinity over 21 days was determined and the growth curves were generated (Figure 2). The growth curve pattern of the three strains was typical, with different distinctive growth phases. For KMHK, three growth phases, namely lag (cells need to adapt to growth conditions with little division and increase in cell density), log (exponential growth) and stationary (growth ceases) phases were observed, while an accelerated phase was observed between lag and log phases for CAWD133. The Japanese strain NIES2411 also had the accelerated phase but cells continued growing and did not reach the stationary phase at the end of the 21-days experiment. The duration of the lag phase was comparable, but that of the log phase differed among the three strains (Table 1). The cell density of KMHK increased slowly in the first 4 days, then grew rapidly from day 5 onwards and peaked with a density of 2.5 × 10⁴ cells mL−1 on day 13. A similar phenomenon was observed in CAWD133. The cell density increased slowly in the first 4 days, then increased steadily and peaked at 3.25 × 10⁴ cells mL−1 on day 14. The cell density of both KMHK and CAWD133 strains in the stationary phase was similar. In contrast, NIES2411 exhibiting delayed growth with a relatively long duration of lag, accelerated and log phases. The strain started the log phase on day 9 and reached maximum cell density at 7.69 × 10⁴ cells mL−1 on day 21. The maximum cell density of NIES2411 was the highest among the three strains. Interestingly, the prolonged log phase and high maximum cell density were also observed in other Japan strains (Table 1). In general, the growth rates of other K. mikimotoi strains reported in other studies ranged from 0.126 to 0.336 day−1 (Table 1). The specific growth rates of the three strains in this study were within the range; however, the specific growth rate was strain-specific and dependent on the growing conditions used in the study. In the present study, we found that the specific growth rate of the New Zealand strain CAWD133 (0.271 day−1) was closer to that of the Japanese strain NIES2411 (0.189 day−1), and the Hong Kong strain KMHK demonstrated a moderate growth rate of 0.169 day−1 when compared to other strains reported previously.

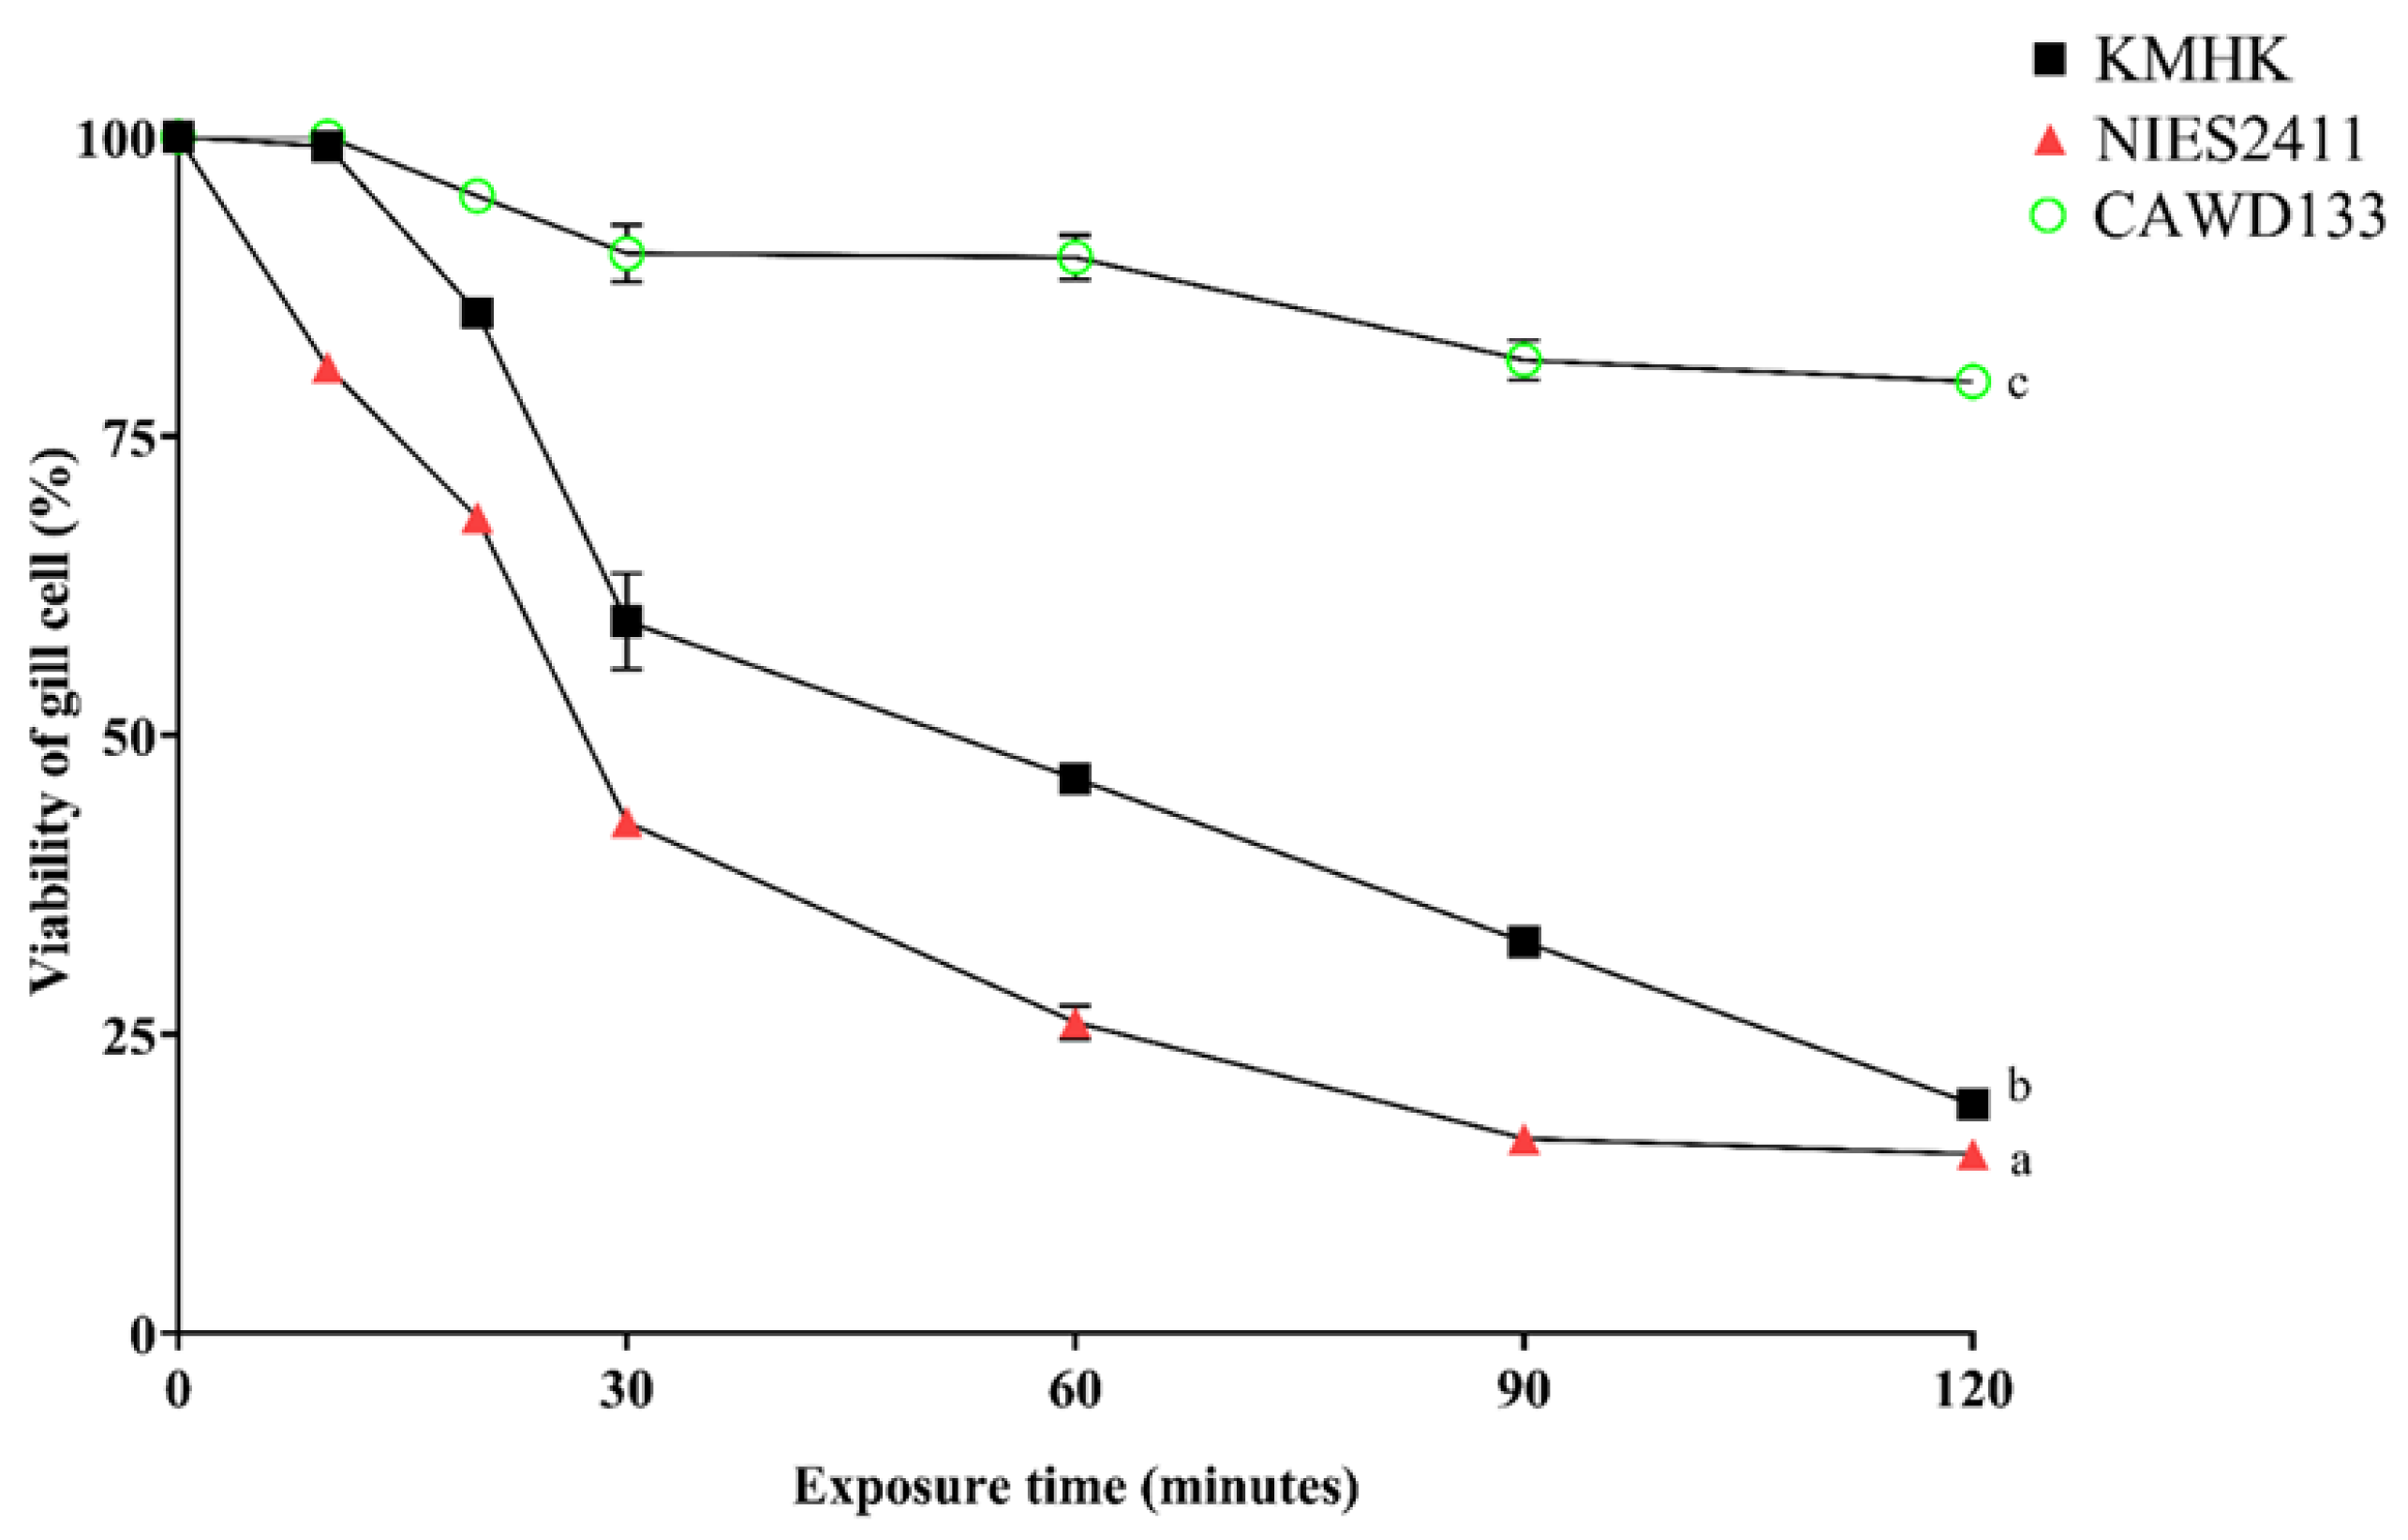
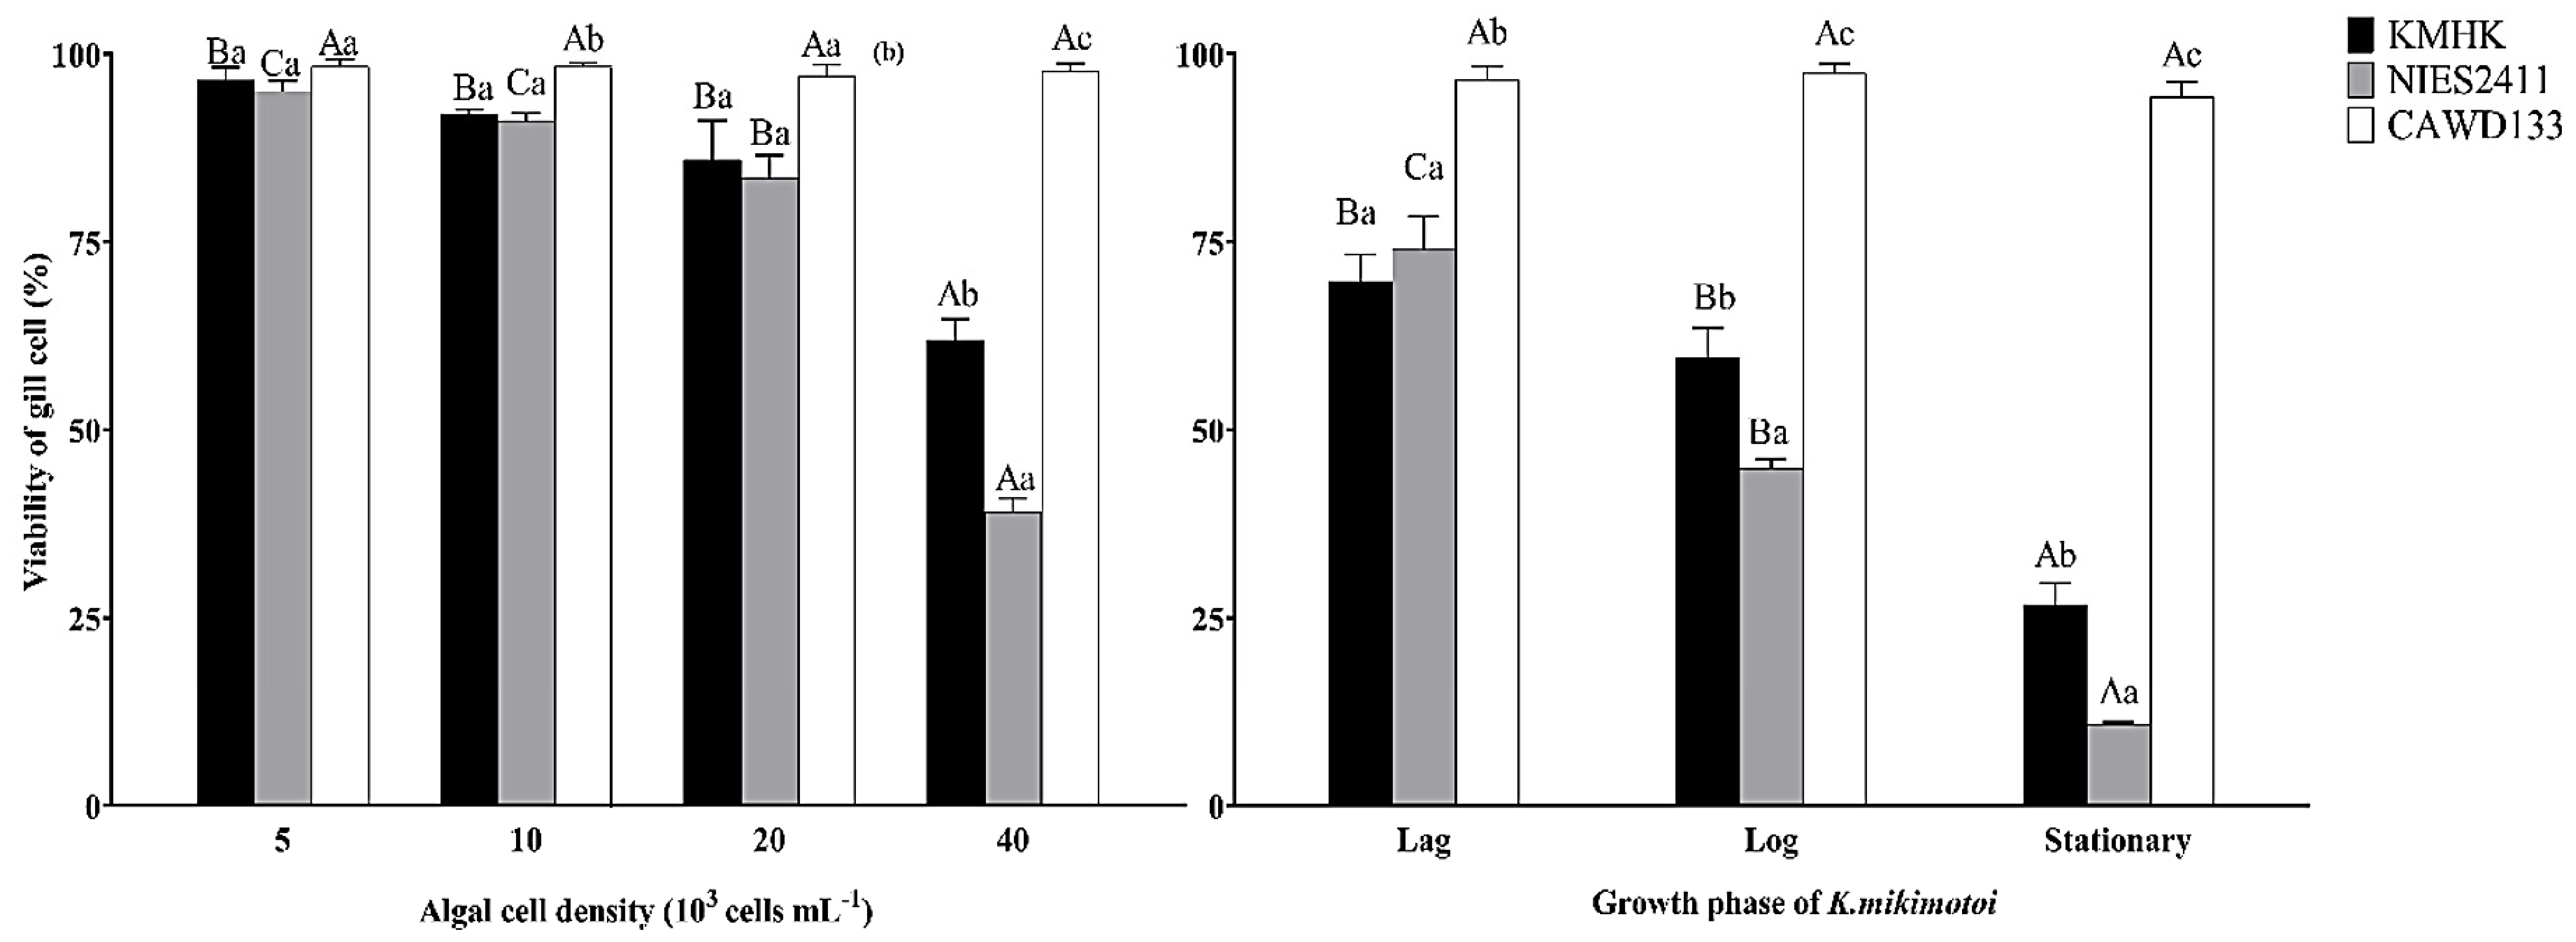
3.3. Ichthyotoxicity of K. Mikimotoi Strains

We investigated and compared the ichthyotoxicity of the three strains. Viability assays on fish gill RTgill-W1 cells after exposure to K. mikimotoi cells for 120 min were conducted (Figure 3). The viability assay using this fish gill cell line was adopted to test the cytotoxicity of harmful marine microalgae in a recent study [35]. Figure 3 shows that the Japanese strain NIES2411 was more toxic to fish gill cells than the Hong Kong KMHK strain, while the New Zealand strain did not have a significant toxic effect on the fish gill cells during the 120 min of exposure. The median lethal times (LT50) of gill cell line exposure to KMHK and NIES2411 were 66.9 ± 3.3 and 31.3 ± 2.5 min, respectively. Gill cell viability after 120 min of exposure to KMHK and NIES2411 (both at log phase and density of 4 × 10⁴ algal cells mL−1) dropped to below 20%. On the other hand, a loss of cell attachment was observed in the gill cell line at 10 min after exposure to KMHK and NIES2411, but no cell detachment was observed in the gill cell line after exposure to CAWD133 (data not shown). It has been reported that adherent-type cells need cell anchorage to develop and maintain tissue homeostasis, and cell detachment would often be linked to apoptosis of the cells [36].
We further examined the changes in the ichthyotoxicity of the three strains under different initial algal cell densities and growth phases (Figure 4). In general, the viability of gill cells decreased as a function of initial algal cell density in both KMHK and NIES2411 with significant reduction in gill cell viability at the highest algal cell density (4 × 10⁴ cell mL−1). A two-way ANOVA revealed that the differences in ichthyotoxicity among the three strains and algal densities were significant. The viability levels of gill cells exposed to KMHK and NIES2411 were very similar at algal cell densities from 5 × 10³ to 2 × 10⁴ cell mL−1. When at an algal cell density of 4 × 10⁴ cell mL−1, NIES2411 caused a drop in gill cell viability that was significantly higher (~20%) than KMHK. This result indicated that both strains exhibited significant ichthyotoxicity when their algal cell density reached 4 × 10⁴ cell mL−1. Interestingly, no effect on the gill cell viability was found in the gill cells exposed to CAWD133 at various algal cell densities. Our results were comparable to a previous study where the ichthyotoxicity of the New Zealand K. mikimotoi strain KMWL01 was found to be dependent on algal cell density [37]. After being exposed to 2.6 × 10⁴ algal cells mL−1 of KMWL01, the viability of the gill cells was reduced to 49%, whereas the viability of the gill cells was increased to 70% when the algal cell density was diluted to one-third of the original density. Similar to the effect of the initial algal cell density, the effects of growth phase on the gill cell viability in the KMHK and NIES2411 exposures were similar (Figure 4). A two-way ANOVA revealed that the differences in ichthyotoxicity among the three strains and growth phase of algae were significant. KMHK and NIES2411 at stationary phase were significantly more toxic to gill cells than that at log phase and lag phase. The ichthyotoxicity of NIES2411 was significantly higher than that of KMHK when the algal cells were growing at log phase and stationary phase. As expected, no toxic effect was found from CAWD133 at any of the three growth phases. Such results further demonstrated that CAWD133 is a non-toxic or least toxic K. mikimotoi strain, whose toxicity is not affected by algal cell density and growth phase. The effect of growth phases on the toxicity of HAB species has been well studied. However, no conclusive results have been achieved; the toxicity of different HAB species/strains at different growth phases varied. This generally indicated that the toxicity of Alexandrium cells was higher at log phase than at the stationary growth phase [38]. Other species showed an opposite effect [39]. For example, the production of a diarrhetic shellfish poisoning (DSP) cellular toxin by the Prorocentrum species on day 50 (stationary growth phase) was significantly higher than on day 28 (log phase) [39]. Reports showed that the toxicity of yessotoxin (YTX)-producing Protoceratium reticulatum was significantly higher in the stationary growth phase when compared to the exponential growth phase [40,41,42]. Some algal toxins have been suggested to serve as secondary metabolites that are usually in higher production under growth-limiting/stress conditions [42]. This might be a reason for higher toxicity expression in the stationary growth phase. However, no significant difference was observed between the two growth phases in another two YTX-producing Lingulodinium polyedra strains [43]. Relevant study on K. mikimotoi is scarce and our current understanding is greatly limited. Zou et al. demonstrated that the ichthyotoxicity of two Japanese K. mikimotoi strains, SUO-1 and FUK, growing in log and stationary growth phases was very different [9]. Similar to our results, the SUO-1 strain in the stationary growth phase exhibited higher toxicity that in the initial and mid-log growth phases. In contrast, no significant changes in the toxicity of the FUK strain were observed between the different growth phases.

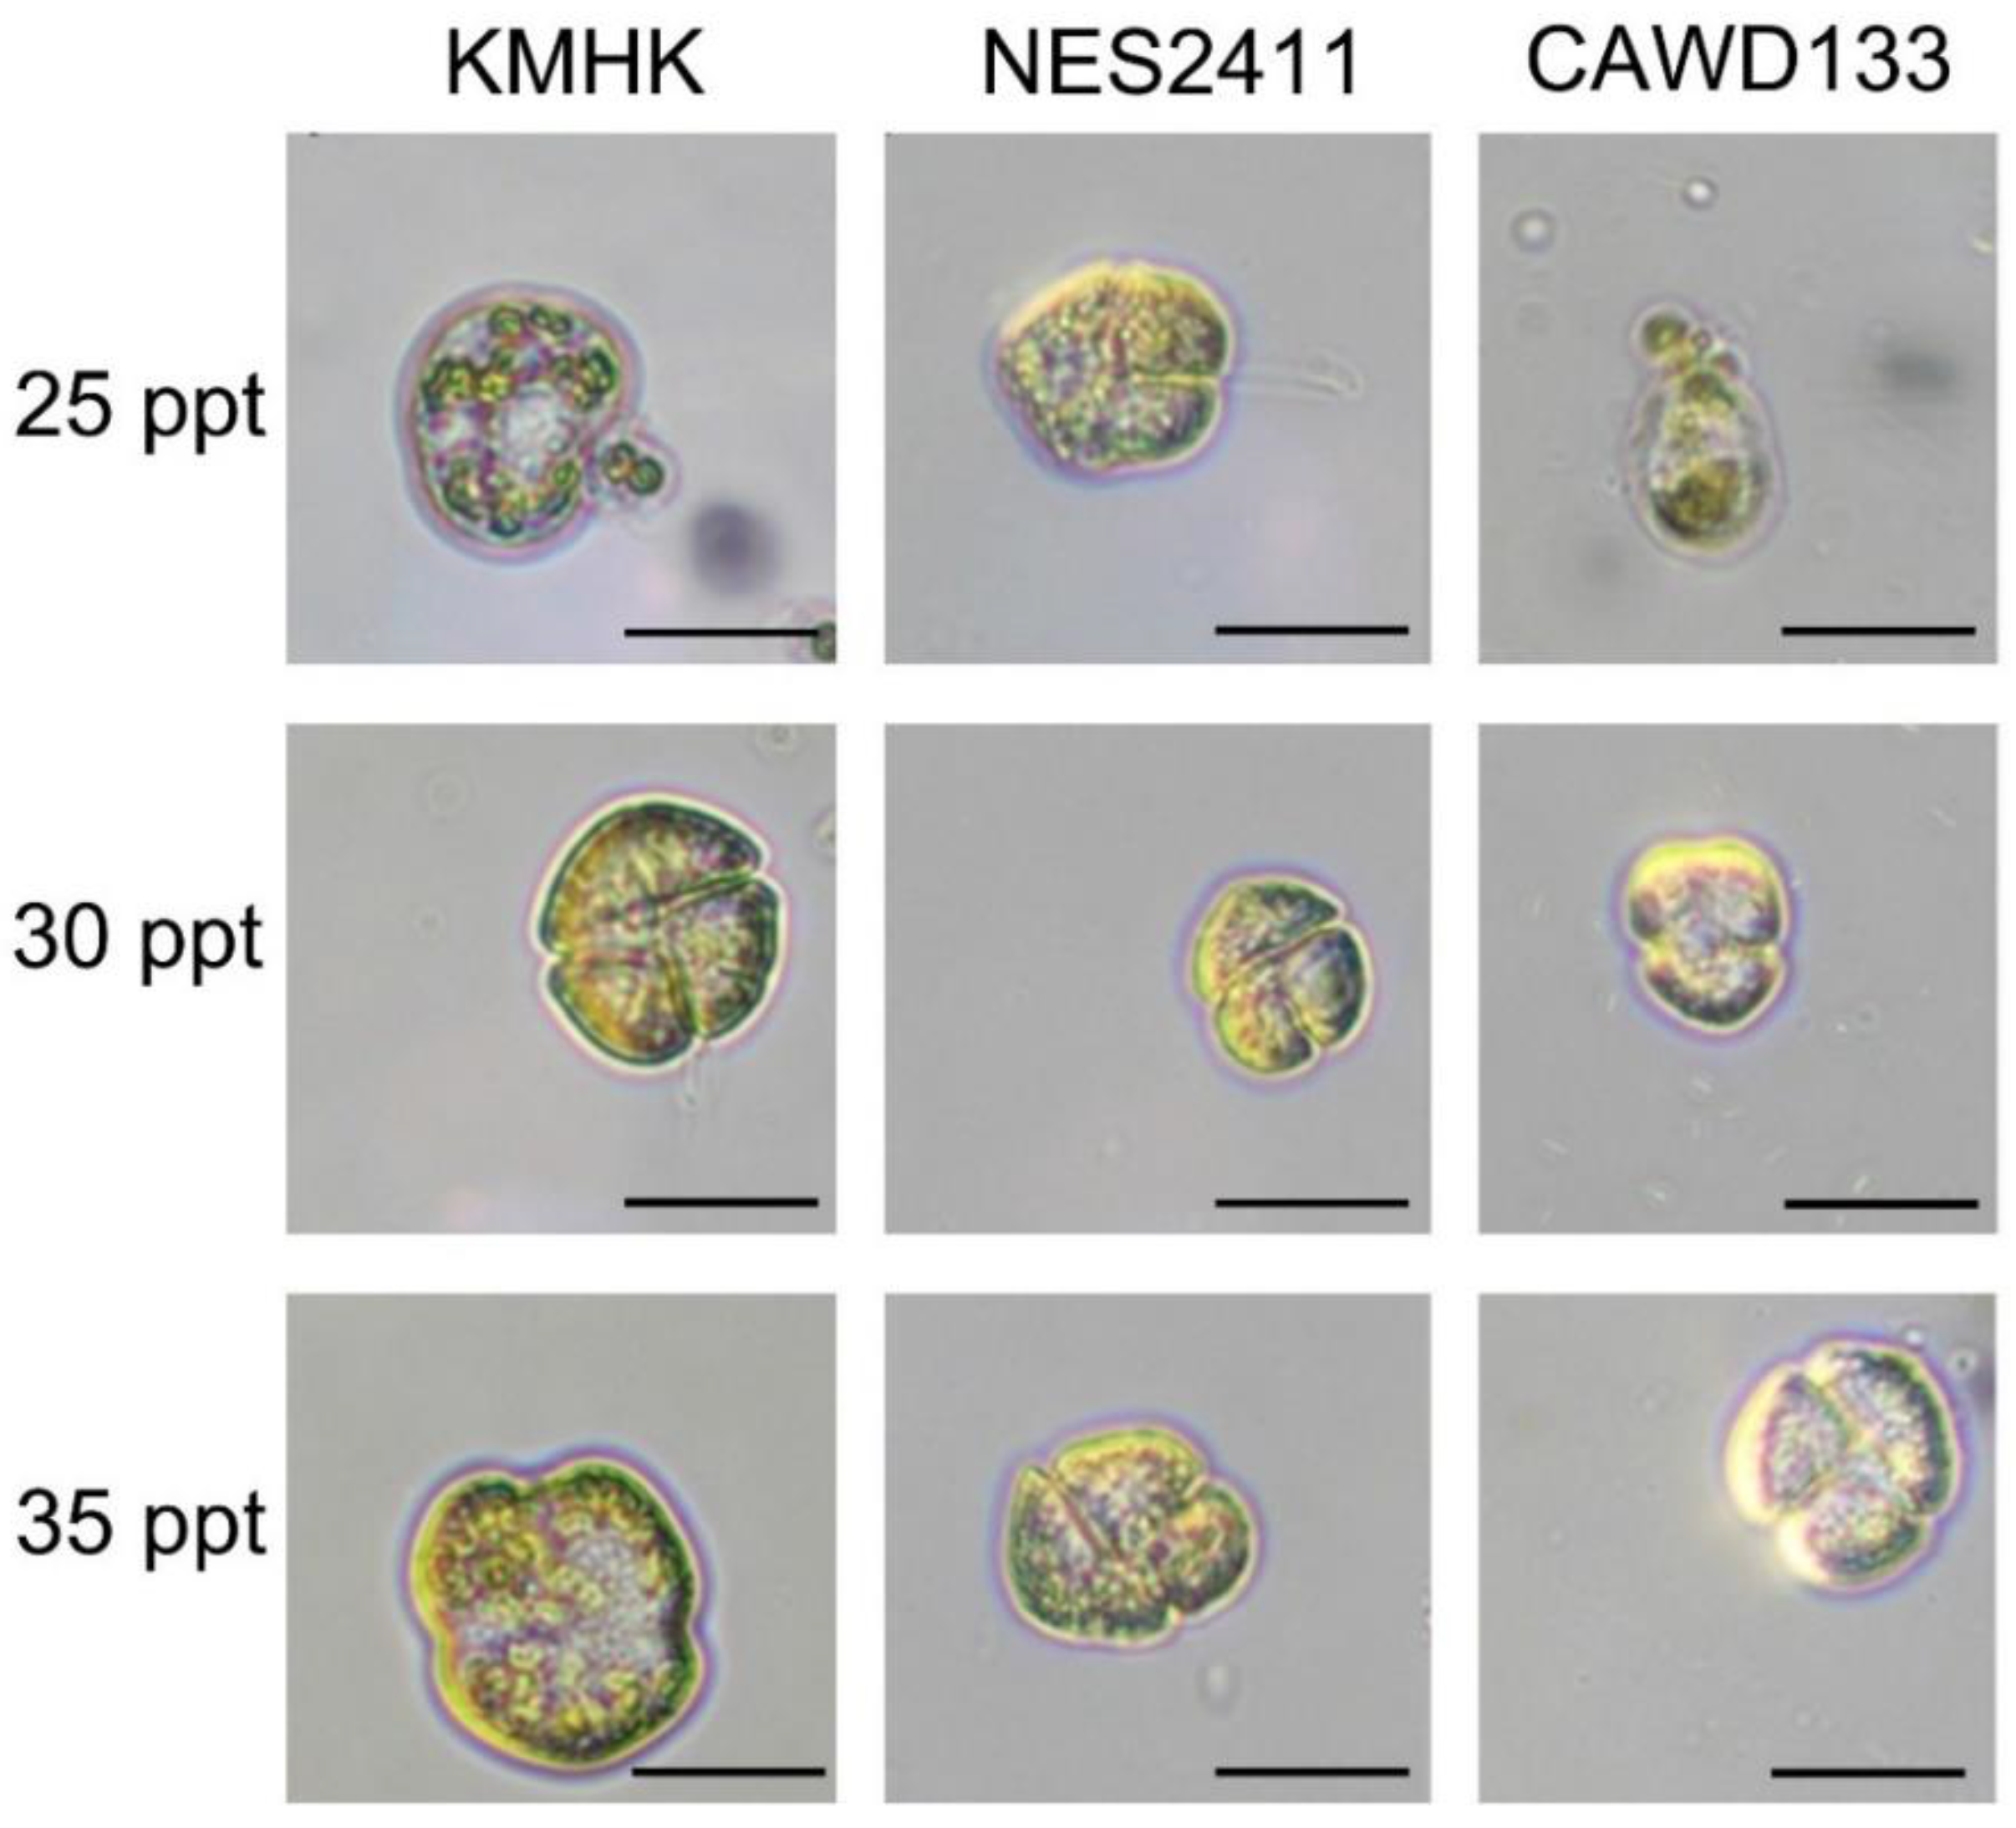
3.4. Effect of Salinity on Cell Size, and Growth of K. Mikimotoi Strains

Cell size of dinoflagellates were reported to be affected by changes in salinity [41,44,45]. For example, the cell size of Protoceratium reticulatum was found to be highest in low salinity and the stationary growth phase [41]. A similar effect was also noticed in a field study of the same species. The size of P. reticulatum cells increased from the more saline parts of the western Baltic Sea to the more diluted parts of the inner regions. This prompted us to examine the cell size (in terms of cell width), and relative mobility of the three K. mikimotoi strains in response to salinity treatments (Figure 5 and Table 2). In general, the cell widths were comparable to other K. mikimotoi strains (15.6 to 31.4 μm) reported in previous studies [46,47]. All three strains maintained their normal cell shape when grown in 30 and 35 ppt salinity treatments. Neither KMHK nor CAWD133 survived under a salinity condition of 25 ppt. They lost their viability, and cell lysis was observed within 3 days after inoculation. In contrast, NIES2411 grew well in 25 ppt salinity and maintained normal cell shape. The average cell width of KMHK, NIES2411 and CAWD133 strains grown in 30 ppt salinity were 23.7 ± 2.0, 22.7 ± 2.3 and 21.9 ± 2.3 μm, respectively, and the cell widths of all three strains in 35 ppt salinity were larger, with respective diameters of 29.0 ± 3.6, 28.0 ± 4.2 and 24.7 ± 3.3 μm (Table 2). Notably, swelling of cells was observed in all three strains when the salinity treatments dropped from 30 to 25 ppt and increased from 30 to 35 ppt. We also observed that the swimming speed of the three strains slowed down when cells were cultivated at the two extreme salinities (i.e., 25 and 35 ppt). The mobility of KMHK and CAWD133 in 25 ppt could not be recorded because of cell lysis. At 35 ppt, CAWD133 became inactive, and its movement was much slower than that of both KMHK and NIES2411. Studies on responses to salinity changes and adaptation mechanisms in dinoflagellates are scarce, but in general, marine algae can be affected by salinity changes in three ways [48]. The first is osmotic stress with a direct impact on water potential in the cells. Second, cellular ionic ratios can change because of the selective ion permeability of the membrane. Lastly, ionic stress can be caused by unavoidable loss or uptake of ions. Salinity can change the osmoregulation of microalgae, including diatoms, dinoflagellates and cyanobacteria. Lower salinity can increase cell size because of the inflow of water by osmoregulation [10,14]. The enhanced osmoregulation is associated with higher energetic costs, leading to decreases in the growth rate and subsequent increases in the accumulation of cellular toxins in Alexandrium ostenfeldii [11]. Reports have indicated that most microalgal species exhibit certain adaptation mechanisms to overcome the ionic imbalance and osmotic stress induced by very low or very high salinities in order to maximize their growth from the suboptimal condition [48,49]. One very common strategy is algal cells increasing their cellular compatible solutes in order to balance the osmotic stress. The algal cells may even sacrifice their growth in order to maintain the osmotic adjustment for survival and cell function. On the other hand, it was suggested that cells with a larger volume possess more storage capacity [50]. This may explain the swelling and decrease in mobility of algal cells in 25 and 35 ppt salinity. The severe movement inactivation of CAWD133 observed in 35 ppt coincided to a relatively lesser extent with cell enlargement. The cell widths of KMHK and NIES2411 increased 22.3 and 23.3%, respectively, when salinity was changed from 30 to 35 ppt, whereas CAWD133 only increased 12.8% in cell width.
According to two-way ANOVA analysis, the algal cell densities of KMHK, NIES2411 and CAWD133 were significantly affected by salinity and growth phase (Figure 6). In our study, salinity at 30 ppt was the optimal growing condition for the three strains, similar to previous findings in a study on Karenia spp. [16]. Therefore, the highest cell densities were recorded at 30 ppt in all three strains and growth phases. In general, similar growing trends were found in the three strains, where a few common phenomena could be observed. First, a bell-shaped growth response was seen in salinities ranging from 25 to 35 ppt at any growth phase. Second, cell densities in the stationary growth phase were higher than those in the log phase and lag phase, with cell densities in the log phase higher than in the lag phase. Third, at any salinity, the cell density of NIES2411 was generally higher than that in other two strains. However, the three strains exhibited different growth responses to the changes in salinity, particularly in the log and stationary phases. When the algal cells were cultured in 25 ppt salinity, cell lysis occurred in KMHK and CAWD133 after 3 days of cultivation. In contrast, no adverse effect was observed in NIES2411. The Japanese strains grew very well in the low salinity condition and achieved high cell density at around 3 × 10⁴ cells mL−1 in the stationary growth phase, which was as high as in the log phase at 30 ppt. These findings indicated that the Japanese strain NIES2411 not only grew fast but also was more tolerant to the changes of salinity than the other two strains. This also suggested that the Japanese strain can survive in the form of vegetative cells in sea areas with very low salinity. As mentioned, salinity could be one of the determining factors of an algal bloom. The ability for rapid adaptation to salinity fluctuations would allow the Japanese strain a higher survival tolerance in the coastal waters, which in turn could be an ecological advantage in outgrowing co-existing species/strains in the same region and predominating in the area. In addition, the broad salinity tolerance might also allow the algal strain to escape predation by migrating to salinity conditions that its predators cannot survive. This would promote its bloom formation and ichthyotoxic events [51]. According to statistical analysis, the algal density of NIES2411 in all salinities increased significantly from lag to stationary phases. However, the algal density of both KMHK and CAWD133 only increased significantly from lag to stationary phases when grown in 28 to 33 ppt salinity. At log phase, no significant difference in cell density between 28 and 30 ppt was observed in both NIES2411 and CAWD133. However, the cell density of KMHK dropped significantly (more than 80%) when salinity changed from 30 to 28 ppt. In addition, the cell density of KMHK decreased significantly in 35 ppt, where the percentage decrease was higher than that of NIES2411 and CAWD133. The greatest differences in cell density between 28 and 33 ppt were also observed in the stationary growth phase of KMHK. On the other hand, either fewer or no significant differences were found in the cell densities of NIES2411 and CAWD133 grown in 28 to 33 ppt in the stationary growth phase. The results indicated that the Hong Kong strain was highly sensitive to the changes in salinity. In addition, the arrested growth observed in low salinity conditions might be attributed to the stress induced by osmotic shock, which could in turn affect the cell cycle. A study reported that a higher population of Prorocentrum minimum entered S phase, and a prolonged G1 phase was observed when the algal cells were stressed by low salinity conditions [52]. This indicated that the algal cells attempted to survive and cope with salinity changes by increasing their DNA replication. Another possible reason was that the efficiency of the photosystem was diminished when the algal cells were cultivated at low salinities [53].
A previous study reported that the optimum salinity for the growth of Karenia spp. was close to the salinities that occur in nature [16]. In another study on Heterocapsa circularisquama, the optimal salinity found in the study matched the salinities observed in its natural environment [17]. The optimum salinity ranges of dinoflagellates varied according to their geographic locations and habitats [54]. The average salinity range of Tolo Harbour in Hong Kong, where KMHK was isolated, was between 30 and 34 ppt [55] and barely below 20 ppt [56]. This may be one of the reasons why blooms of K. mikimotoi frequently occur in Tolo Harbour (Table A1). The salinity data for New Zealand and Japanese seawater were not available, so we were not able to analyze the relationship between salinity and geographic location for the New Zealand strain and Japanese strain. However, we noticed that the salinity tolerance range was more significant in other Karenia spp.; for instance, more frequent Karenia spp. blooms occurred at low salinities in the northwestern Florida Shelf, USA, than in the rest of Florida after a tropical storm. These Karenia species could grow in the minimum salinity of 17.5 to 20 ppt, and the maximum range was between 37.5 and 45 ppt, depending on the strains [16].

3.5. Effect of Salinity on Ichthyotoxicity of K. Mikimotoi Strains

We further examined and compared the effects of salinity changes on the ichthyotoxicity of the three strains under log and stationary growth phases (Figure 7). As shown in Figure 6, cell densities of KMHK and CAWD133 in 25 ppt were too low to allow for toxicity determination, and thus, these cultures were excluded from the following analysis. Similar to the ichthyotoxicity test mentioned above, the gill cell viability after exposure to CAWD133 was significantly higher than after exposure to the other two strains, and a high percentage of viability was maintained (on average ~85%), irrespective of different salinities and growth phases. This finding reiterated that this strain was the least toxic to fish gill cells. The effects of salinity on the ichthyotoxicity of CAWD133 in both log and stationary phases were not significant according to one-way ANOVA. In general, exposure to NIES2411 resulted in the lowest gill cell viabilities, which indicated that this strain is highly toxic to fish gills. The ichthyotoxicity of both KMHK and NIES2411 in the stationary growth phase was much higher than in the log phase. In the log phase, no significant difference in gill cell viabilities was observed after exposure to KMHK at different salinities. In contrast, significant differences were found among gill cell viabilities after exposure to NIES2411 at different salinities. The gill cell viability dropped more than 60% when salinity changed from 30 to 28 ppt. We noticed that higher toxicity in lower salinity conditions was also found in other HAB species. For instance, a dinoflagellate Chilean strain Pseudochattonella verruculosa grown in 35 ppt was found to be less toxic than that in 25 ppt [28]. The result was reversed in other species/strains. For instance, Guerrini et al. demonstrated that the toxicity of Protoceratium reticulatum growing in 16 ppt was around one-third lower than that in 32 ppt [40]. Increased toxicity of Alexandrium species was determined when the cells were grown in higher salinities [57]. As the cytotoxicity of HAB species may interact with salinity, the potential confounding effect of salinity on gill cell viability cannot be ignored, thus more research is needed in future. Interestingly, significant differences in gill cell viabilities among all salinities were observed in both KMHK and NIES2411 when the algal cells were at the stationary growth phase. This indicated that both KMHK and NIES2411 exhibited a higher response to the changes in salinity when they were at stationary growth phase. Both strains became more toxic when the salinity was higher or lower than 30 ppt (i.e., the optimal condition). Previous findings also revealed that salinities deviating from the optimum resulted in lower cell density, but higher toxin quotas were measured in Alexandrium ostenfeldii and Pseudochattonella verruculosa [10,28]. Our results suggested that the effect of salinity on the ichthyotoxicity of K. mikimotoi was strain- and growth-phase-dependent.

4. Conclusions

This is the first study to formally confirm the taxonomic identification of a Hong Kong Karenia mikimotoi strain using a phylogenetic approach and document its in vitro cell growth and ichthyotoxicity. We evaluated and compared how the growth and ichthyotoxicity of three K. mikimotoi strains were affected by changes in salinity. Our data suggested that the growth of the three strains was significantly affected by the changes in salinity. All strains achieved the highest cell density when they were grown in 30 ppt. Cell densities were greatly diminished when salinity was lower or higher than 30 ppt, and the largest reduction in cell densities was observed in the Hong Kong strain. This indicated that the growth of the Hong Kong strain was highly sensitive to the salinity changes. Only the Japanese strain could survive at 25 ppt, whereas cell lysis occurred in the other two strains. This would allow the Japanese strain to remain more competitive in coastal regions with critical salinity conditions and enable it to outcompete other species/strains in the same region. The ichthyotoxicity of the three strains was diverse and behaved very differently under salinity changes. The viability of gill cells exposed to the New Zealand strain remained at high percentages regardless of the changes in salinity and growth phase. The toxicities of both the Hong Kong and Japanese strains were found to be greatest at lower salinity, and they became even more toxic when at the stationary growth phase. However, study with more strains from Hong Kong, Japan and New Zealand is required to confirm the geographic effects. With the effects of global warming, changes in salinity are expected to be observed in different coastal areas, which will impact the growth and ichthyotoxicity of K. mikimotoi and, in turn, affect the occurrence of algal blooms. Certainly, the mechanism of K. mikimotoi’s response to the salinity changes is not yet fully understood and more research is required in future.

Author Contributions

Conceptualization, F.W.-F.L.; methodology, W.L., E.M.-S.C. and. C.S.-N.K.; software, W.L. and K.K.-Y.L.; validation, W.L., N.F.-Y.T. and S.J.X.; experiments, W.L., E.M.-S.C. and T.C.-H.L.; resources, F.W.-F.L.; data curation, W.L.; writing—original draft preparation, W.L.; writing—review and editing, W.L., N.F.-Y.T., S.J.X. and F.W.-F.L.; supervision, F.W.-F.L.; project administration, F.W.-F.L.; funding acquisition, F.W.-F.L. All authors have read and agreed to the published version of the manuscript.

Funding

This work described in this paper was supported by grants from the Research Grants Council of the Hong Kong Special Administrative Region, China (UGC/FDS16/M06/20) and (UGC/IDS(R)16/19).

Institutional Review Board Statement

Not applicable.

Informed Consent Statement

Not applicable.

Conflicts of Interest

The authors declare no conflict of interest.

Appendix

Figure A1. Occurrences and locations of Karenia mikimotoi blooms in Hong Kong waters between 1980 and 2016 (AFCD, 2021). The star (★) indicates the sampling location, Yim Tin Tsai Fish Culture Zone.
Jmse 10 01236 g0a1
Table A1. Summary of growth rates and maximum cell densities of K. mikimotoi obtained in the present study and previously reported. NM: not measured by EPD database.
Starting Date Estimated Area (10−3 km2)Estimated Cell Density (103 Cells mL−1)Salinity(ppt)
One Month Before
Algal Blooming
The Month with Algal Blooming
Surface LayerMiddle LayerSurface LayerMiddle Layer
December 201515.11–1031.53229.2–30.130–30.8
October 201012.11–1029.630.926.929.9
June 20031.110–5032.332.528.128.6
July 20010.011–1032.132.326.4–28.730.7–31.9
March 19970.310–50NM
August 19880.121–1033.534.329.631
December 19860.3<1NMNMNMNM
October 19860.31–10NMNMNMNM
October 19830.3>50NMNMNMNM
February 19810.01210–50NMNMNMNM
September 19800.310–50NMNMNMNM
Table A2. Corresponding days for algal cells harvesting of each strain at different growth phases.
Growth PhaseKMHKNIES2411CAWD133
Lag474
Log9149
Stationary132113
Table A3. LSU, ITS1-5.8S-ITS2 and rbcL DNA sequence data of Karenia mikimotoi species used in the phylogenetic study. The nucleotide difference was based on Hong Kong strain KMHK.
GroupGeographic OriginGenBank
Accession Number
I.D. CodeReferences
1Hong Kong, ChinaKKMHKN/AThe present study
ChinaKT733616KM IV[58]
JapanU92247CAWD05[46]
JapanHM807312MBA561[24]
2New ZealandU92249CAWD63[46]
New ZealandHM807326CAWD117[24]
New ZealandHM807327CAWD133[24]
New ZealandHM807328CAWD134[24]
3Not reportedHM807333CCMP430[24]
UKHM807318CCMP429[24]
UKHM807317MBA705[24]
Table A4. Primers for LSU, ITS1-5.8S-ITS2 and rbcL DNA region.
LociForward and Reverse PrimerPrimer Sequence (5′–3′)Annealing Temperature (°C)Amplicon Size (bp)References
LSUD1R-FACCCGCTGAATTTAAGCATA60760[21]
D2C-RCCTTGGTCCGTGTTTCAAGA
ITSITSA-FCCGGATCCAAGCTTTCGTAACAAGGHTCCGTAGGT56700[22]
ITSB-RCCGGATCCGTCGACAKATGCTTAARTTCAGCRGG
rbcLrbcL 640-FATGATGAAAA(CT)ATTAATTCTCAACC56619[24]
rbcL 1240-R TG(AT)CC(AG)AT(AGT)GTACCACCACC

References

  1. Hallegraeff, G.M. Harmful Algal Blooms: A Global Overview; Unesco Publishing: Paris, France, 2003. [Google Scholar]
  2. Sha, J.; Xiong, H.; Li, C.; Lu, Z.; Zhang, J.; Zhong, H.; Zhang, W.; Yan, B. Harmful algal blooms and their eco-environmental indication. Chemosphere 2021, 274, 129912. [Google Scholar] [CrossRef] [PubMed]
  3. Li, X.; Yan, T.; Yu, R.; Zhou, M. A review of Karenia mikimotoi: Bloom events, physiology, toxicity and toxic mechanism. Harmful Algae 2019, 90, 101702. [Google Scholar] [CrossRef] [PubMed]
  4. Heil, C.A.; Glibert, P.M.; Al-Sarawi, M.A.; Faraj, M.; Behbehani, M.; Husain, M. First record of a fish-killing Gymnodinium sp. bloom in Kuwait Bay, Arabian Sea: Chronology and potential causes. Mar. Ecol. Prog. Ser. 2001, 214, 15–23. [Google Scholar] [CrossRef]
  5. Honjo, T. Karenia (formarly Gymnodinium) mikimotoi. In Red Tides; Okaichi, T., Ed.; Terra Scientific Publishing Company: Tokyo, Japan, 2004; pp. 345–356. [Google Scholar]
  6. Lin, J.N.; Yan, T.; Zhang, Q.C.; Wang, Y.F.; Liu, Q.; Zhou, M.J. The detrimental impacts of Karenia mikimotoi blooms on the abalone haliotis discus hannai in fujian province. Mar. Environ. Sci. 2016, 35, 27–34. [Google Scholar]
  7. Li, X.; Yan, T.; Lin, J.; Yu, R.; Zhou, M. Detrimental impacts of the dinoflagellate Karenia mikimotoi in Fujian coastal waters on typical marine organisms. Harmful Algae 2017, 61, 1–12. [Google Scholar] [CrossRef]
  8. Kwok, C.S.N.; Wan, W.W.; Chan, K.K.K.; Xu, S.J.L.; Lee, F.W.F.; Ho, K.C. Karenia mikimotoi, a rare species in Hong Kong waters, associated with a recent massive fish kill. Harmful Algae News 2016, 53, 4–5. [Google Scholar]
  9. AFCD. Hong Kong Red Tide Database. Available online: https://www.afcd.gov.hk/tc_chi/fisheries/hkredtide/database/database.html (accessed on 1 January 2021).
  10. Martens, H.; Van de Waal, D.B.; Brandenburg, K.M.; Krock, B.; Tillmann, U. Salinity effects on growth and toxin production in an Alexandrium ostenfeldii (Dinophyceae) isolate from The Netherlands. J. Plankton Res. 2016, 38, 1302–1316. [Google Scholar] [CrossRef]
  11. Gomes, M.P.; Juneau, P. Temperature and light modulation of herbicide toxicity on algal and cyanobacterial physiology. Front. Environ. Sci. 2017, 5, 50. [Google Scholar] [CrossRef]
  12. Hamasaki, K.; Horie, M.; Tokimitsu, S.; Toda, T.; Taguchi, S. Variability in toxicity of the dinoflagellate Alexandrium Tamarense isolated from Hiroshima Bay, western Japan, as a reflection of changing environmental conditions. J. Plankton Res. 2001, 23, 271–278. [Google Scholar] [CrossRef]
  13. Band-Schmidt, C.J.; Morquecho, L.; Lechuga-Devéze, C.H.; Anderson, D.M. Effects of growth medium, temperature, salinity and seawater source on the growth of Gymnodinium catenatum (Dinophyceae) from Bahía Concepción, Gulf of California, Mexico. J. Plankton Res. 2004, 26, 1459–1470. [Google Scholar] [CrossRef]
  14. Silveira, S.B.; Odebrecht, C. Effects of salinity and temperature on the growth, toxin production, and akinete germination of the cyanobacterium. Nodularia spumigena. Front. Environ. Sci. 2019, 6, 339. [Google Scholar] [CrossRef]
  15. Grzebyk, D.; Béchemin, C.; Ward, C.J.; Vérité, C.; Codd, G.A.; Maestrini, S.Y. Effects of salinity and two coastal waters on the growth and toxin content of the dinoflagellate Alexandrium minutum. J. Plankton Res. 2003, 25, 1185–1199. [Google Scholar] [CrossRef]
  16. Maier Brown, A.F.; Dortch, Q.; Dolah, F.M.V.; Leighfield, T.A.; Morrison, W.; Thessen, A.E.; Steidinger, K.; Richardson, B.; Moncreiff, C.A.; Pennock, J.R. Effect of salinity on the distribution, growth, and toxicity of Karenia spp. Harmful Algae 2006, 5, 199–212. [Google Scholar] [CrossRef]
  17. Leong, S.C.Y.; Nakazawa, M.; Taguchi, S. Physiological and optical responses of the harmful dinoflagellate Heterocapsa circularisquama to a range of salinity. Hydrobiologia 2006, 559, 149–159. [Google Scholar] [CrossRef]
  18. Bearon, R.; Grünbaum, D.; Cattolico, R.A. Effects of salinity structure on swimming behavior and harmful algal bloom formation in Heterosigma akashiwo, a toxic raphidophyte. Mar. Ecol. Prog. Ser. 2006, 306, 153–163. [Google Scholar] [CrossRef]
  19. Sandoval-Sanhueza, A.; Aguilera-Belmonte, A.; Basti, L.; Figueroa, R.I.; Molinet, C.; Álvarez, G.; Oyanedel, S.; Riobó, P.; Mancilla-Gutiérrez, G.; Díaz, P.A. Interactive effects of temperature and salinity on the growth and cytotoxicity of the fish-killing microalgal species Heterosigma akashiwo and Pseudochattonella verruculosa. Mar. Pollut. Bull. 2022, 174, 113234. [Google Scholar] [CrossRef]
  20. Lee, F.W.F.; Lo, S.C.L. Proteomic study of micro algae: Sample preparation for two dimensional gel electrophoresis and de novo peptide sequencing Using MALDI-TOF MS. Curr. Proteom. 2007, 4, 67–78. [Google Scholar] [CrossRef]
  21. Lenaers, G.; Maroteaux, L.; Michot, B.; Herzog, M. Dinoflagellates in evolution. A molecular phylogenetic analysis of large subunit ribosomal RNA. J. Mol. Evol. 1989, 29, 40–51. [Google Scholar] [CrossRef]
  22. Ho, K.C.; Lee, T.C.H.; Kwok, O.T.; Lee, F.W.F. Phylogenetic analysis on a strain of Alexandrium tamarense collected from Antarctic Ocean. Harmful Algae 2012, 15, 100–108. [Google Scholar] [CrossRef]
  23. Yoon, H.S.; Hackett, J.D.; Bhattacharya, D. A single origin of the peridinin- and fucoxanthin-containing plastids in dinoflagellates through tertiary endosymbiosis. Proc. Natl. Acad. Sci. USA 2002, 99, 11724–11729. [Google Scholar] [CrossRef]
  24. Al-Kandari, M.A.; Highfield, A.C.; Hall, M.J.; Hayes, P.; Schroeder, D.C. Molecular tools separate harmful algal bloom species, Karenia mikimotoi, from different geographical regions into distinct sub-groups. Harmful Algae 2011, 10, 636–643. [Google Scholar] [CrossRef]
  25. Saitou, N.; Nei, M. The neighbor-joining method: A new method for reconstructing phylogenetic trees. Mol. Biol. Evol. 1987, 4, 406–425. [Google Scholar] [CrossRef]
  26. Felsenstein, J. Confidence limits on phylogenies: An approach using the bootstrap. Evolution 1985, 39, 783–791. [Google Scholar] [CrossRef]
  27. Dayeh, V.R.; Schirmer, K.; Bols, N.C. Applying whole-water samples directly to fish cell cultures in order to evaluate the toxicity of industrial effluent. Water Res. 2002, 36, 3727–3738. [Google Scholar] [CrossRef]
  28. Mardones, J.I.; Fuenzalida, G.; Zenteno, K.; Alves-de-Souza, C.; Astuya, A.; Dorantes-Aranda, J.J. Salinity-growth response and ichthyotoxic potency of the Chilean Pseudochattonella verruculosa. Front. Mar. Sci. 2019, 6, 24. [Google Scholar] [CrossRef]
  29. Schirmer, K.; Chan, A.G.J.; Greenberg, B.M.; Dixon, D.G.; Bols, N.C. Methodology for demonstrating and measuring the hotocytotoxicity of fluoranthene to fish cells in culture. Toxicol. Vitr. 1997, 11, 107–113. [Google Scholar]
  30. Marshall, J.A.; Nichols, P.D.; Hamilton, B.; Lewis, R.J.; Hallegraeff, G.M. Ichthyotoxicity of Chattonella marina (Raphidophyceae) to damselfish (Acanthochromis polycanthus): The synergistic role of reactive oxygen species and free fatty acid. Harmful Algae 2003, 2, 273–281. [Google Scholar] [CrossRef]
  31. Kim, D.; Li, W.; Matsuyama, Y.; Matsuo, A.; Yagi, M.; Cho, K.; Yamasaki, Y.; Takeshita, S.; Yamaguchi, K.; Oda, T. Strain-dependent lethal effects on abalone and haemolytic activities of the dinoflagellate Karenia mikimotoi. Aquaculture 2020, 520, 734953. [Google Scholar] [CrossRef]
  32. Guan, W.; Li, P. Dependency of UVR-induced photoinhibition on atomic ratio of N to P in the dinoflagellate Karenia mikimotoi. Mar. Biol. 2017, 164, 1–9. [Google Scholar] [CrossRef]
  33. Shen, A.; Ma, Z.L.; Jiang, K.J.; Li, D.J. Effects of temperature on growth, photophysiology, Rubisco gene expression in Prorocentrum donghaiense and Karenia mikimotoi. Ocean Sci. J. 2016, 51, 581–589. [Google Scholar] [CrossRef]
  34. Stæhr, P.A.; Cullen, J.J. Detection of Karenia mikimotoi by spectral absorption signatures. J. Plankton Res. 2003, 25, 1237–1249. [Google Scholar] [CrossRef]
  35. Dorantes-Aranda, J.J.; Waite, T.D.; Godrant, A.; Rose, A.L.; Tovar, C.D.; Woods, G.M.; Hallegraeff, G.M. Novel application of a fish gill cell line assay to assess ichthyotoxicity of harmful marine microalgae. Harmful Algae 2011, 10, 366–373. [Google Scholar] [CrossRef]
  36. Grossmann, J. Molecular mechanisms of “detachment-induced apoptosis—Anoikis”. Apoptosis 2002, 7, 247–260. [Google Scholar] [CrossRef]
  37. Dorantes-Aranda, J.J.; Seger, A.; Mardones, J.I.; Nichols, P.D.; Hallegraeff, G.M. Progress in understanding algal bloom-mediated fish kills: The role of superoxide radicals, phycotoxins and fatty acids. PLoS ONE 2015, 10, e0133549. [Google Scholar] [CrossRef] [PubMed]
  38. Parker, N.S.; Negri, A.P.; Frampton, D.M.F.; Rodolfi, L.; Tredici, M.R.; Blackburn, S.I. Growth of the toxic dinoflagellate Alexandrium minutum (Dinophyceae) using high biomass culture systems. J. Appl. Phycol. 2002, 14, 313–324. [Google Scholar] [CrossRef]
  39. Lee, T.C.H.; Chan, P.L.; Xu, S.J.L.; Lee, F.W.F. Comparison of the growth and toxicity responses between a non toxic and a toxic strain of Prorocentrum hoffmannianum. Aquat. Biol. 2020, 29, 59–70. [Google Scholar] [CrossRef]
  40. Guerrini, F.; Ciminiello, P.; Dell’Aversano, C.; Tartaglione, L.; Fattorusso, E.; Boni, L.; Pistocchi, R. Influence of temperature, salinity and nutrient limitation on yessotoxin production and release by the dinoflagellate Protoceratium reticulatum in batch-cultures. Harmful Algae 2007, 6, 707–717. [Google Scholar] [CrossRef]
  41. Röder, K.; Hantzsche, F.M.; Gebühr, C.; Miene, C.; Helbig, T.; Krock, B.; Hoppenrath, M.; Luckas, B.; Gerdts, G. Effects of salinity, temperature and nutrients on growth, cellular characteristics and yessotoxin production of Protoceratium reticulatum. Harmful Algae 2012, 15, 59–70. [Google Scholar] [CrossRef]
  42. Sala-Pérez, M.; Alpermann, T.J.; Krock, B.; Tillmann, U. Growth and bioactive secondary metabolites of arctic Protoceratium reticulatum (Dinophyceae). Harmful Algae 2016, 55, 85–96. [Google Scholar] [CrossRef]
  43. Peter, C.; Krock, B.; Cembella, A. Effects of salinity variation on growth and yessotoxin composition in the marine dinoflagellate Lingulodinium polyedra from a Skagerrak fjord system (western Sweden). Harmful Algae 2018, 78, 9–17. [Google Scholar] [CrossRef]
  44. ØStergaard Jensen, M.; Moestrup, Ø. Autecology of the toxic dinoflagellate Alexandrium ostenfeldii: Life history and growth at different temperatures and salinities. Eur. J. Phycol. 1997, 32, 9–18. [Google Scholar] [CrossRef]
  45. Laabir, M.; Jauzein, C.; Genovesi, B.; Masseret, E.; Grzebyk, D.; Cecchi, P.; Vaquer, A.; Perrin, Y.; Collos, Y. Influence of temperature, salinity and irradiance on the growth and cell yield of the harmful red tide dinoflagellate Alexandrium catenella colonizing Mediterranean waters. J. Plankton Res. 2011, 33, 1550–1563. [Google Scholar] [CrossRef]
  46. Haywood, A.J.; Steidinger, K.A.; Truby, E.W.; Bergquist, P.R.; Bergquist, P.L.; Adamson, J.; Mackenzie, L. Comparative morphology and molecular phylogenetic analysis of three new species of the genus Karenia (dinophyceae) from new zealand. J. Phycol. 2004, 40, 165–179. [Google Scholar] [CrossRef]
  47. Zhao, T.; Tan, L.; Huang, W.; Wang, J. The interactions between micro polyvinyl chloride (mPVC) and marine dinoflagellate Karenia mikimotoi: The inhibition of growth, chlorophyll and photosynthetic efficiency. Environ. Pollut. 2019, 247, 883–889. [Google Scholar] [CrossRef]
  48. Kirst, G.O. Salinity tolerance of eukaryotic marine algae. Annu. Rev. Plant Physiol. 1990, 41, 21–53. [Google Scholar] [CrossRef]
  49. Shetty, P.; Gitau, M.M.; Maróti, G. Salinity stress responses and adaptation mechanisms in eukaryotic green microalgae. Cells 2019, 8, 1657. [Google Scholar] [CrossRef]
  50. Marañón, E.; Cermeño, P.; López-Sandoval, D.C.; Rodríguez-Ramos, T.; Sobrino, C.; Huete-Ortega, M.; Blanco, J.M.; Rodríguez, J. Unimodal size scaling of phytoplankton growth and the size dependence of nutrient uptake and use. Ecol. Lett. 2013, 16, 371–379. [Google Scholar] [CrossRef]
  51. Strom, S.L.; Harvey, E.L.; Fredrickson, K.A.; Menden-Deuer, S. Broad salinity tolerance as a refuge from predation in the harmful raphidophyte alga Heterosigma akashiwo (Raphidophyceae). J. Phycol. 2013, 49, 20–31. [Google Scholar] [CrossRef]
  52. Skarlato, S.; Filatova, N.; Knyazev, N.; Berdieva, M.; Telesh, I. Salinity stress response of the invasive dinoflagellate Prorocentrum minimum. Estuar. Coast. Shelf Sci. 2018, 211, 199–207. [Google Scholar] [CrossRef]
  53. Gilmour, D.J.; Hipkins, M.L.F.; Boney, A.D. The effect of decreasing the external salinity on the primary processes of photosynthesis in Dunaliella tertiolecta. J. Exp. Bot. 1984, 35, 28–35. [Google Scholar] [CrossRef]
  54. Salgado, P.; Riobó, P.; Rodríguez, F.; Franco, J.M.; Bravo, I. Differences in the toxin profiles of Alexandrium ostenfeldii (Dinophyceae) strains isolated from different geographic origins: Evidence of paralytic toxin, spirolide, and gymnodimine. Toxicon 2015, 103, 85–98. [Google Scholar] [CrossRef] [PubMed]
  55. Lee, J.H.W.; Arega, F. Eutrophication Dynamics of Tolo Harbour, Hong Kong. Mar. Pollut. Bull. 1999, 39, 187–192. [Google Scholar] [CrossRef]
  56. EPD. Marine Water Quality Data. Available online: https://cd.epic.epd.gov.hk/EPICRIVER/marine/?lang=en (accessed on 1 January 2021).
  57. Parkhill, J.P.; Cembella, A. Effects of salinity, light and inorganic nitrogen on growth and toxigenity of the marine dinoflagellate Alexandrium tamarense from northeastern Canada. J. Plankton Res. 1999, 21, 5. [Google Scholar] [CrossRef]
  58. Zhang, Q. Phylogenetic Analysis and Pigment Features of the Causative Species of the Dinoflagellate Bloom in Fujian in 2012; Key Laboratory of Marine Ecology and Environmental Sciences, Institute of Oceanology, Chinese Academy of Sciences: Qingdao, China, 2015. [Google Scholar]
Figure 1. The phylogenetic inference tree based on a distance matrix algorithm between the concatenated sequences from LSU rDNA, ITS1-5.8S-ITS2 and rbcL (Neighbor, in PHYLIP version 3.69). Numbers at nodes (corresponding to LSU rDNA/ITS1-5.8S-ITS2/rbcL respectively) indicate % based on bootstrap values retrieved from 1000 replicates for the neighbor-joining analyses. Scale bars indicate substitutions per site. Karenia selliformis (CAWD79) and Karenia bidigitata (CAWD92 and CAWD81) were used as outgroups to root the phylogenetic tree. The Hong Kong strain K. mikimotoi (KMHK) is bolded. The accession number for LSU rDNA, ITS1-5.8S-ITS2 and rbcL of KMHK is ON898609, ON898610 and ON937622, respectively.
Jmse 10 01236 g001
Figure 2. Growth curves of the three K. mikimotoi strains (KMHK, NIES2411 and CAWD133) growing in L1 medium and 30 ppt salinity for 21 days. Data points represent mean ± standard error of the mean (SEM) cell densities of three replicate cultures. Different small letters indicate significant difference between the cell densities of the three K. mikimotoi strains at day 21.
Jmse 10 01236 g002
Figure 3. Ichthyotoxicity of three K. mikimotoi strains at log phase (initial algal density of 4 × 10⁴ cells mL−1) at 30 ppt salinity. Viability of gill cells (%) = (reading of sample—reading of blank cell) * 100/(reading of solvent control—reading of blank cell). The initial algal cell density of K. mikimotoi was 4 × 10⁴ cells mL−1. Non-toxic algal species Dunaliella tertiolecta (STK-2) was used as control and no mortality of the gill cells was observed within the 120 min exposure. Each data point represents the mean ± standard error of mean (SEM) of three true replicates. Different small letters indicate a significant difference between the viability of gill cell of the three K. mikimotoi strains at 120 min exposure.
Jmse 10 01236 g003
Figure 4. Ichthyotoxicity of three K. mikimotoi strains at different initial algal densities (5 to 40 × 103 cells mL1) and various growth phases (lag, log and stationary phase) in 30 ppt salinity to RTgill W1 gill cells, based on their metabolic activity at 30 min of exposure. For the growth phase experiment, the initial algal cell density of K. mikimotoi was 4 × 10⁴ cells mL1 and the corresponding days for harvesting the algal cells of each strain at different growth phases were listed in Table A2. Non-toxic algal species Dunaliella tertiolecta (STK2) was used as control and no mortality of the gill cells was observed within the 120 min exposure. The capital and small letters indicate statistical results showing significant differences between comparisons. Capital letters indicate significant differences between cell densities or growth phases in the same algal strain, while small letters represent significant differences between three strains of K. mikimotoi at the same cell density or growth phase. Each bar represents the mean ± standard error of mean (SEM) of three true replicates. A 100% gill cell viability was observed in the control experiments with gill cell line exposed to 30 ppt L1 algal medium without any algal cells (data not shown).
Jmse 10 01236 g004
Figure 5. Microscopic images of three K. mikimotoi strains (left column: Hong Kong strain KMHK; middle column: Japanese strain NIES2411, and right column: New Zealand strain CAWD133) growing at log phase and three different salinities (25, 30 and 35 ppt). Cell lysis was observed in KMHK and CAWD133 growing in 25 ppt before the cells entered log phase. Corresponding diagrams were created before cell lysis occurred (i.e., day 3). Scale bar represents a width of 25 μm.
Jmse 10 01236 g005
Figure 6. Growth of the three K. mikimotoi strains (KMHK, NIES2411 and CAWD133) in different salinities (25 to 35 ppt) and growth phases (lag, log and stationary phase). The initial algal cell density of K. mikimotoi was 4 × 10⁴ cells mL−1 and the corresponding days for harvesting the algal cells of each strain at different growth phases were listed in Table A2. Non-toxic algal species Dunaliella tertiolecta (STK2) was used as control and no mortality of the gill cells was observed within the 120 min exposure. Small letters indicate a significant difference in cell density at different salinities within a growth phase. Each bar represents the mean ± standard error of mean (SEM) of three true replicates. ND: not detected.
Jmse 10 01236 g006
Figure 7. Ichthyotoxicity of three K. mikimotoi strains (KMHK, NIES2411 and CAWD133) grown in different salinities (28 to 35 ppt) under log phase (left) and stationary phase (right). The initial algal cell density of K. mikimotoi was 4 × 10⁴ cells mL−1 and the corresponding days for harvesting the algal cells of each strain at different growth phases were listed in Table A2. Small letters (a, b and c) indicate a significant difference in viability of gill cell at different salinities within a strain of K. mikimotoi. Non-toxic algal species Dunaliella tertiolecta (STK-2) was used as control and no mortality of the gill cells was observed within the 120 min exposure. Each bar represents the mean ± standard error of mean (SEM) of three true replicates. Small letters indicate a significant difference in salinities within a strain of K. mikimotoi.
Jmse 10 01236 g007
Table 1. Summary of specific growth rates and maximum cell densities of K. mikimotoi strains of different geographical origin.
Assess CodeGeographic LocationsDuration of Lag, Log Phase in DaysSpecific Growth Rates, in Day-1Maximum Cell Density,
104 Cells mL−1
Salinity (ppt)References
KMHKHong Kong, China4, 90.169 2.5330This study
CAWD133New Zealand4, 30.2713.2530This study
NIES2411Japan4, 120.1897.6930This study
NIES2411Japan6, 140.14611.625[31]
NGU04Japan10, 100.19010.025[31]
SUO-1Japan4, 140.12618.625[31]
--China--0.257--34[32]
ECSFRI081109China--0.336----[33]
K-0260Norway--0.150----[34]
Table 2. Variations in cell width and mobility of the three K. mikimotoi strains (KMHK, NIES2411 and CAWD133) growing in different salinities. The mean ± standard error of mean (SEM) of 30 replicates are shown. Small letters represent significant differences of cell width of a K. mikimotoi strain at different salinities. The number of stars indicate relative mobility (*, **, ***). ND: not determined due to lysis of algal cells.
Salinity (ppt)Cell Width (μm)Relative Mobility
KMHKNIES2411CAWD133KMHKNIES2411CAWD133
25ND28.3 ± 4.0 bNDND**ND
2826.5 ± 3.3 b23.2 ± 2.6 a24.7 ± 4.1 b*********
3023.7 ± 2.0 a22.7 ± 2.3 a21.9 ± 2.3 a*********
3326.9 ± 2.1 b23.8 ± 2.8 a24.4 ± 2.2 b*********
3529.0 ± 3.6 c28.0 ± 4.2 b24.7 ± 3.3 b*****
Publisher’s Note: MDPI stays neutral with regard to jurisdictional claims in published maps and institutional affiliations.

