Article

Similarity Calculation of Sudden Natural Disaster Cases with Fused Case Hierarchy—Taking Storm Surge Disasters as Examples

College of Computer Science and Engineering, Shandong University of Science and Technology, Qingdao 266590, China
*
Authors to whom correspondence should be addressed.
J. Mar. Sci. Eng. 2022, 10(9), 1218; https://doi.org/10.3390/jmse10091218
Submission received: 25 July 2022 / Revised: 25 August 2022 / Accepted: 26 August 2022 / Published: 31 August 2022
(This article belongs to the Section Marine Hazards)

Abstract

:
Sudden natural disasters have the characteristics of complexity, unpredictability and frequency. To better manage and analyze sudden natural disasters promptly with the help of historical natural disaster cases, this study adopts the method of fused case structure to calculate the similarity between sudden disaster cases. Based on the disaster information of historical natural disaster cases, this paper aims to perform similarity measures for sudden natural disaster cases that contain textual information, data information and geographic location information at the same time. Taking storm surge disasters as examples, we designed a hierarchical case structure of “vertex-edge-label” based on the characteristics of sudden natural disaster cases. Then, we calculated the case similarity based on three aspects of sudden natural disasters, which were “case scenario”, “disaster damage” and “case structure”. Finally, we aggregated multiple factors to obtain the similarity between storm surge cases and conducted experiments on the historical storm surge cases in China. The result verified the feasibility and effectiveness of the method and showed a higher accuracy of the established aggregated multifactor method compared with the benchmark method.

1. Introduction

With rising temperatures, global extreme weather events have increased, causing an upsurge in natural disasters worldwide. Natural disaster outbreaks are generally complex, unpredictable and frequent and have a serious impact on social and economic development [1,2,3]. One of the most serious marine natural disasters in the world is a storm surge disaster, which causes serious damage to the sea, nearshore and inland [4,5,6]. Storm surge disasters are transient, high-risk, complex and frequent, resulting in serious damage in a short time [7,8,9]. After the occurrence of sudden natural disasters, people need to respond promptly for an immediate analysis and handling, by comparing with historical natural disaster information. Furthermore, they need to make a qualitative damage determination in real time based on the actual situation of sudden natural disasters, so as to facilitate the subsequent adjustment and decision-making for effective rescue measures [10,11].
An important empirical resource for natural disaster emergency managers is the relevant historical disaster cases [6,12], but historical case information is widely recorded in texts and people need to obtain historical natural disaster information and knowledge from these texts to manage and analyze disasters [13]. As reference knowledge, historical natural disaster cases can provide a scientific basis and support for emergency decision-making to achieve an orderly and effective response over a short time. In recent years, scenario construction techniques have been proposed in the field of emergency management from home and abroad [14,15]. They can generate solutions to new problems by using source cases through case-based reasoning (CBR) techniques, and they complete the mapping of similar elements between source and target cases via reasoning [16,17]. Existing studies have carried out a large number of case similarity calculations for scenario building in the areas of business [18,19,20], medical health [21,22,23] and disaster incidents [24,25]. However, the existing studies provide very limited help for emergency decisions during sudden natural disasters [2,26].
The paper [27] in the field of emergency management of sudden natural disasters proposed an ontology-based semantic similarity calculation model to calculate the similarity by quantifying the semantic similarity between concepts. The paper [28] proposed a case inference based on a differential evolution algorithm, which obtained a new differential evolution algorithm through a hybrid mutation operator and improved the adaptiveness of the model. The paper [29] proposed a modeling and analysis of disaster chains based on stochastic Petri nets, established the model elements of disaster chains and analyzed their control flow relations. The paper [30] proposed an emergency risk decision-making method based on fault tree analysis; they constructed fault trees by analyzing the evolution process of emergencies and described the logical relations between the conditions and factors leading to the evolution of emergencies.
The following problems and challenges are found when calculating the similarity between cases in the natural disaster field: (1) natural disaster information is usually recorded in unstructured texts, which generally contain a lot of noisy data (texts that are irrelevant to disaster descriptions); (2) texts contain a variety of information, such as text information, data information, geographic information, etc., which makes it difficult to calculate the similarity between cases by processing the corpus uniformly; (3) natural disaster cases contain many disaster events, and the values of the disaster-bearing body and damage information in disaster are not unified, which makes it more difficult to judge the similarity between disaster cases; (4) the temporal information between disaster events is not obvious as many natural disasters are transient in nature, resulting in a lack of temporal information in the text; (5) the spatial distribution of disaster events in natural disaster cases is wide and disasters are generally scattered in different locations.
It can be found that most of the existing studies focus on disaster analysis, numerical simulation, prediction and warning, damage assessment and emergency decision-making in the field of sudden natural disasters [31], while the comprehensive problems caused by sudden natural disasters are not considered globally. The distribution of disaster “dynamics” in the field of sudden natural disasters is widely varied, resulting in a large number of influencing factors. In this paper, we focus on the geographic distribution and the damage of natural disasters and build a multifactor, multiaspect and multihierarchy model to calculate the similarity between natural disaster cases. The main contributions of the study can be summarized as follows:
  • We transform the case similarity calculation into a similarity calculation of the case structure and case node labels by using the “vertex-edge-label” case structure;
  • We propose the similarity calculation of sudden natural disaster cases with a fused case hierarchy and we calculate the similarity in “case scenario”, “disaster damage” and “case structure” in a multihierarchy, multiaspect and multifactor way;
  • The experimental results of the storm surge disaster cases show that the results of aggregating the three similarities of “case scenario”, “disaster damage” and “case structure” in this paper are better than other comparison methods.

2. Related Work

The intercase similarity calculations in traditional methods are mainly based on a case’s textual content [32,33,34] and case hierarchy [35,36].
In the similarity calculation method based on a case’s textual content, an ontology mapping is generally an effective means of multisource data fusion and an ontology enables the sharing, common understanding and reuse of the domain knowledge [27,37]. An ontology mapping obtains the source ontology that is similar to the target ontology by a similarity calculation method. It forms a mapping relationship, obtains a unified global representation and realizes the effective fusion of multisource data. The ontology-based similarity calculation methods can be broadly classified into five categories: semantic-distance-based similarity calculation methods [38], information-content-based similarity calculation methods [33,39], concept-attribute-based similarity calculation methods [40], hybrid semantic similarity calculation methods [41] and deep-learning-based similarity calculation methods [42,43]. Among them, the calculation methods based on semantic distance have a low computational complexity, but the single consideration makes the results less accurate and unstable. For the calculation methods based on information content, the results are more accurate for a corpus with a high completeness and the algorithm does not have robustness. The calculation method based on concept attributes shows more accurate results but ignores the location and content information between concept nodes. Furthermore, the hybrid semantic similarity calculation method has more objective and accurate results but has a high computational complexity. Furthermore, the calculation method based on deep learning has accurate results but poor convergence. In this paper, we build a domain ontology for the domain of storm surge natural disasters and use the similarity calculation method of information content to calculate the similarity of the cases’ textual content.
The graph structure is flexible and widely used in terms of similarity calculation methods for case hierarchies, and the graphs are available in the form of a Petri net model [44,45], BPMN network model [46], Bayesian network model [47], etc. A graph structure is used for the similarity measure of sudden natural disaster case hierarchies by methods such as the graph edit distance [48], maximum common subgraph [49] and graph isomorphism [50] for the similarity search and graph matching on the graph structure. With the development of neural networks, many studies have recently turned similarity estimation into a learning problem, and a graph neural network is a powerful tool for learning various structural graph representations [51,52]. However, since the extracted sudden natural disaster case structures have fewer graph structure nodes, shallower layers and smaller sizes, which makes the neural network [53] unable to learn effective features, we used the unsupervised graph edit distance method to learn the similarity between sudden natural disaster case hierarchies.
For the main problems of the similarity calculations between sudden natural disasters cases, to deal with sudden natural disaster cases timely and intelligently and to overcome the one-sidedness and limitations of the existing cases’ text content and hierarchy, we propose a case similarity calculation with a fused case hierarchy.

3. Disaster Case Analysis

The current “scenario–response” model is the trend in the study of emergency natural disaster response, and managers need to study the “situation” of the occurrence and the development of that current emergency natural disaster [54]. The characteristics of the storm surge disaster “situation” are that the “situation” is spatially dispersed and temporally short-lived. 
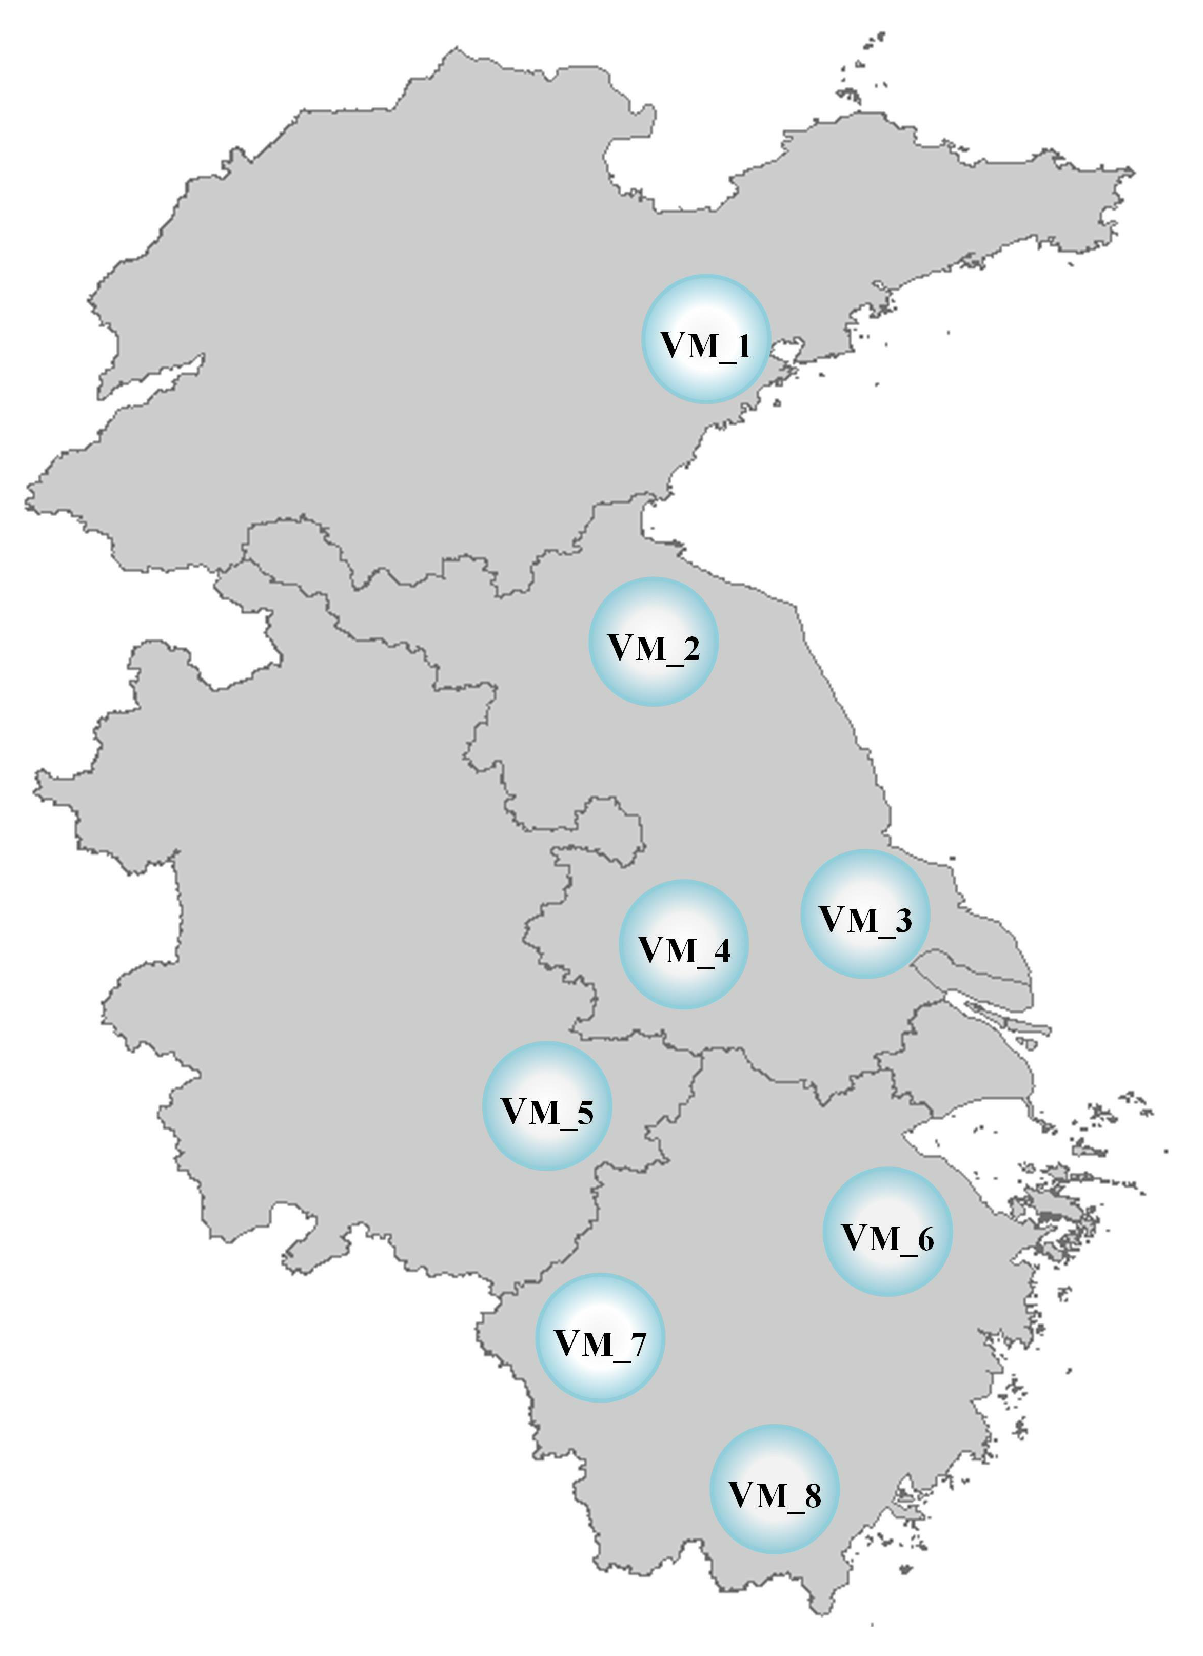
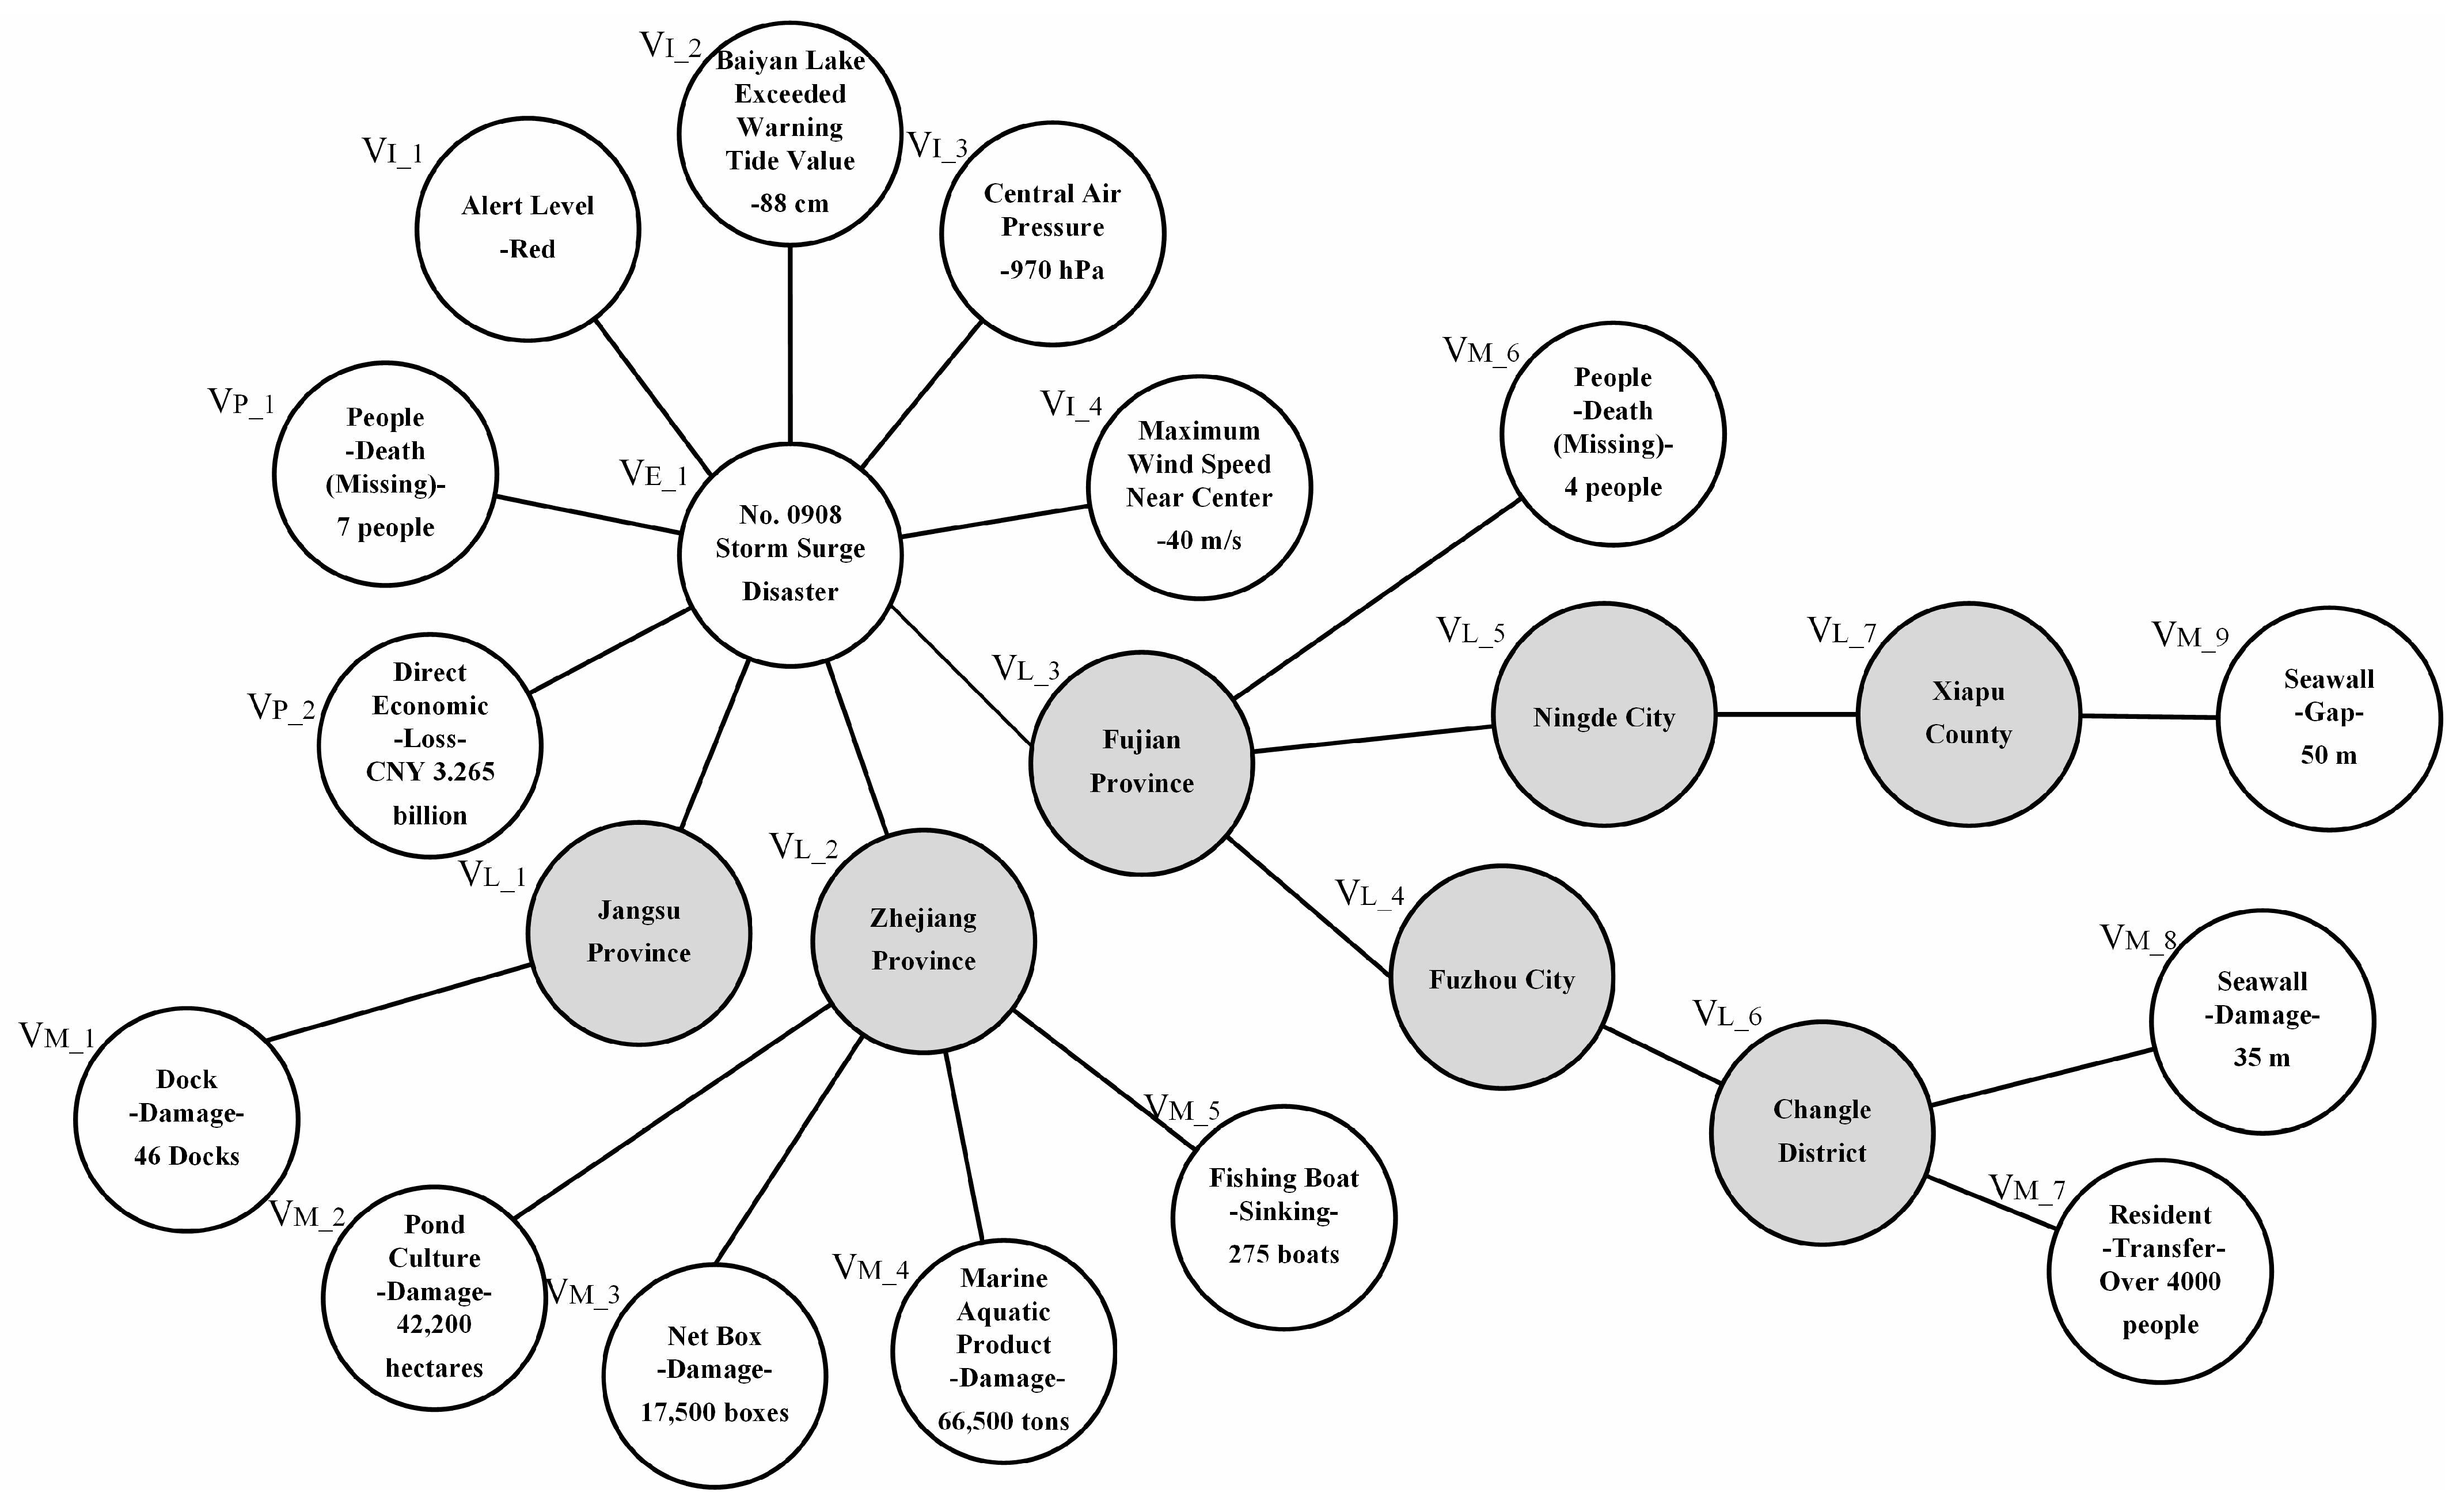
Figure 1 shows the decomposition of multiple events in the spatial dimension of a storm surge disaster case, which shows the spatial distribution of the disaster conditions after the storm surge disaster V M 1 V M 8 . The distribution of the disaster is generally expressed as the information and distribution of the storm-surge-disaster-bearing body, which is a manifestation of the set of “states”.
We performed the analysis from the perspective of the disposal model of emergency decision-making in sudden natural disasters, assuming that the fundamental goal of emergency decision-making is to control, reduce and eliminate the impact of the disaster around different disaster-bearing bodies. Based on the fundamental goal of emergency decision-making, we combined the definition and spatial analysis of sudden natural disaster texts. We believe that the damage of the disaster-bearing body (disaster damage) and the disaster scenario constitute the core of sudden natural disaster cases. Furthermore, we propose the concept of “sudden natural disaster cases”.
This paper used 281 cases of storm surge disasters in China from 1949 to 2019. We analyzed the text of sudden natural disaster cases and found that they contained many case scenarios and disaster damage information. Therefore, in response to the spatial and temporal distribution characteristics of natural disasters, we constructed “sudden natural disaster cases” by converting case scenarios and disaster damage into case structure hierarchies according to the geographical location of natural disasters. We defined a case as a collection of information, which combined the disaster information suffered by a disaster-bearing body and the disaster-generating environment in a sudden natural disaster. A sample of sudden natural disasters from storm surges is shown in Figure 2.
Specifically, a sudden natural disaster case can be represented formally as a triplet G = { V , E , N } , where V is the set of all nodes of the graph, E is the set of all edges of the graph and N is the set of all node labels in the graph.
The set V = { V E , V I , V P , V M , V L } is the set of case nodes, V E = { V E 1 , V E 2 , } is the set of case ID nodes, V I = { V I 1 , V I 2 , } is the set of case damage nodes, V P = { V P 1 , V P 2 , } is the set of case attribute nodes, V M = { V M 1 , V M 2 , } is the set of disaster damage nodes and V L = { V L 1 , V L 2 , } is the set of disaster geographic location nodes. The set of case edges E = { < V i , V j > , , < V m , V n > , } is the set of directed edges, which is used to represent the order relation between the case nodes of sudden natural disasters.
The set of case node labels is N = { N I , N P , N M , N L } , where N I = { H a I , P r I , D a I } is the set of case damage information and the statistical information on dead population, affected population, house loss, economic loss, crop damage and overalert tide value in sudden natural events, consisting of the set of case disaster-bearing bodies H a I = { H a I 1 , H a I 2 , } , the set of attributes of the case disaster-bearing body P r I = { P r I 1 , P r I 2 , } and the set of data of the case disaster-bearing body D a I = { D a I 1 , D a I 2 , } ; N P = { R e P , C o P } is the set of case attribute information, the meteorological attributes and time attributes, etc., at the landing of sudden natural cases, composed of the set of case attribute types R e P = { R e P 1 , R e P 2 , } and the set of case attribute data C o P = { C o P 1 , C o P 2 , } ; N M = { H a M , P r M , D a M } is a disaster damage information set and the basic information of a sudden natural disaster event element, composed of a disaster-damage-bearing body set H a M = { H a M 1 , H a M 2 , } , the set of attributes of the damage-bearing body P r M = { P r M 1 , P r M 2 , } and the data set of disaster-damage-bearing body D a M = { D a M 1 , D a M 2 , } ; N L = { L o L } is a disaster geographic location information collection, which is the specific location of the event caused by sudden natural disasters and it consists of the set of geographic locations L o L = { L o L 1 , L o L 2 , } . The sets D a I , C o P , D a M are numerical information and the other nodes are textual information.

4. Similarity Calculation between Cases

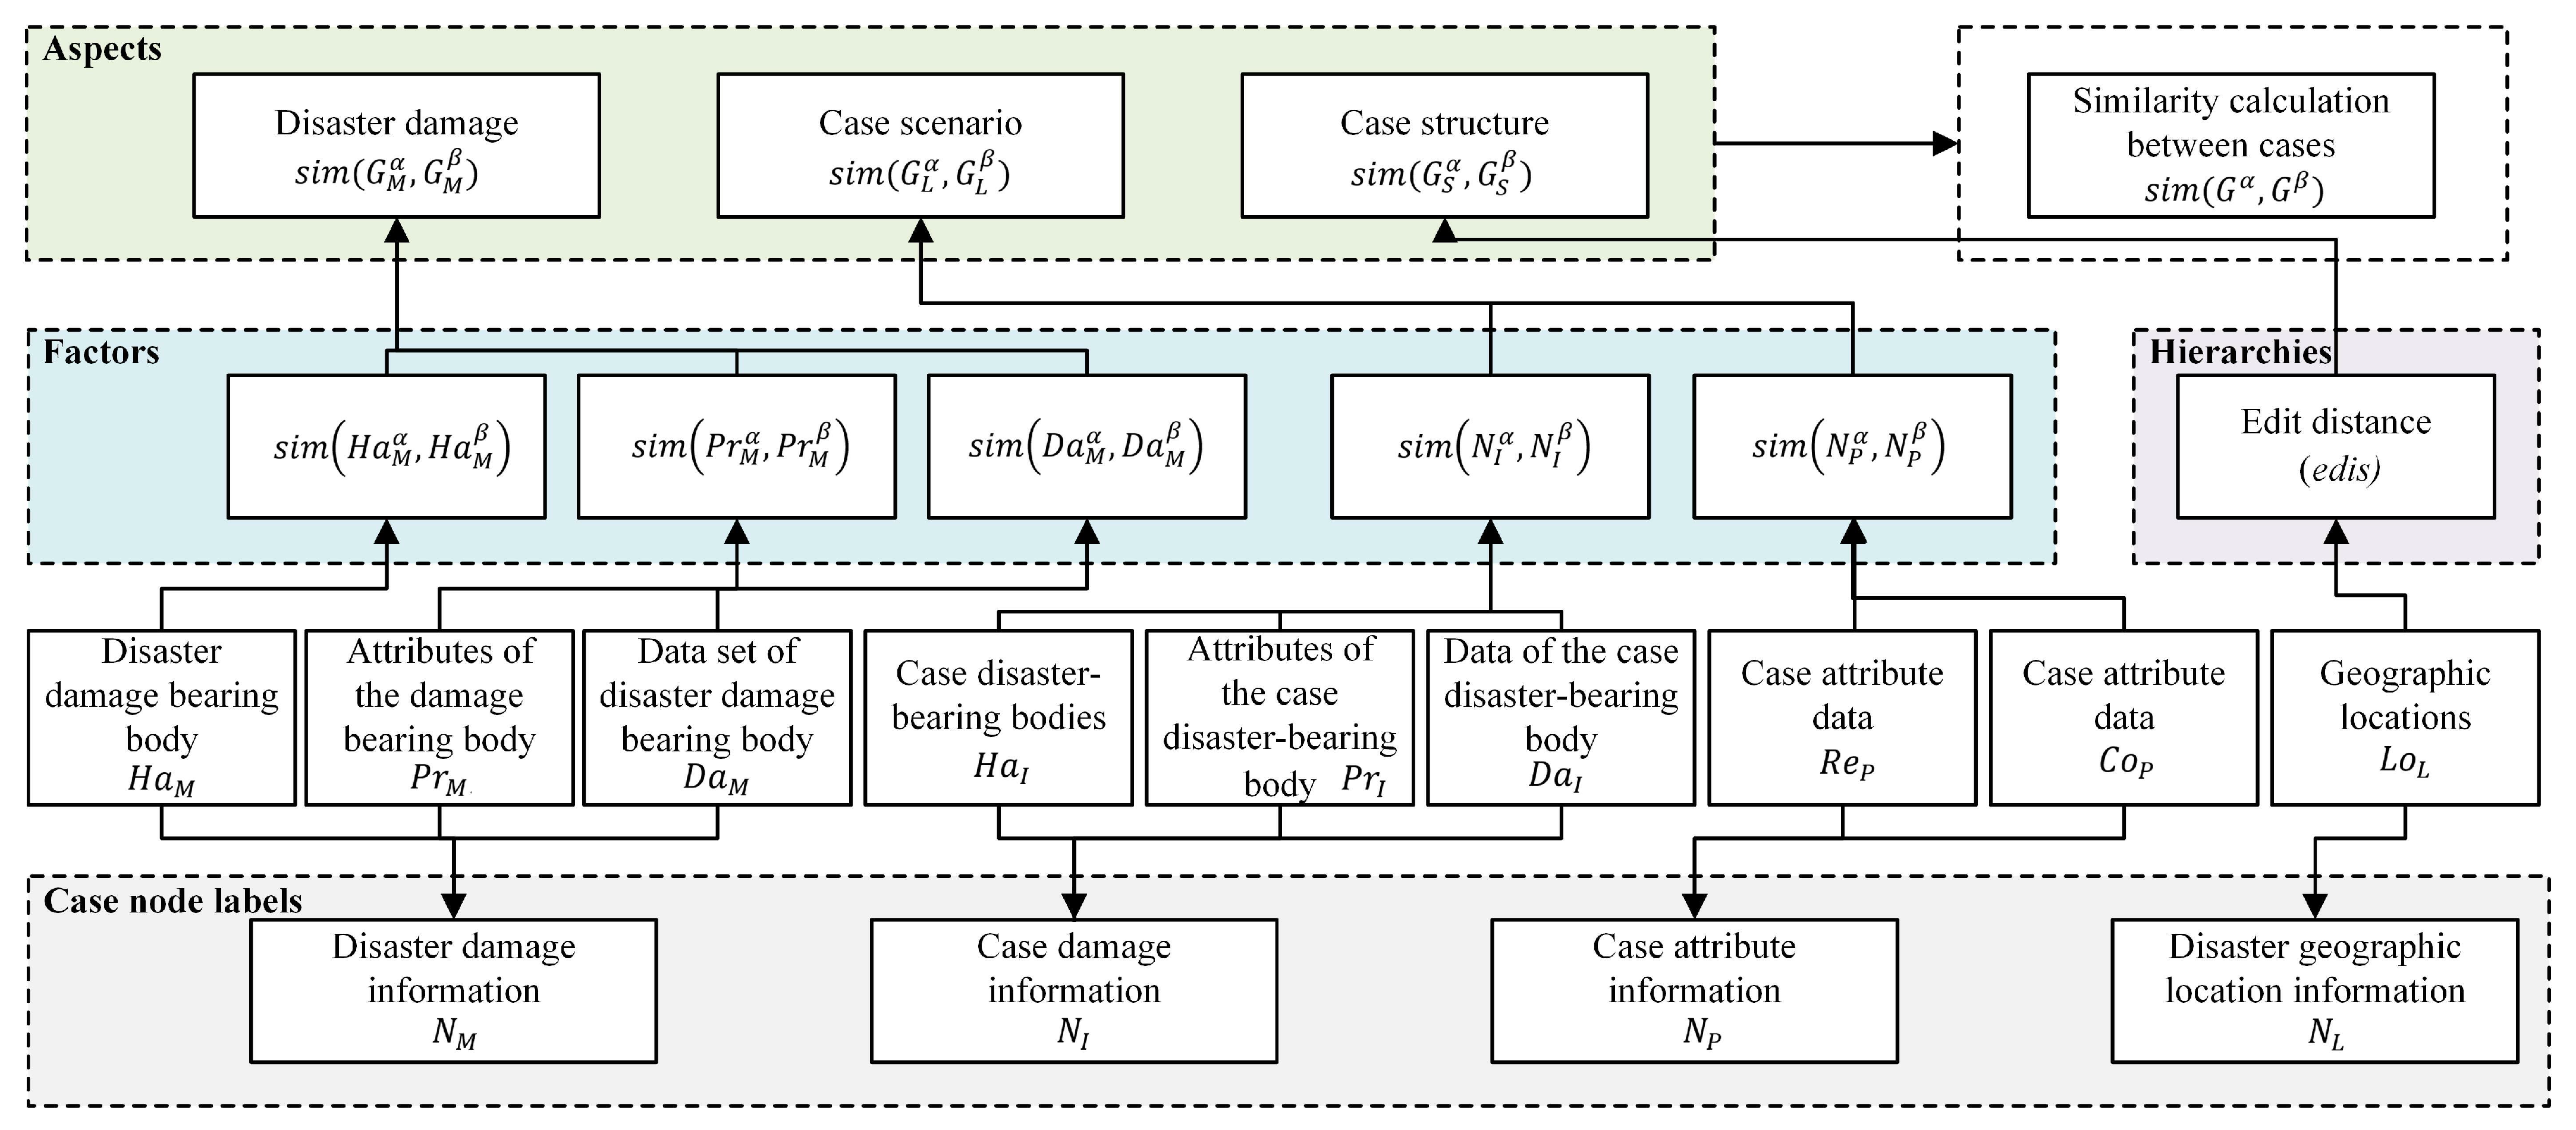
The similarity between cases was obtained by combining the similarity in “case scenario”, “disaster damage” and “case structure” between two cases. The similarity in “case scenario” in the case of sudden natural disasters was calculated from the label data between the case loss node and the case attribute node. The similarity in “disaster damage” was calculated from the textual information and data information in the label data. Furthermore, the “case structure” was the geographic location information of the event, which was transformed into a case hierarchy for the similarity calculation. In other words, the similarity in the label text and the case structure were calculated and analyzed in a multihierarchy, multiaspect and multifactor way for the label text and structure of the cases that constituted sudden natural disasters. The architecture of the similarity model between natural disaster cases is shown in Figure 3.

4.1. Similarity between Case Scenarios

The “case scenario” mainly contains the natural and disaster-forming attributes of the disaster [55]. The natural attributes of the storm surge disaster were mainly the statistical information about the disaster level, landfall time, landfall location, landfall wind speed, central air pressure and coastal water increase in the case; the disaster-forming attributes of the storm surge disaster were mainly the statistical information about the dead population, affected population, housing damage, economic loss, crop damage and excess tide value. The natural attributes and disaster-forming attributes corresponded to the case loss node V I and the case attribute node V P in the case, respectively.
Specifically, we used the disaster level ( L L ), landfall wind speed ( W L ), central air pressure ( P L ) and coastal water increase ( I L ) information for the natural attributes’ similarity calculation. For disaster-forming attributes followed the Statistical System of Natural Disaster Situation (Minfa [2016] No. 23) and Natural Disaster Statistics (Part 1): Basic Indicators (GB/T24438.1-2009), and for case damage we used the death population ( D C ), affected population ( P C ), house damage ( H C ), economic loss ( E C ), crop damage ( C C ) and exceeded warning tide values ( S C ) for the similarity calculation.
The similarity between the “case scenarios” was calculated by combining the information of natural attributes and disaster attributes, which was transferred to the similarity calculation of the label information in the V I and V P nodes of the disaster case. The formulas for the natural attributes in the “case scenario” were given by the similarity between disaster levels, similarity between landfall wind speeds and central air pressures and similarity between coastal water increases, respectively, and the formulas for the disaster attributes were for the similarity between case damages.
(1) Calculation of disaster level similarity: a storm surge disaster level P L L is generally divided into four levels: red, orange, yellow and blue, corresponding to level I, level II, level III and level IV and corresponding to values 1∼4. Thus, the disaster level similarity between case A and case B is calculated by the formula shown in Equation (1).
s i m ( P L L α , P L L β ) = 1 | P L L α P L L β | m a x ( P L L α , P L L β )
(2) Landing wind speed and central pressure similarity calculation: landing wind speed P W L and central pressure P P L are both storm surge disaster environments; the more similar the landing wind speed and central pressure of cases A and B are to the environment, the higher their similarity is. The calculation formula is shown in Equations (2) and (3).
s i m ( P W L α , P W L β ) = 1 | P W L α P W L β | m a x ( P W L α , P W L β )
s i m ( P P L α , P P L β ) = 1 | P P L α P P L β | m a x ( P P L α , P P L β )
(3) Coastal water increase similarity calculation: the maximum water increase value P I L in the storm surge disaster process was divided into five levels: extralarge, large, relatively large, medium and general, corresponding to level I, level II, level III, level IV and level V. The specific classification criteria for the levels are shown in Table 1. Coastal water increase counting in storm surge disasters involves multiple tide gauge sites. We first counted the number of tide gauge sites and tide gauge site water increase values in cases A and B; then, according to the corresponding values 1∼5 of the grade, we averaged the site water increase values and calculated the similarity between coastal water increases in cases A and B. The calculation formula is shown in Equation (4).
s i m ( P I L α , P I L β ) = 1 | P I L α P I L β | m a x ( P I L α , P I L β )
In conclusion, we combined these four calculations results of the disaster level, landfall wind speed, central air pressure and coastal water increase to derive the case attribute similarity s i m ( N P α , N P β ) , and the formula is shown in Equation (5).
s i m ( N P α , N P β ) = s i m ( P L L α , P L L β ) + s i m ( P W L α , P W L β ) + s i m ( P P L α , P P L β ) + s i m ( P I L α , P I L β ) 4
(4) Case damage similarity calculation: death (missing) people I D C , affected population I P C , house collapse I H C , direct economic loss I E C , crop damage area I C C and exceeded warning tide value I S C were divided into four grades (extralarge, large, relatively large, general) and the specific classification criteria are shown in Table 2. The case damage similarity between cases A and B was calculated according to the values 1∼4 corresponding to their rank, where the formula for calculating the number of fatalities is shown in Equation (6) and s i m ( I P C α , I P C β ) , s i m ( I H C α , I H C β ) , s i m ( I E C α , I E C β ) , s i m ( I C C α , I C C β ) and s i m ( I S C α , I S C β ) also can be calculated by the same formula.
s i m ( I D C α , I D C β ) = 1 | I D C α I D C β | m a x ( I D C α , I D C β )
In conclusion, the six calculation results of death (missing) people, affected population, collapsed houses, direct economic loss, crop damage area and exceeded warning tide value were combined to derive the case damage similarity s i m ( N I α , N I β ) , and the formula is shown in Equation (7).
s i m ( N I α , N I β ) = s i m ( I D C α , I D C β ) + s i m ( I P C α , I P C β ) + s i m ( I H C α , I H C β ) + s i m ( I E C α , I E C β ) + s i m ( I C C α , I C C β ) + s i m ( I S C α , I S C β ) 6

4.2. Similarity in Disaster Damage

Normally, a disaster case contains multiple “disaster damage” pieces of information. For example, a storm surge disaster case may contain events such as “46 docks destroyed in Jiangsu Province”, “275 fishing boats sunk in Zhejiang Province”, etc., where the “disaster damage” corresponds to the node V M in the case of a sudden natural disaster, and the label information of the node V M is “46 docks destroyed” and “275 fishing boats sunk”; the label information contains the disaster’s textual information “docks” and “fishing boats” as the “disaster damage”-bearing body H a M ; “destroyed” and “sunk” are the “disaster damage”-bearing body attributes P r M ; “46 docks” and “275 boats” are the “disaster damage”-bearing body data D a M .
All the “disaster damage” elements in cases A and B contributed to the similarity calculated by the textual information of H a M , P r M and the data information of D a M .

4.2.1. Similarity in Textual Information

Both disaster-bearing body information H a M and disaster-bearing body attribute information P r M 
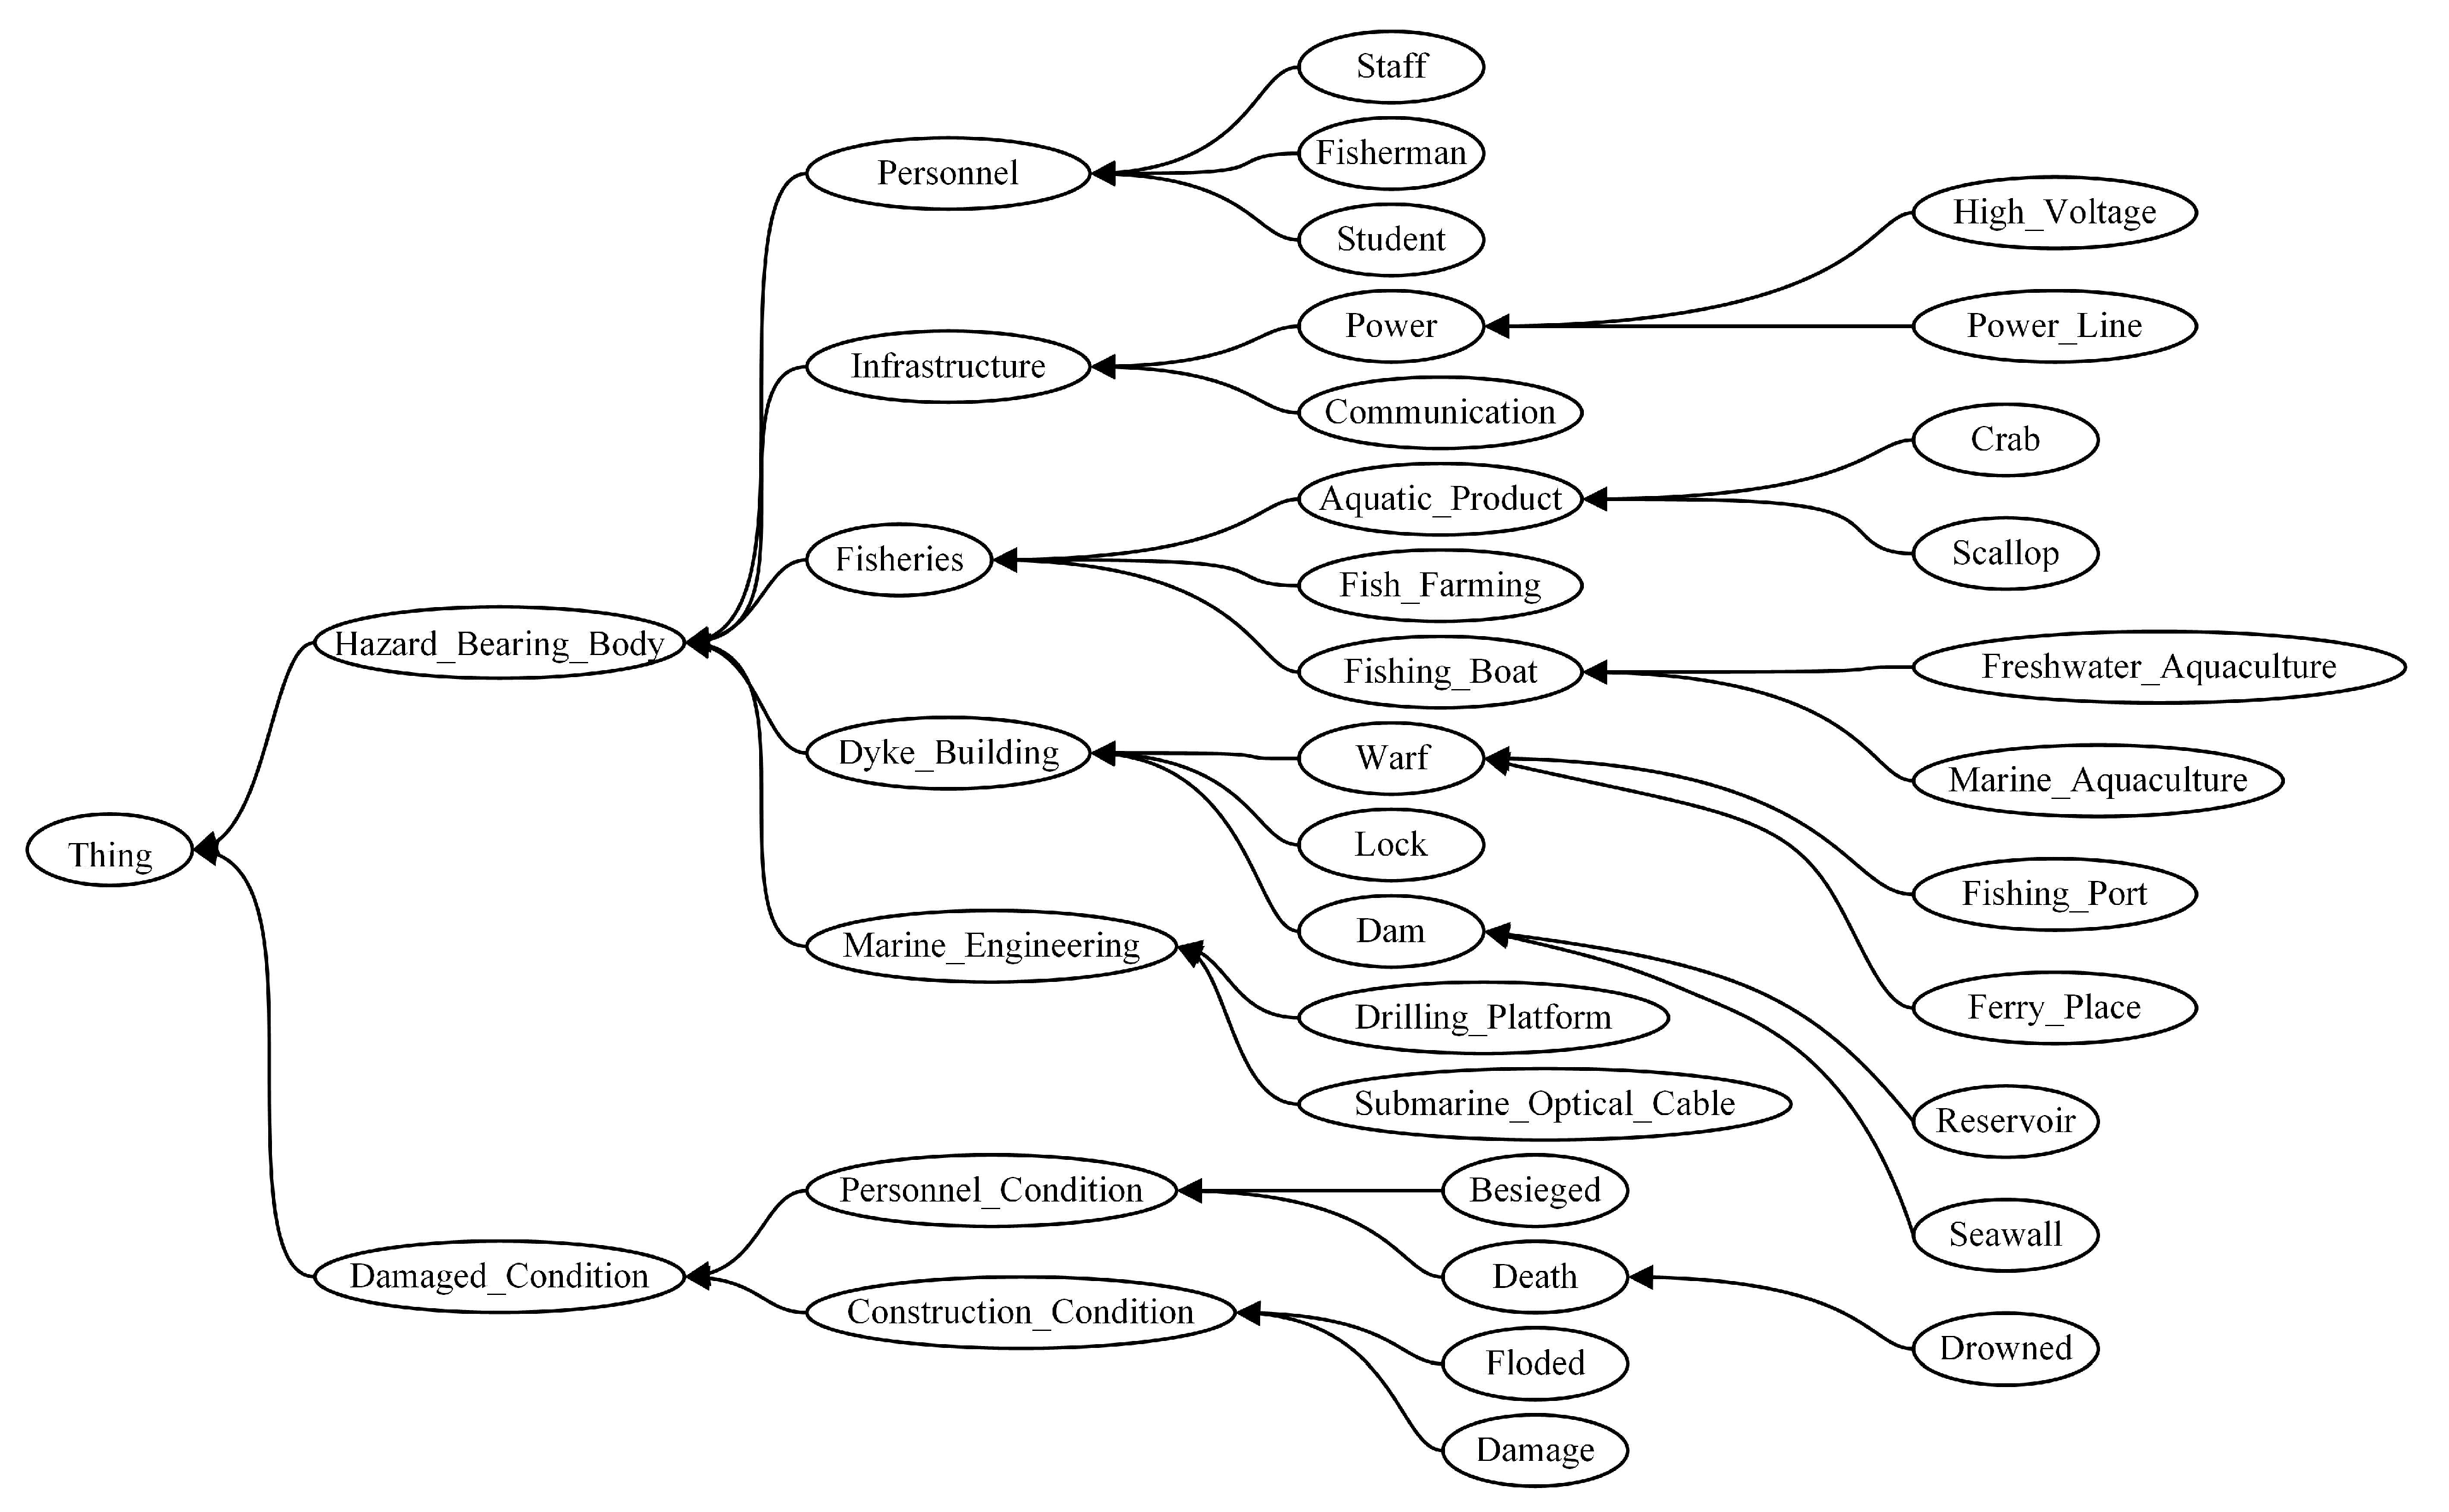
in the “disaster damage” information are concepts of the mentioned disaster domain ontology. The similarity calculation of H a M and P r M can be transformed into the similarity calculation between concepts of the ontology. In our previous work, we constructed the storm surge disaster domain ontology by comprehensively referring to the existing domain ontologies for sudden natural disasters and the National General Emergency Response Plan for Public Emergencies issued by the State Council and other emergency management departments [56,57]. Figure 4 shows the hierarchy among some concepts in the storm surge disaster domain ontology.
In this paper, the similarity between the disaster-bearing body H a M α of storm surge disaster case A and the H a M β of case B was taken as an example for the calculation of textual information similarity, which mainly contained the following three steps.
(1) Construct the disaster similarity matrix: H a M : the sets of H a M of the two cases are H a M α = { H a M 1 α , H a M 2 α , , H a M m α } , m = ( 1 , 2 , ) and H a M β = { H a M 1 β , H a M 2 β , , H a M n β } , n = ( 1 , 2 , ) . Then, the following m × n disaster-bearing body similarity matrix M H a M can be established based on the two H a M sets, and the calculation formula is shown in Equation (8).
M H a M = S i m H a M 1 α , H a M 1 β S i m H a M 1 α , H a M 2 β S i m H a M 1 α , H a M n β S i m H a M 2 α , H a M 1 β S i m H a M 2 α , H a M 2 β S i m H a M 2 α , H a M n β S i m H a M m α , H a M 1 β S i m H a M m α , H a M 2 β S i m H a M m α , H a M n β
where S i m ( H a M i α , H a M j β ) ( i = 1 , 2 , , m ; j = 1 , 2 , , n ) is the similarity between the disaster-bearing body H a M i α in the set H a M α and H a M j β in the set H a M β .
(2) Calculate the value of each element in the similarity matrix: each element of the matrix M H a M represents the similarity between two concepts, and they can be calculated by any concept hierarchy method in the domain ontology. The similarity calculation method based on the domain ontology concept was used to calculate the concept similarity matrix M H a M for the content based on the amount of concept information within the ontology. The elements in the matrix M H a M were calculated by the formula shown in Equation (9).
S i m ( H a M i α , H a M j β ) = 2 I C ( H a M i α H a M j β ) I C H a M i α + I C ( H a M j β )
where H a M i α H a M j β is the commonality between two words, which is expressed as the nearest neighbor common ancestor concept of concepts H a M i α and H a M j β in the ontology structure tree, and I C ( H a M i α ) and I C ( H a M j β ) denote the information quantity of concepts H a M i α and H a M j β , respectively.
The I C value illustrates the amount of information provided by a concept when it appears in context [58], and the I C value of the function used the method reported in [59] to calculate the information content of a concept. The value of the function increases incrementally with the depth of the ontology, which means a more abstract concept has a smaller I C value and a more concrete concept has a larger I C value. This approach ensures that the value of the concept decreases as it moves from the leaf node to the root node of the hierarchy, and the calculated value is greater for the more concrete concept. To calculate the concept information content ( I C ), the formula shown in Equation (10) was used:
I C ( H a M k ) = l o g ( | l e a v e s ( H a M k ) | / | s u b s u m e r s ( H a M k ) | + 1 s u m l e a v e s + 1 )
where I C ( H a M k ) is the information content of the concept H a M k , and H a M k refers to a specific concept. | l e a v e s H a M k | is the number of the set composed of all leaf concepts under H a M k , | s u b s u m e r s ( H a M k ) | is the number of the set composed of all leaf concepts and all their parent concepts H a M k , and sum_leaves is the number of all leaf concepts in the storm surge disaster domain ontology.
(3) Calculate the similarity of textual information: after calculating the value of each element in M H a M , we selected the element with the largest value s i m ( H a M i α , H a M j β ) and added it to the set M . Then, we removed all the elements in row i and column j from M H a M . Repeating the above procedure until the number of elements in the set M gets to | M | = m i n ( | H a M α | , | H a M β | ) , assuming that the set M = { s i m 1 , s i m 2 , , s i m N } , the similarity between the set of disaster-bearing bodies can be calculated by the sum of all elements of the normalized set A . The corresponding formula is shown in Equation (11).
s i m ( H a M α , H a M β ) = ( | H a M α | + | H a M β | ) k = 1 N s i m k 2 | H a M α | × | H a M β |
In the same way, we can calculate the similarity s i m ( P r M α , P r M β ) between the set of attributes P r M in cases A and B.

4.2.2. Similarity in Data Information

Considering the different data types in the data set D a M of the disaster-bearing body, we classified the data information into three types of cases, namely, exact values, definite intervals and fuzzy intervals, for the calculation of the similarity.
(1) Similarity between exact values: the data of exact value type can be continuous or discrete, and we used the evolution formula based on the Hamming distance formula [60] to calculate the similarity of value attributes in this paper. The formula is shown in Equation (12), where a, b are the specific data information values of concepts C 1 , C 2 and S denotes the range of these data information values.
s i m ( C 1 , C 2 ) = 1 | a b | S
(2) Similarity between definite intervals: a definite interval is a set of real numbers in a closed interval with definite upper and lower bounds and the data information interval value of the concept C 1 is ( c , c ) and for the concept C 2 , it is ( d , d ) . The formula for calculating the similarity between them is shown in Equation (13).
s i m ( C 1 , C 2 ) = ( c , c ) ( d , d ) m a x ( c , d ) m i n ( c , d )
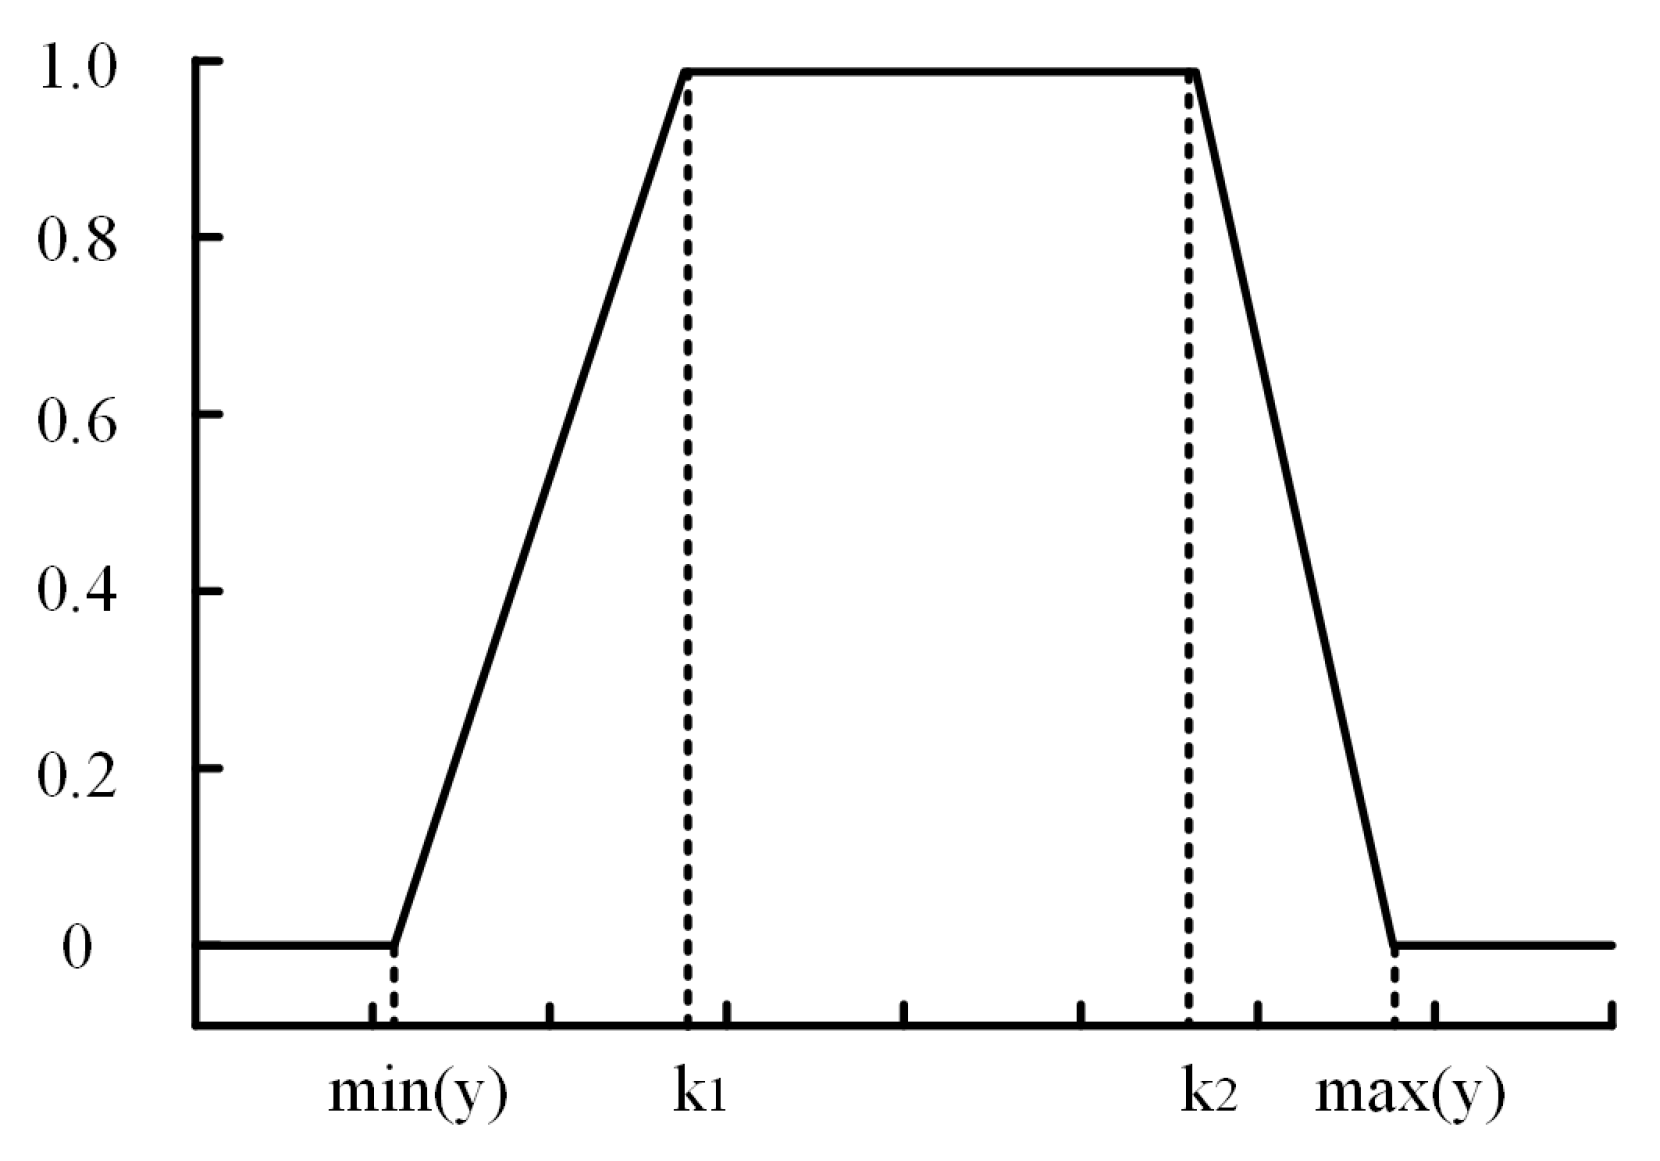
(3) Similarity between fuzzy intervals: fuzzy intervals have no definite upper and lower bounds, the values of such data information are usually sets and the elements in the sets are fuzzy concepts corresponding to the concept variables x. In this paper, the intervals were divided by the trapezoidal affiliation function [61], and the affiliation function was as in Equation (14), shown in Figure 5. The similarity between the concepts C 1 and C 2 was set to one in the optimal value interval, and the other intervals were expressed by the affiliation function relation. The two fuzzy intervals and their overlapping interval areas were calculated according to the responding affiliation function, and the rate of area overlapping was the similarity between the fuzzy intervals. The formula is shown in Equation (15), where g, k are the fuzzy intervals of concepts C 1 and C 2 .
f ( x ) = x m i n ( y ) k 1 m i n ( y ) x m i n ( y ) , k 1 1 x k 1 , k 2 m a x ( y ) x m a x ( y ) k 2 x k 2 , m a x ( y ) 0 o t h e r
s i m ( C 1 , C 2 ) = g k g k ( g k )
The steps to calculate the similarity matrix of the data information were the same as those of the text information and took the calculation of the similarity s i m ( D a M α , D a M β ) of the set D a M as an example. We needed to calculate the value of each element in M D a M at first and select the element with the largest value to add to the set M . Then, we standardized the sum of all elements of the set M to obtain the final “disaster damage” set D a M of cases A and B, and the formula is shown in Equation (16).
s i m ( D a M α , D a M β ) = ( | D a M α | + | D a M β | ) k = 1 N s i m k 2 | D a M α | × | D a M β |

4.3. Similarity between the Case Structures

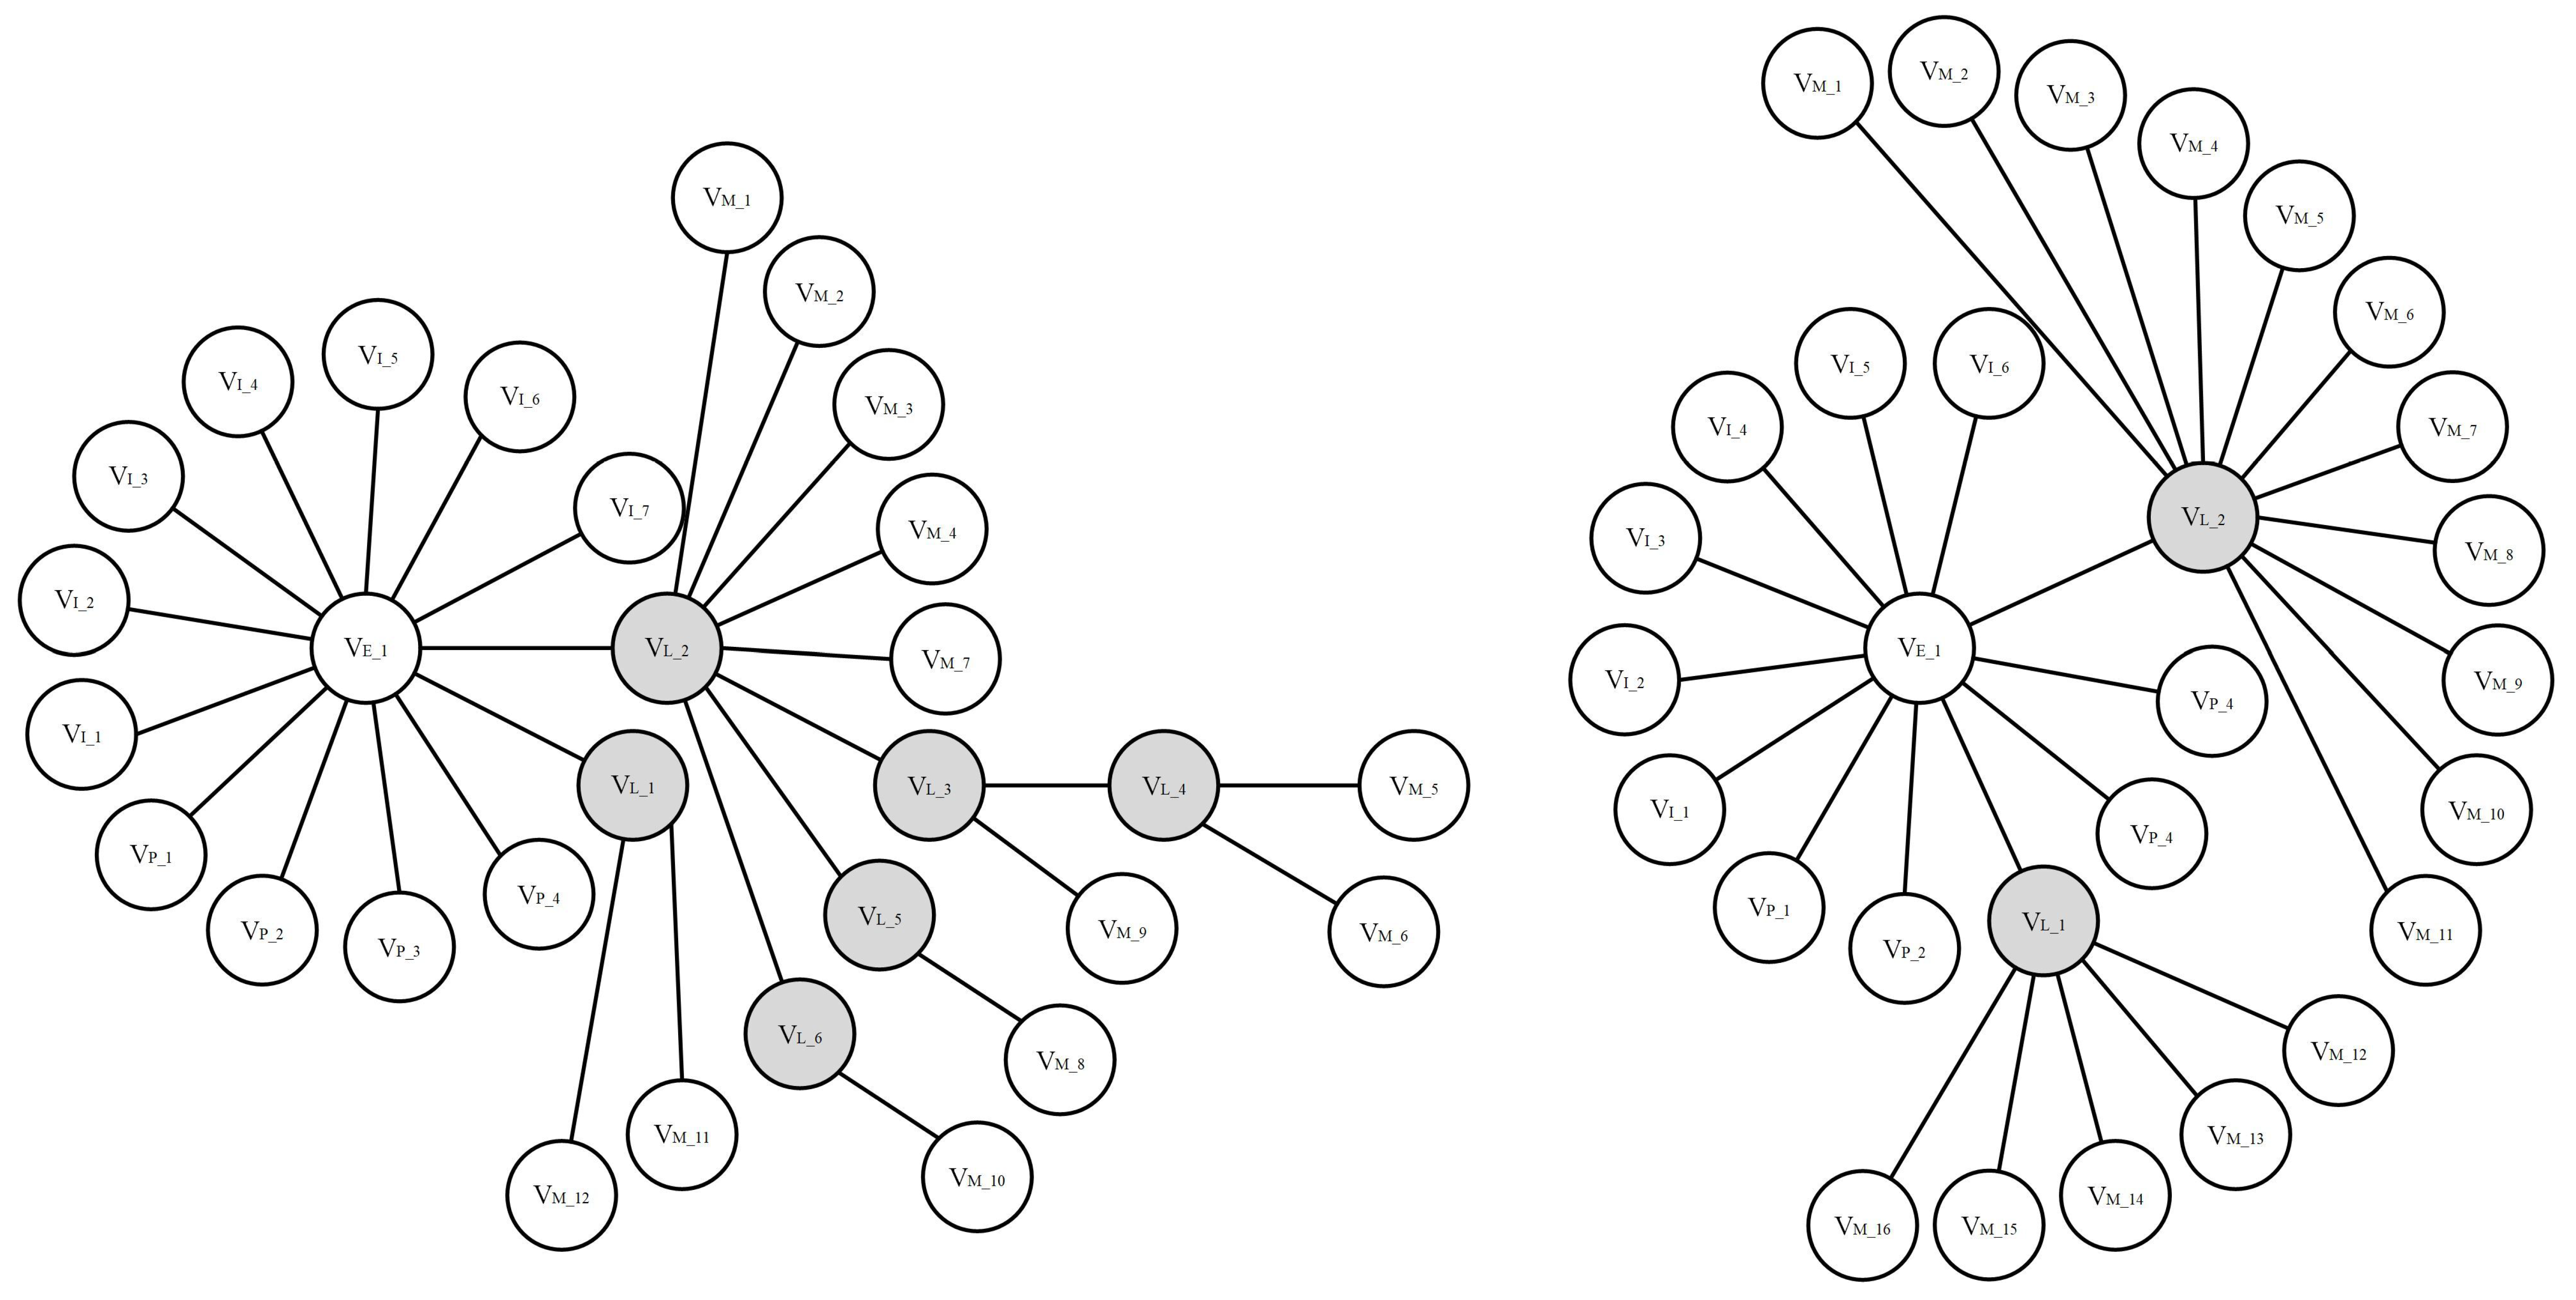
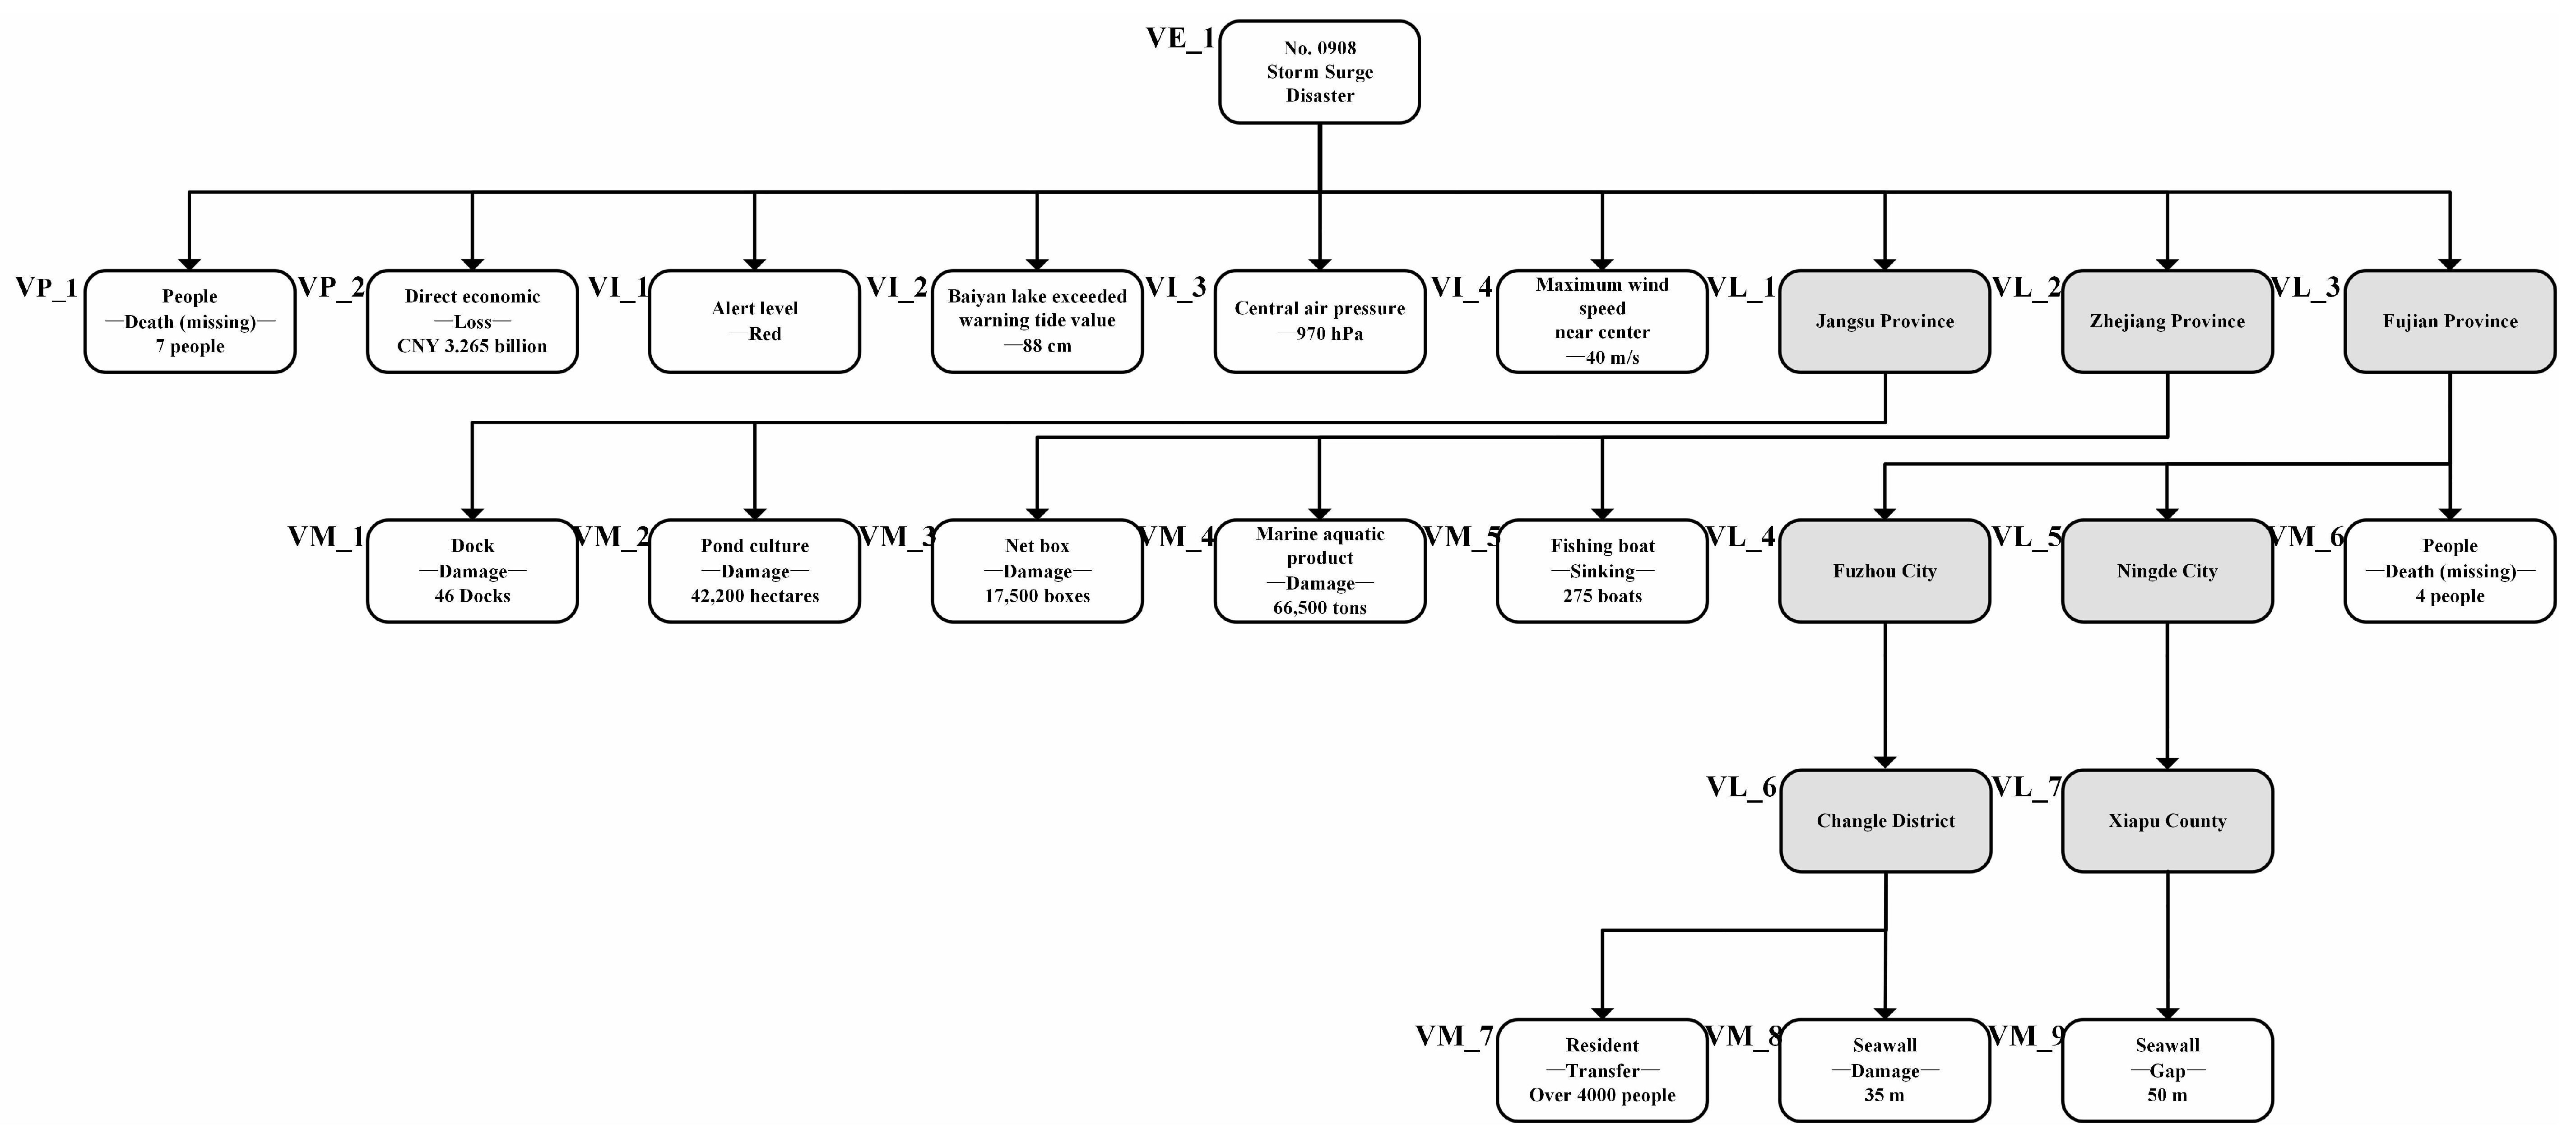
In this paper, we converted the geographic location in disaster cases into a hierarchy for a multihierarchy similarity calculation, and a case hierarchy sample is shown in Figure 6. The difference in two cases’ structures was expressed as a sequence of editing operations, and the sequence of editing operations was the editing operations required when changing one case to another, such as deleting nodes, inserting nodes, deleting edges and inserting edges. Then, the case structure similarity between cases A and B was s i m ( G S α , G S β ) , which was calculated as shown in Equation (17).
s i m ( G S α , G S β ) = 1 e d i s ( G S α , G S β ) m a x ( | G S α | , | G S β | )
e d i s ( G S α , G S β ) = w s u b V × s u b V + w s k i p V × s k i p V + w s k i p E × s k i p E
In Equation (18), e d i s ( G S α , G S β ) is the edit distance between graph G S α and graph G S β , | G S α | = | V S α | + | E S α | , | V S α | denotes the number of nodes in the graph G S α , | E S α | denotes the number of edges in the graph G S α , s u b V denotes the set of all nodes to be replaced, s k i p V denotes the set of all nodes to be inserted or deleted, s k i p E denotes the set of all edges to be inserted or deleted, w s u b V denotes the cost weight assigned to the set of replacement nodes, w s k i p V denotes the cost weight assigned to the set of nodes to be added or deleted and w s k i p E denotes the cost weight assigned to the set of edges associated with the nodes to be added or deleted. For this group of parameters, we used the experimental best values w s u b V = 1 , w s k i p V = 1 , w s k i p E = 0.5 .

4.4. Similarity Calculation between Cases

The similarity between two cases can be obtained by aggregating the label and structure information of the cases in a multihierarchy, multiaspect and multifactor way. Specifically, we set the source case A as G α = ( G L α , G M α , G S α ) and the target case B as G β = ( G L β , G M β , G S β ) . The similarity between the two cases was calculated by the similarities of the “case scenario” G L , “disaster damage” G M and “case structure” G S .
The “case scenario” similarity G L can be obtained by combining the multifactor case attribute similarity s i m ( N P α , N P β ) and the case damage similarity s i m ( N I α , N I β ) . The “disaster damage” similarity G M can be obtained by combining the multifactor “disaster damage”-bearing body similarity s i m ( H a M α , H a M β ) , “disaster damage”-bearing body attribute similarity s i m ( P r M α , P r M β ) and “disaster damage”-bearing body data similarity s i m ( D a M α , D a M β ) . Then, the similarity s i m ( G α , G β ) between G α and G β was calculated as shown in Equation (19).
s i m ( G α , G β ) = w 1 s i m ( G L α , G L β ) + w 2 s i m ( G M α , G M β ) + w 3 s i m ( G S α , G S β )
s i m ( G L α , G L β ) = w L 1 s i m ( N I α , N I β ) + w L 2 s i m ( N P α , N P β )
s i m ( G M α , G M β ) = w M 1 s i m ( H a M α , H a M β ) + w M 2 s i m ( P r M α , P r M β ) + w M 3 s i m ( D a M α , D a M β )
where s i m ( G α , G β ) is the overall similarity between the two cases, w 1 , w 2 and w 3 are the weights of the aggregation method, w L 1 and w L 2 are the weights in the “case scenario”, w M 1 and w M 2 are the weights in the “disaster damage”, and they satisfy the conditions of 0 w L 1 , w L 2 1 , 0 w M 1 , w M 2 1 , 0 w 1 , w 2 , w 3 1 and w L 1 + w L 2 = 1 , w M 1 + w M 2 = 1 , w 1 + w 2 + w 3 = 1 .

5. Experimental Evaluation

5.1. Experimental Setup

The sudden natural disaster data were the collected storm surge disaster cases in China from 1949 to 2019, containing 281 storm surge disaster cases with a total of 39,340 case pairs, including four storm surge disaster grades: red, orange, yellow and blue. A total of 1155 case damage nodes, 1075 case attribute nodes, 5253 disaster damage nodes and 627 disaster geography nodes were extracted.
Eleven domain experts were invited to estimate the similarity between each storm surge disaster case pair; the domain experts included five domain-expert teachers and six PhD and graduate students in the field of sudden natural disasters. The domain experts made judgments based on the values of similarity between cases in four levels of no similarity [0 0.25), low similarity [0.25 0.50), medium similarity [0.50 0.75) and high similarity [0.75 1.0], respectively. We eliminated one maximum and one minimum value from the 11 estimation results and then averaged the remaining 9 estimation results of each case pair to get the final manual estimation similarity.
To better evaluate the performance of the aggregation method in this paper, we used 31,472 case pairs as the training set to determine the best weights for the method performance results and we used 7868 test case pairs as the input data. In this paper, we used a regression analysis [62] to calculate the weights of the case similarity, and we used 31,472 case pairs and their final manually estimated similarity as input to calculate the maximum value of the Pearson correlation coefficient between the similarity of the aggregation method and the similarity of the manual estimation. The formula is shown in Equation (22).
s i m ( G α , G β ) = w 0 + w 1 s i m ( G L α , G L β ) + w 2 s i m ( G M α , G M β ) + w 3 s i m ( G S α , G S β ) + e
where w 0 is the constant term and e is the residual term; we finally obtained the best values of the weights form the experiment as w 1 = 0.5972 , w 2 = 0.2857 and w 3 = 0.1171 . The formula for calculating the intercase similarity is Equation (23), and the weight coefficients in Equations (20) and (21) can be calculated similarly, where w L 1 = 0.3063 , w L 2 = 0.6937 , w M 1 = 0.1627 and w M 2 = 0.8373 .
s i m ( G α , G β ) = 0.5972 s i m ( G L α , G L β ) + 0.2857 s i m ( G M α , G M β ) + 0.1171 s i m ( G S α , G S β )
In this paper, we used the maximum value, mean, standard deviation and Pearson correlation coefficient of the difference between the similarity of the comparison experiment algorithm and the similarity of the manual evaluation to compute the performance test experiments. Furthermore, we assessed the correlation between the similarities derived from various algorithms and the results obtained from the manual evaluation. The Pearson correlation coefficient was used to characterize the correlation between two variables, with values ranging from 0 to 1, and a higher value meaning a greater correlation between the two. The Pearson correlation coefficient was used as a reference indicator and the formula is shown in Equation (24).
r = ( x x ¯ ) ( y y ¯ ) ( x x ¯ ) 2 · ( y y ¯ ) 2
where x X , y Y , x ¯ and y ¯ are means, the numerator is the covariance of X and Y, and the denominator is the product of the standard deviation of X and Y.
We used precision, recall and F1 scores to perform accuracy testing experiments on groups of storm surge disaster levels and compared the performance of this aggregation method with 10 benchmark methods.

5.2. Analysis of Experimental Results

Based on the fused case structure, the core of the similarity calculation of storm surge disaster cases had two points, which were the similarity calculation between cases by fusing multiaspect and multifactor information and the similarity calculation between cases by fusing the multihierarchy information of case structure. Therefore, the focus in the experimental design phase was to verify whether adding different aspects, different factors and multihierarchy information would bring gains. We experimentally tested and verified the textual-information-based similarity calculation method ( s i m 1 ), data-information-based similarity calculation method ( s i m 2 ), case-scenario-based similarity calculation method ( s i m 3 ), disaster-damage-based similarity calculation method ( s i m 4 ), case-structure-based similarity calculation method ( s i m 5 ) and the similarity calculation methods based on case scenario + disaster damage ( s i m 6 ), case scenario + case structure ( s i m 7 ) and disaster damage + case structure ( s i m 8 ). Furthermore, we designed two neural network learning methods, the Word2vec [63] method ( s i m 10 ), which can model document information, and the graph neural network (GNN) [53] method ( s i m 11 ). These two methods were compared with the aggregation method ( s i m 9 ) from this paper, and the comparison results are shown in Table 3 and Table 4.

5.2.1. Multifactor Analysis

From the experimental results shown in Table 3, it can be seen that the Pearson correlation coefficients of the aggregation method s i m 9 proposed in this paper are all higher than those of the other 10 methods. The similarity calculation methods s i m 1 based on textual information and s i m 2 based on data information are all single-factor methods, and the similarity calculation methods s i m 3 based on case scenario, s i m 4 based on disaster damage and s i m 5 based on case structure are all multi-factor methods that only consider one side. It is observed that the Pearson correlation coefficients of the single-factor methods are lower than those of the other methods, indicating that the multifactor methods can represent storm disaster cases better than the single-factor methods.
s i m 1 has a much lower Pearson correlation coefficient than s i m 2 and the main reason is that the information extracted from s i m 1 is the conceptual information about the disaster-bearing bodies and their attributes in the document. It does not directly reveal the severity of the disaster and only shows that those disaster-bearing bodies have been damaged by the storm surge. On the contrary, the data information in s i m 2 can directly show the severity of the disaster and s i m 2 is more effective than sim1, for s i m 1 only uses textual information. However, since the data information in the data-based similarity calculation method does not reflect the specific disaster-bearing body object, it leads to better results when the two are combined in the disaster-damage-based similarity calculation method.
From Table 3 and Table 4, we can see that the similarity experimental results of s i m 5 are worse than those of other methods. The reason is that s i m 5 uses structural information, which is calculated by the editing distance. It cannot verify whether the disaster events in two cases are similar or not by directly using the editing distance. In actual storm surge disaster cases, there are many nodes with different information contents. For example, 139 people died in case A and 2 people died in case B represent one node; the editing operation of the node operation is similar, but the similarity between the substantial information contents of the two nodes is very low. Therefore, the combination of structural and textual information in the s i m 7 similarity experiment could not lead to a significant improvement in the effect, as it lacks information about the severity of the storm surge disaster cases. The results of the experiments are consistent with human cognitive logic: when evaluating the similarity manually, experts will first judge the similarity of keywords and data in the text between two cases before judging the similarity between the scenarios and structures.
From the accuracy test’s experimental results in Table 4, we can see that the similarity experimental results of red level and blue level have higher accuracy, where the textual information factor and data information factor can bring obvious accuracy improvement for the methods. Different disaster levels are classified differently, and the experimental results show that the classification method does not distinguish the orange level from the yellow level significantly, and the effect is worse compared to the accuracy performance of the red level and the blue level. This is due to the special nature of the dichotomous classification problem, and adding too many factors to the method does not bring an improvement in the accuracy rate.
The experimental comparison shows that the improvement of similarity experimental results of aggregation method s i m 9 is not caused by a single factor individually, but the combination of multiple factors leading to the resulting enhancement. The textual information factor and the data information factor are the keys to significantly improving the experimental results. The role of the textual information factor and the data information factor is to provide the basic feature information for the method to ensure that the method can successfully learn the similarity-related information. While the case scenario information and case structure information further enhance the aggregation ability, the basic feature information is sufficient for the method to distinguish the similarity between different data. We can see that when multiple factors are available at the same time, the method s i m 9 obtains the globally optimal result. Furthermore, the result will fall back when any factor has been removed, so we believe that multiple factors are essential.

5.2.2. Neural Network Analysis

From Table 3 and Table 4, it can be seen that s i m 11 , a method based on a graphical neural network, has poor experimental results in calculating the similarity between cases. Comparing the results of s i m 11 and s i m 5 , it can be seen that the graphical neural network can indeed learn the structural information in the cases, and the reasons for its poor accuracy are similar to the reasons of s i m 5 . The case structure information extracted by s i m 11 can only show the hierarchical relation between each disaster event in the case. This hierarchical relation can only show the geographical location of each disaster damage event and the relation between them, and it is hard to learn the damage data, casualty data and other data information factors. The previous experiments through multifactor learning and analysis showed that only when the text information, data information, scenario information and case structure information were combined in multiaspect, multifactor and multihierarchy ways could we get better results. This explains why the s i m 11 experiments were less effective.
The similarity experimental results in the neural network method s i m 10 based on word vector are much better than those of the method s i m 11 . We think the reason is that the features of word vector Word2vec are made from the extracted textual information, which is the feature word vector obtained by a secondary calculation, and it is not the textual feature of the original document. Word vector Word2vec shows more features of the text itself; if the feature space is large enough, the model can learn certain knowledge based on these features to make predictions. In this paper, each type of feature had a separate dimension in the feature matrix, and each word in the word vector approach was a node with 200-dimensional features. When we pooled the word vectors, the information contained in the word vectors themselves was masked, and the pooled word vectors of a document were not able to fully characterize the document. The information in the documents that played a key role in the similarity calculation between cases was masked a lot by pooling, which led to a worse similarity experiment result of Word2vec than the aggregation method s i m 9 with multifactor learning.

6. Example Analysis

Taking storm surge disasters no. 1 and no. 2 as examples, we show the process of similarity calculation between the two disasters. The relevant information in the two cases was extracted automatically from case text by the natural language processing technology, which included the label information of V P , V I , V M , V L and the structure information of the cases. Figure 7 shows the case of storm surge disasters no. 1 and no. 2.
The label information V P of the storm surge disaster cases is shown in Table 5 and Table 6, each node label N P of a case attribute contains two attribute values of case attribute type R e P and case attribute data C o P . The label information V I of the storm surge disaster cases is shown in Table 7 and Table 8, the label N I of case damage node in each case contains three attribute values of case disaster-bearing body H a I , case disaster-bearing body attribute P r I and case disaster-bearing body data D a I . The label information V M and V L of the storm surge disaster cases are shown in Table 9 and Table 10, the label of disaster damage node N M in each case contains three attribute values of disaster-damage-bearing body H a M , disaster-damage-bearing body attribute P r M and disaster-damage-bearing body data D a M , and the geographical location node label N L contains the attribute value of geographical location L o M .
Based on the above results, the “case scenario” of storm surge disaster no. 1 contains 11 nodes of V P and V I , its “disaster damage” contains 12 nodes of V M , and the “case structure” has four layers; the “case scenario” of storm surge disaster no. 2 contains 10 nodes of V P and V I , its “disaster damage” contains 16 nodes of V M , and the “case structure” has three layers. The similarity in “case scenario”, “disaster damage” and “case structure” in both cases was calculated from the contents shown in Table 5, Table 6, Table 7, Table 8, Table 9 and Table 10, and the aggregated similarity multifactor was 0.8922, using Equation (23).

7. Summary

Cases of sudden natural disasters contain textual information, data information and geographic location information, which are difficult to read and understand by computers. In this paper, we took a holistic approach to consider the comprehensive problems associated with sudden natural disaster disasters and calculate the similarity between sudden natural disaster cases by aggregation methods in multihierarchy, multiaspect and multifactor ways. Furthermore, we comprehensively considered the text content and the geographical distribution in cases and solved the one-sidedness and limitation of similarity calculation between cases with case text content and case hierarchy. Meanwhile, we converted the text information of sudden natural disaster cases into case label information and converted the disaster damage events into a case structure based on geographic location information. This can help calculate the similarity of sudden natural disasters and provide corresponding automated processing methods and reference solutions for natural disaster emergency managers. The results were verified by storm surge disaster domain experiments, which showed that the aggregated multihierarchy, multiaspect, multifactor method worked better compared to other single-factor methods. The case similarity calculated by the aggregated method was closer to the manually estimated similarity than other methods.
The case similarity calculation method proposed in this paper still needs to be further refined in the future; the sudden natural disaster domain database needs to be continuously expanded and more different features need to be found. We will improve the case similarity calculation by optimizing the sudden natural disaster domain ontology, learning matrix and weights, to provide a more intelligent and automated disaster analysis and disaster decision-making.

Author Contributions

Conceptualization, Q.Z., H.Z. and C.C.; methodology, C.C. and S.W.; software, C.C. and S.W.; validation, H.Z. and C.C.; formal analysis, Q.Z. and C.C.; investigation, C.C. and S.W.; resources, Q.Z. and C.C.; data curation, C.C.; writing—original draft preparation, C.C.; writing—review and editing, Q.Z., H.Z. and C.C.; visualization, C.C.; supervision, Q.Z.; project administration, H.Z. and C.C.; funding acquisition, Q.Z. and H.Z. All authors have read and agreed to the published version of the manuscript.

Funding

This research was funded by National Natural Science Foundation of China, grant number U1931207 and 61702306; Science and Technology Development Fund of Shandong Province of China, grant number ZR202102230289, ZR202102250695 and ZR2019LZH001; Humanities and Social Science Research Project of the Ministry of Education, grant number 18YJAZH017; Taishan Scholar Program of Shandong Province, grant number ts20190936 and tsqn201909109; Shandong Chongqing Science and technology cooperation project, grant number cstc2020jscx-lyjsAX0008; Science and Technology Development Fund of Qingdao, grant number 21-1-5-zlyj-1-zc; Shandong University of Science and Technology Research Fund, grant number 2019KJN024 and 2015TDJH102; Natural Science Foundation of Shandong Province of China, grant number ZR2021MG038.

Institutional Review Board Statement

Not applicable.

Informed Consent Statement

Not applicable.

Data Availability Statement

Not applicable.

Conflicts of Interest

The authors declare no conflict of interest.

References

  1. Huang, D.; Wang, S.; Liu, Z. A systematic review of prediction methods for emergency management. Int. J. Disaster Risk Reduct. 2021, 62, 102412. [Google Scholar] [CrossRef]
  2. Wang, D.; Wan, K.; Ma, W. Emergency decision-making model of environmental emergencies based on case-based reasoning method. J. Environ. Manag. 2020, 262, 110382. [Google Scholar] [CrossRef]
  3. Evelpidou, N.; Tzouxanioti, M.; Gavalas, T.; Spyrou, E.; Saitis, G.; Petropoulos, A.; Karkani, A. Assessment of Fire Effects on Surface Runoff Erosion Susceptibility: The Case of the Summer 2021 Forest Fires in Greece. Land 2021, 11, 21. [Google Scholar] [CrossRef]
  4. Liu, H.; Luo, N.; Zhao, Q. Research on the Construction of Typhoon Disaster Chain Based on Chinese Web Corpus. J. Mar. Sci. Eng. 2022, 10, 44. [Google Scholar] [CrossRef]
  5. State Oceanic Administration of China. Bulletin of China Marine Disaster. 2021. Available online: http://www.nmdis.org.cn/hygb/zghyzhgb/2021nzghyzhgb/ (accessed on 10 May 2022).
  6. Wang, K.; Yang, Y.; Reniers, G.; Li, J.; Huang, Q. Predicting the spatial distribution of direct economic losses from typhoon storm surge disasters using case-based reasoning. Int. J. Disaster Risk Reduct. 2022, 68, 102704. [Google Scholar] [CrossRef]
  7. Pan, A. Study on the decision-making behavior of evacuation for coastal residents under typhoon storm surge disaster. Int. J. Disaster Risk Reduct. 2020, 45, 101522. [Google Scholar] [CrossRef]
  8. Gao, J.; Xu, Z.; Liang, Z.; Liao, H. Expected consistency-based emergency decision making with incomplete probabilistic linguistic preference relations. Knowl.-Based Syst. 2019, 176, 15–28. [Google Scholar] [CrossRef]
  9. Helderop, E.; Grubesic, T.H. Streets, storm surge, and the frailty of urban transport systems: A grid-based approach for identifying informal street network connections to facilitate mobility. Transp. Res. Part D Transp. Environ. 2019, 77, 337–351. [Google Scholar] [CrossRef]
  10. Kou, G.; Ergu, D.; Shi, Y. An integrated expert system for fast disaster assessment. Comput. Oper. Res. 2014, 42, 95–107. [Google Scholar] [CrossRef]
  11. Chen, N.; Liu, W.; Bai, R.; Chen, A. Application of computational intelligence technologies in emergency management: A literature review. Artif. Intell. Rev. 2019, 52, 2131–2168. [Google Scholar] [CrossRef]
  12. Smith, J.; Yazdanpanah, F.; Thistle, R.; Musharraf, M.; Veitch, B. Capturing expert knowledge to inform decision support technology for marine operations. J. Mar. Sci. Eng. 2020, 8, 689. [Google Scholar] [CrossRef]
  13. Chen, S.; Yi, J.; Jiang, H.; Zhu, X. Ontology and CBR based automated decision-making method for the disassembly of mechanical products. Adv. Eng. Inform. 2016, 30, 564–584. [Google Scholar] [CrossRef]
  14. Chen, C.; Yang, Y.; Wang, M.; Zhang, X. Characterization and evolution of emergency scenarios using hybrid Petri net. Process. Saf. Environ. Prot. 2018, 114, 133–142. [Google Scholar] [CrossRef]
  15. De Nicola, A.; Melchiori, M.; Villani, M.L. Creative design of emergency management scenarios driven by semantics: An application to smart cities. Inf. Syst. 2019, 81, 21–48. [Google Scholar] [CrossRef]
  16. Bannour, W.; Maalel, A.; Ben Ghezala, H.H. Emergency Management Case-Based Reasoning Systems: A Survey of Recent Developments. J. Exp. Theor. Artif. Intell. 2021, 1–24. [Google Scholar] [CrossRef]
  17. Hadj-Mabrouk, H. Application of Case-Based Reasoning to the safety assessment of critical software used in rail transport. Saf. Sci. 2020, 131, 104928. [Google Scholar] [CrossRef]
  18. Song, B.; Yan, W.; Zhang, T. Cross-border e-commerce commodity risk assessment using text mining and fuzzy rule-based reasoning. Adv. Eng. Inform. 2019, 40, 69–80. [Google Scholar] [CrossRef]
  19. Okudan, O.; Budayan, C.; Dikmen, I. A knowledge-based risk management tool for construction projects using case-based reasoning. Expert Syst. Appl. 2021, 173, 114776. [Google Scholar] [CrossRef]
  20. Khosravani, M.R.; Nasiri, S. Injection molding manufacturing process: Review of case-based reasoning applications. J. Intell. Manuf. 2020, 31, 847–864. [Google Scholar] [CrossRef]
  21. Bentaiba-Lagrid, M.B.; Bouzar-Benlabiod, L.; Rubin, S.H.; Bouabana-Tebibel, T.; Hanini, M.R. A case-based reasoning system for supervised classification problems in the medical field. Expert Syst. Appl. 2020, 150, 113335. [Google Scholar] [CrossRef]
  22. El-Sappagh, S.; Elmogy, M.; Riad, A. A fuzzy-ontology-oriented case-based reasoning framework for semantic diabetes diagnosis. Artif. Intell. Med. 2015, 65, 179–208. [Google Scholar] [CrossRef]
  23. Perez, B.; Lang, C.; Henriet, J.; Philippe, L.; Auber, F. Risk prediction in surgery using case-based reasoning and agent-based modelization. Comput. Biol. Med. 2021, 128, 104040. [Google Scholar] [CrossRef] [PubMed]
  24. Feng, Y.; Xiang-Yang, L. Improving emergency response to cascading disasters: Applying case-based reasoning towards urban critical infrastructure. Int. J. Disaster Risk Reduct. 2018, 30, 244–256. [Google Scholar] [CrossRef]
  25. Qingsong, Z.; Junyi, D.; Yu, G.; Peng, L.; Kewei, Y. A scenario construction and similarity measurement method for navy combat search and rescue. J. Syst. Eng. Electron. 2020, 31, 957–968. [Google Scholar] [CrossRef]
  26. Zhang, Y.J. Research on emergency aid decision-making model for environmental emergency based on case-based reasoning. In Proceedings of the Applied Mechanics and Materials; Trans Tech Publ.: Bach, Switzerland, 2014; Volume 675, pp. 206–212. [Google Scholar] [CrossRef]
  27. Yang, Y.; Ping, Y. An ontology-based semantic similarity computation model. In Proceedings of the 2018 IEEE International Conference on Big Data and Smart Computing (Bigcomp), Shanghai, China, 15–17 January 2018; pp. 561–564. [Google Scholar]
  28. Yu, X.; Li, C.; Zhao, W.X.; Chen, H. A novel case adaptation method based on differential evolution algorithm for disaster emergency. Appl. Soft Comput. 2020, 92, 106306. [Google Scholar] [CrossRef]
  29. Chen, Y.; Zhang, J.; Zhou, A.; Yin, B. Modeling and analysis of mining subsidence disaster chains based on stochastic Petri nets. Nat. Hazards 2018, 92, 19–41. [Google Scholar] [CrossRef]
  30. Liu, Y.; Fan, Z.P.; Yuan, Y.; Li, H. A FTA-based method for risk decision-making in emergency response. Comput. Oper. Res. 2014, 42, 49–57. [Google Scholar] [CrossRef]
  31. Jiang, B.; Chen, T.; Yuan, H.; Fan, W. Emergency decision-making method for rainstorm disasters based on spatiotemporal scenario analyses. Tsinghua Sci. Technol. 2022, 62, 52–59. [Google Scholar]
  32. Chandrasekaran, D.; Mago, V. Evolution of semantic similarity—A survey. ACM Comput. Surv. (CSUR) 2021, 54, 1–37. [Google Scholar] [CrossRef]
  33. Harispe, S.; Ranwez, S.; Janaqi, S.; Montmain, J. Semantic similarity from natural language and ontology analysis. Synth. Lect. Hum. Lang. Technol. 2015, 8, 1–254. [Google Scholar]
  34. Lastra-Díaz, J.J.; Goikoetxea, J.; Taieb, M.A.H.; García-Serrano, A.; Aouicha, M.B.; Agirre, E. A reproducible survey on word embeddings and ontology-based methods for word similarity: Linear combinations outperform the state of the art. Eng. Appl. Artif. Intell. 2019, 85, 645–665. [Google Scholar] [CrossRef]
  35. Ma, G.; Ahmed, N.K.; Willke, T.L.; Yu, P.S. Deep graph similarity learning: A survey. Data Min. Knowl. Discov. 2021, 35, 688–725. [Google Scholar] [CrossRef]
  36. Frisoni, G.; Moro, G.; Carlassare, G.; Carbonaro, A. Unsupervised event graph representation and similarity learning on biomedical literature. Sensors 2021, 22, 3. [Google Scholar] [CrossRef]
  37. Lee, C.H.; Wang, Y.H.; Trappey, A.J. Ontology-based reasoning for the intelligent handling of customer complaints. Comput. Ind. Eng. 2015, 84, 144–155. [Google Scholar] [CrossRef]
  38. Rada, R.; Mili, H.; Bicknell, E.; Blettner, M. Development and application of a metric on semantic nets. IEEE Trans. Syst. Man Cybern. 1989, 19, 17–30. [Google Scholar] [CrossRef]
  39. Aouicha, M.B.; Taieb, M.A.H. Computing semantic similarity between biomedical concepts using new information content approach. J. Biomed. Inform. 2016, 59, 258–275. [Google Scholar] [CrossRef]
  40. Likavec, S.; Lombardi, I.; Cena, F. Sigmoid similarity-a new feature-based similarity measure. Inf. Sci. 2019, 481, 203–218. [Google Scholar] [CrossRef]
  41. Lu, J.; Xue, X.; Lin, G.; Huang, Y. A new ontology meta-matching technique with a hybrid semantic similarity measure. In Advances in Intelligent Information Hiding and Multimedia Signal Processing; Springer: Berlin/Heidelberg, Germany, 2020; pp. 37–45. [Google Scholar]
  42. Pilehvar, M.T.; Navigli, R. From senses to texts: An all-in-one graph-based approach for measuring semantic similarity. Artif. Intell. 2015, 228, 95–128. [Google Scholar] [CrossRef]
  43. Zhou, P.; El-Gohary, N. Semantic information alignment of BIMs to computer-interpretable regulations using ontologies and deep learning. Adv. Eng. Inform. 2021, 48, 101239. [Google Scholar] [CrossRef]
  44. Zeng, Q.; Lu, F.; Liu, C.; Duan, H.; Zhou, C. Modeling and verification for cross-department collaborative business processes using extended Petri nets. IEEE Trans. Syst. Man Cybern. Syst. 2014, 45, 349–362. [Google Scholar] [CrossRef]
  45. Zeng, Q.; Liu, C.; Duan, H. Resource conflict detection and removal strategy for nondeterministic emergency response processes using Petri nets. Enterp. Inf. Syst. 2016, 10, 729–750. [Google Scholar] [CrossRef]
  46. Guo, W.; Zeng, Q.; Duan, H.; Yuan, G.; Ni, W.; Liu, C. Automatic extraction of emergency response process models from chinese plans. IEEE Access 2018, 6, 74104–74119. [Google Scholar] [CrossRef]
  47. Li, S.; Chen, S.; Liu, Y. A method of emergent event evolution reasoning based on ontology cluster and Bayesian network. IEEE Access 2019, 7, 15230–15238. [Google Scholar] [CrossRef]
  48. Chen, X.; Huo, H.; Huan, J.; Vitter, J.S. An efficient algorithm for graph edit distance computation. Knowl.-Based Syst. 2019, 163, 762–775. [Google Scholar] [CrossRef]
  49. Wallis, W.D.; Shoubridge, P.; Kraetz, M.; Ray, D. Graph distances using graph union. Pattern Recognit. Lett. 2001, 22, 701–704. [Google Scholar] [CrossRef]
  50. Dijkman, R.; Dumas, M.; García-Bañuelos, L. Graph matching algorithms for business process model similarity search. In Proceedings of the International Conference on Business Process Management, Ulm, Germany, 8–10 September 2009; Springer: Berlin/Heidelberg, Germany. 2009; pp. 48–63. [Google Scholar]
  51. Bai, Y.; Ding, H.; Bian, S.; Chen, T.; Sun, Y.; Wang, W. Simgnn: A neural network approach to fast graph similarity computation. In Proceedings of the Twelfth ACM International Conference on Web Search and Data Mining, Melbourne, VIC, Australia, 11–15 February 2019; pp. 384–392. [Google Scholar]
  52. Hamilton, W.L. Graph representation learning. Synth. Lect. Artifical Intell. Mach. Learn. 2020, 14, 1–159. [Google Scholar]
  53. Wu, Z.; Pan, S.; Chen, F.; Long, G.; Zhang, C.; Philip, S.Y. A comprehensive survey on graph neural networks. IEEE Trans. Neural Netw. Learn. Syst. 2020, 32, 4–24. [Google Scholar] [CrossRef]
  54. Li, M.; Cao, P. Extended TODIM method for multi-attribute risk decision making problems in emergency response. Comput. Ind. Eng. 2019, 135, 1286–1293. [Google Scholar] [CrossRef]
  55. Yu, F.; Dong, J.; Ye, L. Historical Materials of Storm Surge Disasters in China: 1949–2009; China Ocean Press: Beijing, China, 2015. [Google Scholar]
  56. Jain, S.; Mehla, S.; Mishra, S. An ontology of natural disasters with exceptions. In Proceedings of the 2016 International Conference System Modeling & Advancement in Research Trends (SMART), Moradabad, India, 25–27 November 2016; pp. 232–237. [Google Scholar]
  57. Joshi, H.; Seker, R.; Bayrak, C.; Ramaswamy, S.; Connelly, J.B. Ontology for disaster mitigation and planning. In Proceedings of the 2007 Summer Computer Simulation Conference, San Diego, CA, USA, 15–18 July 2007; pp. 1–8. [Google Scholar]
  58. Meymandpour, R.; Davis, J.G. A semantic similarity measure for linked data: An information content-based approach. Knowl. Based Syst. 2016, 109, 276–293. [Google Scholar] [CrossRef]
  59. Lin, D. An Information-Theoretic Definition of Similarity. In Proceedings of the Fifteenth International Conference on Machine Learning, Madison, WI, USA, 24–27 July 1998; Volume 98, pp. 296–304. [Google Scholar]
  60. Norouzi, M.; Fleet, D.J.; Salakhutdinov, R.R. Hamming distance metric learning. In Proceedings of the Advances in Neural Information Processing Systems, Lake Tahoe, NV, USA, 3–6 December 2012; Volume 25. [Google Scholar]
  61. Khairuddin, S.H.; Hasan, M.H.; Hashmani, M.A.; Azam, M.H. Generating clustering-based interval fuzzy type-2 triangular and trapezoidal membership functions: A structured literature review. Symmetry 2021, 13, 239. [Google Scholar] [CrossRef]
  62. Peng, C.Y.J.; Lee, K.L.; Ingersoll, G.M. An introduction to logistic regression analysis and reporting. J. Educ. Res. 2002, 96, 3–14. [Google Scholar] [CrossRef]
  63. Mikolov, T.; Chen, K.; Corrado, G.; Dean, J. Efficient estimation of word representations in vector space. arXiv 2013, arXiv:1301.3781. [Google Scholar]
Figure 1. Decomposition of events in the spatial dimension in storm surge disaster.
Jmse 10 01218 g001
Figure 2. Sample of storm surge disaster cases.
Jmse 10 01218 g002
Figure 3. Architecture of the similarity model between natural disaster cases.
Jmse 10 01218 g003
Figure 4. The concept of storm surge disaster domain ontology.
Jmse 10 01218 g004
Figure 5. Fuzzy interval affiliation function.
Jmse 10 01218 g005
Figure 6. Sample of storm surge hazard case hierarchy.
Jmse 10 01218 g006
Figure 7. Storm surge disaster cases no. 1 and no. 2.
Jmse 10 01218 g007
Table 1. Storm water increase grade standard.
GradeGrade IGrade IIGrade IIIGrade IVGrade V
Water increase value≥251 cm201∼250 cm151∼200 cm101∼150 cm50∼100 cm
Table 2. Criteria for disaster-forming attribute grades in case scenarios.
GradeGrade IGrade IIGrade IIIGrade IV
Death (missing) people≥100 people31∼100 people10∼30 peopleless than 10 people
Affected population≥2 million people1∼2 million people0.5∼1 million people0.1∼0.5 million people
House collapse≥300,000 houses200,000∼300,000 houses100,000∼200,000 housesless than 100,000 houses
Direct economic lossCNY ≥5 billionCNY 2∼5 billionCNY 1∼2 billion<CNY 1 billion
Crop damage area≥500,000 hectares200,000∼500,000 hectares100,000∼200,000 hectaresless than 100,000 hectares
Exceeded warning tide value≥151 cm81∼150 cm31∼80 cm0∼30 cm
Table 3. Experimental results of similarity performance test in storm surge disaster cases.
Calculation Method of SimilarityExpressionMax ErrorMean ErrorStandard DeviationPearson Correlation Coefficient
Textual information s i m 1 0.78610.24660.18040.7410
Data information s i m 2 0.18270.34470.27850.9046
Case scenario s i m 3 0.23700.61200.49950.9323
Disaster damage s i m 4 0.34360.63210.50590.9352
Case structure s i m 5 0.54360.18570.13200.5623
Case scenario + disaster damage s i m 6 0.21620.34290.31310.9829
Case scenario + case structure s i m 7 0.48320.12070.85500.7945
Disaster damage + case structure s i m 8 0.16660.48820.31190.9659
Aggregation method (ours) s i m 9 0.17600.45280.32900.9886
Word2vec s i m 10 0.52330.15640.11570.6170
GNN s i m 11 0.48430.16100.13620.5901
Table 4. Experimental results of similarity accuracy test in storm surge disaster cases.
Calculation Method
of Similarity
ExpressionRedOrangeYellowBlue
P.R.F.P.R.F.P.R.F.P.R.F.
Textual information s i m 1 71.9754.5262.0463.3851.7356.9768.4557.5962.5573.8063.6368.34
Data information s i m 2 77.2160.4667.8272.2454.7862.3175.1160.4867.0178.3262.8569.74
Case scenario s i m 3 74.7163.8068.8366.1663.3964.7578.1063.9270.3077.6565.5771.10
Disaster damage s i m 4 81.6167.3173.7773.3366.8969.9676.9865.5570.8175.2767.9271.41
Case structure s i m 5 57.3439.2446.5956.6138.4845.8261.3143.6250.9764.9459.8362.28
Case scenario + disaster damage s i m 6 91.7971.0280.0881.8371.0176.0482.5873.8877.9989.4673.0180.40
Case scenario + case structure s i m 7 71.7058.9564.7070.6859.5264.6270.9352.8560.5778.9862.8069.97
Disaster damage + case structure s i m 8 90.7369.3978.6480.0369.2774.2684.8470.1276.7886.8769.5377.24
Aggregation method (ours) s i m 9 92.5479.4285.4882.5374.6478.3985.4177.7881.4290.9476.2082.92
Word2vec s i m 10 86.7164.2173.7880.3260.1768.8076.6861.2468.1077.3563.1869.55
GNN s i m 11 68.7244.6154.1059.4140.9448.4866.5445.1053.7673.2457.3464.32
Table 5. Label information V P of storm surge disaster case no. 1.
Case Attribute Re P Co P
N P _ 1 Disaster levelYellow
N P _ 2 Landing wind speed35 m/s
N P _ 3 Central air pressure970 hPa
N P _ 4 Coastal water increase100 cm
Table 6. Label information V P of storm surge disaster case no. 2.
Case Attribute Re P Co P
N P _ 1 Disaster levelYellow
N P _ 2 Landing wind speed23 m/s
N P _ 3 Central air pressure990 hPa
N P _ 4 Coastal water increase132 cm
Table 7. Label information V I of storm surge disaster case no. 1.
Case Damage Ha I Pr I Da I
N I _ 1 PeopleDeadFour people
N I _ 2 PopulationAffected42,900 people
N I _ 3 HouseLoss3280 rooms
N I _ 4 EconomyLossCNY 1.2106 billion
N I _ 5 CropsAffected203,180 hectares
N I _ 6 Old Town StationExceeds the warning tide value2 cm
N I _ 7 Quarry BayExceeds the warning tide value69 cm
Table 8. Label information V I of storm surge disaster case no. 2.
Case Damage Ha I Pr I Da I
N I _ 1 PeopleDeadTwelve people
N I _ 2 PopulationAffected168,330 people
N I _ 3 HouseLoss321 rooms
N I _ 4 EconomyLossCNY 0.230253 billion
N I _ 5 CropsAffected47,333 hectares
N I _ 6 Xiuying StationExceeds the warning tide value30 cm
Table 9. Label information V M and V L of storm surge disaster case no. 1.
Disaster Damage Ha M Pr M Da M Lo L
N M _ 1 PeopleAffected3,667,800 peopleGuangdong Province
N M _ 2 PopulationEmergency transfer42,900 peopleGuangdong Province
N M _ 3 HouseCollapse3280 roomsGuangdong Province
N M _ 4 AquacultureAffected48,930 hectaresGuangdong Province
N M _ 5 Fishing boatDamageMore than 120 boatsHuilai County, Jieyang City, Guangdong Province
N M _ 6 Fishing boatSankEight boatsHuilai County, Jieyang City, Guangdong Province
N M _ 7 Direct economyLossCNY 1.2106 billionGuangdong Province
N M _ 8 Direct economyLossCNY 0.557 billionShanwei City, Guangdong Province
N M _ 9 Direct economyLossCNY 0.417 billionJieyang City, Guangdong Province
N M _ 10 Direct economyLossCNY 0.1215 billionChaozhou City, Guangdong Province
N M _ 11 PeopleHurtFive peopleHong Kong
N M _ 12 BoatDamageTwo boatsHong Kong
Table 10. Label information V M and V L of storm surge disaster case no. 2.
Disaster Damage Ha M Pr M Da M Lo L
N M _ 1 PeopleDeadFour peopleHainan Province
N M _ 2 PopulationAffected167,590 peopleHainan Province
N M _ 3 HouseDamage321 roomsHainan Province
N M _ 4 BoatDamage34 boatsHainan Province
N M _ 5 FarmlandAffected45,700 hectaresHainan Province
N M _ 6 Cage cultureDamage155 cagesHainan Province
N M _ 7 AquacultureLoss940 tonsHainan Province
N M _ 8 BreakwaterDamage246 mHainan Province
N M _ 9 Bank protectionDamage48 mHainan Province
N M _ 10 RoadDamage900 mHainan Province
N M _ 11 Direct economyLossCNY 0.23 billionHainan Province
N M _ 12 PeopleDead8 peopleGuangxi Zhuang Autonomous Region
N M _ 13 PopulationAffected380 peopleGuangxi Zhuang Autonomous Region
N M _ 14 Fishing boatDamage2 boatsGuangxi Zhuang Autonomous Region
N M _ 15 FarmlandFlooded1633 hectaresGuangxi Zhuang Autonomous Region
N M _ 16 Direct economyLossCNY 0.03 billionGuangxi Zhuang Autonomous Region
Publisher’s Note: MDPI stays neutral with regard to jurisdictional claims in published maps and institutional affiliations.

