Article

Effect of Variation in the Mass Ratio on Vortex-Induced Vibration of a Circular Cylinder in Crossflow Direction at Reynold Number = 104: A Numerical Study Using RANS Model

1
School of Mechanical & Manufacturing Engineering, National University of Sciences and Technology (NUST), Islamabad 44000, Pakistan
2
Electrical Engineering Department, Princess Nourah bint Abdulrahman University, Riyadh 11564, Saudi Arabia
3
Department of Civil Engineering, College of Engineering, King Khalid University, Abha 62529, Saudi Arabia
4
Mechanical Engineering Department, College of Engineering, University of Bahrain, Isa Town Campus, Kingdom of Bahrain, Sakheer P.O. Box 32038, Bahrain
5
Mechanical Engineering Department, College of Engineering and Islamic Architecture, Umm Al-Qura University, Makkah 21955, Saudi Arabia
6
Department of Mechanical Engineering, College of Engineering in Wadi Alddawasir, Prince Sattam Bin Abdulaziz University, Al-Kharj 16273, Saudi Arabia
7
Production Engineering and Mechanical Design Department, Faculty of Engineering, Mansoura University, Mansoura 35516, Egypt
*
Author to whom correspondence should be addressed.
J. Mar. Sci. Eng. 2022, 10(8), 1126; https://doi.org/10.3390/jmse10081126
Submission received: 6 May 2022 / Revised: 31 July 2022 / Accepted: 9 August 2022 / Published: 17 August 2022
(This article belongs to the Special Issue Strength of Ship Structures)

Abstract

:
This study reports on the numerical analysis of the impact of mass ratio on the Vortex-Induced Vibration (VIV) phenomenon of an elastically rigid cylinder, oscillating freely in a crossflow direction. Reynolds-averaged Navier–Stokes (RANS) equations with (k-ω SST) model were used to analyze the flow behavior, amplitude ratio and vortex shedding patterns. The study was performed at constant Reynold number (Re) = 104 with reduced velocity (Ur) ranging from 2 to 14 and mass ratio (m*) of 2.4 and 11. The mass ratio was defined as the ratio between mass of the vibrating cylinder and mass of the fluid displaced. It was found that increasing the mass ratio from 2.4 to 11 resulted in decrease in amplitude response by 80%, 71% and 31% at initial branch, upper to lower transition region and lower branch, respectively. However, the amplitude in the upper branch decreased only 8% at high mass ratio. The peak amplitude observed in the present study was lower than previous experimental and DES results. However, the RANS k-ω SST well captured the vortex shedding modes of 2S, 2P, P + S, and 2T. In 2S mode, two single pairs of vortices were formed, whereas in 2P mode two pairs were generated in single oscillation. Similarly, P + S meant one pair and one individual vortex; whereas 2T mode meant two triplets of vortices generated in one oscillation. The study concluded that increase in mass ratio results in shortening of the lock-in region and decrease in amplitude response.

1. Introduction

Fluid-structure interaction phenomenon around a circular cylinder is a highly researched topic, due to its applications in extraction of oil and gas engineering where pipelines and risers are modeled as circular cylinders. The recent trend of extracting the oil from the deep sea and the construction of skyscrapers and bridges in windy areas have diverted the attention of researchers to accurately predicting the fluid forces at the design stage and calculating the vibrations generated because of these forces. With the continuous advancement in computational fluid mechanics, the recent trend has shifted from experimental testing and analysis to the utilization of CFD tools to reduce the cost of the prototype. In this regard, numerous researchers have performed numerical analyses to investigate the VIV phenomenon and to predict flow behavior at different design conditions. When a structure is exposed to fluid flow, periodic vortices are shed in the wake region. If the structure is elastically mounted in the fluid flow, the structure vibrates because of this complicated fluid-structure interaction, which is commonly known as VIV.
Sarpkaya [1], Breuer [2], and Bearman [3] performed an extensive study to understand the phenomena of vortex-induced vibrations. These reviews clarified that amplitude response is highly susceptible to Reynolds number inside the laminar flow regime. However, limited data is available at high subcritical (Re = 300 < Re < 3 × 10⁵) regions and at the critical Reynolds number region. LES, RANS, and DNS techniques are mainly used in the case of turbulent flow. RANS is an emerging technique, due to its low computational cost and acceptable results. Limited studies are available on VIV in circular cylinders at higher Reynolds numbers, whereas extensive research has been carried out at the laminar regime with low mass ratios. Placzek et al. [4] studied the vortex shedding mode at low Re using 2D RANS code. Zhao [5] studied the VIV in the Re range of Re =150 to 1000. Niaz [6] et al. performed a study at Re = 3900 around a fixed structure using the sub-grid-scale model with LES code. Khalak and Williamson [7] performed experimental studies in the Reynolds number range Re = 1700 to 12,000 and classified the vibration response into different branches. Guilmineau and Queutey [8], Pan [9], and Wei Li [10] conducted numerical studies to validate experimental results available in literature [7]. However, despite accurately predicting the transition of vortex-shedding mode, their studies could not exactly compute the maximum amplitude response. Nguyen [11] performed a study using DES to validate experimental work done by Hover [12] and showed good agreeability with experimental results. Niaz [13] et al. performed a numerical study using a computationally less expensive RANS SST-kw turbulent model at a low mass ratio and high Reynolds number (104).
The mass ratio of a bluff body significantly influences the flow behavior and VIV phenomenon. A review study by Williamson and Govardhan [14] presented the impact of mass ratio in synchronization conditions, and investigated the influence of mass ratio on the dominant frequency and the highest response captured at upper and lower branches. Stappenbelt [15] conducted a physical experiment to find that with decreasing mass ratio, the lock-in region was widened, and transverse amplitude response increased. Bahmani and Akbari [16] performed 2D simulations to study the variation in mass ratio and damping ratio (ζ) in the laminar regime (80 < Re < 160). They found that the results agreed well with the literature where an increase in m* ζ (by either varying m* or ζ) decreased the peak amplitude response with a shortened lock-in regime. Alireza modir [17] et al. performed an experimental study at high Re range and high damping system for low mass ratios of (m* = 1.6, 2.3, and 3.4) and found significant influence on the amplitude response and lock-in regime. A decrease in the m* results in the maximum VIV response and the synchronization range widens at higher Re. Pigazzini [18] et al. conducted a study with URANS code at order of Re = 104 to analyze the mass impact on the VIV behavior of the 1DOF multi-frequency system. The study gave a profound insight into the characteristics of vortex-induced vibrations in transverse directions. This study focused only on a limited number of mass ratios and an 1DOF vibrating system. Zhao [19] et al. experimentally analyzed the influence of mass ratio in a square cylinder in the Reynolds number range of 1000 < Re < 12,300 on the crossflow VIV response for three angles of attack, α = 0°, 20°, and 45°. It was found that at α = 0°, the VIV galloping response decreased with an increase in mass ratio, while for m* ≥ 11.31, it completely diminished. For α = 45°, there was only a marginal reduction in the peak response & for α = 20°, and after critical mass ratio m* = 3.5, there were no higher branch subharmonic VIV. Tang and Zhou [20] analyzed the impact of mass ratio (2 ≤ m* ≤ 10) at four angles of attack i.e., α = 0°, 10°, 22.5°, and 45°. Chen, Marzocca [21] et al. studied the VIV phenomenon at moderate Reynolds numbers (within the range 1155 through 6934). Navrose and Sanjay Mittal [22] investigated the VIV phenomenon with different mass ratio in the laminar flow regime. More recently, Kinaci [23] investigated the free surface effect on the VIV phenomenon having single degree of freedom. The authors combined the experimental and numerical results from different mass ratios at six different depths. Tao [24] utilized the immersed boundary method with high mass ratio and laminar regime to investigate the VIV phenomenon. The authors concluded that mass ratio had minor impact on amplitude, but variation in damping ratio could not be neglected. Zhang [25] studied the impact of damping model on the VIV response. Lin et al. [26,27] studied the impact of flexibility on a circular cylinder in marine application. The authors analyzed the flow around rigid and flexible cylinders to study the flow characteristics. The impact of cross-sectional area and materials were presented in the study. Zhang et al. [28] utilized the hybrid FEM-DNS to predict the VIV response under oscillatory flow. The results were verified with experimental results available in literature. The authors incorporated the impact of KC number, flow velocity and other flow characteristics. Salhi et al. [29] studied the thermo-fluid behavior of fluid in a rectangular channel having inclined baffles at Reynolds number range of 10,000 to 87,300. Kurishina et al. [30] used different oscillator models to investigate the VIV response. The authors also discussed the mechanism and behavior of damping. Niaz et al. [31,32,33] investigated the flow characteristics around a circular cylinder at various Reynolds numbers.
The main objective of this paper is to numerically analyze the effects of variation in mass ratios on vibration modes, crossflow amplitude, and lock-in region of a cylinder. Also, the performance of the RANS kw-sst model for predicting the VIV phenomenon is reported on. Numerical analyses were carried out using the ANSYS tool [34]. This study was conducted on a smooth circular cylinder with mass ratios of 2.4 and 11. Low mass ratio (2.4) applications are commonly available in marine field, whereas high mass ratio cases are found in high rise buildings. The behavior of both cases are entirely different and need to be investigated.

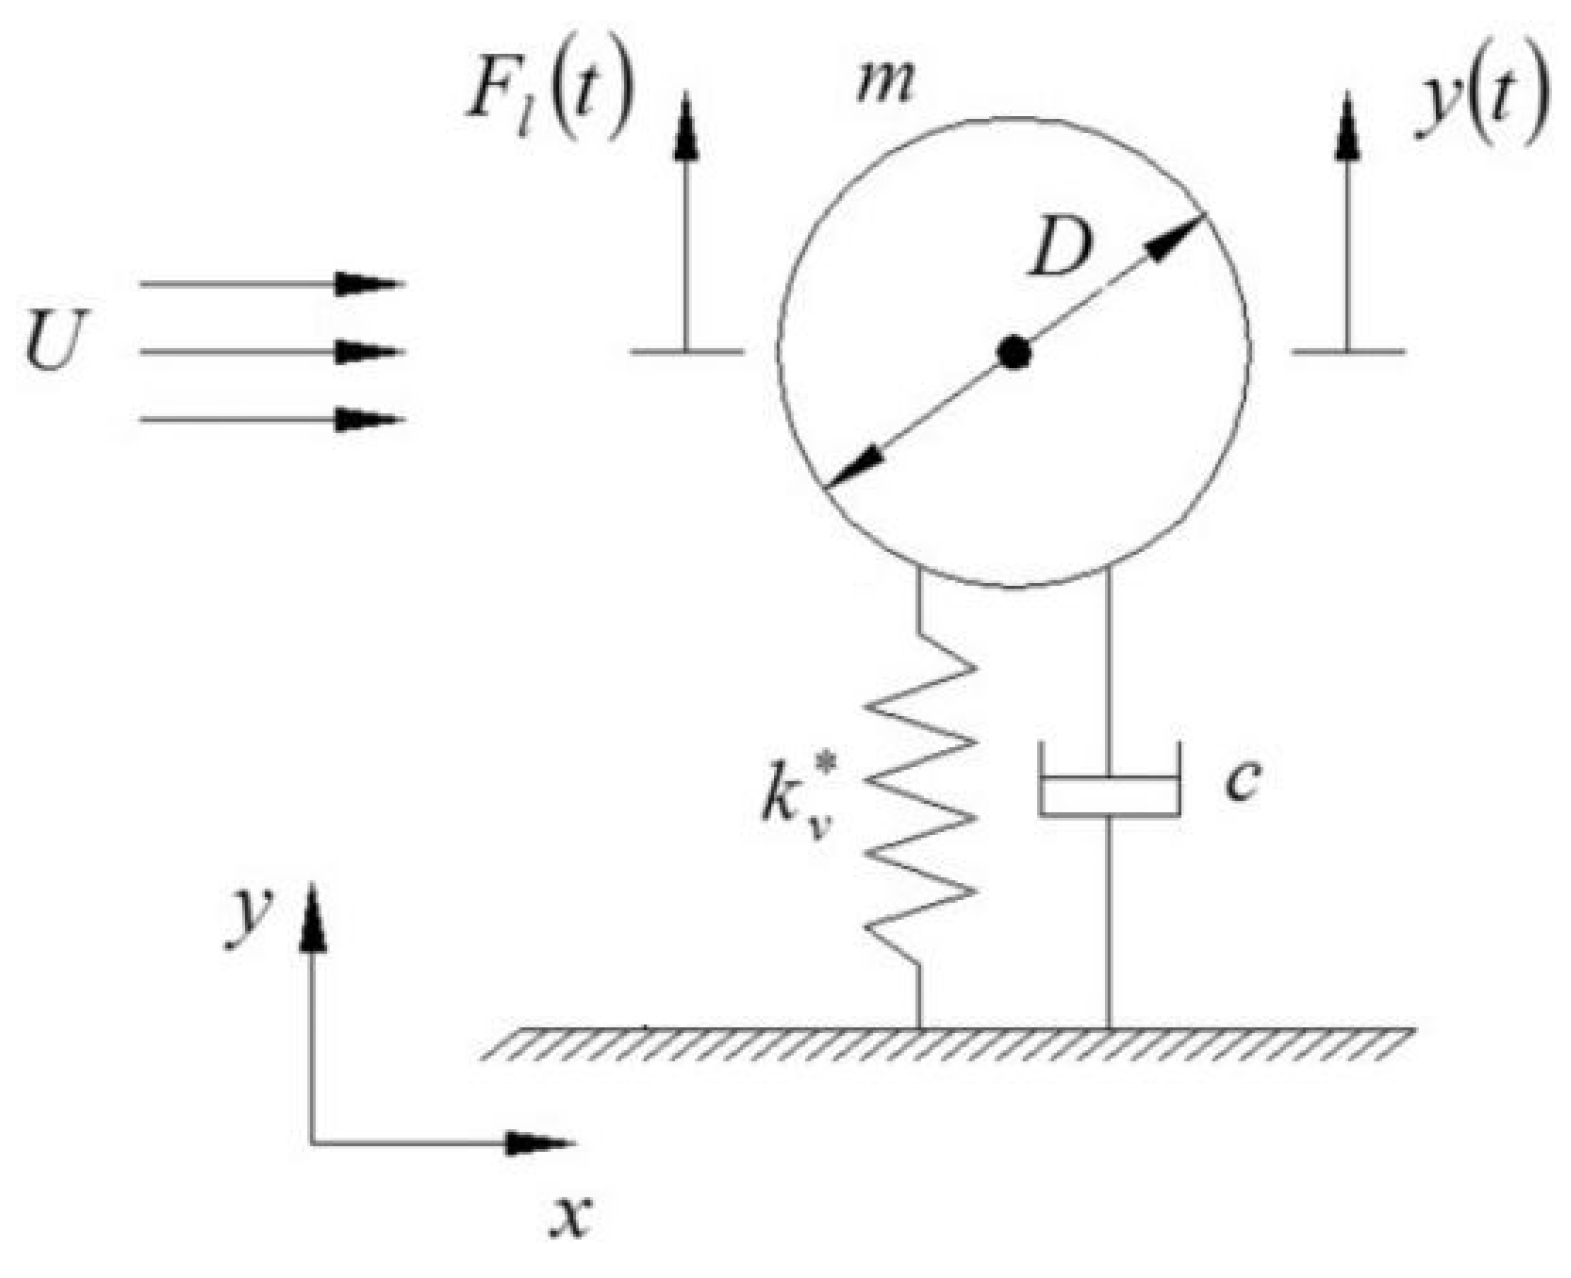
2. Numerical Approach

The flow was considered to be incompressible, 2D, and unsteady in this study. The incompressible RANS equations were utilized to simulate the flow using the ANSYS Fluent tool. The details of the numerical model can be found in [13]. All the input parameters (Velocity, density etc.) were assigned values which corresponded to a Reynold’s Number of 10,000.
For simulation of the vibrating cylinder, the cylinder was considered to be a mass-spring damping system consisting of m (mass), k (stiffness), and c (damping), as shown in Figure 1. The motion generated in the crossflow direction because of fluid forces acting on the cylinder could be expressed mathematically as:
m y ¨ + c y ˙ +   Ky   =   F y
The acceleration was computed by resolving all the external elastic forces acting on it. Displacement and velocity were calculated accordingly at each timestep. The motion of the center of gravity is mathematically expressed as:
v ˙ G = 1 m Σ f G
here v ˙ G is the acceleration, m is the mass and fG symbolizes all the acting forces. After applying on the rigid cylinder:
y ¨ = 1 m Σ f G = F y c y ˙ ky m
where y is the displacement, y ˙ is the velocity, y ¨ is the acceleration at each timestep, Fy is the fluid force and c y ˙ and ky are the acting elastic forces. The position of the rigid body was calculated and updated at each timestep by the dynamic mesh method from velocity.
The velocity at each time step is:
y ˙ n = y ¨ n 1 Δ t

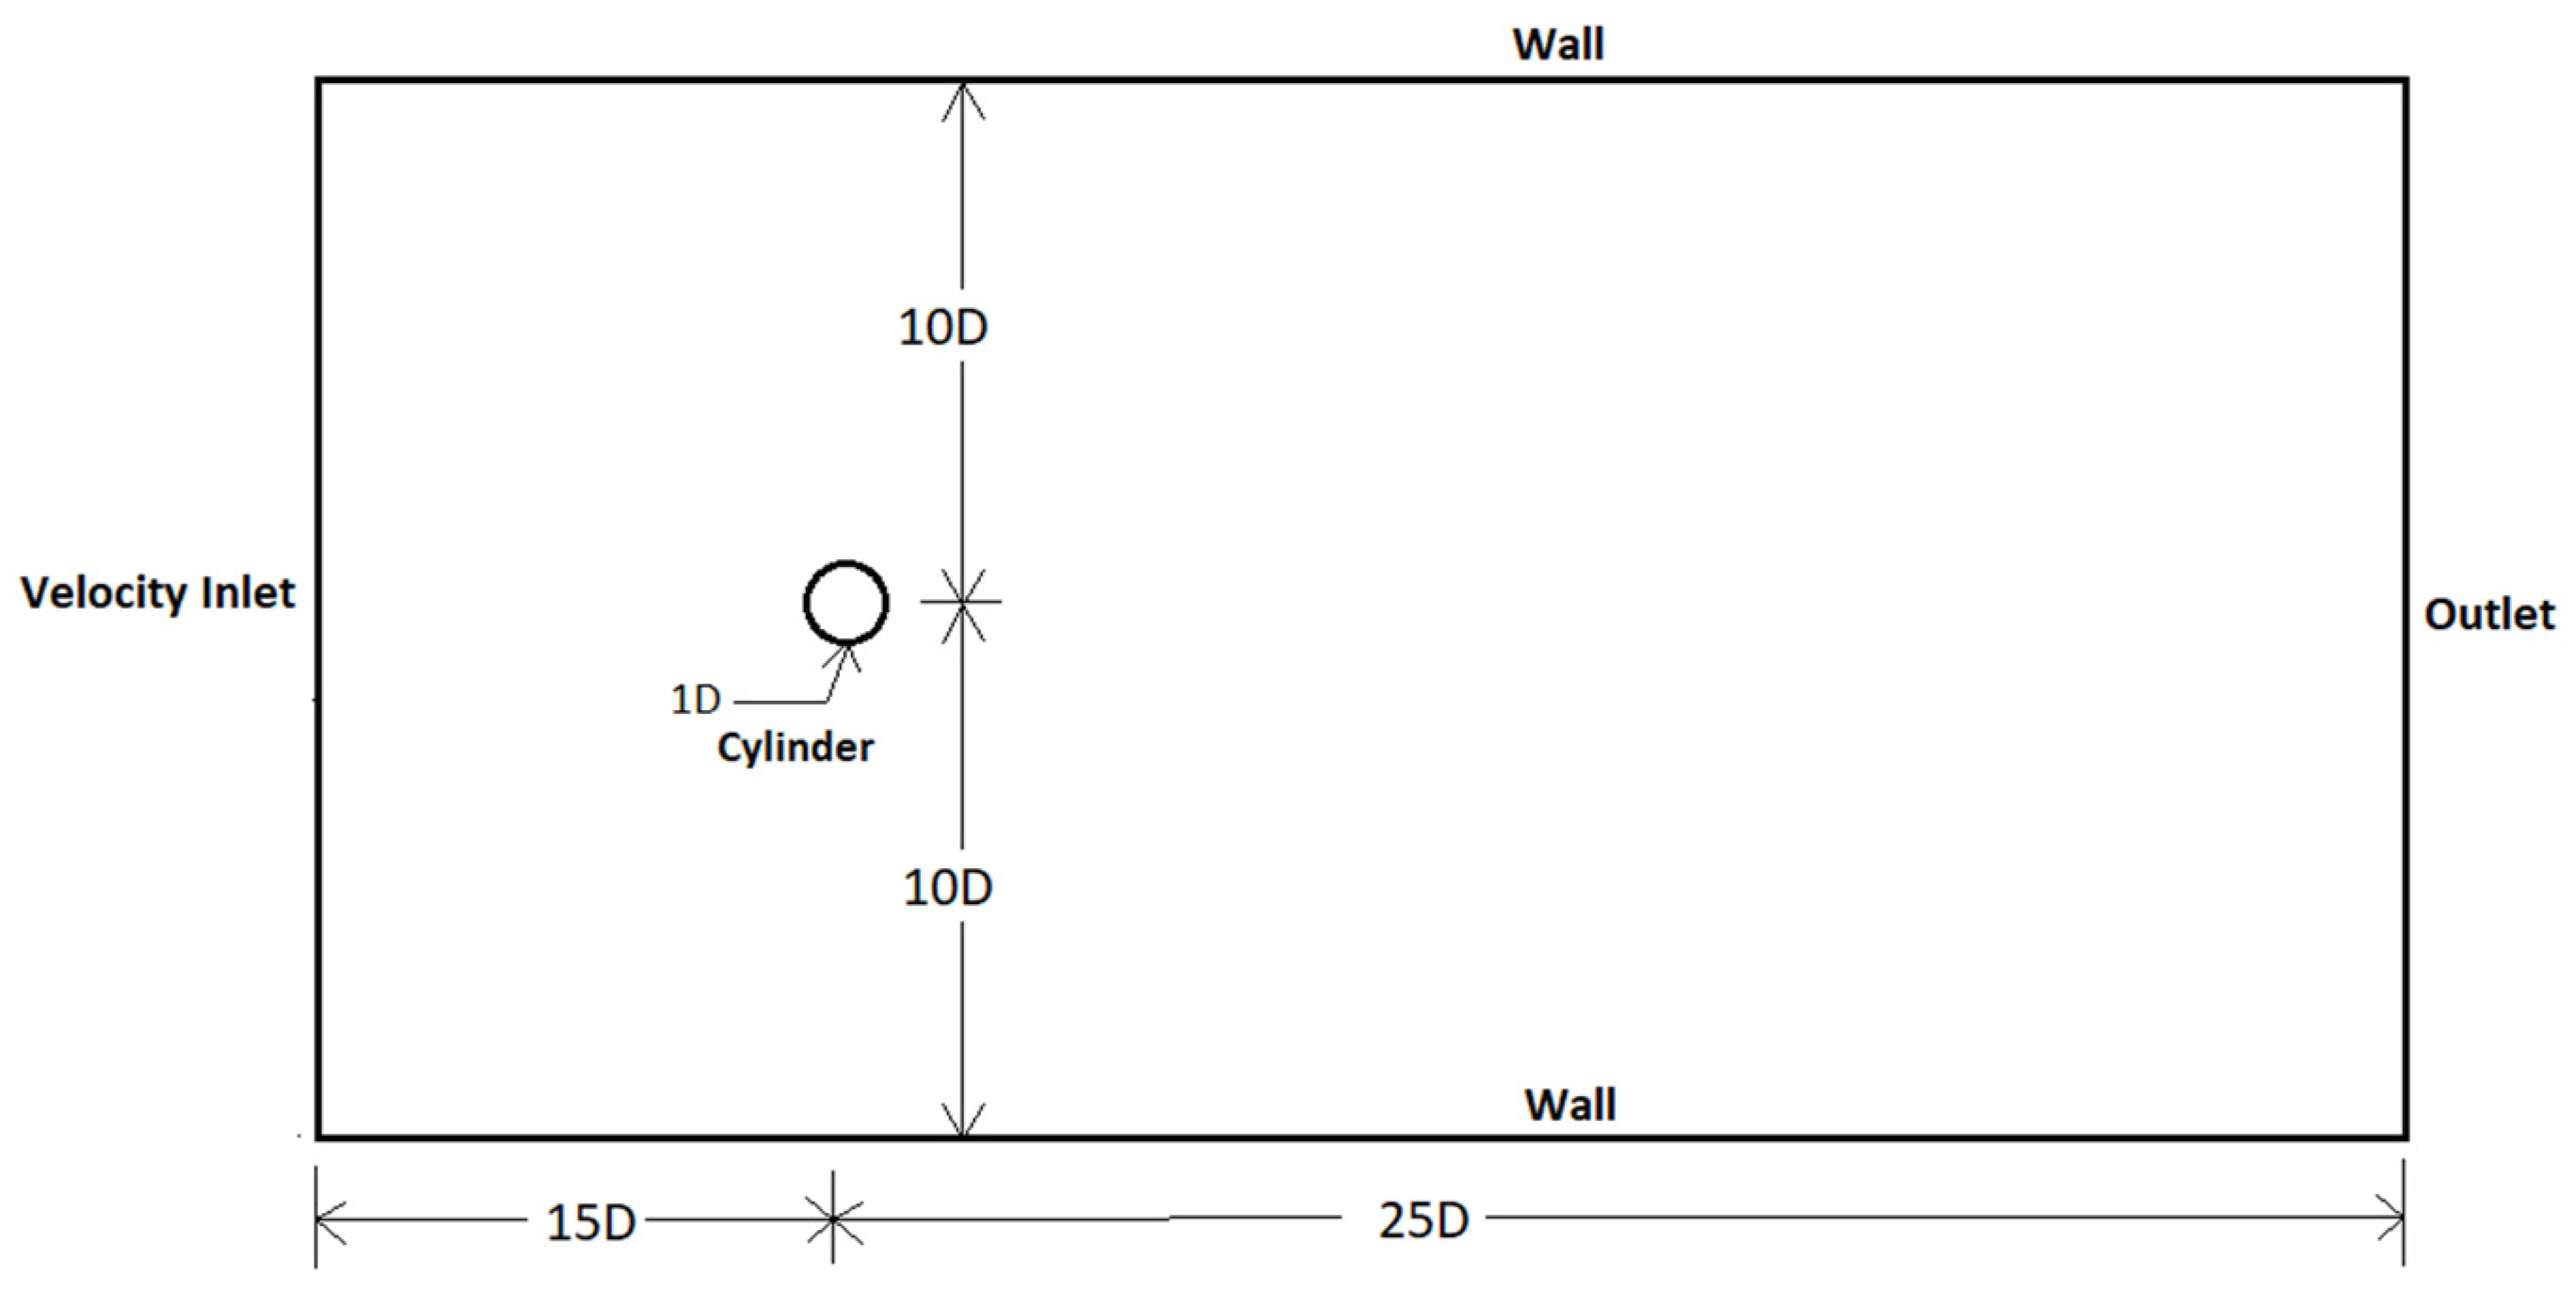
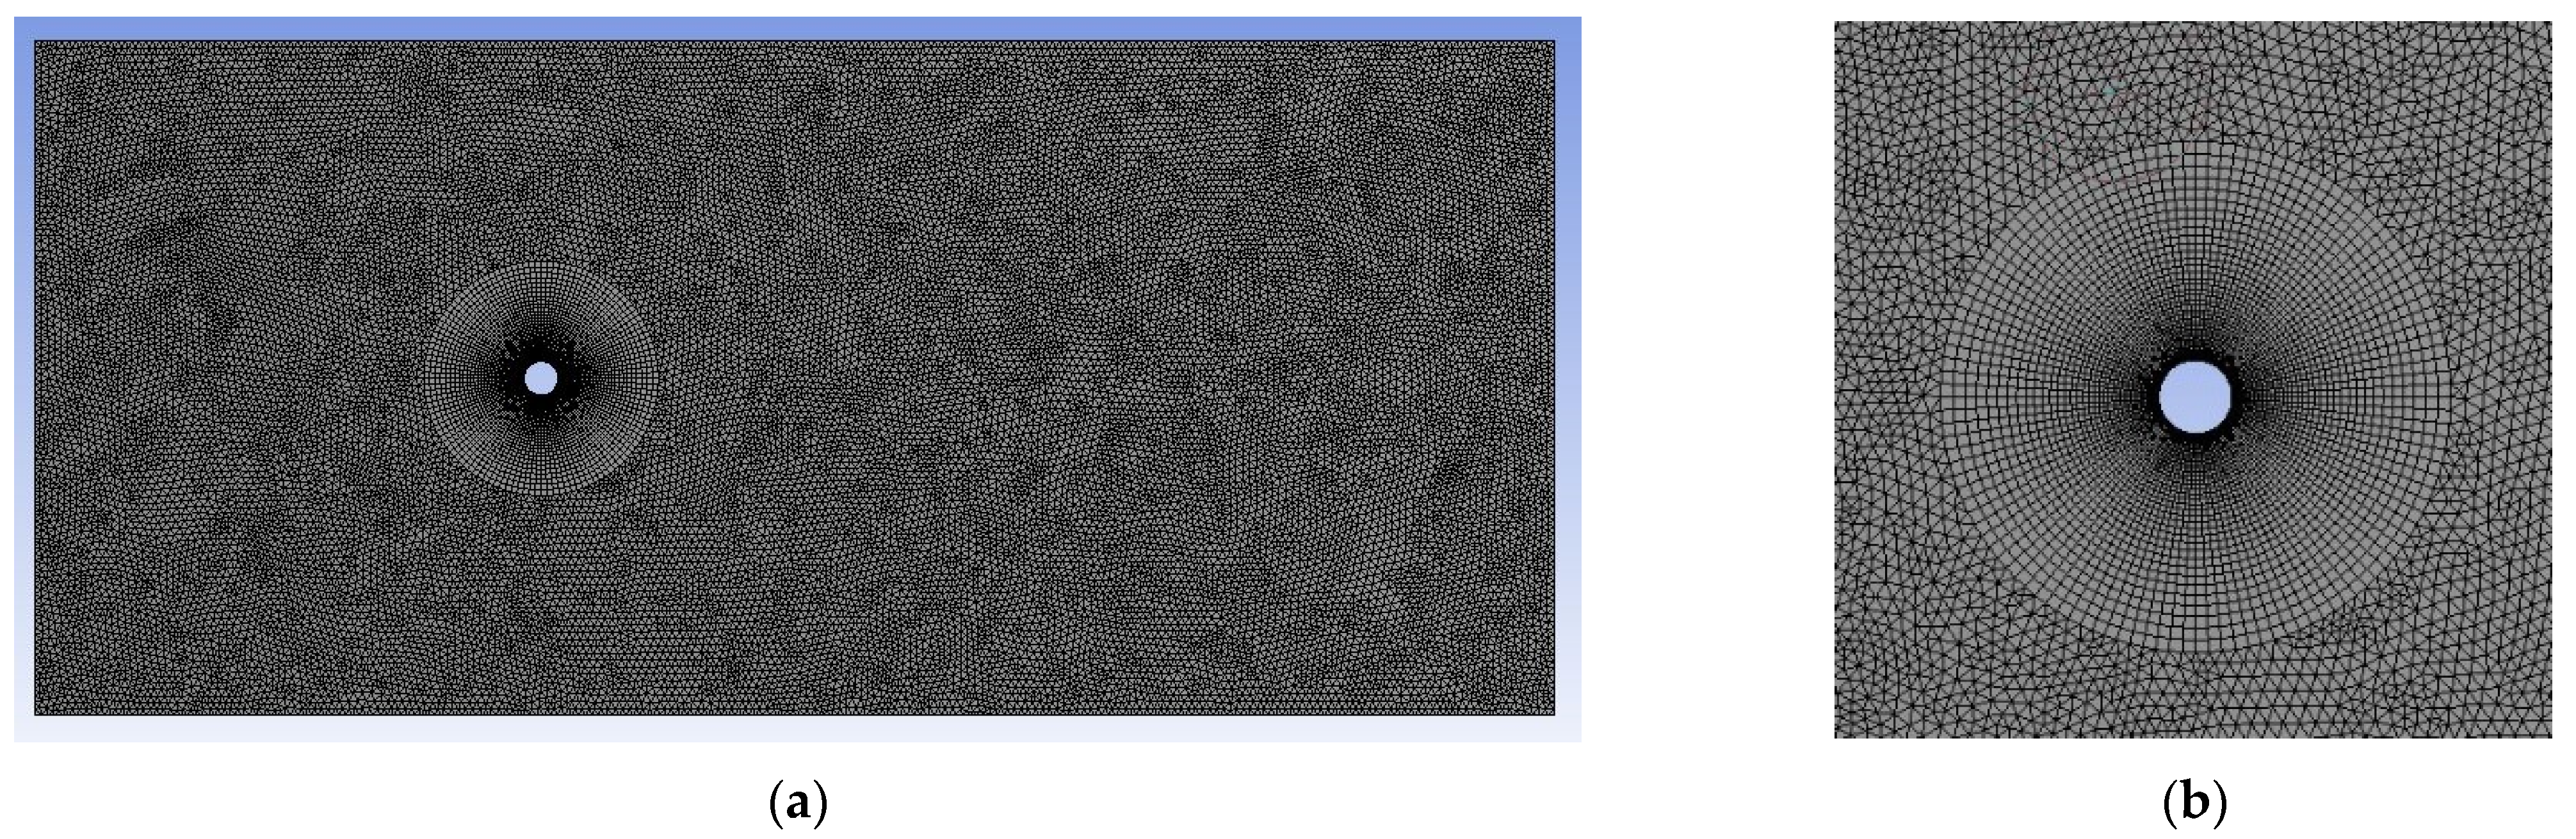
3. Computational Domain and Mesh

Literature reviews depict that size of the flow domain strongly affects the fluid flow behavior. Several researchers used different sizes of flow domains. Shao [35]’s numerical study utilized the domain size of 30D × 16D. While investigating the hydrodynamic forces, Fang and Han [36] used a domain size of 8D in the traverse direction. Franke and Frank [37] performed a numerical study using the LES model with the working domain of 25D × 20D. In past studies, it was observed that a smaller domain size significantly affects the formation of vortices behind the cylinder, so, a sufficiently large flow domain size is preferred to diminish the resulting disturbances from boundary conditions.
Zdravkovich [38], Mittal [39], and Zhao [40] concluded, from their work, that impact of boundary diminished significantly by keeping the blockage ratio up to 5%. Therefore, the current study used a domain of 45D × 20D which met the criteria (Figure 2).
The inlet was kept at 15D from the cylinder, whereas the outlet boundary was at a distance of 30D from the cylinder. The upper and lower walls of the flow domain were maintained at 10D from the center of the cylinder. In this research work, all the important parameters were dimensionless and independent of geometry size, boundary conditions, and fluid properties [11,12].
In all case studies, the region around the cylinder was meshed using structured quadrilateral elements, whereas the remaining region used triangular elements, as shown in Figure 3. The mesh was developed in such a way that the region around the wall of the cylinder hac a very fine mesh, whereas the region far away from the cylinder had a coarse mesh. Figure 3a,b represent the mesh and mesh closeup view near the cylinder. The non-dimensionless distance from the first mesh node to the cylinder, known as the y+ value, was kept at less than unity so as to accurately solve the flow.
Grid independency tests were performed at Re = 10,000, m = 11, Ur = 5.84 and ζ = 0. (Table 1). These grid independency tests were performed at different grid resolutions. It was observed that M3 mesh was the most optimum mesh and further refinements had no significant effect on capturing the cylinder response.
To ensure the y+ value of unity, the first mesh layer height was placed at 0.0014 from the cylinder in all the simulations. Timestep was calculated by maintaining the courant number below 1. Courant number is defined as C = uΔt/Δx, where Δx is the distance of the first node from surface of cylinder in the radial direction.

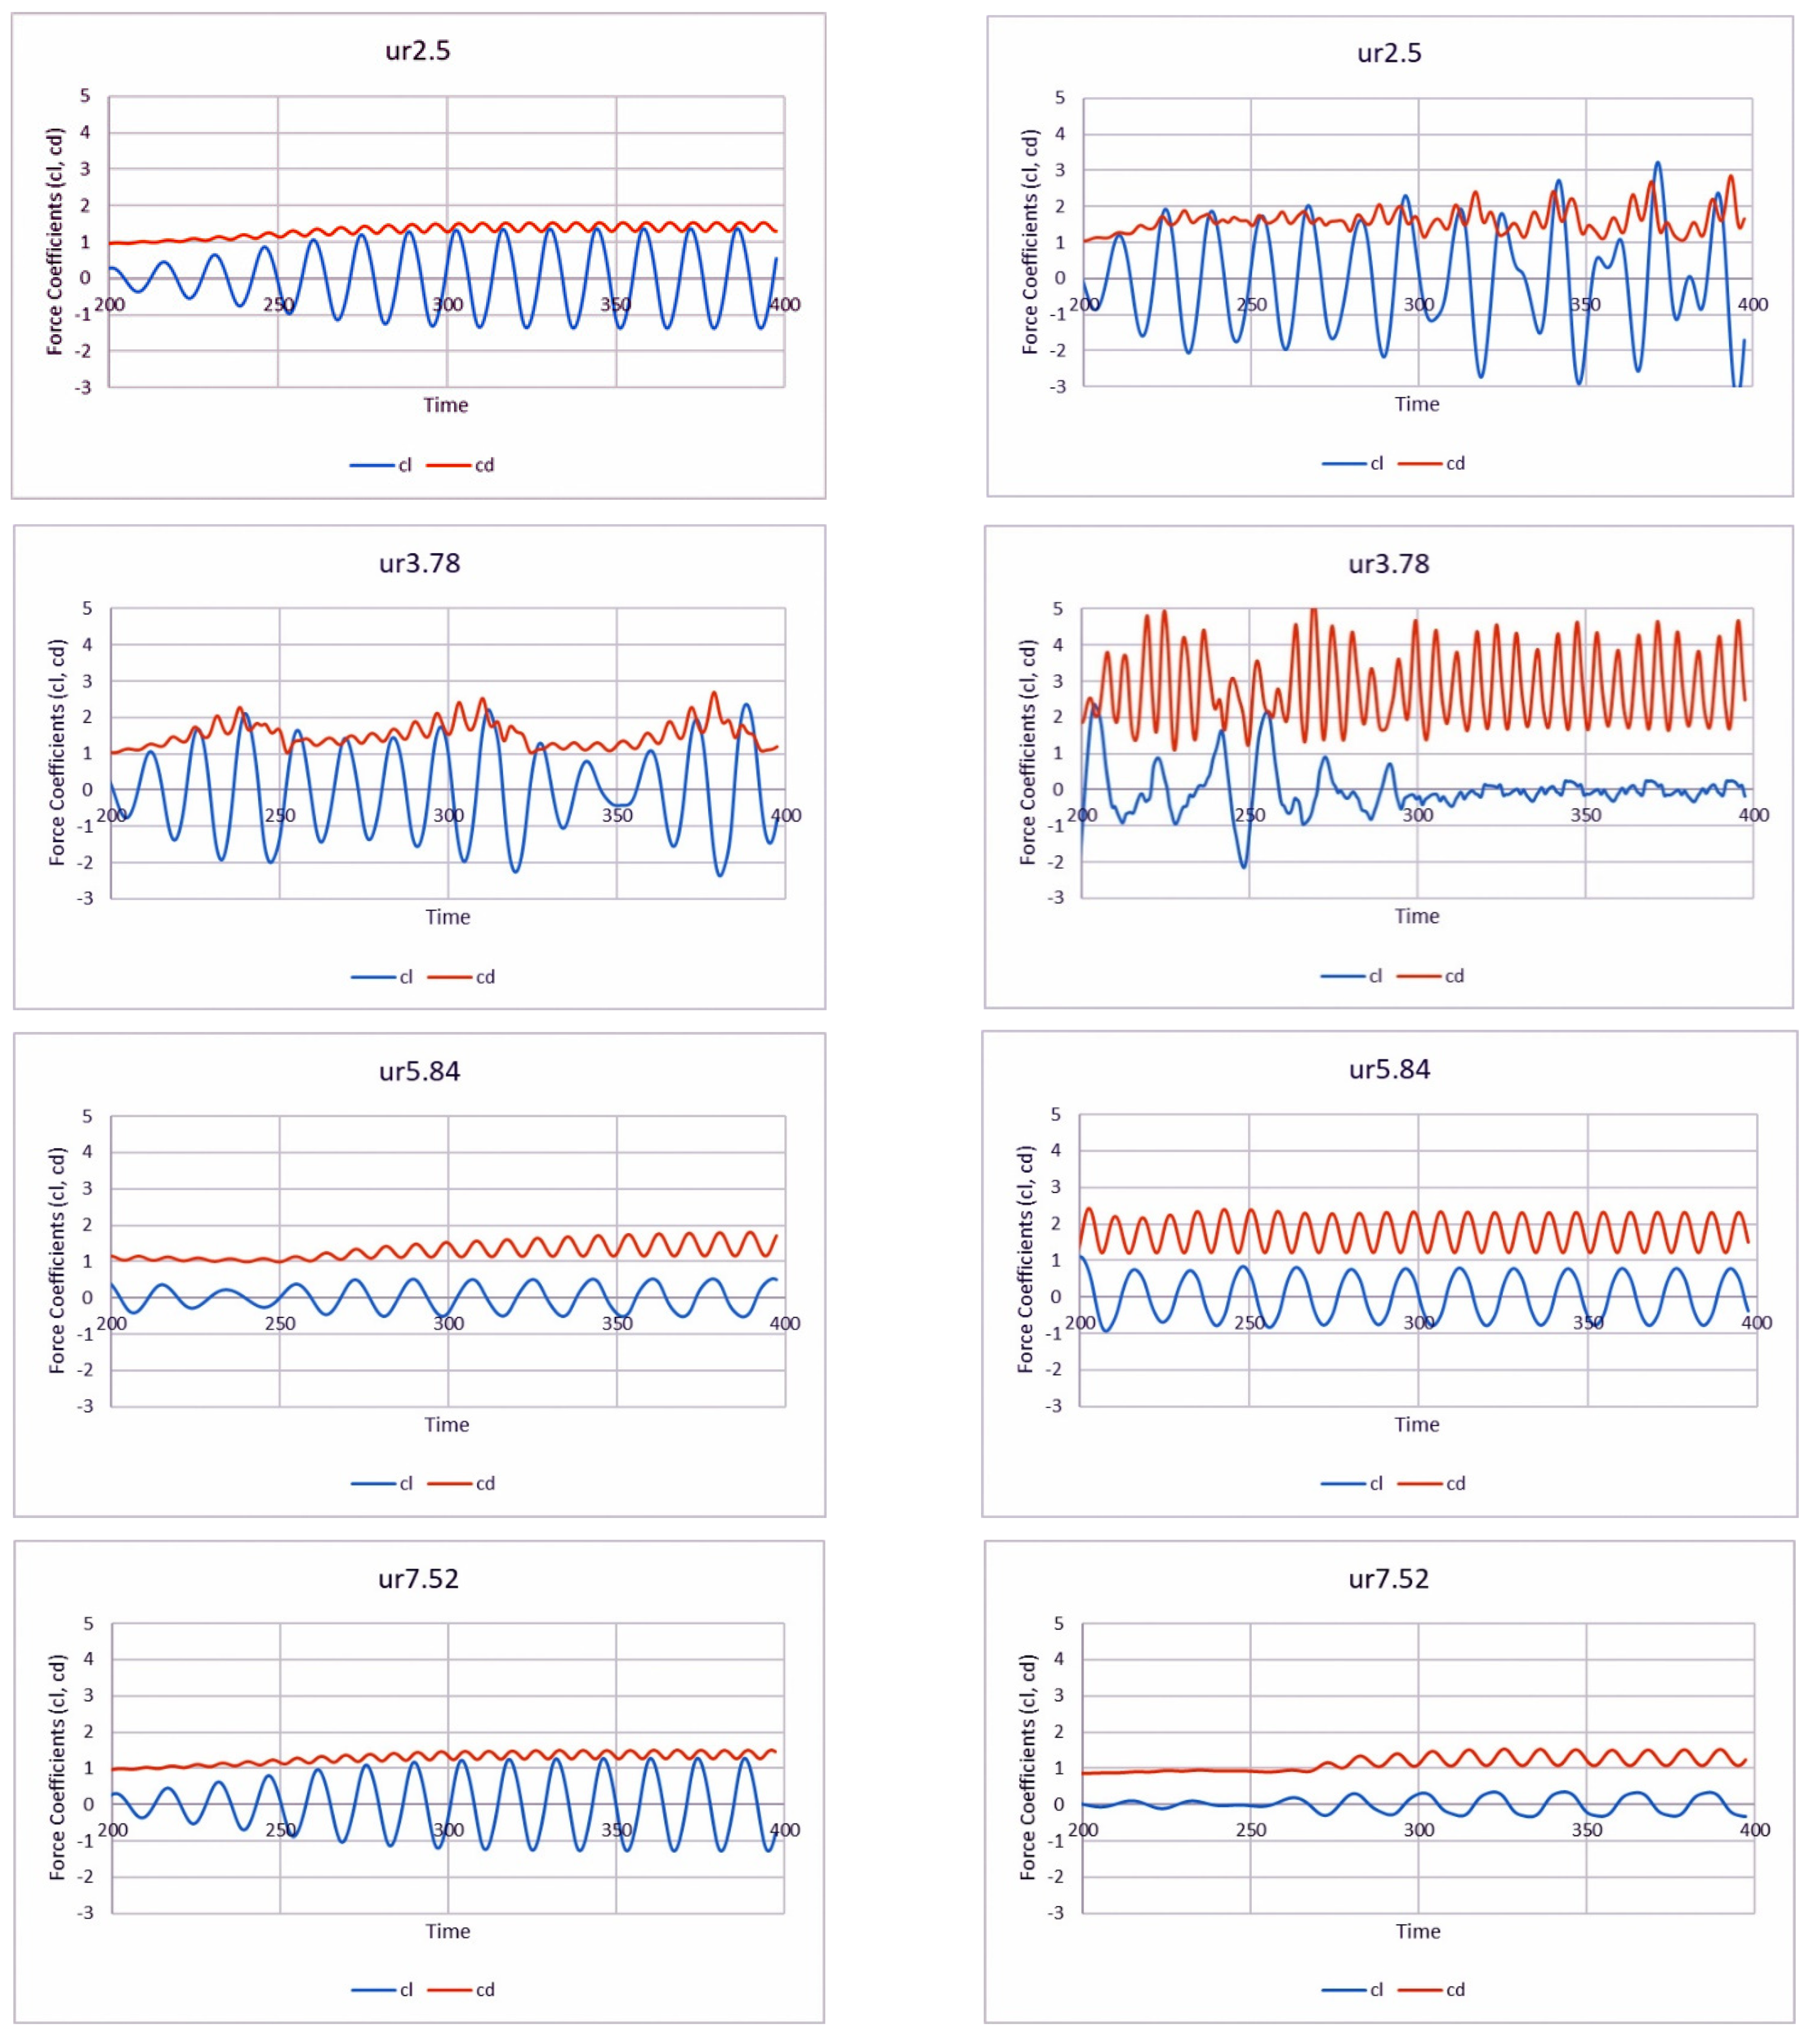
4. Results & Discussion

Smooth Circular Cylinder with Mass Ratio, m* = 11

Numerical analyses were performed with mass ratios 11 and 2.4 for reduced velocities of Ur = 2.5, 3.78, 5.84, 7.52, 8.77 & 11. The impact of variation in mass ratio at different reduced velocities on hydrodynamic forces (Cd and Cl, Figure 4), vortex shape (Figure 5), and amplitude responses in cross-flow direction (Ay/D) (Figure 6) are discussed. The vortex shedding induced periodic displacement, resulting in the various wake patterns [14]. Figure 4 shows a weak correlation between drag and lift coefficient, due to the fact that the analysis was performed using a 2D model. It was also observed that a high value of drag was reported at the reduced velocity of 3.78 and 5.84, which lay within the lock-in region. However, the magnitude of drag forces was comparatively smaller in the case of high mass ratio (Figure 4a). In both cases, smaller drag coefficients were found outside the lock-in region, which was the same behavior reported earlier in literature [41].
Figure 5 and Figure 6 show a comparison between vortex shapes captured at high and low mass ratios and associated amplitude ratios in crossflow direction at different reduced velocities. At high mass ratio m* = 11, smaller amplitude ratio (Ay/D = 0.045) in the crossflow direction was captured. This regime lay within the initial branch. At Ur = 3.78, a significant increase in amplitude (Ay/D = 0.22) was captured which was high in comparison to the results reported by Hover [12] and Nguyen [11] (Figure 6). A 2S vortex mode was observed in the wake region at Ur = 3.78, which was also reported earlier [13].
The maximum value of amplitude response was observed to be Ay/D = 0.67 at Ur = 5.84 which lay in the upper branch. At upper branch, vortex of 2P mode was found as shown in Figure 5, which was also reported by Williamson and Govardhan [14]. This 2P vortex mode has already been recorded by Nguyen [11] and Niaz [13]. In the upper branch, higher values of drag were observed which can be seen in Figure 4. This agreed well with the results of Bishop and Hassan [41]. At Ur = 7.52, the amplitude response was observed to be very small (Ay/D = 0.15) in comparison to the results reported by Hover [12]. With an increase in reduced velocity to Ur = 8.77, the amplitude response decreased to a small value of Ay/D = 0.1, which was also a little lower in comparison to the results reported by Hover [12] and Nguyen [11]. Vortex mode of 2S was observed in the wake region at both Ur = 7.52 and Ur = 8.77, which agreed well with the literature recorded by Niaz [13]. At Ur = 11, the amplitude response was observed to be very small (Ay/D = 0.04), which agreed well with the results reported by Hover [12]. It was observed that at the initial branch and lower branch, where amplitude response was very small, drag forces also appeared to have very small values, which agreef well with the literature. Bishop and Hassan [41] observed high drag forces in the lock-in region, which were significantly reduced in the synchronization region.
At mass ratio m* = 2.4 and Ur = 2.5, the cylinder response was observed to be (Ay/D = 0.23) which was relatively high in magnitude, compared to high mass ratio amplitude. At Ur = 3.78, a significant increase in amplitude response (Ay/D = 0.62) was measured, which was relatively very high in comparison to the response observed for m* = 11 in the previous case. Pan [9] reported amplitude response of Ay/d = 0.30 and a 2S vortex shedding mode at m* = 2.4 (Ur = 3.93, Re = 3400). Higher amplitude response and P + S vortex mode were observed in the wake region at Ur = 3.78, Re = 10,000 comprising one pair and one single vortex shedding into the wake occur during each half cycle (Figure 5).
A very high drag response was observed (Figure 4), which agreed well with the literature, as reported by Bishop and Hassan [41]. At Ur = 5.84, the maximum value of amplitude response was observed to be Ay/D = 0.73, which lay in the upper branch, and the amplitude response was very high in comparison to the case study at m* = 11. This behavior showed good agreement with the literature and has been already reported by Stappenbelt [15] and Alireza Modir [17].
The maximum amplitude response for Ur = 5.84 can be seen in Figure 6, whereas Figure 5 shows the 2P vortex mode. In the upper branch, higher values of drag were observed (Figure 4). This agreed well with the literature and has been reported by Bishop and Hassan [41].
At Ur = 7.52, the amplitude response was observed to be (Ay/D = 0.53) which was very high in comparison to the amplitude response at m* = 11. Vortex mode of 2P was observed in the wake region at Ur = 7.52, as shown in Figure 5, which was due to a high amplitude response, as suggested by Williamson and Govardhan [14]. With an increase in reduced velocity to Ur = 8.77, the amplitude response decreased to a small value of Ay/D = 0.165.
Vortex mode of 2T was observed in the wake region at Ur = 8.77 which agreed well with the literature. This vortex mode consisted of triplet vortices that formed in each half-cycle, as shown in Figure 5. High drag forces were observed at both Ur = 7.52 and Ur = 8.77, as shown in Figure 4. At Ur = 11, the amplitude response was observed to be very small (Ay/D = 0.058), which was almost the same in magnitude as reported in mass ratio m* = 11. It was observed that at reduced velocities, where amplitude response was very small, drag forces also appeared to have very small values, which agreed well with the literature. Bishop and Hassan [41] also reported high drag forces at the lock-in region and low drag forces out of the lock-in region.
In comparison with mass ratio (m* = 11), it was found that with decrease in mass ratio, the lock-in region widened and a significant rise in the cylinder amplitude response was reported, as shown in Figure 6. This behavior has been reported earlier by Stappenbelt [15] and Alireza Modir [17]. The results showed good agreement with the literature.

5. Conclusions

The paper presented the impact of mass ratio on the VIV phenomenon, for a smooth circular cylinder that was free to oscillate in the traverse direction at a reduced velocities range (Ur = 2 to 14) with Reynolds number fixed at Re = 104. The study concluded that:
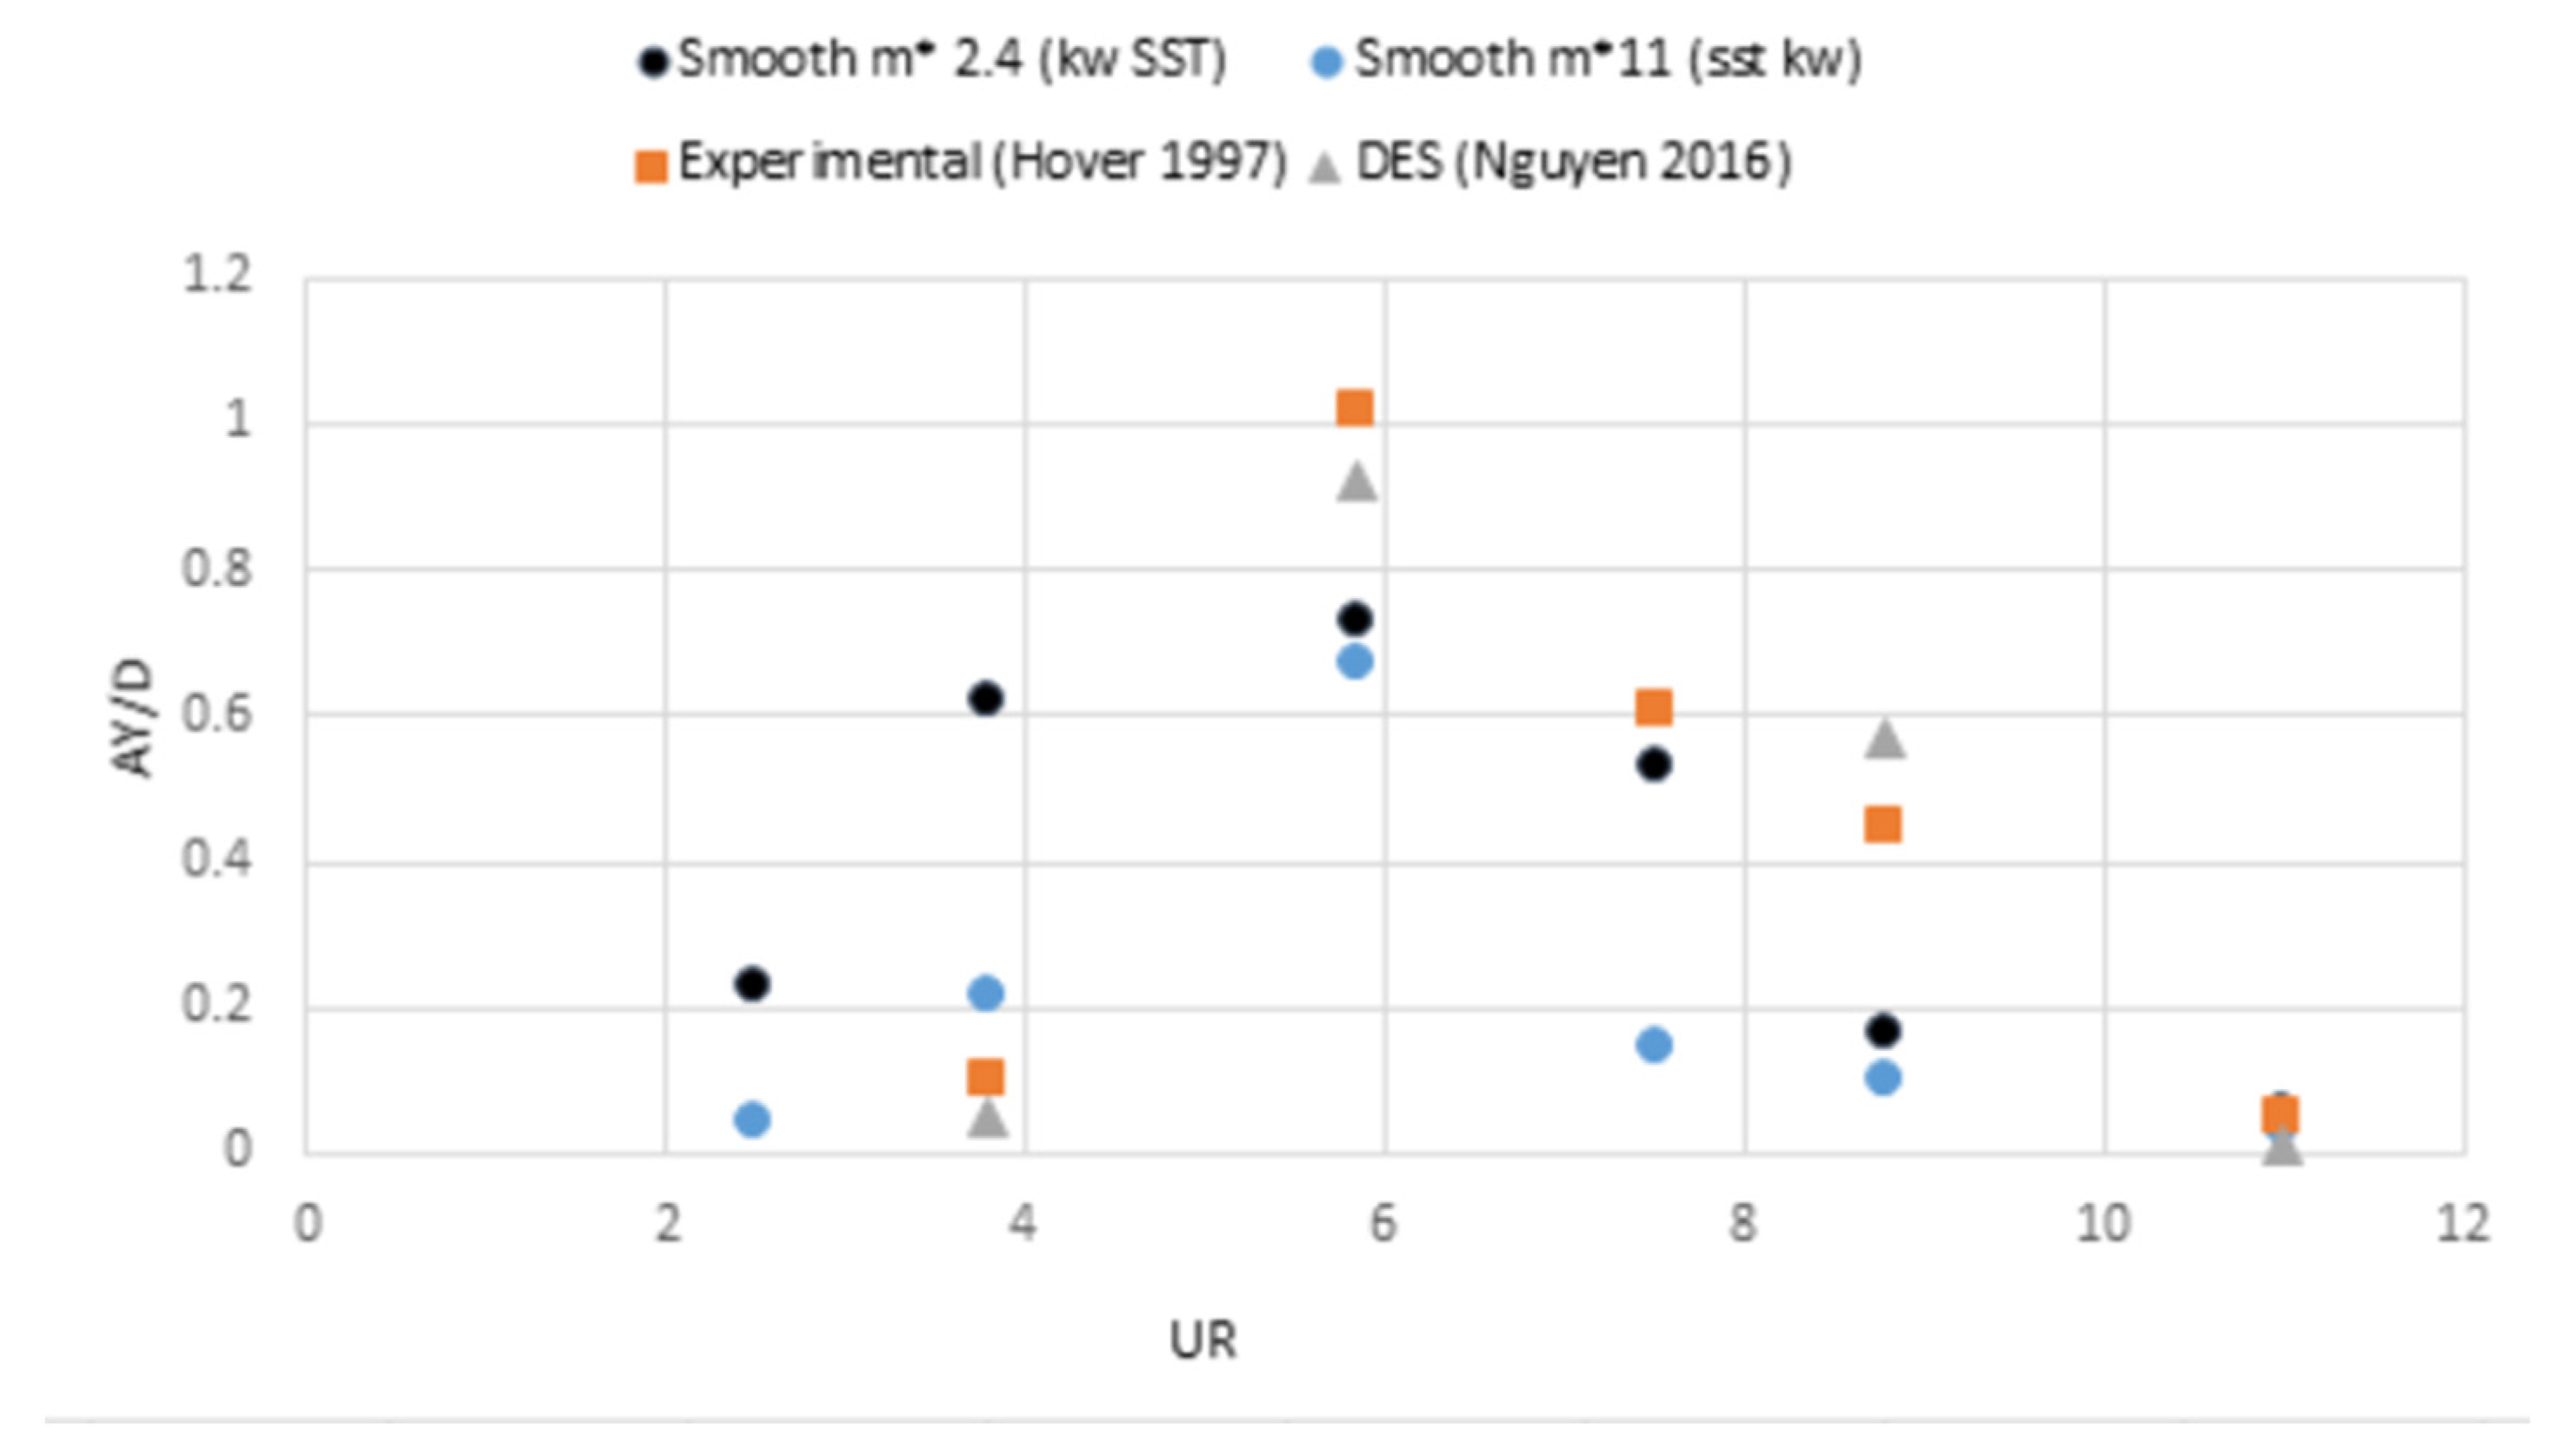
  • At the same range of Reynold number and damping ratio, decrease in mass ratio results in widened lock-in region. Furthermore, low mass ratio results in comparatively higher amplitude response and the difference becsme more significant (more than twice) at the beginning and end of the lock-in region. However, the peak amplitude response at reduced velocity 0.73 was slightly higher (8%) in the case of low mass ratio.
  • Overall, comparatively high amplitude and widened synchronization region were computed at the low mass ratio.
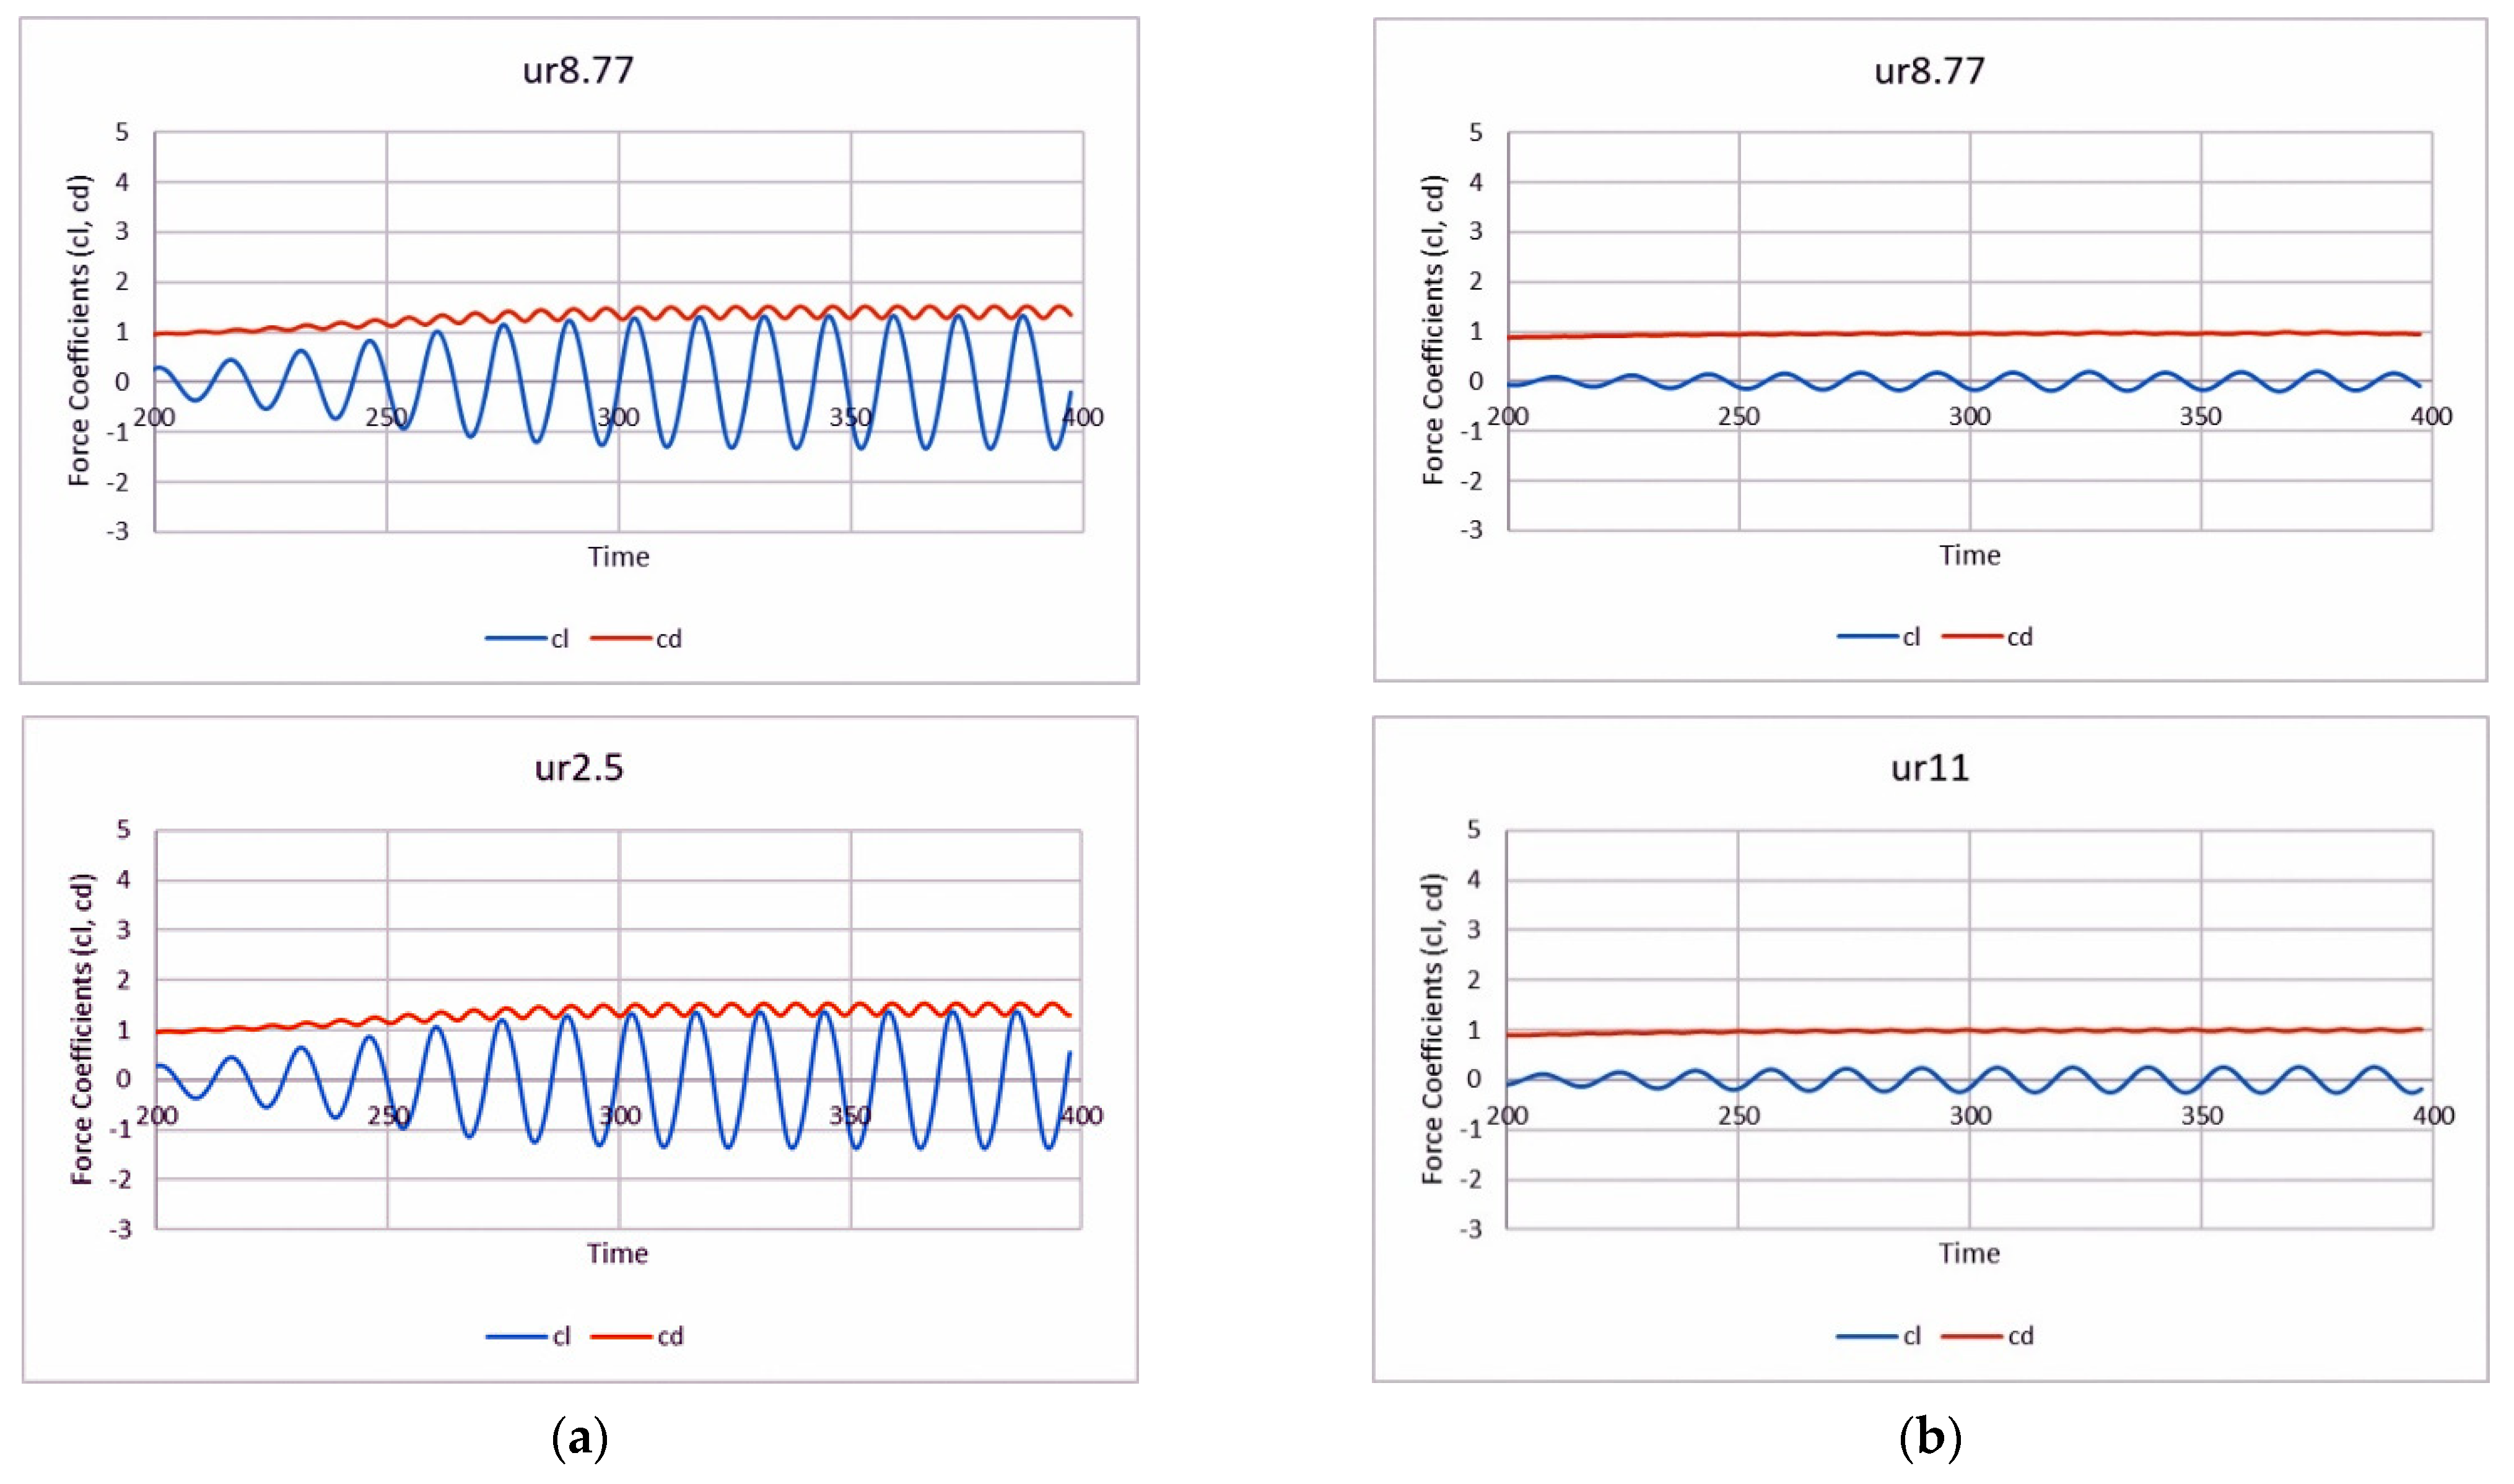
  • For a cylinder with m* = 11, it was found from the study that kw-SST was successful in capturing all three branch responses (initial branch, upper branch, and lower branch) and it also successfully captured 2S & 2P vortex modes for the corresponding amplitude responses and their branches.
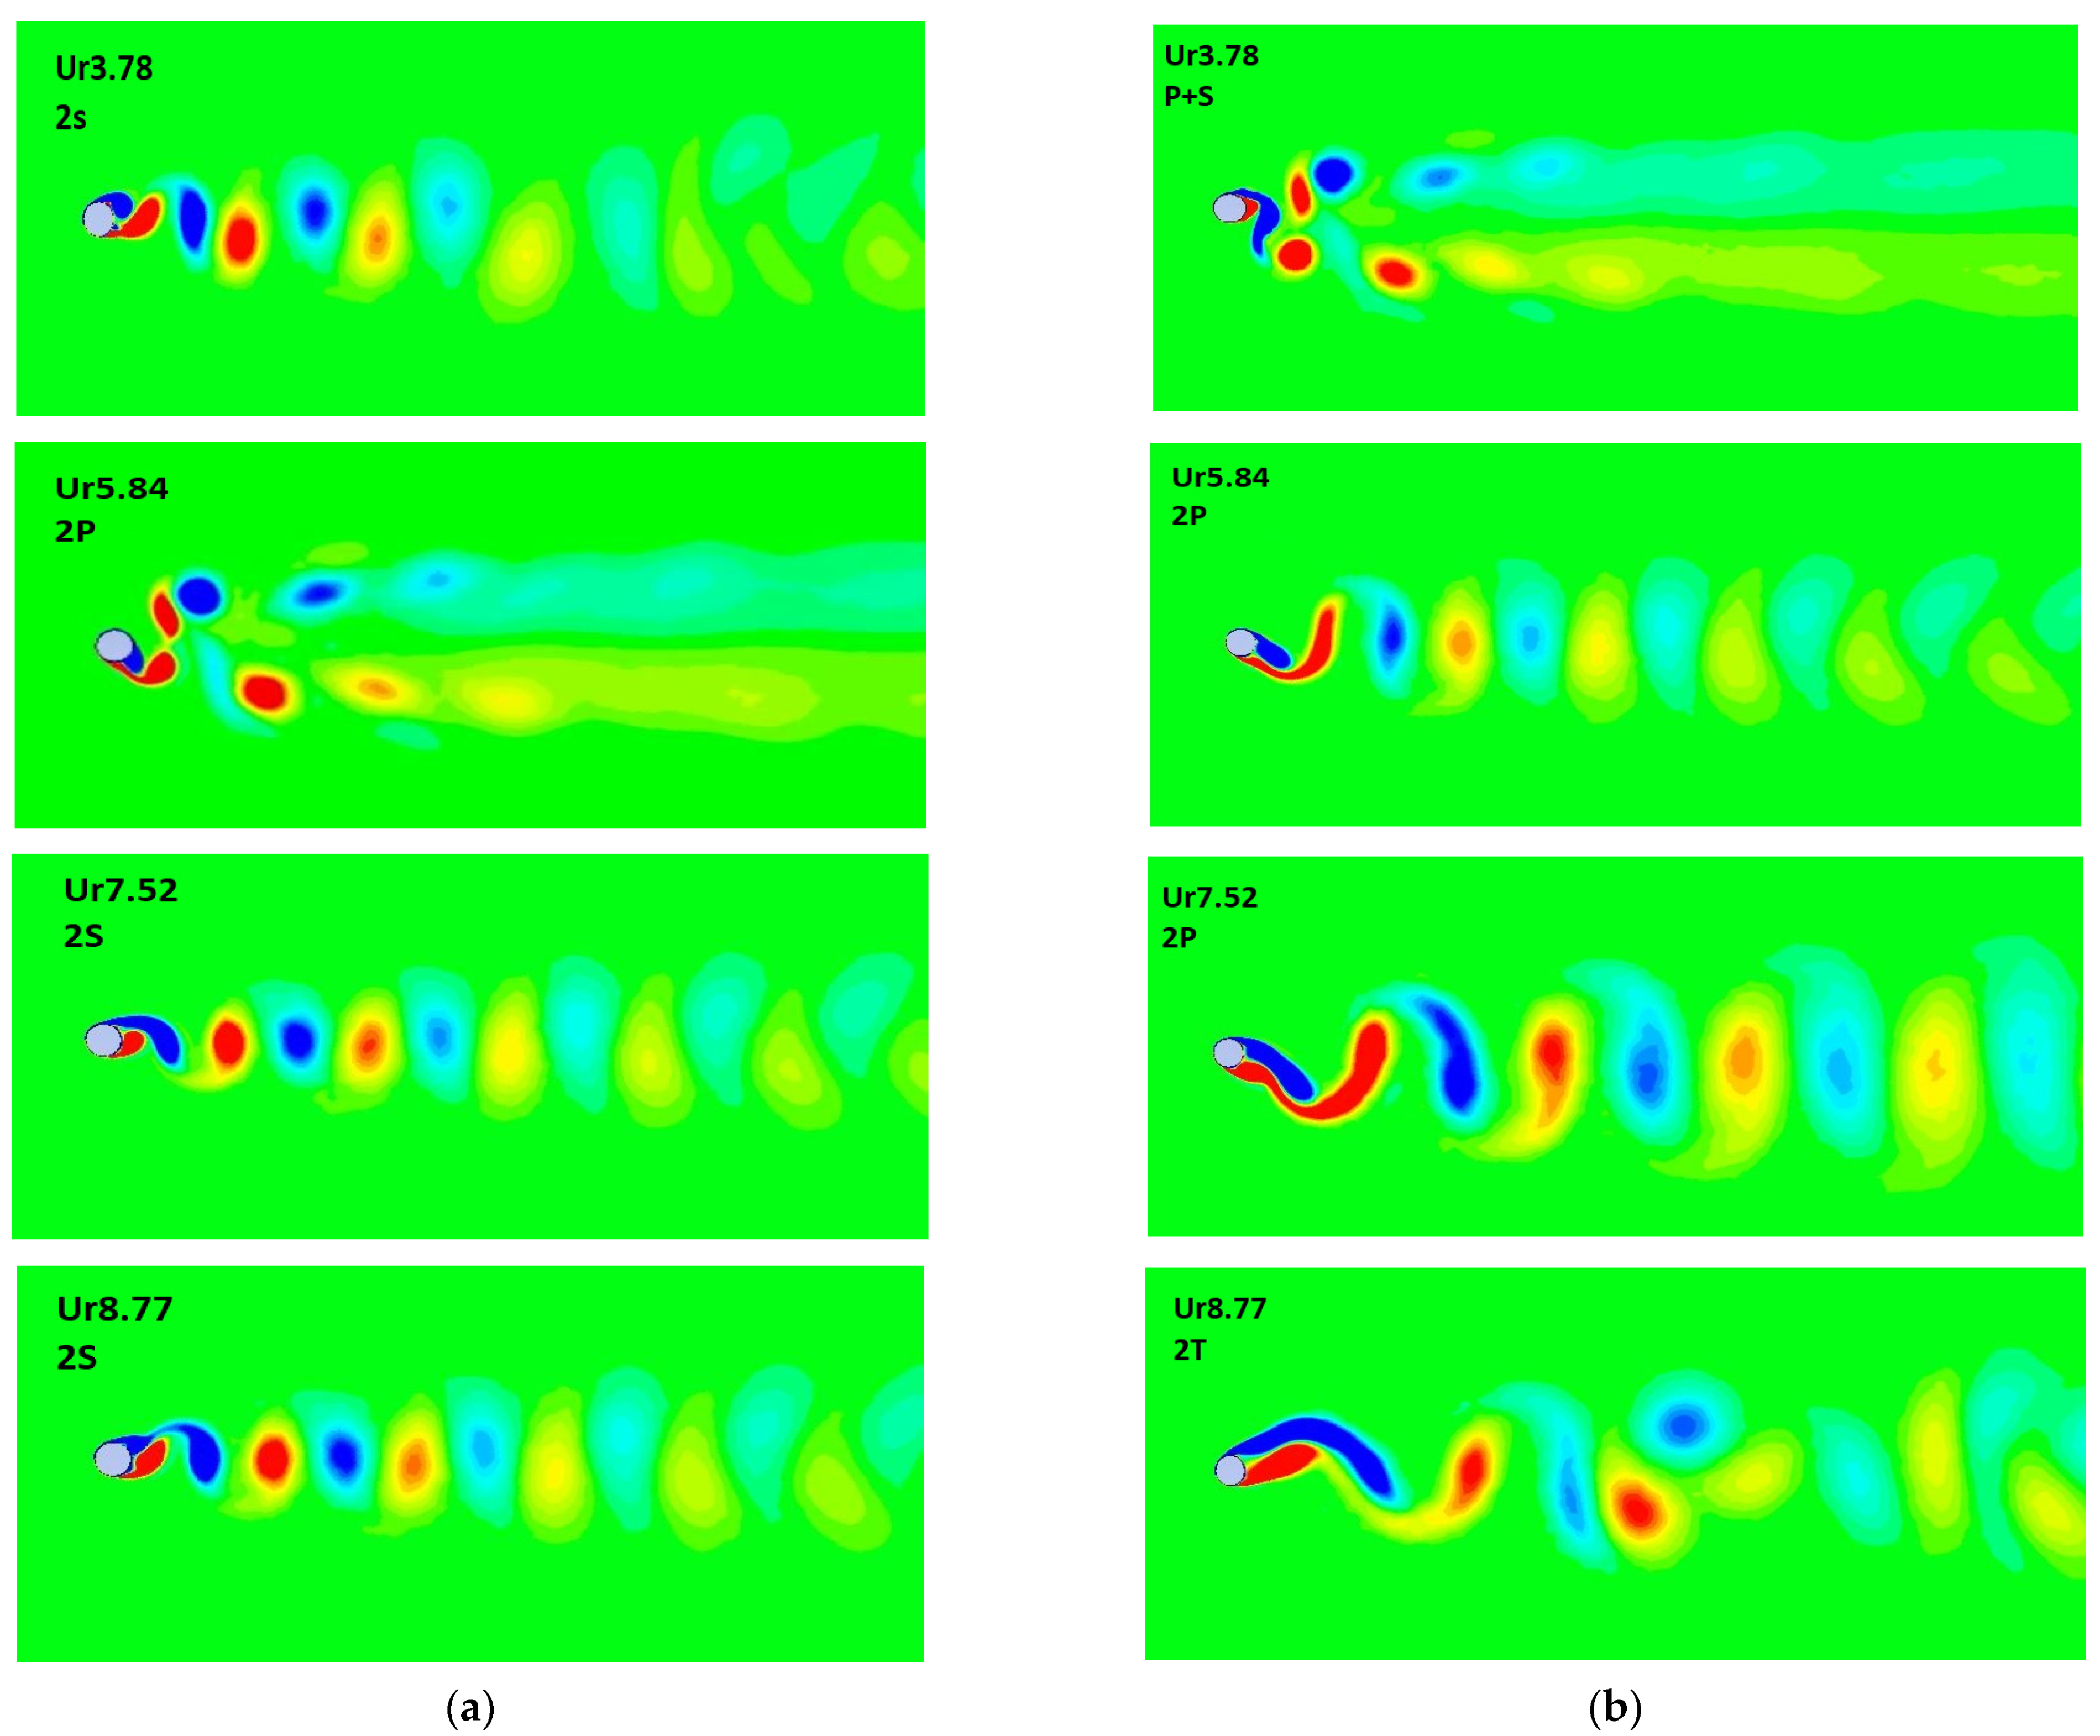
  • At peak amplitude inside the lock-in region, the vortex mode of 2P was captured in both cases of low and high mass ratio. However, vortex shape captured at a low mass ratio at reduced velocity 8.77was 2T, whereas, at high mass ratio, a vortex mode of 2S was captured.
  • Peak amplitude responses were lower in comparison to the numerical (DES model) and experimental study which could be due to a lower blockage ratio. However, comparatively, the study was computationally less expensive and was also less time-consuming, which leads us to conclude that the 2D RANS approach and kw-SST turbulent model are quite reliable and capable of the resolution of complex fluid flow problems.

Author Contributions

Conceptualization, M.U.A., M.M.A.L., N.B.K., A.M., M.J., R.M., K.G. and A.M.G.; methodology, M.U.A., M.M.A.L., N.B.K., A.M., M.J. and A.M.G.; software, M.U.A., M.M.A.L., N.B.K., A.M., M.J. and A.M.G.; validation, M.U.A., N.B.K., A.M., M.J., R.M., K.G. and A.M.G.; formal analysis, M.U.A., M.M.A.L., N.B.K., A.M. and A.M.G.; investigation, M.U.A., M.M.A.L., N.B.K., K.G. and A.M.G.; resources, M.U.A., M.M.A.L., N.B.K., A.M., M.J., R.M., K.G. and A.M.G.; data curation, M.U.A., M.M.A.L., N.B.K., A.M., M.J., R.M., K.G. and A.M.G.; writing—original draft preparation, M.U.A., M.M.A.L., N.B.K., A.M. and M.J.; writing—review and editing visualization, M.U.A., M.M.A.L., N.B.K., A.M., M.J., R.M., K.G. and A.M.G.; supervision, M.U.A., M.M.A.L., N.B.K., A.M., M.J., R.M., K.G. and A.M.G.; project administration, N.B.K.; funding acquisition, M.U.A., M.M.A.L., N.B.K., A.M., M.J., R.M., K.G. and A.M.G. All authors have read and agreed to the published version of the manuscript.

Funding

The authors express their gratitude to Princess Nourah bint Abdulrahman University Researchers Supporting Project (Grant No. PNURSP2022R152), Princess Nourah bint Abdulrahman University, Riyadh, Saudi Arabia. The authors would like to thank the Deanship of Scientific Research at Umm Al-Qura University for supporting this work by Grant Code: 22UQU4331317DSR66. The authors extend their appreciation to the Deanship of scientific research at King Khalid University for funding this work through large groups project under grant number (RGP. 2/93/43).

Institutional Review Board Statement

Not applicable.

Informed Consent Statement

Not applicable.

Data Availability Statement

All data generated or analysed during this study are included in this published article.

Acknowledgments

The authors express their gratitude to Princess Nourah bint Abdulrahman University Researchers Supporting Project (Grant No. PNURSP2022R152), Princess Nourah bint Abdulrahman University, Riyadh, Saudi Arabia. The authors extend their appreciation to the Deanship of scientific research at King Khalid University for funding this work through large groups project under grant number (RGP. 2/93/43). The authors would like to thank the Deanship of Scientific Research at Umm Al-Qura University for supporting this work by Grant Code: 22UQU4331317DSR66.

Conflicts of Interest

The authors declare no conflict of interest.

References

  1. Sarpkaya, T. A critical review of the intrinsic nature of vortex-induced vibrations. J. Fluids Struct. 2004, 19, 389–447. [Google Scholar] [CrossRef]
  2. Breuer, M. Large eddy simulation of the subcritical flow past a circular cylinder: Numerical and modeling aspects. Int. J. Numer. Methods Fluids 1998, 28, 1281–1302. [Google Scholar] [CrossRef]
  3. Bearman, P. Circular cylinder wakes and vortex-induced vibrations. J. Fluids Struct. 2011, 27, 648–658. [Google Scholar] [CrossRef]
  4. Placzek, A.; Sigrist, J.-F.; Hamdouni, A. Numerical simulation of an oscillating cylinder in a cross-flow at low Reynolds number: Forced and free oscillations. Comput. Fluids 2009, 38, 80–100. [Google Scholar] [CrossRef]
  5. Zhao, M.; Cheng, L.; An, H.; Lu, L. Three-dimensional numerical simulation of vortex-induced vibration of an elastically mounted rigid circular cylinder in steady current. J. Fluids Struct. 2014, 50, 292–311. [Google Scholar] [CrossRef]
  6. Khan, N.B.; Jameel, M.; Badry, A.B.B.M.; Ibrahim, Z.B. Numerical study of flow around a smooth circular cylinder at Reynold number = 3900 with large eddy simulation using CFD code. In Proceedings of the ASME 2016 35th International Conference on Ocean, Offshore and Arctic Engineering, Busan, Korea, 19–24 June 2016; American Society of Mechanical Engineers Digital Collection: New York, NY, USA, 2016. [Google Scholar]
  7. Khalak, A.; Williamson, C. Dynamics of a hydroelastic cylinder with very low mass and damping. J. Fluids Struct. 1996, 10, 455–472. [Google Scholar] [CrossRef]
  8. Guilmineau, E.; Queutey, P. Numerical simulation of vortex-induced vibration of a circular cylinder with low mass-damping in a turbulent flow. J. Fluids Struct. 2004, 19, 449–466. [Google Scholar] [CrossRef]
  9. Pan, Z.; Cui, W.; Miao, Q. Numerical simulation of vortex-induced vibration of a circular cylinder at low mass-damping using RANS code. J. Fluids Struct. 2007, 23, 23–37. [Google Scholar] [CrossRef]
  10. Li, W.; Li, J.; Liu, S. Numerical simulation of vortex-induced vibration of a circular cylinder at low mass and damping with different turbulent models. In Proceedings of the OCEANS 2014, Taipei, Taiwan, 7–10 April 2014; IEEE: Manhattan, NY, USA, 2014; pp. 1–7. [Google Scholar]
  11. Nguyen, V.-T.; Nguyen, H.H. Detached eddy simulations of flow induced vibrations of circular cylinders at high Reynolds numbers. J. Fluids Struct. 2016, 63, 103–119. [Google Scholar] [CrossRef]
  12. Hover, F.; Miller, S.; Triantafyllou, M. Vortex-induced vibration of marine cables: Experiments using force feedback. J. Fluids Struct. 1997, 11, 307–326. [Google Scholar] [CrossRef]
  13. Khan, N.B.; Ibrahim, Z.; Nguyen, L.T.T.; Javed, M.F.; Jameel, M. Numerical investigation of the vortex-induced vibration of an elastically mounted circular cylinder at high Reynolds number (Re = 104) and low mass ratio using the RANS code. PLoS ONE 2017, 12, e0185832. [Google Scholar] [CrossRef] [PubMed]
  14. Williamson, C.; Govardhan, R. Vortex-induced vibrations. Annu. Rev. Fluid Mech. 2004, 36, 413–455. [Google Scholar] [CrossRef]
  15. Stappenbelt, B.; Lalji, F.; Tan, G. Low mass ratio vortex-induced motion. In Proceedings of the 16th Australasian Fluid Mechanics Conference, Gold Coast, Australia, 3–7 December 2007. [Google Scholar]
  16. Bahmani, M.; Akbari, M. Effects of mass and damping ratios on VIV of a circular cylinder. Ocean Eng. 2010, 37, 511–519. [Google Scholar] [CrossRef]
  17. Modir, A.; Kahrom, M.; Farshidianfar, A. Mass ratio effect on vortex induced vibration of a flexibly mounted circular cylinder, an experimental study. Int. J. Mar. Energy 2016, 16, 1–11. [Google Scholar] [CrossRef]
  18. Pigazzini, R.; Contento, G.; Martini, S.; Morgut, M.; Puzzer, T. An investigation on VIV of a single 2D elastically-mounted cylinder with different mass ratios. J. Mar. Sci. Technol. 2019, 24, 1078–1091. [Google Scholar] [CrossRef]
  19. Zhao, J.; Leontini, J.; Jacono, D.L.; Sheridan, J. The effect of mass ratio on the structural response of a freely vibrating square cylinder oriented at different angles of attack. J. Fluids Struct. 2019, 86, 200–212. [Google Scholar] [CrossRef]
  20. Tang, Z.; Zhou, B. The effect of mass ratio and spring stiffness on flow-induced vibration of a square cylinder at different incidence angles. Ocean Eng. 2020, 198, 106975. [Google Scholar] [CrossRef]
  21. Chen, D.; Marzocca, P.; Xiao, Q.; Zhan, Z.; Gu, C. Vortex-induced vibration on a low mass ratio cylinder with a nonlinear dissipative oscillator at moderate Reynolds number. J. Fluids Struct. 2020, 99, 103160. [Google Scholar] [CrossRef]
  22. Mittal, S. The critical mass phenomenon in vortex-induced vibration at low. J. Fluid Mech. 2017, 820, 159–186. [Google Scholar]
  23. Kinaci, O.K.; Demirhan, A.E.; Duranay, A. Vortex-induced vibrations of a single-degree-of-freedom circular cylinder in the vicinity of the free surface. Appl. Ocean Res. 2022, 124, 103202. [Google Scholar] [CrossRef]
  24. Guo, T.; Zhang, W.-h.; Wang, W.-q.; Luo, Z.-m. Effects of high mass and damping ratio on VIV of a circular cylinder with low Reynolds number based on IBM. Eng. Mech. 2022, 39, 222–232. [Google Scholar]
  25. Zhang, B.; Li, B.; Fu, S.; Mao, Z.; Ding, W. Vortex-Induced Vibration (VIV) hydrokinetic energy harvesting based on nonlinear damping. Renew. Energy 2022, 195, 1050–1063. [Google Scholar] [CrossRef]
  26. Lin, J.; Zhao, D.; Guo, C.; Zhang, Z.; Su, Y. Numerically Modeling the Effect of Flexibility on Flow around Marine Engineering Structures: Using the Shape of the Saguaro Cactus. J. Coast. Res. 2020, 36, 628. [Google Scholar] [CrossRef]
  27. Lin, J.-F.; Han, Y.; Su, Y.-M.; Wang, Y.; Zhang, Z.-T.; Jiang, R.-Q. Hydrodynamic performance of a Magnus anti-rolling device at zero and low ship speeds. Ocean Eng. 2021, 229, 109008. [Google Scholar] [CrossRef]
  28. Zhang, M.; Fu, S.; Ren, H.; Ma, L.; Xu, Y. A hybrid FEM-DNN-based vortex-induced Vibration Prediction Method for Flexible Pipes under oscillatory flow in the time domain. Ocean Eng. 2022, 246, 110488. [Google Scholar] [CrossRef]
  29. Salhi, J.E.; Ajarostaghi, S.S.M.; Zarrouk, T.; Pour, M.S.; Salhi, N.; Salhi, M. Turbulence and thermo-flow behavior of air in a rectangular channel with partially inclined baffles. Energy Sci. Eng. 2022. Available online: https://onlinelibrary.wiley.com/doi/full/10.1002/ese3.1239 (accessed on 1 May 2022). [CrossRef]
  30. Kurushina, V.; Pavlovskaia, E.; Postnikov, A.; Wiercigroch, M. Calibration and comparison of VIV wake oscillator models for low mass ratio structures. Int. J. Mech. Sci. 2018, 142–143, 547–560. [Google Scholar] [CrossRef]
  31. Khan, N.B.; Ibrahim, Z. Numerical investigation of vortex-induced vibration of an elastically mounted circular cylinder with One-degree of freedom at high Reynolds number using different turbulent models. Proc. Inst. Mech. Eng. Part M J. Eng. Marit. Environ. 2019, 233, 443–453. [Google Scholar] [CrossRef]
  32. Khan, N.B.; Ibrahim, Z.; Badry, A.B.B.M.; Jameel, M.; Javed, M.F. Numerical investigation of flow around cylinder at Reynolds number = 3900 with large eddy simulation technique: Effect of spanwise length and mesh resolution. Proc. Inst. Mech. Eng. Part M J. Eng. Marit. Environ. 2018, 233, 417–427. [Google Scholar] [CrossRef]
  33. Khan, N.B.; Ibrahim, Z.; Khan, M.I.; Hayat, T.; Javed, M.F. VIV study of an elastically mounted cylinder having low mass-damping ratio using RANS model. Int. J. Heat Mass Transf. 2018, 121, 309–314. [Google Scholar] [CrossRef]
  34. Fluent, A.J.I.C. R2 User’s Manual; ANSYS: Canonsburg, PA, USA, 2020. [Google Scholar]
  35. Shao, J.; Zhang, C. Numerical analysis of the flow around a circular cylinder using RANS and LES. Int. J. Comput. Fluid Dyn. 2006, 20, 301–307. [Google Scholar] [CrossRef]
  36. Fang, Y.Y.; Han, Z.L. Numerical experimental research on the hydrodynamic performance of flow around a three dimensional circular cylinder. In Applied Mechanics and Materials; Trans Tech Publication: Bäch, Switzerland, 2011. [Google Scholar]
  37. Franke, J.; Frank, W. Large eddy simulation of the flow past a circular cylinder at ReD = 3900. J. Wind Eng. Ind. Aerodyn. 2002, 90, 1191–1206. [Google Scholar] [CrossRef]
  38. Zdravkovich, M. Conceptual overview of laminar and turbulent flows past smooth and rough circular cylinders. J. Wind Eng. Ind. Aerodyn. 1990, 33, 53–62. [Google Scholar] [CrossRef]
  39. Navrose; Mittal, S. Free vibrations of a cylinder: 3-D computations at Re = 1000. J. Fluids Struct. 2013, 41, 109–118. [Google Scholar] [CrossRef]
  40. Zhao, M.; Tong, F.; Cheng, L. Numerical Simulation of Two-Degree-of-Freedom Vortex-Induced Vibration of a Circular Cylinder between Two Lateral Plane Walls in Steady Currents. J. Fluids Eng. 2012, 134, 104501. [Google Scholar] [CrossRef]
  41. Bishop, R.E.D.; Hassan, A.Y.; Sciences, P. The lift and drag forces on a circular cylinder oscillating in a flowing fluid. Proc. R. Soc. London Ser. A Math. Phys. Sci. 1964, 277, 51–75. [Google Scholar]
Figure 1. Schematic diagram of the elastically mounted circular cylinder with 1DoF.
Jmse 10 01126 g001
Figure 2. Computational domain.
Jmse 10 01126 g002
Figure 3. (a) Mesh (b) Mesh closeup view near cylinder.
Jmse 10 01126 g003
Figure 4. Force coefficients (cd & cl) at different reduced velocities with mass ratio (a) m* = 11 and (b) m* = 2.4.
Jmse 10 01126 g004aJmse 10 01126 g004b
Figure 5. Vortex mode at different reduced velocity for mass ratio (a) m* = 11 and (b) m* = 2.4.
Jmse 10 01126 g005
Figure 6. Comparison of amplitude response for cylinders at (m* = 11 & m* = 2.4).
Jmse 10 01126 g006
Table 1. Grid independency tests with RANS kw-sst Model.
MeshNo. of ElementsMaximum Ay/d
M128,0500.52
M234,9800.581
M351,0940.6702
M464,3640.6771
Publisher’s Note: MDPI stays neutral with regard to jurisdictional claims in published maps and institutional affiliations.

