
Wave Energy Resource Assessment for Small-Scale WEC near a Harbour


Abstract
:1. Introduction
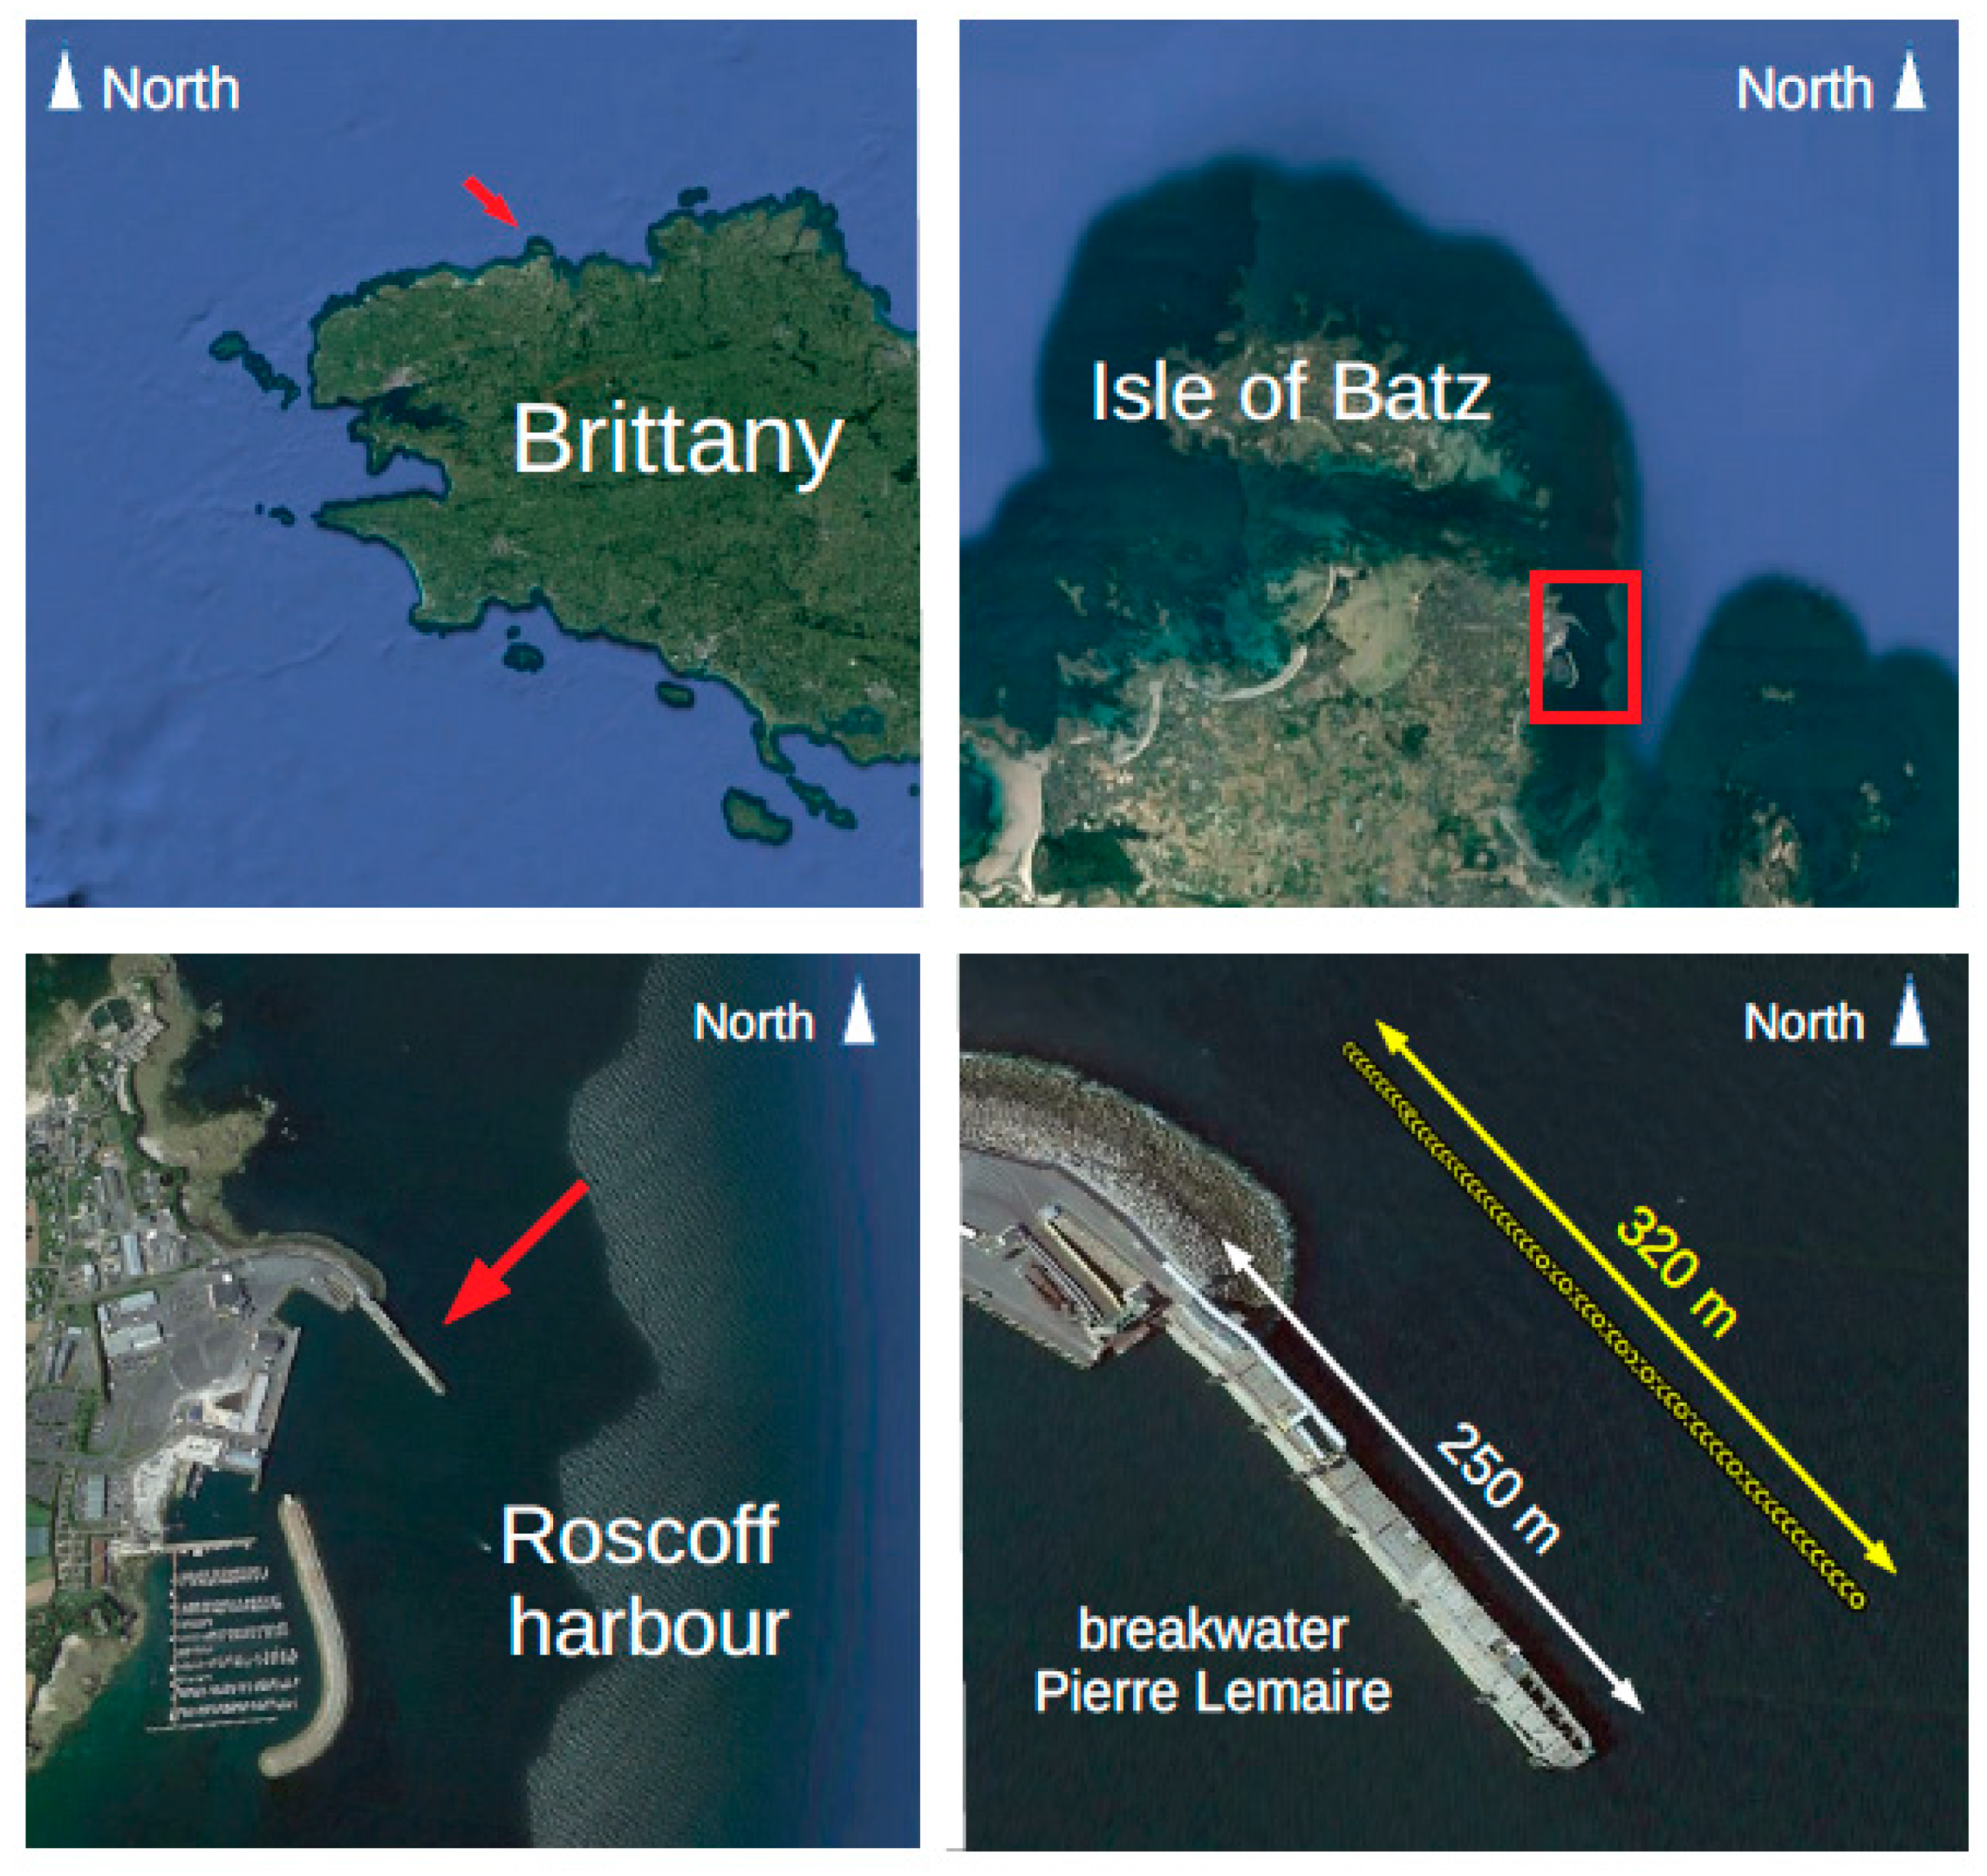
2. Study Site
3. Materials and Methods
3.1. Model Theoretical Description
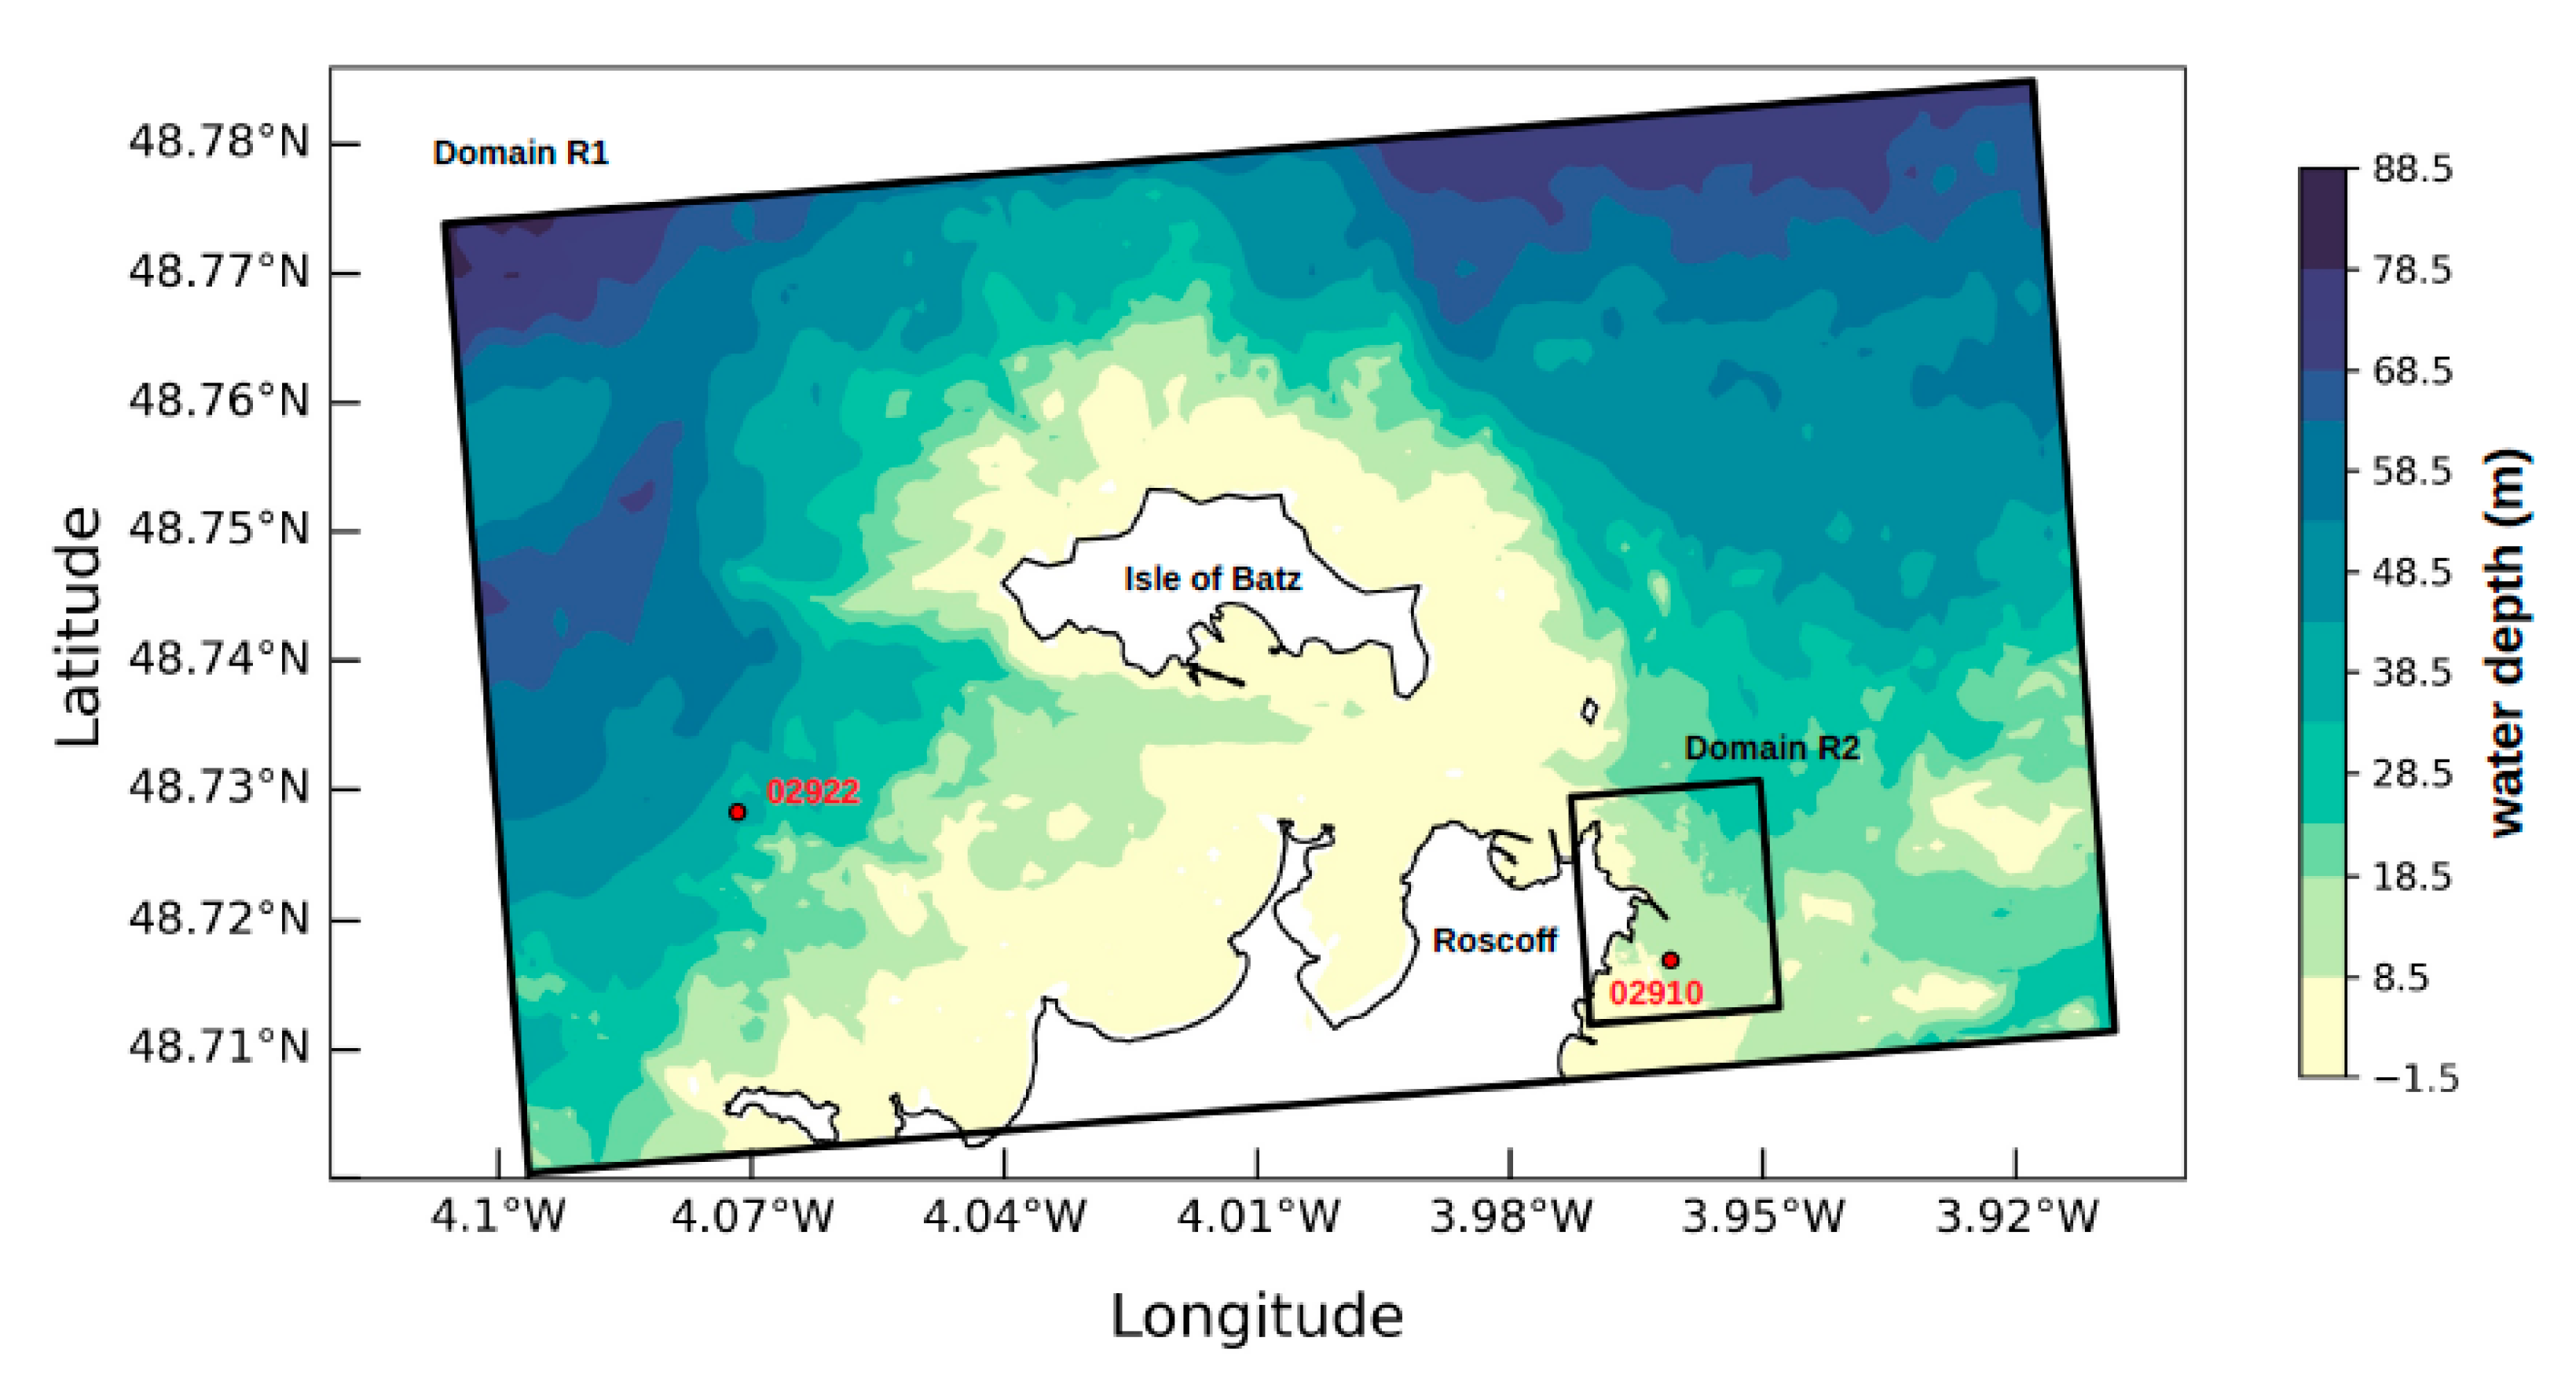
3.2. Model Setup
3.3. In Situ Measurements
3.4. Performance Indicators and Wave Energy Metrics
4. Results and Discussion
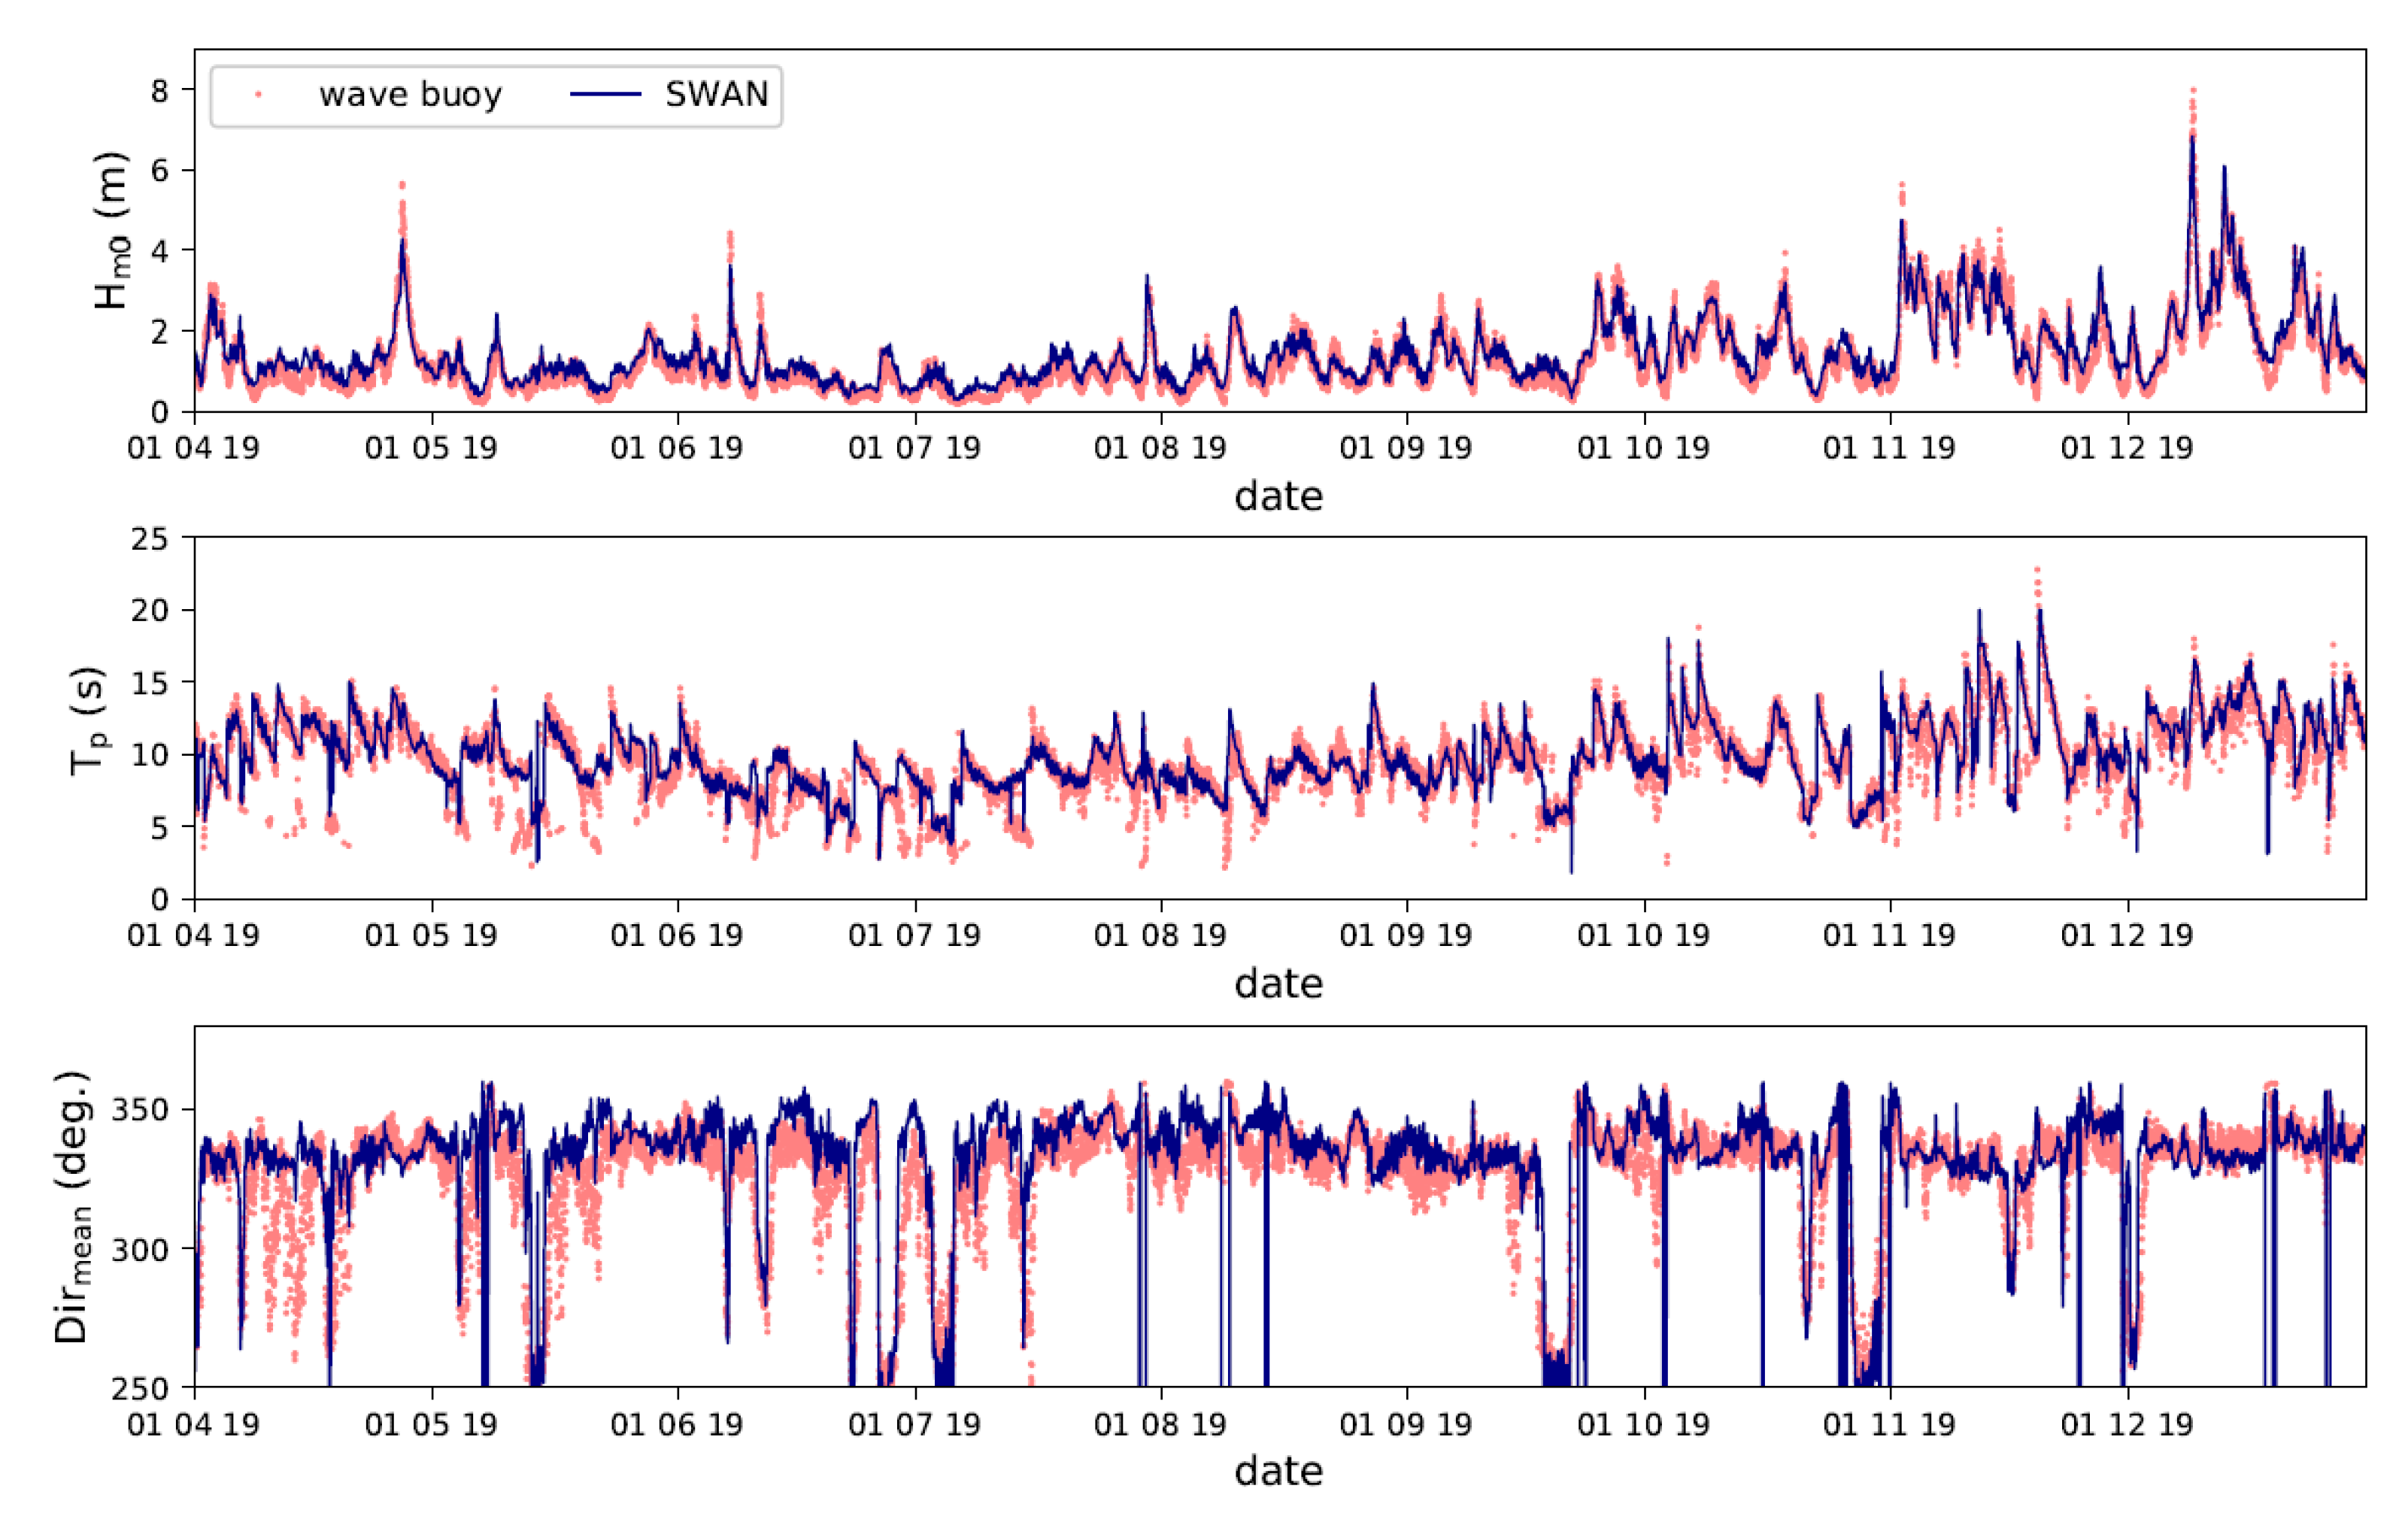
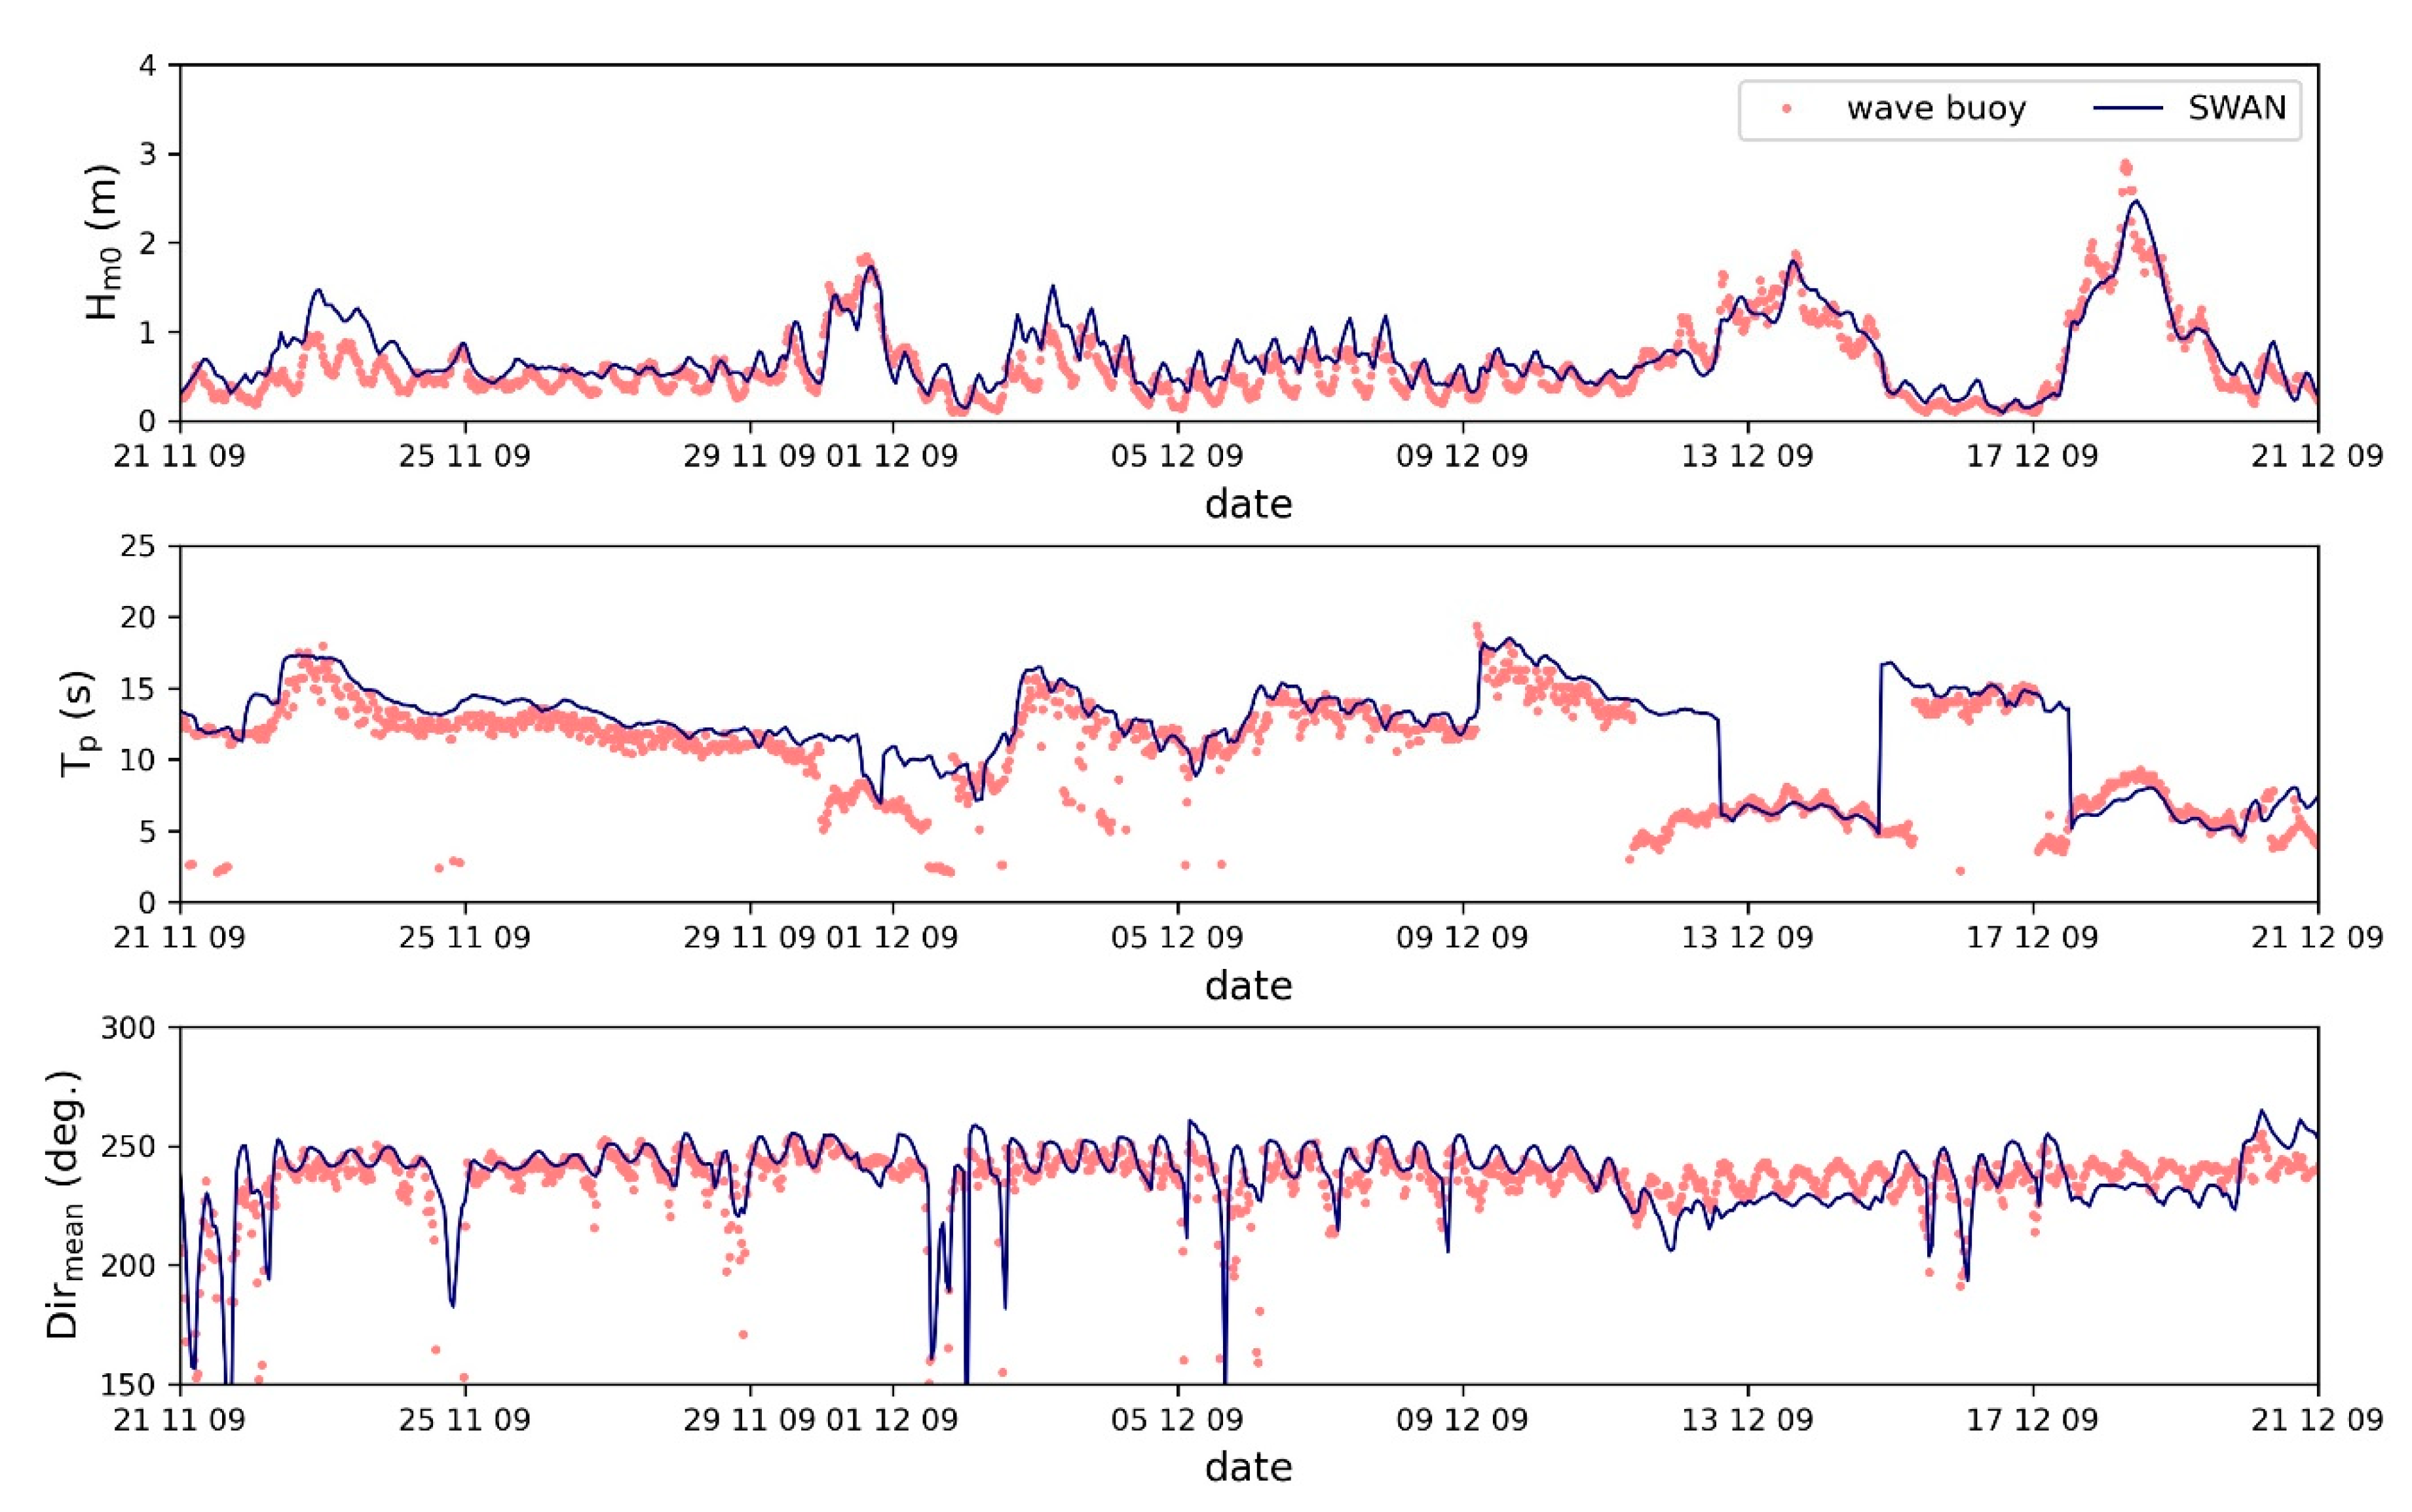
4.1. Evaluation of Model Predictions
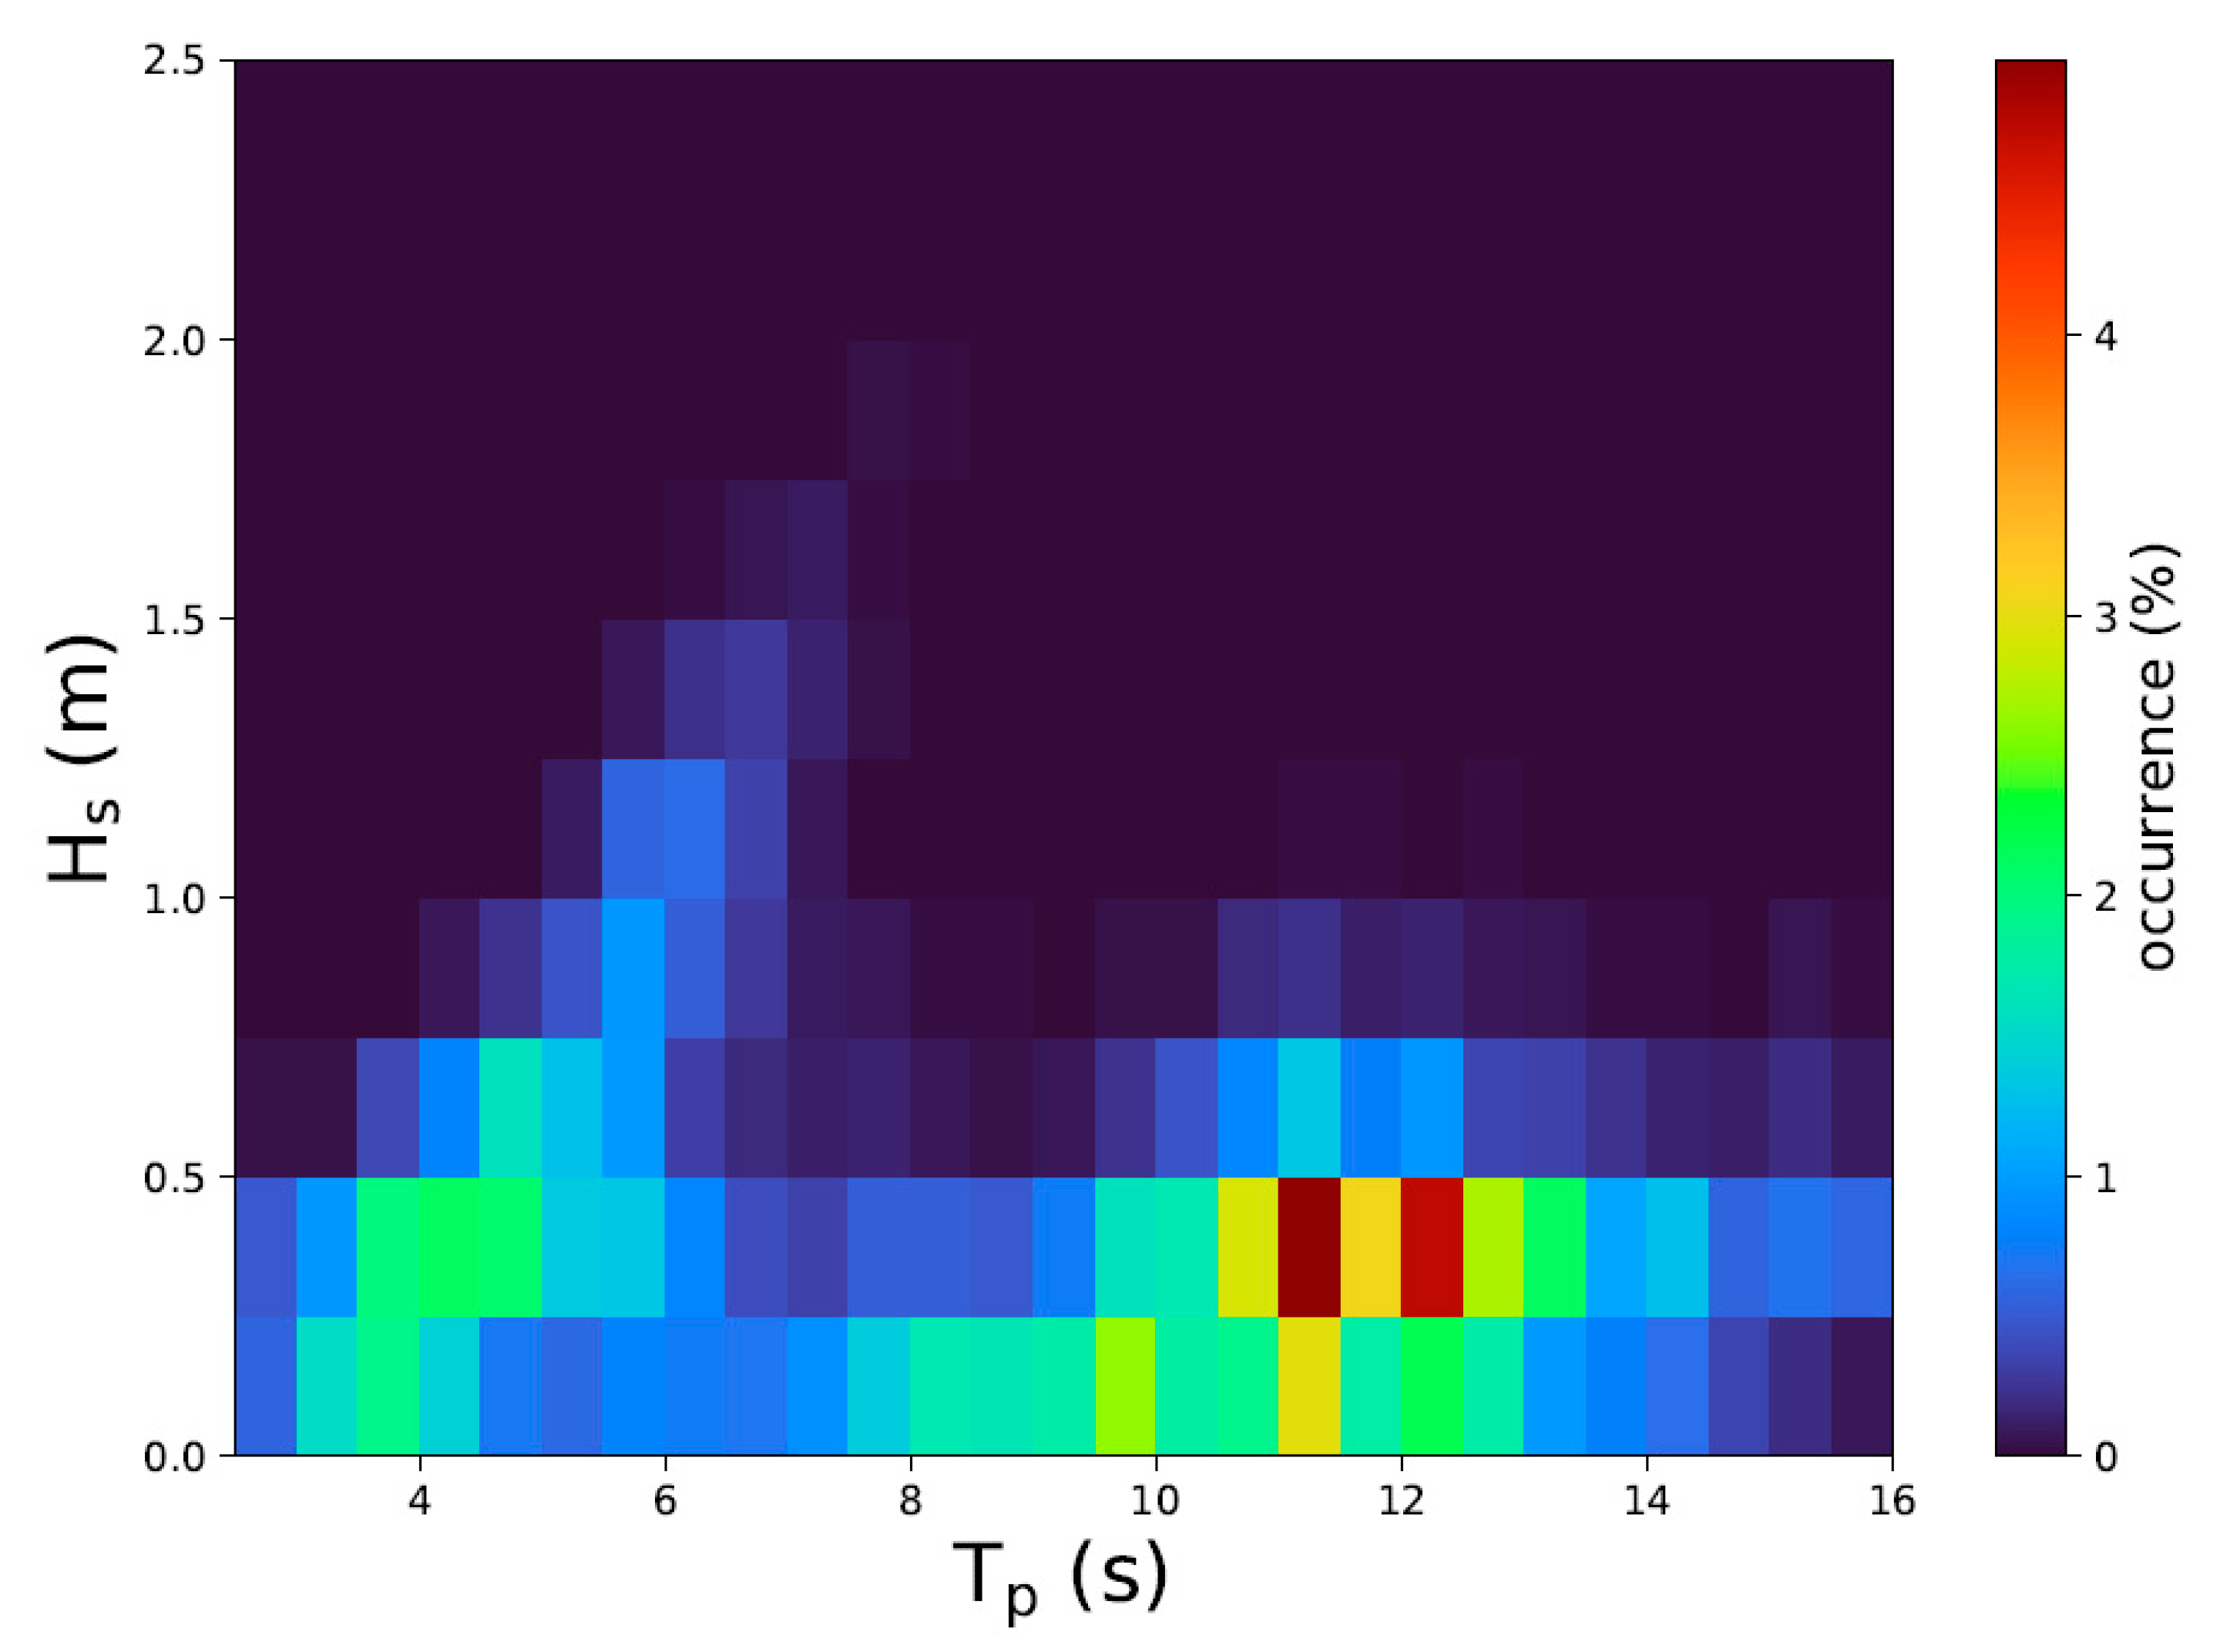
4.2. Spatiotemporal Variability of Available Wave Energy
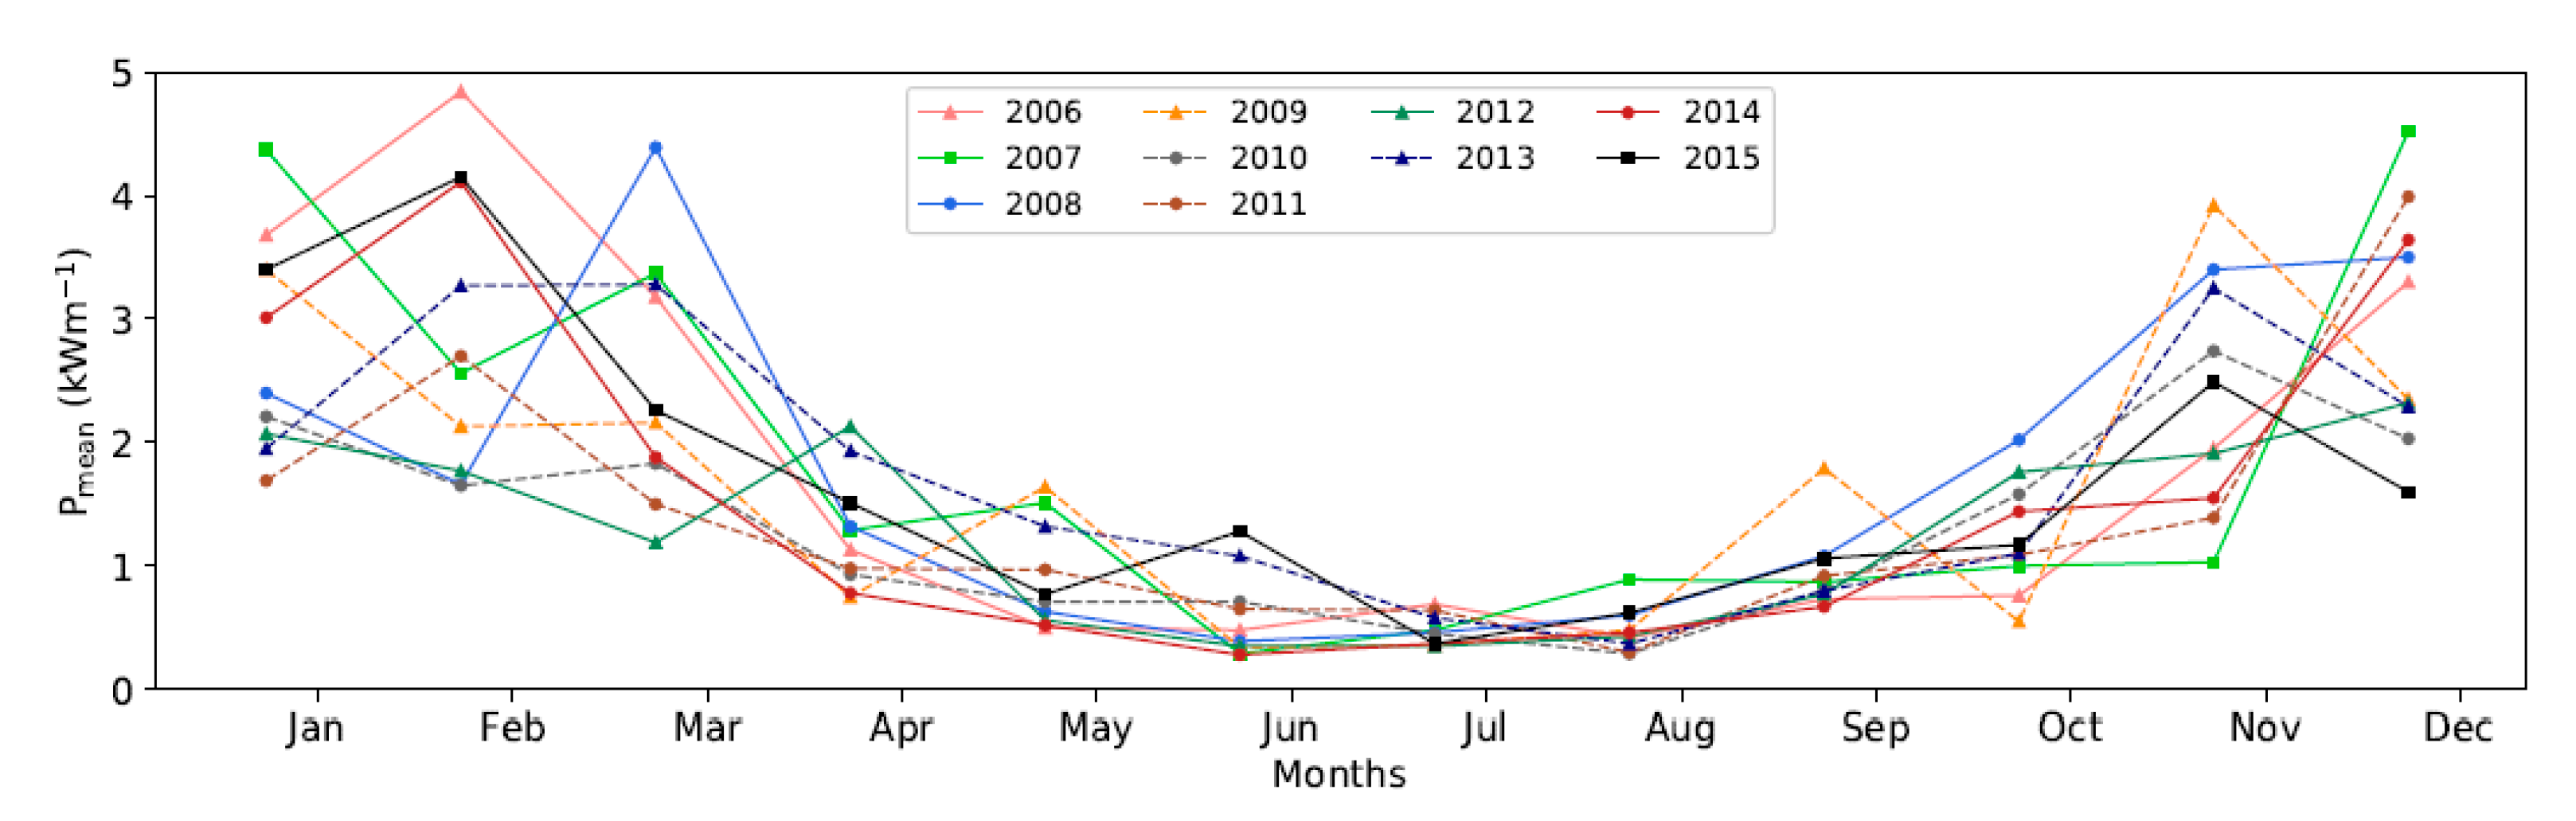
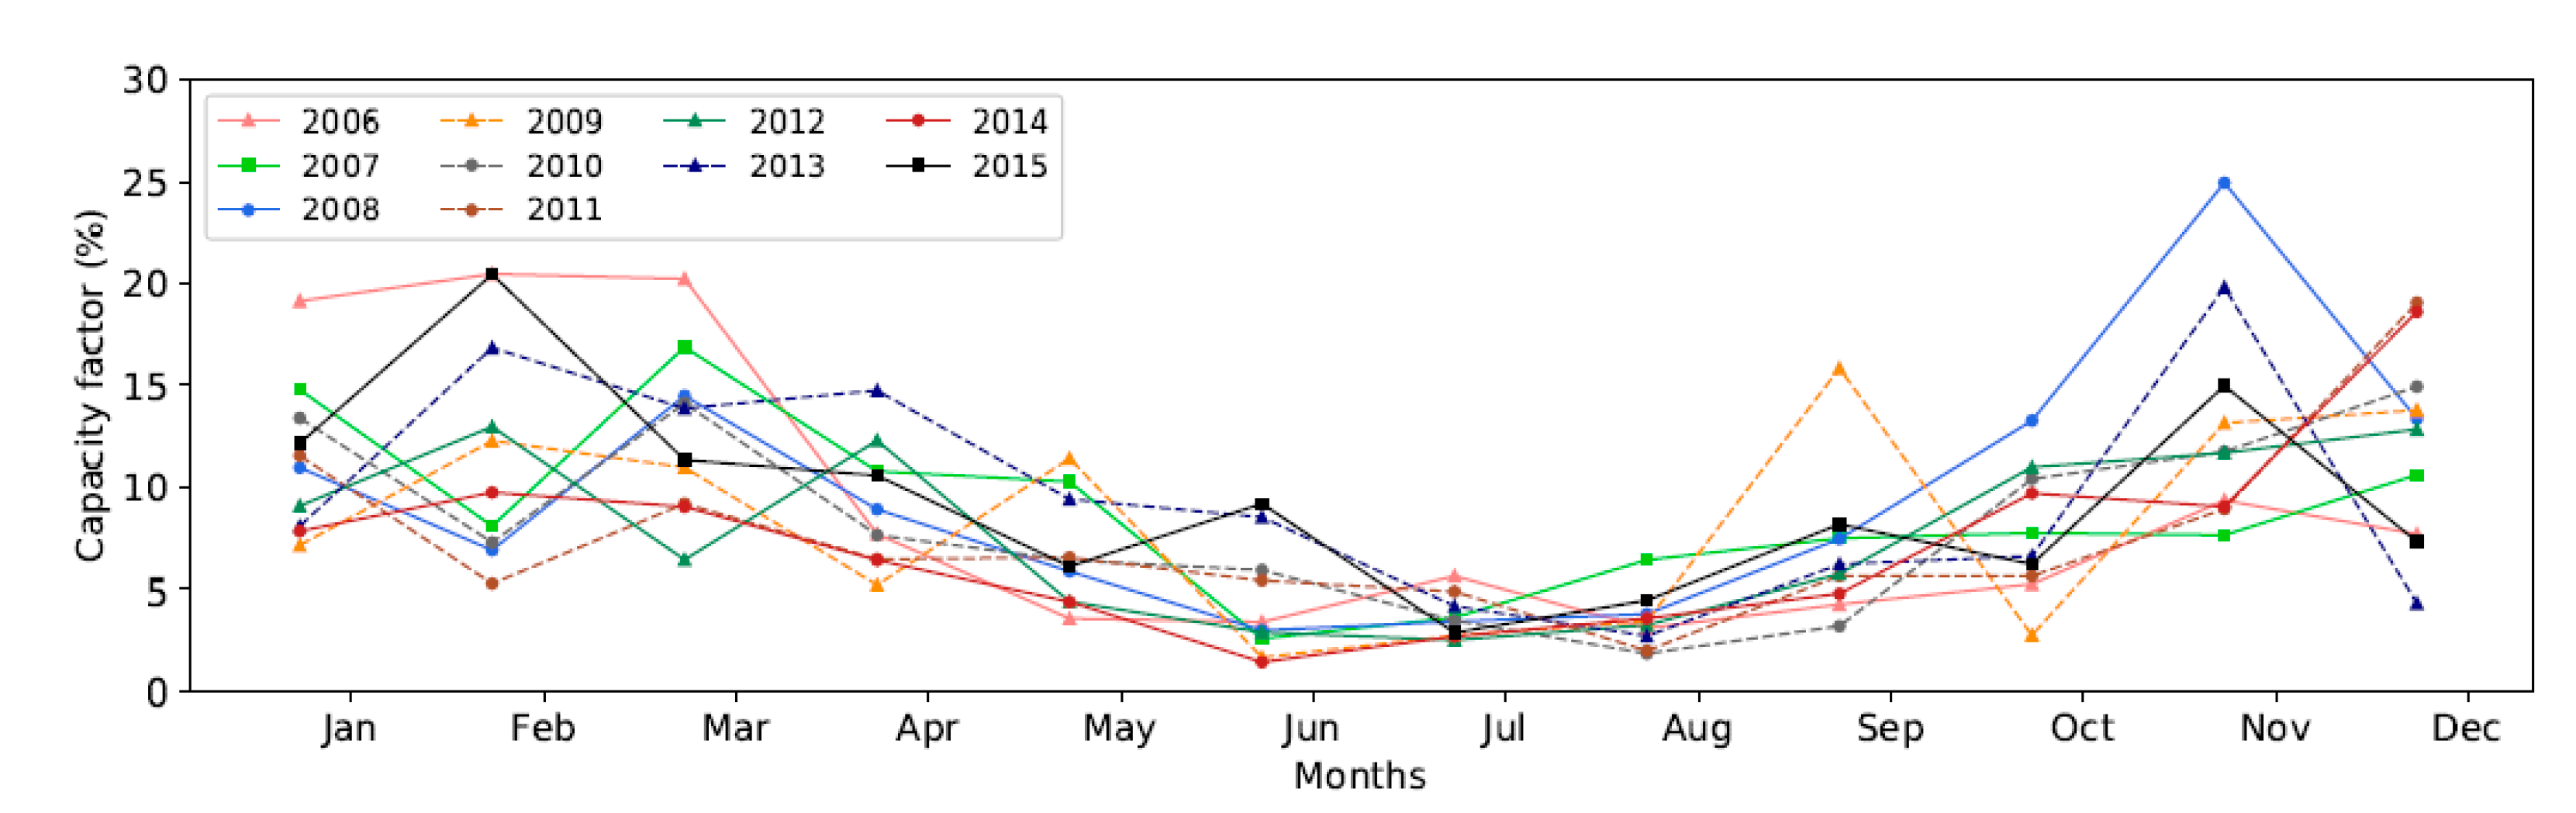
4.3. Annual and Seasonal Variability of Onshore WEC Performance
4.3.1. Generic Assessment
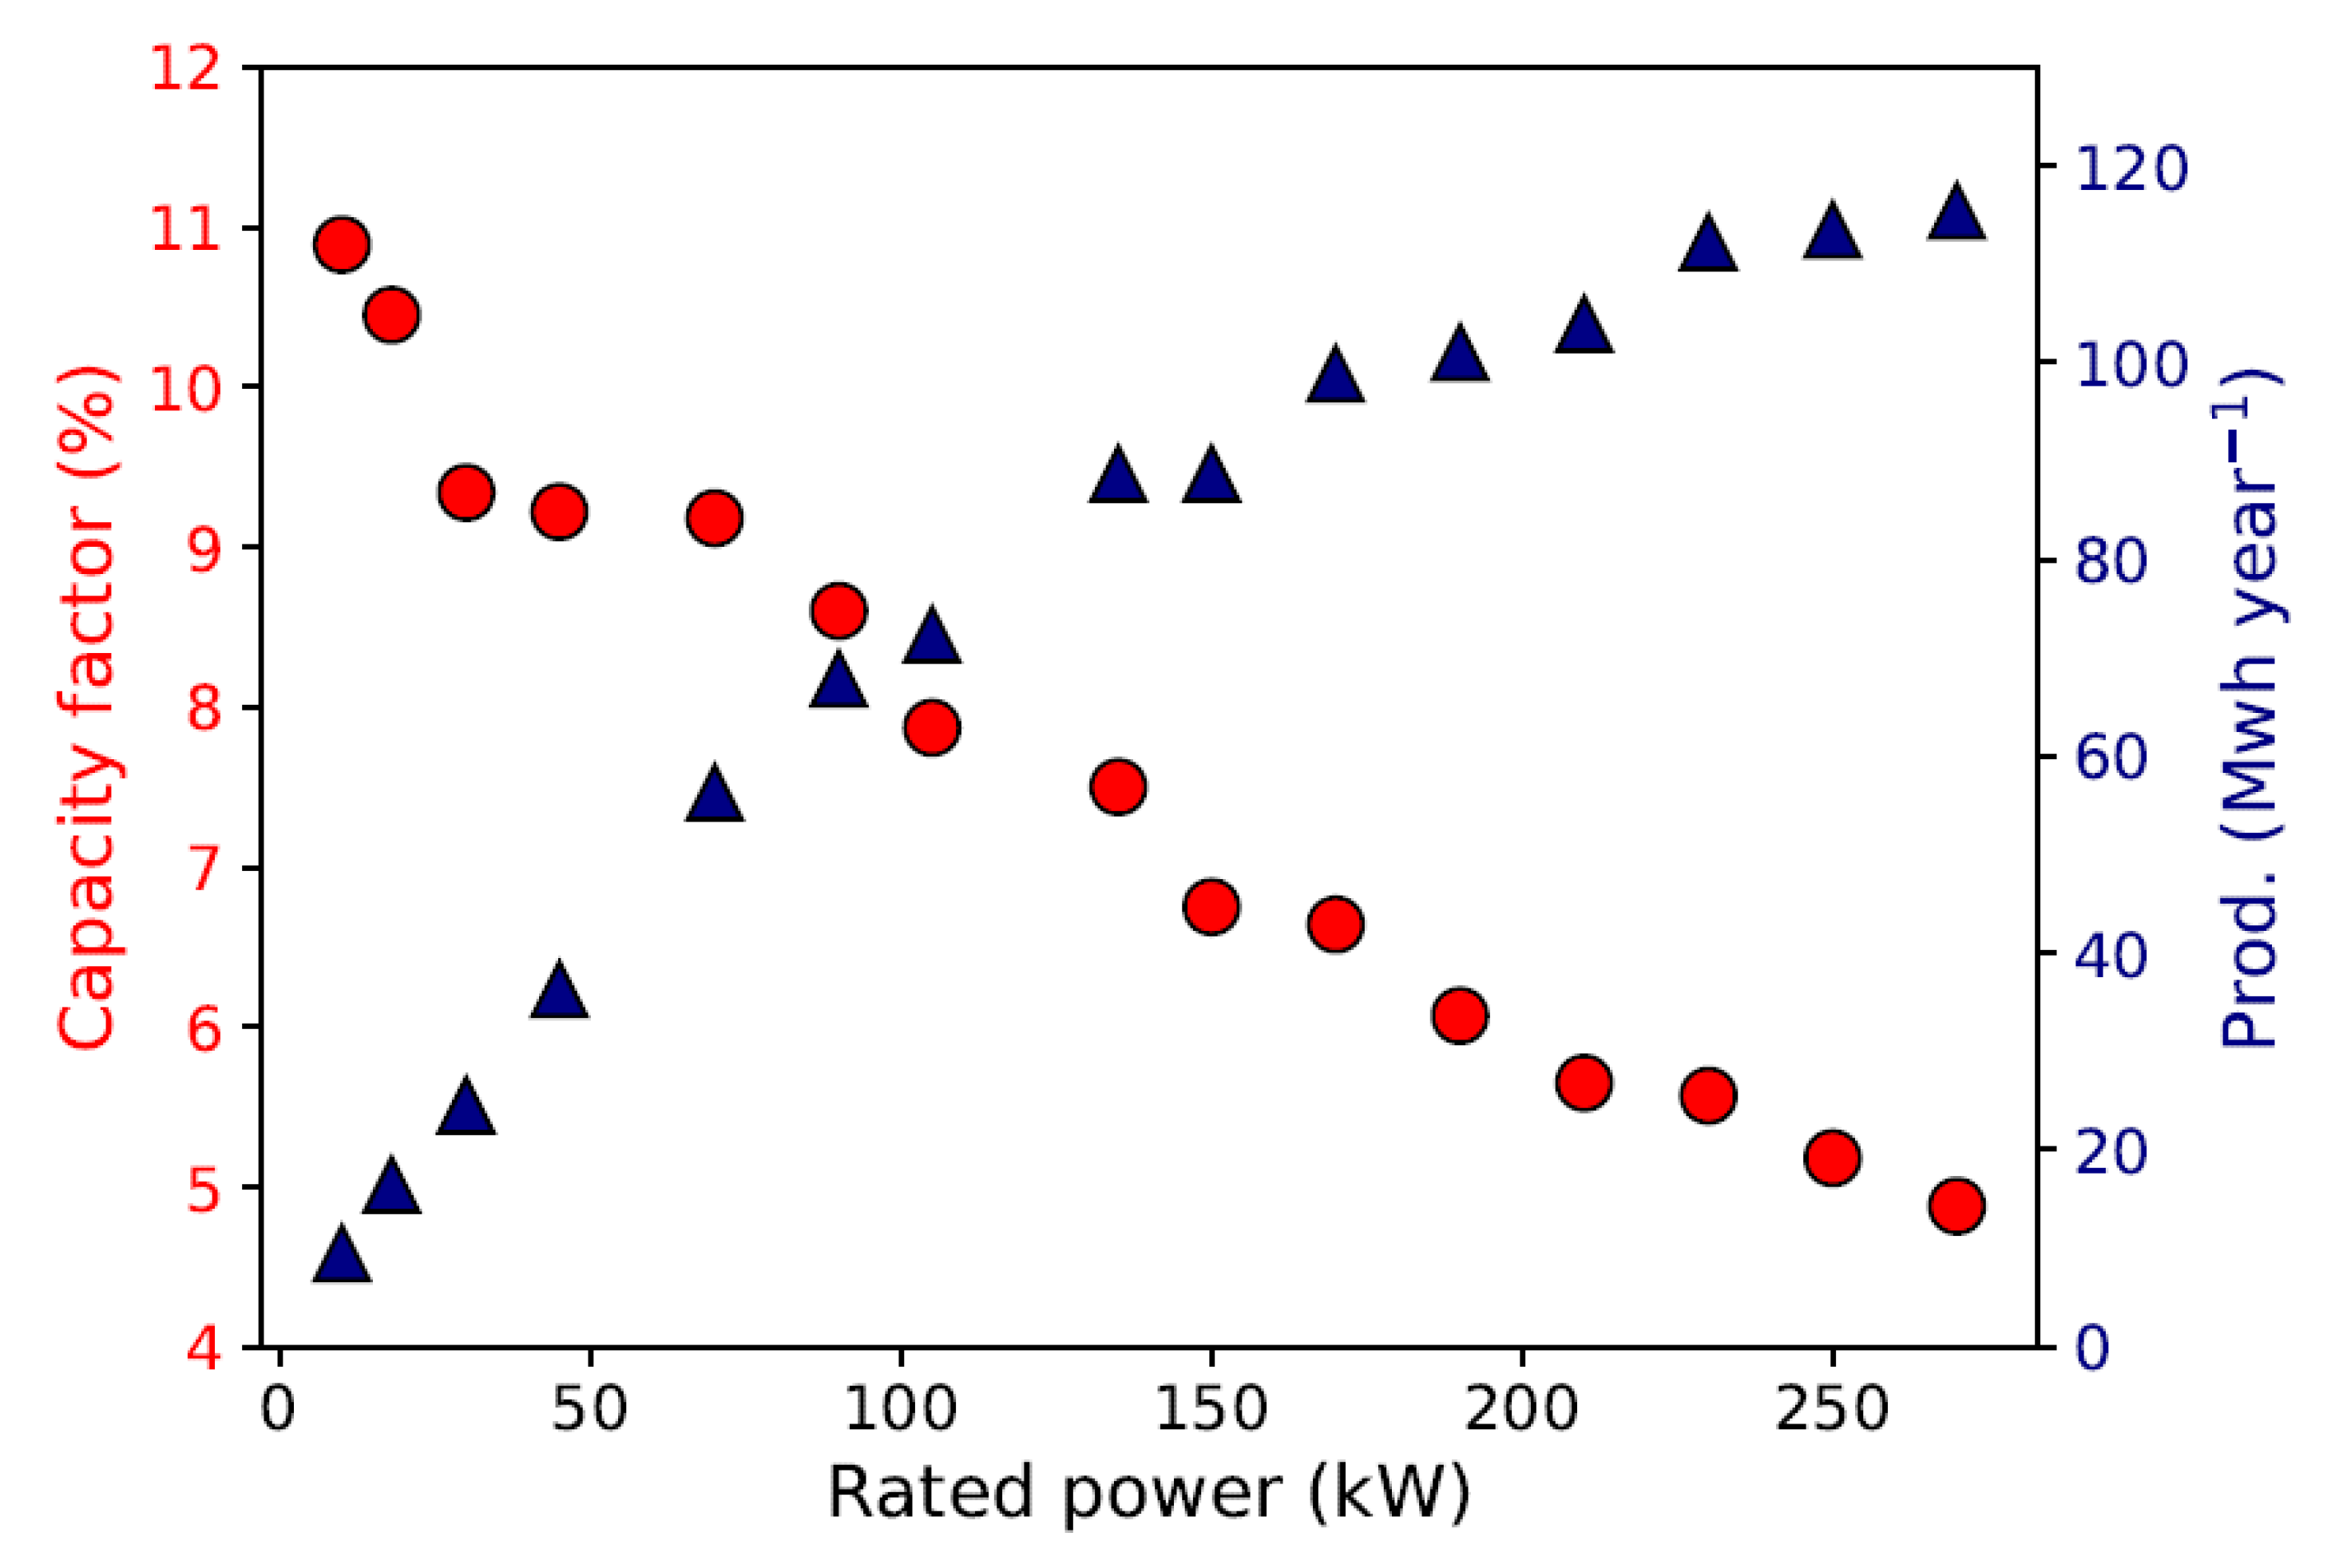
4.3.2. Assessment Based on Small-Scale Prototypes
5. Conclusions
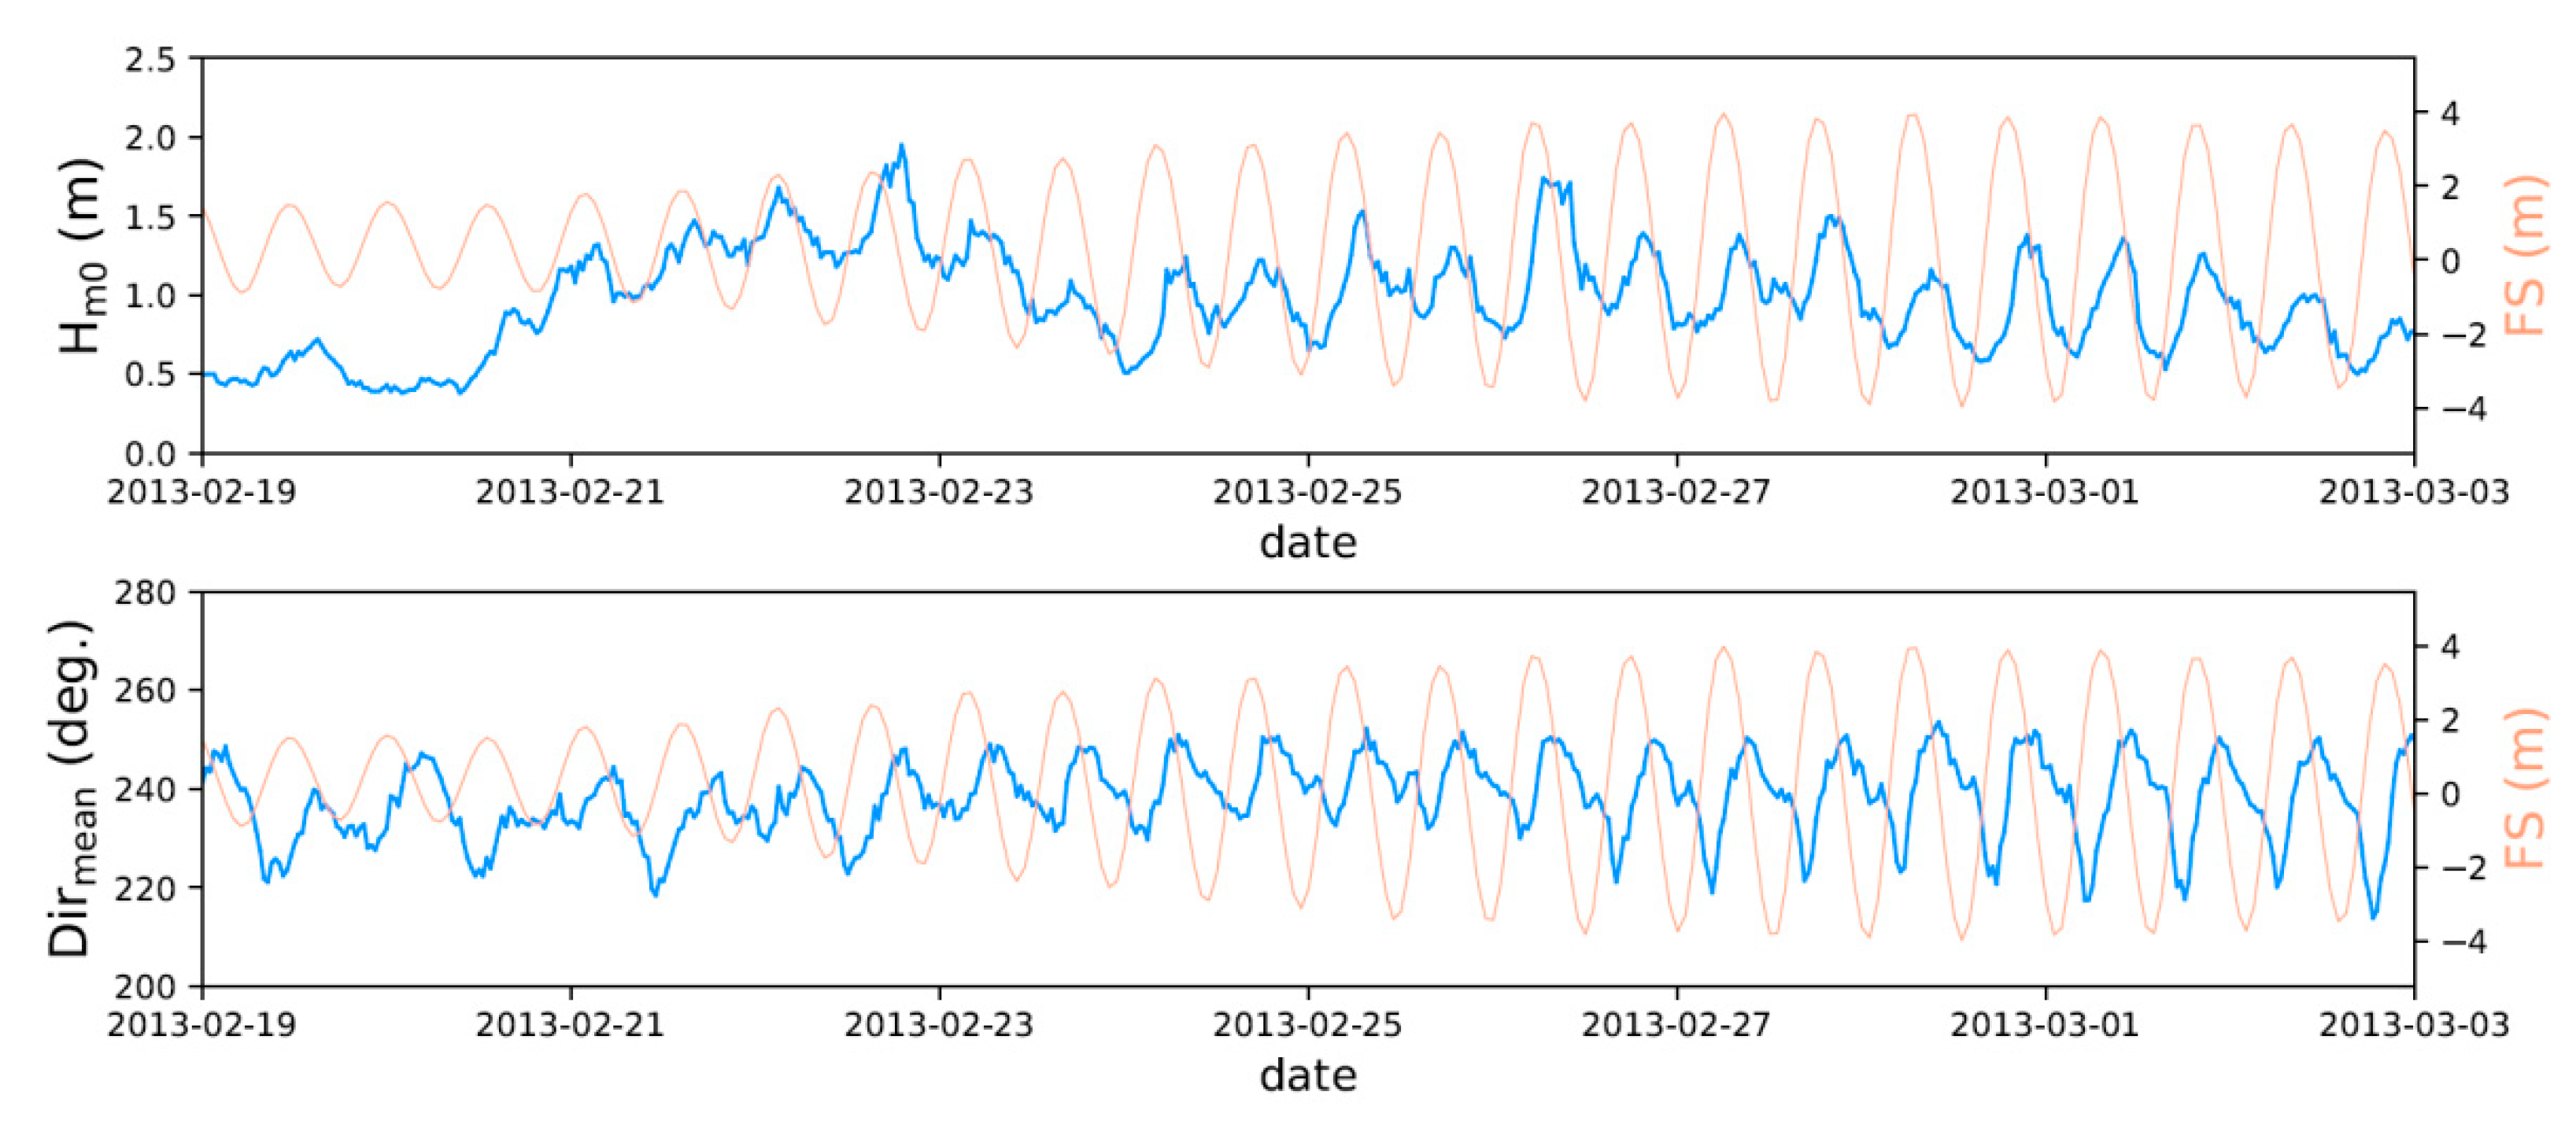
- The phase-averaged spectral wave model SWAN reproduced the observed evolution of wave conditions in offshore and nearshore waters, including the vicinity of the harbour breakwater. Thus, besides approaching the observed variations between storm and calm weather conditions, the model reproduced the semidiurnal modulations of significant wave heights and incoming wave directions resulting from tide-induced refraction.
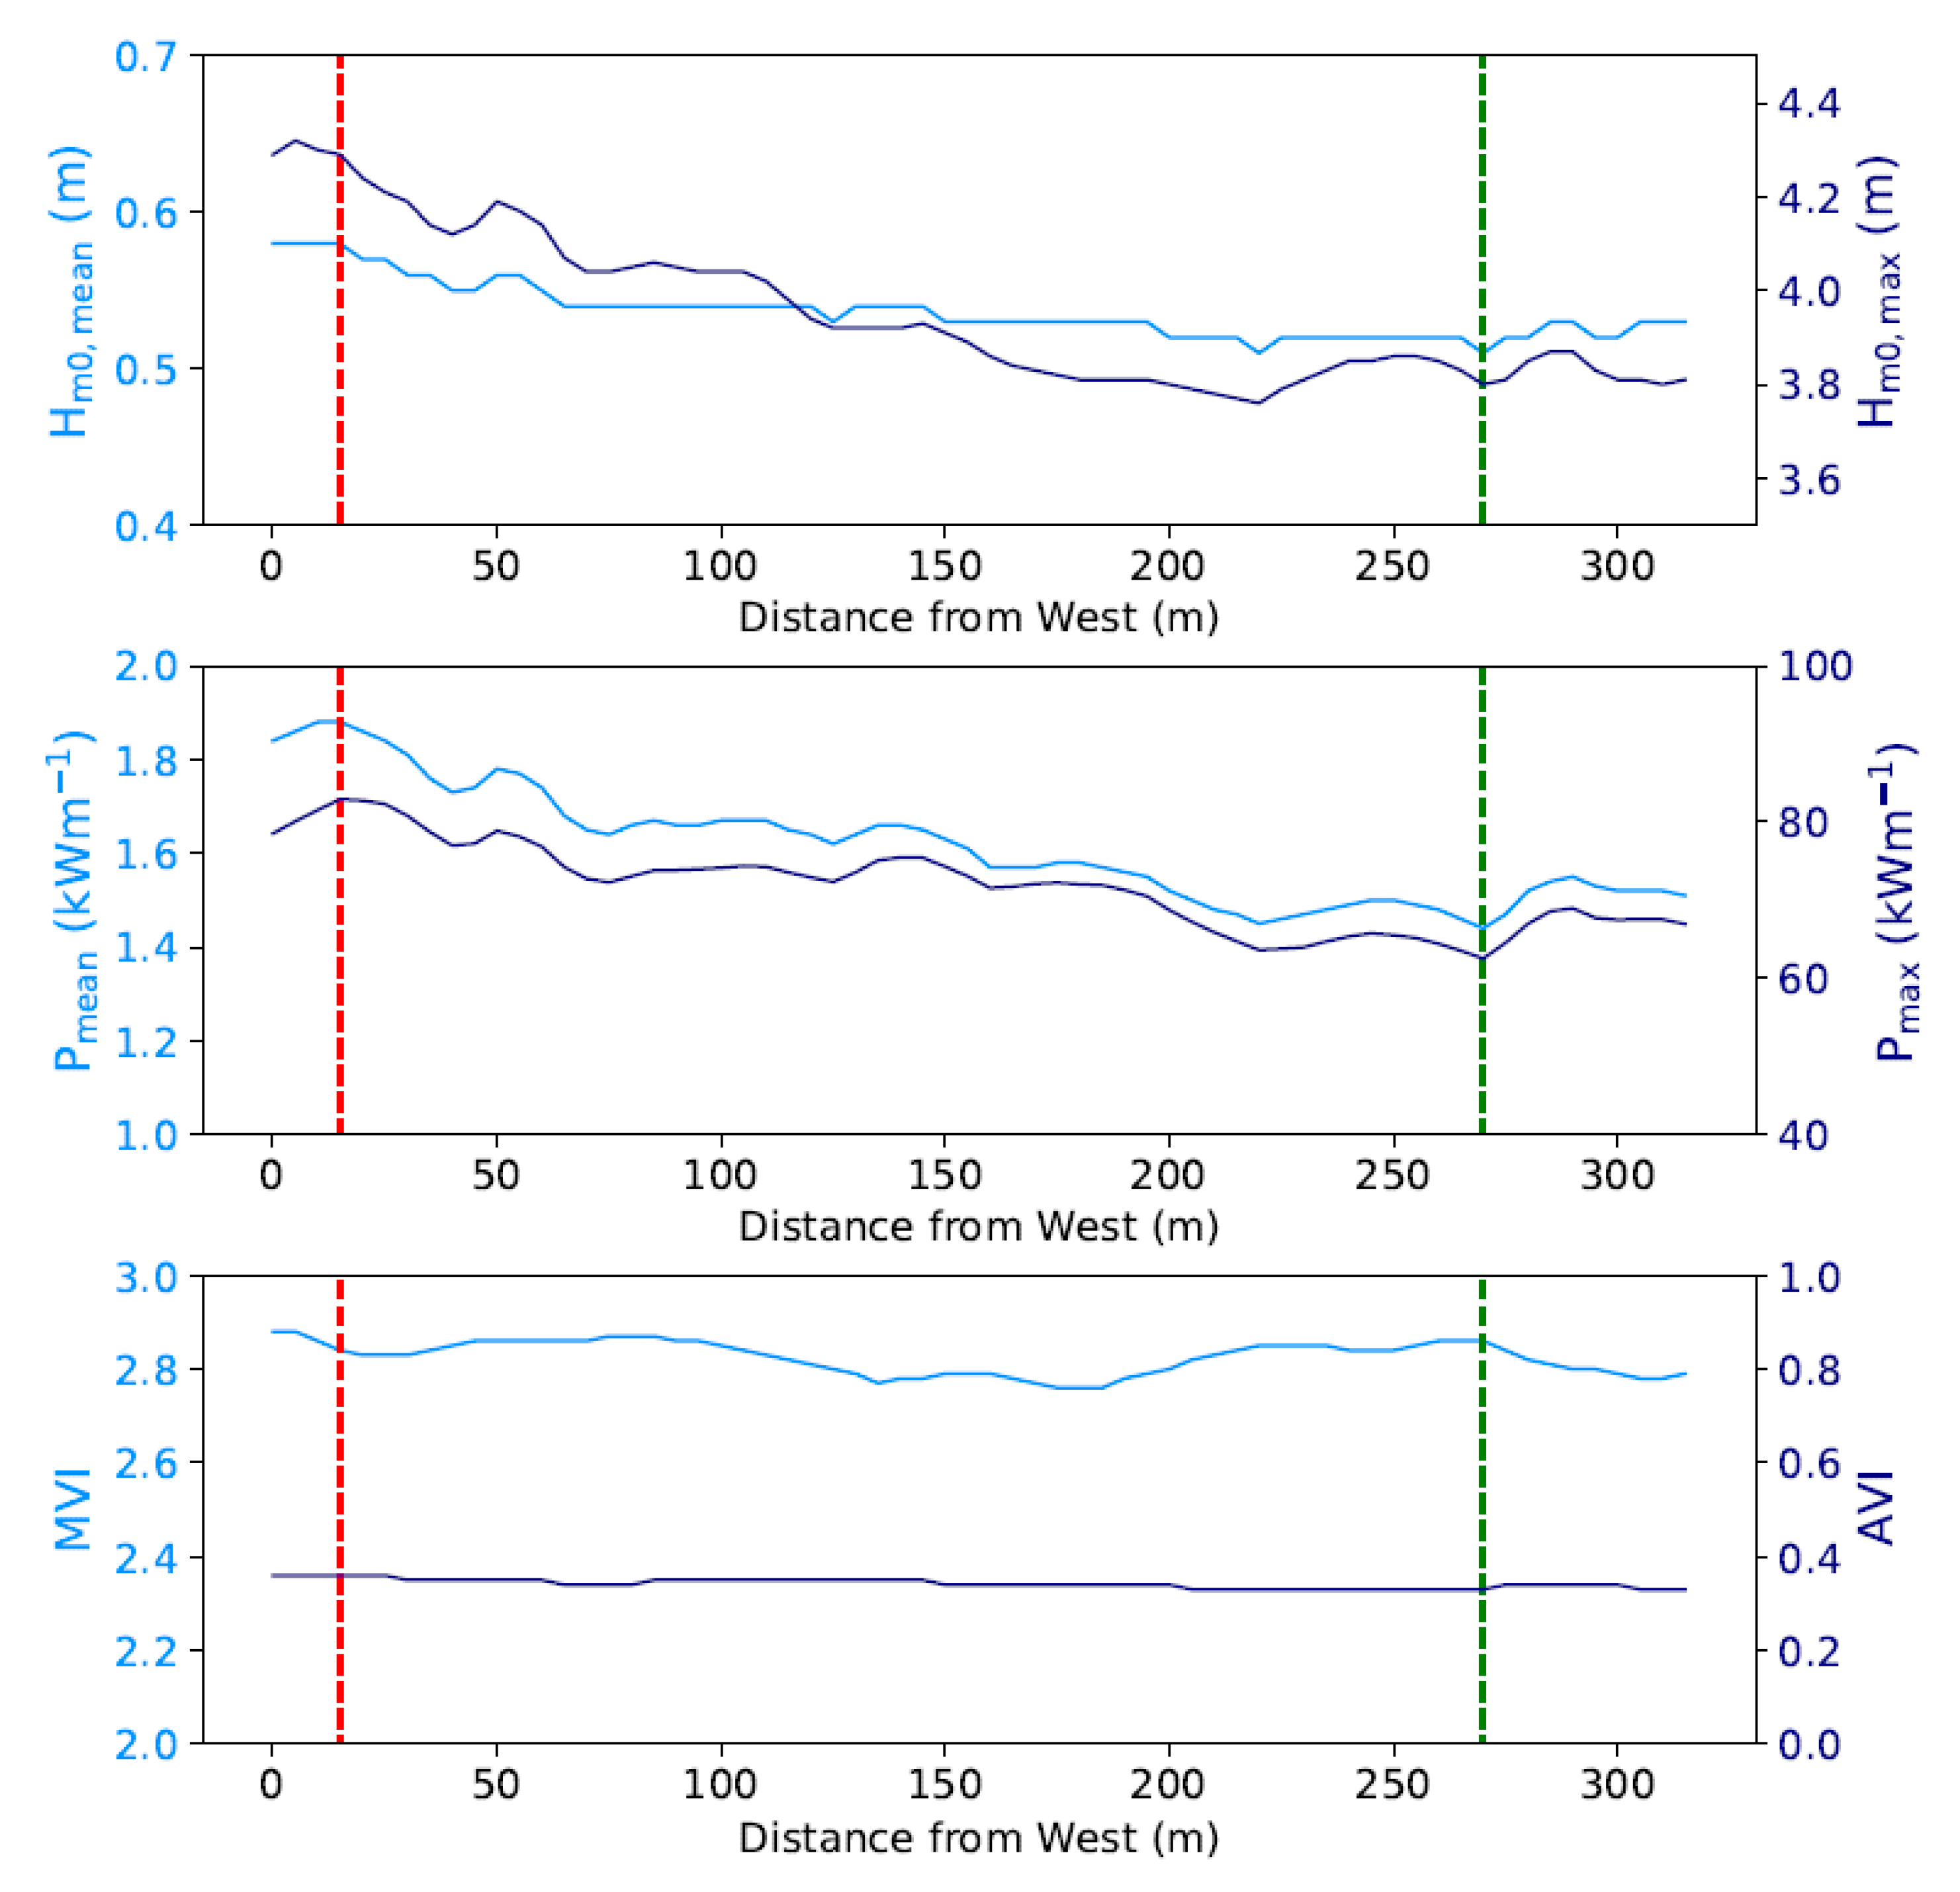
- In order to gain further insights about the spatiotemporal variability of the wave energy flux in the vicinity of the harbour, these predictions were exploited to produce a hindcast database of the available resource, over the ten-year period from 2006 to 2015, along a line offset at a distance of 100 m from the breakwater. The surroundings of the harbour showed a spatial gradient in the distribution of significant wave height and energy flux, associated with increased exposure of the northwestern area off the rockfill section at the foot of the breakwater.
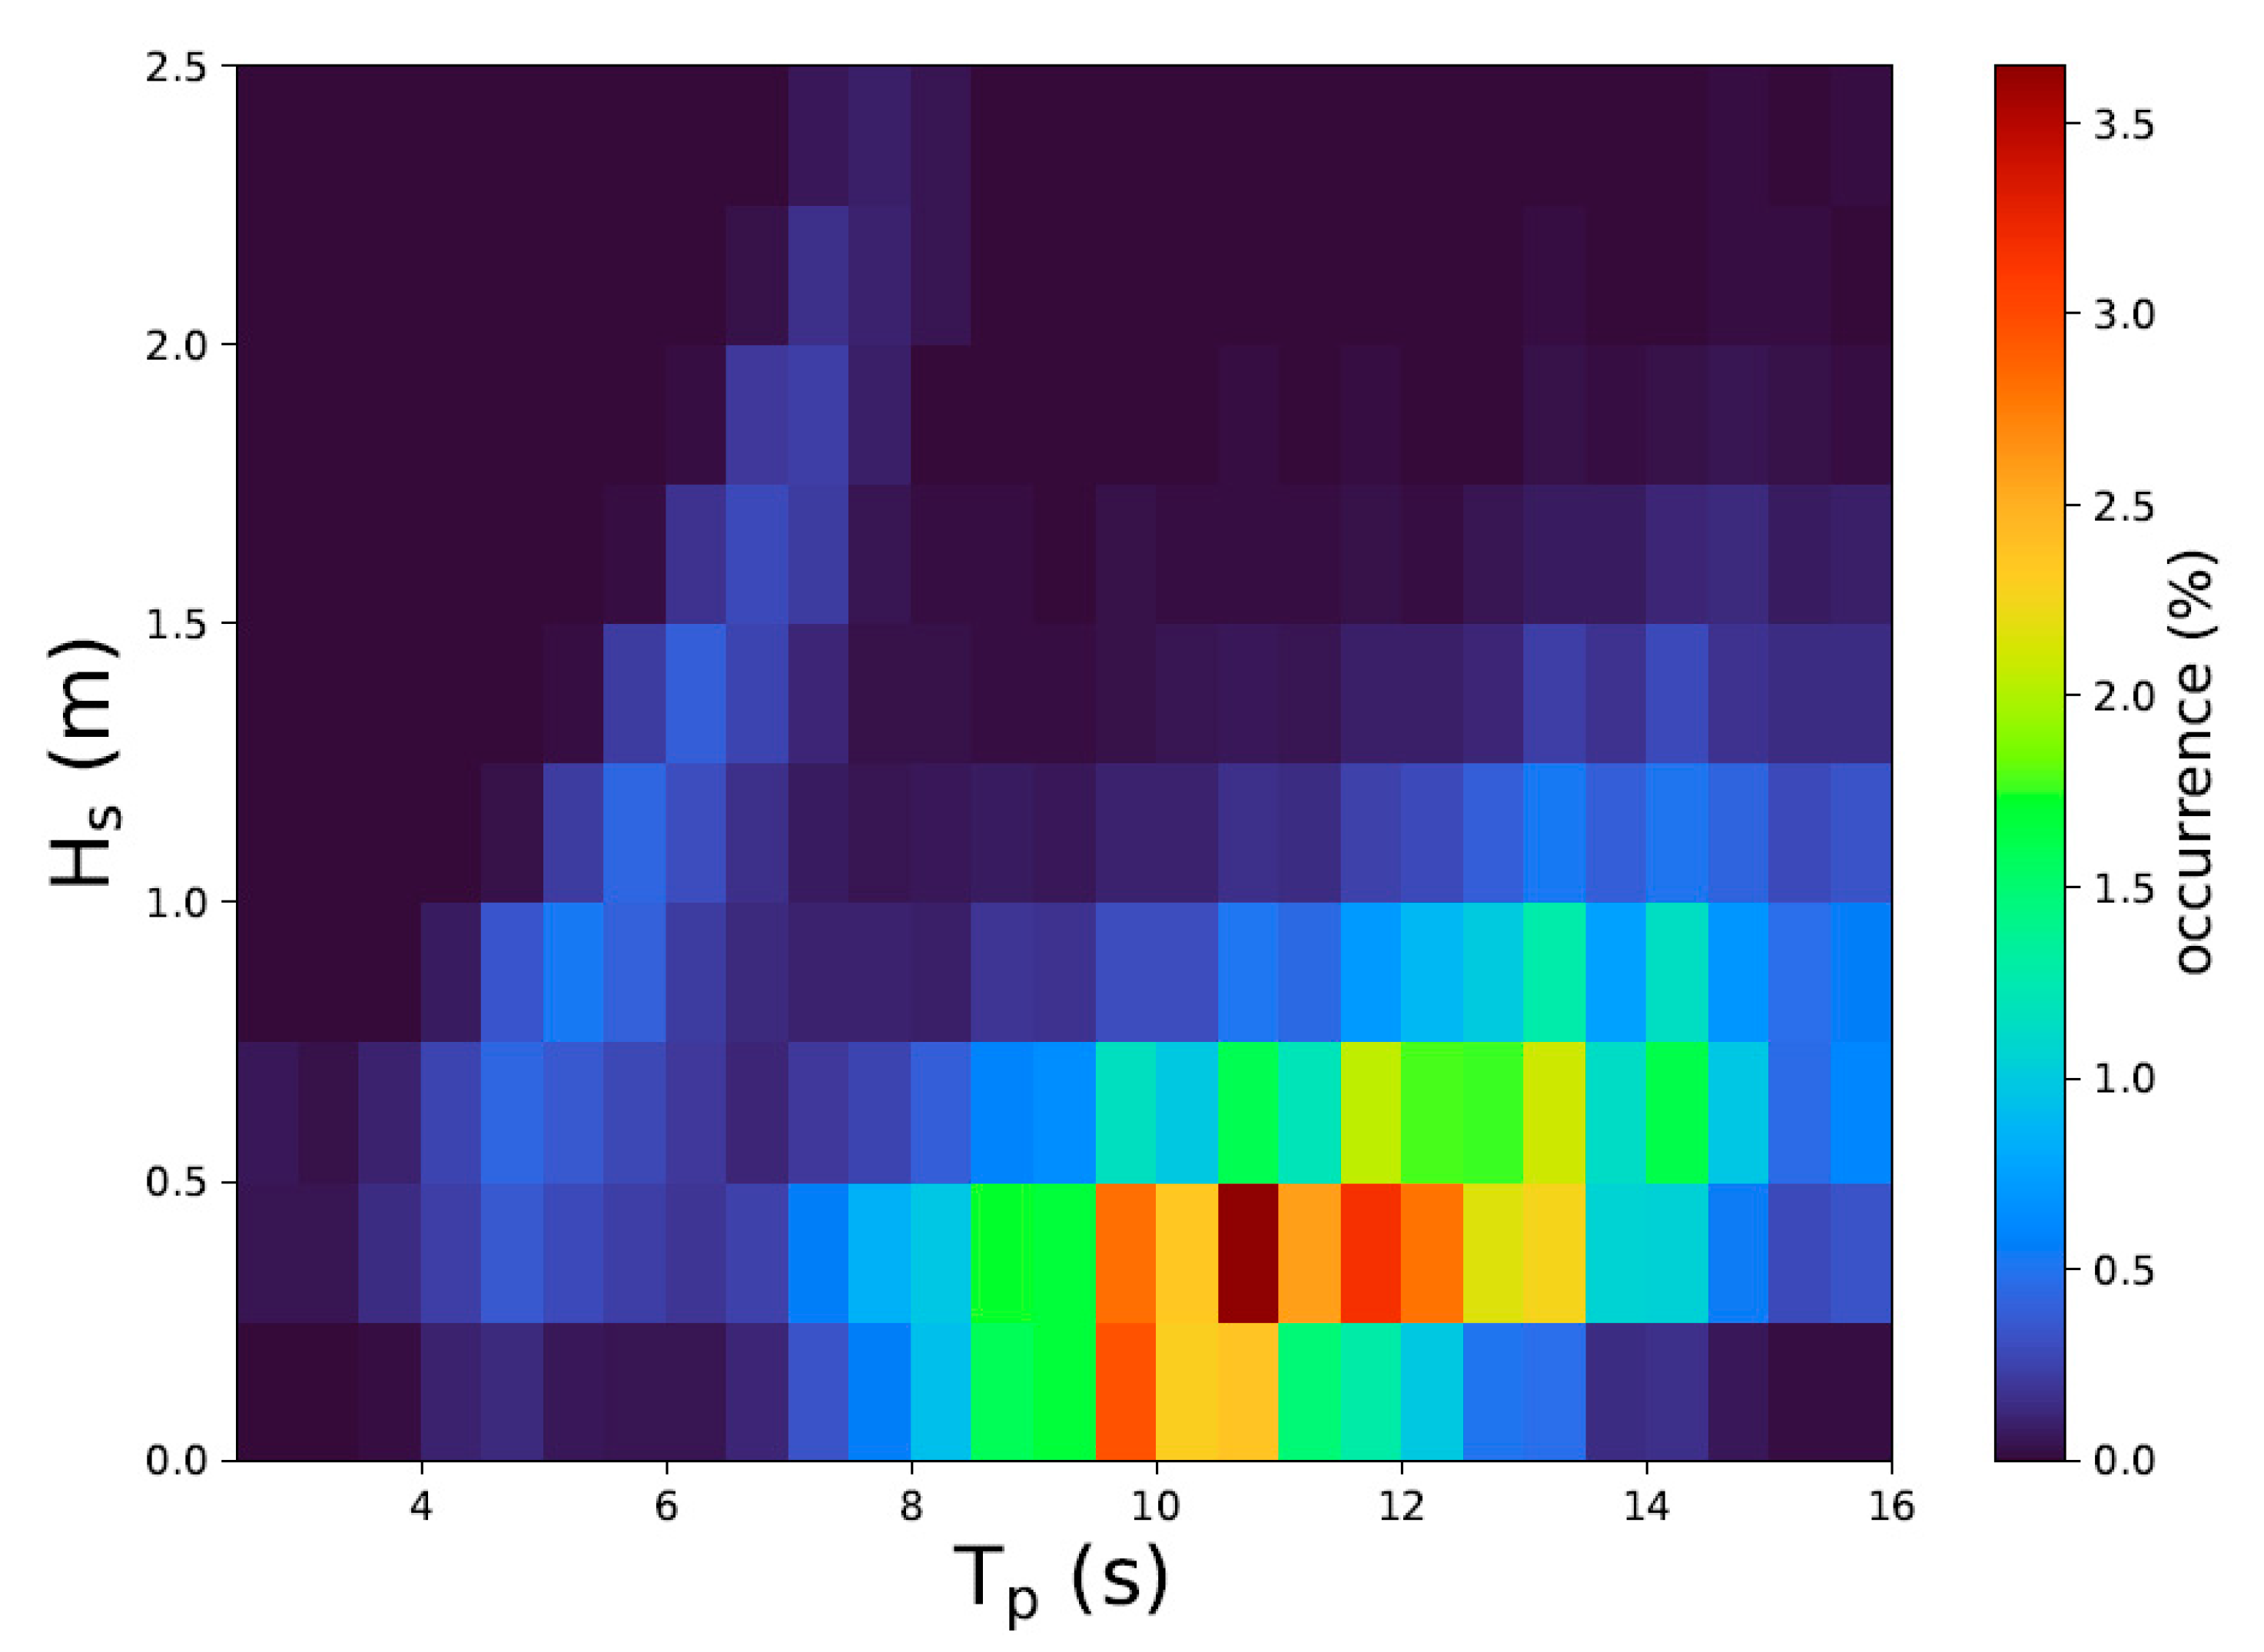
- Along this line, the available resource was characterised by increased seasonal and monthly variability, exhibiting prominent differences between the winter and the summer periods. It showed, however, more restricted differences at the annual scales.
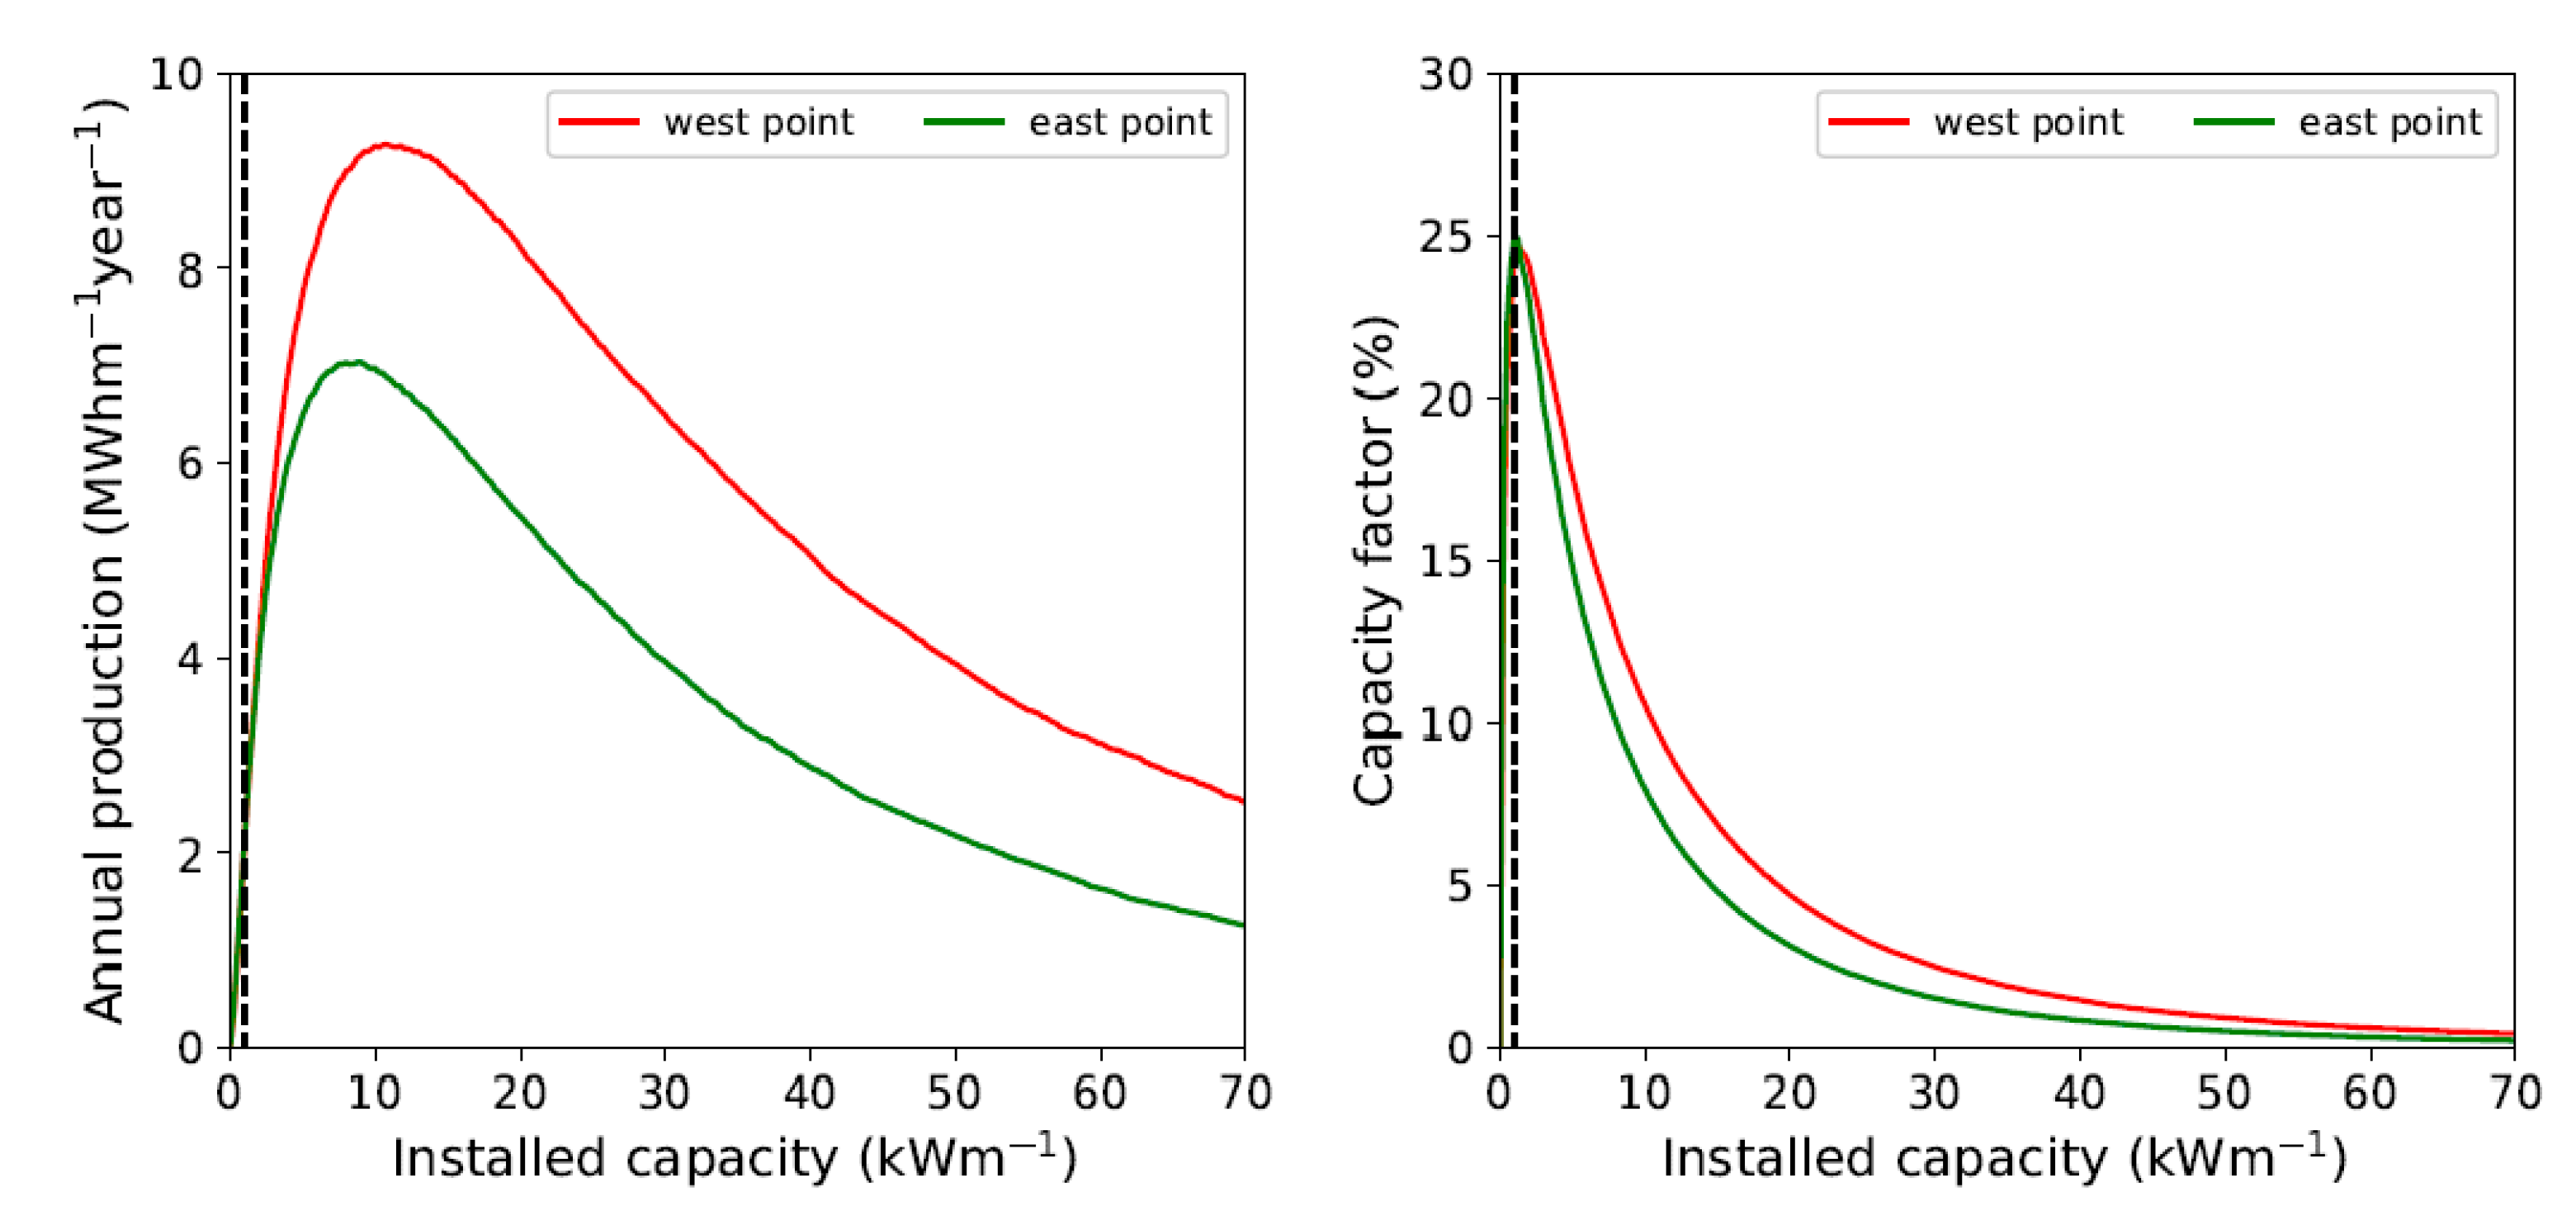
- The generic assessment of WEC energy production showed increased performance for a low capacity installation, exhibiting the interest of the site of application for the implementation of small-scale devices. Thus, the refined evaluation based on scaled power matrices derived from the Oyster technology confirmed this first assessment. Furthermore, the capacity factor was characterised by increased seasonal variability reaching values over 20% during the winter period.
Author Contributions
Funding
Institutional Review Board Statement
Informed Consent Statement
Data Availability Statement
Acknowledgments
Conflicts of Interest
References
- Cascajo, R.; García, E.; Quiles, E.; Correcher, A.; Morant, F. Integration of Marine Wave Energy Converters into Seaports: A Case Study in the Port of Valencia. Energies 2019, 12, 787. [Google Scholar] [CrossRef]
- Sergent, P.; Baudry, V.; De Bonviller, A.; Michard, B.; Dugor, J. Numerical Assessment of Onshore Wave Energy in France: Wave Energy, Conversion and Cost. J. Mar. Sci. Eng. 2020, 8, 947. [Google Scholar] [CrossRef]
- Ingine Inc.—Harness Nature Power. Available online: https://ingine.co.kr/en/ (accessed on 15 June 2022).
- Eco Wave Power—Wave Energy Company. Available online: http://www.ecowavepower.com (accessed on 15 June 2022).
- Contestabile, P.; Di Lauro, E.; Buccino, M.; Vicinanza, D. Economic Assessment of Overtopping BReakwater for Energy Conversion (OBREC): A Case Study in Western Australia. Sustainability 2016, 9, 51. [Google Scholar] [CrossRef]
- Contestabile, P.; Ferrante, V.; Di Lauro, E.; Vicinanza, D. Prototype Overtopping Breakwater for Wave Energy Conversion at Port of Naples. In Proceedings of the 26th International Ocean and Polar Engineering Conference, Rhodes, Greece, 26 June 2016; p. ISOPE-I-16-418. [Google Scholar]
- Arena, F.; Romolo, A.; Malara, G.; Fiamma, V.; Laface, V. The First Full Operative U-OWC Plants in the Port of Civitavecchia. In Proceedings of the Volume 10: Ocean Renewable Energy; American Society of Mechanical Engineers: Trondheim, Norway, 2017. [Google Scholar]
- Ibarra-Berastegi, G.; Ulazia, A.; Sáenz, J.; Serras, P.; González Rojí, S.J.; Esnaola, G.; Iglesias, G. The Power Flow and the Wave Energy Flux at an Operational Wave Farm: Findings from Mutriku, Bay of Biscay. Ocean. Eng. 2021, 227, 108654. [Google Scholar] [CrossRef]
- Guillou, N.; Lavidas, G.; Chapalain, G. Wave Energy Resource Assessment for Exploitation—A Review. J. Mar. Sci. Eng. 2020, 8, 705. [Google Scholar] [CrossRef]
- IEC. Marine Energy—Wave, Tidal and Other Water Current Converters—Part 101: Wave Energy Resource Assessment and Characterization; International Electrotechnical Commission/Technical Specification: Geneva, Switzerland, 2014. [Google Scholar]
- ISO. Petroleum and Natural Gas Industries—Specific Requirements for Offshore Structures—Part 1: Metocean Design and Operating Considerations; The International Organization for Standardization: Geneva, Switzerland, 2015. [Google Scholar]
- IMAREST. Metocean Procedures Guide for Offshore Renewables; Institute of Marine Engineering, Science & Technology (Offshore Renewables Special Interest Group): London, UK, 2018. [Google Scholar]
- Reguero, B.G.; Losada, I.J.; Méndez, F.J. A Recent Increase in Global Wave Power as a Consequence of Oceanic Warming. Nat. Commun. 2019, 10, 205. [Google Scholar] [CrossRef] [PubMed]
- Penalba, M.; Aizpurua, J.I.; Martinez-Perurena, A.; Iglesias, G. A Data-Driven Long-Term Metocean Data Forecasting Approach for the Design of Marine Renewable Energy Systems. Renew. Sustain. Energy Rev. 2022, 167, 112751. [Google Scholar] [CrossRef]
- Lastiri, X.; Abadie, S.; Maron, P.; Delpey, M.; Liria, P.; Mader, J.; Roeber, V. Wave Energy Assessment in the South Aquitaine Nearshore Zone from a 44-Year Hindcast. JMSE 2020, 8, 199. [Google Scholar] [CrossRef]
- Booij, N.; Ris, R.C.; Holthuijsen, L.H. A Third-Generation Wave Model for Coastal Regions: 1. Model Description and Validation. J. Geophys. Res. Ocean. 1999, 104, 7649–7666. [Google Scholar] [CrossRef]
- Cascajo, R.; García, E.; Quiles, E.; Morant, F.; Correcher, A. Wave Energy Assessment at Valencia Gulf and Comparison of Energy Production of Most Suitable Wave Energy Converters. IJERPH 2020, 17, 8473. [Google Scholar] [CrossRef]
- Cameron, L.; Doherty, K.; Doherty, R.; Henry, A.; Van’t Hoff, J.; Kaye, D.; Naylor, D.; Bourdier, S.; Whittaker, T. Design of the Next Generation of the Oyster Wave Energy Converter. In Proceedings of the 3rd International Conference on Ocean Energy, Bilbao, Spain, 6–9 October 2010. [Google Scholar]
- O’Boyle, L.; Doherty, K.; Hoff, J.V.; Skelton, J. The Value of Full Scale Prototype Data—Testing Oyster 800 at EMEC, Orkney. In Proceedings of the 11th European Wave and Tidal Energy Conference (EWTEC), Nantes, France, 6–11 September 2015. [Google Scholar]
- SHOM. 2022. Available online: https://www.data.shom.fr (accessed on 5 July 2022).
- Holthuijsen, L.H. Waves in Oceanic and Coastal Waters, 1st ed.; Cambridge University Press: Cambridge, UK, 2007; ISBN 978-0-521-86028-4. [Google Scholar]
- Guillou, N. Modelling Effects of Tidal Currents on Waves at a Tidal Stream Energy Site. Renew. Energy 2017, 114, 180–190. [Google Scholar] [CrossRef]
- Komen, G.J.; Cavaleri, L.; Donelan, M.; Hasselmann, K.; Hasselmann, S.; Janssen, P.A.E.M. Dynamics and Modelling of Ocean Waves, 1st ed.; Cambridge University Press: Cambridge, UK, 1994; ISBN 978-0-521-57781-6. [Google Scholar]
- Rogers, W.E.; Babanin, A.V.; Wang, D.W. Observation-Consistent Input and Whitecapping Dissipation in a Model for Wind-Generated Surface Waves: Description and Simple Calculations. J. Atmos. Ocean. Technol. 2012, 29, 1329–1346. [Google Scholar] [CrossRef]
- Hasselmann, S.; Hasselmann, K.; Allender, J.H.; Barnett, T.P. Computations and Parameterizations of the Nonlinear Energy Transfer in a Gravity-Wave Specturm. Part II: Parameterizations of the Nonlinear Energy Transfer for Application in Wave Models. J. Phys. Oceanogr. 1985, 15, 1378–1391. [Google Scholar] [CrossRef]
- Bouws, E.; Komen, G.J. On the Balance Between Growth and Dissipation in an Extreme Depth-Limited Wind-Sea in the Southern North Sea. J. Phys. Oceanogr. 1983, 13, 1653–1658. [Google Scholar] [CrossRef]
- Eldeberky, Y.; Battjes, J.A. Spectral Modeling of Wave Breaking: Application to Boussinesq Equations. J. Geophys. Res. Ocean. 1996, 101, 1253–1264. [Google Scholar] [CrossRef]
- Battjes, J.A.; Janssen, J.P.F.M. Energy Loss and Set-up Due to Breaking Random Waves. In Proceedings of the 16th Conference on Coastal Engineering, Hamburg, Germany, 27 August–3 September 1978. [Google Scholar]
- The SWAN Team. SWAN—Scientific and Technical Documentation; Delft University of Technology: Delft, The Netherlands, 2017. [Google Scholar]
- SHOM. MNT Bathymétrique de façade Atlantique (Projet HOMONIM); Technical Report; 2015. [Google Scholar] [CrossRef]
- SHOM. Litto3D—Version 1.0—Descriptif Du Contenu; Technical Report; 2015; p. 32. [Google Scholar]
- Pierson, W.J., Jr.; Moskowitz, L. A Proposed Spectral Form for Fully Developed Wind Seas Based on the Similarity Theory of S. A. Kitaigorodskii. J. Geophys. Res. 1964, 69, 5181–5190. [Google Scholar] [CrossRef]
- Boudière, E.; Maisondieu, C.; Ardhuin, F.; Accensi, M.; Pineau-Guillou, L.; Lepesqueur, J. A Suitable Metocean Hindcast Database for the Design of Marine Energy Converters. Int. J. Mar. Energy 2013, 3–4, e40–e52. [Google Scholar] [CrossRef]
- MARC—Modélisation et Analyse Pour La Recherche Cotière. Available online: https://marc.ifremer.fr/ (accessed on 15 June 2022).
- Hanna, S.R.; Heinold, D. Development and Application of a Simple Method for Evaluating Air Quality; American Petroleum Institute: Washington, DC, USA; Health and Environmental Affairs Department: Washington, DC, USA, 1985. [Google Scholar]
- Kalourazi, M.Y.; Siadatmousavi, S.M.; Yeganeh-Bakhtiary, A.; Jose, F. WAVEWATCH-III Source Terms Evaluation for Optimizing Hurricane Wave Modeling: A Case Study of Hurricane Ivan. Oceanologia 2021, 63, 194–213. [Google Scholar] [CrossRef]
- Mentaschi, L.; Besio, G.; Cassola, F.; Mazzino, A. Problems in RMSE-Based Wave Model Validations. Ocean. Model. 2013, 72, 53–58. [Google Scholar] [CrossRef]
- Cornett, A. A Global Wave Energy Resource Assessment. In Proceedings of the International Offshore and Polar Engineering Conference, Vancouver, BC, Canada, 6 July 2008. [Google Scholar]
- Gonçalves, M.; Martinho, P.; Guedes Soares, C. A 33-Year Hindcast on Wave Energy Assessment in the Western French Coast. Energy 2018, 165, 790–801. [Google Scholar] [CrossRef]
- Guillou, N. Evaluation of Wave Energy Potential in the Sea of Iroise with Two Spectral Models. Ocean. Eng. 2015, 106, 141–151. [Google Scholar] [CrossRef]
- Guillou, N.; Chapalain, G. Numerical Modelling of Nearshore Wave Energy Resource in the Sea of Iroise. Renew. Energy 2015, 83, 942–953. [Google Scholar] [CrossRef]
- Neill, S.P.; Hashemi, M.R. Wave Power Variability over the Northwest European Shelf Seas. Appl. Energy 2013, 106, 31–46. [Google Scholar] [CrossRef]
- Mentaschi, L.; Besio, G.; Cassola, F.; Mazzino, A. Performance Evaluation of Wavewatch III in the Mediterranean Sea. Ocean. Model. 2015, 90, 82–94. [Google Scholar] [CrossRef]
- Guillou, N.; Chapalain, G. Assessment of Wave Power Variability and Exploitation with a Long-Term Hindcast Database. Renew. Energy 2020, 154, 1272–1282. [Google Scholar] [CrossRef]
- Portilla, J.; Sosa, J.; Cavaleri, L. Wave Energy Resources: Wave Climate and Exploitation. Renew. Energy 2013, 57, 594–605. [Google Scholar] [CrossRef]
- Payne, G. Guidance for the Experimental Tank Testing of Wave Energy Converters. Supergen Mar. 2008, 254, 1–51. [Google Scholar]
- O’Connor, M.; Lewis, T.; Dalton, G. Techno-Economic Performance of the Pelamis P1 and Wavestar at Different Ratings and Various Locations in Europe. Renew. Energy 2013, 50, 889–900. [Google Scholar] [CrossRef]
- Bozzi, S.; Archetti, R.; Passoni, G. Wave Electricity Production in Italian Offshore: A Preliminary Investigation. Renew. Energy 2014, 62, 407–416. [Google Scholar] [CrossRef]
- Majidi, A.; Bingölbali, B.; Akpınar, A.; Iglesias, G.; Jafali, H. Downscaling Wave Energy Converters for Optimum Performance in Low-Energy Seas. Renew. Energy 2021, 168, 705–722. [Google Scholar] [CrossRef]
- Majidi Nezhad, M.; Groppi, D.; Rosa, F.; Piras, G.; Cumo, F.; Garcia, D.A. Nearshore Wave Energy Converters Comparison and Mediterranean Small Island Grid Integration. Sustain. Energy Technol. Assess. 2018, 30, 68–76. [Google Scholar] [CrossRef]
- Bozzi, S.; Besio, G.; Passoni, G. Wave Power Technologies for the Mediterranean Offshore: Scaling and Performance Analysis. Coast. Eng. 2018, 136, 130–146. [Google Scholar] [CrossRef]
- Babarit, A.; Hals, J.; Muliawan, M.J.; Kurniawan, A.; Moan, T.; Krokstad, J. Numerical Benchmarking Study of a Selection of Wave Energy Converters. Renew. Energy 2012, 41, 44–63. [Google Scholar] [CrossRef]
- Baudry, V.; Marrone, S.; Babarit, A.; Le Touzé, D.; Clément, A.H. Power Matrix Assessment and Extreme Loads Estimation on a Flap Type Wave Energy Converter in Front of a Dike. In Proceedings of the EWTEC, Nantes, France, 6–11 September 2015. [Google Scholar]
- Carballo, R.; Sánchez, M.; Ramos, V.; Fraguela, J.A.; Iglesias, G. The Intra-Annual Variability in the Performance of Wave Energy Converters: A Comparative Study in N Galicia (Spain). Energy 2015, 82, 138–146. [Google Scholar] [CrossRef]
- Silva, D.; Rusu, E.; Soares, C. Evaluation of Various Technologies for Wave Energy Conversion in the Portuguese Nearshore. Energies 2013, 6, 1344–1364. [Google Scholar] [CrossRef]
- Guillou, N.; Chapalain, G. Annual and Seasonal Variabilities in the Performances of Wave Energy Converters. Energy 2018, 165, 812–823. [Google Scholar] [CrossRef]


| Wave Buoys | Hm0 | Tp | Dirmean | |||||
|---|---|---|---|---|---|---|---|---|
| MAE | NBI | HH | MAE | NBI | HH | NBIθ | NRMSEθ | |
| 02922 | 0.25 m | 0.12 | 0.19 | 0.99 s | 0.04 | 0.16 | 0.018 | 0.05 |
| 02910 | 0.13 m | 0.13 | 0.32 | 2.70 s | 0.27 | 0.40 | 0.0004 | 0.05 |
Publisher’s Note: MDPI stays neutral with regard to jurisdictional claims in published maps and institutional affiliations. |
© 2022 by the authors. Licensee MDPI, Basel, Switzerland. This article is an open access article distributed under the terms and conditions of the Creative Commons Attribution (CC BY) license (https://creativecommons.org/licenses/by/4.0/).
Share and Cite
Guillou, N.; Chapalain, G.; Sergent, P. Wave Energy Resource Assessment for Small-Scale WEC near a Harbour. J. Mar. Sci. Eng. 2022, 10, 1081. https://doi.org/10.3390/jmse10081081
Guillou N, Chapalain G, Sergent P. Wave Energy Resource Assessment for Small-Scale WEC near a Harbour. Journal of Marine Science and Engineering. 2022; 10(8):1081. https://doi.org/10.3390/jmse10081081
Chicago/Turabian StyleGuillou, Nicolas, Georges Chapalain, and Philippe Sergent. 2022. "Wave Energy Resource Assessment for Small-Scale WEC near a Harbour" Journal of Marine Science and Engineering 10, no. 8: 1081. https://doi.org/10.3390/jmse10081081
APA StyleGuillou, N., Chapalain, G., & Sergent, P. (2022). Wave Energy Resource Assessment for Small-Scale WEC near a Harbour. Journal of Marine Science and Engineering, 10(8), 1081. https://doi.org/10.3390/jmse10081081