Review

Rock Physics Modeling of Acoustic Properties in Gas Hydrate-Bearing Sediment

1
College of Engineering, Peking University, Beijing 100871, China
2
Beijing International Center for Gas Hydrate, School of Earth and Space Sciences, Peking University, Beijing 100871, China
3
Chinese Academy of Geological Sciences, Beijing 100037, China
*
Author to whom correspondence should be addressed.
J. Mar. Sci. Eng. 2022, 10(8), 1076; https://doi.org/10.3390/jmse10081076
Submission received: 11 May 2022 / Revised: 21 July 2022 / Accepted: 1 August 2022 / Published: 5 August 2022
(This article belongs to the Section Marine Energy)

Abstract

:
Gas hydrates (GH) are well known to have an influential effect on the velocity and attenuation of gas hydrate-bearing sediments (GHBS). Based on rock physics modeling, sediment velocity has been extensively used to characterize the distribution of gas hydrate. However, the results obtained from different models show a significant variation. In this study, we firstly review and compare the existing rock physics modeling for velocity and attenuation. The assumption, characteristics, theoretical basis, and workflow of the modeling are briefly introduced. The feasibility and limitations of the published models are then discussed and compared. This study provides insight into how to select a suitable rock physics model and how to conduct modeling in the application of the rock physics model to field data. Then, we introduce how to predict hydrate saturation, hydrate morphology, the dip angle of fracture, sediment permeability, and attenuation mechanisms from the comparison between the modeled and measured acoustic properties. The most important application of rock physics modeling is predicting the hydrate saturation and we discuss the uncertainties of the predicted saturation caused by the errors related to the velocity measurements or rock physics modeling. Finally, we discuss the current challenges in rock physics modeling related to optimizing the input parameters, choice of a suitable model, and upscaling problems from ultrasonic to seismic and well log frequencies.

1. Introduction

GH is a crystalline compound consisting of water and guest molecules that forms under high pressure and low temperature [1]. Great effort has been devoted to analyzing the potential of GH as a main alternative energy resource, and its important effects on global climate change and sub-marine geohazards [2,3,4,5,6]. Moreover, GH poses great challenges to the flow assurance in deepwater oil and gas exploitation and transportation because of the possible aggregation and flocculation caused by the coexistence of GH, asphaltenes, and resins in the pipelines [7,8,9]. The presence of GH indicates a finely balanced system in equilibrium, and the reduction in pressure and increase in temperature will cause the decomposition of GH [10,11].
The occurrence of GH accumulations under permafrost in polar continental shelves and the sediments beneath the ocean floor has triggered our interest in GH as an unconventional energy resource for the next few decades [3,12,13,14,15,16,17]. Although there still is disagreement over the concentration of GH within GHBS and the total amount of methane stored in GH accumulations, the estimated amount of methane in GH accumulations worldwide is considered to contain more potential energy than conventional oil, gas, and coal deposits [18,19,20,21]. The enormous amount of methane within GH accumulations and the widespread distribution of GHBS have been confirmed by previous studies [22]. Previous estimates of the available amount of methane in GH are highly varied over a wide range because direct sampling and analysis of GH in the natural state are an almost impossible task. It is challenging to retrieve intact GH samples during the coring process because of the unstable temperature and pressure conditions. Therefore, partially frozen systems are used as an analog for understanding GH occurrence because of their similar physical properties. The coexistence of hydrate, ice, and unfrozen water complicates the characterization of wave propagation in partially frozen sediments. Several rock physics approaches are applied to predict their acoustic properties [23,24,25,26,27]. Previous rock physical modeling indicated that the amount and pore-scale distribution of coexisting hydrate, ice, and unfrozen water significantly affect the acoustic properties of the partially frozen systems [26,27].
Collett (2002) indicated that whether the estimation of GH is accurate or not is dependent on the following reservoir parameters: coverage of the GH occurrence, reservoir conditions, reservoir thickness, sediment porosity, water, and GH saturation [28]. Some reservoir parameters can be estimated by the acoustic properties of GHBS which can be obtained from the field measurements such as the remote seismic method and the down-hole logging method [22]. Theoretical rock physics modeling can bridge the abovementioned reservoir parameters with the acoustic properties of GHBS. Moreover, rock physics modeling can provide a method to estimate the hydrate saturation from the acoustic properties in GHBS (P- and S-wave velocities and attenuations) [29,30,31,32,33,34]. However, previous studies indicated that the estimation based on different rock physics models varies significantly even for the same GHBS. Therefore, the choice of a rock physics model is crucial for the accurate estimation of GH in sediments. The main objective of this study is to review the existing rock physics models for GHBS and provide further insight into selecting a suitable model for a specific GHBS. Moreover, combing sediment velocity with attenuation will provide a method to accurately quantify the GH occurrence. This study also reviews how GH occurrence affects sediment attenuation by the rock physics method.
A series of recent field expeditions have provided new insights into the nature of GH occurrence. The confirmed GHBS occur in a wide variety of geologic settings, and the field data have indicated that the coarse-grained and fine-grained sands are superior GHBS due to their higher permeability [35]. Recently, the GH-filled fractures in clay-dominated reservoirs also became potential energy production targets [19,35]. Existing rock physics models generally assume the isotropic nature for sand-dominated sediment and the anisotropy nature for clay-dominated sediment. This study classifies the existing models into isotropic and anisotropic models to facilitate the application of these models to field data. The existing rock physics models also can characterize the acoustic properties of other reservoir types, such as the carbonate reservoir type, by introducing the mineral compositions in these reservoirs. Taking no account of the lithology type of GHBS, rock physics modeling will yield misleading hydrate saturation results. In this paper, we firstly review the acoustic properties of GHBS, including velocity and attenuation at various field investigation frequencies. According to the abovementioned classification of rock physics models, the commonly used rock physics models for GHBS are further introduced and compared. Finally, the application and challenges of rock physics models to field data will be discussed.

2. Acoustic Properties of GHBS at Various Frequency Domains

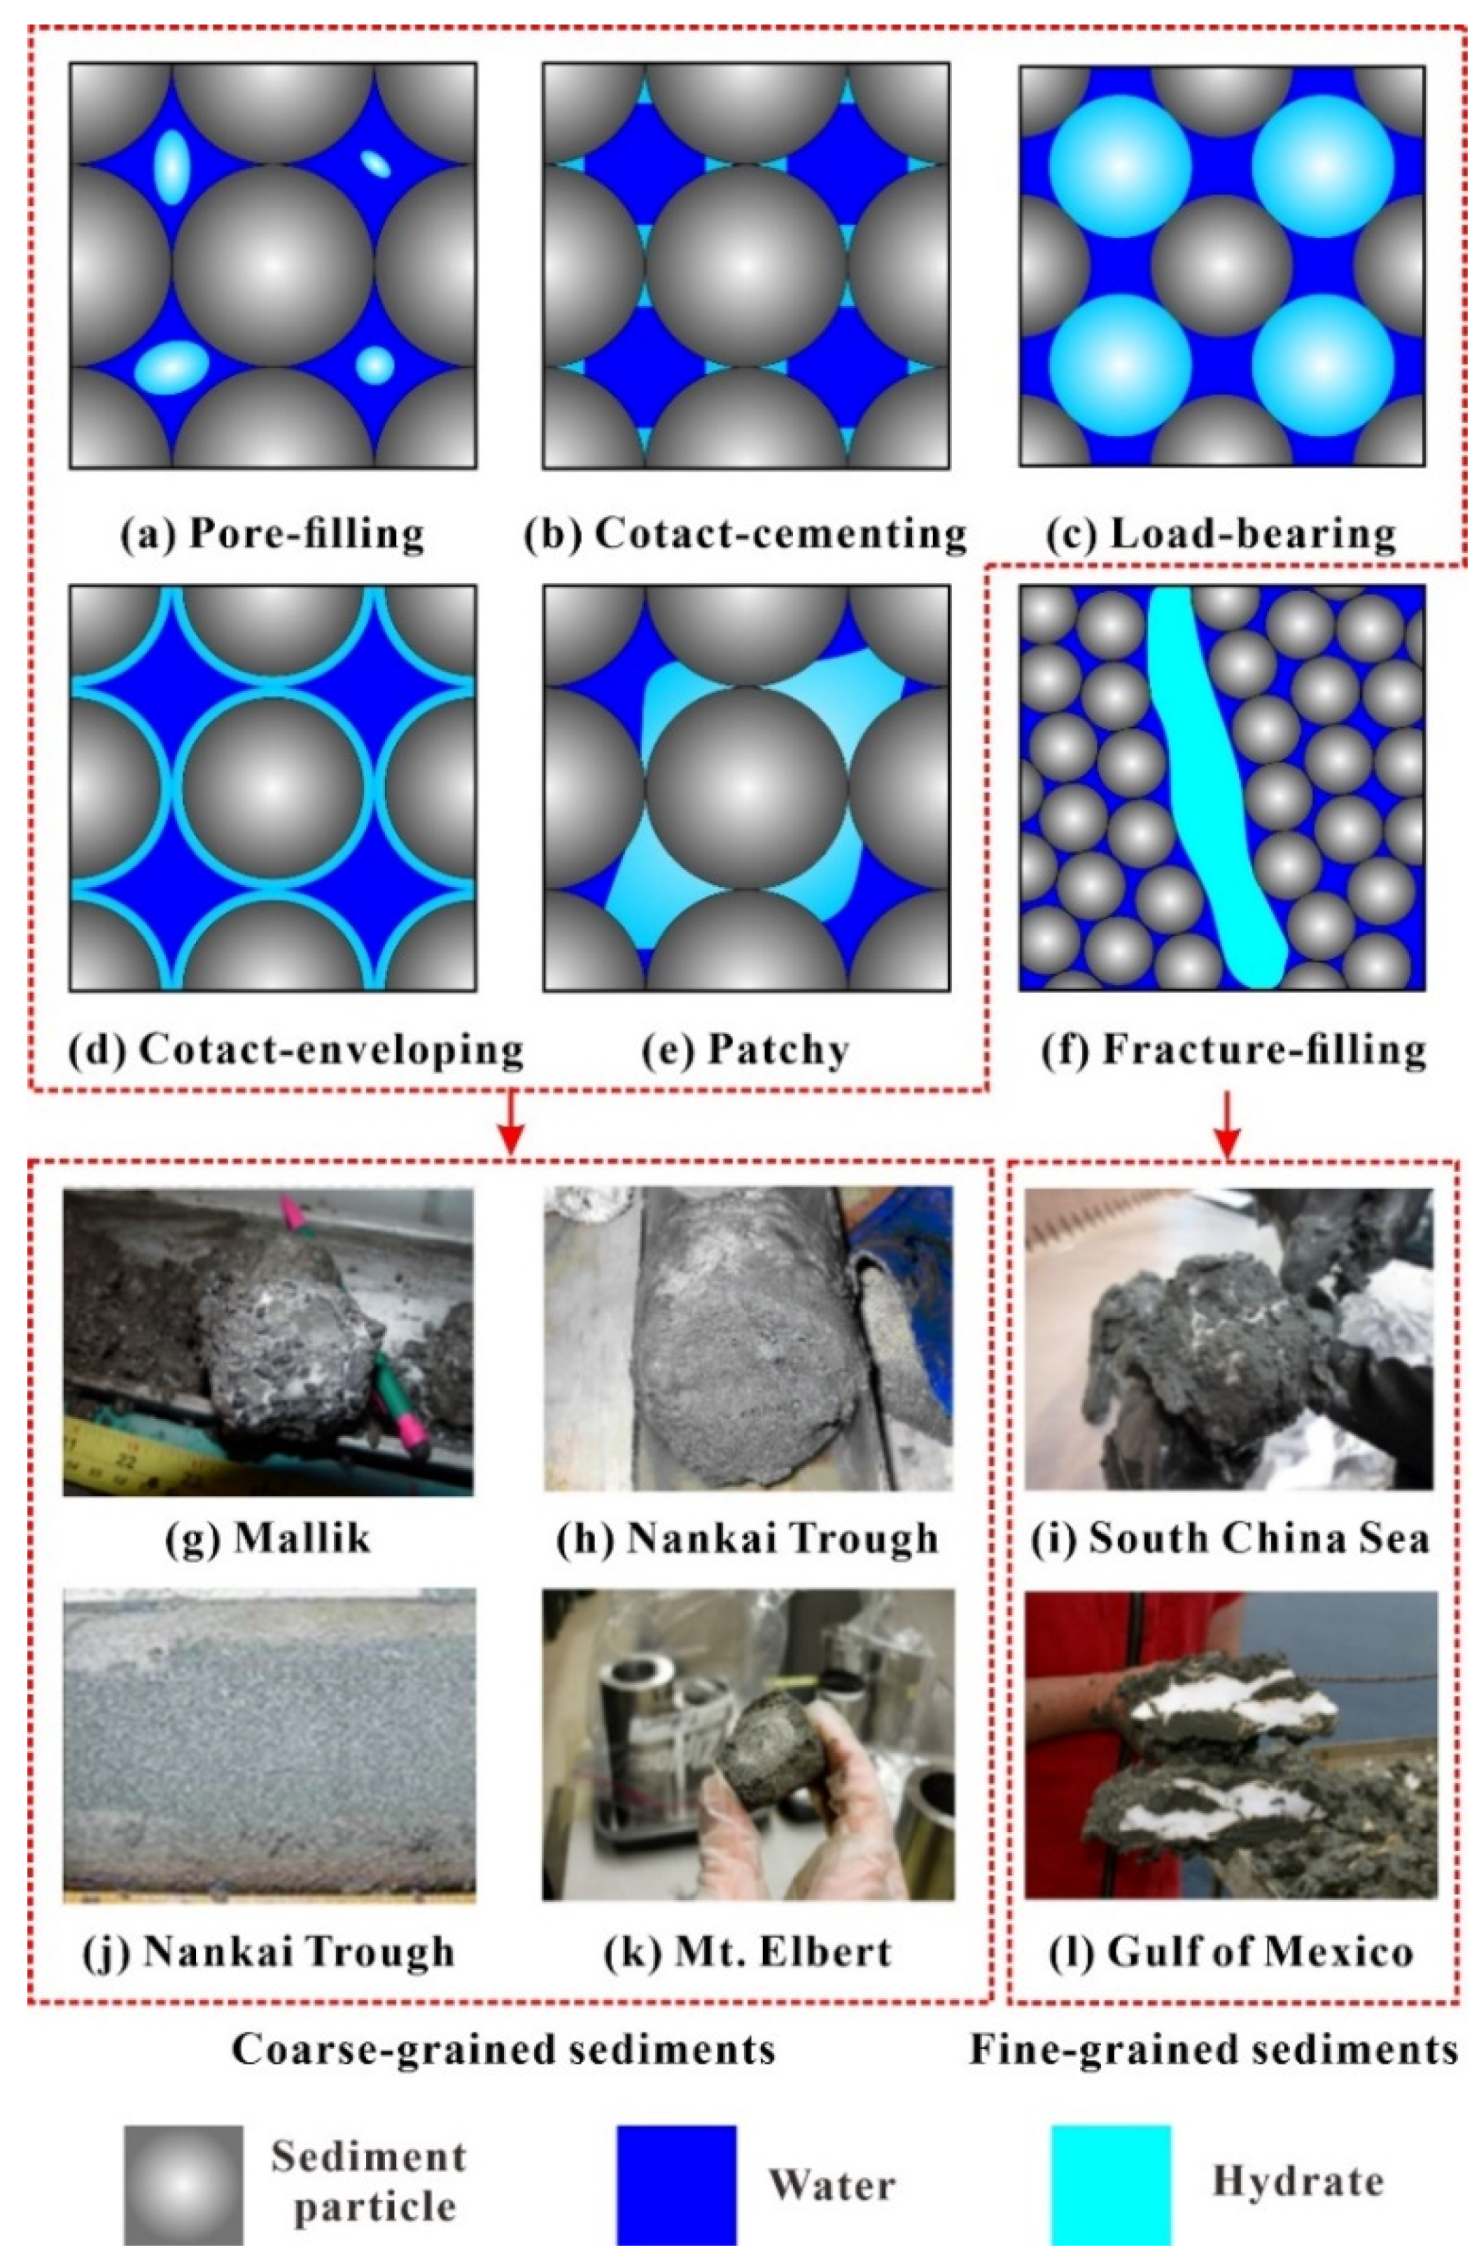
2.1. Gas Hydrate Morphology

It has been recognized that GH morphology combined with hydrate saturation significantly affects the acoustic properties of GHBS [36,37,38]. GH morphology provides information on the hydrate distribution and formation pattern in GHBS, and there seems to be no consensus on hydrate morphology even for the same geological environment because GH morphology is speculated to depend on the sediment lithology, pore structure, and GH saturation [37,39,40]. However, GH morphology is required information for most rock physics models in the prediction of velocity, attenuation, and hydrate saturation [41,42]. In coarse-grained sediment, GH usually grows with the following patterns: (1) free growth in the pores and without contact with sediment particles (pore-filling morphology) (Figure 1a); (2) intergranular growth at the contact between neighboring grains (contact cementing morphology) (Figure 1b); (3) growth as a sediment framework bridging neighboring sediment particles (load-bearing morphology) (Figure 1c); and (4) uniform growth coating the surface of sediment particles (envelope cementing morphology) (Figure 1d) [37,38,43]. In mature coarse-grained sediments, patchy hydrate morphology with pore space fully saturated by 100% hydrate can occur due to the Ostwald ripening in pore-filling conditions [40]. When the saturation of pore-filling hydrate is high enough to fill the connecting two or more pores, then the hydrate will become interpore-bridging patchy hydrate morphology (Figure 1e) [40,44,45]. GH in clay-dominated sediment usually forms with a larger size than the original fracture pores and then moves apart from the neighboring sediment particles, generating grain displacement hydrate (Figure 1f) [43,46,47,48]. Figure 1g,h,j,k shows the field hydrate morphology in the coarse-grained sediments in the Mallik, Nankai Trough, and Mt. Elbert [43]. The hydrates distributed in the pores of coarse-grained GHBS are not readily visible [43]. The GH morphology in fine-grained sediments was recognized as hydrate lenses, nodules, and veins by the nature hydrate cores in the South China Sea and Gulf of Mexico (Figure 1i,l) [43,48].

2.2. Acoustic Properties of GHBS

The presence of GH essentially affects the physical properties of GHBS including shear strength, porosity, permeability, and geophysical properties including resistivity, velocity, and attenuation [22,37]. Among these geophysical anomalies, the velocity and attenuation of P- and S-waves have been extensively used to characterize the occurrence and distribution of hydrate and assess the hydrate saturation of GHBS [37]. This study mainly focuses on how the presence of GH affects the P- and S-wave velocities and attenuations. In this section, hydrate morphologies and attenuation mechanisms associated with GH proposed in previous studies are reviewed.

2.2.1. Wave Velocity

It is generally considered that the pore space in GHBS is occupied by GH, whereas free gas is commonly trapped beneath the GHBS [49,50,51]. The presence of GH makes the sediments stiffer, and it might cement the grains together, and then cause the bulk and shear moduli to significantly increase, thus increasing both P- and S-wave velocities. However, the degree of increase in velocity is dependent on the hydrate saturation and hydrate morphology [38,52]. In addition, it is believed that a small amount of free gas will dramatically decrease the P-wave velocity because of the significant reduction in sediment bulk modulus, and the fact that the P-wave velocity of free gas-bearing sediment is strongly dependent on the distribution type of free gas and gas bubble size [49]. There is no effect of free gas on the S-wave velocity because S-waves cannot travel through fluid phases [29,53].
The rock physics model can provide a tool to relate P- and S-wave velocities to hydrate saturation, hydrate morphology, porosity, and physical properties of sediment mineral, pore fluid, and hydrate. Previous rock physics modeling has taken into account the effect of hydrate morphology on velocity [54,55,56,57]. The disseminated hydrate tends to form pore-filling hydrate at low hydrate saturation, while it tends to become load-bearing sediments as hydrate saturation exceeds 25–40% [38,52]. The velocities of P- and S- waves for cementing hydrate sharply increase even at a low hydrate saturation (< 3%), conversely those are insensitive to hydrate saturation until hydrate saturation exceeds 40% for load-bearing and pore-filling hydrate [58,59,60] (Figure 2a–d). Previous ultrasonic measurements indicated that for hydrate saturation above 15%, the hydrate morphology will transform from pore-filling hydrate morphology into patchy hydrate morphology, and the corresponding P-wave velocity will increase more steeply [44,45] (Figure 2e). The distribution of free gas in sediments is commonly assumed to be either uniform type, water and gas being evenly distributed in the pores, or patchy type, pores fully saturated with water and dry pores only filled with gas [55,61,62,63] (Figure 2f,g). The P-wave velocity of free gas-bearing sediment strongly depends on the distribution type of free gas in the sediment pores, and this issue is beyond the scope of this study.

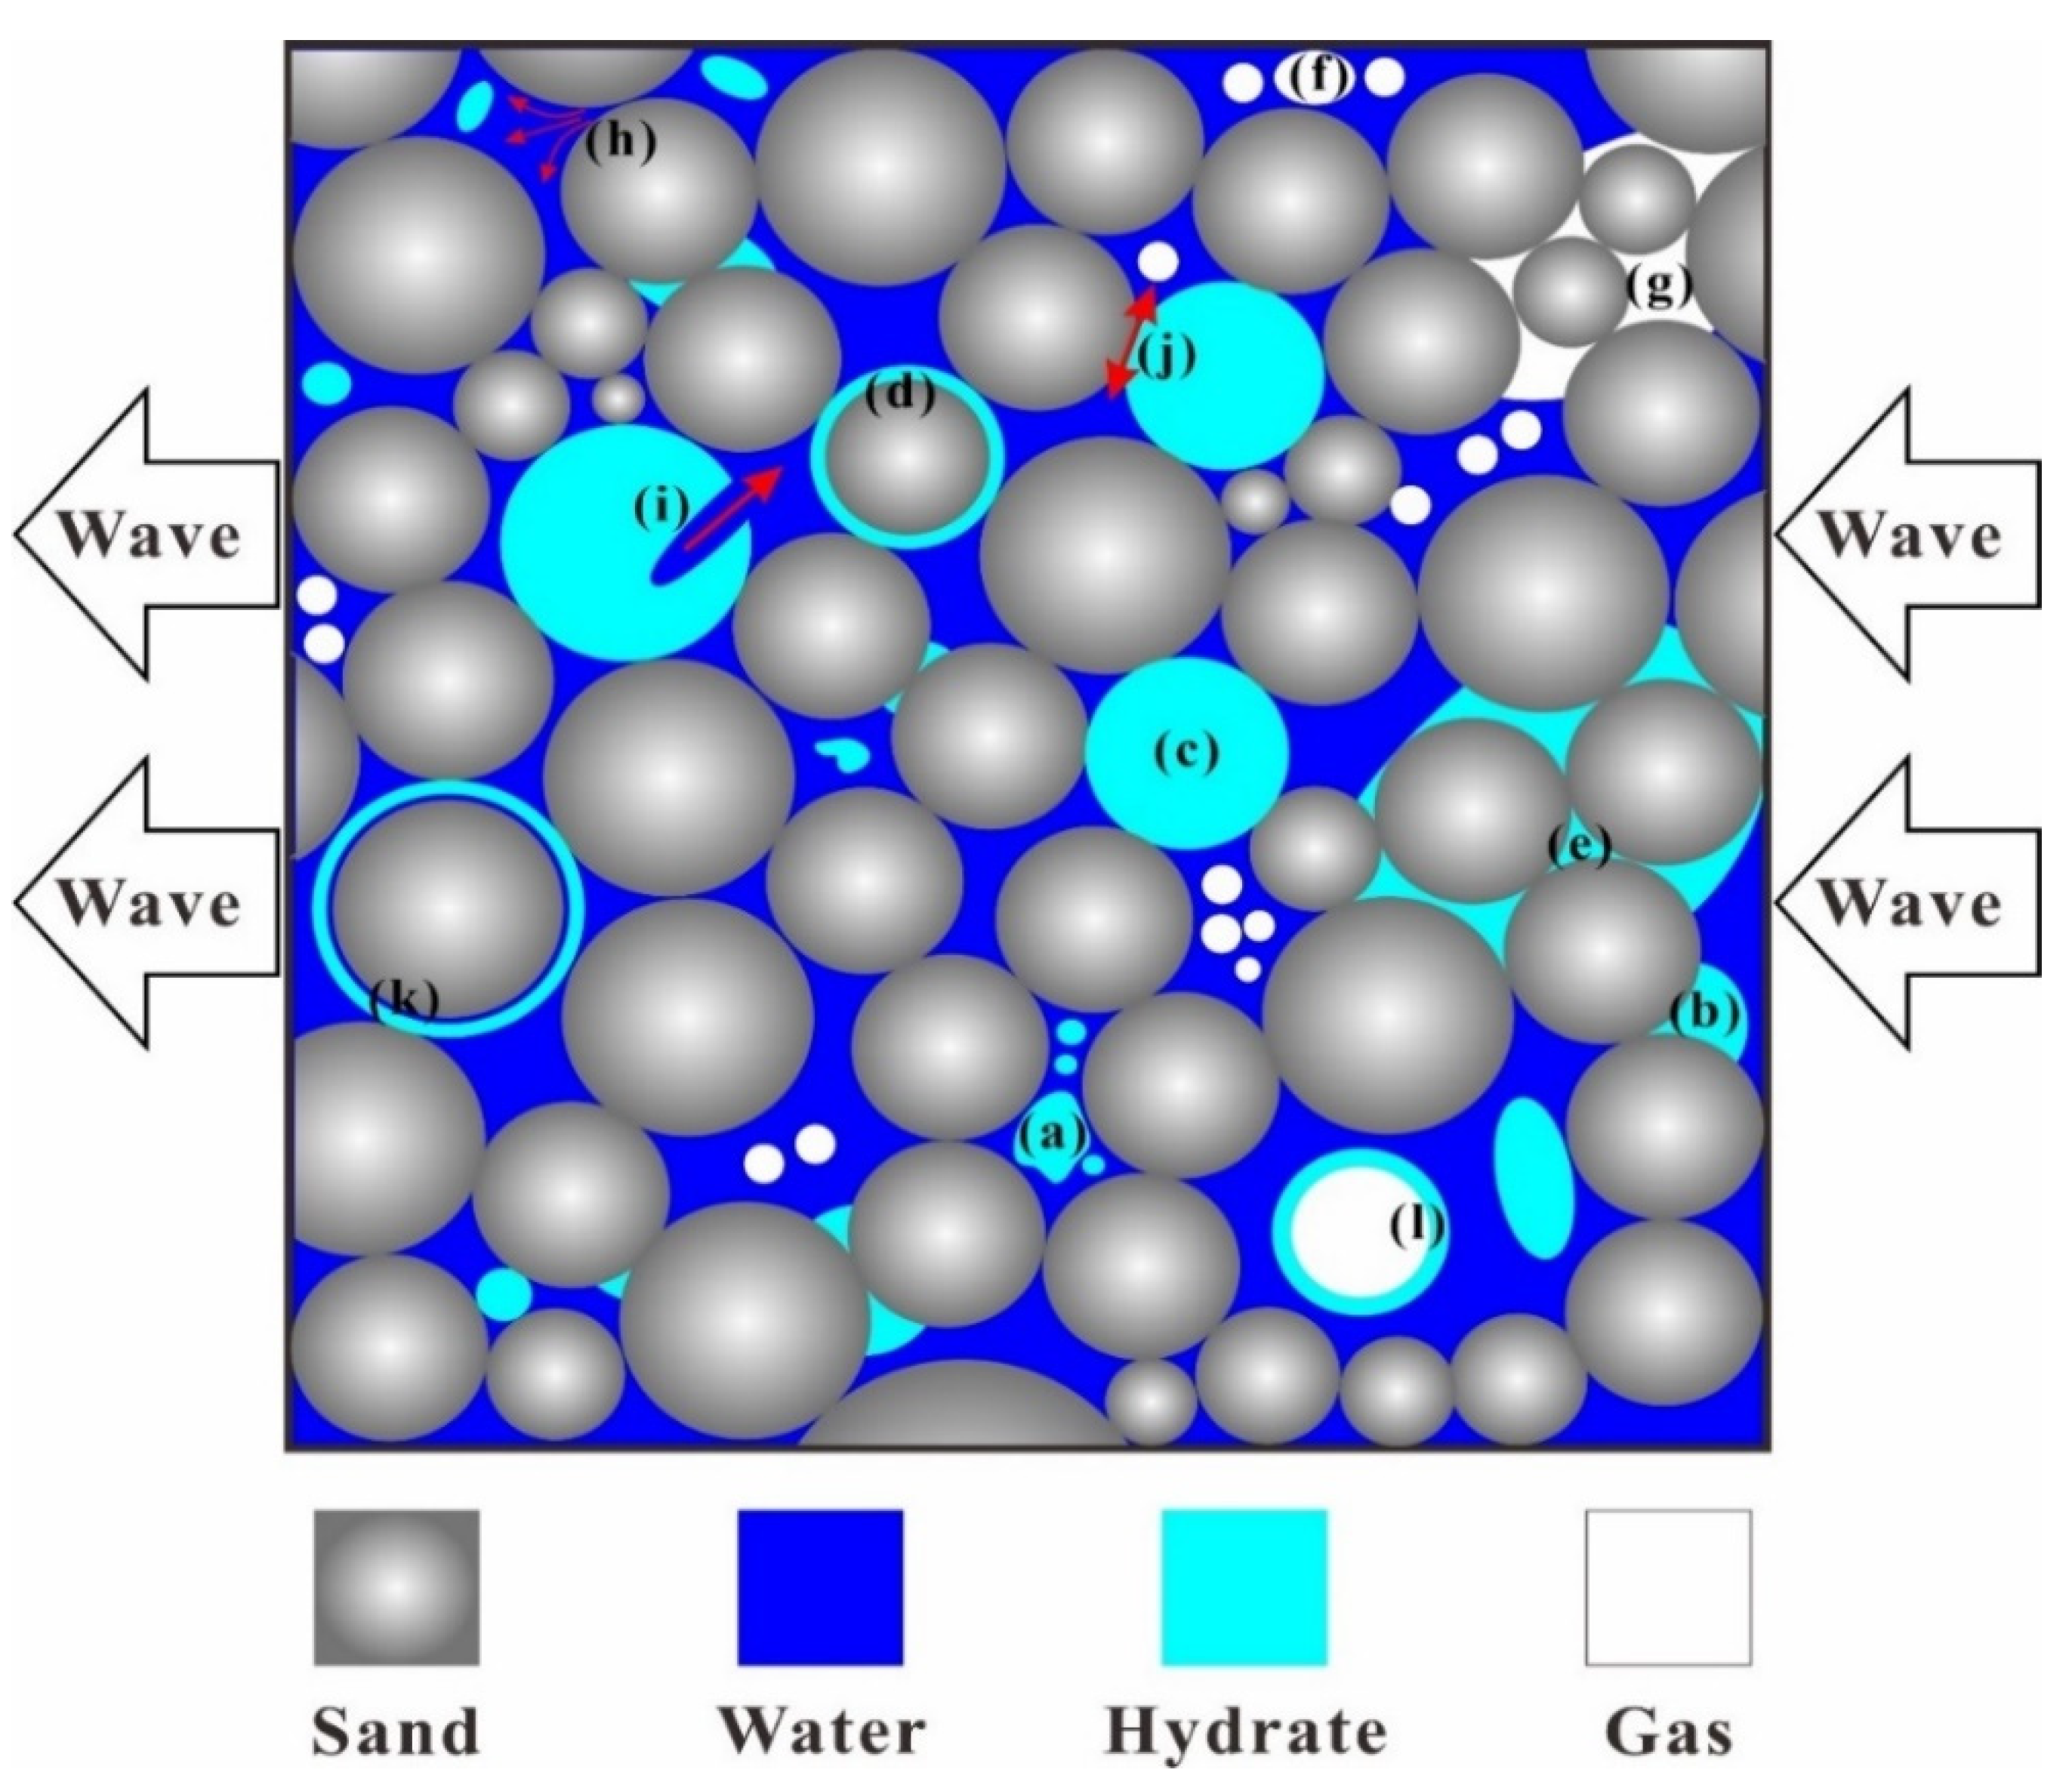
2.2.2. Wave Attenuation

Previous studies have thoroughly elaborated on the effect of GH on sediment velocity, while there has been a very limited comprehensive investigation of the effect of GH on sediment attenuation. Attenuation is a measure of energy loss when the elastic wave travels through a rock [29]. The intrinsic sediment attenuations are generally dependent on sediment lithology, fluid saturation, frequency, and strain amplitude [64]. Several important attenuation mechanisms are provided including matrix anelasticity, friction dissipation due to relative motions between grains and crack surfaces [65,66], squeezing gas pockets for the case of partial saturation [67,68], global Biot flow [69,70], local squirt flow [71,72,73,74,75], and wave-induced flow due to mesoscopic scale patches [76,77,78,79]. It is believed that intrinsic attenuation for fluid-saturated rocks is frequency-dependent over a broadband frequency range through a series of experimental data [73,75,80,81,82].
The presence of GH makes the attenuation mechanism more complicated. The attenuation of GHBS is affected by hydrate saturation and interaction between the hydrate and matrix grains [29,83,84]. The proposed attenuation mechanisms associated with GHBS include the effect of hydrate morphology on attenuation (Figure 2a–d) [83,84,85], gas bubble damping (Figure 2f) [84], global Biot flow (Figure 2h), local squirt flow (Figure 2i) [29,83,84], and cementation and frictional loss between the hydrate and solid grain (Figure 2j) [29]. A thin bound water film was observed between hydrate and grain surface by X-ray microtomography [45,86]. The presence of water film will increase the sediment velocities such as pore-filling hydrate morphology and cause significant seismic attenuation [45,85,87,88] (Figure 2k). When the methane gas moves upward into the sediment and reaches the hydrate stability zone, hydrate film can occur between the gas bubble and the surrounding pore water (Figure 2l) [89,90]. The gas bubble trapping within the hydrate film results in the coexisting hydrate and gas bubble and a subsequent significant effect on sediment velocity and attenuation [42,90].

2.3. Acoustic Properties of GHBS at Various Investigation Frequencies

A tremendous number of geophysical exploration expeditions and deep-drilling expeditions were conducted to investigate the occurrence of GHBS in Japan [91], the United States [35], Canada [92], China [93,94], India [95], and Korea [96]. Geophysical exploration is one of the important approaches to identify and characterize GHBS such as hydrate saturation, lithology, permeability, porosity, and the extent and thickness of GHBS [35]. GH behaves at a higher P-wave velocity and a lower density than water, and has an elastic modulus comparable with ice [97]. All these changes in the sediment properties caused by the presence of GH or free gas will result in corresponding geophysical anomalies, allowing us to employ a corresponding geophysical method to characterize GHBS.

2.3.1. Seismic Technique and VSP Technique

The most commonly used geophysical technique for detecting GH is the seismic method. The bottom-simulating reflector (BSR) in the seismic reflection profile is often used to identify the base of GHBS in the marine environment [98]. However, it is not possible to use the BSR alone to infer the hydrate saturation. Moreover, it should be noted that hydrate can also be present in areas without BSR [41,99,100], and the BSR is considered to be related only to the top of free gas, and not necessarily the base of GHBS [101].
Using rock physics modeling, seismic velocity estimated from seismic data can be related to hydrate saturation. Thus, the evaluation of GHBS (structure, thickness, lateral extent) can be complemented [40]. It should be noted that the determination of hydrate saturation from the measuring P- and S-wave velocities of GHBS is still difficult because the velocity is also strongly dependent on sediment composition, porosity, and hydrate morphology.
The vertical seismic profiling (VSP) method can also be employed to help identify hydrate occurrence in the subsurface. VSP is a kind of measurement conducted inside the well hole and can obtain higher resolution than the seismic method but lower resolution than the well logging method. It allows us to measure the in-situ wave velocity and amplitude in GHBS at seismic frequencies [53,98]. The combined use of the surface seismic technique and VSP enables us to identify the lateral and vertical seismic velocity and amplitude in GHBS.

2.3.2. Well Logging Technique

Logging techniques are beneficial for the characterization of GHBS. The physical properties of GHBS can be measured in situ by well logging techniques including caliper, gamma-ray, resistivity, the amplitude of the waveform, sonic velocity, density, and neutron porosity. Sonic velocity logs of P- and S-waves have been used to identify GHBS [97]. The resistivity of GHBS is larger than that of non-hydrate bearing sediments, and resistivity logs are commonly used to estimate hydrate saturation by using Archie’s equation [102]. Other parameters (gamma-ray, porosity, and density) are also very important for the evaluation of GHBS. In the last decade, the sonic amplitude of P- and S-waves has become critical information to assess GH by using acoustic attenuation analysis [29,53,92,103].

2.3.3. Laboratory Measurements

It is challenging to retrieve intact GH samples during the coring process because of the unstable temperature and pressure conditions; therefore, laboratory analysis of artificial GH becomes important for understanding the GH occurrence. There are several autoclave systems for laboratory measurements, which are developed to measure the physical properties (P- and S-wave velocity, porosity, permeability, and electrical resistivity) of samples [104]. Priest et al. [58,59] and Best et al. [83] proposed a method based on a resonant column technique and measured the acoustic properties (P- and S-wave velocities and attenuations) over a much lower frequency domain (<550 Hz), while the common laboratory measurements are conducted in the ultrasonic frequencies (several hundred kHz). The tetrahydrofuran (THF) hydrate system is proposed to be an alternate methodology [105]. Although there are some differences between THF hydrate and methane hydrate, quite similar mechanical properties between them have been observed at a hydrate saturation lower than 40% [105].
There are two main challenges for laboratory measurements of natural or artificial GH samples. The formation method of GH samples affects the hydrate morphology, thus, in turn, affecting the physical properties of GH samples. The previous studies regarding the natural GH exhibit a specific pore-filling or load-bearing hydrate morphology, while laboratory synthetic samples formed from free gas generally result in cementing hydrate morphology at lower hydrate saturation [1,37,58,85]. However, Best et al. [83] also indicated that using the “excess water” method tends to result in pore-filling hydrate morphology. These discrepancies allow us to investigate the effects of hydrate morphology on the physical properties of GH sediment samples in laboratory measurements. In addition, when the measured physical properties of small hydrate samples in the laboratory are applied to the data obtained from the well logging or seismic method, there will be a problem of scale difference [37,97].

2.4. Rock Physics Modeling for Acoustic Properties of GHBS

The formation of hydrate in pore space will reduce the porosity and permeability of the sediment. The presence of GH is known to affect the physical properties of GHBS, and the sediment velocity increases with the increasing hydrate saturation. However, apart from hydrate saturation, the degree of increase is also strongly dependent on hydrate morphology, and this dependency will become more complicated [106,107]. By using rock physics modeling, the effect of hydrate saturation, hydrate morphology, and porosity on sediment velocity can be investigated (Figure 3).
It is generally accepted that both the P- and S-wave velocities increase with increasing hydrate saturation. However, significantly high attenuation has been widely observed along with the increase in velocity for both P- and S-waves in GHBS in the sonic logging frequency range [29,92,103,108,109,110]. This is contrary to our intuition that higher velocity corresponds to lower attenuation. In contrast to high attenuation at sonic frequencies in GHBS, attenuation at seismic frequencies (typically 10 to 150 Hz) is more contentious in existing studies [83,85,111,112,113,114,115]. There are extremely limited numbers of rock physical modeling focusing on elucidating the ultrasonic attenuation of GHBS. Pohl et al. [116] suggested that the high ultrasonic P-wave attenuation in THF hydrates might be related to the presence of liquid water between hydrate grains. Sahoo et al. [44] speculated that the ultrasonic P-wave attenuation changes might be caused by a decrease in coexisting gas bubble radius, and the creation of different aspect ratio pores during hydrate formation. Furthermore, Sahoo and Best [45] found that the ultrasonic S-wave velocity and attenuation can be explained by the decreasing permeability associated with the transition of hydrate morphology from pore-filling to load-bearing, and further to interpore hydrate framework morphology. Rock physics modeling for GHBS can consider the coupled effect of hydrate morphology, hydrate saturation, sediment porosity, permeability, anisotropic, and various attenuation mechanisms (Figure 3). The attenuation in the frequency range from seismic to sonic, and further to ultrasonic frequencies can be modeled (Figure 3).

3. Rock Physics Models for GHBS

3.1. Classification of Rock Physics Models

If GH occurs within the pores of coarse-grained sediments, the sediment velocity exhibits isotropic nature, whereas if GH occurs within fractures of fine-grained sediments, the sediment velocity exhibits an anisotropic nature [117]. Therefore, this study classifies the existing rock physics models into isotropic and anisotropic rock physics models. The existing isotropic rock physics models for GHBS are including the three-phase weighted model [118,119], three-phase Biot extension model [108,120], and effective medium model [84,121]. The existing anisotropic rock physics models for GHBS include the layered anisotropic model [100,122,123,124,125,126,127] and the effective medium anisotropic model [54,128,129,130,131]. The main characteristics, assumptions, workflows, attenuation mechanisms, and crucial input parameters for these models are provided as follows.

3.2. Isotropic Rock Physics Models

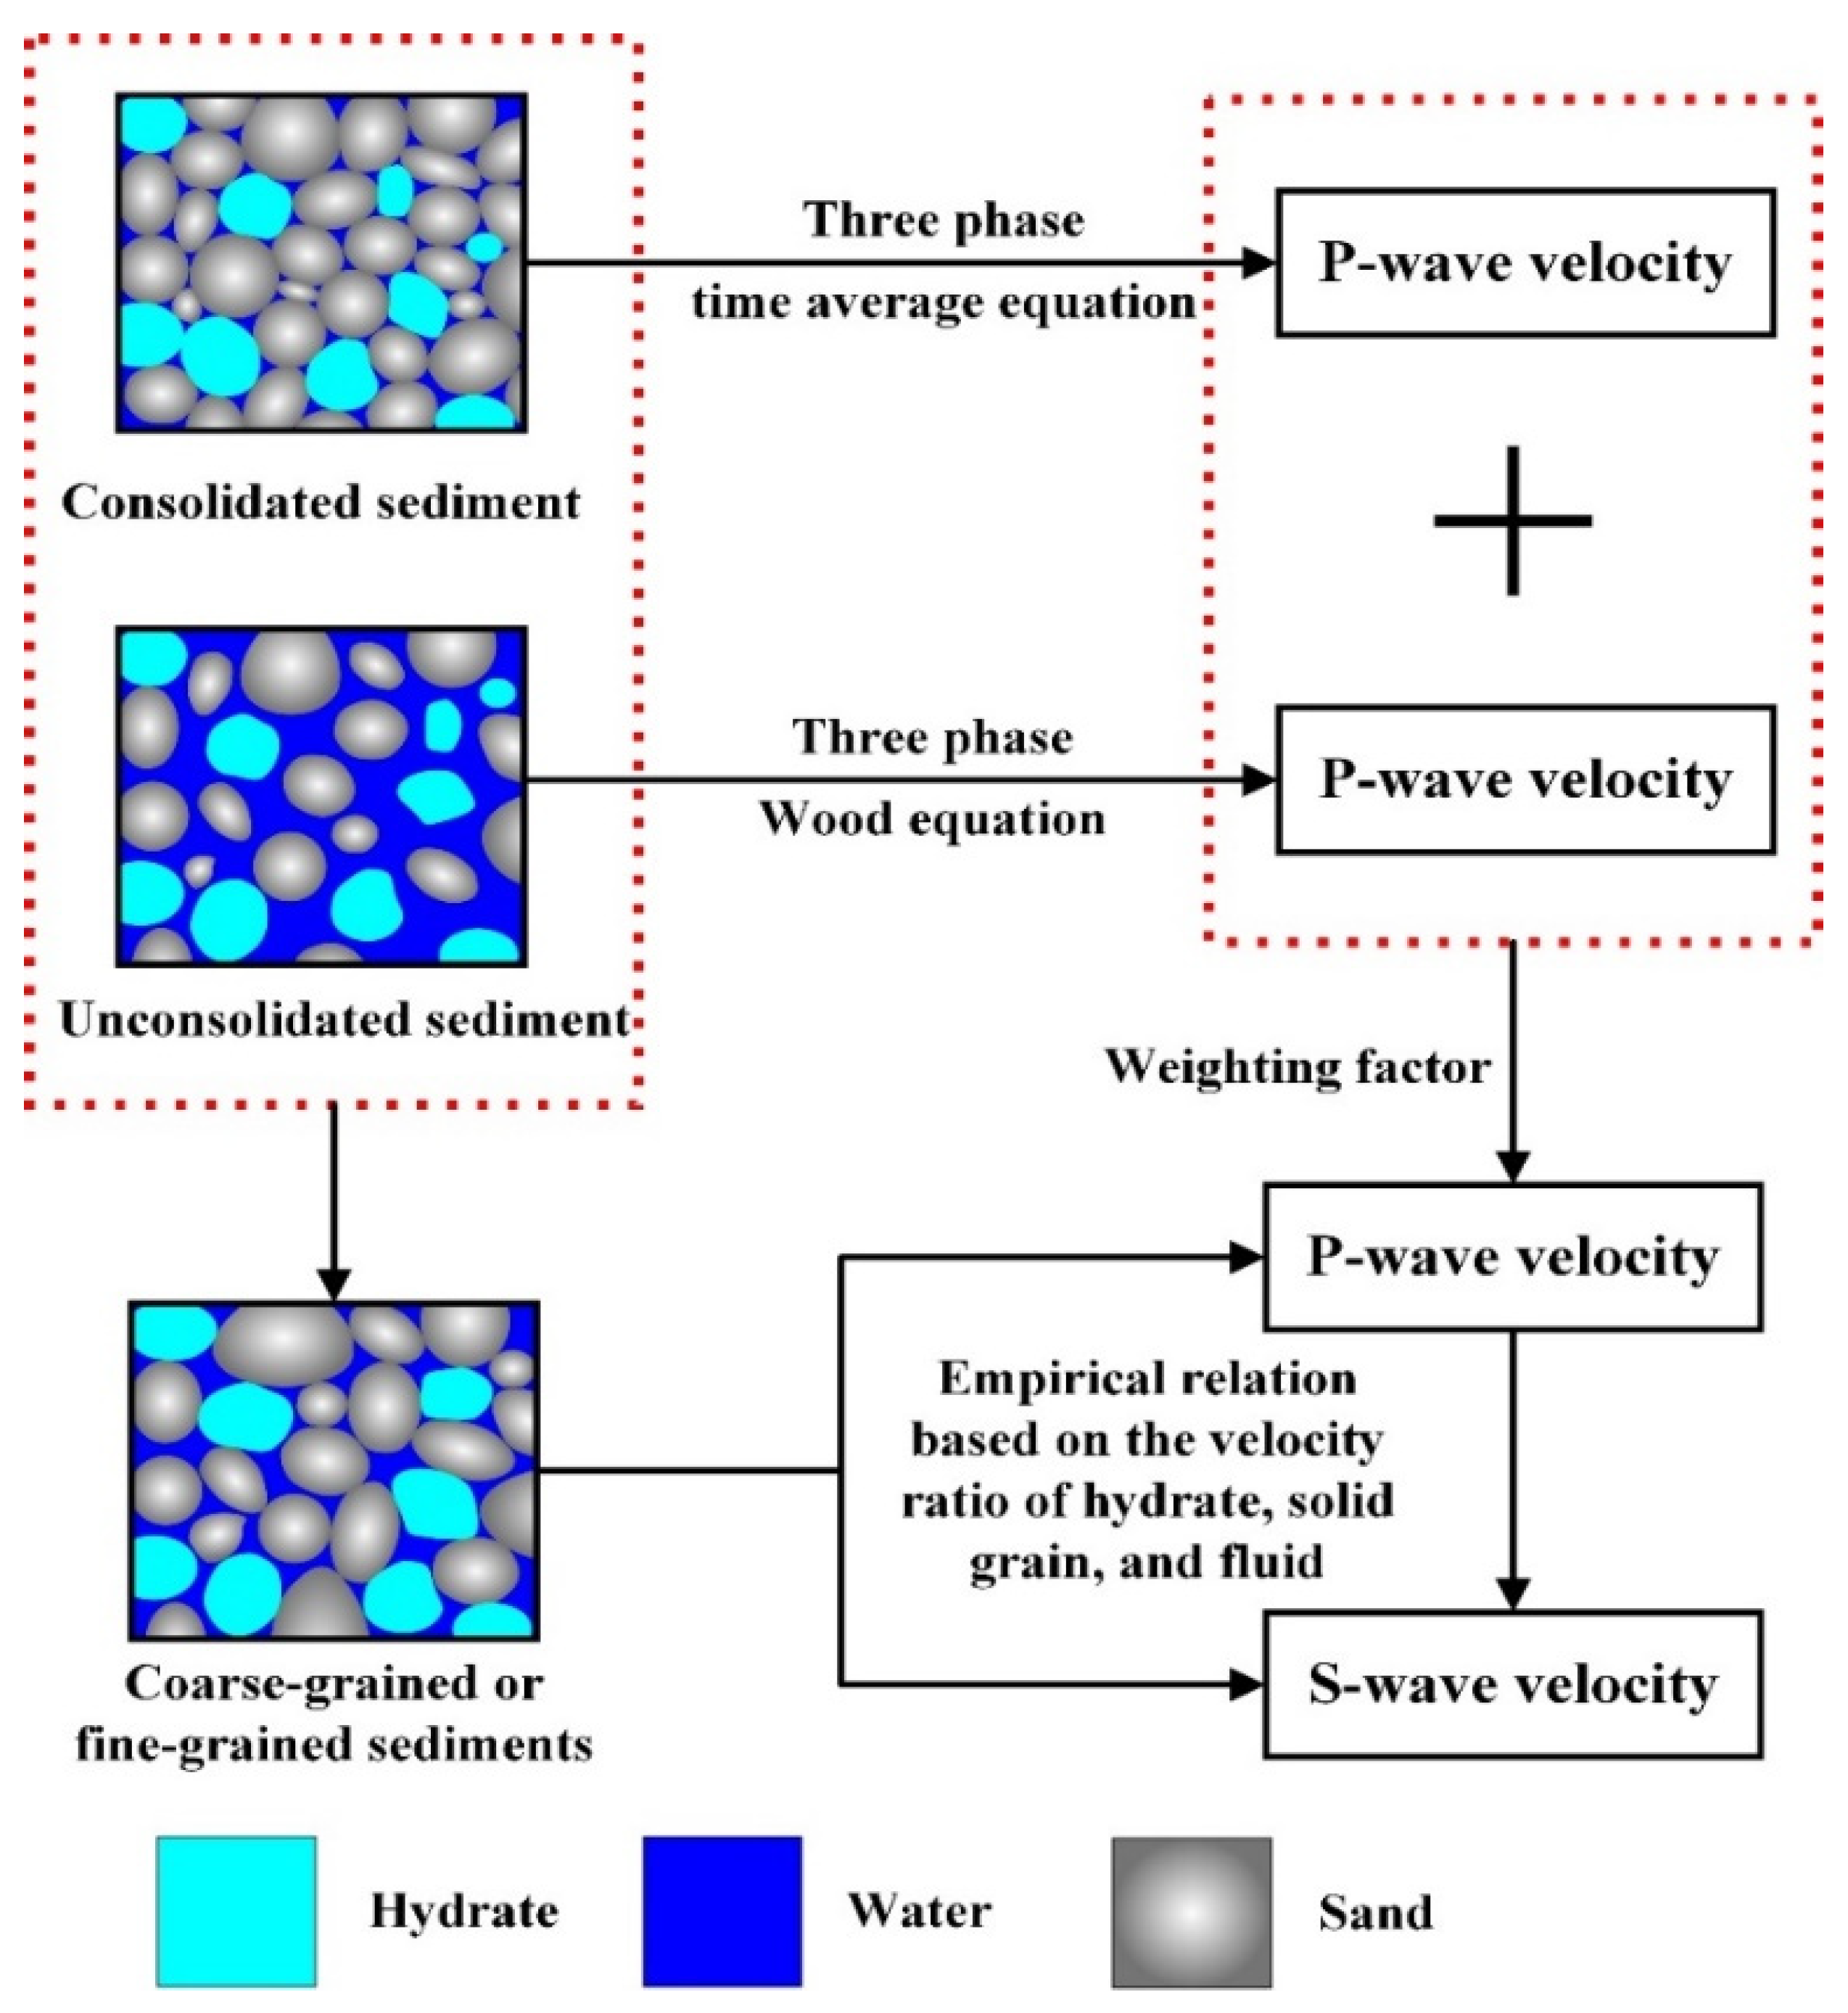
3.2.1. Three-Phase Weighted Model

Based on the assumption of pore-filling hydrate morphology, the Wood model is applicable in GHBS with high porosity, while using the time average equation associated with load-bearing hydrate morphology assumption, the Wyllie model is valid for GHBS with low porosity. As Figure 4 shows, using the P-wave velocities predicted from the Wood model and the Wyllie model, the P-wave velocity of composite sediment with any porosity can be obtained based on three-phase weighted equations. The calculation equations of this model are provided in Appendix A. In this model, the most crucial parameter is the arbitrary weighting factor when averaging the two types of velocities. The choice of weighting factor is dependent on the consolidation state of real GHBS and it can be predicted by fitting the P-wave velocity of non-hydrate sediment obtained from the sonic logging data to the velocity calculated from the three-phase weighted equations. The ratio of P-wave and S-wave velocities of GHBS is commonly associated with the velocity ratio of sediment matrix and porosity, and this ratio can be obtained by the Biot-Gassmann theory [132,133,134]. Consequently, the P- and S-wave velocities of GHBS can be calculated by using the three-phase weighted model and Biot-Gassmann equation, and this model is applicable for the sediment with high and low porosities.
Previous studies suggested that the main uncertainty of this method stems from the selection of the weighting factor, and the choice of weighting factor is dependent on the consolidation state of GHBS. The weighted factor of 1.27 and 1.29 are used by Shankar and Riedel [135] and Arun et al. [136], respectively, and they suggested that this value yields a best-fit P-wave velocity at the NGHP sites in the clay-dominated Mahanadi offshore, India. Chen et al. [137] proposed a calibration constant similar to the weighting factor and adjusted the calibration constant by fitting the experimental acoustic data to the modeling data. The results obtained show that the calibration of −0.6 allows a more accurate prediction of hydrate saturation for their synthetic sand-dominated sediment.

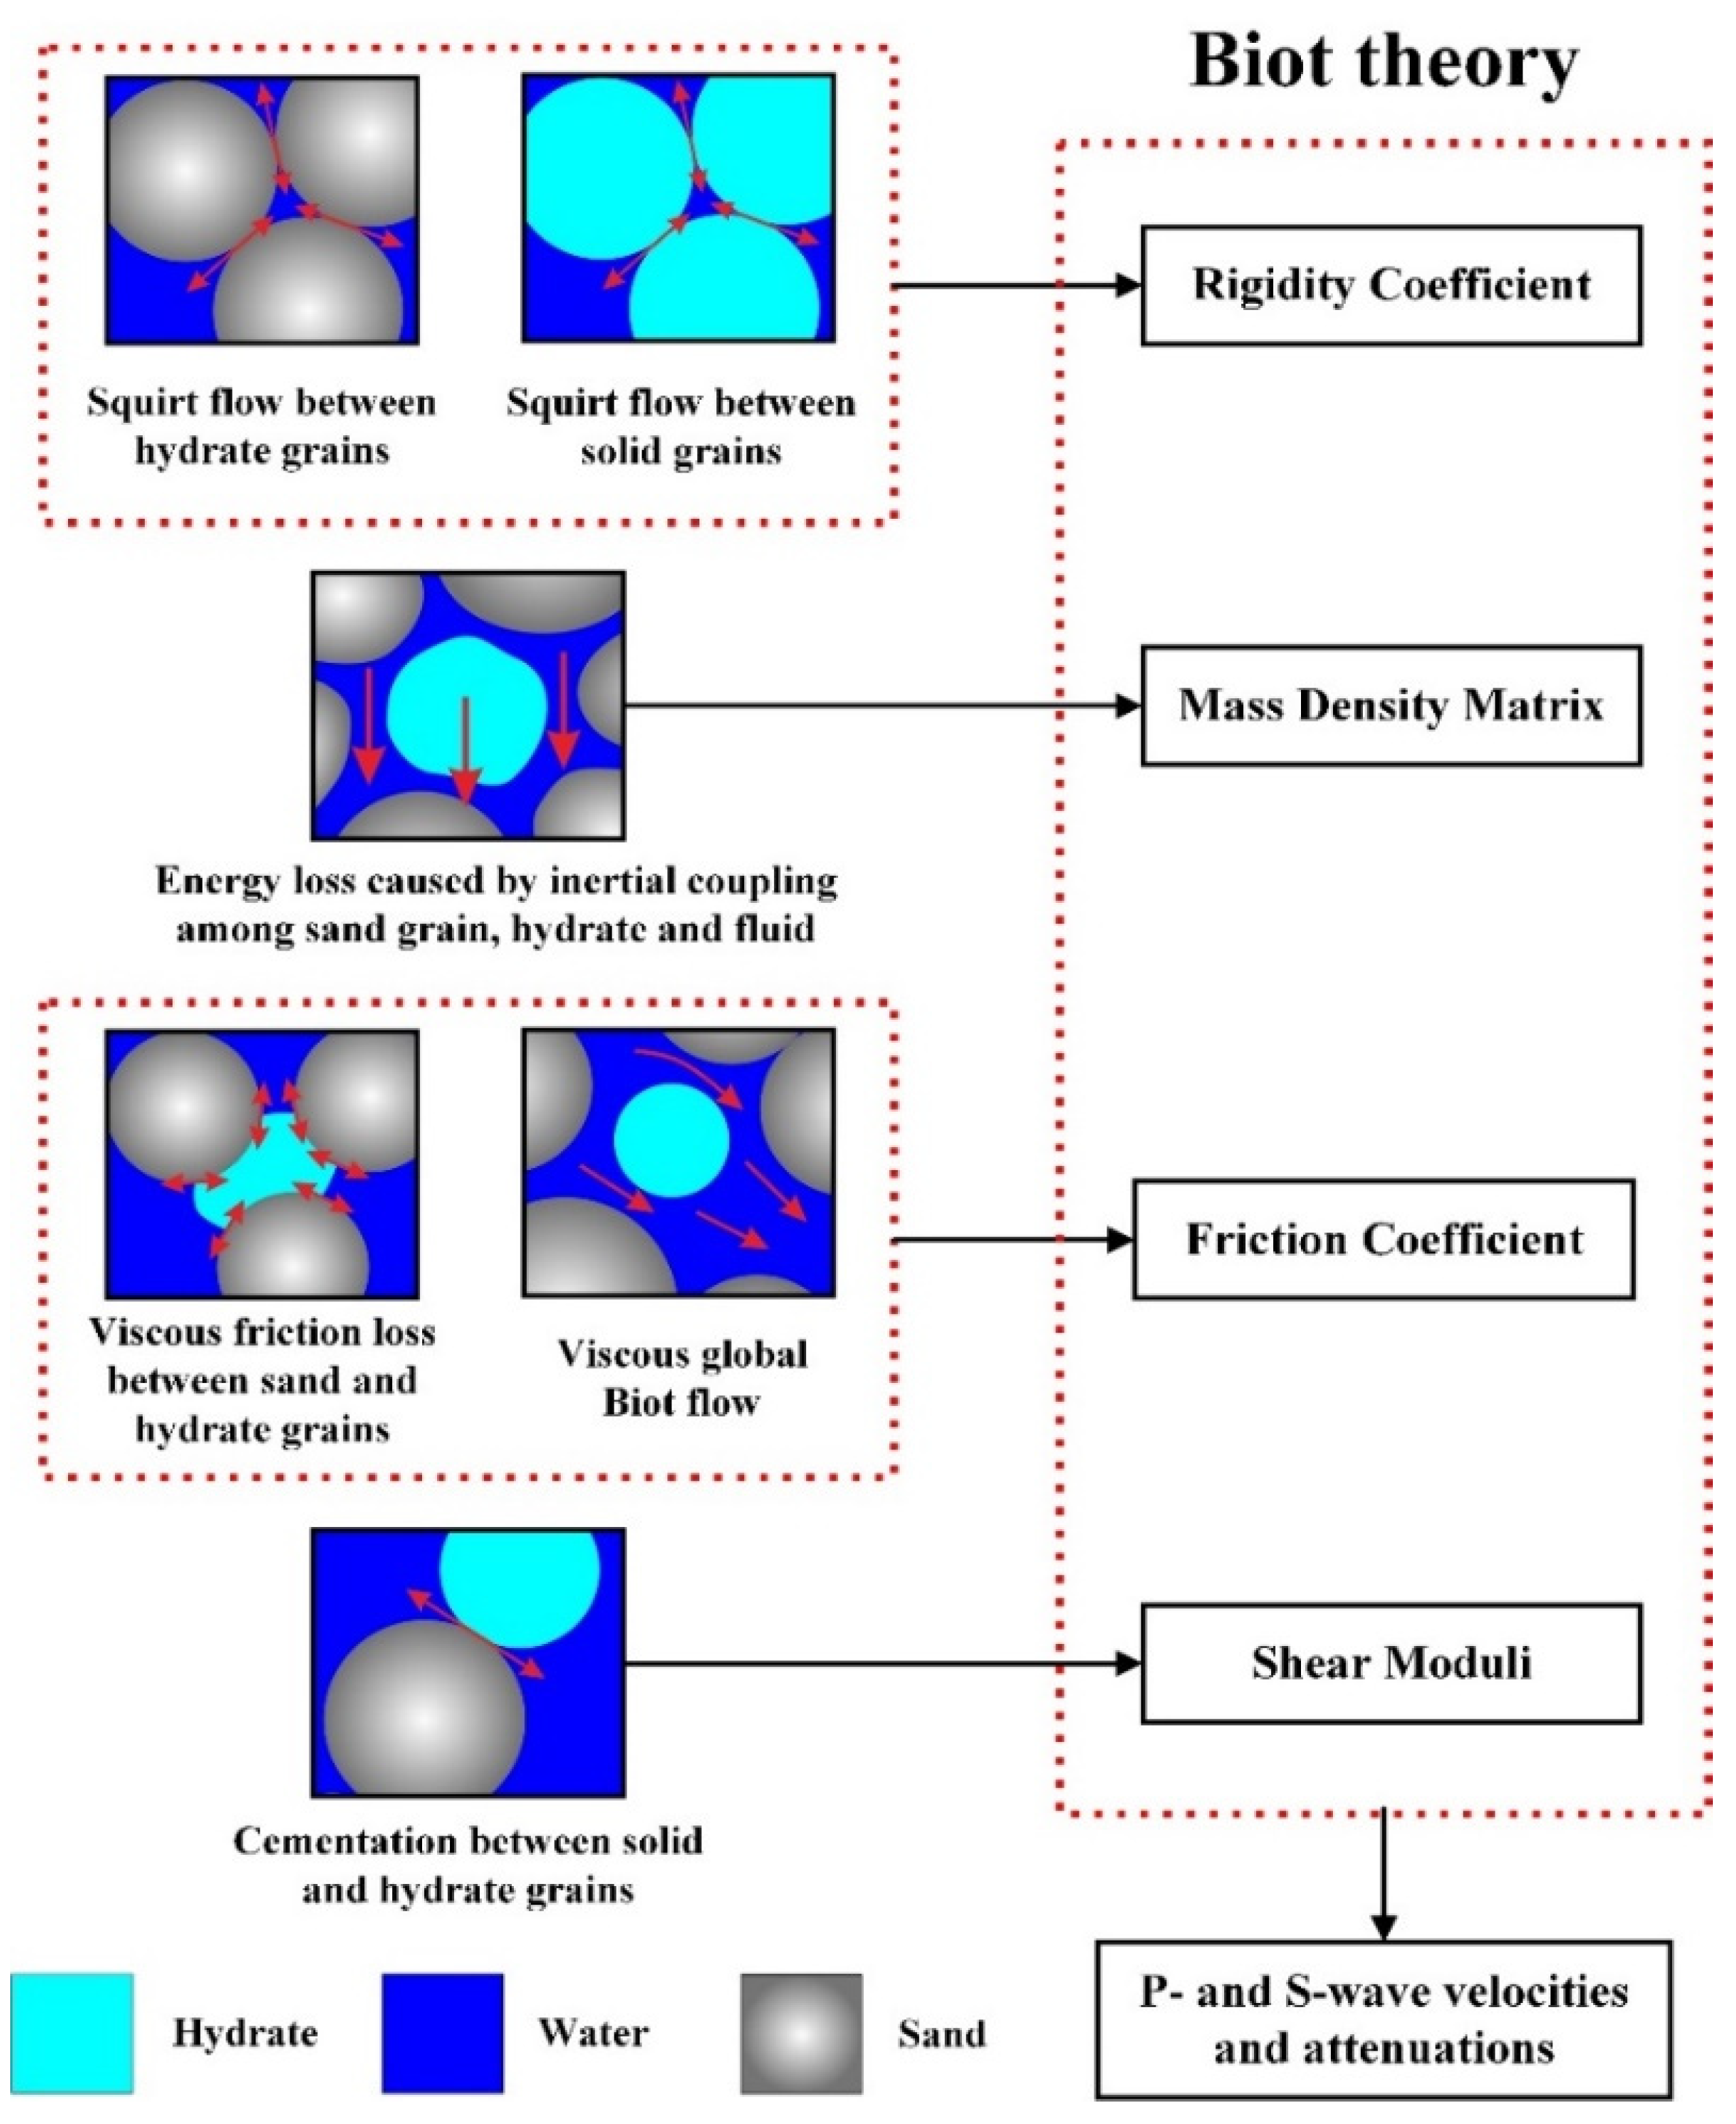
3.2.2. Three-Phase Biot Extension Model

The common three-phase Biot extension theory is based on the theory proposed by Leclaire et al. [48,49,119]. By using the percolation theory, the Leclaire theory incorporates the Biot flow in sand grains and ice, and describes the transition from a continuous to a discontinuous state during the freezing process. However, the Leclaire theory makes an important assumption that there is no contact between the ice and solid grains [70]. Therefore, as shown in Figure 5, the rigidity coefficient, mass density coefficient, friction coefficient, and shear modulus between sand grains and hydrate are equal to 0. The Leclaire theory includes the attenuation mechanisms due to energy dissipation caused by inertial coupling among three different phases, and global Biot flow (Figure 5). The Leclaire theory assumes no contact between ice and sand grains; however, Carcione and Tinivella [63] considered this contact (Figure 5). In addition, Carcione and Tinivella [63] added the apparent mass density between sand and hydrate grains (Figure 5), which was neglected in the Leclaire theory. Carcione and Tinivella [63] also introduced the viscous Biot dissipation of shear waves between a solid (sand and hydrate) and a fluid. Gei and Carcione [138] include the attenuation mechanisms due to energy dissipation caused by inertial coupling among three different phases, cementation between sand grains and hydrate, and global Biot flow (Figure 5). Concerning the inertial coupling coefficients among sand grains, hydrate, and fluid, Carcione and Tinivella [63] set the coupling coefficients to 0, and Guerin and Goldberg [29] showed that the coupling coefficients as 0 (which indicates the absence of inertial coupling between hydrate and fluid) significantly increase attenuation. Furthermore, Guerin and Goldberg [29] introduced squirt flow in sand grains and hydrate grains and the friction between sand grains and the hydrate (Figure 5). They consider the attenuation caused by the Biot and squirt flow in sand grains and hydrate grains, respectively. They also employ cementation between hydrate and solid grain, and friction between hydrate and solid grains. In addition, the effect of inertial coupling among hydrate, sand grains, and fluid has been taken into account in their model [29] (Figure 5). The calculation equations of this model are briefly introduced in Appendix B.
Although the intrinsic sediment attenuation is generally considered to be more sensitive to hydrate saturation and can better characterize the wave propagation in GHBS than sediment velocity [36,44,84], the sediment velocity is widely applied to model and predict the hydrate occurrence because of its flexible applicability. The grains cementation and the interaction between sediment grain and hydrate are considered to significantly affect sediment velocity [63]. Unlike the previous simple velocity average model, the main characteristic of the three-phase Biot extension model introduces the grain–hydrate interaction to model the hydrate occurrence in porous sediment [63]. Assuming a load-bearing GH morphology, a simplified three-phase Biot-type model is proposed to relate the P- and S-wave velocities of GHBS to hydrate saturation, porosity, and other physical properties such as the density, bulk modulus, and shear modulus of matrix components and pore water [41,113,114]. Due to the simple calculation procedure, this model has been successfully applied in marine sediments with high porosity, e.g., Alaska North Slope [57,117], Hydrate Ridge in the Cascadia margin [57,133], Blake Ridge in the Gulf of Mexico [57], Hikurangi margin of New Zealand [119], Shenhu area of the South China Sea [139], Krishna-Godavari Basin in the eastern Indian margin [120,140], South Shetland margin in the Antarctic peninsula [141,142], Nankai Trough in offshore Japan [143], Ulleung Basin offshore South Korea [144], etc. In the application of the three-phase Biot extension model, the selection of the consolidation parameter is crucial for the accurate prediction of velocity and hydrate saturation, which can be obtained by fitting the predicted velocities of non-hydrate sediment from rock physics modeling to the measured ones from field data [145]. The three-phase Biot extension model is usually suitable for the sand-dominated and unconsolidated GHBS with high hydrate saturation [94]. Note that the three-phase Biot extension theory usually fails to describe the hydrate occurrence of clay-dominated sediment because of abundant pore water bounded by clay particles and the basic Biot theory assumes that the pore water is not bound to sediment particles [119].

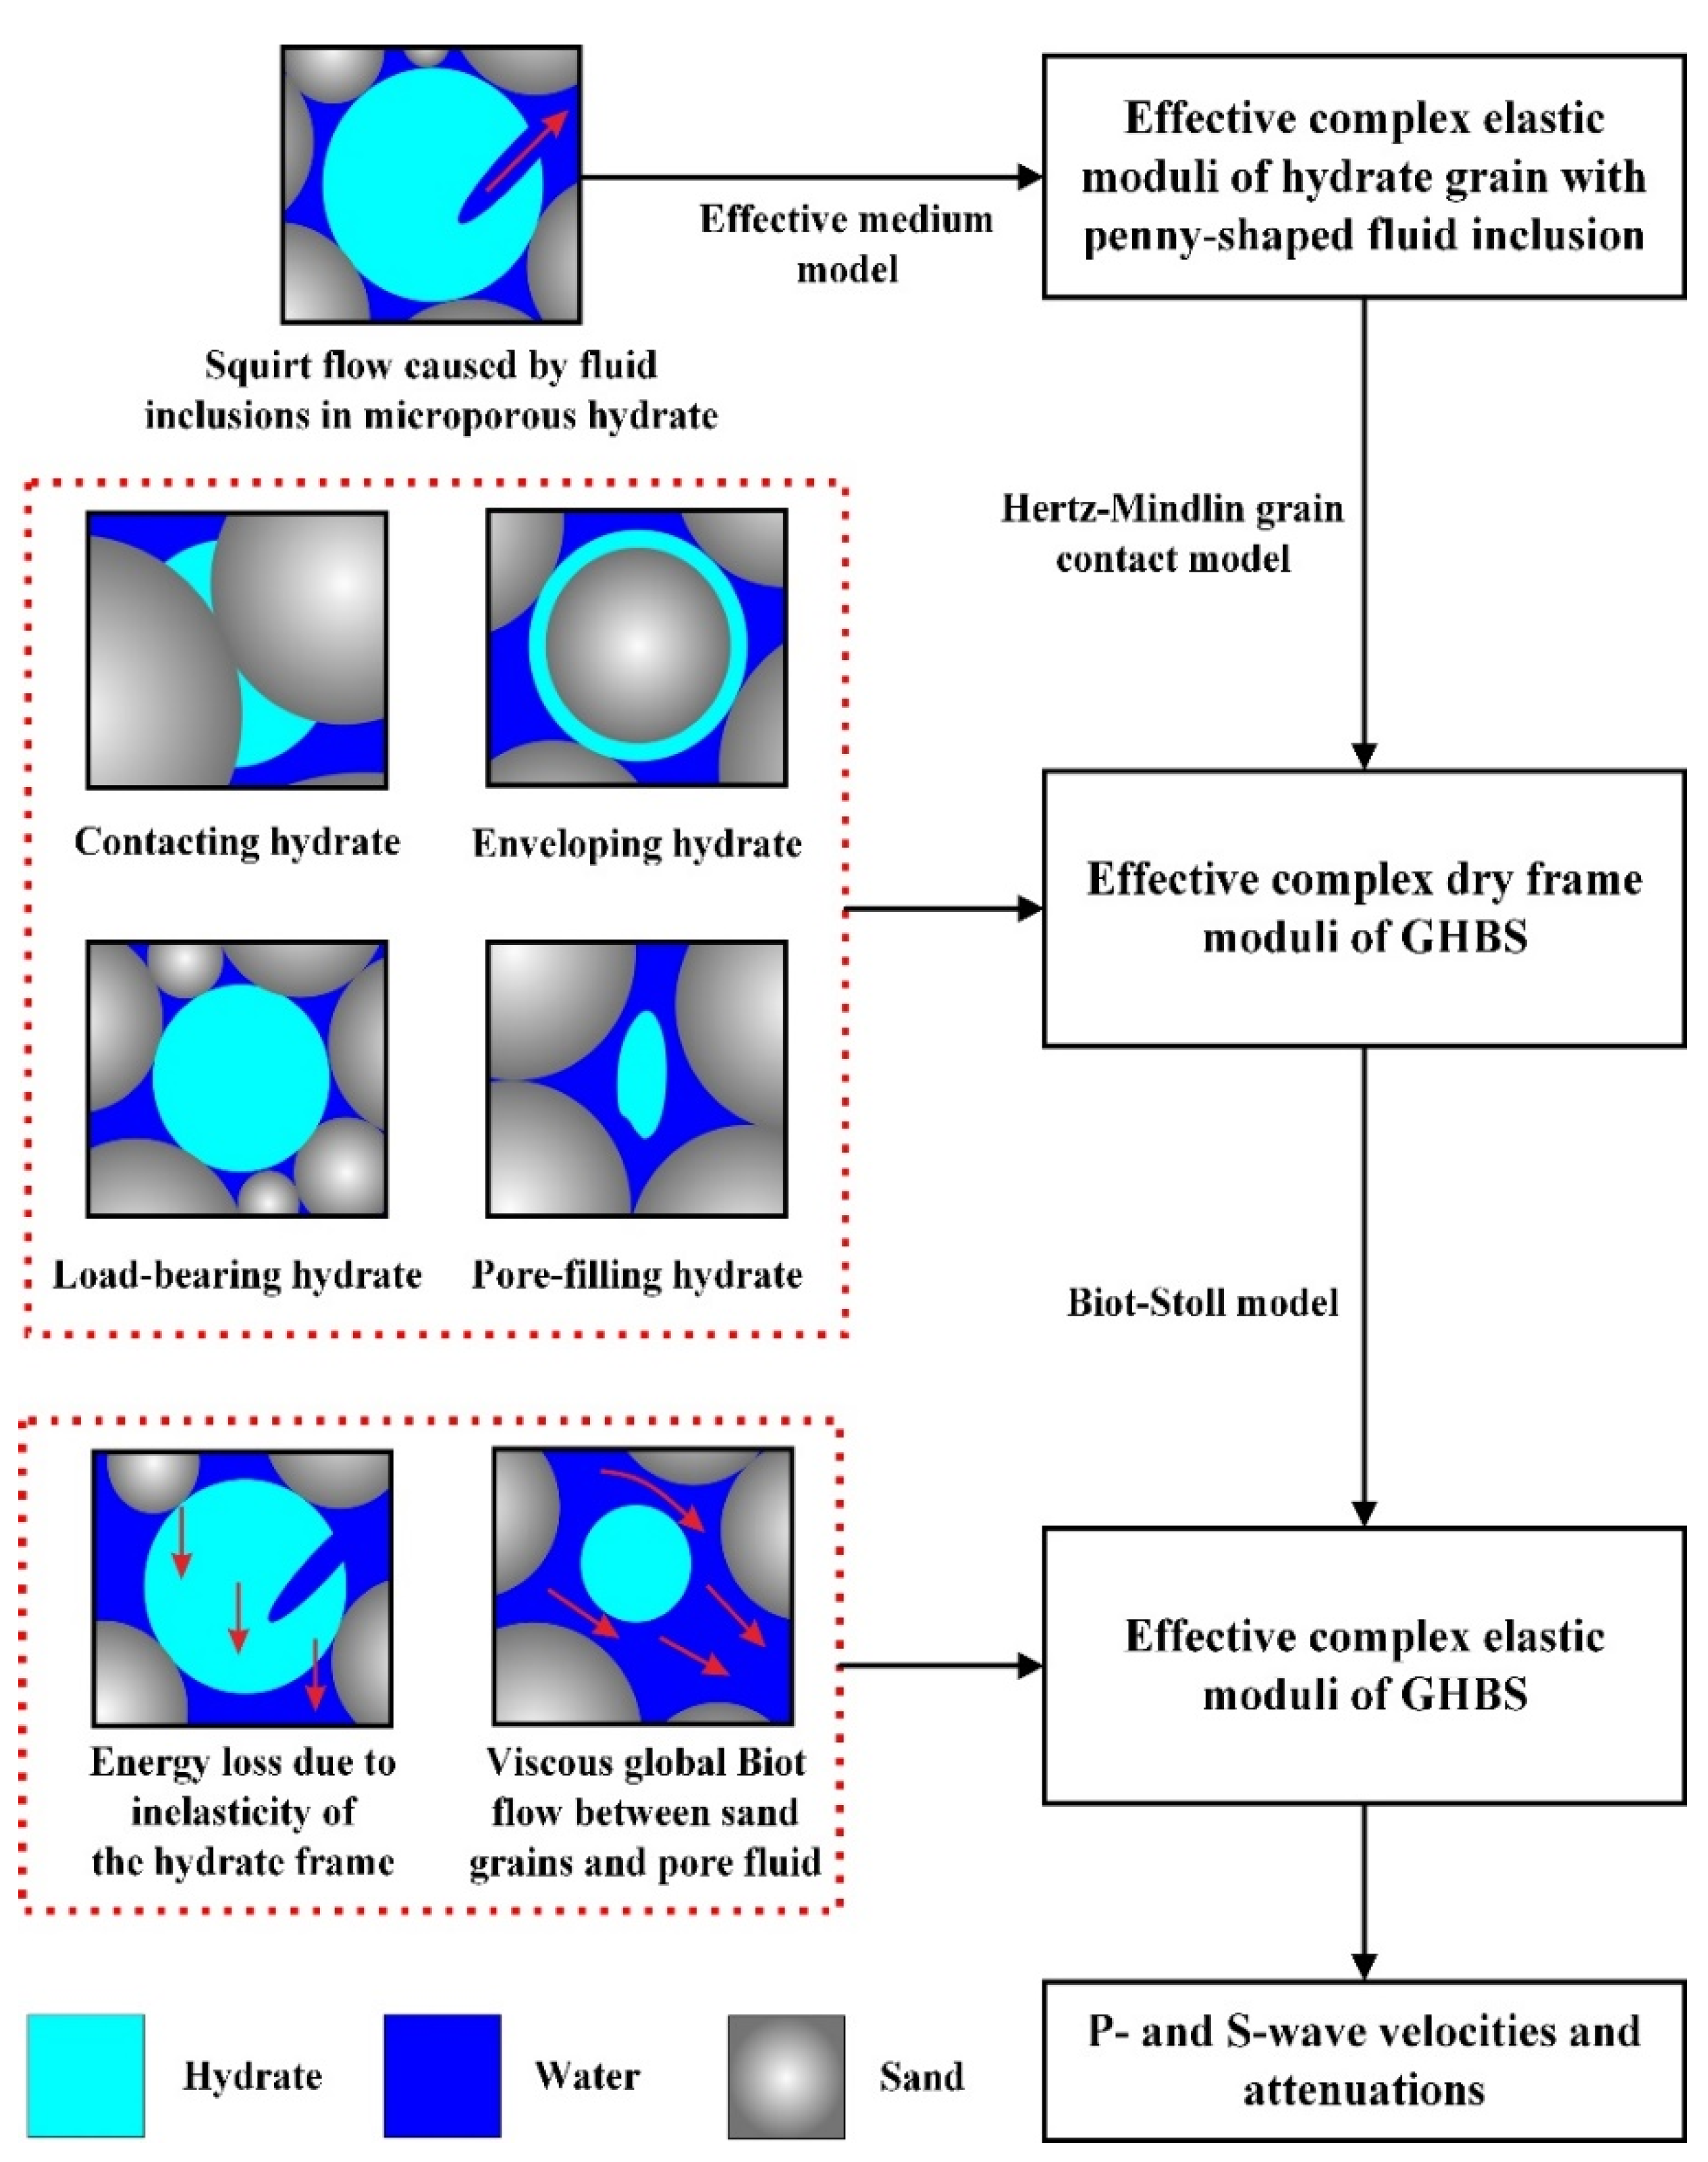
3.2.3. Effective Medium Model

The three-phase weighted model and three-phase Biot extension model approximate the hydrate occurrence as a part of the sediment matrix and assume the sequent alteration in sediment porosity and elastic moduli. The effective medium model considers the hydrate as pore fluid (pore-filling morphology), cement at the dry sediment frame (envelope and contact cementing morphologies), and sediment frame (load-bearing morphology) [55,146,147]. Different hydrate habits in pores alter the porosity, permeability, and elastic properties of the sediment in a different manner. The envelope and contact cementing morphologies reinforce the sediment frame and increase the sediment stiffness, the pore-filling hydrate morphology does not influence the sediment stiffness at all, and the load-bearing hydrate morphology weakly influences the sediment stiffness at high hydrate saturation [41,55]. Using the Voigt–Reuss–Hill average and assuming the hydrate as fluid or solid phases, the sediment porosity, and the bulk and shear moduli of solid and fluid phases in the sediment pores containing hydrate and water can be obtained. Introducing various hydrate morphologies, the bulk and shear moduli of the dry skeleton of GHBS can be calculated by the hydrate contact model proposed by Dvorkin et al. [146]. Then, the bulk and shear moduli of the dry sediment skeleton, solid phase, and fluid phase are substituted into Gassmann’s equation, and the effective elastic moduli of water-saturated sediment can be predicted. Finally, using the elastic moduli and density of water-saturated sediment, the P- and S-wave velocities of GHBS can be obtained. The detailed calculation equations of this model are introduced in Appendix C. This velocity-derived effective medium model has been widely applied to model the hydrate occurrence and to predict hydrate saturation in a pockmark offshore Norway [128], Mallik site in the Cascadia margin [148], Blake Ridge in the Gulf of Mexico [41,55,147,149,150], Hikurangi margin of New Zealand [151], Shenhu area of the South China Sea [93], Krishna-Godavari Basin in the eastern Indian margin [49,152], and Nankai Trough in offshore Japan [153]. In the application of the effective medium model, the assumption of hydrate morphology is the most critical problem, which will be discussed later.
Unlike the sediment velocity, the modeling of sediment attenuation based on the effective medium model is more complicated. This is because not only the hydrate morphology, but also fluid flow in the pores with different structures affects the sediment attenuation and these mechanisms should be included in the modeling. In addition to the effect of hydrate morphology on sediment attenuation, the introduction of porous hydrate in the effective model enables us to consider the geometrical shape of micropores and various attenuation mechanisms related to pore fluid in the micropores [154]. The squirt flow due to fluid inclusion in the porous hydrate is incorporated when calculating the bulk and shear moduli of fluid inclusion based on the correspondence principle proposed by Johnston et al. [64] (Figure 6). Then, the porous hydrate becomes an effective grain composed of homogeneous and isotropic elastic hydrate and interspersed ellipsoidal fluid inclusions [155]. The effective bulk and shear moduli of the effective hydrate with fluid inclusion become complex numbers as well as being frequency-dependent [83,84,155]. Then the real bulk and shear moduli of hydrate in the hydrate contact model can be replaced with the abovementioned complex bulk and shear moduli of the effective hydrate [41,147] (Figure 6). Subsequently, similar to the aforementioned calculation procedure of velocity, the effect of four modes of hydrate morphologies on attenuation is introduced by applying the hydrate contact model to calculate the effective bulk and shear moduli of the dry skeleton of GHBS [83,84] (Figure 6). Note that the contact cementing hydrate forms part of the solid frame, and the effective elastic moduli for the solid phase containing the contact cementing hydrate also become complex numbers, while the pore-filling hydrate is part of the fluid, and the effective elastic moduli of the fluid phase also becomes a complex number (Figure 6). Finally, the abovementioned effective and complex moduli of solid and fluid phases are then introduced into the Biot–Stoll model [156], and then the frequency-dependent P- and S-wave velocities and attenuations can be calculated [36,84]. In summary, the effective medium model considers the attenuation caused by the flow of fluid inclusions between micropores in hydrate and pore, the global Biot flow between sand grain and pore fluid, and energy loss due to the inelasticity of the hydrate frame, as shown in Figure 6.

3.3. Anisotropic Rock Physics Models

3.3.1. Layered Anisotropic Model

The abovementioned three-phase weighted model, three-phase Biot extension model, and effective medium model are usually suitable in sand-dominated isotropic GHBS. However, the acoustic properties of clay-dominated sediments commonly exhibit anisotropic characteristics when GH occurs in the fracture developed in fine-grained sediments [117,120]. The transverse isotropic medium is the simplest anisotropic medium and this anisotropy may be caused by clay particles or fracture-filled hydrate [100,130]. Pecher et al. [100] show that the observed transverse isotropy may be due to the directional alignment of clay grains rather than hydrate veins. In our description of anisotropic rock physics models, we assume that the anisotropy is caused by the high-velocity fracture-filled hydrate.
As Figure 7 shows, fracture-filled fine-grained GHBS can be modeled by laminated layers including the component of the pure hydrate layer and the isotropic water-saturated fine-grained sediment. The pure hydrate layer means the 100% hydrate-filled fracture and the P- and S-wave velocities, density, and volume fraction of this layer will be used in the modeling. The P- and S-wave velocities and density of water-saturated clay sediment can be computed by the aforementioned three-phase weighted equation or three-phase Biot extension equation without consideration of the hydrate. Using Lame constants of the two components, the anisotropic P-wave velocity and horizontally and vertically polarized S-wave velocities can be modeled by the Backus average. For a vertical borehole, the dip angle of a horizontal fracture is 0°, while the angle of a vertical fracture is 90° [126]. The dip angle of fracture is an important characteristic and the hydrate-filled fracture with a dip angle varying from 0° to 90° can be incorporated into this model using the anisotropy analysis of the Thomsen parameters [124,157]. Finally, P- and S-wave velocities and density of the transversely isotropic medium with an arbitrary dip angle of hydrate-filled fracture can be calculated. The detailed calculation equations of this model are provided in Appendix D.
Few studies have characterized the rock properties of fine-grained GHBS containing fracture-filled fracture. Anisotropic resistivity and velocity are two primary properties that can be obtained from resistivity logs and sonic logs [125]. Assuming the isotropic resistivity in fine-grained sediment with hydrate-filled fracture, the hydrate saturation estimated from resistivity logs is significantly higher than that calculated from core samples, which is possibly attributed to the anisotropy characteristic of this type of sediment [125]. In addition to the pronounced effect of anisotropy on sediment resistivity, the significant effect of anisotropy on P- and S-wave velocities has also been observed by previous modeling and field investigation [125]. The predicted velocity for anisotropic fine-grained sediment based on a layered anisotropic model shows that the anisotropy nature has a more significant effect on S-wave than P-wave [125]. Furthermore, except at high hydrate saturation, the P-wave velocity of anisotropic fine-grained sediment is insensitive to the dip angle of fracture [124]. Moreover, the orientation of the logging tool is required for the accurate estimation of dip angles using sonic logging data; however, this information is difficult to obtain [125]. A comparison of the velocities predicted from the layered anisotropic model and those measured from the field sonic logging data indicates the presence of high-angle fracture in clay-dominated GHBS such as the K-G Basin, eastern margin of India [125,126,130], the Ulleung Basin, East Sea of Korea [124], and the Shenhu area, South China Sea [158].

3.3.2. Effective Medium Anisotropic Model

Although the layered anisotropic model is widely used to model the hydrate-filled fracture in the clay-dominated sediment, the assumption of the laminated layers is unusual in filed investigations. Based on a theoretical framework combining the self-consistent approximation and differential effective medium approximation, several studies have successfully examined the intricate anisotropic microstructure caused by percolating clay and hydrate particles [54,128,129,130,131]. As Figure 8 shows, this model firstly creates a two-phase host composite consisting of aligned biconnected hydrate particles and water-saturated pores. The biconnected pore water is assumed as ellipsoidal inclusion and the biconnected hydrate particle is also ellipsoid with the same aspect ratio as the water-aurated pore. Using the self-consistent approximation theory, the effective stiffnesses of the hydrate–water host composite at the critical porosity (from 40% to 60%) are estimated as a function of the inclusion aspect ratio [159,160]. The stiffness at other porosities can be computed by the successive reduction in biconnected hydrate particles or water-saturated pores and the replacement of one component with the other component through differential effective medium approximation (Figure 8) [131]. Then, a new scheme composed of the host composite and clay particles is constructed, and the procedure of combining the self-consistent approximation and differential effective medium is repeated to predict the stiffnesses of the three-phase anisotropic effective medium composed of hydrate grain, pore water, and clay particles [130], as shown in Figure 8. The orientation of aligned clay particles is required for the accurate prediction based on the effective medium anisotropic model, and it can be provided by the measurement of core samples from scanning electron microphotographs [161] or the X-ray diffraction method [128], and the method of smoothing [54,129]. Therefore, the distribution of clay particles is employed in the host composite with different orientations consisting of hydrate–water. The calculation equations of this model are briefly introduced in Appendix E. The final model scheme incorporates the microstructure of biconnected solid and fluid phases, anisotropy caused by the alignment of clay particles, and grain displacement morphology due to the aligned hydrate inclusion. Consequently, the model successfully predicts the P- and S-wave velocities as a function of porosity and hydrate saturation [129,130].

3.4. Comparison of Rock Physics Models

In principle, all the rock physics models for the GHBS depict how the hydrate interacts with sediment components and how the presence of hydrate alters the acoustic properties and microstructure of the sediment. The acoustic properties predicted by various rock physics models may vary significantly due to the sediment mineral composition, sediment porosity, degree of consolidation, fracturing, hydrate morphology, hydrate saturation, and fluid type. One model may not be valid for all cases and even in the same drilling site, the rock physics model may be valid for some sediment layers, and invalid for other sediment layers. Therefore, the uppermost issue for rock physics modeling is deciding which model should be used to interpret the acoustic properties. Here, we try to make a general comparison of the commonly used rock physics models and assess the applicability and limitation of these models.
Different rock physics models are usually applied to the same data set to evaluate which model provides the best result for one certain reservoir type. Here, we provide the existing comparison examples of the application of different models to the GHBS in the Shenhu area, South China Sea, and the K-G basin, offshore eastern India. Wang et al. [94] introduced the three-phase Biot extension model and effective medium model to estimate hydrate saturation in the Shenhu area, South China Sea. GH saturation is predicted by the three-phase extension model with a maximum of 41.0%, which is slightly higher than those predicted by the effective medium model with a maximum of 38.5% [94]. Their results showed similar performance and they concluded that these two models are valid in the unconsolidated porous GHBS. However, Qian et al. [158] used the effective medium model and layered anisotropy model to examine the possible anisotropic effect due to the fracture developed in the same area. GH saturation predicted by the layered anisotropic model in the upper and lower facture-dominated layer shows a maximum of 25.0% and 85.0%, respectively, while GH saturation predicted by the isotropic model in the middle carbonate layer is lower than 20.0% [158]. They suggested that the anisotropic model provides a reliable result in the upper and lower hydrate layers, whereas the isotropic model gives a better estimate in the middle hydrate layer. In the K-G basin, offshore eastern India, various rock physics models have been used extensively to model the hydrate occurrence. Arun et al. [118] obtained an average GH saturation of 7.0% and 10.0% by the effective medium model and three-phase weighted model, respectively. They showed that the effective medium model with uncemented hydrate morphology provides a more accurate result in this area [118]. Joshi et al. [126] used the three-phase Biot extension model and layered anisotropic model to conduct velocity analysis. The obtained GH saturation by the isotropic model at two drilling sites shows an average of 45.8% and 33.8%, which are comparable with the saturation measured from nature cores. They suggested that the isotropic model yields the most accurate result [126]. Yadav et al. [145] suggested that the three-phase Biot extension model shows a very good correlation with the pressure core, and they also showed that this model generally overestimates the hydrate saturation in the fracture-filled GHBS. Shankar et al. [140] obtained the GH saturation with a maximum of 13.0% and 12.0% using the three-phase weighted equation at two drilling sites, while GH saturation predicted by the effective medium model shows a maximum of 16.0% and 22.0% at the same two sites. They found that the three-phase weighed equation predicted a better hydrate saturation [140]. They also suggested that the effective medium model is more accurate compared to the three-phase weighted equation because the latter model requires additional data to set the weighting factor. Ghosh and Ojha [130] compared the effective medium anisotropic model with the Wood average model, and they suggested that the former model yields a better agreement because of inherent anisotropy in the K-G basin, offshore eastern India.
Among the proposed rock physics models, the effective medium model, the three-phase Biot extension equation, and the three-phase weighted equation are generally suitable for the isotropic and unconsolidated coarse-grained sediment. The effective medium model is the only method to consider how the different hydrate morphologies affect the acoustic properties of GHBS. A knowledge of hydrate morphology is required for the accurate estimation of permeability, resistivity, and acoustic properties of the sediment. However, this model usually overestimates the S-wave velocity because of the introduction of friction at the grain contacts which does not exist for the unconsolidated GHBS [133,153]. This overestimation can be calibrated by the smooth contact model without consideration of the friction between grain contacts [148,153]. The three-phase Biot extension model generally holds true for the unconsolidated and coarse-grained marine sediment with high porosity. Existing applications of this model in various field investigations have indicated the broad applicability for GHBS when hydrates grow away from grain contacts. The model is widely used due to its ease of use and high efficiency; however, setting the consolidation factor will induce uncertainty in the estimation of sediment velocities and hydrate saturation. The three-phase weighted equation has been proved to be suitable for unconsolidated marine sediments with high or low porosity. This model can essentially be viewed as an empirical velocity–porosity equation and without consideration of hydrate–grains interaction except for the porosity reduction caused by hydrate growth. This model also requires supplementary data to constrain the weighting factor.
The abovementioned three models fail to handle the anisotropy caused by hydrate-filled fractures or the aligned orientation of clay particles. The layered anisotropic model simply considers the transversely isotropic nature by employing the laminated layer model [130]. The dip angle of fracture can be briefly estimated by this model [100,126,158]. This parameter is critical for characterizing the sediment anisotropy and interpreting the obtained seismic and sonic response in fracture-dominated sediment. However, the purely laminated medium concept does not hold true for the real GHBS. Among the aforementioned models, the effective medium anisotropic model is the only method to consider the microstructure characteristics of pore inclusion and grain displacement hydrate morphology [130,131,150]. The grain displacement hydrate morphology is the dominant distribution habit in fine-grained sediment. Adjusting the procedure of effective medium anisotropic modeling, the anisotropy in the clay-dominated GHBS caused by hydrate-filled fracture or aligned clay particles can be characterized [54]. However, the effective pressure is not considered and the model considers the greater compliance at the edges of different particle alignments [129]. In summary, the feasibility and limitations of the abovementioned models are compared in Table 1.

4. Application of Rock Physics Modeling to Field Data

4.1. Rock Physics Modeling for Acoustic Properties of GHBS

The measured P- and S-wave velocities and attenuations from seismic data, sonic logging data, and ultrasonic measurements are the product of wave characteristics possibly caused by hydrate–mineral interaction, pore structure change, and fluid flow in the sediment. The rock physics model can transform these measurable acoustic properties into meaningful physical properties which are difficult to measure. Here, we briefly describe the calculation procedure (Figure 9). Inputting a set of parameters into the selected rock physics model, the P- and S-wave velocities and attenuations for the sediment or experimental material can be predicted as a function of hydrate saturation or frequency. These values are further compared with the measured ones from the field investigations or laboratory measurements, revealing the desired information on the hydrate, fluid, or pore structure. Whether the input parameters are reasonable is critical for successful rock physics modeling. As mentioned above, the crucial parameters for the three-phase weighted model, the three-phase Biot extension model, and the effective medium model are the weighting factor, consolidation factor, inclusion aspect ratio, inclusion concentration, and hydrate morphology, respectively. The crucial parameters for the layered anisotropic model and effective medium anisotropic model are the dip angle and inclusion aspect ratio, respectively. The supplementary data, such as measurement results of nature cores and artificial samples, are generally used to validate the selection of input parameters and part of the input parameters are directly taken from the existing studies. Appendix F provides the moduli, densities, and velocities of sand, clay, hydrate, and water borrowed from the existing studies. According to the comparison between the modeled and measured acoustic properties, several important parameters including hydrate morphology, the dip angle of fracture, sediment permeability, fluid viscosity, and attenuation mechanisms can be inferred, as introduced as follows.
The effective medium model is the only method to relate various hydrate morphologies to sediment velocities; therefore, hydrate morphology at a specific site can be determined from the measured velocities. The load-bearing and pore-filling hydrate morphologies are generally interpreted as natural morphologies from the sonic velocities using the effective medium model at the Blake Ridge site, the Mallik site, and the Nankai Trough [57,106,130]. In addition to the single homogenous hydrate morphology widely determined by the field velocities, hydrate morphology transition and multiple hydrate morphologies have also been inferred by previous studies based on rock physics modeling. Hu et al. [162] suggested that hydrate may be viewed as load-bearing morphology at hydrate saturation higher than 30% and pore-filling hydrate morphology at hydrate saturation lower than 30% based on the comparison of P-wave velocities predicted from two rock physics models and measured from consolidated sand samples. Zhang et al. [163] measured the ultrasonic P- and S-wave velocities in unconsolidated sediment and compared them with the modeled velocities using the effective medium model, and indicated that the hydrate morphology changes from the load-bearing morphology to pore-filling hydrate morphology at hydrate saturation of 25%. Sahoo et al. [44,45] interpreted their ultrasonic P- and S-wave velocities of consolidated sands as the morphology transition from the initial pore-filling to the patchy hydrates by using the effective medium model. Dai et al. [40] suggested that heterogeneous patchy hydrate morphology rather than homogenous hydrate morphologies captures the observed P-wave velocity in nature sands. Pan et al. [164,165] introduced an improved effective medium model to calculate the ratio of pore-filling and load-bearing hydrate morphologies in the Mallik field, the Nankai Trough, and the Hikurangi margin. In the Shenhu area, based on the effective medium modeling for the sonic velocities, the fraction of pore-filling hydrate in the multiple morphologies was determined as 60% by Liu et al. [166] and 80% by Zhan et al. [42].
Varying the dip angle of fracture in the layered anisotropic model from 0° to 90°, sediment velocities are estimated and then compared with those predicted by field investigations. Consequently, the dominated dip angle of fracture in the sediment can be determined by the comparison. Anisotropic modeling for the sonic P-wave velocities in the Ulleung Basin of the East Sea of Korea shows the presence of hydrate-filled fracture with a dip angle of 7° at the upper layer and high-angle fracture at the lower layer [124]. Lee and Collett [125] suggested the P-wave velocity predicted by the layered anisotropic model is insensitive to fracture angle, whereas S-wave velocity is sensitive to fracture orientation. They indicated that the assumption of high-angle fracture yields the best agreement between modeled velocity and measured velocity from the cores [125]. Using the anisotropic modeling of P-wave velocity, Joshi et al. [126] indicated the presence of vertical fracture at the lower layer in the K-G Basin on the eastern margin of India.
Rock physics modeling for the sediment attenuation is more related to fluid properties such as sediment permeability and fluid viscosity as compared to sediment velocity. Zhan and Matsushima [36] have modeled the P- and S-wave attenuations of GHBS by using the three-phase Biot extension equations and provided the estimate of sediment permeability through the comparison of the modeled attenuations and the measured attenuations from sonic and VSP data at Nankai Trough, Japan. Recently, Sahoo and Best [88] provided a first inversion method from the measured S-wave velocity and attenuation into the in situ sediment permeability based on the two-phase and three-phase Biot extension models, and their estimates have been proved to agree well with the permeability obtained from resistivity measurements.
Knowledge about attenuation mechanisms is required for quantifying the hydrate saturation based on geophysical methods at various investigation frequencies. Different rock physics models introduce different attenuation mechanisms, and the combined modeling for the P- and S-wave attenuations at seismic, sonic, and ultrasonic frequencies by employing various models may provide the dominant attenuation mechanism responsible for the measured attenuations. Effective medium modeling for P- and S-wave attenuations at seismic (50–550 Hz) and ultrasonic (448–782 kHz) frequencies shows a complex dependence of attenuation on hydrate morphology and the modeling indicates that a squirt flow in porous hydrate and low aspect ratio pores may be responsible for the observed attenuations at these frequencies [44,83]. Three-phase Biot extension modeling for P- and S-wave attenuation at sonic frequencies (0.5–20 kHz) suggests that viscous friction between hydrate and sediment grain and squirt flow caused by hydrate formation may dominate the P- and S-wave attentions at the sonic frequencies [29]. Sahoo and Best [88] suggested that the observed S-wave attenuation at the ultrasonic frequencies (448–782 kHz) varies with the permeability change related to hydrate morphology transition from pore-filling to patchy. Combining the effective medium model and three-phase medium model, Zhan and Matsushima [36] explained the frequency-dependent P-wave attenuation at seismic (30–110 Hz) and sonic (0.5–20 kHz) frequencies as the squirt flow between sand grains and hydrate grains, and/or the squirt flow caused by fluid inclusions with different aspect ratios.

4.2. Hydrate Saturation Prediction Based on Rock Physics Modeling

Based on rock physics modeling, hydrate saturation can be obtained from the measured velocity from filed investigations or laboratory measurements. As Figure 10 shows, porosity, density, and volume fractions as well as elastic moduli of sediment components (calcite, illite, and quartz) are input into the selected rock physics model to predict P- and S-wave velocities of GHBS. Hydrate saturation varies from 0 to 100% and is repeatedly input to the model. Then, the predicted P- and S-wave velocities are compared with those extracted from the field investigations or laboratory measurements. The final hydrate saturation will be output until the difference between the predicted and measured velocities is within the predefined error range.
Uncertainties of the predicted hydrate saturation are generally from errors related to the velocity measurements or rock physics modeling. Whether the P- and S-wave velocities are measured from field data or laboratory data, both of them rely on the quality of the collected data [167]. The first arrivals of P- and S-waves are always difficult to extract due to the strong attenuation caused by the presence of gas hydrate [42]. The bad borehole condition and coupling effect between the measurement tools and sediment may also result in a poor signal-to-noise ratio [168]. Moreover, uncertainties of saturation prediction strongly depend on the selection of the rock physics model. Application of the models proposed for the coarse-grained sediments to the fine-grained sediments may yield misleading results because they ignore the anisotropy caused by the aligned hydrate-filled fracture in the sediment. The uncertainties associated with rock physics modeling mainly stem from the mineral composition fraction, porosity, permeability, and density used in the model. To reduce these uncertainties, the aforementioned input parameters for the model should be similar to the physical properties of real sediment or materials [94,140]. The mineral composition fractions, density, and porosity can be calculated from the well logs and permeability can be estimated from the in situ measurement for the core samples. Few free parameters are unavailable for any kind of rock physics model. We will provide examples of how to set these parameters. The critical parameters for the three-phase weighted equation and three-phase Biot extension equation are the weighting factor and consolidation factor, respectively, which can be obtained by fitting the predicted velocities to the measured velocities from the non-hydrate sediment [135,136]. The assumptions of hydrate morphology, inclusion concentration, and inclusion aspect ratio are critical for the effective medium model [83,84]. In the prediction of hydrate saturation using the rock physics method, the effect of inclusion aspect ratio and inclusion concentration can be ignored because they have been proven to significantly affect attenuation rather than velocity [36,84]. However, the assumption of hydrate morphology affects the accuracy of the predicted saturation and it can be obtained by fitting the modeled velocity to the measured velocity in GHBS [42,164].

5. Challenges

Even with the extraordinary progress in this area, some challenges limit the further application of rock physics modeling.
  • Optimizing the input parameters of models is crucial for successful modeling. Although the sonic logging data directly reflecting the porosity, density, and mineral composition of GHBS are widely used to improve the input parameters, more geological information is still required to constrain the set of free parameters. The integration of rock physics modeling with measurements for core samples by technologies such as X-ray computed tomography, nuclear magnetic resonance, and X-ray diffraction enables us to investigate the microstructure, rock properties, and hydrate distribution of GHBS, and this integration can reduce the uncertainties in the modeling.
  • How should we choose a suitable rock physics model for a specific question? Although the existing rock physics models are mainly proposed to deal with a specific problem, a certain model is not always valid in practical application. For example, confirming the dominated attenuation mechanism associated with gas hydrate and free gas from the measured attenuations. A combination of various models allows us to introduce as many mechanisms as possible and is further beneficial to explaining the observed attenuations.
  • The final goal of rock physics modeling is quantifying the gas hydrate occurrence and distribution of GHBS from seismic and well log investigations. Because of the difficulties posed by taking in situ measurements for the drilling core, the calibration of the rock physics model is mainly conducted by ultrasonic measurements for the synthetic hydrate samples. Are the observations at the ultrasonic frequency domain still valid at the seismic and well log frequency domains? Combining the sonic logging data and cross-well seismic data with ultrasonic measurements for the core samples at the same well location can provide an insight into the P- and S-wave velocities and attenuations at various frequency domains. Rock physics modeling for these acoustic properties can further constrain the model and better explain these observations.

6. Conclusions

Theoretical rock physics modeling provides a tool to link the hydrate occurrence of GHBS to the measurable acoustic properties at different investigation frequency domains. Based on the different theoretical basis, assumptions, and different propagating mechanisms, the published rock physics models are proposed for the modeling of velocity and attenuation of GHBS. Some important conclusions can be drawn as follows.
  • P- and S-wave velocities are comprehensively affected by the hydrate saturation combined with the hydrate morphologies. Attenuation mechanisms associated with GHBS include the effect of hydrate morphology on attenuation, gas bubble damping, global Biot flow, local squirt flow, cementation and frictional loss between hydrate and solid grain, thin bound water film between hydrate and grain surface, and hydrate film between the gas bubble and the surrounding pore water.
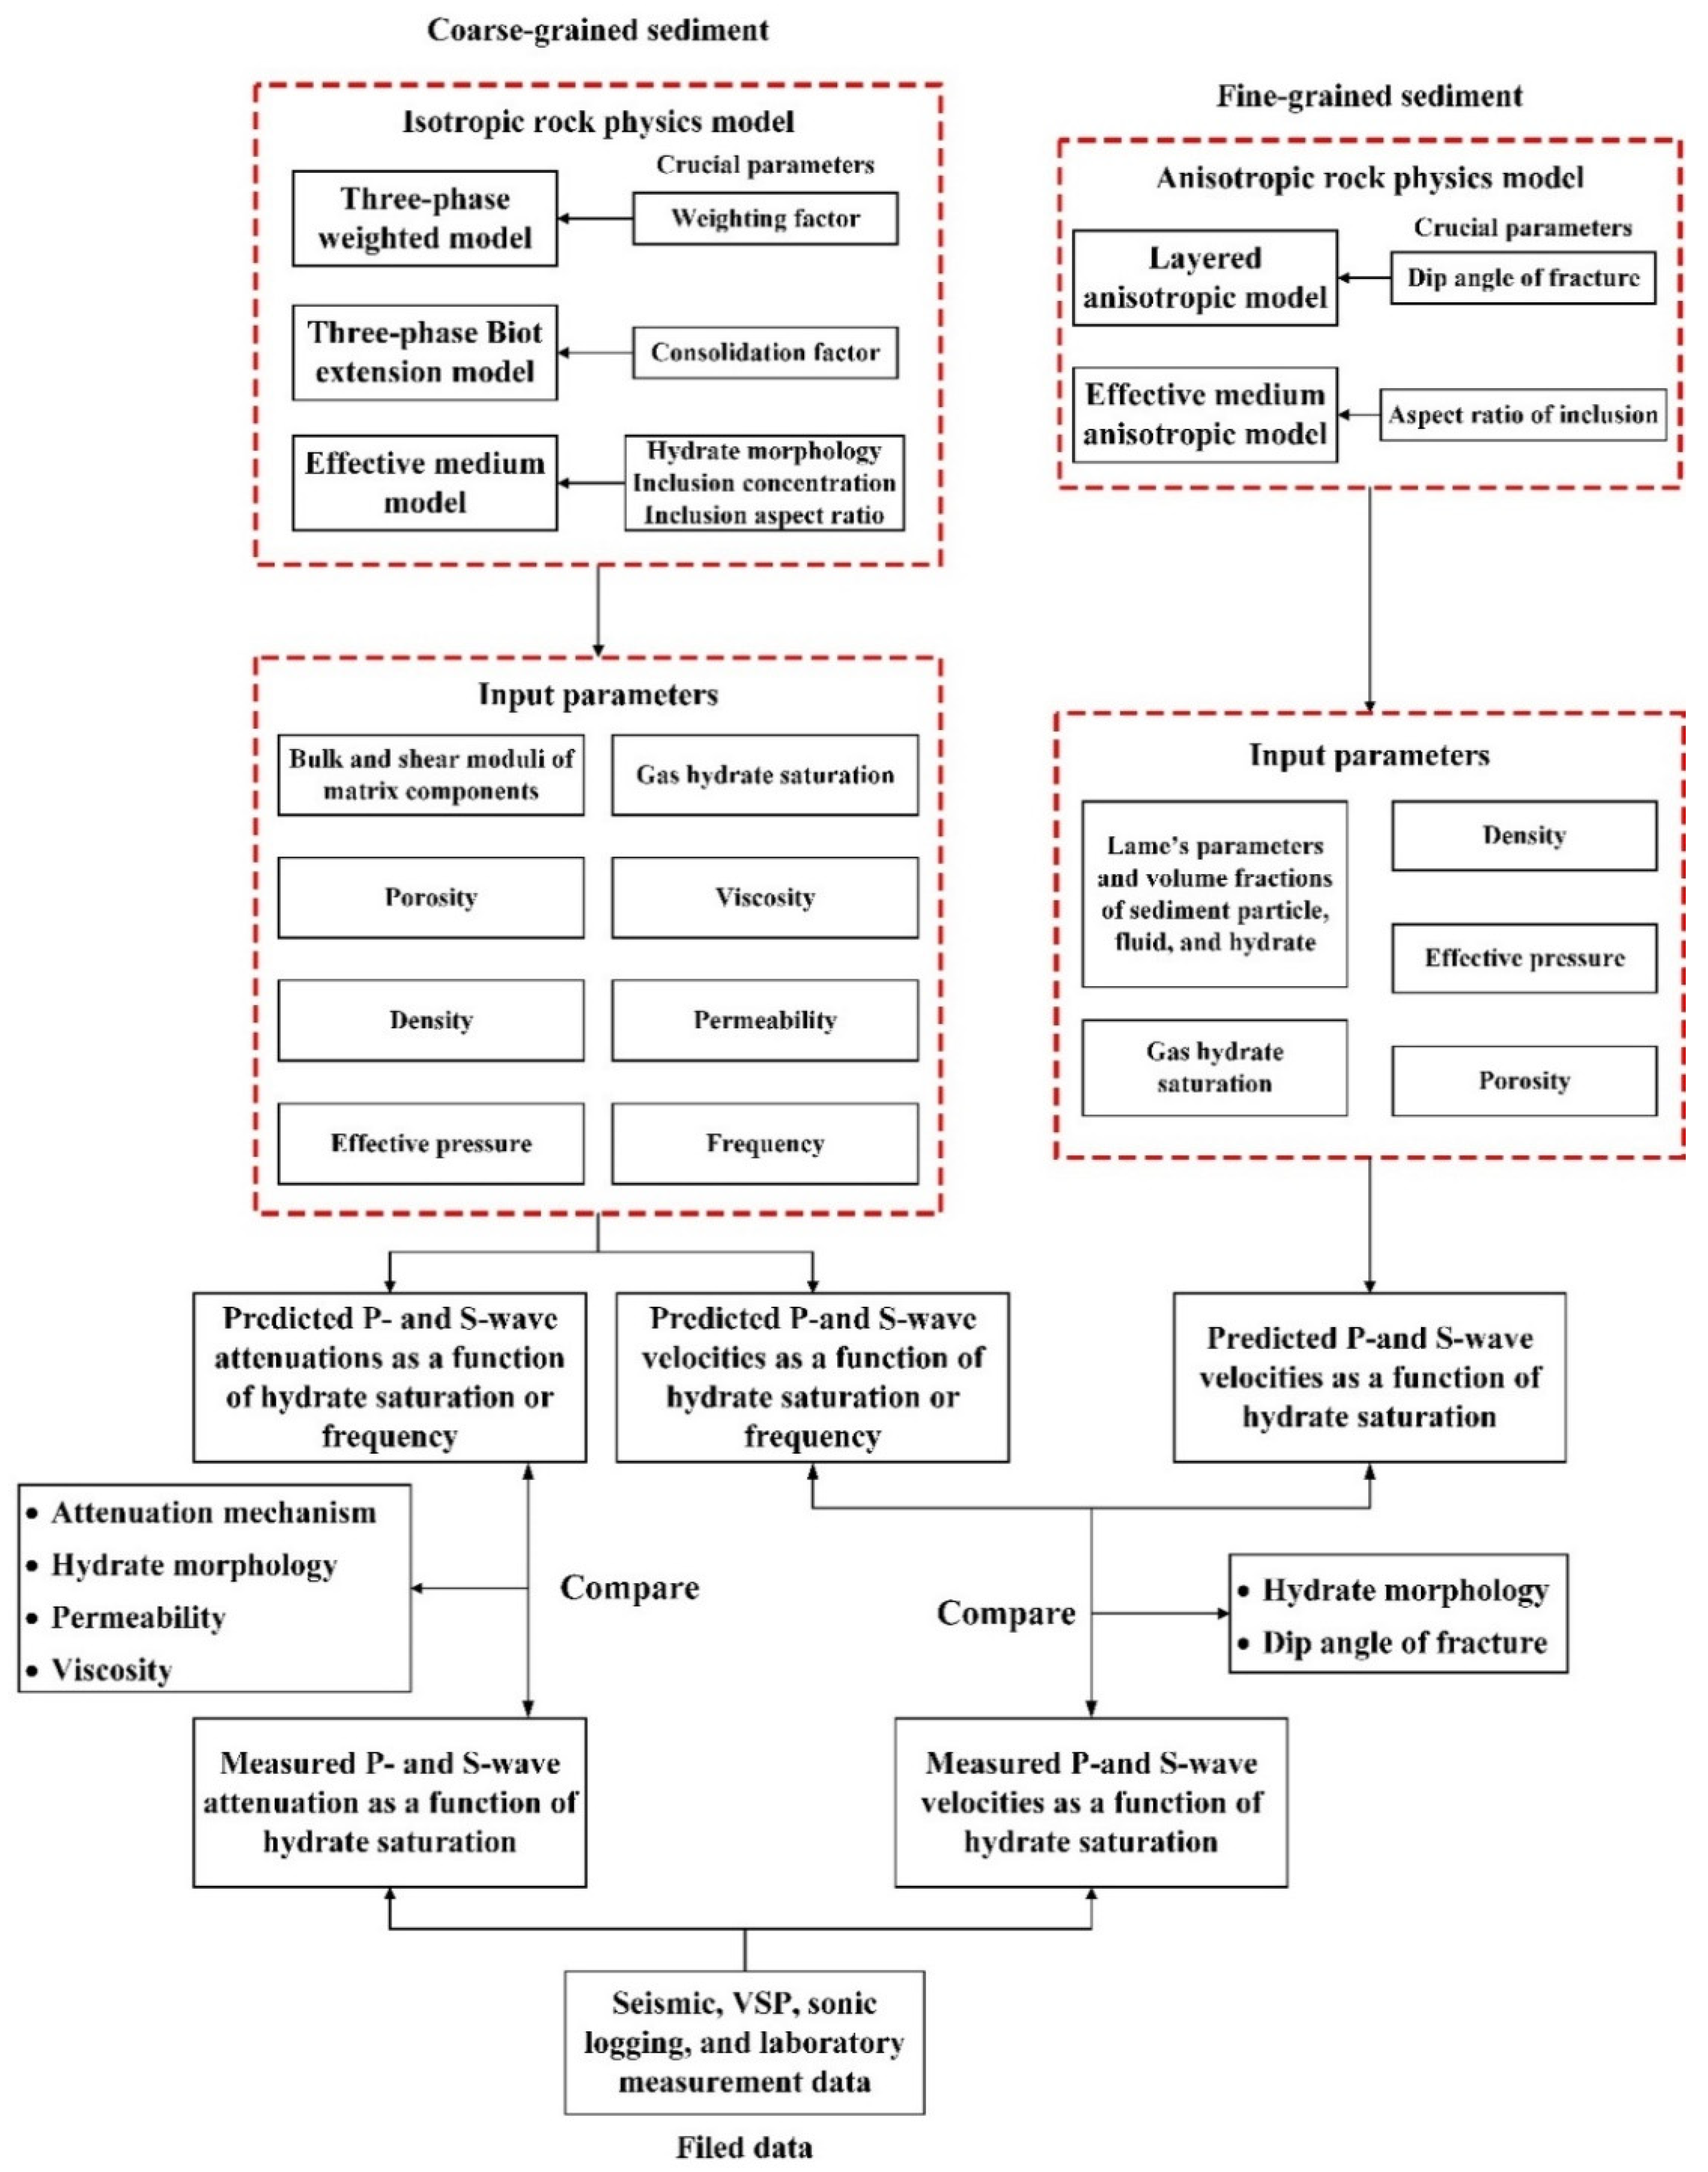
  • This study classifies the existing rock physics models into isotropic models for coarse-grained sediment including three-phase weighted equations, three-phase Biot extension equations, effective medium model, and anisotropic rock physics models for fine-grained sediment including layered anisotropic model and effective medium anisotropic model. We briefly introduce the assumption, characteristics, theoretical basis, and workflow of the aforementioned modeling. In particular, methods of introducing the attenuation caused by gas hydrate in the three-phase Biot extension model and effective medium model have also been reviewed. Then, the feasibility and limitations of these models are discussed and compared. This study provides insight into how to select a suitable rock physics model and how to conduct modeling in the application of the rock physics model to field data.
  • Several important parameters, including hydrate morphology, the dip angle of fracture, sediment permeability, and attenuation mechanisms, can be inferred from the comparison between the modeled and measured acoustic properties. Based on the modeling examples using the abovementioned models, we investigated how to define these parameters. The most important application of rock physics modeling is predicting the hydrate saturation from the measured velocity from field investigations or laboratory measurements. We discussed the uncertainties of the predicted saturation caused by the errors related to the velocity measurements or rock physics modeling.
  • We finally discussed the current challenges in rock physics modeling related to optimizing the input parameters, choice of a suitable model, and upscaling problems from ultrasonic to seismic and well log frequencies.

Author Contributions

Conceptualization and supervision, H.L.; methodology and writing—original draft preparation, L.Z.; writing—review and editing, H.L. and L.Z.; visualization and editing, B.L.; project administration and funding acquisition, Y.Z. All authors have read and agreed to the published version of the manuscript.

Funding

This research received funding from China Geological Survey (Grant No. DD20221703).

Institutional Review Board Statement

Not applicable.

Informed Consent Statement

Not applicable.

Data Availability Statement

Not applicable.

Acknowledgments

We highly appreciate the five anonymous reviewers for their comments and suggestions, which benefited us greatly in revising this manuscript.

Conflicts of Interest

The authors declare no conflict of interest.

Nomenclature

GHGas hydrate
FGFree gas
GHSZGas hydrate stability zone
P-waveCompressional wave
S-waveShear wave
VSPVertical seismic profiling
BSRBottom simulating reflector
THFTetrahydrofuran
K-G BasinKrishna-Godavari Basin

Appendix A. Three-Phase Weighted Model

Using the P-wave velocities predicted from the Wood model ( V P 1 ) and the Wyllie model ( V P 2 ), the P-wave velocity of composite sediment ( V P ) with any porosity ( ϕ ) and hydrate saturation ( S h ) can be obtained [136,137]:
1 V P = W ϕ ( 1 S h ) n V P 1 + [ 1 W ϕ ( 1 S h ) n ] V P 2
The P-wave velocities based on the Wood model and the Wyllie model can be predicted from following equations:
1 ρ V P 1 2 = ϕ ( 1 S h ) ρ f V f 2 + ϕ S h ρ h V h 2 + ( 1 ϕ ) ρ s V d r y 2
1 ρ V P 2 2 = ϕ ( 1 S h ) V f + ϕ S h V h + ( 1 ϕ ) V d r y
where, the parameters ρ , ρ f , ρ s and ρ h are the density of the sediment, fluid, sand, and hydrate, respectively. V f , V d r y and V h are the velocity of fluid, sand, and hydrate, respectively. W is the weighting factor which can be defined by fitting the field velocities to the modeled ones.
The S-wave velocity ( V s ) of GHBS can be calculated using the following equation:
V S = V P [ α ( 1 ϕ ) + β ϕ S h + γ ϕ ( 1 S h ) ]
where, parameters α , β and γ are the ratio of the S-wave velocity of sand, hydrate, and fluid to the P-wave velocity of the sediment, respectively.

Appendix B. Three-Phase Biot Extension Model

Guerin and Goldberg [29] presented the propagation equations for P- and S-waves as follows:
R φ = ρ φ ¨ + A φ ˙   ( P - wave ) ,   and   μ ψ = ρ ψ ¨ + A ψ ˙   ( S - wave )
The overdots in the above equations indicate time derivatives, and φ and ψ are compressional and shear displacement potentials, respectively. The complex roots of the above polynomials are calculated using the rigidity matrix R, the shear matrix μ , the density matrix ρ , and the friction matrix A, which are given by [29]:
R = ( R s s R s f R s h R s f R f f R f h R s h R f h R h h ) ,   μ = ( μ s s 0 μ s h 0 0 0 μ s h 0 μ h h ) ,   ρ = ( ρ s s ρ s f ρ s h ρ s f ρ f f ρ f h ρ s h ρ f h ρ h h ) , and   A = ( b s s + b s h b s s b s h b s s b s s + b h h b h h b s h b h h b s h + b h h )
where subscripts s, f, and h indicate values for sand grains, fluid, and hydrate, respectively. There are three modes of P-waves and two modes of S-waves (the complex roots for Equation (A5) are   Λ i   ,   i = 1 ,   2 ,   3 and   Ω i , i = 1 ,   2 ) :
V p i = [ R e ( Λ i ) ] 1 ,   Q p i 1 = | I m ( Λ i ) R e ( Λ i ) | ,   i = 1 , 2 , 3   ( P - wave )
V s i = [ R e ( Ω i ) ] 1 ,   Q s i 1 = | I m ( Ω i ) R e ( Ω i ) | ,   i = 1 , 2   ( S - wave )
where the Re and Im are the real and imaginary parts, respectively, of the complex roots of Equation (A5).
For the rigidity matrix R , the mass density matrix ρ , the shear moduli matrix μ , and the friction coefficient matrix A , Leclaire et al. [70], Carcione and Tinivella [63], and Guerin and Goldberg [29] have provided detailed equations for the coefficients in these matrices.

Appendix C. Effective Medium Model

Appendix C.1. Effective Medium Model

The correspondence principle is applied to the bulk ( K f ) and shear ( μ f ) moduli of fluid inclusion [155], as follows:
K f = K f + j 2 π f K h γ , μ f = j 2 π f η
By incorporating the squirt flow due to fluid inclusion in a microporous hydrate, the effective bulk ( K h ) and shear ( μ h ) moduli of the hydrate with fluid inclusion become a complex number.
K h = ( K h + 4 c i μ h L k α ) / ( 1 3 c i L k α )
μ h = μ h [ 1 + c i L μ α ( 9 K h + 8 μ h ) ] / [ 1 c i L μ α ( 6 K h + 12 μ h ) ]
where the intermediate variables L k α and L μ α are given by:
L k α = [ ( K f K h ) / ( 3 K h + 4 μ h ) ] { K h / [ K f + π α μ h ( 3 K h + μ h ) / ( 3 K h + 4 μ h ) ] }
L μ α = μ f μ h 25 μ h ( 3 K h + 4 μ h ) { 1 + 8 μ h 4 μ f + π α μ h [ 1 + 2 ( 3 K h + μ h 3 K h + 4 μ h ) ] + 2 [ 3 K f + 2 ( μ f + μ h ) 3 K f + 4 μ f + 3 π α μ h ( 3 K h + μ h 3 K h + 4 μ h ) ] }

Appendix C.2. Biot-Stoll Model

The effective and complex moduli of a solid phase ( K s o l i d and μ s o l i d ), fluid phase ( K f p ), and dry frame ( K d r y and μ d r y ) are then introduced into the Biot-Stoll model [156], and a, b, c, and q are calculated from Biot coefficients. The intermediate variables are given by:
P = ( b   ±   b 2 4 a c ) / 2 ,   S = ( q ρ e ρ f 2 ) / ( q μ d r y )
where μ d r y indicates the shear modulus of the dry frame and ρ e indicates the effective density of GHBS.
The Marin-Moreno model assumes that the presence of hydrate decreases the effective permeability ( k ) of the medium [85], which is expressed as:
k = { c p f / [ k 0 ( 1 S h ) n k p ] + ( 1 c p f ) / [ k 0 ( 1 S h ) n k c ] } 1
Therefore, the fast P-wave velocity ( V p 1 ), the slow P-wave velocity ( V p 2 ), the S-wave velocity ( V s ), the fast P-wave attenuation ( Q p 1 1 ), the slow P-wave attenuation ( Q p 2 1 ), and the S-wave attenuation ( Q s 1 ) are calculated as follows [84]:
V p 1 = R e ( P / c ) ,   V p 2 = R e ( a / P ) ,   V s = R e ( 1 / S ) ,   Q p 1 1 = 2 I m ( P / c ) / R e ( P / c ) , Q p 2 1 = 2 I m ( a / P ) / R e ( a / P ) ,   and   Q s 1 = 2 I m ( 1 / S ) / R e ( 1 / S )

Appendix D. Layered Anisotropic Model

Fracture-filled fine-grained GHBS can be modeled by laminated layers including the component of the pure hydrate layer and the isotropic water-saturated fine-grained sediment. The volume fractions of two components are defined as η 1 and η 2 . The phase velocities of the laminated sediment can be calculated:
G = ( η 1 G 1 + η 2 G 2 ) G 1 = ( η 1 / G 1 + η 2 / G 2 ) 1
where G is any elastic constants such as the Lame’s parameters and density ( λ , μ , and ρ ) of components 1 and 2.
The P- and S-wave velocities of the composite sediment can be predicted by:
V P = ( A sin 2 γ + C cos 2 γ + L + Q ) / 2 ρ V S V = ( A sin 2 γ + C cos 2 γ + L Q ) / 2 ρ V S H = ( N sin 2 γ + L cos 2 γ ) / ρ
where, intermediate variables can be calculated by following definitions.
A = 4 μ ( λ + μ ) / ( λ + 2 μ ) + 1 / ( λ + 2 μ ) 1 λ / ( λ + 2 μ ) 2 ,   C = 1 / ( λ + 2 μ ) 1 ,   F = 1 / ( λ + 2 μ ) 1 1 / ( λ + 2 μ ) ,   L = 1 / μ 1 , N = μ , ρ = ρ , Q = [ ( A L ) sin 2 γ ( C L ) cos 2 γ ] 2 + 4 ( F + L ) 2 sin 2 γ cos 2 γ Q p 2 1 = 2 I m ( a / P ) / R e ( a / P ) ,   and   Q s 1 = 2 I m ( 1 / S ) / R e ( 1 / S )

Appendix E. Effective Medium Anisotropic Model

Using the self-consistent approximation theory, the effective stiffnesses of the hydrate-water host composite can be estimated as follows.
C = [ i = 1 n ν i C i Q i ] [ j n ν j Q j ] 1
where ν i ( i = 1 , 2 , n ) is the volume fractions of the sediment components, and C i is the elastic stiffness of these components. The intermediate variable Q i is defined by the formula as follows.
Q i = [ I + P ( C ) ( C i C ) ] 1
where the identity matrix I of size n is the 6 × 6 square matrix. The fourth rank tensor P is a function of elastic stiffness C and the tensor can be calculated by solving Green’s function of displacement.
The successive and infinitesimal reduction d ν i in the volume ν i of biconnected hydrate particles or water-saturated pores and the replacement with the other component can be conducted through differential effective medium approximation. The resulted alteration of elastic stiffness d C can be expressed as follows.
d C = d v i 1 v i ( C i C ) Q i
Simultaneously, the alteration of volume fraction of other sediment components can be computed as:
d v j = v j d v i k i v k

Appendix F. Moduli, Densities, and Velocities of Sand, Clay, Hydrate, and Water in the Rock Physics Models

Parameters and UnitsValue
K s a n d : sand bulk modulus, Pa38 × 109 [29]
K c l a y : clay bulk modulus, Pa21.2 × 109 [29]
K h : hydrate bulk modulus, Pa7.9 × 109 [84]
K f : water bulk modulus, Pa2.67 × 109 [29]
μ s a n d : sand shear modulus, Pa44 × 109 [29]
μ c l a y : clay shear modulus, Pa6.67 × 109 [29]
μ h : hydrate shear modulus, Pa3.3 × 109 [29]
ρ s a n d : sand grain density, kg/m32700 [29]
ρ c l a y : clay grain density, kg/m32580 [29]
ρ h : hydrate density, kg/m3600 [29]
ρ f : water density, kg/m31000 [29]
V P s a n d : P-wave velocity of sand6050 [84]
V P c l a y : P-wave velocity of clay, m/s3420 [84]
V P h y d r a t e : P-wave velocity of hydrate, m/s3870 [84]
V P w a t e r : P-wave velocity of water, m/s1600 [84]
V S s a n d : S-wave velocity of sand, m/s4090 [84]
V S c l a y : S-wave velocity of clay, m/s1640 [84]
V S h y d r a t e : S-wave velocity of water, m/s1950 [84]

References

  1. Sloan, E.D.; Koh, C. Clathrate Hydrates of Natural Gases, 3rd ed.; CRC Press: Boca Raton, FL, USA, 2006; ISBN 9781420008494. [Google Scholar]
  2. Haq, B.U. Methane in the Deep Blue Sea. Science 1999, 285, 543–544. [Google Scholar] [CrossRef]
  3. Hassanpouryouzband, A.; Joonaki, E.; Vasheghani Farahani, M.; Takeya, S.; Ruppel, C.; Yang, J.; English, N.J.; Schicks, J.M.; Edlmann, K.; Mehrabian, H.; et al. Gas Hydrates in Sustainable Chemistry. Chem. Soc. Rev. 2020, 49, 5225–5309. [Google Scholar] [CrossRef] [PubMed]
  4. Yang, J.; Hassanpouryouzband, A.; Tohidi, B.; Chuvilin, E.; Bukhanov, B.; Istomin, V.; Cheremisin, A. Gas Hydrates in Permafrost: Distinctive Effect of Gas Hydrates and Ice on the Geomechanical Properties of Simulated Hydrate-Bearing Permafrost Sediments. J. Geophys. Res. Solid Earth 2019, 124, 2551–2563. [Google Scholar] [CrossRef]
  5. Cheng, C.; Wang, F.; Tian, Y.; Wu, X.; Zheng, J.; Zhang, J.; Li, L.; Yang, P.; Zhao, J. Review and Prospects of Hydrate Cold Storage Technology. Renew. Sustain. Energy Rev. 2020, 117, 109492. [Google Scholar] [CrossRef]
  6. Yan, C.; Ren, X.; Cheng, Y.; Song, B.; Li, Y.; Tian, W. Geomechanical Issues in the Exploitation of Natural Gas Hydrate. Gondwana Res. 2020, 81, 403–422. [Google Scholar] [CrossRef]
  7. Ning, Y.; Li, Y.; Song, G.; Wang, W.; Liu, X.; Liu, Z.; Zhang, J. Investigation on Hydrate Formation and Growth Characteristics in Dissolved Asphaltene-Containing Water-In-Oil Emulsion. Langmuir 2021, 37, 11072–11083. [Google Scholar] [CrossRef]
  8. Khormali, A.; Sharifov, A.R.; Torba, D.I. Experimental and Modeling Analysis of Asphaltene Precipitation in the near Wellbore Region of Oil Wells. Pet. Sci. Technol. 2018, 36, 1030–1036. [Google Scholar] [CrossRef]
  9. Khormali, A.; Moghadasi, R.; Kazemzadeh, Y.; Struchkov, I. Development of a New Chemical Solvent Package for Increasing the Asphaltene Removal Performance under Static and Dynamic Conditions. J. Pet. Sci. Eng. 2021, 206, 109066. [Google Scholar] [CrossRef]
  10. Chong, Z.R.; Yang, S.H.B.; Babu, P.; Linga, P.; Li, X. Sen Review of Natural Gas Hydrates as an Energy Resource: Prospects and Challenges. Appl. Energy 2016, 162, 1633–1652. [Google Scholar] [CrossRef]
  11. Zatsepina, O.Y.; Buffett, B.A. Phase Equilibrium of Gas Hydrate: Implications for the Formation of Hydrate in the Deep Sea Floor. Geophys. Res. Lett. 1997, 24, 1567–1570. [Google Scholar] [CrossRef]
  12. Kelland, M. Natural Gas Hydrates: Energy for the Future. Mar. Pollut. Bull. 1994, 29, 307–311. [Google Scholar] [CrossRef]
  13. Minshull, T.A.; Marín-Moreno, H.; Betlem, P.; Bialas, J.; Bünz, S.; Burwicz, E.; Cameselle, A.L.; Cifci, G.; Giustiniani, M.; Hillman, J.I.T.; et al. Hydrate Occurrence in Europe: A Review of Available Evidence. Mar. Pet. Geol. 2020, 111, 735–764. [Google Scholar] [CrossRef]
  14. Yamamoto, K.; Boswell, R.; Collett, T.S.; Dallimore, S.R.; Lu, H. Review of Past Gas Production Attempts from Subsurface Gas Hydrate Deposits and Necessity of Long-Term Production Testing. Energy Fuels 2022, 36, 5047–5062. [Google Scholar] [CrossRef]
  15. Collett, T.S.; Boswell, R.; Waite, W.F.; Kumar, P.; Roy, S.K.; Chopra, K.; Singh, S.K.; Yamada, Y.; Tenma, N.; Pohlman, J.; et al. India National Gas Hydrate Program Expedition 02 Summary of Scientific Results: Gas Hydrate Systems along the Eastern Continental Margin of India. Mar. Pet. Geol. 2019, 108, 39–142. [Google Scholar] [CrossRef]
  16. Collett, T.S.; Zyrianova, M.V.; Okinaka, N.; Wakatsuki, M.; Boswell, R.; Marsteller, S.; Minge, D.; Crumley, S.; Itter, D.; Hunter, R.; et al. Planning and Operations of the Hydrate 01 Stratigraphic Test Well, Prudhoe Bay Unit, Alaska North Slope. Energy Fuels 2022, 36, 3016–3039. [Google Scholar] [CrossRef]
  17. White, M.D.; Kneafsey, T.J.; Seol, Y.; Waite, W.F.; Uchida, S.; Lin, J.S.; Myshakin, E.M.; Gai, X.; Gupta, S.; Reagan, M.T.; et al. An International Code Comparison Study on Coupled Thermal, Hydrologic and Geomechanical Processes of Natural Gas Hydrate-Bearing Sediments. Mar. Pet. Geol. 2020, 120, 104566. [Google Scholar] [CrossRef]
  18. Dawe, R.A.; Thomas, S. A Large Potential Methane Source—Natural Gas Hydrates. Energy Sources Part A Recover. Util. Environ. Eff. 2007, 29, 217–229. [Google Scholar] [CrossRef]
  19. Demirbas, A. Methane Hydrates as Potential Energy Resource: Part 2—Methane Production Processes from Gas Hydrates. Energy Convers. Manag. 2010, 51, 1562–1571. [Google Scholar] [CrossRef]
  20. Demirbas, A.; Rehan, M.; Al-Sasi, B.O.; Nizami, A.S. Evaluation of Natural Gas Hydrates as a Future Methane Source. Pet. Sci. Technol. 2016, 34, 1204–1210. [Google Scholar] [CrossRef]
  21. Swaranjit Singh, A.A. Natural Gas Hydrate as an Upcoming Resource of Energy. J. Pet. Environ. Biotechnol. 2015, 6, 1–6. [Google Scholar] [CrossRef]
  22. Kvenvolden, K.A. Gas Hydrates—Geological Perspective and Global Change. Rev. Geophys. 1993, 31, 173–187. [Google Scholar] [CrossRef]
  23. Zimmerman, R.W.; Kingt, M.S. The Effect of the Extent of Freezing on Seismic Velocities in Unconsolidated Permafrost. Geophysics 1986, 51, 1285–1290. [Google Scholar] [CrossRef]
  24. Dou, S.; Nakagawa, S.; Dreger, D.; Ajo-Franklin, J. A Rock-Physics Investigation of Unconsolidated Saline Permafrost: P-Wave Properties from Laboratory Ultrasonic Measurements. Geophysics 2016, 81, WA233–WA245. [Google Scholar] [CrossRef]
  25. Dou, S.; Nakagawa, S.; Dreger, D.; Ajo-Franklin, J. An Effective-Medium Model for P-Wave Velocities of Saturated, Unconsolidated Saline Permafrost. Geophysics 2017, 82, EN33–EN50. [Google Scholar] [CrossRef]
  26. Vasheghani Farahani, M.; Hassanpouryouzband, A.; Yang, J.; Tohidi, B. Development of a Coupled Geophysical-Geothermal Scheme for Quantification of Hydrates in Gas Hydrate-Bearing Permafrost Sediments. Phys. Chem. Chem. Phys. 2021, 23, 24249–24264. [Google Scholar] [CrossRef] [PubMed]
  27. Zhan, L.; Matsushima, J. Rock-Physics Modeling of Ultrasonic P- And S-Wave Attenuation in Partially Frozen Brine and Unconsolidated Sand Systems and Comparison with Laboratory Measurements. Geophysics 2019, 84, MR153–MR171. [Google Scholar] [CrossRef]
  28. Collett, T.S. Energy Resource Potential of Natural Gas Hydrates. Am. Assoc. Pet. Geol. Bull. 2002, 86, 1971–1992. [Google Scholar]
  29. Guerin, G.; Goldberg, D. Modeling of Acoustic Wave Dissipation in Gas Hydrate-Bearing Sediments. Geochem. Geophys. Geosyst. 2005, 6, 1–16. [Google Scholar] [CrossRef]
  30. Guerin, G.; Goldberg, D.; Collett, T.S. Sonic Attenuation in the JAPEX/JNOC/GSC et Al. Mallik 5L-38 Gas Hydrate Production Research Well. Geol. Surv. Can. Bull. 2005, 585, 117. [Google Scholar] [CrossRef]
  31. Yuan, T.; Hyndman, R.D.; Spence, G.D.; Desmons, B. Seismic Velocity Increase and Deep-Sea Gas Hydrate Concentration above a Bottom-Simulating Reflector on the Northern Cascadia Continental Slope. J. Geophys. Res. 1996, 101, 13655. [Google Scholar] [CrossRef]
  32. Guo, Z.; Wang, X.; Jiao, J.; Chen, H. Rock Physics Model and Seismic Dispersion and Attenuation in Gas Hydrate-Bearing Sediments. Front. Earth Sci. 2021, 9, 641606. [Google Scholar] [CrossRef]
  33. Liu, L.; Zhang, X.; Ji, Y.; Wang, X. Acoustic Wave Propagation in a Borehole with a Gas Hydrate-Bearing Sediment. J. Mar. Sci. Eng. 2022, 10, 235. [Google Scholar] [CrossRef]
  34. Liu, L.; Zhang, X.; Wang, X. Wave Propagation Characteristics in Gas Hydrate-Bearing Sediments and Estimation of Hydrate Saturation. Energies 2021, 14, 804. [Google Scholar] [CrossRef]
  35. Boswell, R.; Collett, T.S. Current Perspectives on Gas Hydrate Resources. Energy Environ. Sci. 2011, 4, 1206–1215. [Google Scholar] [CrossRef]
  36. Zhan, L.; Matsushima, J. Frequency-Dependent P-Wave Attenuation in Hydrate-Bearing Sediments: A Rock Physics Study at Nankai Trough, Japan. Geophys. J. Int. 2018, 214, 1961–1985. [Google Scholar] [CrossRef]
  37. Waite, W.F.; Santamarina, J.C.; Cortes, D.D.; Dugan, B.; Espinoza, D.N.; Germaine, J.; Jang, J.; Jung, J.W.; Kneafsey, T.J.; Shin, H.; et al. Physical Properties of Hydrate-Bearing Sediments. Rev. Geophys. 2009, 47. [Google Scholar] [CrossRef]
  38. Yun, T.S.; Francisca, F.M.; Santamarina, J.C.; Ruppel, C. Compressional and Shear Wave Velocities in Uncemented Sediment Containing Gas Hydrate. Geophys. Res. Lett. 2005, 32, 1–5. [Google Scholar] [CrossRef]
  39. Waite, W.F.; Jang, J.; Collett, T.S.; Kumar, P. Downhole Physical Property-Based Description of a Gas Hydrate Petroleum System in NGHP-02 Area C: A Channel, Levee, Fan Complex in the Krishna-Godavari Basin Offshore Eastern India. Mar. Pet. Geol. 2019, 108, 272–295. [Google Scholar] [CrossRef]
  40. Dai, S.; Santamarina, J.C.; Waite, W.F.; Kneafsey, T.J. Hydrate Morphology: Physical Properties of Sands with Patchy Hydrate Saturation. J. Geophys. Res. B Solid Earth 2012, 117, B11205. [Google Scholar] [CrossRef]
  41. Ecker, C.; Dvorkin, J.; Nur, A.M. Estimating the Amount of Gas Hydrate and Free Gas from Marine Seismic Data. Geophysics 2000, 65, 565–573. [Google Scholar] [CrossRef]
  42. Zhan, L.; Kang, D.; Lu, H.; Lu, J. Characterization of Coexistence of Gas Hydrate and Free Gas Using Sonic Logging Data in the Shenhu Area, South China Sea. J. Nat. Gas Sci. Eng. 2022, 101, 104540. [Google Scholar] [CrossRef]
  43. Ren, X.; Guo, Z.; Ning, F.; Ma, S. Permeability of Hydrate-Bearing Sediments. Earth-Sci. Rev. 2020, 202, 103100. [Google Scholar] [CrossRef]
  44. Sahoo, S.K.; North, L.J.; Marín-Moreno, H.; Minshull, T.A.; Best, A.I. Laboratory Observations of Frequency-Dependent Ultrasonic P-Wave Velocity and Attenuation during Methane Hydrate Formation in Berea Sandstone. Geophys. J. Int. 2019, 219, 713–723. [Google Scholar] [CrossRef]
  45. Sahoo, S.K.; Madhusudhan, B.N.; Marín-Moreno, H.; North, L.J.; Ahmed, S.; Falcon-Suarez, I.H.; Minshull, T.A.; Best, A.I. Laboratory Insights Into the Effect of Sediment-Hosted Methane Hydrate Morphology on Elastic Wave Velocity From Time-Lapse 4-D Synchrotron X-Ray Computed Tomography. Geochem. Geophys. Geosyst. 2018, 19, 4502–4521. [Google Scholar] [CrossRef]
  46. Jang, J.; Santamarina, J.C. Hydrate Bearing Clayey Sediments: Formation and Gas Production Concepts. Mar. Pet. Geol. 2016, 77, 235–246. [Google Scholar] [CrossRef]
  47. Lei, L.; Seol, Y.; Jarvis, K. Pore-Scale Visualization of Methane Hydrate-Bearing Sediments with Micro-CT. Geophys. Res. Lett. 2018, 45, 5417–5426. [Google Scholar] [CrossRef]
  48. Lei, L.; Santamarina, J.C. Physical Properties of Fine-Grained Sediments with Segregated Hydrate Lenses. Mar. Pet. Geol. 2019, 109, 899–911. [Google Scholar] [CrossRef]
  49. Shankar, U.; Riedel, M. Gas Hydrate Saturation in the Krishna-Godavari Basin from P-Wave Velocity and Electrical Resistivity Logs. Mar. Pet. Geol. 2011, 28, 1768–1778. [Google Scholar] [CrossRef]
  50. Majumdar, U.; Cook, A.E.; Shedd, W.; Frye, M. The Connection between Natural Gas Hydrate and Bottom-Simulating Reflectors. Geophys. Res. Lett. 2016, 43, 7044–7051. [Google Scholar] [CrossRef]
  51. Haacke, R.R.; Westbrook, G.K.; Hyndman, R.D. Gas Hydrate, Fluid Flow and Free Gas: Formation of the Bottom-Simulating Reflector. Earth Planet. Sci. Lett. 2007, 261, 407–420. [Google Scholar] [CrossRef]
  52. Yun, T.S.; Santamarina, C.J.; Ruppel, C. Mechanical Properties of Sand, Silt, and Clay Containing Tetrahydrofuran Hydrate. J. Geophys. Res. Solid Earth 2007, 112, 1–13. [Google Scholar] [CrossRef]
  53. Matsushima, J. Seismic Wave Attenuation in Methane Hydrate-Bearing Sediments Vertical Seismic Profiling Data from the Nankai Trough Exploratory Well, Offshore Tokai, Central Japan. J. Geophys. Res. Solid Earth 2006, 111, 1–20. [Google Scholar] [CrossRef]
  54. Jakobsen, M.; Hudson, J.A.; Minshull, T.A.; Singh, S.C. Elastic Properties of Hydrate-Bearing Sediments Using Effective Medium Theory. J. Geophys. Res. 2000, 105, 561–577. [Google Scholar] [CrossRef]
  55. Helgerud, M.B.; Dvorkin, J.; Nur, A.; Sakai, A.; Collett, T. Elastic-Wave Velocity in Marine Sediments with Gas Hydrates: Effective Medium Modeling. Geophys. Res. Lett. 1999, 26, 2021–2024. [Google Scholar] [CrossRef]
  56. Carcione, J.M.; Seriani, G. Seismic and Ultrasonic Velocities in Permafrost. Geophys. Prospect. 1998, 46, 441–454. [Google Scholar] [CrossRef]
  57. Lee, M.W.; Waite, W.F. Estimating Pore-Space Gas Hydrate Saturations from Well Log Acoustic Data. Geochem. Geophys. Geosyst. 2008, 9, 1–8. [Google Scholar] [CrossRef]
  58. Priest, J.A.; Best, A.I.; Clayton, C.R.I. A Laboratory Investigation into the Seismic Velocities of Methane Gas Hydrate-Bearing Sand. J. Geophys. Res. Solid Earth 2005, 110, 1–13. [Google Scholar] [CrossRef]
  59. Priest, J.A.; Rees, E.V.L.; Clayton, C.R.I. Influence of Gas Hydrate Morphology on the Seismic Velocities of Sands. J. Geophys. Res. Solid Earth 2009, 114, 1–13. [Google Scholar] [CrossRef]
  60. Lee, J.Y.; Francisca, F.M.; Santamarina, J.C.; Ruppel, C. Parametric Study of the Physical Properties of Hydrate-Bearing Sand, Silt, and Clay Sediments: 2. Small-Strain Mechanical Properties. J. Geophys. Res. Solid Earth 2010, 115, 1–11. [Google Scholar] [CrossRef]
  61. Dvorkin, J.; Moos, D.; Packwood, J.L.; Nur, A.M. Identifying Patchy Saturation from Well Logs. Geophysics 1999, 64, 1756–1759. [Google Scholar] [CrossRef]
  62. Lee, M.W. Elastic Velocities of Partially Gas-Saturated Unconsolidated Sediments. Mar. Pet. Geol. 2004, 21, 641–650. [Google Scholar] [CrossRef]
  63. Carcione, J.M.; Tinivella, U. Bottom-Simulating Reflectors: Seismic Velocities and AVO Effects. Geophysics 2000, 65, 54–67. [Google Scholar] [CrossRef]
  64. Johnston, D.H.; Toksoz, M.N.; Timur, A. Attenuation of Seismic Waves in Dry and Saturated Rocks; II, Mechanisms. Geophysics 1979, 44, 691–711. [Google Scholar] [CrossRef]
  65. Walsh, J.B. Seismic Wave Attenuation in Rock Due to Frcition. J. Geophys. Res. 1966, 71, 2591–2599. [Google Scholar] [CrossRef]
  66. Winkler, K.W.; Nur, A. Seismic Attenuation: Effects of Pore Fluids and Frictional-sliding. Geophysics 1982, 47, 1–15. [Google Scholar] [CrossRef]
  67. White, J. Computed seismic speeds and attenuation in rocks with partial gas saturation. Geophysics 1975, 40, 224–232. [Google Scholar] [CrossRef]
  68. Tisato, N.; Quintal, B.; Chapman, S.; Podladchikov, Y.; Burg, J.P. Bubbles Attenuate Elastic Waves at Seismic Frequencies: First Experimental Evidence. Geophys. Res. Lett. 2015, 42, 3880–3887. [Google Scholar] [CrossRef]
  69. Biot, M.A. Theory of Propagation of Elastic Waves in a Fluid-Saturated Porous Solid. I. Low-Frequency Range. J. Acoust. Soc. Am. 1956, 28, 168–178. [Google Scholar] [CrossRef]
  70. Leclaire, P.; Cohen-Ténoudji, F.; Aguirre-Puente, J. Extension of Biot’s Theory of Wave Propagation to Frozen Porous Media. J. Acoust. Soc. Am. 1994, 96, 3753–3768. [Google Scholar] [CrossRef]
  71. Mavko, G.M.; Nur, A. Wave Attenuation in Partially Saturated Rocks. Geophysics 1979, 44, 161–178. [Google Scholar] [CrossRef]
  72. Mavko, G.; Jizba, D. Estimating Grain-Scale Fluid Effects on Velocity Dispersion in Rocks. Geophysics 1991, 56, 1940–1949. [Google Scholar] [CrossRef]
  73. Murphy, W.M. Effects of Partial Water Saturation on Attenuation in Massillon Sandstone and Vycor Porous Glass. J. Acoust. Soc. Am. 1983, 71, 1458–1486. [Google Scholar] [CrossRef]
  74. Murphy, W.F.; Winkler, K.W.; Kleinberg, R.L. Acoustic Relaxation in Sedimentary Rocks: Dependence on Grain Contacts and Fluid Saturation. Geophysics 1986, 51, 757–766. [Google Scholar] [CrossRef]
  75. Jones, T.D. Pore Fluids and Frequency-Dependent Wave Propagation in Rocks. Geophysics 1986, 51, 1939–1953. [Google Scholar] [CrossRef]
  76. Ba, J.; Nie, J.X.; Cao, H.; Yang, H.Z. Mesoscopic Fluid Flow Simulation in Double-Porosity Rocks. Geophys. Res. Lett. 2008, 35, 1–5. [Google Scholar] [CrossRef]
  77. Tisato, N.; Quintal, B. Measurements of Seismic Attenuation and Transient Fluid Pressure in Partially Saturated Berea Sandstone: Evidence of Fluid Flow on the Mesoscopic Scale. Geophys. J. Int. 2013, 195, 342–351. [Google Scholar] [CrossRef]
  78. Müller, T.M.; Gurevich, B. Wave-Induced Fluid Flow in Random Porous Media: Attenuation and Dispersion of Elastic Waves. J. Acoust. Soc. Am. 2005, 117, 2732–2741. [Google Scholar] [CrossRef]
  79. Pride, S.R.; Berryman, J.G.; Harris, J.M. Seismic Attenuation Due to Wave-Induced Flow. J. Geophys. Res. Solid Earth 2004, 109, 1–19. [Google Scholar] [CrossRef]
  80. Sams, M.S.; Neep, J.P.; Worthington, M.H.; King, M.S. The Measurement of Velocity Dispersion and Frequency-Dependent Intrinsic Attenuation in Sedimentary Rocks. Geophysics 1997, 62, 1456–1464. [Google Scholar] [CrossRef]
  81. Best, A.I.; Huggett, Q.J.; Harris, A.J.K. Comparison of in Situ and Laboratory Acoustic Measurements on Lough Hyne Marine Sediments. J. Acoust. Soc. Am. 2001, 110, 695. [Google Scholar] [CrossRef]
  82. Batzle, M.L.; Han, D.-H.; Hofmann, R. Fluid Mobility and Frequency-Dependent Seismic Velocity—Direct Measurements. Geophysics 2006, 71, N1–N9. [Google Scholar] [CrossRef]
  83. Best, A.I.; Priest, J.A.; Clayton, C.R.I.; Rees, E.V.L. The Effect of Methane Hydrate Morphology and Water Saturation on Seismic Wave Attenuation in Sand under Shallow Sub-Seafloor Conditions. Earth Planet. Sci. Lett. 2013, 368, 78–87. [Google Scholar] [CrossRef]
  84. Marín-Moreno, H.; Sahoo, S.K.; Best, A.I. Theoretical Modeling Insights into Elastic Wave Attenuation Mechanisms in Marine Sediments with Pore-Filling Methane Hydrate. J. Geophys. Res. Solid Earth 2017, 122, 1835–1847. [Google Scholar] [CrossRef]
  85. Priest, J.A.; Best, A.I.; Clayton, C.R.I. Attenuation of Seismic Waves in Methane Gas Hydrate-Bearing Sand. Geophys. J. Int. 2006, 164, 149–159. [Google Scholar] [CrossRef]
  86. Chaouachi, M.; Falenty, A.; Sell, K.; Enzmann, F.; Kersten, M.; Haberthür, D.; Kuhs, W.F. Microstructural Evolution of Gas Hydrates in Sedimentary Matrices Observed with Synchrotron X-Ray Computed Tomographic Microscopy. Geochem. Geophys. Geosyst. 2015, 16, 1711–1722. [Google Scholar] [CrossRef]
  87. Sell, K.; Quintal, B.; Kersten, M.; Saenger, E.H. Squirt Flow Due to Interfacial Water Films in Hydrate Bearing Sediments. Solid Earth. 2018, 9, 699–711. [Google Scholar] [CrossRef]
  88. Sahoo, S.K.; Best, A.I. The Influence of Gas Hydrate Morphology on Reservoir Permeability and Geophysical Shear Wave Remote Sensing. J. Geophys. Res. Solid Earth 2021, 126, e2021JB022206. [Google Scholar] [CrossRef]
  89. Lei, L.; Seol, Y.; Myshakin, E.M. Methane Hydrate Film Thickening in Porous Media. Geophys. Res. Lett. 2019, 46, 11091–11099. [Google Scholar] [CrossRef]
  90. Sahoo, S.K.; Marín-Moreno, H.; North, L.J.; Falcon-Suarez, I.; Madhusudhan, B.N.; Best, A.I.; Minshull, T.A. Presence and Consequences of Coexisting Methane Gas With Hydrate Under Two Phase Water-Hydrate Stability Conditions. J. Geophys. Res. Solid Earth 2018, 123, 3377–3390. [Google Scholar] [CrossRef]
  91. Uchida, T.; Lu, H.; Tomaru, H.; Matsumoto, R.; Senoh, O.; Oda, H.; Okada, S.; Delwiche, M.; Dallimore, S.R. Subsurface Occurrence of Natural Gas Hydrate in the Nankai Trough Area: Implication for Gas Hydrate Concentration. Resour. Geol. 2004, 54, 35–44. [Google Scholar] [CrossRef]
  92. Guerin, G.; Goldberg, D. Sonic Waveform Attenuation in Gas Hydrate-Bearing Sediments from the Mallik 2L-38 Research Well, Mackenzie Delta, Canada. J. Geophys. Res. B Solid Earth 2002, 107, EPM-1. [Google Scholar] [CrossRef]
  93. Wang, X.; Lee, M.; Wu, S.; Yang, S. Identification of Gas Hydrate Dissociation from Wireline-Log Data in the Shenhu Area, South China Sea. Geophysics 2012, 77, B125–B134. [Google Scholar] [CrossRef]
  94. Wang, X.; Hutchinson, D.R.; Wu, S.; Yang, S.; Guo, Y. Elevated Gas Hydrate Saturation within Silt and Silty Clay Sediments in the Shenhu Area, South China Sea. J. Geophys. Res. Solid Earth 2011, 116, 1–18. [Google Scholar] [CrossRef]
  95. Kumar, P.; Collett, T.S.; Vishwanath, K.; Shukla, K.M.; Nagalingam, J.; Lall, M.V.; Yamada, Y.; Schultheiss, P.; Holland, M. Gas-Hydrate-Bearing Sand Reservoir Systems in the Offshore of India: Results of the India National Gas Hydrate Program Expedition 02. Fire Ice 2016, 16, 1–20. [Google Scholar]
  96. Ryu, B.; Riedel, M. Gas Hydrates in the Ulleung Basin, East Sea of Korea. Terr. Atmos. Ocean. Sci. 2017, 28, 943–963. [Google Scholar] [CrossRef]
  97. Riedel, M.; Willoughby, E.; Chopra, S. Geophysical Characterization of Gas Hydrates; Society of Exploration Geophysicists: Houston, TX, USA, 2010; ISBN 978-1-56080-218-1. [Google Scholar]
  98. Holbrook, W.S.; Hoskins, H.; Wood, W.T.; Stephen, R.A.; Lizarralde, D. Methane Hydrate and Free Gas on the Blake Ridge from Vertical Seismic Profiling. Science 1996, 273, 1840–1843. [Google Scholar] [CrossRef]
  99. Ashi, J.; Tokuyama, H.; Taira, A. Distribution of Methane Hydrate BSRs and Its Implication for the Prism Growth in the Nankai Trough. Mar. Geol. 2002, 187, 177–191. [Google Scholar] [CrossRef]
  100. Pecher, I.A.; Holbrook, W.S.; Sen, M.K.; Lizarralde, D.; Wood, W.T.; Hutchinson, D.R.; Dillon, W.P.; Hoskins, H.; Stephen, R.A. Seismic Anisotropy in Gas-Hydrate- and Gas-Bearing Sediments on the Blake Ridge, from a Walkaway Vertical Seismic Profile. Geophys. Res. Lett. 2003, 30, 1–4. [Google Scholar] [CrossRef]
  101. Chand, S.; Minshull, T.A. Seismic Constraints on the Effects of Gas Hydrate on Sediment Physical Properties and Fluid Flow: A Review. Geofluids 2003, 3, 275–289. [Google Scholar] [CrossRef]
  102. Archie, G.E. The Electrical Resistivity Log as an Aid in Determining Some Reservoir Characteristics. Pet. Technol. 1942, 146, 54–62. [Google Scholar] [CrossRef]
  103. Matsushima, J. Attenuation Measurements from Sonic Waveform Logs in Methane Hydrate-Bearing Sediments at the Nankai Trough Exploratory Well off Tokai, Central Japan. Geophys. Res. Lett. 2005, 32, 1–5. [Google Scholar] [CrossRef]
  104. Winters, W.J.; Waite, W.F.; Mason, D.H. Effects of Methane Hydrate on the Physical Properties of Sediments. In Natural Gas Hydrates—ENERGY Resource Potential and Associated Geologic Hazards AAPG Memoir; Collett, T., Johnson, A., Knapp, C., Boswell, R., Eds.; AAPG: McLean, VA, USA, 2009; Volume 89, pp. 714–722. [Google Scholar]
  105. Lee, J.Y.; Yun, T.S.; Santamarina, J.C.; Ruppel, C. Observations Related to Tetrahydrofuran and Methane Hydrates for Laboratory Studies of Hydrate-Bearing Sediments. Geochem. Geophys. Geosyst. 2007, 8, 1–10. [Google Scholar] [CrossRef]
  106. Jia, J.; Tsuji, T.; Matsuoka, T. Gas Hydrate Saturation and Distribution in the Kumano Forearc Basin of the Nankai Trough. Explor. Geophys. 2017, 48, 137–150. [Google Scholar] [CrossRef]
  107. Konno, Y.; Yoneda, J.; Egawa, K.; Ito, T.; Jin, Y.; Kida, M.; Suzuki, K.; Fujii, T.; Nagao, J. Permeability of Sediment Cores from Methane Hydrate Deposit in the Eastern Nankai Trough. Mar. Pet. Geol. 2015, 66, 487–495. [Google Scholar] [CrossRef]
  108. Guerin, G.; Goldberg, D.; Meltser, A. Characterization of in Situ Elastic Properties of Gas Hydrate-Bearing Sediments on the Blake Ridge. J. Geophys. Res. Solid Earth 1999, 104, 17781–17795. [Google Scholar] [CrossRef]
  109. Nittala, S.; Sain, K.; Nara, D. Seismic Vis-a-Vis Sonic Attenuation in Gas Hydrate Bearing Sediments of Krishna-Godavari Basin, Eastern Margin of India. Geophys. J. Int. 2017, 209, 1195–1203. [Google Scholar] [CrossRef]
  110. Suzuki, H.; Matsushima, J. Quantifying Uncertainties in Attenuation Estimation at Methane-Hydrate-Bearing Zones Using Sonic Waveform Logs. Geophysics 2013, 78, D339–D353. [Google Scholar] [CrossRef]
  111. Bauer, K.; Pratt, R.G.; Haberland, C.; Weber, M. Neural Network Analysis of Crosshole Tomographic Images: The Seismic Signature of Gas Hydrate Bearing Sediments in the Mackenzie Delta (NW Canada). Geophys. Res. Lett. 2008, 35, 1–6. [Google Scholar] [CrossRef]
  112. Bellefleur, G.; Riedel, M.; Brent, T.; Wright, F.; Dallimore, S.R. Implication of Seismic Attenuation for Gas Hydrate Resource Characterization, Mallik, Mackenzie Delta, Canada. J. Geophys. Res. Solid Earth 2007, 112, 1–11. [Google Scholar] [CrossRef]
  113. Dvorkin, J.; Uden, R. Seismic Wave Attenuation in a Methane Hydrate Reservoir. Lead. Edge 2004, 23, 730–732. [Google Scholar] [CrossRef]
  114. Madrussani, G.; Rossi, G.; Camerlenghi, A. Gas Hydrates, Free Gas Distribution and Fault Pattern on the West Svalbard Continental Margin. Geophys. J. Int. 2010, 180, 666–684. [Google Scholar] [CrossRef]
  115. Rossi, G.; Gei, D.; Böhm, G.; Madrussani, G.; Carcione, J. Attenuation Tomography: An Application to Gas-Hydrate and Free Gas Detection. Geophys. Prospect. 2007, 55, 655–669. [Google Scholar] [CrossRef]
  116. Pohl, M.; Prasad, M.; Batzle, M.L. Ultrasonic Attenuation of Pure THF-Hydrate. Geophys. Prospect. 2018, 66, 1349–1357. [Google Scholar] [CrossRef]
  117. Lee, M.W.; Collett, T.S. In-Situ Gas Hydrate Hydrate Saturation Estimated from Various Well Logs at the Mount Elbert Gas Hydrate Stratigraphic Test Well, Alaska North Slope. Mar. Pet. Geol. 2011, 28, 439–449. [Google Scholar] [CrossRef]
  118. Arun, K.P.; Sain, K.; Kumar, J. Application of Constrained AVO Inversion: 2-D Modelling of Gas Hydrates and Free Gas in Mahanadi Basin, India. J. Nat. Gas Sci. Eng. 2020, 78, 103287. [Google Scholar] [CrossRef]
  119. Shankar, U.; Ojha, M.; Ghosh, R. Assessment of Gas Hydrate Reservoir from Inverted Seismic Impedance and Porosity in the Northern Hikurangi Margin, New Zealand. Mar. Pet. Geol. 2021, 123, 104751. [Google Scholar] [CrossRef]
  120. Pandey, L.; Sain, K.; Joshi, A.K. Estimate of Gas Hydrate Saturations in the Krishna-Godavari Basin, Eastern Continental Margin of India, Results of Expedition NGHP-02. Mar. Pet. Geol. 2019, 108, 581–594. [Google Scholar] [CrossRef]
  121. Dugarov, G.A.; Duchkov, A.A.; Duchkov, A.D.; Drobchik, A.N. Laboratory Validation of Effective Acoustic Velocity Models for Samples Bearing Hydrates of Different Type. J. Nat. Gas Sci. Eng. 2019, 63, 38–46. [Google Scholar] [CrossRef]
  122. Lee, M.W. Anisotropic Velocities of Gas Hydrate-Bearing Sediments in Fractured Reservoirs; US Geological Survey: Reston, VA, USA, 2009; Volume 5141. [Google Scholar]
  123. Lee, M. Isotropic, Anisotropic, and Borehole Washout Analyses in Gulf of Mexico Gas Hydrate Joint Industry Project Leg II, Alaminos Canyon Well 21–A. USGS Sci. Investig. Rep. 2012, 23, 5046. [Google Scholar]
  124. Lee, M.W.; Collett, T.S. Characteristics and Interpretation of Fracture-Filled Gas Hydrate—An Example from the Ulleung Basin, East Sea of Korea. Mar. Pet. Geol. 2013, 47, 168–181. [Google Scholar] [CrossRef]
  125. Lee, M.W.; Collett, T.S. Gas Hydrate Saturations Estimated from Fractured Reservoir at Site NGHP-01-10, Krishna-Godavari Basin, India. J. Geophys. Res. Solid Earth 2009, 114, 1–13. [Google Scholar] [CrossRef]
  126. Joshi, A.K.; Sain, K.; Pandey, L. Gas Hydrate Saturation and Reservoir Characterization at Sites NGHP-02-17 and NGHP-02-19, Krishna Godavari Basin, Eastern Margin of India. Mar. Pet. Geol. 2019, 108, 595–608. [Google Scholar] [CrossRef]
  127. Shankar, U.; Pandey, A.K. Estimation of Gas Hydrate Saturation Using Isotropic and Anisotropic Modelling in the Mahanadi Basin. J. Earth Syst. Sci. 2019, 128, 163. [Google Scholar] [CrossRef]
  128. Attias, E.; Amalokwu, K.; Watts, M.; Falcon-Suarez, I.H.; North, L.; Hu, G.W.; Best, A.I.; Weitemeyer, K.; Minshull, T.A. Gas Hydrate Quantification at a Pockmark Offshore Norway from Joint Effective Medium Modelling of Resistivity and Seismic Velocity. Mar. Pet. Geol. 2020, 113, 104151. [Google Scholar] [CrossRef]
  129. Chand, S.; Minshull, T.A.; Gei, D.; Carcione, J.M. Elastic Velocity Models for Gas-Hydrate-Bearing Sediments-a Comparison. Geophys. J. Int. 2004, 159, 573–590. [Google Scholar] [CrossRef]
  130. Ghosh, R.; Ojha, M. Amount of Gas Hydrate Estimated from Rock Physics Analysis Based on Morphology and Intrinsic Anisotropy in Area B, Krishna Godavari Offshore Basin, Expedition NGHP-02. Mar. Pet. Geol. 2021, 124, 104856. [Google Scholar] [CrossRef]
  131. Ghosh, R.; Sain, K.; Ojha, M. Effective Medium Modeling of Gas Hydrate-Filled Fractures Using the Sonic Log in the Krishna-Godavari Basin, Offshore Eastern India. J. Geophys. Res. Solid Earth 2010, 115, 1–15. [Google Scholar] [CrossRef]
  132. Lee, M.W. Biot-Gassmann Theory for Velocities of Gas Hydrate-Bearing Sediments. Geophysics 2002, 67, 1711–1719. [Google Scholar] [CrossRef]
  133. Lee, M.W.; Collett, T.S. Gas Hydrate and Free Gas Saturations Estimated from Velocity Logs on Hydrate Ridge, Offshore Oregon, USA. Proc. Ocean Drill. Progr. Sci. Results 2005, 204, 1–25. [Google Scholar] [CrossRef]
  134. Lee, M.W.; Hutchinson, D.R.; Collett, T.S.; Dillon, W.P. Seismic Velocities for Hydrate-Bearing Sediments Using Weighted Equation. J. Geophys. Res. B Solid Earth 1996, 101, 20347–20358. [Google Scholar] [CrossRef]
  135. Shankar, U.; Riedel, M. Assessment of Gas Hydrate Saturation in Marine Sediments from Resistivity and Compressional-Wave Velocity Log Measurements in the Mahanadi Basin, India. Mar. Pet. Geol. 2014, 58, 265–277. [Google Scholar] [CrossRef]
  136. Arun, K.P.; Sain, K.; Kumar, J. Elastic Parameters from Constrained AVO Inversion: Application to a BSR in the Mahanadi Offshore, India. J. Nat. Gas Sci. Eng. 2018, 50, 90–100. [Google Scholar] [CrossRef]
  137. Chen, J.; Hu, G.; Bu, Q.; Liu, C.; Dong, L.; Wan, Y.; Mao, P.; Guo, Y.; Wang, Z. Elastic Wave Velocities of Hydrate-Bearing Sands Containing Methane Gas Bubbles: Insights from CT-Acoustic Observation and Theoretical Analysis. J. Nat. Gas Sci. Eng. 2021, 88, 103844. [Google Scholar] [CrossRef]
  138. Gei, D.; Carcione, J.M. Acoustic Properties of Sediments Saturated with Gas Hydrate, Free Gas and Water. Geophys. Prospect. 2003, 51, 141–158. [Google Scholar] [CrossRef]
  139. Qian, J.; Wang, X.; Collett, T.S.; Guo, Y.; Kang, D.; Jin, J. Downhole Log Evidence for the Coexistence of Structure II Gas Hydrate and Free Gas below the Bottom Simulating Reflector in the South China Sea. Mar. Pet. Geol. 2018, 98, 662–674. [Google Scholar] [CrossRef]
  140. Shankar, U.; Gupta, D.K.; Bhowmick, D.; Sain, K. Gas Hydrate and Free Gas Saturations Using Rock Physics Modelling at Site NGHP-01-05 and 07 in the Krishna-Godavari Basin, Eastern Indian Margin. J. Pet. Sci. Eng. 2013, 106, 62–70. [Google Scholar] [CrossRef]
  141. Lodolo, E.; Camerlenghi, A.; Madrussani, G.; Tinivella, U.; Rossi, G. Assessment of Gas Hydrate and Free Gas Distribution on the South Shetland Margin (Antarctica) Based on Multichannel Seismic Reflection Data. Geophys. J. Int. 2002, 148, 103–119. [Google Scholar] [CrossRef]
  142. Tinivella, U.; Accaino, F.; Camerlenghi, A. Gas Hydrate and Free Gas Distribution from Inversion of Seismic Data on the South Shetland Margin (Antarctica). Mar. Geophys. Res. 2002, 23, 109–123. [Google Scholar] [CrossRef]
  143. Miyakawa, A.; Saito, S.; Yamada, Y.; Tomaru, H.; Kinoshita, M.; Tsuji, T. Gas Hydrate Saturation at Site C0002, IODP Expeditions 314 and 315, in the Kumano Basin, Nankai Trough. Isl. Arc 2014, 23, 142–156. [Google Scholar] [CrossRef]
  144. Yi, B.Y.; Lee, G.H.; Kang, N.K.; Yoo, D.G.; Lee, J.Y. Deterministic Estimation of Gas-Hydrate Resource Volume in a Small Area of the Ulleung Basin, East Sea (Japan Sea) from Rock Physics Modeling and Pre-Stack Inversion. Mar. Pet. Geol. 2018, 92, 597–608. [Google Scholar] [CrossRef]
  145. Yadav, U.S.; Shukla, K.M.; Ojha, M.; Kumar, P.; Shankar, U. Assessment of Gas Hydrate Accumulations Using Velocities Derived from Vertical Seismic Profiles and Acoustic Log Data in Krishna-Godavari Basin, India. Mar. Pet. Geol. 2019, 108, 551–561. [Google Scholar] [CrossRef]
  146. Dvorkin, J.; Prasad, M.; Sakai, A.; Lavoie, D. Elasticity of Marine Sediments: Rock Physics Modeling. Geophys. Res. Lett. 1999, 26, 1781–1784. [Google Scholar] [CrossRef]
  147. Ecker, C.; Dvorkin, J.; Nur, A. Sediments with Gas Hydrates: Internal Structure from Seismic AVO. Geophysics 1998, 63, 1659. [Google Scholar] [CrossRef]
  148. Terry, D.A.; Knapp, C.C. A Unified Effective Medium Model for Gas Hydrates in Sediments. Geophysics 2018, 83, MR317–MR332. [Google Scholar] [CrossRef]
  149. Dai, J.; Snyder, F.; Gillespie, D.; Koesoemadinata, A.; Dutta, N. Exploration for Gas Hydrates in the Deepwater, Northern Gulf of Mexico: Part I. A Seismic Approach Based on Geologic Model, Inversion, and Rock Physics Principles. Mar. Pet. Geol. 2008, 25, 830–844. [Google Scholar] [CrossRef]
  150. Ghosh, R.; Sain, K.; Ojha, M. Estimating the Amount of Gas-Hydrate Using Effective Medium Theory: A Case Study in the Blake Ridge. Mar. Geophys. Res. 2010, 31, 29–37. [Google Scholar] [CrossRef]
  151. Turco, F.; Azevedo, L.; Grana, D.; Crutchley, G.J.; Gorman, A.R. Characterization of Gas Hydrate Systems on the Hikurangi Margin (New Zealand) through Geostatistical Seismic and Petrophysical Inversion. Geophysics 2021, 86, R825–R838. [Google Scholar] [CrossRef]
  152. Sriram, G.; Dewangan, P.; Ramprasad, T. Modified Effective Medium Model for Gas Hydrate Bearing, Clay-Dominated Sediments in the Krishna-Godavari Basin. Mar. Pet. Geol. 2014, 58, 321–330. [Google Scholar] [CrossRef]
  153. Chhun, C.; Kioka, A.; Jia, J.; Tsuji, T. Characterization of Hydrate and Gas Reservoirs in Plate Convergent Margin by Applying Rock Physics to High-Resolution Seismic Velocity Model. Mar. Pet. Geol. 2018, 92, 719–732. [Google Scholar] [CrossRef]
  154. Berryman, J.G. Mixture Theory for Rock Properties; American Geophysical Union: Washington, DC, USA, 1995; ISBN 0-87590-853-5. [Google Scholar]
  155. Leurer, K.C. Attenuation in Fine-Grained Marine Sediments; Extension of the Biot-Stoll Model by the “Effective Grain Model” (EGM). Geophysics 1997, 62, 1465–1479. [Google Scholar] [CrossRef]
  156. Stoll, R.D.; Bryan, G.M. Wave Attenuation in Saturated Sediments. J. Acoust. Soc. Am. 1970, 47, 1440–1447. [Google Scholar] [CrossRef]
  157. Thomsen, L. Weak Elastic Anisotropy. Geophysics 1986, 51, 1954–1966. [Google Scholar] [CrossRef]
  158. Qian, J.; Wang, X.; Collett, T.S.; Dong, D.; Guo, Y.; Su, P.; Liang, J. Gas Hydrate Accumulation and Saturations Estimated from Effective Medium Theory in the Eastern Pearl River Mouth Basin, South China Sea. Interpretation 2017, 5, SM33–SM48. [Google Scholar] [CrossRef]
  159. Sheng, P. Effective-Medium Theory of Sedimentary Rocks. Phys. Rev. B 1990, 41, 4507–4512. [Google Scholar] [CrossRef] [PubMed]
  160. Sheng, P. Consistent Modeling of the Electrical and Elastic Properties of Sedimentary Rocks. Geophysics 1991, 56, 1236–1243. [Google Scholar] [CrossRef]
  161. Hornby, B.E.; Schwartz, L.M.; Hudson, J.A. Anisotropic Effective-Medium Modeling of the Elastic Properties of Shales. Geophysics 1994, 59, 1570–1583. [Google Scholar] [CrossRef]
  162. Hu, G.W.; Ye, Y.G.; Zhang, J.; Liu, C.L.; Diao, S.B.; Wang, J.S. Acoustic Properties of Gas Hydrate–Bearing Consolidated Sediments and Experimental Testing of Elastic Velocity Models. J. Geophys. Res. 2010, 115, 1–11. [Google Scholar] [CrossRef]
  163. Zhang, Q.; Yang, Z.; He, T.; Lu, H.; Zhang, Y. Growth Pattern of Dispersed Methane Hydrates in Brine-Saturated Unconsolidated Sediments via Joint Velocity and Resistivity Analysis. J. Nat. Gas Sci. Eng. 2021, 96, 104279. [Google Scholar] [CrossRef]
  164. Pan, H.; Li, H.; Chen, J.; Zhang, Y.; Cai, S.; Huang, Y.; Zheng, Y.; Zhao, Y.; Deng, J. A Unified Contactcementation Theory for Gas Hydrate Morphology Detection and Saturation Estimation from Elastic-Wave Velocities. Mar. Pet. Geol. 2020, 113, 104146. [Google Scholar] [CrossRef]
  165. Pan, H.; Li, H.; Chen, J.; Riedel, M.; Holland, M.; Zhang, Y.; Cai, S. Quantification of Gas Hydrate Saturation and Morphology Based on a Generalized Effective Medium Model. Mar. Pet. Geol. 2020, 113, 104166. [Google Scholar] [CrossRef]
  166. Liu, T.; Liu, X.; Zhu, T. Joint Analysis of P-Wave Velocity and Resistivity for Morphology Identification and Quantification of Gas Hydrate. Mar. Pet. Geol. 2020, 112, 104036. [Google Scholar] [CrossRef]
  167. Singhroha, S.; Chand, S.; Bünz, S. Constraints on Gas Hydrate Distribution and Morphology in Vestnesa Ridge, Western Svalbard Margin, Using Multicomponent Ocean-Bottom Seismic Data. J. Geophys. Res. Solid Earth 2019, 124, 4343–4364. [Google Scholar] [CrossRef]
  168. Lee, M.W.; Waite, W.F. Amplitude Loss of Sonic Waveform Due to Source Coupling to the Medium. Geophys. Res. Lett. 2007, 34, 1–4. [Google Scholar] [CrossRef]
Figure 1. Hydrate morphologies in coarse-grained sediment: (a) pore-filling morphology, (b) contact cementing morphology, (c) load-bearing morphology, (d) envelope cementing morphology, and (e) patchy morphology, and fine-grained sediments: (f) fracture-filling morphology. (gl) show the field hydrate morphologies in the coarse-grained and fine-grained sediments in the Mallik, Nankai Trough, the South China Sea, Gulf of Mexico, and Mt. Elbert [43]. The blue indicates water, grey indicates sand or clay grains, and light blue indicates hydrate.
Jmse 10 01076 g001
Figure 2. Proposed hydrate morphologies and attenuation mechanisms associated with GHBS: (a) pore-filling hydrate morphology, (b) contact cementing hydrate morphology, (c) load-bearing hydrate morphology, (d) envelope cementing hydrate morphology, (e) patchy hydrate morphology, (f) uniformly distributed gas bubble, (g) patchy gas bubble, (h) global Biot flow, (i) squirt flow in the porous hydrate, (j) cementation between hydrate and sand grains, (k) water film between hydrate and sand grains, and (l) hydrate film enveloping gas bubble. The grey color indicates sand, the blue color indicates water, the bright blue indicates hydrate, and the white color indicates gas bubble.
Jmse 10 01076 g002
Figure 3. The frequency-dependent velocity and attenuation from field measurements and rock physics modeling.
Jmse 10 01076 g003
Figure 4. Workflow of the application of the three-phase weighted model.
Jmse 10 01076 g004
Figure 5. Workflow of the three-phase Biot-extension model.
Jmse 10 01076 g005
Figure 6. Workflow of the implication of the effective medium model.
Jmse 10 01076 g006
Figure 7. Workflow of the implication of the layered anisotropic model.
Jmse 10 01076 g007
Figure 8. Workflow of the effective medium anisotropic model.
Jmse 10 01076 g008
Figure 9. Workflow of rock physics modeling for acoustic properties of GHBS.
Jmse 10 01076 g009
Figure 10. Workflow of hydrate saturation prediction from P- and S-wave velocities based on rock physics models.
Jmse 10 01076 g010
Table 1. Feasibility and limitation of the various rock physics models.
ModelFeasibilityLimitation
IsotropicEffective medium modelVarious hydrate morphologies.Unreasonably higher S-wave velocity at high porosities.
Three-phase Biot extension modelFlexible application in high-porosity marine sediment.Load-bearing morphology.
Setting the consolidation factor
Three-phase weighted modelFlexible application to the sediment with any porosity.Pore-filling hydrate morphology.
Setting the weighting factor.
AnisotropicLayered anisotropic modelTransversely isotropic feature.
Dip angle of fracture.
Laminated layer is unusual in field investigations.
Effective medium anisotropic modelGrain displacement morphology.
Microstructure of biconnected solid and fluid phases.
Weaker bonding and greater compliance at the edges of different particle alignments.
Effective pressure is not considered.
Publisher’s Note: MDPI stays neutral with regard to jurisdictional claims in published maps and institutional affiliations.

