Article

Irish Wave Data—Rogues, Analysis and Continuity

1
Met Éireann, D09 Y921 Dublin, Ireland
2
Marine Institute, H91 FW18 Galway, Ireland
*
Author to whom correspondence should be addressed.
J. Mar. Sci. Eng. 2022, 10(8), 1073; https://doi.org/10.3390/jmse10081073
Submission received: 13 June 2022 / Revised: 29 July 2022 / Accepted: 3 August 2022 / Published: 5 August 2022
(This article belongs to the Special Issue Extreme Coastal and Ocean Waves)

Abstract

:
The Marine Institute of Ireland operates a network of weather buoys around Ireland. A wave of 32.3 m height (crest–trough) was recorded by one of these buoys, the M6 buoy, off the coast of Ireland in October 2020. In this paper, the technological evolution of this network is explored, with a particular emphasis on this extremely high wave. Raw data and bulk parameters collected during the event are presented, and the wider met-ocean context is outlined. In addition, wave data across the buoy deployment period from dual wave sensors installed on the buoy are analysed. Differences in calculation methods are discussed, rogue incidence rates are calculated, and the sensors are found to be generally in good agreement for key sea state parameters. Considerations specific to this network of buoys are described, including recent advances in technology that may affect continuity of historic records. Wave data from the buoys are found to be robust; the importance of keeping technological changes in mind and using the full raw dataset for analysis purposes are highlighted.

1. Introduction

Rogue waves are those which are exceptionally high compared to the surrounding sea state—their causes and frequency of occurrence are still not fully understood, and are the subject of ongoing scientific investigation [1]. Rogue waves can pose a hazard for seagoing and coastal activities—for example, a rogue wave has been proposed as a possible cause for the 2015 sinking of the SS El Faro [2]. Monitoring of these events is more important than ever, due to uncertainties surrounding how anthropogenic climate change may affect the prevalence of extreme and rogue waves [3].
The most common definition of a rogue wave is one whose height is more than double the significant wave height ( H s —the average height of the highest third of waves). However, there are several alternative definitions in use depending on the context. For example, ref. [4] and others consider the ratio of crest height ( η ) to significant wave height, with waves for which η / H s > 1.25 being considered rogue waves. Rogue waves can occur in any sea state from ripples to storms, although it is the extreme events which cause the most interest and potential hazard to ocean users. For many years, tales of huge freak waves were known only as stories from fishermen and other seagoers, but in recent years the wider deployment of in situ observational equipment has led to the measurement of several of these extreme waves. The Draupner wave (25.6 m crest–trough) was the first confirmation of the existence of such rogue waves, and other events have followed such as the Andrea and Killard waves (22.9 m and 26.1 m crest–trough, respectively) which dispel any doubt [5,6]. More recently with the availability of large temporal and spatial datasets there have been large analyses of data covering millions of waves, showing that rogue waves are perhaps much more common in the oceans than we may have suspected [7,8,9]. Waves far exceeding the rogue threshold in less intense sea states [4] have shown that the limits of extreme waves may still be far beyond those observed to date.
Several explanations for the cause of rogue waves have been proposed, including directionality of the wave spectrum [10], second-order non-linearities [1] and modulational instability [11], although the exact mechanism of formation is still under debate and may reasonably be assumed to be some combination of these various factors. Several wave parameters or spectral statistics have been considered as possible indicators of the likelihood of rogue wave occurrence—these include kurtosis, Benjamin-Feir Index B F I and peak-trough correlation [9]. Many of these parameters are interrelated and pinning down exact relationships can be a difficult task. In summary, understanding rogue wave occurrence is an open question—potential rogue occurrences are presented here, but the exact causes are beyond the scope of this paper.
This paper describes an exceptionally high, potentially rogue wave which was measured by the M6 weather buoy off the coast of Ireland in the early hours of 28 October 2020. The wave had a crest–trough height of 32.3 m, representing one of the highest individual waves ever recorded. This wave is considered in the broader context of the wave climate off the West coast of Ireland and the evolving technologies used to measure waves at M6 during its 16 years in operation. In Section 2, the evolution of the Irish Marine Data Buoy Observation Network, of which M6 is a component, is discussed. The ERA5 dataset is also introduced; this is used to illustrate the met-ocean context leading up to the rogue wave. In Section 3, raw and summary wave statistics pertaining to the rogue wave itself are presented. Results are discussed in Section 4, with analysis of the rogue wave incidence at M6, the met-ocean context of this particular wave, comparison to previous notable rogue waves and how data from this buoy network should be interpreted as technologies evolve. Conclusions are presented in Section 5.

2. Data

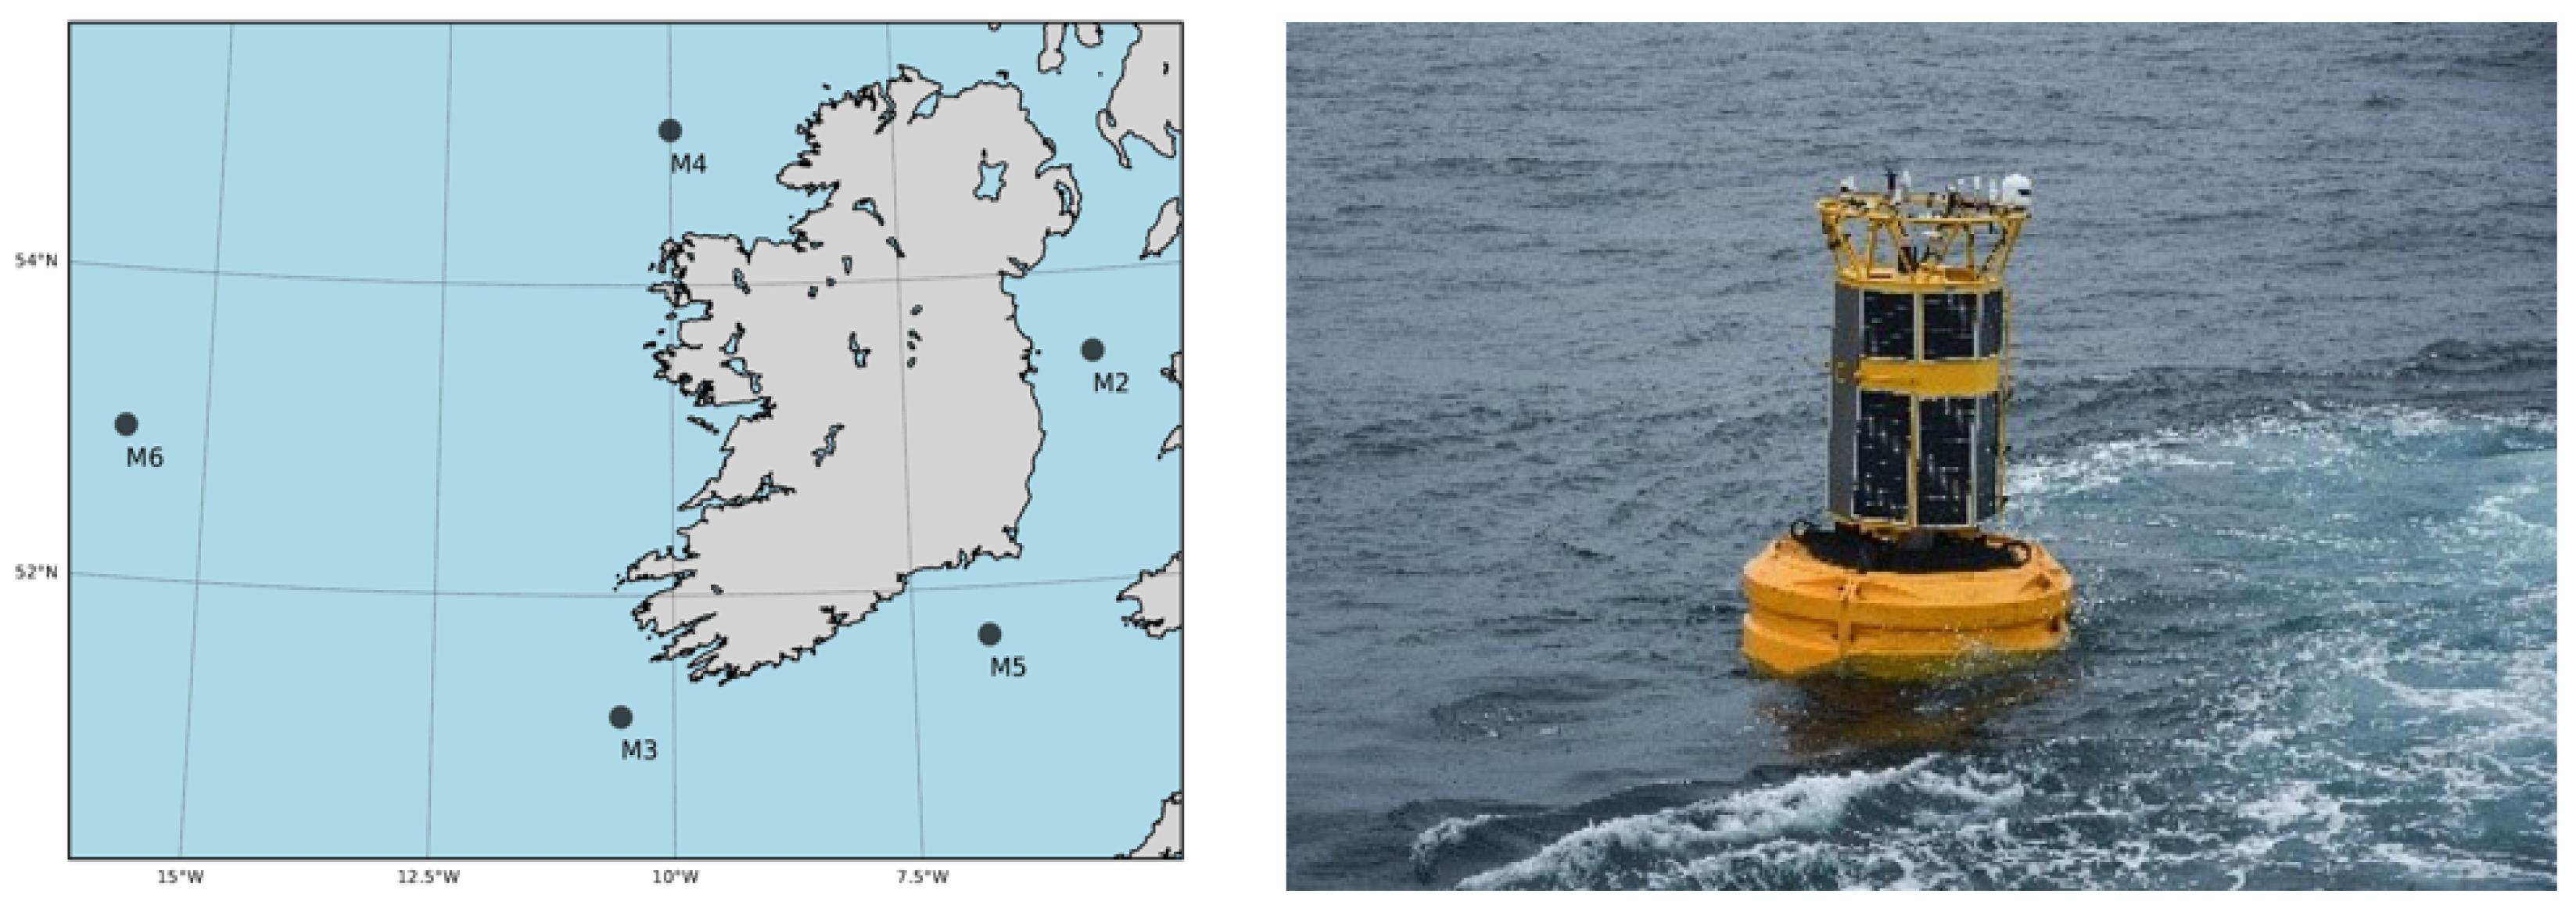
2.1. Irish Marine Data Buoy Observation Network

The Irish Marine Data Buoy Observation Network, IMDBON hereafter, consists of five offshore marine buoys around Ireland, with the current buoy locations indicated in Figure 1. The M6 buoy is located far offshore, moored in deep water, approximately 3000 m, over the Rockall Trough. All buoys measure basic meteorological and oceanographic parameters at the surface. In addition, the M6 location has a string of instruments deployed adjacent to the mooring, from 1000 m depth to the seabed. The network is managed by the Marine Institute in collaboration with Met Éireann and is funded by the Department of Agriculture, Food and the Marine.
The 1st generation of IMDBON buoys was deployed from 2001 in collaboration with the UK Met Office, using ODAS (Oceanographic Data Acquisition System) buoys. These large, robust buoys incorporated dual-sensors for most parameters. However, although the on-board heave sensor (Datawell MK1) was reliable, it did not measure the full wave spectrum (non-directional parameters only). Furthermore, due to the method of communications, real-time information on maximum wave height ( H m a x ) was not available and thus it was not possible to observe rogue waves in near real-time.
The roll-out of the 2nd generation of IMDBON buoys began in 2009. This generation used Fugro Oceanor buoys equipped with Wavesense wave sensors. These sensors measured the full wave spectrum and calculated and transmitted a wider range of wave parameters in near real-time, including H m a x . Buoys were equipped with two independent, identical systems, each measuring the full suite of weather and wave data. This provides a source of validation and an illustration of the variability between different measurement systems. However, these 2nd generation buoys were much smaller and lay low in the water compared to the 1st generation. This resulted in algae contamination of solar panels causing power outages, particularly during winter, and more frequent mechanical failure due to the energetic wave climate and ship strikes. Due to its location, the M6 buoy is extremely valuable for weather forecasting, and also very challenging to visit for maintenance. Due to the issues outlined above, the decision was taken to retain the more robust ODAS buoy at M6 rather than adopting the 2nd generation system.
In 2016, building on the wealth of experience gained through the years, the Marine Institute supported by P&O Maritime Services, commenced research into new data buoy designs and technologies. Ongoing support from the Department of Agriculture, Food and the Marine, together with a research infrastructure grant from Science Foundation Ireland, enabled the development of the 3rd generation. The physical buoy platform is the JFC Marine SG-3000 data buoy. Like the 1st generation buoys, these are large with extensive solar panel area, making the buoy robust to the harsh maritime climate and enabling year-round operation without power issues. In tandem with this, a new sensor payload has been developed in house by the Marine Institute and P&O Maritime Services. As with the 2nd generation, the payload contains two independent systems, each with a full suite of WMO specification weather and oceanographic sensors, along with associated DAS (Data Acquisition System), power and communication devices. However, unlike the 2nd generation, the sensors used by each system are not always identical—this allowed the Marine Institute to gradually implement and test changes without interfering with operational data streams, whilst still retaining in situ validation capability. These new generation systems represent the state of the art in terms of what was available globally at the time of design and construction. Operational roll-out began in 2019, commencing with the M6 buoy. The M6 buoy is moored by a three tonne sinker and ground chain. The majority of the chain is composed of dynex (net neutral buoyancy) to minimise the effect of the mooring on the wave riding characteristics of the buoy. This maximises freedom of motion as far as possible; however, during periods of high seas the buoy can become constrained at the outer edge of its ~8 km surface watch circle by tension in the mooring.
The 3rd generation wave sensor setup on IMDBON buoys consists currently of a Datawell Wave unit MK3 and a Fugro Wavesense 3. The Datawell unit operates continuously, with raw heave data stored at 1.28 Hz; data are analysed spectrally and by time-series every half hour. All data are stored locally and a subset of data are transmitted to shore hourly. Transmissions include the most recent parameters for most variables, but for H m a x the transmission includes the largest value of the hour. The Fugro Wavesense records samples for approx. 17 min at the beginning of each hour (1024 samples at 1 Hz), and analysed parameters (time-series and spectral) are reported by the buoy at the next hourly transmission. Time-series analysis characterises each wave in the sample period in terms of height, period, and steepness—statistics such as significant wave height, significant period and zero-crossing period ( H s , T s & T z ) are then calculated for transmission. Spectral analysis involves the sample data being converted to a frequency spectrum by FFT (Fast Fourier Transform)—moments of the spectrum are calculated and used to derive parameters such as significant wave height, peak period, and mean direction ( H m 0 , T p & M d i r ). Both of these analyses are repeated using post-processed raw data in the Wave Data Analysis section below, in addition to the calculation of longer-term statistics on rogue wave incidence rates and the effects of using up- or down-crossing definitions of waves.

2.2. ERA5 Reanalysis

The ERA5 reanalysis dataset is used to examine the met-ocean context of the rogue wave observation. This product is based on ECMWF’s Integrated Forecast System (IFS) Cycle 41r2 and the Wave Assimilation Model (WAM) [12]. It provides a complete reanalysis at hourly intervals from 1979 to the present, with horizontal resolution of 40 km for the ocean component. Here, we consider ERA5 winds and waves; note that H m a x from ERA is an estimated individual maximum wave height, approximated from the non-normality of the probability density function of the sea surface.
ERA5 winds speeds estimates have shown accuracy on a par with current ECMWF forecasts, [13]. Studies evaluating ERA5 wave parameters found that although ERA5 wave representation is better than that in ERA-Interim, there is positive bias overall and some suggestion that ERA5 may perform worse during extreme weather events. For example, ref. [14] found that ERA5 underestimated maximum and significant wave heights to a greater degree during a Tropical Storm.

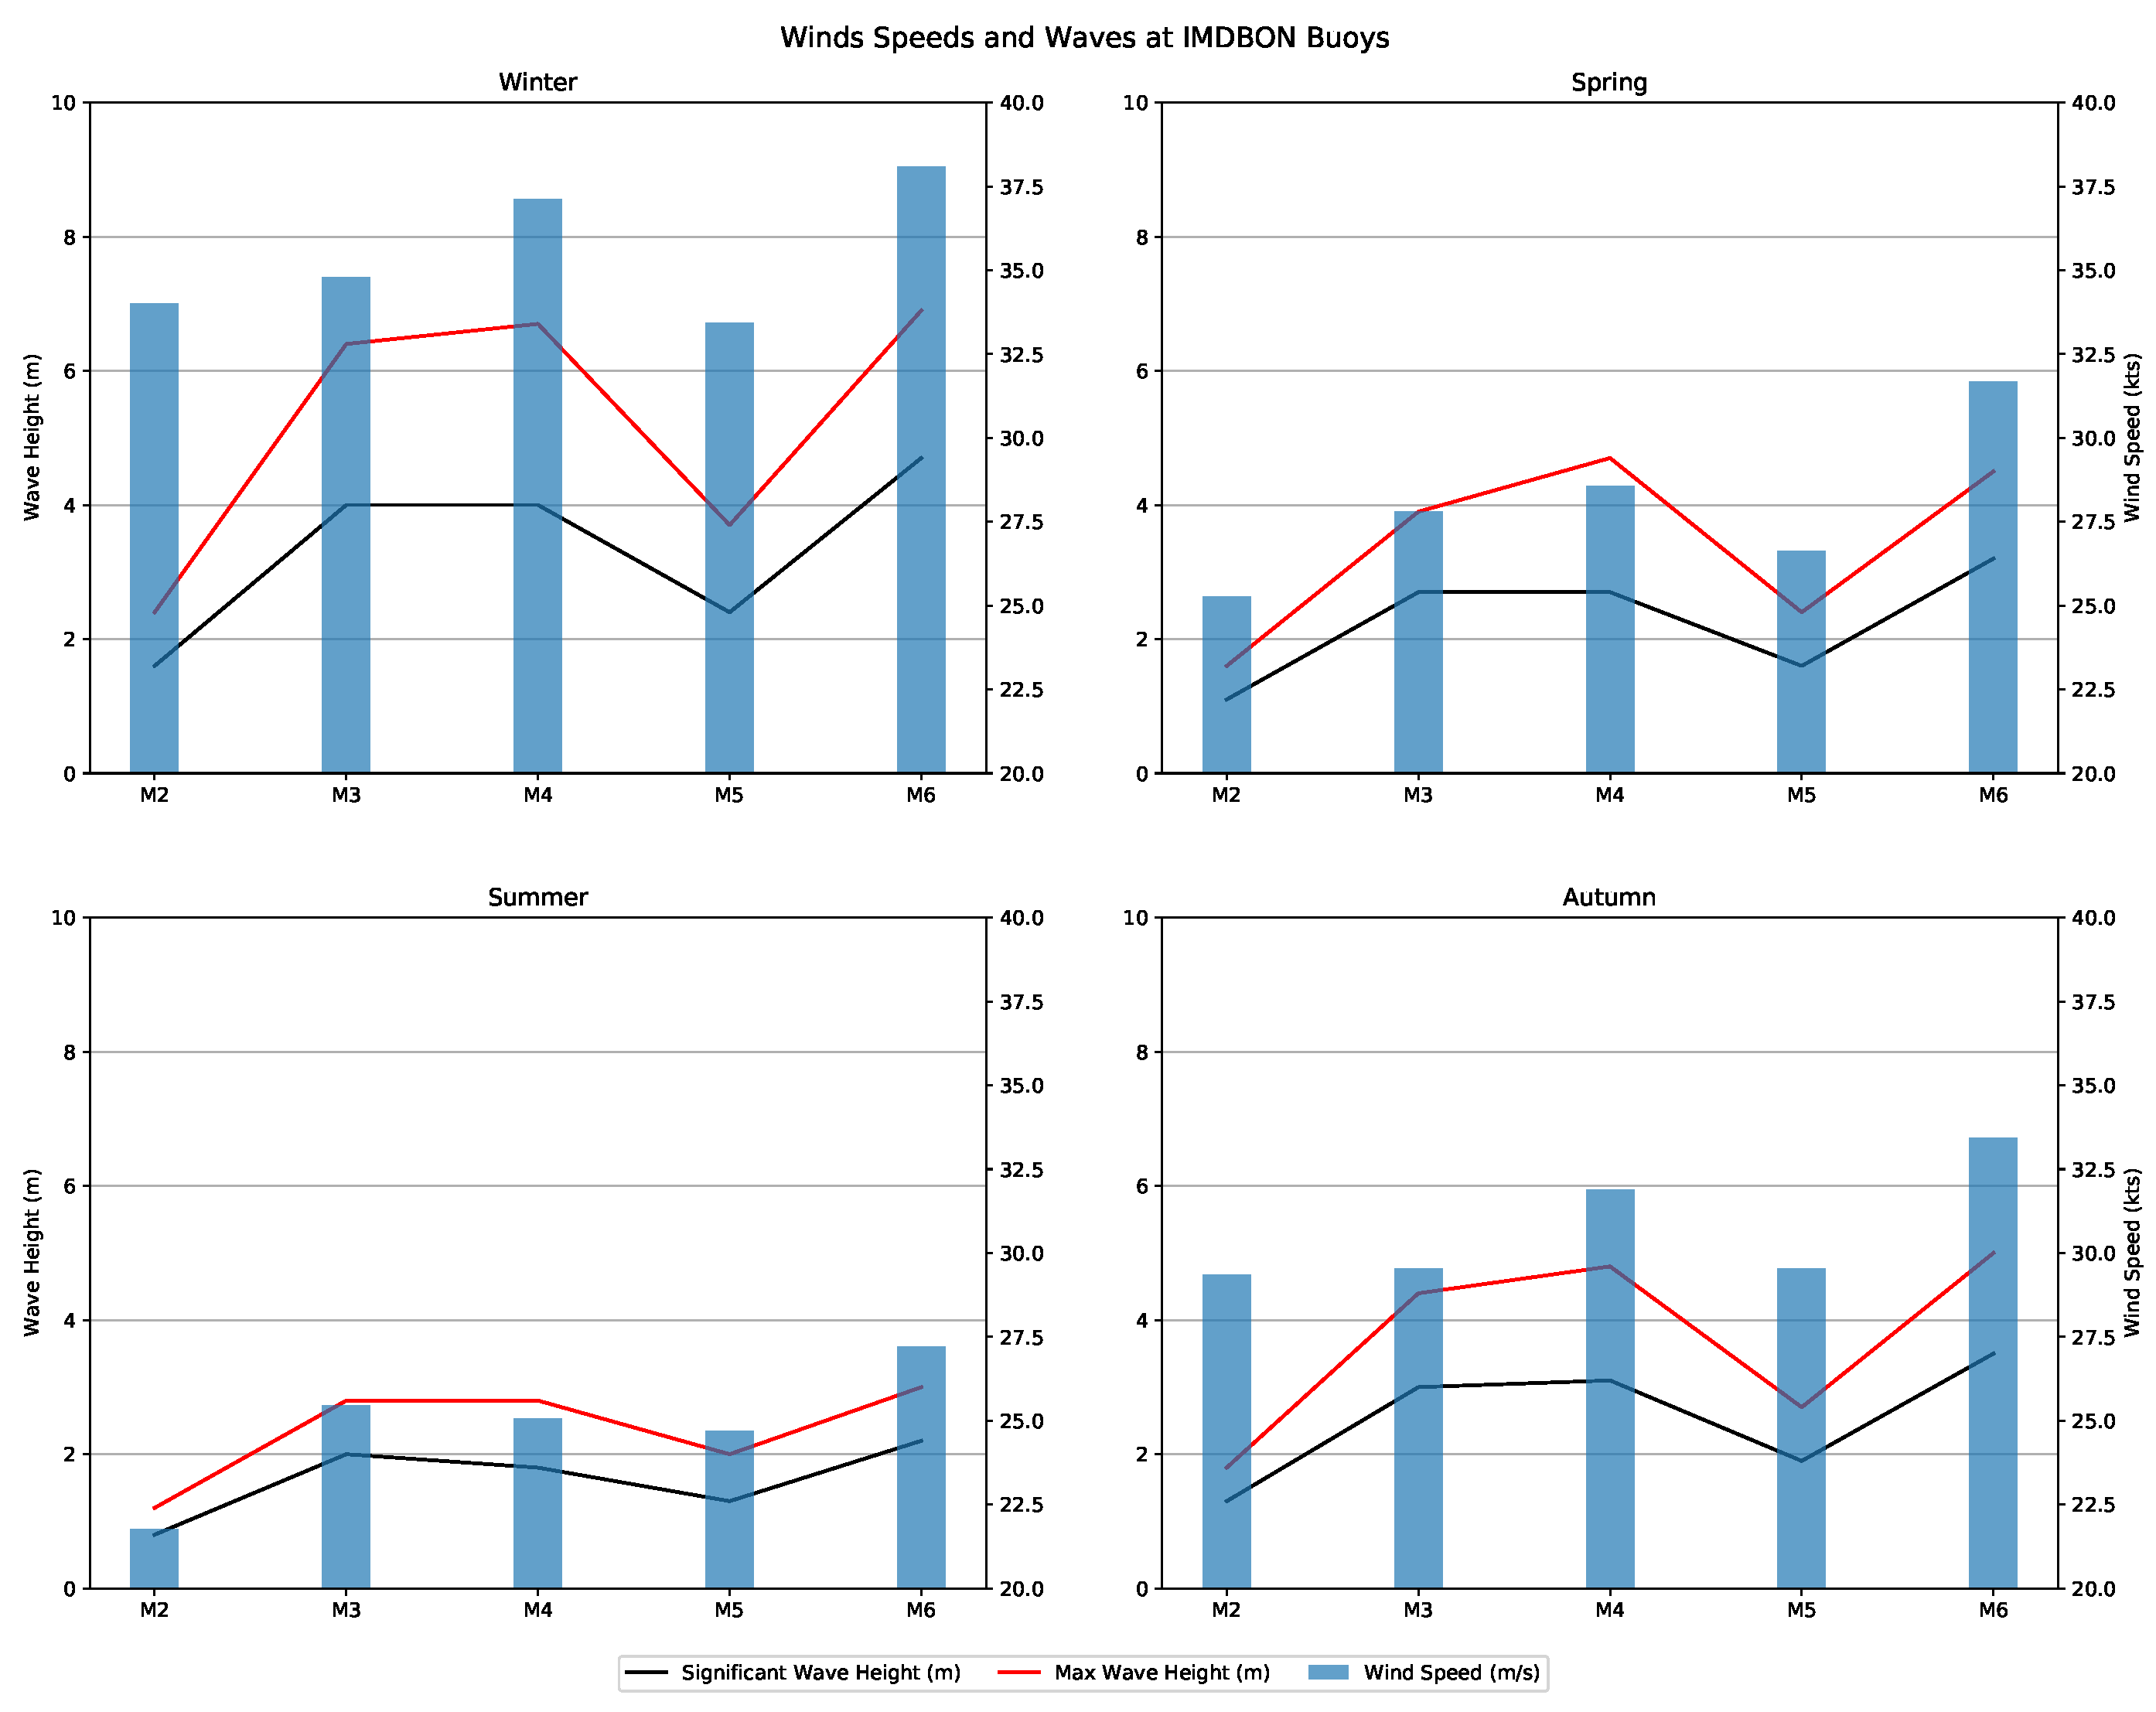
2.3. Local Wave Climate

Ireland sits amidst the highly energetic wave climate of the Northeast Atlantic. Understanding the nature and origin of waves is important to maritime safety, coastal communities and the emerging wave energy sector. Significant wave height [15,16], extreme wave heights [17], wave periods and directions [15,18] all show correlations with the NAO Index, a North Atlantic Teleconnection which plays a major role in directing storms across the Atlantic. Much of the wind and swell waves encountered by the IMDBON network are formed as these Atlantic storms propagate across the Atlantic.
A catalogue of Irish extreme wave events, including rogue waves and other extreme waves is provided in [6]. They note that although rogue waves are relatively common, the majority of high waves are not rogue waves. This is in line with expectations, given that the majority of extreme wave events in Ireland are associated with storms. Ireland’s location on the Eastern edge of the Atlantic facilitates fully developed seas forming as storms develop and propagate eastwards over the Atlantic. The duration and intensity of these systems increase the probability of extreme wave heights. The previous IMDBON wave height record ( H m a x ) was a 23.4 m wave measured by M4 during a storm in January 2014, ref. [19] during a period of intense storm activity. The Atlantic influence is evident at most IMDBON buoys—all but M2 predominantly experience Northwesterly to Southwesterly winds off the Atlantic. These winds generate waves; as shown in Figure 2 the more exposed Atlantic buoys M3, M4 and M6 off the west coast experience stronger winds and more developed seas.

3. Wave Data Analysis

In this section, wave data from M6 are presented and examined to validate the rogue wave observation. In the following discussion, H s refers to significant wave height as measured by time-series analysis, while H m 0 refers to significant wave height determined by spectral analysis. All sea state parameters are given as calculated over the respective instrument’s sample period (30 min for Datawell, 17 min for Fugro). Note that the rogue wave was reported at the time of occurrence as a H m a x of 29.88 m due to limits (binary scaling) set in the buoy transmission format at the time. The true height of the wave was verified upon recovery of the buoy and analysis of the raw data, and transmission limits have since been updated to allow for wave heights of up to 40 m.

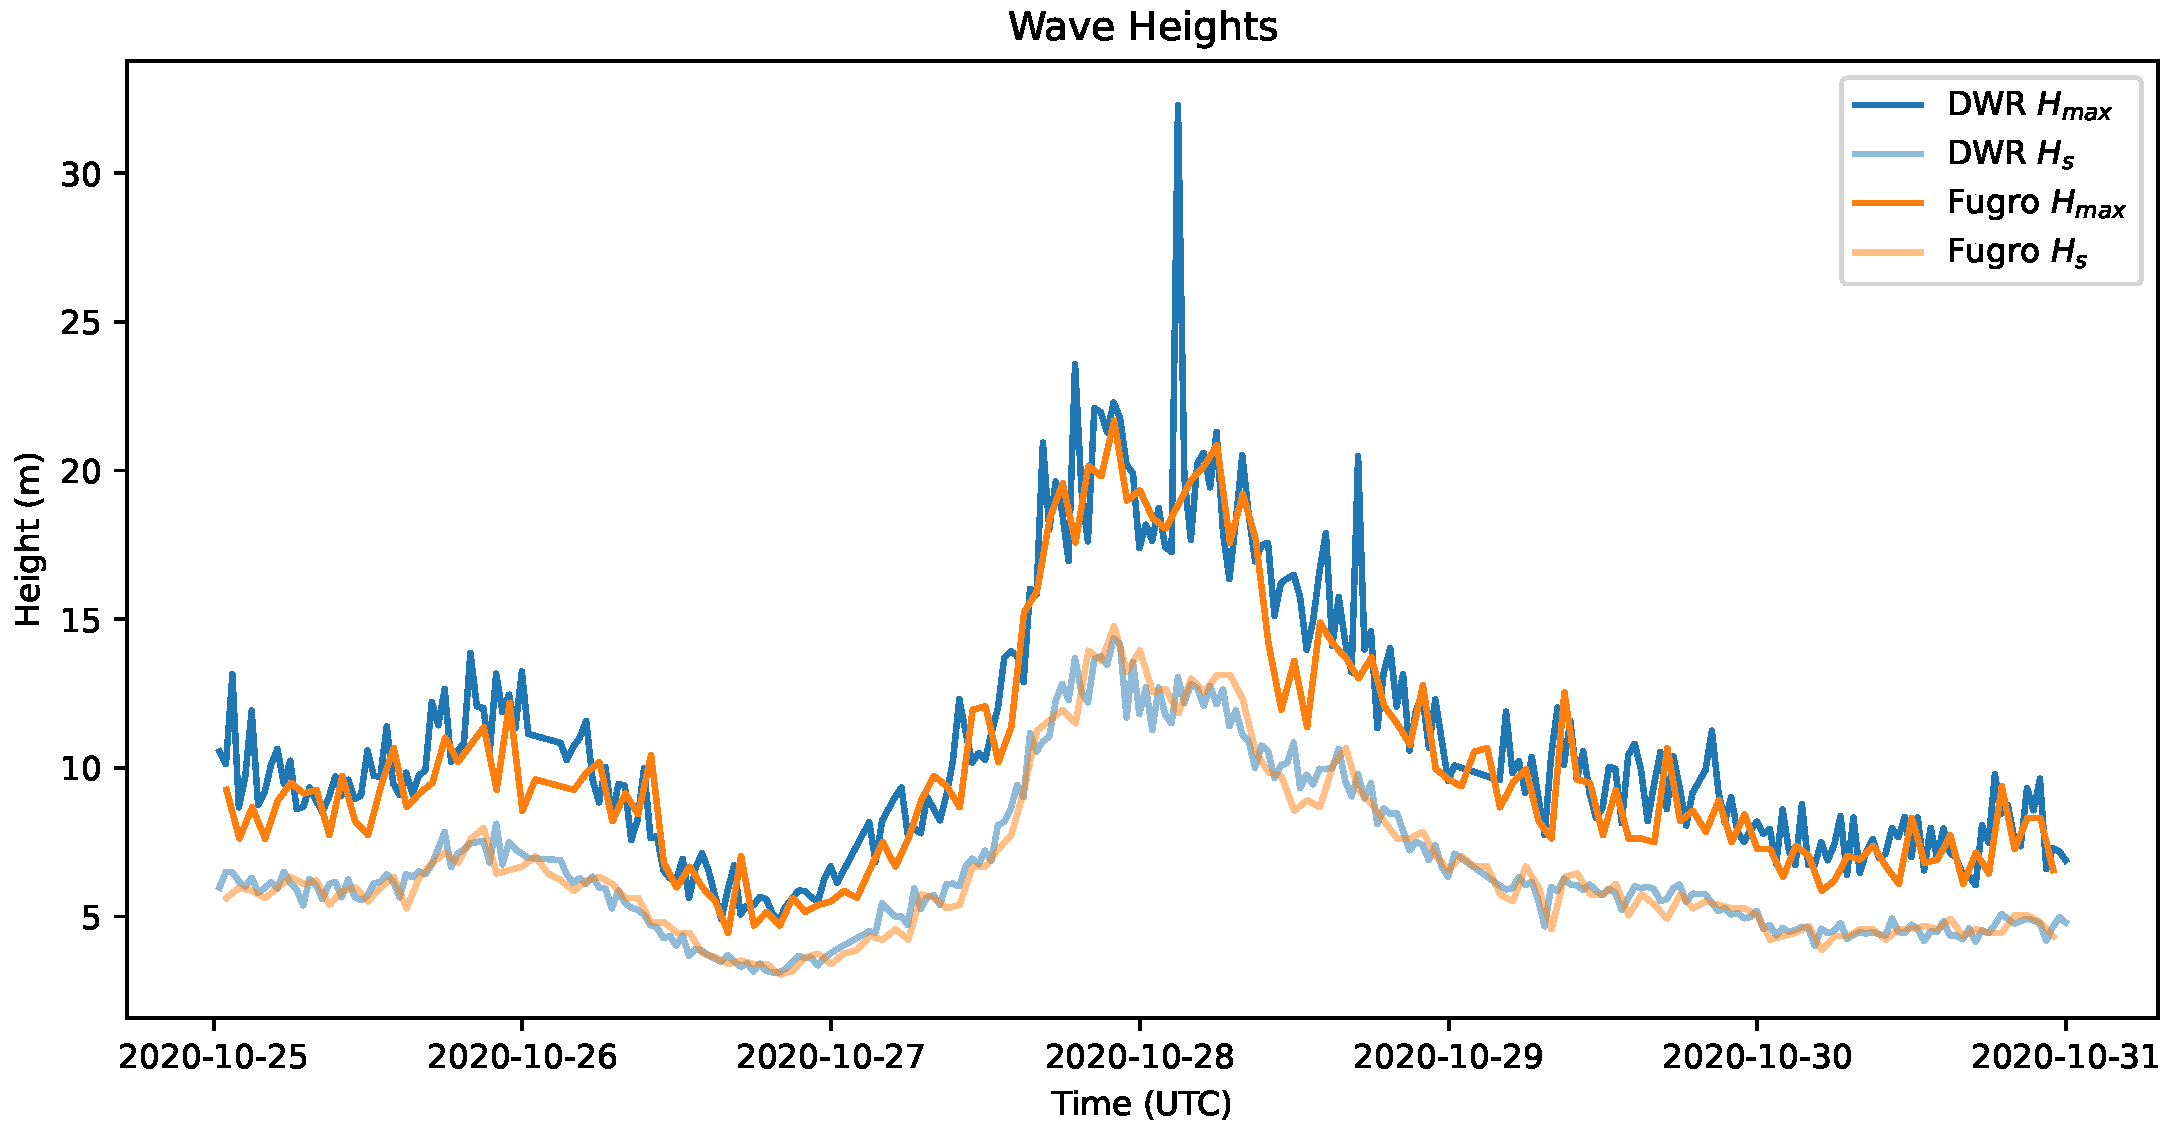
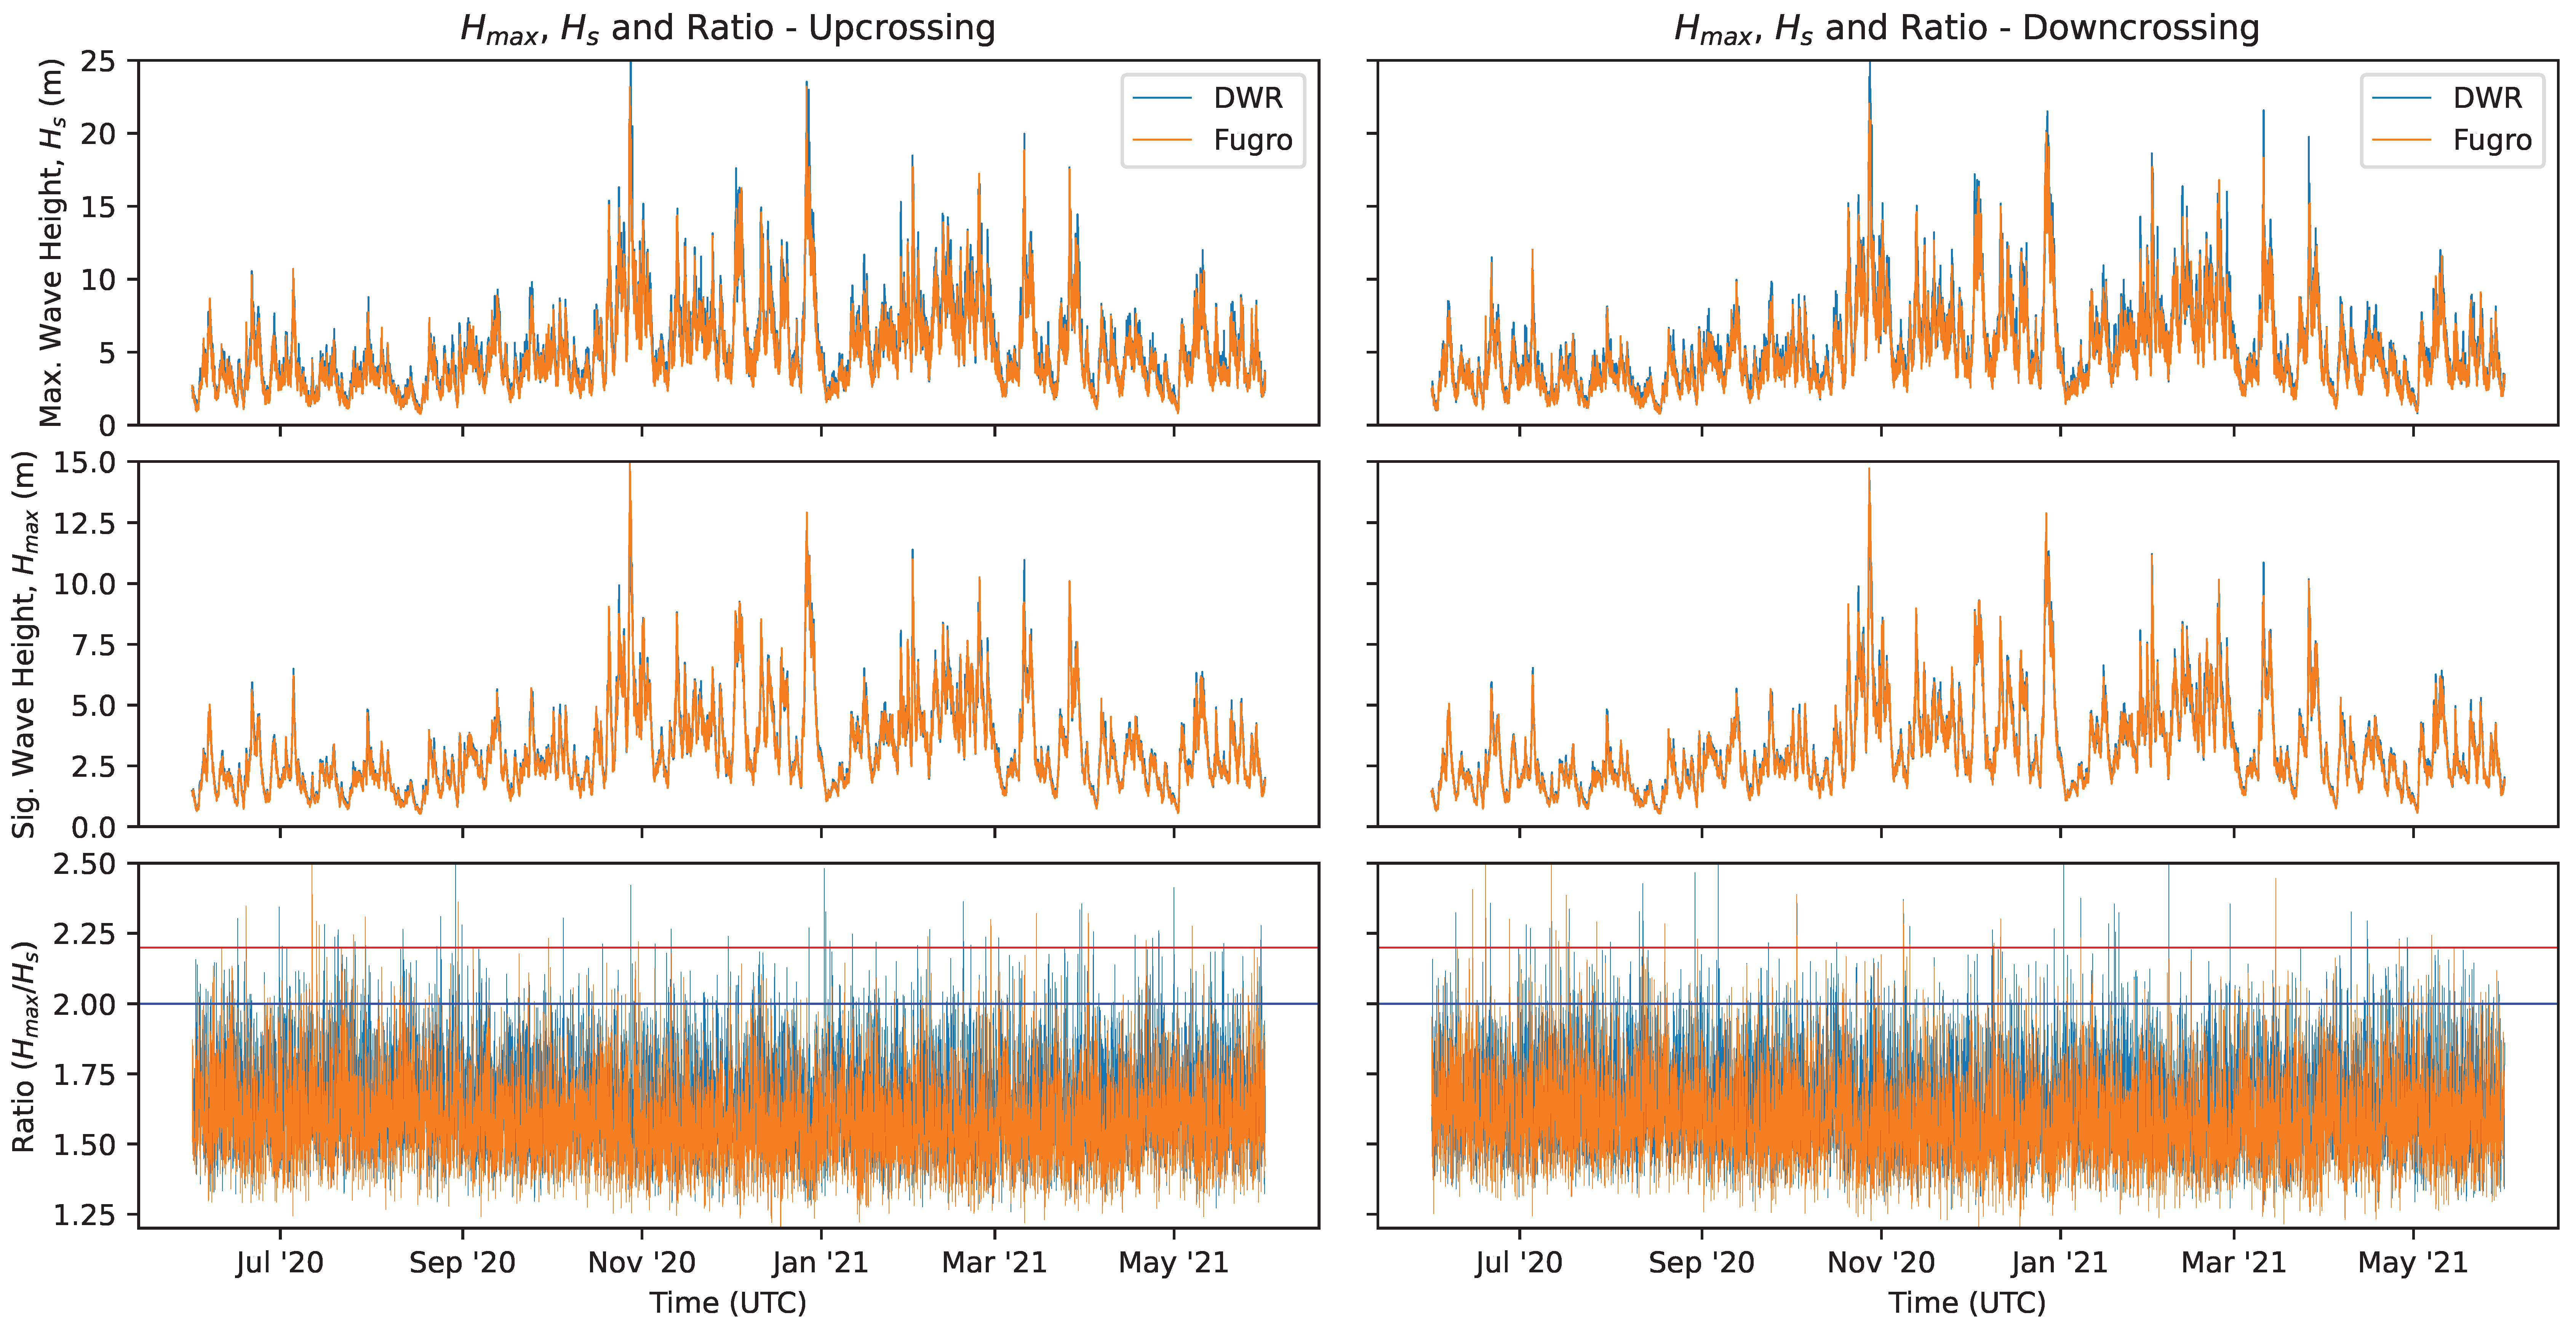
3.1. Comparison of M6 Wave Sensors: Bulk Parameters

Figure 3 shows H s and H m a x as measured by each system (Datawell & Fugro) in the days before and after the hypothesised rogue wave. Correlation coefficients and RMS error between hourly wave parameters from both systems over the course of the buoy deployment (June 2020 to June 2021) are shown in Table 1. Although there is close correlation between the two systems, the Datawell H m a x tends to be slightly higher. On 17 occasions over the deployment, the difference between Datawell and Fugro Wavesense H m a x exceeded 5 m, all of these occasions occurred from late October and early January during periods of above average sea state. This difference may be due to the differences in sampling and reporting of H m a x : Datawell samples for 2 periods of 30 min in each hour and reports the largest of these values whilst Fugro Wavesense samples for 17 min only. Note that the rogue wave in question occurred outside the sampling period of the Fugro Wavesense, explaining the lack of a matching H m a x peak in Figure 3. Note also in Table 1 the significant error in wave direction measurements, which was caused by magnetic interference. This error has since been resolved by repositioning of the instrument within the buoy.

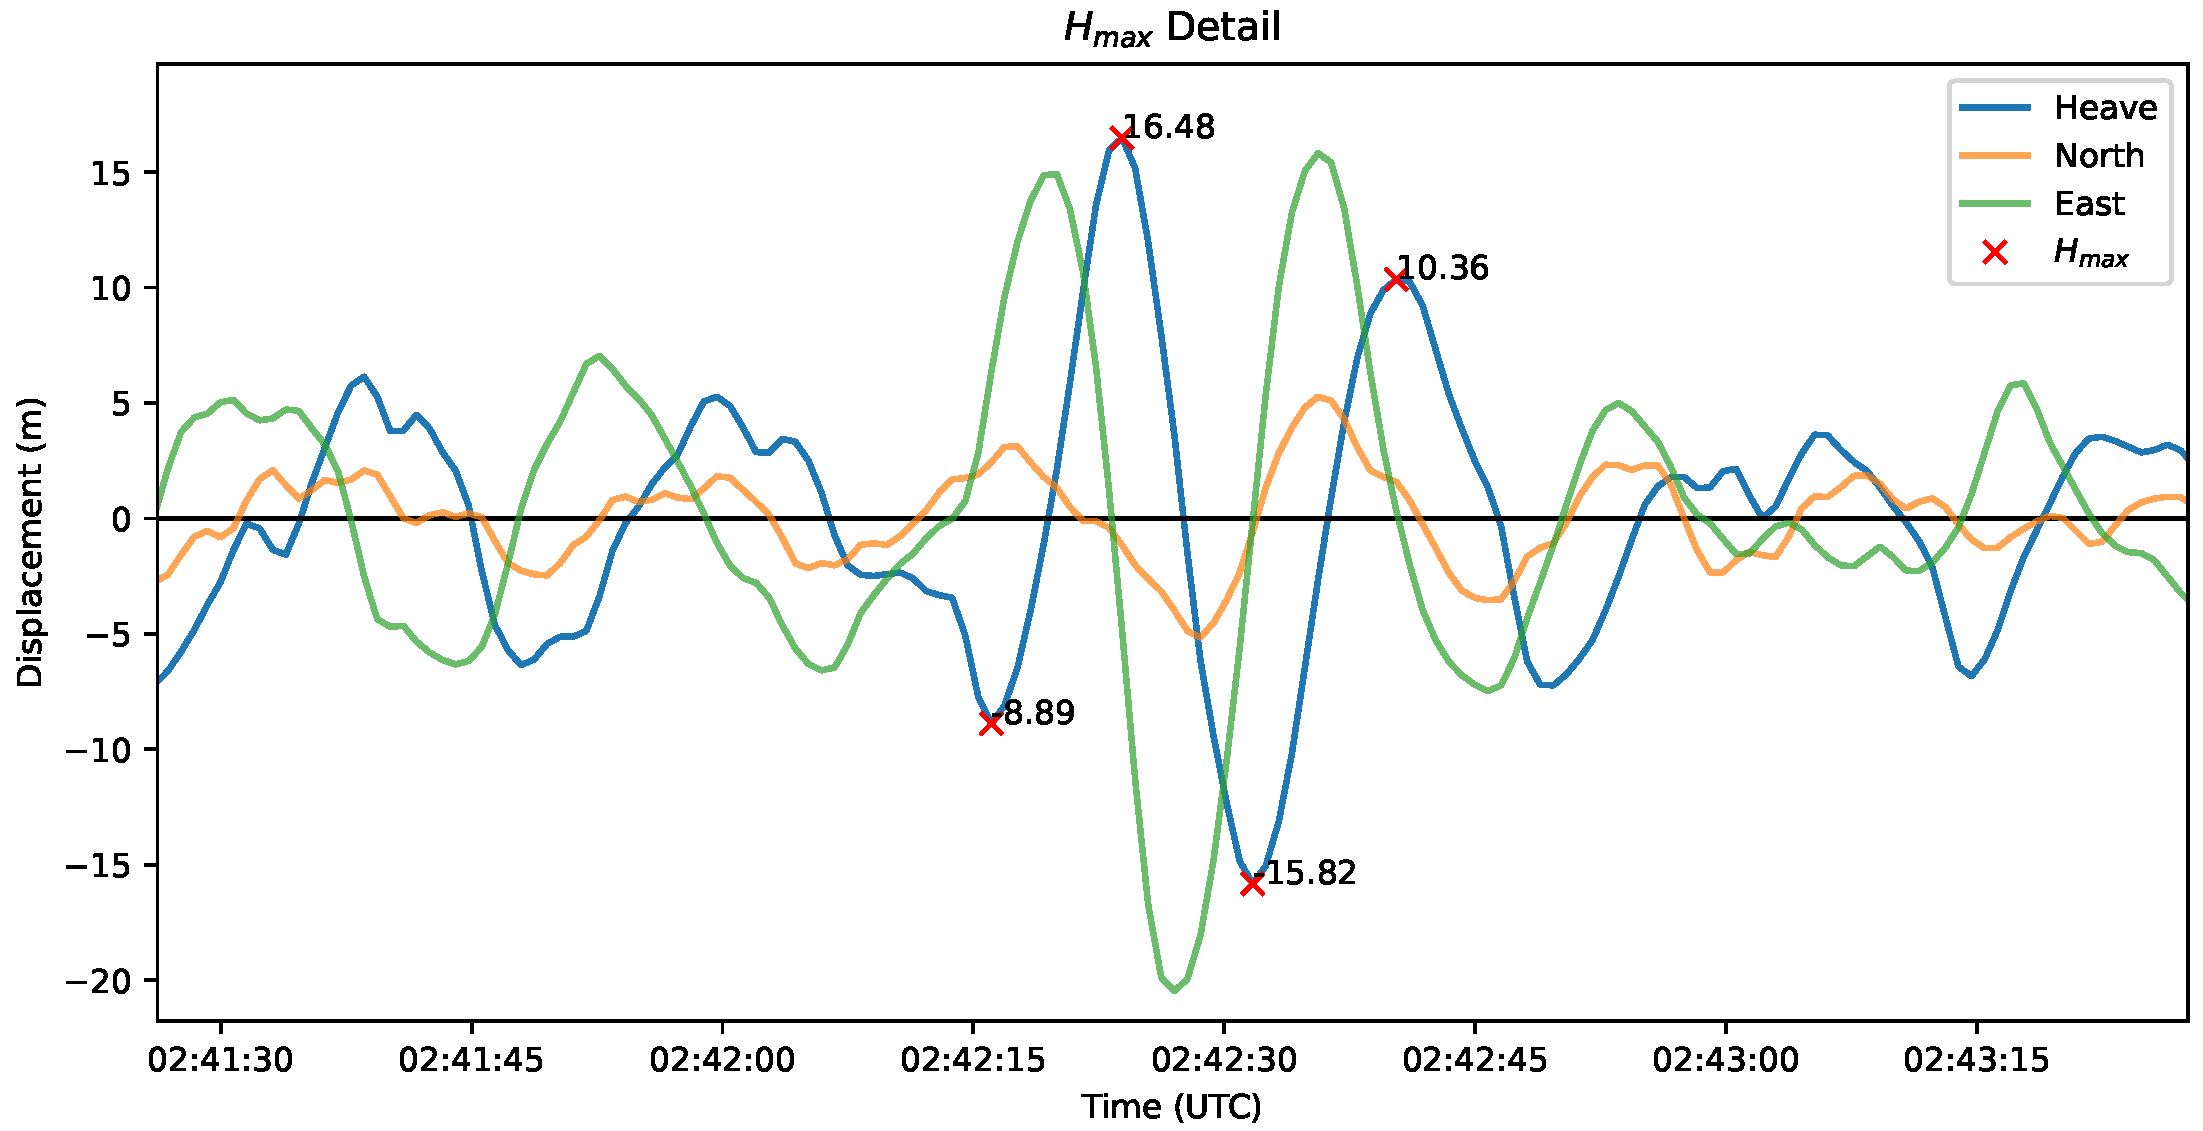
3.2. Rogue Wave Analysis

The hypothesised rogue wave came during a period of intense storm activity, with sea state peaking at 15 m at 20 s ( H m 0 and T p ) on 27 October 2020 22:00. Significant wave height exceeded 10 m for over 12 h, with mean wave direction WSW (ranging 250°–270°) and a directional spread of 30°. Spectral parameters around the time of the rogue wave are shown in Table 2. Raw heave data are shown in Figure 4—the rogue wave is exceptional in the sea state at the time, with wave height (crest–trough) of 32.3 m—over 2.4 × the significant wave height (13.34 m), a significantly greater margin than the commonly used rogue wave definition of 2 × H s [20]. Some detailed aspects of the rogue wave are discussed in Section 4.
Average wind speed at the time as measured by the buoy was 53.2 km/h, gusting to 98.8 km/h. Buoy pitch and roll were up to 35°—there is no evidence of the buoy being inverted or capsizing. The rogue wave occurred outside the sampling period of the Fugro Wavesense, so a direct comparison of the heave timeseries in question was not possible. Figure 5 shows a more detailed view of the rogue wave data. Datawell BV were contacted for comment on the validity of the data, and they conclude that the pattern of vertical and horizontal displacements seen below is consistent with a wave motion to the east, and not caused by instrument error artifact, as may be seen if the unit were to lose horizontal reference [21].

3.3. M6 Rogue Wave Context

The time series analysis used by the buoy data acquisition system (Campbell CR6) for the Datawell raw data are the same as described in the Datawell Library Manual [22]. Waves are defined and counted as between consecutive zero up-crossings of the heave data and categorised in terms of height (peak-trough), period (zero-crossing to zero-crossing) and steepness. The Fugro Wavesense performs a similar analysis internally, except that waves are defined as being between zero down-crossings. Post-processing and analysis of the raw data from both systems show no significant difference in statistical parameters such as H s and T s when using either up- or down-crossing definitions. Although there are differences in individual wave height measurements ( H m a x ) depending on the definition used, these average out over longer time spans.
Figure 6 shows H s , H m a x and the ratio H m a x / H s for each system, using both up- and down-crossing analyses. The blue and red lines indicate 2 rogue wave thresholds ( H m a x / H s > 2 and H m a x / H s > 2.2 ) [20]. Table 3 shows the number of rogue waves identified from raw data collected by each system over over the buoy deployment period (June 2020 to June 2021). The lower absolute number measured by the Fugro Wavesense corresponds to the smaller sample window (~1/3). Rogue incidence is calculated as the number of rogues divided by total number of waves within the considered time interval (based on zero-crossing count). The overall rate of incidence is similar—approximately one wave in 10,000 is rogue when looking at waves 2 × H s ; this decreases by a factor of 10 when using a threshold of 2.2. Differing rates for the two systems may be due to the different sample time used for analysis—wider datasets may be required to make conclusive comment on this point. There are no obvious effects on rogue incidence rate by season or sea state, in line with [9].

4. Discussion

4.1. Comparison to Other Notable Rogues

Table 4 shows some key parameters comparing the M6 wave with other notable rogues in the literature (Andrea and Draupner). Several differences are readily apparent—the M6 wave occurred in a true deep-water location, whilst Andrea and Draupner occurred in relatively shallow depths compared to the sea state, which may contribute to non-linear effects. The M6 wave has a comparatively less extreme crest height, despite occurring during more extreme sea state conditions, and owes its full height to a deep trough following the crest, a feature which was absent from the other rogues examined. This leads to a lower level of vertical asymmetry, and a pronounced difference in height when measured using up-crossing or down-crossing methods, the latter of which does not qualify the wave as a rogue at all ( H m a x < 2 × H s ). The period (and therefore wavelength) of the wave is also much greater, leading to a significantly lower steepness value. These differences combined suggest a possible different mechanism of formation of the M6 wave compared to the others, although such detailed hypothesis is beyond the scope of this paper.
The Benjamin-Feir Index, BFI, can be used to assess likelihood of extreme waves occurring. ERA5 estimates BFI of 0.49 at M6 at 03Z on the 28th. BFI calculated from M6 wave data varies from 0.7 to 1.2 depending on method of calculation, again highlighting that ERA5 did not capture the extreme conditions at M6 particularly well; this is further discussed in the next section. Generally, BFI > 1 indicates such waves are more likely. However, several rogue wave events have recorded similar or lower BFI to M6 in this case: the SS El Faro event reported BFI of 0.69 in [23] whilst the Killard, Andrea and Draupner events all had BFI < 0.25 [1].

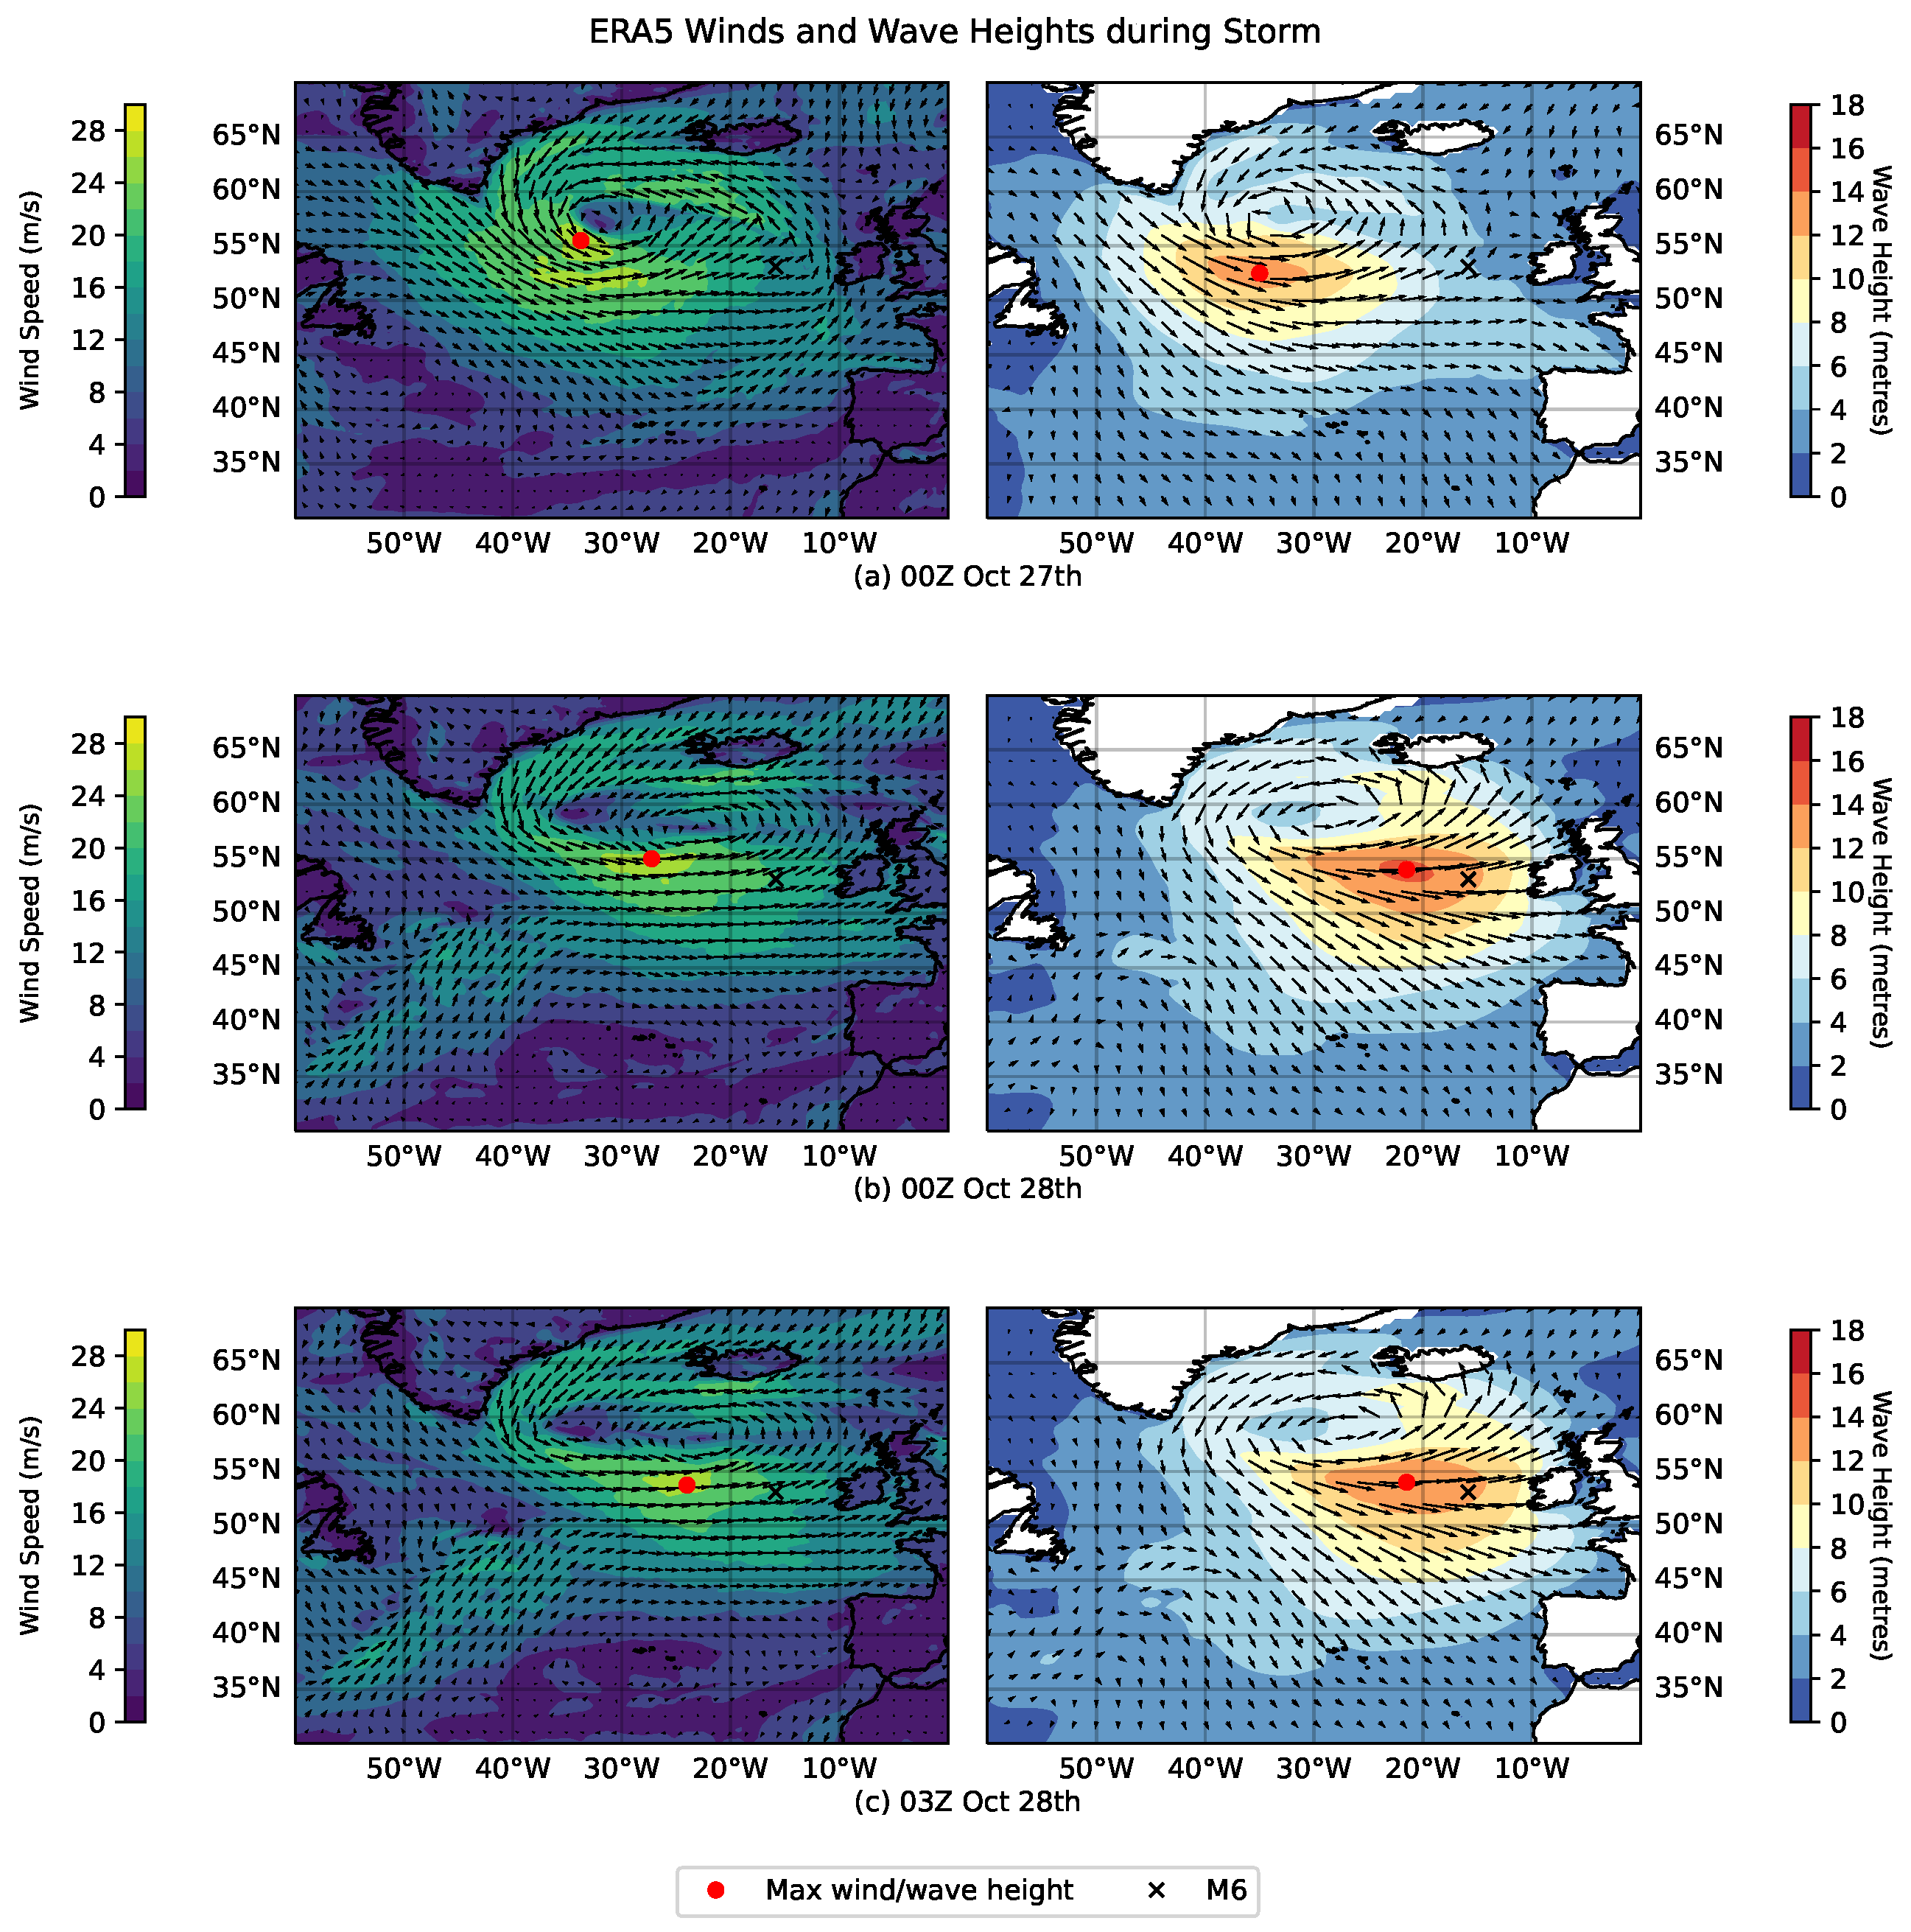
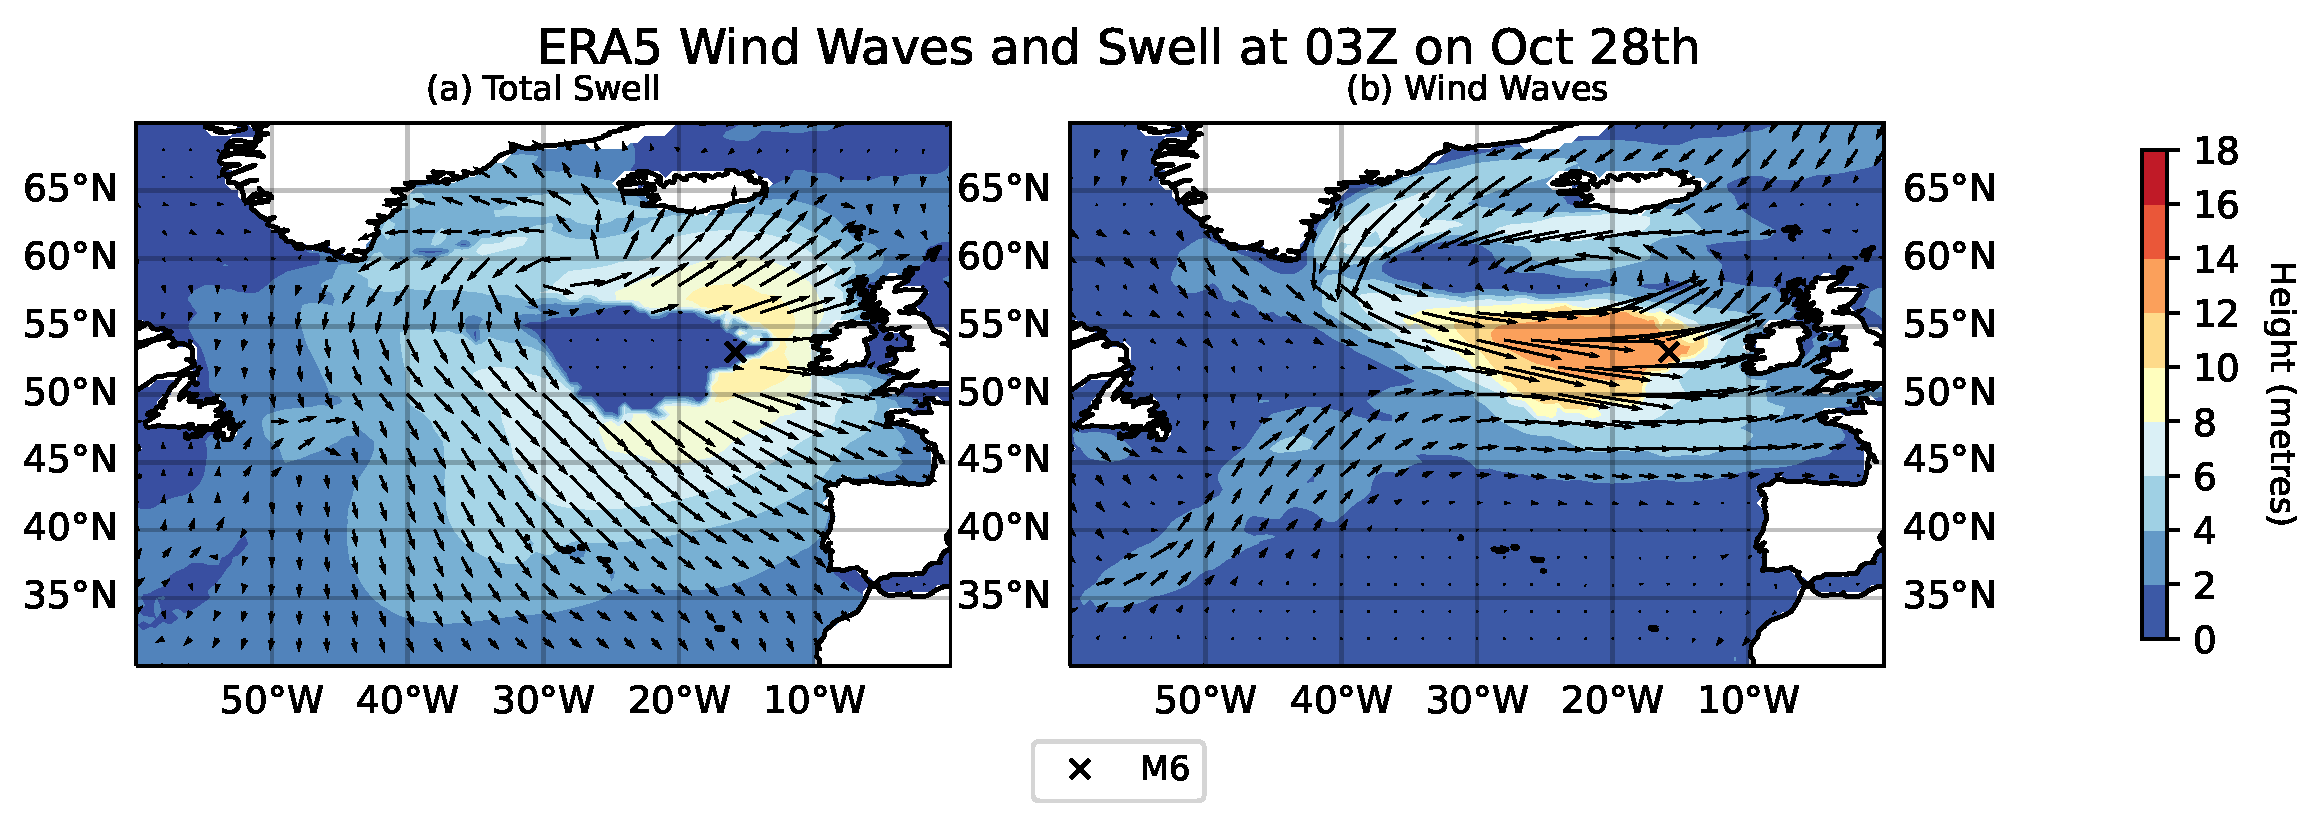
4.2. Meteorological Context

The Atlantic Northwest of Ireland during the period in question was dominated by a strong mid-latitude low pressure system, which evolved from remnants of Hurricane Epsilon. The US National Hurricane Centre have prepared a comprehensive report of Hurricane Epsilon [24]. As can be seen in Figure 7, sustained gale to storm force (70–100 km/h or 38–54 knots) Westerly to Southwesterly winds crossing the Atlantic over the 36 h prior to the exceptional H m a x measurement. These winds supported wave growth to the South and East of the storm centre, with the ERA5 reanalysis modelling combined (wind and swell) significant wave heights in excess of 16 m to the West of M6 from 03Z–18Z on 27 October. When comparing progression of winds and waves between Figure 7a,c, note that swell propagates Eastward more quickly than the pattern of storm winds.
Although M6 wind speeds and Datawell H m 0 and H m a x are highly correlated (Pearson correlation coefficients of 0.89, 0.95 and 0.93, significant with p< 0.001) to those from ERA5 for the storm period (00Z on the 26th to the 29th), there are large biases between ERA and M6, particularly for the highest winds and waves. Even when adjusted to 10 m assuming a logarithmic profile under neutral stability, M6 observed wind speeds were on average 12.7 km/h less than ERA5 values. This difference is far greater than the ~5–6 km/h biases noted by [13] in the Northeast Atlantic. One potential explanation may be due to the vector method of wind speed calculation used by the Fugro datalogger. Another potential contributing factor is sheltering from the adjacent waves. Buoy data were compared to ASCAT winds to assess wind sheltering in [25]. Although they conclude that the affect is insignificant for anemometers at heights from 4 to 5 m above sea-level (M6’s anemometer sits at 4.19 m above sea level), results are presented for significant wave heights up to 6 m high. Given the significant wave height at M6 during this event was approximately 13 m high, this finding may not be applicable and wind sheltering may have had an impact on buoy wind measurements. Finally, the coarse resolution of ERA5 (31 km horizontal resolution) may explain some of this difference.
ERA5 H m 0 were similar to values observed at M6 other than the most extreme values, which ERA5 underestimates: maximum H m 0 estimated by ERA5 at M6 over the period is 12.9 m, whilst M6 observed H m 0 maxima were 15.1 m (Datawell) and 15.7 m (Fugro Wavesense). Similarly ERA5 H m a x is positively biased overall but fails to capture the largest significant and maximum wave heights observed by M6, including the rogue wave—Figure 8b. The maximum H m a x ERA5 estimates at the M6 location is 23.6 m at 00Z on 28 October. This represents a nearly 27% difference between ERA5 and M6 values. This is out of line with findings in other works—for example, [14] note an underestimate of 1.4% between ERA5 and buoy H m a x during a tropical storm. Similarly, they note an underestimate of 3% for the 2013 measurement of 27.3 m at the K5 buoy. Note however, that for several hours late on 27 October, ERA estimates that waves with heights in excess of 30 m were present in the North Atlantic, within 280 km of M6, Figure 8a.
These differences may be partially due to inaccuracies or bias in predicting the timing or paths taken by storm systems. Noting that ERA5 estimates BFI and H m a x using the the full wave spectrum, this finding suggests that ERA5 may be failing to represent and correctly position all elements of the wave spectrum. In particular, non-linear interactions between different elements of the wave spectrum (i.e., wind waves, swell) would be required to form H m a x of 32.3 m as observed at M6, especially given its size relative to the surrounding sea state.
ERA5 reanalyses of swell and wind waves at 03Z on the 28th are shown in Figure 9. The deviation between observed and reanalysis wave values was most pronounced during the height of the storm, from late on the 27th to early on the 28th. One explanation for this deviation may be a mistiming of the swell and wind wave arrival times at M6 in the ERA5 reanalysis. Over this period of deviation, ERA5 determined that there was effectively no swell present at the M6 location, Figure 9a; thus, the combined wave field at M6, according to ERA5, was simply the wind wave field. The larger H m 0 observations at M6 may result from some of the 8 m swell field to the East, South and North of M6 in Figure 9a interacting with the wind wave field constructively. In addition to providing a potential explanation for the larger H m 0 observed by M6, interaction of the swell and wind fields in the form of crossing seas could also provide an explanation for the exceptional H m a x observation. The crossing angle is believed to be a key factor in crossing seas leading to rogue wave formation. In this case, ERA5 estimates the swell and wind wave mean directions as 280° and 260° respectively, in line with the observed wave direction spread at M6. However, the literature varies on which angles are optimal for rogue wave formation: [26] found theoretically that the optimal angle for wave growth was 10–30°, whilst experimental study in [27] found that angles >60° were needed to recreate the Draupner Wave.

4.3. Evolution of IMDBON and Interpreting Hourly Data

Table 5 shows comparison of hourly data from the two wave sensors on board M6 from 2020 to 2022. It confirms findings by [6] that the majority of rogue waves are of limited height, whilst high non-rogue waves are far more common. As noted in Section 3, significant wave heights are very similar for both measurement systems, but there are significant differences in hourly H m a x data; this is unsurprising given the differences in sampling intervals.
It should be noted that advances in wave sensing technology between the 2nd and 3rd generation of IMDBON buoys may result in increases in H m a x measurements. Recall that when compiling hourly wave reports, the CR6 logger connected to the Datawell sensor uses the most recent sample’s H s but the largest H m a x of the past hour (2 sampling periods). Thus, H s and H m a x may not originate in the same sampling period. Because of this, the Datawell system reports larger proportions of both rogue observations and large non-rogue waves in hourly reports, and the full raw dataset should be used when performing any analysis of buoy data, particularly where analysis pertains to rogue waves.
This is particularly relevant when evaluating long-term trends in wave heights. Numerical projections of significant wave height changes under various climate change scenarios indicate robust agreement that significant wave heights around Ireland will decrease over the remainder of this century, particularly in Winter and Summer, for example [28]. However, there is lower certainty in how extreme wave heights, including rogue waves will evolve in line with the climate. Some studies have indicated that extreme wave heights will increase in the future [29] whilst other studies project that extreme wave heights will not change significantly, or will even decrease [28]. Similar uncertainty is found by studies considering rogue waves in particular; for example [3,30] find that results vary depending on models used, emission scenarios and the geographic location of interest such that no firm trends in rogue wave behaviour can be extrapolated from projections at present. As observational data such as that recorded by IMBDON may be used for validation of models statistics and quantifying long-term environmental trends, technological changes in equipment such as described in this paper must be noted to ensure accurate comparisons. Specifically, if data from IMDBON are used whilst failing to take account of the changes in how H m a x is calculated and reported hourly, they could be misrepresented to suggest trends in rogue or other high wave incidence which are not representative of the actual environment. Going forward, as efforts are made to verify and refine projections for Irish waters, it is hoped that this paper may avoid misinterpretation of IMDBON wave data.

4.4. M4 February 2022 Observation

As the upgrade to new-generation IMDBON buoys is relatively recent (at time of writing), the volume of raw data available is still quite small (the full dataset of displacements and spectra are stored on board for retrieval when the buoy is recovered annually). A recent wave recorded by the M4 buoy, off the Northwest coast of Ireland, supports the reliability of the Datawell sensor deployed in the 3rd generation of IMDBON. On 21 February 2022, both sensors on M4 recorded H m a x > 28 m (Datawell and Fugro Wavesense systems recorded waves of 29.5 m and 28.1 m, respectively). The buoy has not been recovered yet, and as such the raw data cannot be examined to confirm findings. However, the close agreement between wave heights reported by both sensors, in addition to close agreement of observations with the ECMWF WAM model suggest that the measurements are valid. This measurement, confirmed independently by each system, adds to the authors’ confidence in the exceptional M6 32.3 m wave report.

5. Conclusions

The M6 buoy off the West Coast of Ireland observed a record 32.3 m maximum wave height during high seas. Analysis of the raw wave recorder data suggest the measurement is reliable and that the wave was a rogue wave based on the up-crossing (crest to trough) height being over 2.4 times the significant wave height at the time. Alternative definitions (crest height or down-crossing) render the wave, although exceptionally high, as not a rogue wave. This suggests that the commonly used definitions of rogue waves may not be precise or consistent enough to reliably flag these types of events. The sea state leading up to the measurement was defined by high swell and wind waves caused by a low pressure system south of Iceland with a wide spectrum of wave energy present in the ocean. Interaction of swell and wind waves may explain the very large wave observed. In addition, the BFI at M6, particularly in comparison to other notable high rogue waves, suggest that there was an elevated probability of rogue wave formation at M6.
The two wave measurement systems deployed on the buoy were found to be in close agreement for most sea state parameters and there were no erroneous measurements or spikes detected in the dataset. These factors, along with the review of the raw data by Datawell BV, lead the authors to conclude that the exceptional wave recorded by M6 was a valid measurement. Different methods of wave statistic calculation were tested, and the number of rogues found by these analyses was largely consistent with other work in this area. The use of crest–trough or trough–crest heights can lead to quite different results when examining individual waves, but when looking at long-term statistics there are no significant differences between these two methods. This paper only analyses data from a single buoy for a period of one year—definitive conclusions would require a much wider-scale analysis of wave sensor data.
As the technology employed by IMDBON buoys has evolved and improved, inconsistencies have been introduced to the hourly data record. This underlines the importance of researchers considering any changes in buoy technology when using such data, and ideally, consulting raw data where possible rather than relying on hourly reports. Particularly for studies focused on rogue or other extreme waves, the move from 2nd to 3rd generation IMDBON systems may lead to an apparent increase in maximum individual wave heights and possibly an increased observed incidence of rogue waves in hourly data. Future projections for the NE Atlantic extreme wave climate demonstrate large degrees of uncertainty. It is likely that given the significant impacts of large rogue waves, there will be interest in establishing which (if any) models are proving to be accurate in their predictions. However, in carrying out such work, researchers must be aware of how to process observations properly to ensure developments in technology are accounted for.
The IMDBON network of buoys is continually being improved to deliver data at the highest possible quality—current developments in testing include the use of newer solid-state wave sensors. As these and other changes are implemented, the network continues to build a detailed met-ocean dataset, which will contribute to further research on rogue waves, environmental models, and climate change.

Author Contributions

D.K. carried out analysis of wave sensor data. M.N.G. analysed ERA5 data for the period. D.K. and M.N.G. jointly prepared the manuscript with guidance and comments from C.C. (Colm Clancy), C.C. (Columba Creamer), S.G., A.B., B.C. and G.W. All authors have read and agreed to the published version of the manuscript.

Funding

The Irish Marine Data Buoy Observation network is funded by the Irish Department of Agriculture, Food and the Marine. This publication has emanated from research supported in part by a Grant from Science Foundation Ireland under Grant number 18/RI/5731.

Institutional Review Board Statement

Not applicable.

Informed Consent Statement

Not applicable.

Data Availability Statement

Hourly buoy data is available at data.gov.ie or erddap.marine.ie, accessed on 2 August 2022; Raw data is available by request from [email protected].

Acknowledgments

The authors would like to extend our thanks to both reviewers and the editorial team for their valuable and insightful comments. The authors would also like to thank the vessel crew members past and present who have serviced the weather buoy network in often very challenging conditions.

Conflicts of Interest

The authors declare that they have no conflict of interest.

References

  1. Fedele, F.; Brennan, J.; De León, S.P.; Dudley, J.; Dias, F. Real world ocean rogue waves explained without the modulational instability. Sci. Rep. 2016, 6, 27715. [Google Scholar] [CrossRef] [PubMed]
  2. Fedele, F.; Lugni, C.; Chawla, A. The sinking of the El Faro: Predicting real world rogue waves during Hurricane Joaquin. Sci. Rep. 2017, 7, 11188. [Google Scholar] [CrossRef] [PubMed] [Green Version]
  3. Bitner-Gregersen, E.M.; Vanem, E.; Gramstad, O.; Hørte, T.; Aarnes, O.J.; Reistad, M.; Breivik, Ø.; Magnusson, A.K.; Natvig, B. Climate change and safe design of ship structures. Ocean. Eng. 2018, 149, 226–237. [Google Scholar] [CrossRef] [Green Version]
  4. Gemmrich, J.; Cicon, L. Generation mechanism and prediction of an observed extreme rogue wave. Sci. Rep. 2022, 12, 1718. [Google Scholar] [CrossRef] [PubMed]
  5. Karin Magnusson, A.; Donelan, M.A. The Andrea wave characteristics of a measured North Sea rogue wave. J. Offshore Mech. Arct. Eng. 2013, 135, 031108. [Google Scholar] [CrossRef]
  6. O’Brien, L.; Renzi, E.; Dudley, J.M.; Clancy, C.; Dias, F. Catalogue of extreme wave events in Ireland: Revised and updated for 14 680 BP to 2017. Nat. Hazards Earth Syst. Sci. 2018, 18, 729–758. [Google Scholar] [CrossRef] [Green Version]
  7. Orzech, M.D.; Wang, D. Measured rogue waves and their environment. J. Mar. Sci. Eng. 2020, 8, 890. [Google Scholar] [CrossRef]
  8. Teutsch, I.; Weisse, R.; Moeller, J.; Krueger, O. A statistical analysis of rogue waves in the southern North Sea. Nat. Hazards Earth Syst. Sci. 2020, 20, 2665–2680. [Google Scholar] [CrossRef]
  9. Häfner, D.; Gemmrich, J.; Jochum, M. Real-world rogue wave probabilities. Sci. Rep. 2021, 11, 10084. [Google Scholar] [CrossRef]
  10. Onorato, M.; Osborne, A.R.; Serio, M. Extreme wave events in directional, random oceanic sea states. Phys. Fluids 2002, 14, L25–L28. [Google Scholar] [CrossRef] [Green Version]
  11. Benjamin, T. Instability of Periodic Wave Trains in Nonlinear Dispersive Systems. Proc. R. Soc. Lond. 1967, 299, 59–75. [Google Scholar]
  12. Hersbach, H.; Bell, B.; Berrisford, P.; Hirahara, S.; Horányi, A.; Muñoz-Sabater, J.; Nicolas, J.; Peubey, C.; Radu, R.; Schepers, D.; et al. The ERA5 global reanalysis. Q. J. R. Meteorol. Soc. 2020, 146, 1999–2049. [Google Scholar] [CrossRef]
  13. Belmonte Rivas, M.; Stoffelen, A. Characterizing ERA-Interim and ERA5 surface wind biases using ASCAT. Ocean. Sci. 2019, 15, 831–852. [Google Scholar] [CrossRef] [Green Version]
  14. Muhammed Naseef, T.; Sanil Kumar, V. Climatology and trends of the Indian Ocean surface waves based on 39-year long ERA5 reanalysis data. Int. J. Climatol. 2020, 40, 979–1006. [Google Scholar] [CrossRef]
  15. Gallagher, S.; Tiron, R.; Dias, F. A long-term nearshore wave hindcast for Ireland: Atlantic and Irish Sea coasts (1979–2012). Ocean. Dyn. 2014, 64, 1163–1180. [Google Scholar] [CrossRef]
  16. Scott, T.; McCarroll, R.; Masselink, G.; Castelle, B.; Dodet, G.; Saulter, A.; Scaife, A.; Dunstone, N. Role of atmospheric indices in describing inshore directional wave climate in the United Kingdom and Ireland. Earth’S Future 2021, 9, e2020EF001625. [Google Scholar] [CrossRef] [PubMed]
  17. Gleeson, E.; Clancy, C.; Zubiate, L.; Janjić, J.; Gallagher, S.; Dias, F. Teleconnections and extreme ocean states in the Northeast Atlantic Ocean. Adv. Sci. Res. 2019, 16, 11–29. [Google Scholar] [CrossRef]
  18. Dodet, G.; Bertin, X.; Taborda, R. Wave climate variability in the North-East Atlantic Ocean over the last six decades. Ocean. Model. 2010, 31, 120–131. [Google Scholar] [CrossRef]
  19. Janjić, J.; Gallagher, S.; Dias, F. Case study of the winter 2013/2014 extreme wave events off the west coast of Ireland. Adv. Sci. Res. 2018, 15, 145–157. [Google Scholar] [CrossRef]
  20. Hayer, S.; Andersen, O.J. Freak waves: Rare realizations of a typical population or typical realizations of a rare population? In Proceedings of the The Tenth International Offshore and Polar Engineering Conference, Seattle, WA, USA, 27 May–2 June 2000; ISOPE: Cupertino, CA, USA. [Google Scholar]
  21. Stoker, E.; Fuquay-Varina, NC, USA. Personal communication, 2021.
  22. Datawell, B.V. Datawell Library Manual, Software for Datawell Waverider Buoys; Datawell BV: Heerhugowaard, The Netherlands, 2017. [Google Scholar]
  23. Bell, R.; Kirtman, B. Extreme environmental forcing on the container ship SS El Faro. J. Oper. Oceanogr. 2021, 14, 98–113. [Google Scholar] [CrossRef] [Green Version]
  24. Papin, P.P. Hurricane Epsilon: 19–26 October 2020; Technical Report; National Hurricane Centre: Miami-Dade, FL, USA, 2020.
  25. Wright, E.E.; Bourassa, M.A.; Stoffelen, A.; Bidlot, J.R. Characterizing Buoy Wind Speed Error in High Winds and Varying Sea State with ASCAT and ERA5. Remote Sens. 2021, 13, 4558. [Google Scholar] [CrossRef]
  26. Onorato, M.; Proment, D.; Toffoli, A. Freak waves in crossing seas. Eur. Phys. J. Spec. Top. 2010, 185, 45–55. [Google Scholar] [CrossRef]
  27. McAllister, M.L.; Draycott, S.; Adcock, T.; Taylor, P.; Van Den Bremer, T. Laboratory recreation of the Draupner wave and the role of breaking in crossing seas. J. Fluid Mech. 2019, 860, 767–786. [Google Scholar] [CrossRef] [Green Version]
  28. Gallagher, S.; Gleeson, E.; Tiron, R.; McGrath, R.; Dias, F. Wave climate projections for Ireland for the end of the 21st century including analysis of EC-Earth winds over the North Atlantic Ocean. Int. J. Climatol. 2016, 36, 4592–4607. [Google Scholar] [CrossRef]
  29. Wolf, J.; Woolf, D.; Bricheno, L. Impacts of climate change on storms and waves relevant to the coastal and marine environment around the UK. MCCIP Sci. Rev. 2020, 2020, 132–157. [Google Scholar]
  30. Gramstad, O.; Bitner-Gregersen, E.; Vanem, E. Projected changes in the occurrence of extreme and rogue waves in future climate in the North Atlantic. In Proceedings of the International Conference on Offshore Mechanics and Arctic Engineering, Trondheim, Norway, 25–30 June 2017; American Society of Mechanical Engineers: New York, NY, USA; Volume 57656, p. V03AT02A012. [Google Scholar]
Figure 1. Left: Map indicating current IMDBON buoy locations around Ireland. M6, the main subject of this paper, is located at 52.986 N–15.866 W; Right: A 3rd generation IMDBON buoy—the full height of the buoy is over 6 m, and the platform weighs more than five tonnes.
Jmse 10 01073 g001
Figure 2. Seasonal mean wind speed, significant wave height and maximum wave height from each of the IMDBON buoys. Note that maximum wave height data was only available from the 2nd generation of the network. Strong seasonal and spatial variability is evident, with Winter being the most active season. M2 and M5 are more sheltered from the Atlantic; although they do experience comparable winds, their wave heights are far smaller than those experienced at M3 for example. This is due to Ireland’s landmass blocking storm waves and swell off the Atlantic.
Jmse 10 01073 g002
Figure 3. Datawell (DWR) and Fugro Wavesense Significant ( H s ) and Maximum ( H m a x ) Wave Height during the storm of 25–31 October 2020.
Jmse 10 01073 g003
Figure 4. Time series of Datawell heave for sample period (30 min) in which the rogue wave was measured. The maximum crest and trough are indicated.
Jmse 10 01073 g004
Figure 5. Time series of the three recorded Datawell buoy displacements indicating the maximum crests and troughs of the rogue wave. Fugro data are not available due to being outside of its sample window.
Jmse 10 01073 g005
Figure 6. H m a x , H s and the ratio H m a x / H s for the two observation systems over the buoy deployment period (June 2020 to June 2021). The analysis compares the up-crossing (left) and down-crossing (right) methods.
Jmse 10 01073 g006
Figure 7. ERA5 mean winds and combined (swell and wind) significant wave heights and direction in the 27 h leading up to rogue wave measurement at (a) 00Z 27 October, (b) 00Z 28 October and (c) 03Z on 28 October. The location of maximum wind speeds/wave heights is indicated, along with the M6 location.
Jmse 10 01073 g007
Figure 8. ERA5 maximum individual wave height, H m a x . The location of maximum wind speeds/wave heights is indicated, along with the M6 location. (a) very large wave heights, of similar magnitude to the observed rogue wave, were present in the ERA5 reanalysis. (b) the maximum waves estimated by ERA5 near M6 at the time of the rogue wave observation were far smaller.
Jmse 10 01073 g008
Figure 9. ERA5 breakdown of (a) total swell and (b) wind waves at 03Z 28 October, the nearest ERA5 timestep to the rogue wave measurement at M6 buoy. The location of maximum wave heights is indicated, along with the M6 location.
Jmse 10 01073 g009
Table 1. Comparison results of Fugro Wavesense and Datawell wave measurement system hourly parameters from June 2020 to June 2021.
ParameterPearson’s RRMS Difference
H m 0 0.990.22 m
H s 0.990.24 m
H m a x 0.971.02 m
T p 0.881.33 s
T m 02 0.990.22 s
T s 0.980.37 s
M d i r 0.9137.9°
Table 2. Spectral parameters recorded by the M6 Datawell sensor prior to and after the rogue wave measurement: significant wave height ( H m 0 ), peak period ( T p ), mean zero-crossing period ( T m 02 ) and mean spectral wave direction ( M d i r ).
Time (UTC)Hm0 (m)Tp (s)Tm02 (s)Mdir (Degrees)
28 October 2020 02:0013.052012.79265.1
28 October 2020 02:3012.6816.6712.6260.7
28 October 2020 03:0014.072013.09270.1
Table 3. Rogue wave incidence rates at M6 calculated from raw data for each sensor, method of calculation and rogue definition. The absolute number of rogue waves is higher for Datawell due to its longer sampling window capturing more individual waves—further details in text.
2 × Hs2.2 × HsCrest 1.25 × Hs
SystemNo. of WavesIncidence RateNo. of WavesIncidence RateNo. of WavesIncidence Rate
Datawell (U-C)3921.1 × 10−4481.4 × 10−5257.3 × 10−6
Datawell (D-C)3771.1 × 10−4381.1 × 10−5n/an/a
Fugro WS (U-C)1521.3 × 10−4171.4 × 10−5151.2 × 10−5
Fugro WS (D-C)1641.4 × 10−4221.8 × 10−5n/an/a
Table 4. Comparison between M6 rogue wave and other notable rogues. Note that the depth at which the M6 rogue occurred is substantially different. Where relevant, parameters are calculated using both up-crossing (uc) and down-crossing (dc) methods.
ParameterM6AndreaDraupner
Water Depth30007470
H s 13.349.1811.92
C r x 16.4814.9718.49
C r x / H s 1.241.631.55
H m a x ( u c ) 32.322.8825.58
H m a x ( u c ) / H s 2.412.492.15
H m a x ( d c ) 25.3721.1425.01
H m a x ( d c ) / H s 1.902.32.10
Steepness (uc/dc)0.074/0.0580.102/0.0940.096/0.093
Period16.712.013.1
T / T z 1.281.331.17
Vertical Asymmetry (uc/dc)0.51/0.650.65/0.710.72/0.74
Table 5. Statistics from hourly data from both wave sensors. Data are available from both from 27 April 2020 to 6 May 2022, accounting for sensor outages, there are a total of 15,091 hourly reports available.
SensorNo. RoguesNo. Rogues > 10 mNo. Non-Rogues > 10 mMean Hs (m)Mean HmaxMax Hmax
Wavesense242225822.9044.54421.68
Datawell10611169872.9715.14932.3
Publisher’s Note: MDPI stays neutral with regard to jurisdictional claims in published maps and institutional affiliations.

