Abstract
The Mediterranean Sea has been consolidated as the second most important destination region in cruise shipping. This paper investigates the dynamics of the contemporary cruise port network in Southern Europe from the perspective of its centrality. To conduct the research, we applied the technique of social network analysis (SNA) to a set of 20 ports. The set of ports forms a network; therefore, we use the SNA to build this network based on nodes (ports) and to analyze the connections between each other. Several network and node metrics are calculated, such as outgoing and incoming centrality degree, betweenness centrality, and hub index. The goals of this research are (1) to explain the dynamics of the cruise port network for contemporary cruise calls in Southern Europe in terms of the centrality of the ports and the connections between ports, and (2) to obtain a series of graphs with the inter-port relationships of the sample of ports analyzed. Important conclusions are revealed: the cruise traffic registered in a port has an impact on several ports in terms of the number of different ports to which it connects and the intensity of the connection between pairs of ports; the role of betweenness centrality is associated with ports of the same destination region and, in some cases, with ports situated in another destination region; and four ports have been identified as hub ports. The results obtained may help itinerary planners identify alternative ports in the configuration of new itineraries to deal with the challenges associated with the COVID-19 pandemic for cruise shipping.
1. Introduction
The cruise sector has been one of the most growing sectors in the tourism industry since it emerged in the late 1960s. According to Rodrigue and Notteboom [1], this industry has become a crucial part of the tourism industry by using larger vessels and adding more passenger services on board. Globally, the ocean cruise industry had an average annual growth rate of 6.63% from 1990 to 2019 in terms of the number of cruise passengers [2]. This sector has become one of the most dynamic and fastest-growing industries in international tourism [3]. In recent decades, cruise ships have been deployed to many destinations around the world, from the Caribbean Sea, the Mediterranean Sea, and Alaska to Asia, because of the rapid growth of this industry. Focusing on the Mediterranean Sea, MedCruise [4] reported that the number of cruise passenger movements in the Mediterranean increased from 17.56 million in 2018 to 19.53 million in 2019, which represents an annual growth of 11.2%. The cruise capacity deployed in the Mediterranean Sea, the second most popular destination region, was 17.3% in 2019, whereas in the most important destination region worldwide, the Caribbean Sea, it was 34.4% in 2019 [5]. The cruise expansion in the Mediterranean market is due to several factors. First, the diversity of the Mediterranean region and the high density of ports have supported the cruise development, which enables innovative itineraries in a relatively small area. Second, several port infrastructures have been improved and modernized. Third, the climate in this region allows for a longer cruising season [6].
Cruise tourism has a hugely positive contribution to the global economy. The global economic contribution generated by this industry amounted to $154.1 billion in 2019 [7]. This economic impact is especially relevant in those hub ports that have high homeport cruise traffic [8]. Hub has different definitions in the fields of airports, seaports, and tourism. According to Lohmann et al. [9], tourism hubs have been transformed into destinations because of the interaction of attractions, transport, and accommodation services they offer. In the case of cruise traffic, several areas can be distinguished: (1) Homeport, where the itinerary starts and ends. Depending on the type of itinerary, there is one homeport (the itinerary starts and ends at the same homeport) or two homeports (the homeport in which the itinerary starts is different in which it ends). (2) Ports of call, in which the ship usually remains docked between 8 and 9 h. Throughout this time span, the passengers visit the port’s tourist hinterland [10]. The consideration of the homeport as the starting and ending ports of the itinerary is similar to the Lohmann et al. [9] hub concept.
In setting up a cruise itinerary, one of the most important questions for cruise lines is ‘which port to visit?’ the final choice has a huge impact on the cruise line, the selected port, and other ports of the destination region. The answer could have economic, environmental, and social impacts in those ports [11]. Cruise ships must have access to appropriate port infrastructures, superstructures, supplies, and services because the passenger’s satisfaction is the most significant reason to select the ports of the itinerary for a cruise line. The cruise ports are interested in being homeports for one or more cruise lines due to the positive impact generated on the port and the related city. Three sources motivate this positive impact: the cruise lines because they ensure traffic of this kind of vessel [12], the cruise passengers and the ship’s crew increase the expenditure in the city, then becoming a source of income for the population [13,14].
Most studies about the cruise industry mainly focus on the following issues: the global cruise industry [15,16], sustainable cruise tourism [17,18,19], problems with cruise ‘overtourism’ [20], ecological problems related to cruise tourism [21,22], the geography of cruise traffic [1,23], port management [10], passenger preferences on board [24,25], and cruise safety and security [23,26]. However, there is a lack of works that study the relationship between ports, as well as their competitive position within the set of ports in a destination region. In this sense, the works related to this field analyze the competition and cooperation between ports [27,28] or the way of modeling and evaluating the behavior of ports in a port network [29].
In addition, the cruise industry sells itineraries, not destinations [1] that are the principal element of cruise traffic [30]. The itineraries have a notable influence on the occupancy rate [31], and therefore those cruise companies that innovate their itineraries in different areas may attract more tourists. The higher number of tourists, the higher differentiation and profitability a cruise company has [32].
COVID-19 Risk to Cruise
The health and well-being of passengers and crew are the fundamental priority for the cruise line [33]. Before 2019, norovirus (Nov) and influenza outbreaks were the major health challenges for the cruise industry [34]. However, since the end of 2019, the new coronavirus SARS-CoV-2 (COVID-19) has threatened the world. Specifically, the first cruise ship affected by this virus was the Diamond Princess at the beginning of February 2020 [35]. A month later, at the end of March, at least 25 cruise ships had confirmed COVID-19 infections, and ten ships remained at sea, unable to find a port that would allow them to dock [36]. Additionally, during the second half of March 2020, the cruise fleet around the world stopped its activity due to the outbreak of COVID-19, which was an unprecedented episode for the cruise shipping industry. Until the development of vaccines, COVID-19 caused an unprecedented health-related risk that evolved into a large-scale crisis for the cruise industry.
2. Aim and Structure of This Work
As mentioned in Section 1, one of the most relevant issues that cruise lines have to deal with is passenger comfort and pleasure. Accordingly, cruise lines must offer good onboard facilities and itineraries that contain attractive ports for the passengers they carry on board. Therefore, not all ports generate the same interest in the cruise passengers; as a consequence, there are high-impact ports that cruise passengers want to visit (attractive ports). The ports that have less impact, but are connected with attractive ports, will gradually increase their importance. The present research focuses on the cruise port network in Southern Europe composed of ports located in the Mediterranean Sea and in the area of the Atlantic Ocean close to the Mediterranean. We have selected ports in Southern Europe to carry out the research because this area registers the highest concentration of cruise traffic in Europe. The goals of this research are (1) to explain the dynamics of the cruise port network for contemporary cruise ships in Southern Europe in terms of the centrality of the ports and the connections between ports, and (2) to obtain a series of graphs with the inter-port relationships of the sample of ports analyzed. To this end, the technique of social network analysis (SNA) is applied.
SNA provides a standardized statistical summary of the properties of a collection of objects (nodes) and the connections (edges) between them. It provides insight into patterns in spatial connections, in addition to the importance of nodes to local and regional connectivity [37], not possible from traditional statistical methods without graphical representation. The application of graph theory, on which SNA is based, is considered of high potential to determine the connectivity among the ports analyzed. Therefore, we choose SNA as the analysis technique based on its understandability and generation of practical results. The relationships revealed through SNA can shed light on principal characteristics and influences in the contemporary cruise port network of Southern Europe, both quantitatively and graphically, which is the main novelty of this study.
The cruise market can be considered dynamic due to its rapid and constant transformation. It is for this reason that, to identify and understand behavior patterns in the cruise port network to be analyzed, it is necessary to consider a long enough time series. The novelty of this study is that the period of analysis is from 2015 to 2019, which allows us to perceive the changes in the network and understand them. Additionally, with the analysis of such large time series, it is expected to obtain results with a high degree of precision, which leads to a better understanding of the evolution of cruise itineraries. These results provide cruise lines and ports with important information to make strategies to attract more passengers in the development of new itineraries.
The article is structured as follows. Section 3 is dedicated to the features of the database used as input data and the methodology applied to perform social network analysis to estimate the different metrics of the cruise port network. Section 4 and Section 5 include the results obtained and their discussion, respectively. Section 6 presents the conclusions, limitations, and future perspectives of the research.
3. Materials and Methods
In this section, we present an overview that includes the data used to carry out the research and the metrics calculated to determine the dynamics of the cruise ship navigation networks in Southern Europe.
3.1. Materials
The ports selected constitute the network to be analyzed. The study was carried out using the time series of cruise ship calls from 2015 to 2019 of 20 ports located in Southern Europe. Fourteen ports are situated in the Mediterranean Sea, and the remaining six ports are situated in the Atlantic Ocean. The time series of cruise ship calls were retrieved from ports’ websites [38,39,40,41,42,43,44,45,46,47,48,49,50]. According to the Association of Mediterranean Cruise ports (MedCruise), the Mediterranean Sea can be divided into the sub-regions of Western Mediterranean, Eastern Mediterranean, and the Adriatic Sea. Italy represents the border between the Western and Eastern Mediterranean [4]. Additionally, to understand the dynamics of the Mediterranean Sea, it is important to consider the cruise traffic in the cruise ports of the Atlantic Ocean located close to the Mediterranean Sea since these have an influence on the traffic of the Mediterranean. Table 1 shows the ports that compose the sample analyzed in this research and their key performance indicators of cruise shipping during the period 2015–2019 [4,38,39,40,41,42,43,44,45,46,47,48,49,50]. The ports were selected considering their traffic and the availability of data.

Table 1.
Key performance indicators of cruise shipping of the ports of the sample during the period 2015–2019.
The database of cruise ship calls analyzed includes, among other information, vessel name and last and next port of call of each registered ship call, which are the most important data to address the present research. Data processing has been an important step in this research. First, the data were cleaned prior to analyzing them because the data comes from different ports and with different formats. The data-cleaning consisted of unifying the data under the same format and language. Through this process, the data were normalized and standardized in order to be able to introduce them into the software that was used and thus be able to analyze them. The database was composed of 47,567 cruise calls. Next, each cruise call was classified by a segment of service of the cruise line. Specifically, six segments have been considered in the classification: budget, contemporary, premium, upper-premium, luxury, and expedition. Table 2 shows the results of the classification of the cruise call database by segment of service. The research focuses on contemporary segments because it registered the highest activity in the sample of ports during the period 2015–2019; in addition, the contemporary vessels represent the most significant share of the entire cruise fleet [51].
Table 2.
Number of cruise calls by segment of service registered in the ports of the sample during the period 2015 to 2019.
Once the data were cleared, they make up a table of n rows and three columns, where n is the number of calls, the first column is the port from which the data are known, while the second and third columns are the port of origin and destination of the cruise, respectively. However, network analysis software cannot interpret this table; then, the data has to be represented in another way, specifically in matrix form. In the matrix, the rows indicate the port of origin, and the columns show the port of destination. Therefore, an x value in position m, n of the matrix indicates that for that year, there were x cruise ships that sailed from m to n.
3.2. Methods
One of the main applications of SNA is to determine the main actors in a network. SNA metrics can be divided into two main groups based on the level of analysis, the node or the network level. A network consists of nodes and ties that connect these nodes, but in a social network, the nodes also can make choices that affect the whole network. Centrality is a parameter that indicates the individual importance of the nodes within the network, and often it is used to find the network actors. A node whose centrality is high will be important within the network.
The strength of SNA comes from its potential for an immense system that can be applied to many domains [52]. Several works point out the advantages of SNA for the study features of a network. For instance, quantitative derivative data can be reflected in tables and graphs, thereby allowing for an overview of an entire network [53]. The presentation of information in a visible format eases the comprehension of connections between the nodes of a network structure [54]. Therefore, SNA is an outstanding methodology that can provide valuable data on the structural characteristics of the contemporary cruise port network in Southern Europe.
SNA has been applied in a wide range of disciplines because it is considered an accurate and suitable tool to solve problems in areas such as tourism, transportation, and oil and gas infrastructure. Martini and Buffa [55] applied SNA to study the links and connections between stakeholders in tourism to determine the evolving dynamic of networks and the relative weights of the decision makers. Chai et al. [56] used SNA to determine critical infrastructures in the Oil and Gas industries. Noble et al. [57] studied marine spatial management through the application of SNA. Mou et al. [58] analyzed spatiotemporal patterns of maritime trade applying SNA. According to Kim et al. [59], SNA offers many quantitative metrics that qualitative approaches cannot by producing various network metrics that allow a comprehensive analysis of the networks. Furthermore, SNA is intended to provide a quantitative analysis of the relationships between actors by investigating network structures and the dynamics which develop within them [55]. For instance, SNA determines the roles of the individual nodes and their relative importance with respect to others in the same network. In the present research, the dynamics of the contemporary cruise port network in Southern Europe are determined through the analysis of data of cruise ship calls for 5 years using SNA as an analysis technique.
3.2.1. Social Network Analysis Applied to Shipping Industry
Container traffic is an area in which port relationships have been extensively investigated. Ducruet [60] applied several network metrics to observe the global configuration of ports. This study showed that the most diversified ports are, on average, larger, more central, and more dominant in the network; in addition, they are also connected at greater physical distances than more specialized ports. Primarily, the investigations in which SNA is applied are more focused on container traffic than on cruise traffic. Using SNA, Jeon et al. [61] studied trends in port competition to identify the evolution between 1980 and 2015. These relationships have been gaining in complexity over time; in fact, the study of Jeon et al. [61] suggests an evolution from a competitive relationship to one that combines cooperation and competition between ports. Furthermore, supply chains have also been increasing in complexity, confirming that the relationship between ports has become more sophisticated and complex.
An example of research applying SNA to cruise shipping can be found in the work of Jeon et al. [29], which highlights the centrality of the port and its attractiveness within the network in the Asian cruise market. The aforementioned research raises an index that estimates the attractiveness of the cruise port within the network. According to this study, a strong connection with important ports makes a port more attractive.
However, there are certain limitations regarding the use of SNA. In this sense, Ducruet [60] states that, unlike in social networks, ports cannot be considered as own entities that can make their own decisions. In this case, ports are more like a part of a broad community where there are multiple interests, and the logistics chain and global and national transport agents participate too.
In cruise ship traffic, as in container traffic, it is important to establish a unified framework where the centrality of ports is correctly measured and how ports are positioned with respect to others in terms of competitiveness both individually and in subgroups [62]. This is crucial in the configuration of the key element of cruise shipping, the itinerary. Therefore, through the application of SNA, the results of this research should provide cruise lines and ports with important information to make strategies to attract more passengers in the development of new itineraries. Taking the previous studies as a reference, it is possible to review the most popular measures of centrality developed in SNA in order to improve the applicability of centrality measurement.
There are several types of metrics at the node level. Node metrics measure centrality and identify the importance of the nodes in various aspects: centrality degree, betweenness centrality, and hub and authority centrality.
3.2.2. Centrality Degree Metric
The centrality degree is the most intuitive to understand as it measures the number of connections of a node with the others in the network. According to Freeman [63], centrality degree is calculated as the sum of the nodes connected to other nodes in the network. In this case, the node refers to a cruise port, and centrality degree (CD (i)) is defined as follows:
where Xij is equal to 1 if node i and node j are connected, or 0 otherwise. Therefore, CD (i) is the number of ports that are connected to node ni.
3.2.3. Betweenness Centrality Metric
Betweenness centrality measures if a node act as an intermediary agent in the network structure. Hence, the betweenness centrality measures the frequency with which a node is on the shortest paths between all combinations of pairs of nodes. This metric is calculated as can be seen in Equation (2) [63].
where gjk (ni) is the number of connections between nj and nk that pass-through node ni and gjk is the number of connections that exist between two nodes nj and nk. For a better comparison between different networks, these metrics are normalized using the proportion of nodes that exist in each network [59].
where g is the number of nodes in the network.
Additionally, SNA also considers metrics about the network structure, such as network density, network centralization, and network complexity. Network density is about the number of ties in a network relative to the number of potential ties [64]. Network centralization estimates if the network is organized around particular nodes of the network [65]. A network has a centralized structure if most of the connections go through few central nodes; in other words, the network will have star structure. These last two metrics are complementary since a network with a high number of connected nodes will have a higher density and less centralization. Network complexity measures the number of dependency relations within a network, and this metric depends on the number of nodes in the network and the degree of connections between them. The greater number of nodes and connections, the more complex the network becomes [66]. All these metrics depend on each other. The more density in a network, the more complex since it requires a greater analysis effort. Additionally, if a network has a low centralization, it will be more complex because there will be many nodes connected to all other nodes.
In this work, the specialized software for network analysis UCINET 6.0 has been used to represent the networks and obtain some of the metrics [67]. UCINET 6.0 allows not only obtaining the centrality degree and the density of the network, but also to represent the nodes and their connections in the network. Furthermore, the node-level measures have been calculated both with UCINET 6.0 (betweenness centrality) and Octave [68] (centrality degree).
3.2.4. Hub and Authority Centrality
It is interesting to know how nodes are influenced by the other nodes to which they are connected. This allows a better understanding of both the network and its dynamics. The centrality metrics, such as the centrality degree or betweenness centrality seen in Section 3.2.2 and Section 3.2.3, do not consider which nodes connect with the most relevant. The measurements represented by the SNA, therefore, assume that all connections are equal and do not consider the importance of relationships with important nodes. Nevertheless, the impact that a node produces can be highly different depending on its importance in the network. For example, a cruise port may be attractive due to its proximity to an airport; therefore, this port will have a higher impact rather than another that does not have this facility. Consequently, it is not entirely correct to consider that all connections have the same influence.
Following Jeon et al. [29], the hub centrality and authority metrics of a particular node increase if it is related to relevant nodes in the network and vice versa; the relevant nodes will be more important if they are connected to nodes whose metrics are high. This means that hubs and authorities’ centrality metrics increase collectively. The relationship between nodes can be calculated through a centralized analysis of the eigenvector, while the hubs’ and authorities’ centrality metrics are calculated through the normalization of the eigenvector in a centralized way.
Kleinberg [69] proposed an iterative algorithm that allows calculating for the hubs and authorities and updates numerical weights for each node with each iteration. Each port is associated with a non-negative authority weight x<p> and non-negative hub weight y<p>. For a better comparison, these measurements are normalized; that is, their squares sum to one. The better authority, the higher x, and the greater hub, the higher the y-value. Sσ refers to the set of nodes in the network.
where x<p> and y<p> are the authority and hub weight for each node, respectively.
The collective reinforcement of the nodes between hubs and authorities works as follows: If p nodes are connected to one node with high x values, then it would receive a high y value, and vice versa, if a node is connected to many nodes with high y value, then it should receive a high x value. Because of this, it is possible to define two operations on the weights, which are denoted by Ψ and Φ. Given the weights vectors {x<p>} and {y<p>} the Ψ operation updates the x weights as follows:
The Φ operation updates the y weights as follows:
To find the equilibrium for weights, Equations (7) and (8) must be applied alternatively, starting an iterative process to ensure that the correct values have been reached. The weights of both x and y give an idea of how important the ports connected to it are which it sends from or which it receives cruise ships from, respectively. Furthermore, a port will not have a weight of x if it does not receive cruise ships from any port, even if it generates traffic, acting as a pure hub. Additionally, a port that does not send traffic and only receives its weight of y will be zero, being a pure authority. Given that cruise ships operate as a regular line service, with the itinerary acting as the core element, most ports will have weight in x and y, acting as authority and hub simultaneously. Figure 1 summarizes the different combinations of hub and authority that could exist.
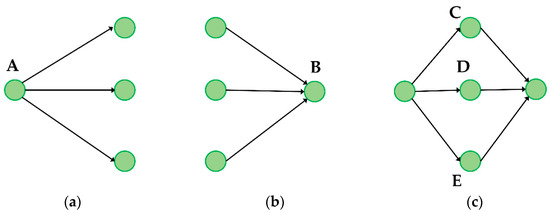
Figure 1.
Authority centrality and hub centrality within a network. (a) A, a pure hub; (b) B, a pure authority; and (c) C, D, and E as hubs and authorities. Source: Authors elaboration.
A high hub centrality implies that the port has a connection to high-impact ports, whereas a high authority centrality means that the port receives cruise services from high-impact ports [70]. According to Jeon et al. [29], these two metrics reflect the attractive ports but do not identify the flow of cruise traffic in these ports. Because of this, they proposed a metric called Hub and Authority Combined Centrality (HACC) or, in short, Hub Index (Equation (9)) to reflect the volume of cruise traffic in a particular port.
where is the number of cruise calls in a particular node, while is the number of cruise calls at the port with the maximum number of calls, and xk and yk are the authority and hub weight, respectively. Figure 2 shows how the research is conducted.
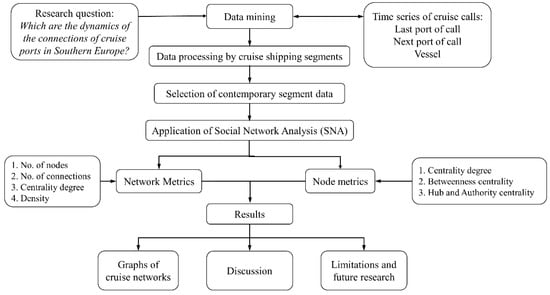
Figure 2.
Diagram of the process carried out in the research. Source: Authors elaboration.
4. Results
4.1. Network Level Metrics
Ports that make up the network and the relationships between them reveal the evolution of the networks. Table 3 shows the progression of the contemporary cruise port network in Southern Europe during the period analyzed. As mentioned in Section 3.2, SNA analysis provides two types of results depending on the level of study: the network level and the node level. The number of connections refers to the number of ports with which one port connects. In terms of programming this metric, the link between ports is binary. A port that connects with another will have a value of one regardless of the traffic intensity between them; otherwise, it will be zero. The calculation of the centrality degree is different depending on the considerations of the connections. If the links between ports introduce orientation, the results will be two, i.e., out and in centrality. Otherwise, if we consider the links in the network with no directions, the result will be the centrality degree.
Table 3.
Mean network level metrics in contemporary cruise port network of Southern Europe during the period 2015–2019.
Contemporary cruises host the general public—the largest vessels are associated with this segment and have the widest entertainment options and variety of amenities. On the one hand, the number of nodes and connections increased during the period analyzed. The number of nodes was 19.1% higher in 2019 than in 2015, and the number of connections was 26.7% higher in 2019 than in 2015. On the other hand, density in this segment had an average value of 0.025 from 2015 to 2019. The results do not reflect relevant changes in the density of the network, see Table 3. The null variation of the density of the network is explained by the increase in both the number of nodes and connections. Additionally, the centrality degree fluctuated during the period analyzed, with an average value of 0.236. The same trend was obtained when orientation between nodes was considered; both out- and in-centrality fluctuated along the period analyzed with an average value of 0.190 and 0.168, respectively.
4.2. Node Level Metrics
The node level metrics should be analyzed each year separately because there were changes in the relevant ports each year during the period studied. As pointed out in Section 4.1, considering orientation in the links of the network, the centrality degree can be separated into outgoing centrality degree and incoming centrality degree. Outgoing centrality degree indicates the sent or generated flow, and the incoming centrality degree means the received flow [59].
4.2.1. Outgoing and Incoming Centrality Degree
The Western Mediterranean is the main European destination region in terms of cruise traffic registered. Table 4 and Table 5 show the 15 ports with the highest outgoing and incoming centrality degree during the period 2015–2019. Palma de Mallorca and Barcelona are the two first ports in terms of generated and received flow; both are located in the Western Mediterranean. In addition, the difference between these two ports and the third, Dubrovnik, is considerably high. The generated and received flow in Barcelona and Palma de Mallorca have over 300 connections per year during the period analyzed. Moreover, the Greek ports of Mykonos, Thira-Santorini, and Piraeus are highlighted due to the growing trend registered. In contrast, in the port of Valencia, the generated and received flows have reduced during the last two years of analysis. It should be noted that no Atlantic ports appear among the top 15 ports in terms of generated and received flow, see Table 4 and Table 5.
Table 4.
Top 15 ports in terms of generated flow and its evolution from 2015 to 2019 in the contemporary cruise port network in Southern Europe.
Table 5.
Top 15 ports in terms of received flow and its evolution from 2015 to 2019 in the contemporary cruise port network in Southern Europe.
4.2.2. Incoming and Out-Coming Degree
Table 6 and Table 7 show the 15 ports with the highest incoming and out-coming degrees, respectively. In this case, for both metrics, the first 4 ports have similar values. Barcelona is the port that connects with the highest number of different ports. The average value obtained for the out-coming degree is relevant with connections to 27 different ports. Among the remaining 11 top ports, there are no vast differences. Moreover, the Atlantic ports of Lisbon and Funchal are situated in the top 15 positions of the table for both metrics. The presence of Atlantic ports in relevant positions has mainly two implications. First, the contemporary segment requires high-class port facilities; this leads to tight itineraries making it difficult to dock in other ports. Second, these results reveal the function of the Atlantic region as a transit area, where the cruise traffic registered is low if it is compared with that registered in the Mediterranean Sea; however, the number of connected ports is high.
Table 6.
Top 15 ports in terms of incoming degree and its evolution from 2015 to 2019 in the contemporary cruise port network in Southern Europe.
Table 7.
Top 15 ports in terms of out-coming degree and its evolution from 2015 to 2019 in the contemporary cruise port network in Southern Europe.
4.2.3. Betweenness Centrality
Betweenness centrality is effective in discovering which ports have a transition function; in other words, this parameter is suitable to determine which ports connect two or more different destination regions. Table 8 shows the top 15 ports with the highest betweenness centrality in the contemporary cruise network of the sample of ports analyzed. These results show several trends in the cruise market of Southern Europe. First, Barcelona has a remarkable role as a transit port in the Western Mediterranean. It distributes traffic to the itineraries that sail to the east and south parts of the Western Mediterranean. Second, Lisbon has registered an increase in the betweenness centrality, which has consolidated it as the main transit port between Northern Europe and the Atlantic region close to the Mediterranean Sea. Furthermore, Amsterdam and Malaga have had similar evolution of this metric, which has led them to become relevant connecting ports in the Northern European and the Mediterranean areas, respectively. Specifically, the role of Málaga is associated with connecting itineraries from the Atlantic Ocean to the Western Mediterranean and vice versa.
Table 8.
Top 15 ports in terms of betweenness centrality and its evolution from 2015 to 2019 in the contemporary cruise port network in Southern Europe.
4.2.4. Hub Index
Table 9 shows the top 15 ports with the highest xk (authority) and yk (hub) weights. The results reveal that Palma de Mallorca, although both metrics have similar values, it has a slightly higher weight as a hub. In contrast, the port of Barcelona has higher values as an authority. The weights of the hub and authority of the port of Valencia fluctuate along the period analyzed, and both have similar values; it cannot be stated that it has a clear role as an authority or hub. The evolution of the port of Marseille differs with respect to that of the first three ports. Marseille highlights as a hub during the period 2015–2017, whereas during 2018 and 2019, it changed its role to authority. Additionally, the ports of Valletta and Cannes stand out as authorities throughout the entire period analyzed. Furthermore, the remaining nine ports show balanced weights of hub and authority, not highlighting one of the roles in particular.
Table 9.
Top 15 ports in terms of authority and hub weights and its evolution from 2015 to 2019 in the contemporary cruise network in Southern Europe.
Table 10 shows the 15 ports with the highest hub index. If we classify as hub ports those that have a hub index higher than the average of the top 15 ports (0.1089), four ports meet this criterion. As a result, the ports of Palma de Mallorca, Barcelona, Valencia, and Marseille have been classified as hub ports. The supremacy of the ports of Palma de Mallorca and Barcelona was highlighted. Specially, the position of Palma de Mallorca in the center of the Western Mediterranean allows it to distribute cruise traffic around the Mediterranean. The fourth position of the French port of Marseille is mainly due to its strong connection with the first three ports of the ranking. Additionally, the increase in cruise traffic flow registered during 2019 in the ports of Mykonos and Santorini explains the sudden increase in their hub index, it has also influenced the increase of the hub index of the remaining Eastern Mediterranean ports of Corfu and Piraeus, see Table 10.
Table 10.
Top 15 ports in terms of hub index and its evolution from 2015 to 2019 in the contemporary cruise network in Southern Europe.
5. Discussion
Figure 3, Figure 4, Figure 5, Figure 6 and Figure 7 confirm the trends presented in Section 4 and show the interrelations of the contemporary cruise port network. In the development of the research, we have faced the difficulty of the unavailability of the information of some ports that register high cruise traffic activity, such as Civitavecchia, Marseille, Naples, or Venice. Barcelona, Palma, Marseille, and Valencia are four of the most relevant European ports in the contemporary cruise port network. Barcelona and Palma have higher metrics than the following ports in terms of outgoing and incoming centrality degree, incoming and out-coming degree, and hub index. Despite this, both ports show an evolution, with very low variation of their metrics. Furthermore, although the time series of cruise calls of Marseille could not be analyzed, this French port represents a key performer in contemporary cruise shipping in Southern Europe. Specifically, the strong connection with Barcelona and Palma de Mallorca explains the relevant position obtained for Marseille, see Figure 3, Figure 4, Figure 5, Figure 6 and Figure 7. Additionally, the intense connections between Barcelona and Palma de Mallorca and Marseille and Valencia lead to the high hub index obtained for the last two ports. Graphs reveal that these ports are key performers of the cruise traffic in the Western Mediterranean. The results lead to strong connections between Barcelona, Marseille, Valencia, and Palma de Mallorca. These connections are repeated year after year, see Figure 3, Figure 4, Figure 5, Figure 6 and Figure 7. In addition, these four ports connect with ports situated in the Atlantic Ocean and in the eastern part of the Mediterranean. For instance, in 2018, Barcelona had connections with Santa Cruz de Tenerife in the Atlantic Ocean and Valletta in the central part of the Mediterranean, see Figure 6.
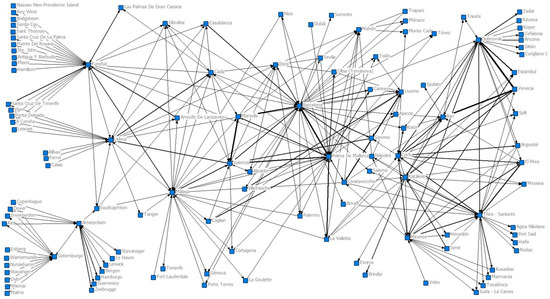
Figure 3.
Interrelations in the contemporary cruise port network of Southern Europe in 2015. Source: Authors elaboration. Note: The thickness of the lines indicates the traffic intensity between ports.
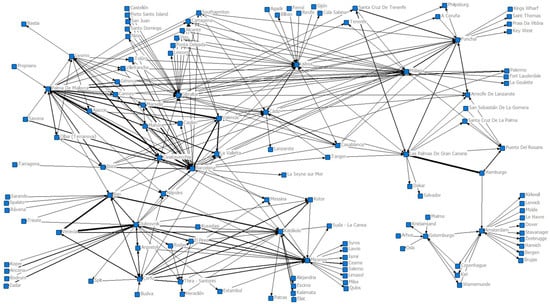
Figure 4.
Interrelations in the contemporary cruise port network in Southern Europe in 2016. Source: Authors elaboration. Note: The thickness of the lines indicates the traffic intensity between ports.
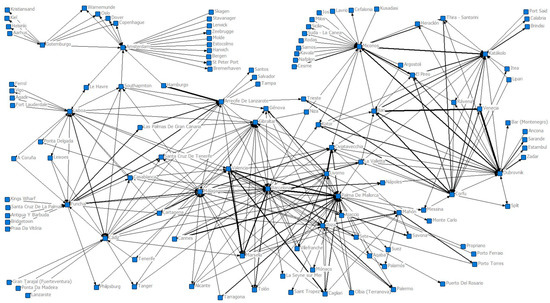
Figure 5.
Interrelations of contemporary cruise port network in Southern Europe in 2017. Source: Authors elaboration. Note: The thickness of the lines indicates the traffic intensity between ports.
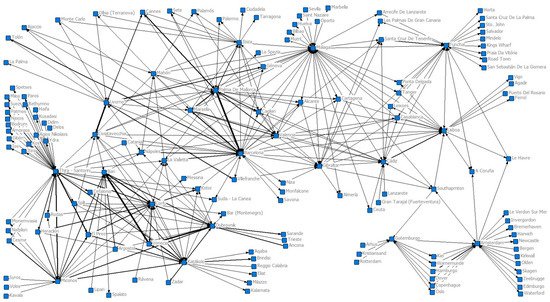
Figure 6.
Interrelations of contemporary cruise port network in Southern Europe in 2018. Source: Authors elaboration. Note: The thickness of the lines indicates the traffic intensity between ports.
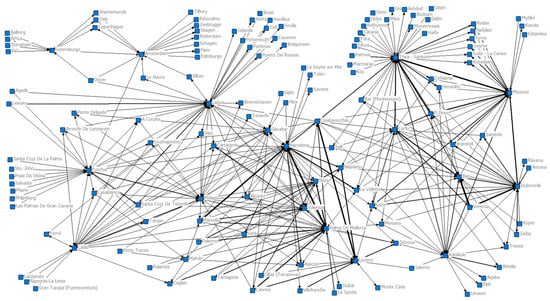
Figure 7.
Interrelations in contemporary cruise port network in Southern Europe in 2019. Source: Authors elaboration. Note: The thickness of the lines indicates the traffic intensity between ports.
The two most important ports in the Adriatic Sea are Dubrovnik and Venice. The flow of cruises in these two ports is high enough to put them among the ten most visited ports. On the one hand, the strongest connections are with ports situated on the shores of the Adriatic Sea. For instance, connections between Dubrovnik, Venice, and Bari are the most relevant, see Figure 4. They are separated by proper sailing distances leading to a sailing time of approximately 7–8 h, which explains the intensity of the connections between them. On the other hand, betweenness metrics are low because this area acts as a destination region in itself. The sailing distance to reach the gateway of the Adriatic Sea that connects to the Western and Eastern parts of the Mediterranean makes it difficult for the Adriatic ports to connect with ports of the adjacent areas of the Mediterranean. Therefore, the betweenness centrality becomes lower. In this sense, only the port of Dubrovnik ranks among the top 15 ports in terms of betweenness centrality. It serves as an intermediate call in itineraries that sail between the north and south parts of the Adriatic Sea. Although, some connections with ports of the Eastern Mediterranean are identified, for instance, with the ports of Corfu, Katakolo, and Piraeus, see Figure 5. The results obtained indicate that there are itineraries only composed of Adriatic ports and those that combine Adriatic ports and ports of the Eastern Mediterranean.
Santorini, Mykonos, and Piraeus are must-see ports in the Eastern Mediterranean. The flow of contemporary cruises and the centrality degree rose in these three Greek ports during the period analyzed, especially in Santorini in 2019. There has been an expansion in the Eastern Mediterranean market because of the higher number of connections there, especially between Santorini and Mykonos. In addition, the connections to and from Mykonos, Santorini, and Piraeus are, basically, with ports of the Eastern Mediterranean, see Figure 6 (lower left corner). The need to reach a balance between sailing distance, length of the itinerary, and call at attractive ports in the contemporary segment may explain the greater number of connections that Eastern Mediterranean ports register among them, but not with ports of other areas. Moreover, the lack of connections between ports of the Eastern and Western Mediterranean is explained by the excessive itinerary’s length for the contemporary segment.
In addition, Civitavecchia, Naples, Ajaccio, and Valletta have the role of transit ports because they connect the contemporary cruise traffic between the Western and Eastern Mediterranean Sea. These ports connect with the most relevant ports in both regions, for instance, in the west with Barcelona, Palma de Mallorca, and Gibraltar, and in the east with Santorini, Corfu, and Katakolo. The role of transit ports is also observed in ports of Northern Europe. Southampton, Amsterdam, and Hamburg act as transit ports in that region, connecting with ports of the Atlantic Ocean, see Figure 3 (lower left corner) and Figure 4 (central upper side). The results also highlight the role of the ports of the Atlantic façade in interconnecting ports of the Caribbean Sea, Northern Europe, and Mediterranean Sea. Among them, the ports of Funchal, Gibraltar, and Lisbon are highlighted, see Figure 5 and Figure 6.
The most relevant ports, according to the average incoming degree for the period from 2015 to 2019, are Barcelona (23), Palma de Mallorca (20), Málaga (20), Lisbon (19), and Santorini (15). In the case of outgoing degree, the ports with the highest metric during the period from 2015 to 2019 are Barcelona (27), Málaga (21), Palma de Mallorca (20), Lisbon (19), and Dubrovnik (16). The above results reflect the huge impact of cruise shipping from/to a specific port; it has two effects: the number of different ports that each port connects to and the number of times a specific connection is repeated. For instance, according to the results obtained, 27 ports (318 interrelations) are connected in the flow initiated from Barcelona, and 23 ports (333 interrelations) are connected in the flow received by Barcelona.
The betweenness centrality is a metric that could be unnoticed, but it can identify some behavior patterns in the network that are relevant. Barcelona (0.143), Lisbon (0.126), Amsterdam (0.106), Malaga (0.105), and Santorini (0.086) are the most important ports in terms of betweenness centrality. Moreover, Civitavecchia is the port with the highest betweenness centrality degree, whose results are obtained from the analysis of ports with available data; specifically, it has the twelfth highest betweenness centrality degree (0.055). Therefore, the contemporary cruise segment operates around Barcelona, Civitavecchia, and Malaga in the Western Mediterranean Sea. Amsterdam has a similar role in Northern Europe, as with Lisbon in the area of the Atlantic Ocean close to the Mediterranean, and Santorini in the Eastern Mediterranean.
From the point of view of hub and authority roles, Palma de Mallorca is considered a hub port because it has the highest hub index. Specifically, the results of Palma de Mallorca can be interpreted as it has cruise service to high-impact ports based on the yk values obtained. In contrast, the explanation of the classification of Barcelona as an authority port is explained by two indicators. First, it has the highest number of cruise calls of the ports analyzed. Second, the values of xk obtained mean that Barcelona receives cruise services from impact ports. In addition, the evolution of the port of Marseille regarding its role as a hub and authority should be noted. During the period 2015–2017, its activity was mainly associated with services to high-impact ports. This trend changed in 2018 and 2019 to higher values of xk than yk; therefore, its role is more associated with authority than with hub.
The results obtained in this research could be of interest to itinerary planners to identify the roles of the different ports in Southern Europe. These results are interesting for developing new itineraries that face the new challenges that the COVID-19 pandemic has introduced to the cruise industry, especially in terms of the flow generated and received in each port, the inter-port relationships of the contemporary cruise port network in Southern Europe, and the intensity of inter-port relationships. Specifically, the results obtained in this work could be the basis for developing research on the carrying capacity of ports and designing itineraries that seek to avoid overcrowded destinations, which is one of the main challenges faced by post-pandemic cruising.
Furthermore, through the inter-port relationships and connections obtained in this work, the design of new itineraries focusing on repeat cruise passengers could be addressed. Regaining the confidence of cruise passengers after the COVID-19 pandemic is another issue to address [71]; the values of centrality degree obtained could be considered to develop attractive new products based on new ports. In addition, the inter-port relationships mapped (Figure 3, Figure 4, Figure 5, Figure 6 and Figure 7) could be of interest to the stakeholders of the supply chain of the cruise industry to assess their impact and seek new areas of influence. Finally, a graphical representation of inter-port relationships could be used in studies of environmental assessment of cruise traffic.
6. Conclusions
The following conclusions can be highlighted from the conducted research:
- The contemporary cruise port network in Southern Europe is dynamic; during the period 2015–2019, it increased the number of nodes and connections. Therefore, the network has become more complex.
- The system of itineraries of the cruise shipping makes all ports of the network register outgoing and incoming centrality degree.
- The cruise traffic generated in a port has an impact on several ports. According to this research, two effects are identified, (1) the number of different ports to(from) which each port generates(receives) traffic, and (2) the intensity of the connections between pairs of ports.
- The port of Barcelona is a key performer in contemporary cruise shipping in the Western Mediterranean (the highest values of incoming and out-coming degree and authority centrality), but it also receives and generates cruise traffic from and to other cruise regions (the highest betweenness centrality), especially to the Atlantic Ocean.
- Depending on the port, betweenness centrality results are associated only with traffic from one cruise region, or it means the role of the port as a transit port to another cruise region in which the vessel will operate in regular itineraries.
- At least four ports in Southern Europe can be classified as hub ports, i.e., Palma de Mallorca, Barcelona, Valencia, and Marseille.
- The port of Palma de Mallorca stands out as a hub port, with a remarkable character of service to high-impact ports.
- The ports of the Atlantic Ocean close to the Mediterranean Sea show high values of incoming and out-coming degrees but low intensity in the connections. This region acts as an intermediate call associated with repositioning sailings to and from the Mediterranean Sea, which explains the result obtained.
The unavailability of the time series of cruise ship calls in some ports with high cruise activity was the main limitation of the present research. Although the time series was requested, it was unable to retrieve them. Therefore, a future research line is proposed for the enlargement of the sample of ports, focusing especially on those ports that concentrate high rates of cruise activity in Southern Europe, such as Civitavecchia, Marseille, Venice, and Piraeus. Furthermore, the future development of the present research is to conduct the analysis by month with the aim of identifying different dynamics depending on the season of the year. This future research line seeks to determine the influence of the seasonality of cruise traffic on the dynamics of the centrality of the cruise port network. Finally, future research focused on luxury and expedition segments could be addressed and compare those results with that obtained in the present research for the contemporary segment. This future research line is based on the current growing trend of the order book of cruise ships for the luxury and expedition segments.
Author Contributions
J.E.-P. and M.d.R.-G. are the originators of the initial idea for the work. M.d.R.-G. provided the introduction and the state of the art of the literature. J.E.-P. consolidated the methodology and presented the results. J.E.-P. and M.d.R.-G. has addressed the discussion of the results. All authors analyzed the data, performed the formal analysis, presented the conclusions, and participated in the writing and revising of the manuscript. All authors have read and agreed to the published version of the manuscript.
Funding
This research received no external funding.
Institutional Review Board Statement
Not applicable.
Informed Consent Statement
Not applicable.
Data Availability Statement
Data sharing not applicable.
Conflicts of Interest
The authors declare no conflict of interest.
References
- Rodrigue, J.P.; Notteboom, T. The geography of cruises: Itineraries, not destinations. Appl. Geogr. 2013, 38, 29–32. [Google Scholar] [CrossRef]
- Cruise Market Watch. Growth of the Ocean Cruise Line Industry. 2021. Available online: https://cruisemarketwatch.com/growth/ (accessed on 30 November 2021).
- Radic, A. Towards an understanding of a child’s cruise experience. Curr. Issues Tour. 2019, 22, 237–252. [Google Scholar] [CrossRef]
- MedCruise. Cruise Activities in MedCruise Ports: Statistics Report 2019; MedCruise: Santa Cruz de Tenerife, Spain, 2020. [Google Scholar]
- Cruise Lines International Association (CLIA). 2019 Cruise Trends & Industry Outlook; CLIA: Washington, DC, USA, 2019.
- McCarthy, J. The Cruise Industry and Port City Regeneration: The Case of Valletta. Eur. Plan. Stud. 2003, 11, 241–350. [Google Scholar] [CrossRef]
- Cruise Lines International Association (CLIA). The Economic Contribution of the International Cruise Industry Globally in 2019; CLIA: Washington, DC, USA, 2020.
- Chase, G.; Alon, I. Evaluating the economic impact of cruise tourism: A case study of Barbados. Anatolia 2002, 13, 5–18. [Google Scholar] [CrossRef]
- Lohmann, G.; Albers, S.; Koch, B.; Pavlovich, K. From hub to tourist destination—An explorative study of Singapore and Dubai’s aviation-based transformation. J. Air Transp. Manag. 2009, 15, 205–211. [Google Scholar] [CrossRef] [Green Version]
- Esteve-Perez, J.; Garcia-Sanchez, A.; Muñoz-Paupie, A. Cruise traffic seasonality patterns in the Western Mediterranean and the Adriatic Sea: A Challenge to Port Operators. Coast. Manag. 2019, 47, 362–386. [Google Scholar] [CrossRef]
- European Commission. Tourist Facilities in Ports: Growth Opportunities for the European Maritime Economy: Economic and Environmentally Sustainable Development of Tourist Facilities in Ports; Office for Official Publications of the European Communities: Luxembourg, 2009. [Google Scholar] [CrossRef]
- Business Research and Economic Advisors (BREA). The Contribution of the North American Cruise Industry to the U.S. Economy in 2004; BREA: Phillipsburg, NJ, USA, 2005. [Google Scholar]
- Vina, L.; Ford, J. Economic impact of proposed cruise ship business. Ann. Tour. Res. 1998, 25, 205–221. [Google Scholar]
- Peisley, T. Cruising: A global view of the challenge and the opportunity. In Proceedings of the International Association Cities and Ports Days, Le Port, France, 19–22 November 2003. [Google Scholar]
- Brida, J.; Zapata, S. Cruise tourism: Economic, socio-cultural and environmental impacts. Int. J. Leis. Tour. Mark. 2009, 1, 205–226. [Google Scholar] [CrossRef]
- Soriani, S.; Bertazzon, S.; Cesare, F.D.; Rech, G. Cruising in the Mediterranean: Structural aspects and evolutionary trends. Marit. Policy Manag. 2009, 36, 235–251. [Google Scholar] [CrossRef]
- Asero, V.; Skonieczny, S. Cruise tourism and sustainability in the Mediterranean: Destination Venice. In Mobilites, Tourism and Travel Behaviour—Contexts and Boundaries; Butowski, L., Ed.; IntechOpen Limited: London, UK, 2017; pp. 93–106. [Google Scholar]
- Toneatti, L.; Deluca, C.; Fraleoni Morgera, A.; Piller, M.; Pozzetto, D. Waste to Energy Onboard Cruise Ships: A New Paradigm for Sustainable Cruising. J. Mar. Sci. Eng. 2022, 10, 480. [Google Scholar] [CrossRef]
- Ruban, D.A.; Yashalova, N.N. Corporate Pro-Environmental Behavior on the Seas: Eco-Ethical Prescriptions of the Largest Cruise Companies. J. Mar. Sci. Eng. 2022, 10, 380. [Google Scholar] [CrossRef]
- González, A. Venice: The problem of overtourism and the impact of cruises. J. Reg. Res. 2018, 42, 35–51. [Google Scholar]
- Butt, N. The impact of cruise ship generated waste on homeports and port of call: A study of Southampton. Mar. Policy 2007, 31, 591–598. [Google Scholar] [CrossRef]
- Tzannatos, E. Ship emissions and their externalities for the port of Piraeus—Greece. Atmos. Environ. 2010, 44, 400–407. [Google Scholar] [CrossRef]
- Santos, T.A.; Martins, P.; Guedes Soares, C. Characterization of the cruise ship fleet calling in the port of Lisbon. In Developments in Maritime Technology and Engineering; Guedes Soares, C., Santos, T.A., Eds.; Taylor and Francis: London, UK, 2021; Volume 1, pp. 91–100. [Google Scholar]
- Lau, Y.-Y.; Sun, X.; Yang, W.; Kanrak, M. Chinese Cruisers’ Preference, Travel Constraints, and Behavioural Intention: Experience from the Arctic Cruise Market. J. Mar. Sci. Eng. 2022, 10, 156. [Google Scholar] [CrossRef]
- Cao, M.; Liu, Y.; Gai, T.; Zhou, M.; Fujita, H.; Wu, J. A Comprehensive Star Rating Approach for Cruise Ships Based on Interactive Group Decision Making with Personalized Individual Semantics. J. Mar. Sci. Eng. 2022, 10, 638. [Google Scholar] [CrossRef]
- Zhang, N.; Miao, R.; Huang, H.; Chan, E.Y. Contact infection of infectious disease on board a cruise ship. Sci. Rep. 2016, 6, 38790. [Google Scholar] [CrossRef]
- Esteve-Perez, J.; Garcia-Sanchez, A. Dynamism patterns of Western Mediterranean cruise ports and the coopetition relationships between major cruise ports. Pol. Marit. Res. 2018, 25, 51–60. [Google Scholar] [CrossRef] [Green Version]
- Lorenčič, V.; Twrdy, E.; Batista, M. Development of Competitive–Cooperative Relationships among Mediterranean Cruise Ports since 2000. J. Mar. Sci. Eng. 2020, 8, 374. [Google Scholar] [CrossRef]
- Jeon, J.W.; Duru, O.; Yeo, G.T. Cruise port centrality and spatial patterns of cruise shipping in the Asian market. Marit. Policy Manag. 2019, 46, 257–304. [Google Scholar] [CrossRef]
- Esteve-Perez, J.; Garcia-Sanchez, A. Determination of seasonality patterns in the transport of cruise travelers through clustering techniques. J. Navig. 2019, 72, 1417–1434. [Google Scholar] [CrossRef]
- Lee, S.; Ramdeen, C. Cruise ship itineraries and occupancy rates. Tour. Manag. 2013, 34, 236–237. [Google Scholar] [CrossRef]
- Sigala, M. Cruise itinerary planning. In Cruise Ship Tourism, 2nd ed.; Dowling, R., Weeden, C., Eds.; CABI: Egham, UK, 2017; pp. 524–545. [Google Scholar] [CrossRef]
- Liu, B.; Pennington, G.L.; Klemmer, L. Using social media in hotel crisis management: The case of bed bugs. J. Hosp. Tour. Technol. 2015, 6, 102–112. [Google Scholar] [CrossRef]
- World Tourism Organization (WTO). Cruise Tourism: Current Situation and Trends. Available online: https://www.e-unwto.org/doi/book/10.18111/9789284413645 (accessed on 30 April 2021).
- Rodrigues da Silva, A.L. An overview of the impact of COVID-19 on the cruise industry with considerations for Florida. Transp. Res. Interdiscip. Perspect. 2021, 10, 100391. [Google Scholar] [CrossRef]
- Mallapaty, S. What the cruise-ship outbreaks reveal about COVID-19. Nature 2020, 580, 18. [Google Scholar] [CrossRef] [PubMed] [Green Version]
- Tidbury, H.; Taylor, N.; van der Molen, J.; Garcia, L.; Posen, P.; Gill, A.; Lincoln, S.; Judd, A.; Hyder, K. Social network analysis as a tool for marine spatial planning: Impacts of decommissioning on connectivity in the North Sea. J. Appl. Ecol. 2020, 57, 566–577. [Google Scholar] [CrossRef] [Green Version]
- Las Palmas Port Authority. Cruise Ship Statistics. 2020. Available online: http://www.palmasport.es/es/datos-estadisticos-buques/ (accessed on 6 May 2020).
- Barcelona Port Authority. Cruise Ship Statistics. 2020. Available online: http://www.portdebarcelona.cat/es/web/port-dels-negocis/cruceros1 (accessed on 5 April 2020).
- Port of Bari. Cruise Calendar. 2020. Available online: https://www.adspmam.it/category/crociere/ (accessed on 18 April 2020).
- Cádiz Port Authority. Cruise Ship Statistics. 2020. Available online: https://www.puertocadiz.com/el-puerto/instalaciones-para-traficos-especificos/cruceros-y-trafico-de-pasajeros/#opc01 (accessed on 3 May 2020).
- Greek Cruise Ports Cluster. Cruise Ship Statistics. 2020. Available online: http://www.greekcruise.gr (accessed on 10 April 2020).
- Dubrovnik Port Authority. Cruise Ship Statistics. 2020. Available online: http://195.29.106.30/ (accessed on 28 March 2020).
- Portos da Madeira. Cruise Ship Movements in Funchal Port. 2020. Available online: http://www.apram.pt/site/index.php/en/ports/wharf-reservations (accessed on 28 March 2020).
- Port of Gibraltar. Cruise Calendar. 2020. Available online: https://www.gibraltarport.com/cruise/schedules (accessed on 29 April 2020).
- Balearic Islands Port Authority. Cruise Ship Statistics. 2020. Available online: http://www.portsdebalears.com/es/buques-en-puerto (accessed on 10 April 2020).
- Lisbon Port Authority. Cruise Ship Statistics. 2020. Available online: https://www.portodelisboa.pt/planeamento-de-cruzeiros1 (accessed on 25 March 2020).
- Livorno Port Authority. Cruise Ship Statistics. 2020. Available online: http://www.portolivorno2000.it/en (accessed on 26 April 2020).
- Malaga Port Authority. Cruise Ship Statistics. 2020. Available online: https://www.puertomalaga.com/es/prevision-cruceros/ (accessed on 25 March 2020).
- Valencia Port Authority. Cruise Ship Statistics. 2020. Available online: https://www.valenciaportpcs.net/portcalls/search/historic (accessed on 22 March 2020).
- Santos, T.A.; Martins, P.; Guedes Soares, C. Cruise shipping in the Atlantic coast of the Iberian Peninsula. Marit. Policy Manag. 2021, 48, 129–145. [Google Scholar] [CrossRef]
- Zhang, J.; Zhai, S.; Liu, H.; Stevenson, J.A. Social network analysis on a topic-based navigation guidance system in a public health portal. J. Assn. Inf. Sci. Tec. 2016, 67, 1068–1088. [Google Scholar] [CrossRef]
- Lovric, M.; Da Re, R.; Vidale, E.; Pettenella, D.; Mavsar, R. Social network analysis as a tool for the analysis of international trade of wood and non-wood forest products. For. Policy Econ. 2018, 86, 45–66. [Google Scholar] [CrossRef]
- Choi, J.H.; Kim, H.S.; Im, N.G. Keyword network analysis for technology forecasting. J. Intell. Inf. Syst. 2011, 17, 227–240. [Google Scholar] [CrossRef]
- Martini, U.; Buffa, F. Local networks, stakeholder dynamics and sustainability in tourism. Opportunities and limits in the light of stakeholder theory and SNA. Sinergie Ital. J. Manag. 2015, 33, 113–130. [Google Scholar] [CrossRef] [Green Version]
- Chai, C.-L.; Liu, X.; Zhang, W.J.; Baber, Z. Application of social network theory to prioritizing Oil & Gas industries protection in a networked critical infrastructure system. J. Loss Prev. Process Ind. 2011, 24, 688–694. [Google Scholar] [CrossRef]
- Noble, M.; Harasti, D.; Pittock, J.; Doran, B. Understanding the spatial diversity of social uses, dynamics, and conflicts in marine spatial planning. J. Environ. Manag. 2019, 246, 929–940. [Google Scholar] [CrossRef] [PubMed]
- Mou, N.; Wang, C.; Yang, T.; Ren, H.; Zhang, L.; Xu, H.; Liu, W. Spatiotemporal patterns of maritime trade between China and Maritime Silk Road: Evidence from a quantitative study using social network analysis. J. Transp. Geogr. 2022, 102, 103387. [Google Scholar] [CrossRef]
- Kim, Y.; Choi, T.Y.; Yan, T.; Dooley, K. Structural investigation of supply networks: A social network analysis approach. J. Oper. Manag. 2011, 29, 194–211. [Google Scholar] [CrossRef]
- Ducruet, C. Network diversity and maritime flows. J. Transp. Geogr. 2013, 30, 77–88. [Google Scholar] [CrossRef] [Green Version]
- Jeon, J.; Wang, Y.; Yeo, G.T. SNA approach for analysing the research trend of international port competition. Asian J. Shipp. Logist. 2016, 32, 165–172. [Google Scholar] [CrossRef] [Green Version]
- Wang, Y.; Cullinane, K. Determinants of port centrality in maritime container transportation. Transp. Res. E Logist. Transp. Rev. 2016, 95, 236–340. [Google Scholar] [CrossRef]
- Freeman, L.C. Centrality in social networks conceptual clarification. Soc. Netw. 1979, 1, 215–239. [Google Scholar] [CrossRef] [Green Version]
- Scott, J. Social Network Analysis: A Handbook, 2nd ed.; SAGE Publications Ltd.: London, UK, 2000. [Google Scholar]
- Provan, K.G.; Milward, H.B. A preliminary theory of interorganizational network effectiveness: A comparative study of four community mental health systems. Adm. Sci. Q. 1995, 40, 1–33. [Google Scholar] [CrossRef]
- Frenken, K. A complexity approach to innovation networks. The case of the aircraft industry (1999–1997). Res. Policy 2000, 29, 257–272. [Google Scholar] [CrossRef]
- Borgatti, S.P.; Everett, M.G.; Freeman, L.C. Ucinet for Windows: Software for Social Network Analysis; Analytic Technologies: Harvard, MA, USA, 2002. [Google Scholar]
- GNU Octave. Available online: https://octave.org/ (accessed on 15 May 2020).
- Kleinberg, J.M. Authoritative sources in a hyperlinked environment. J. ACM 1999, 46, 604–632. [Google Scholar] [CrossRef]
- Hörlesberger, M.; Schiebel, E. Web networks of the science system: Weighted hubs and authorities. Scientometrics 2006, 66, 263–278. [Google Scholar] [CrossRef]
- Lin, L.-Y.; Tsai, C.-C.; Lee, J.-Y. A Study on the Trends of the Global Cruise Tourism Industry, Sustainable Development, and the Impacts of the COVID-19 Pandemic. Sustainability 2022, 14, 6890. [Google Scholar] [CrossRef]
Publisher’s Note: MDPI stays neutral with regard to jurisdictional claims in published maps and institutional affiliations. |
© 2022 by the authors. Licensee MDPI, Basel, Switzerland. This article is an open access article distributed under the terms and conditions of the Creative Commons Attribution (CC BY) license (https://creativecommons.org/licenses/by/4.0/).