
Material Source of Sediments from West Clarion–Clipperton Zone (Pacific): Evidence from Rare Earth Element Geochemistry and Clay Minerals Compositions

 ,
,
Abstract
:1. Introduction
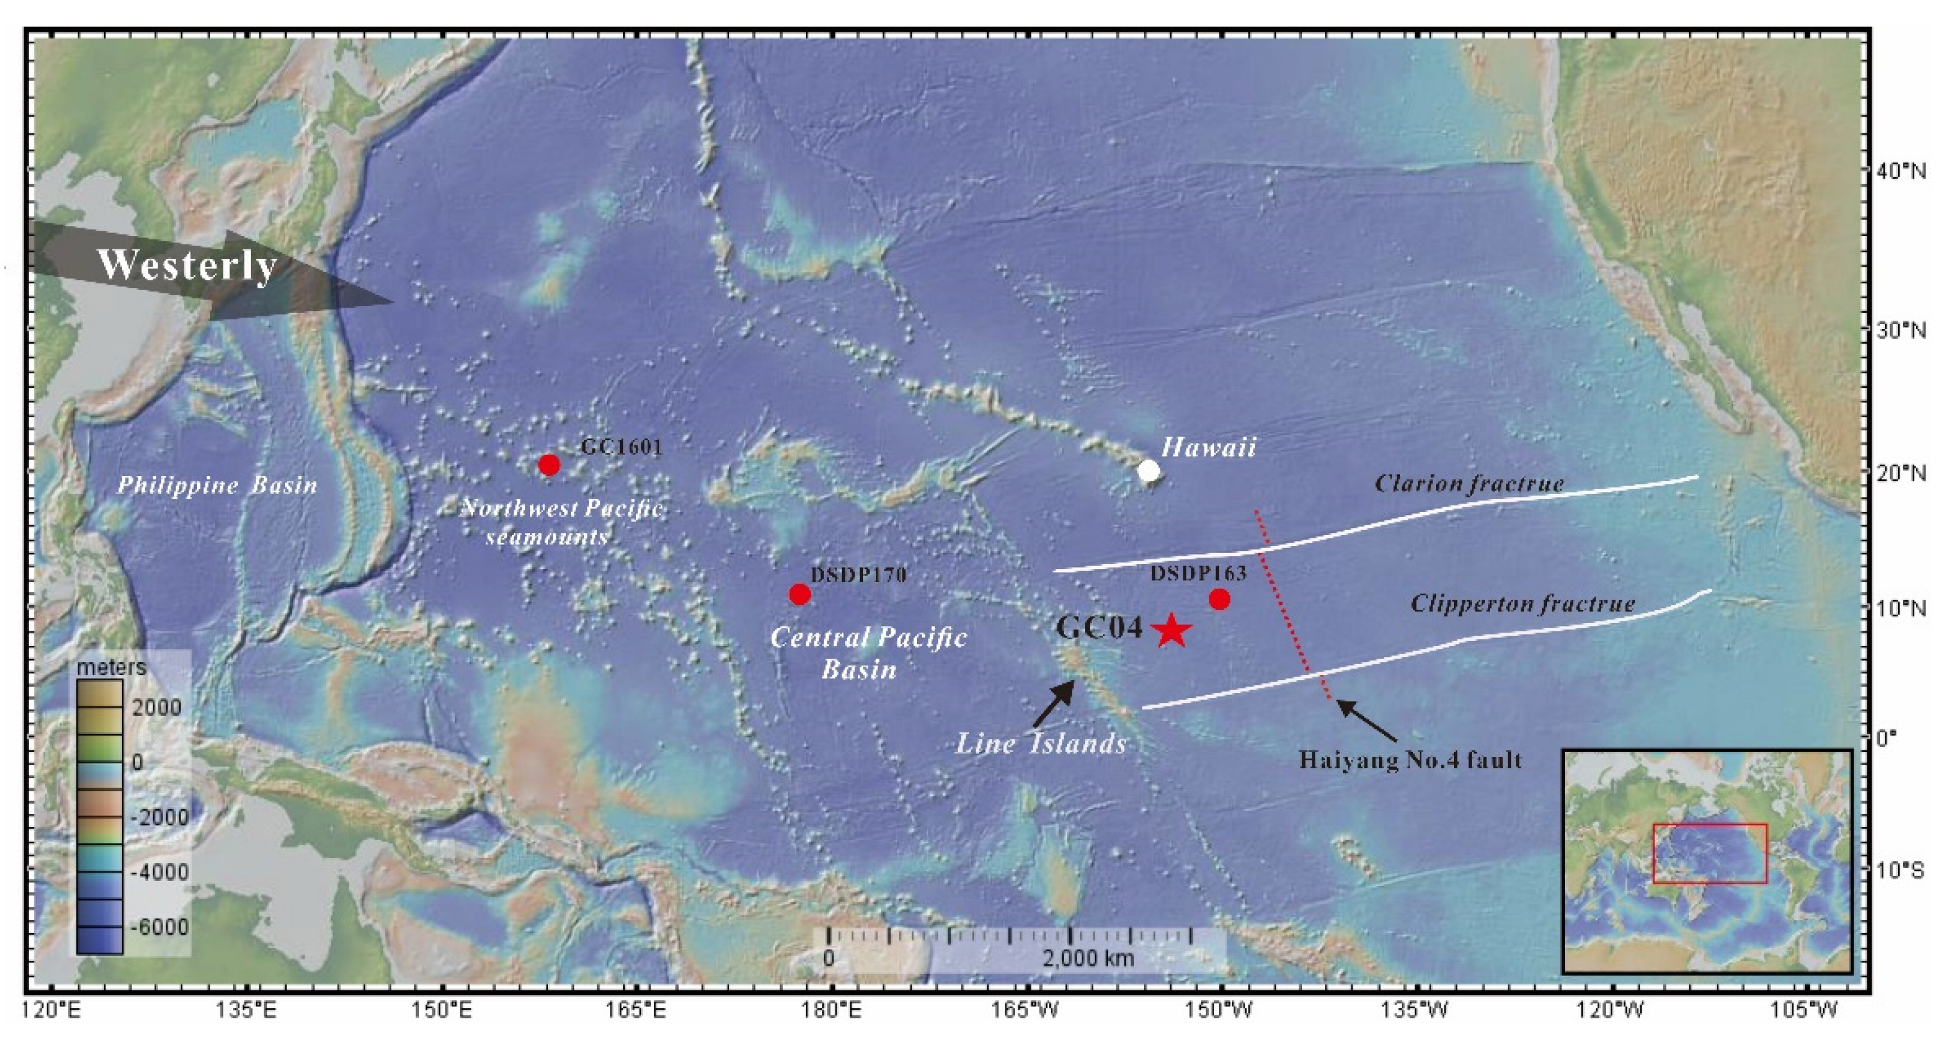
2. Geological Background
3. Samples and Methods
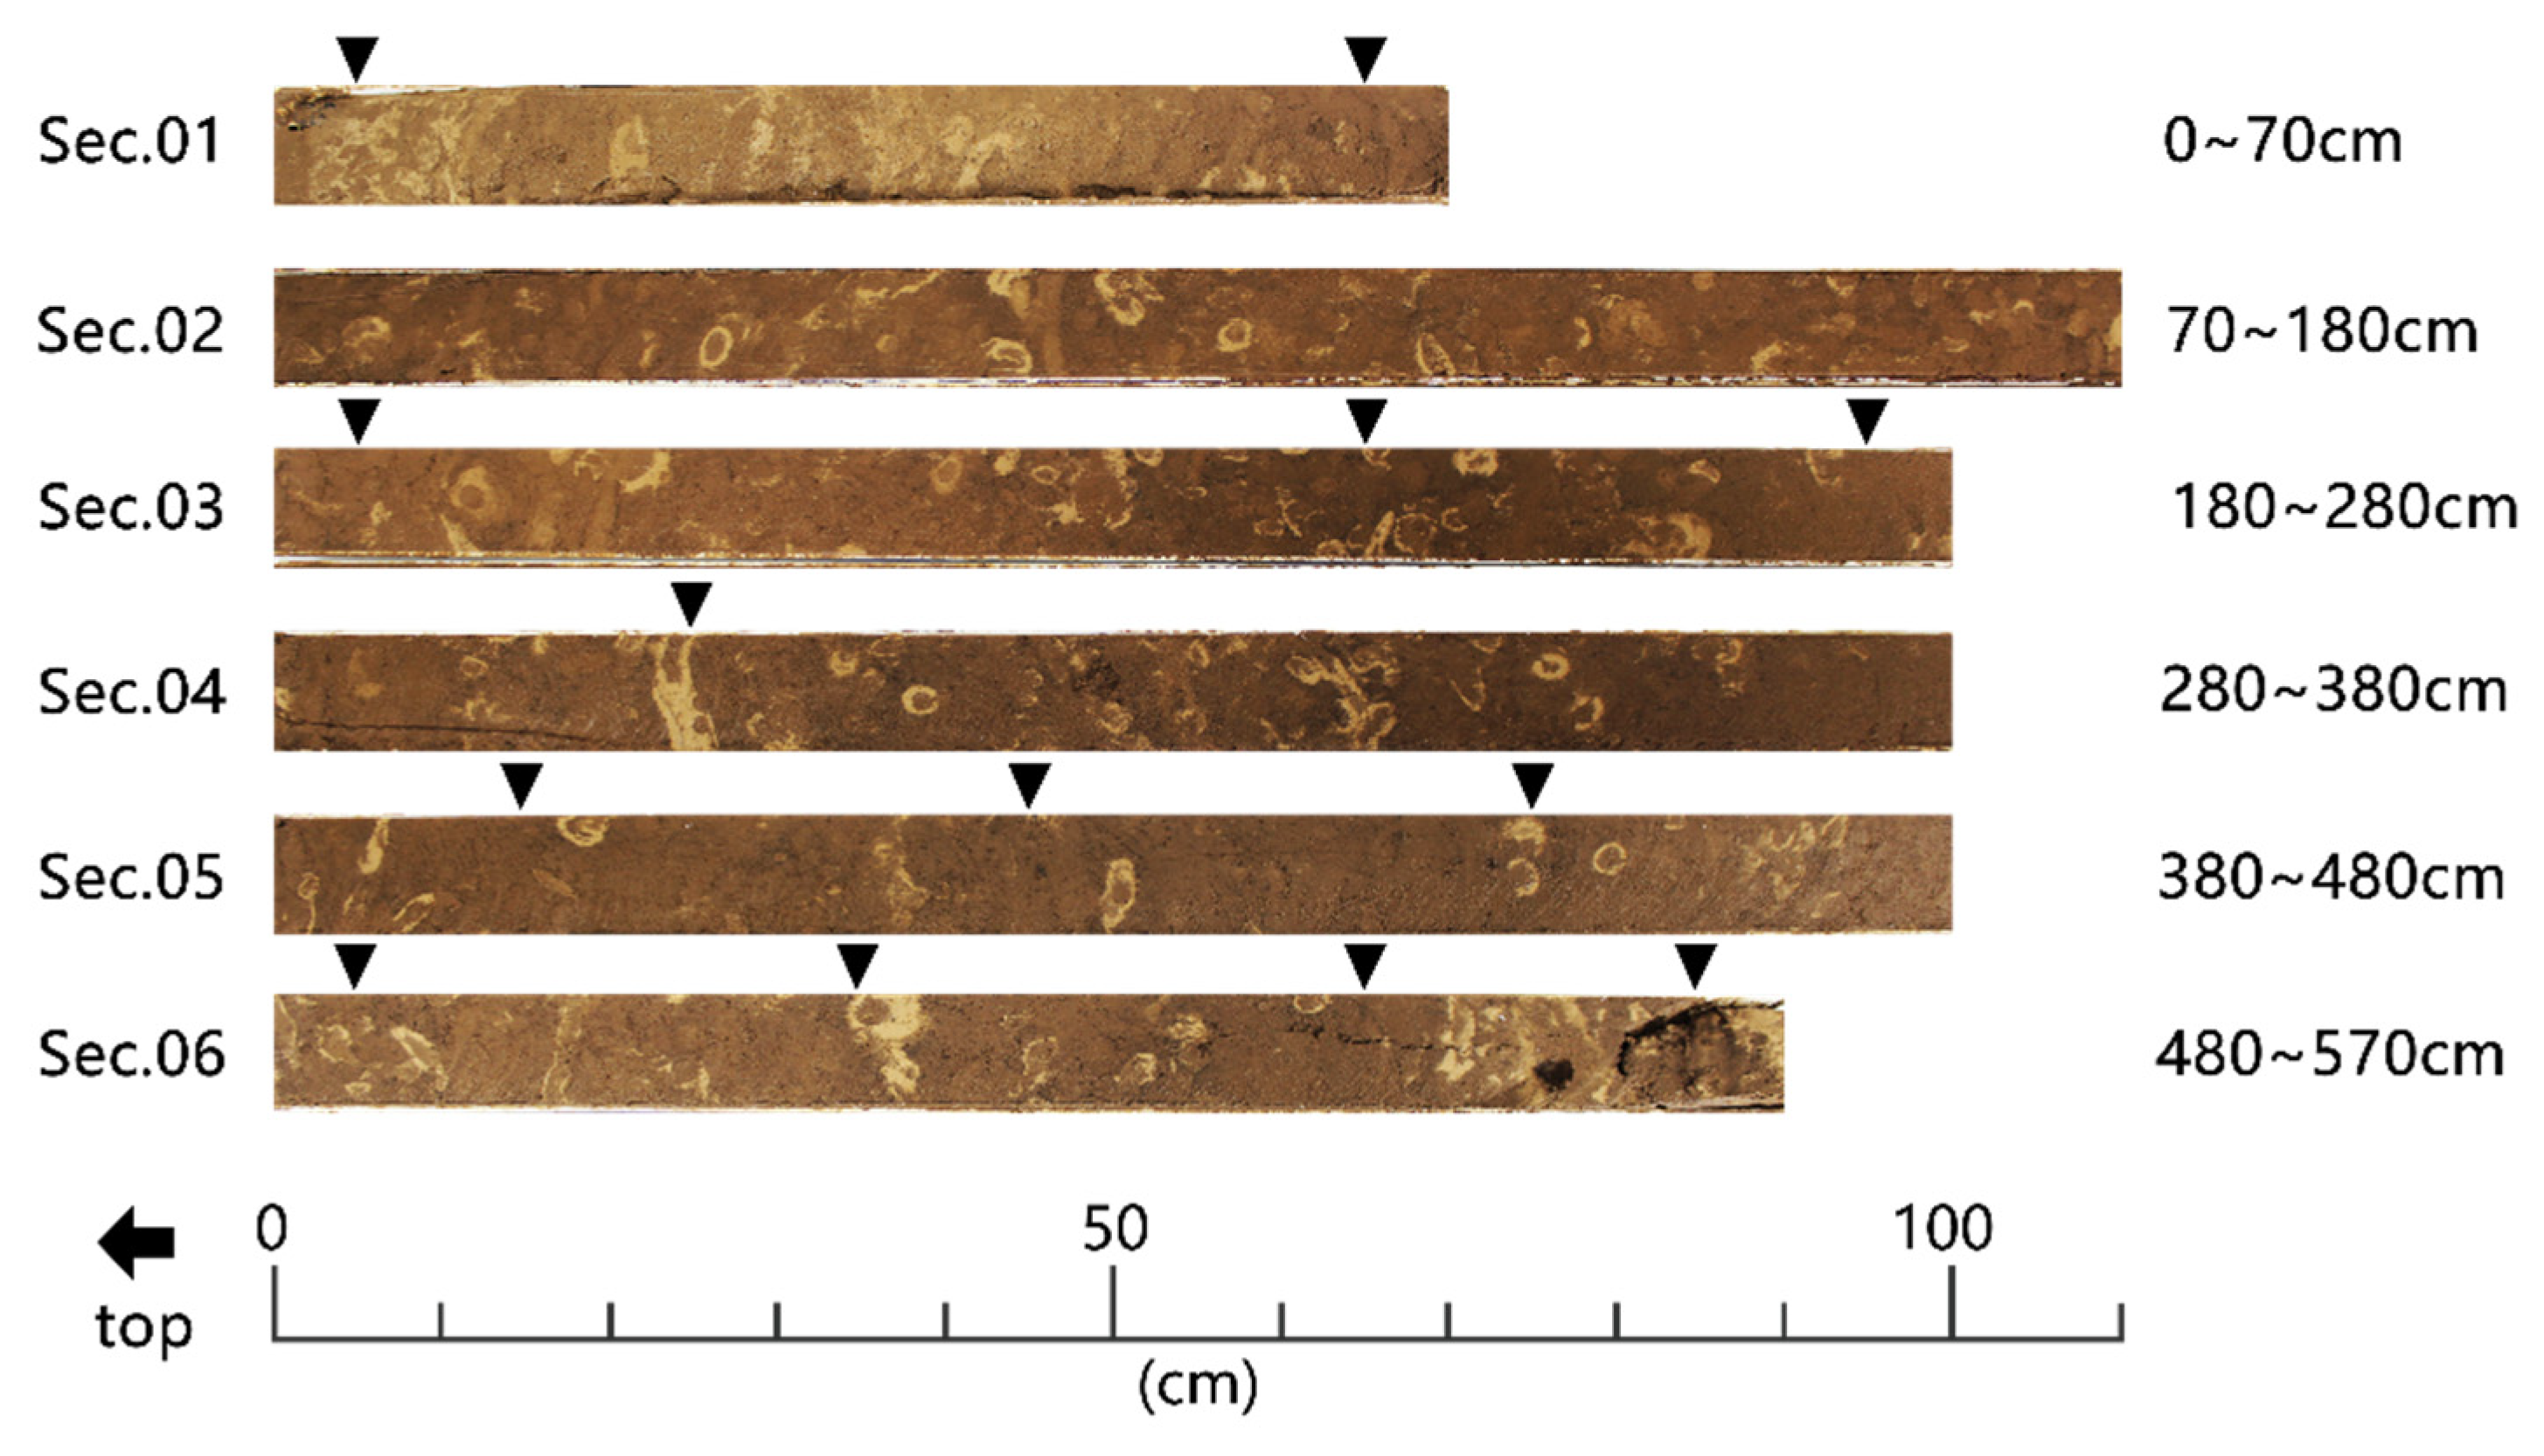
3.1. Samples
3.2. Methods
3.2.1. Smear Slide Identification
3.2.2. Chemical Analyses of Bulk Sediments
3.2.3. Clay Minerals
B1 = A1/A × 100%
B2 = 4A2/A × 100%
B3 = 2A3/A × V/(V + 1)100%
B4 = 2A3/A × V/(V + 1) × 100%
3.2.4. Scanning Electron Microscopy
4. Results
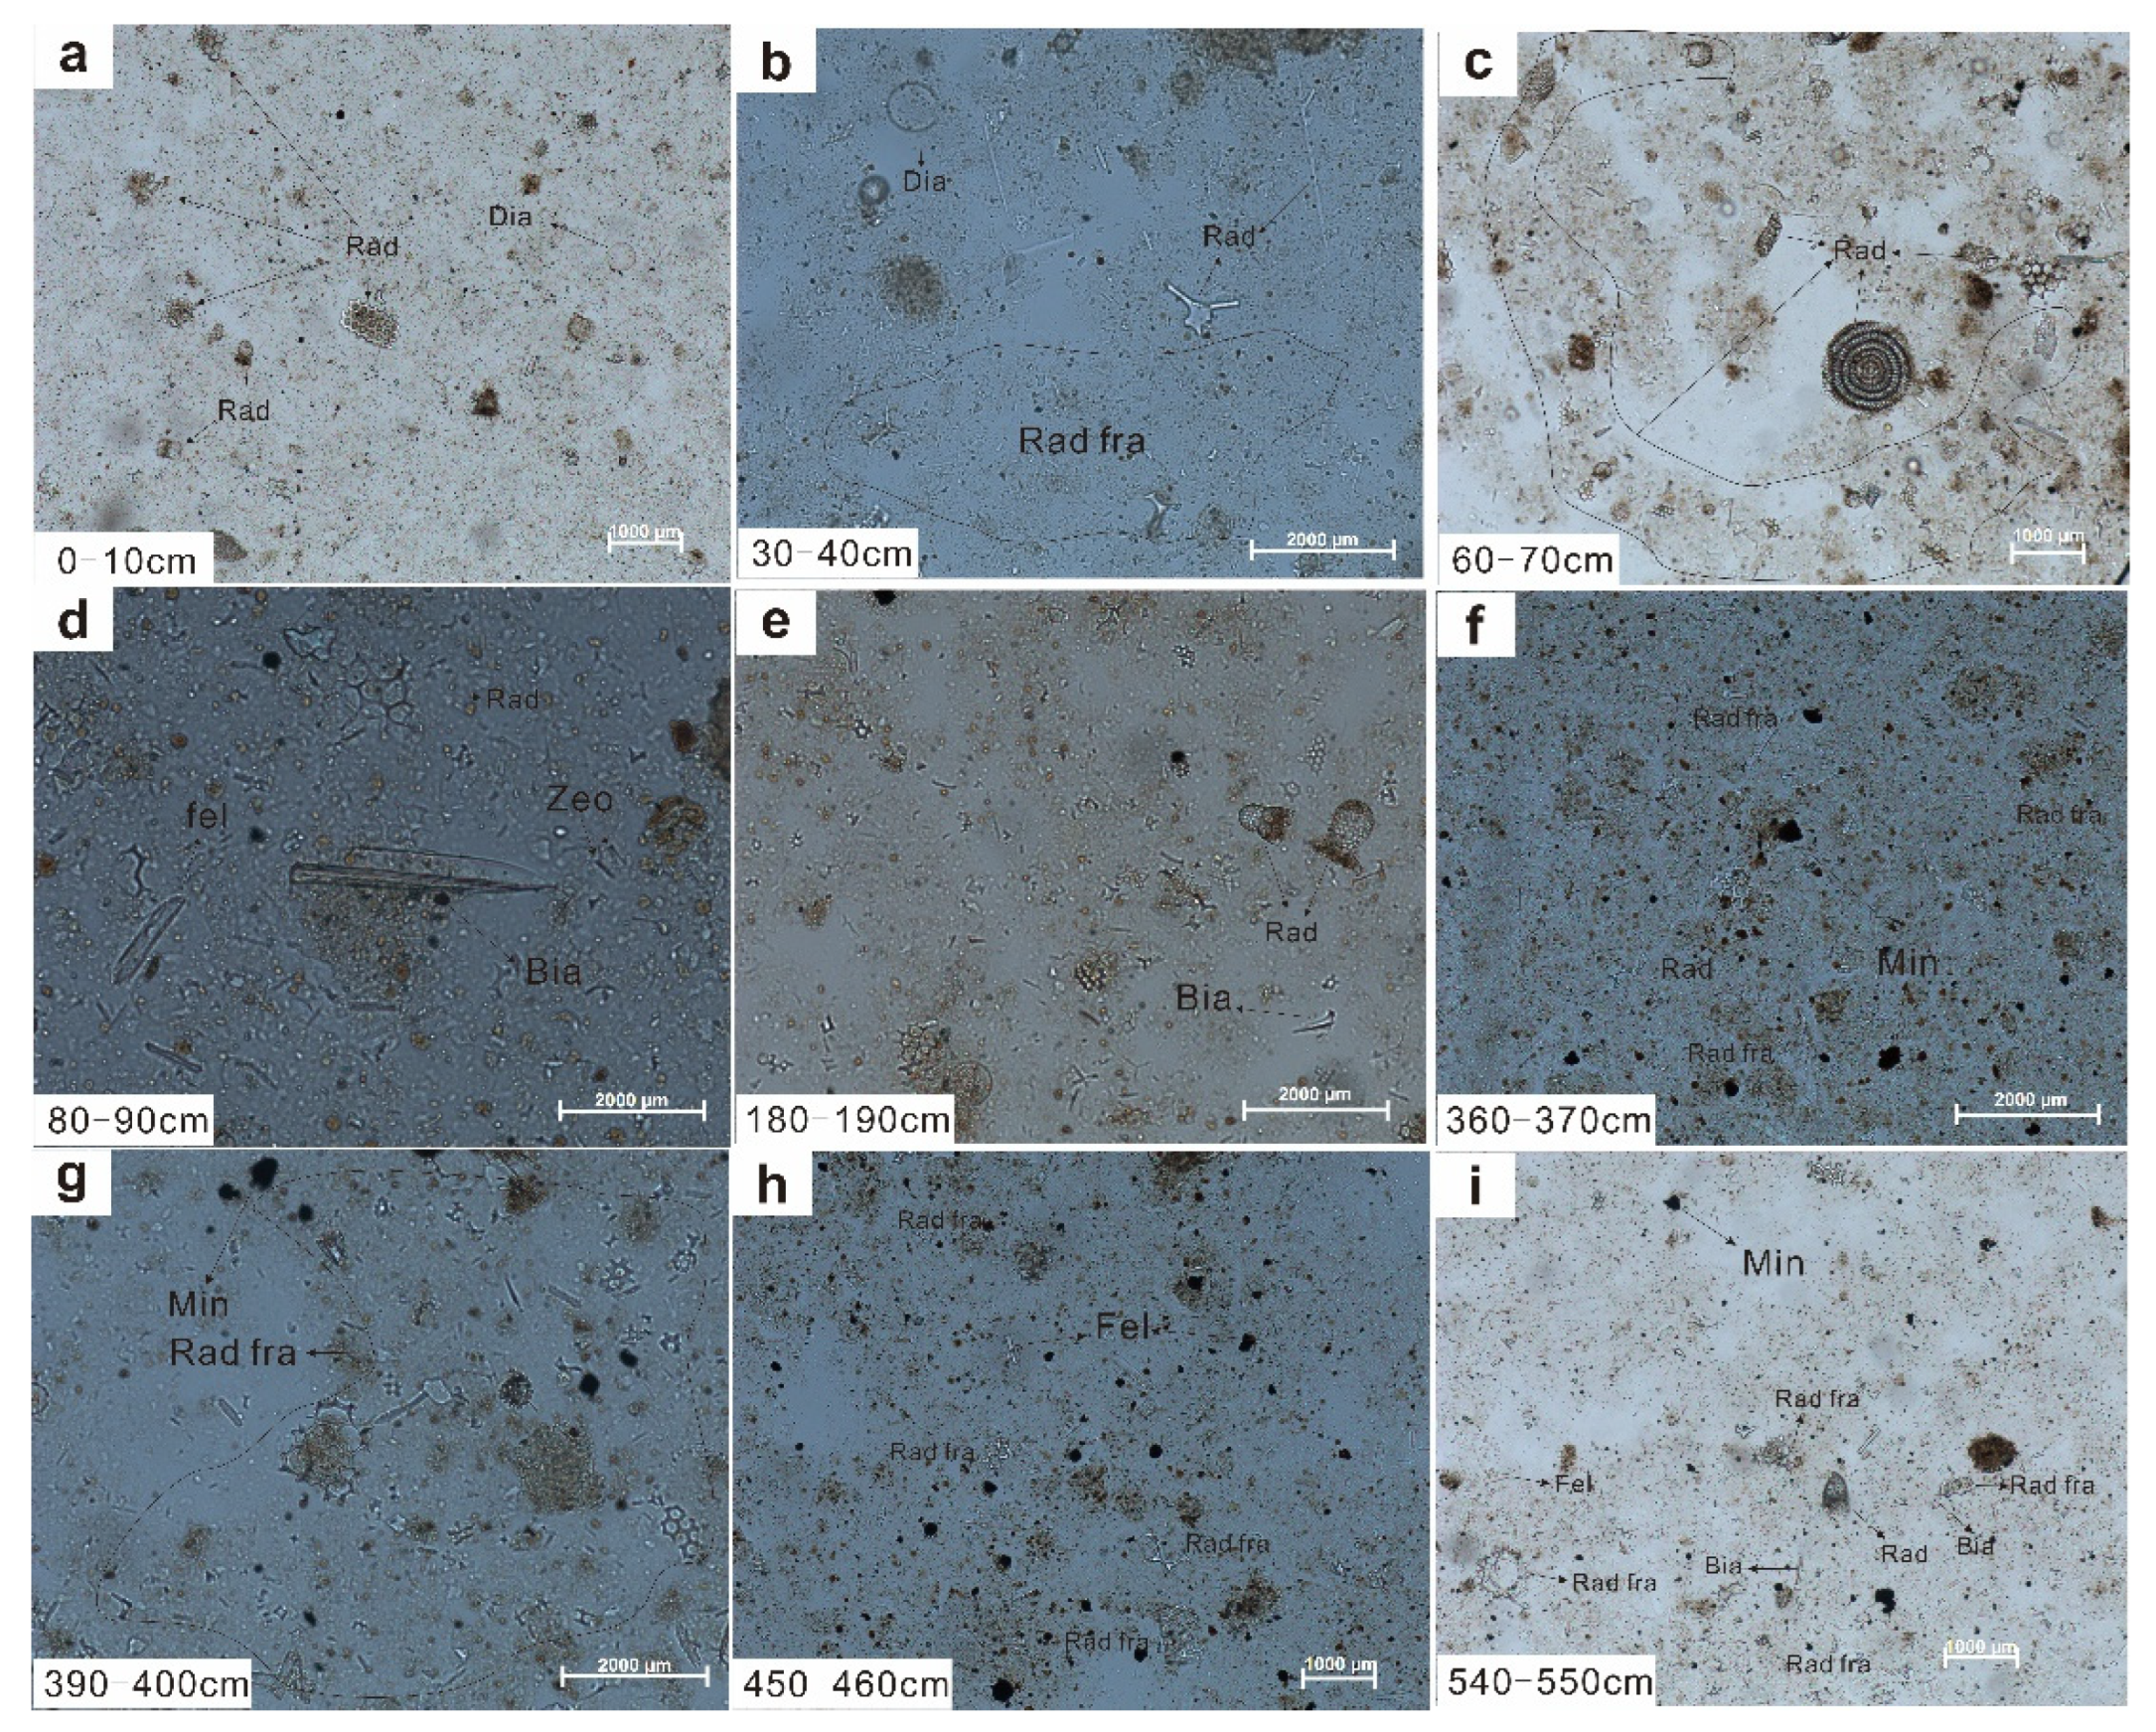
4.1. Sediment Type
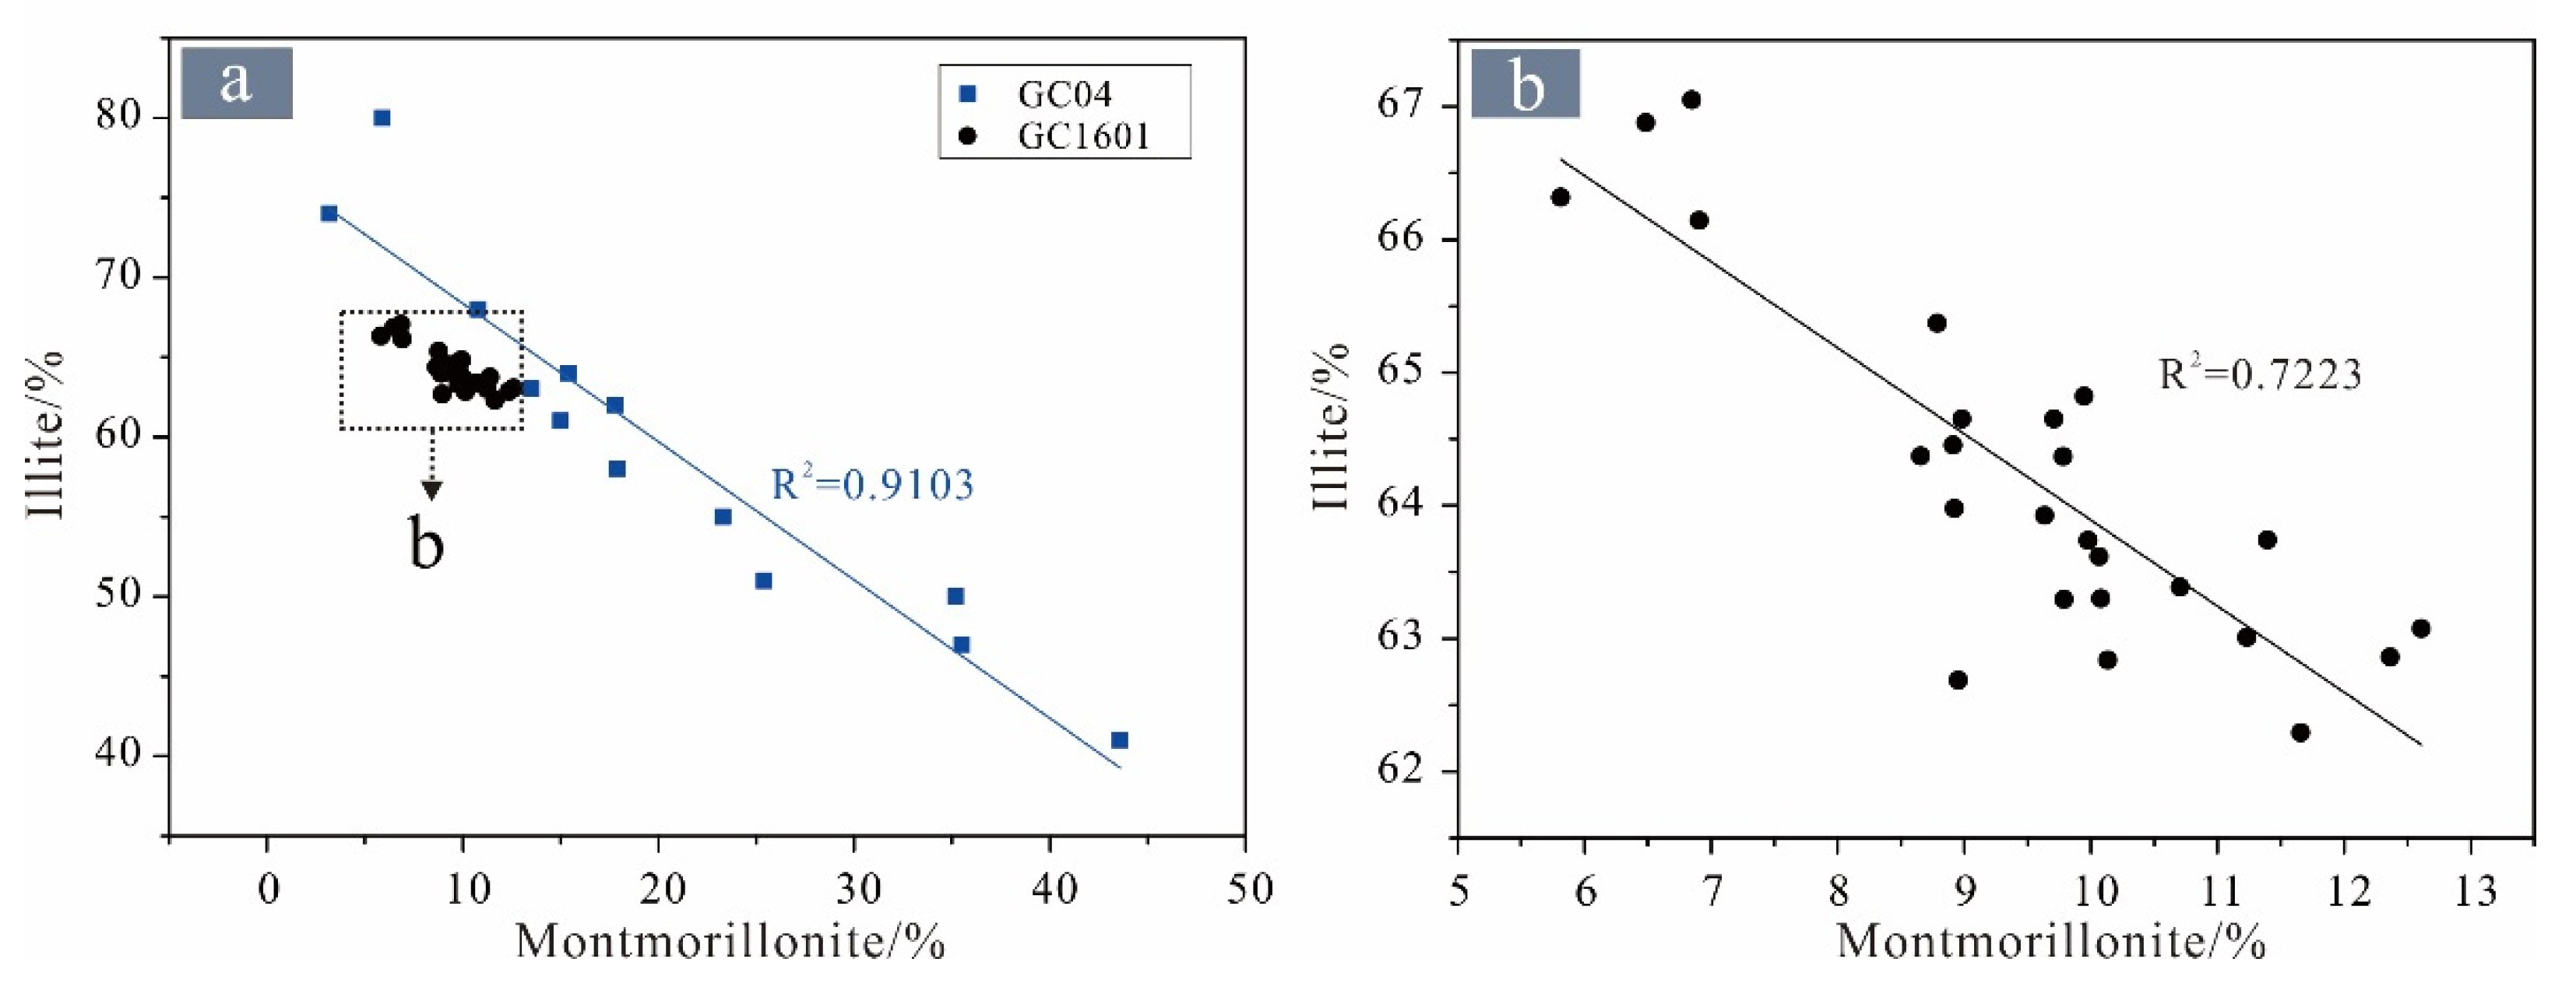
4.2. Clay Minerals Compositions
4.3. Geochemical Characteristics of the Bulk Sediments
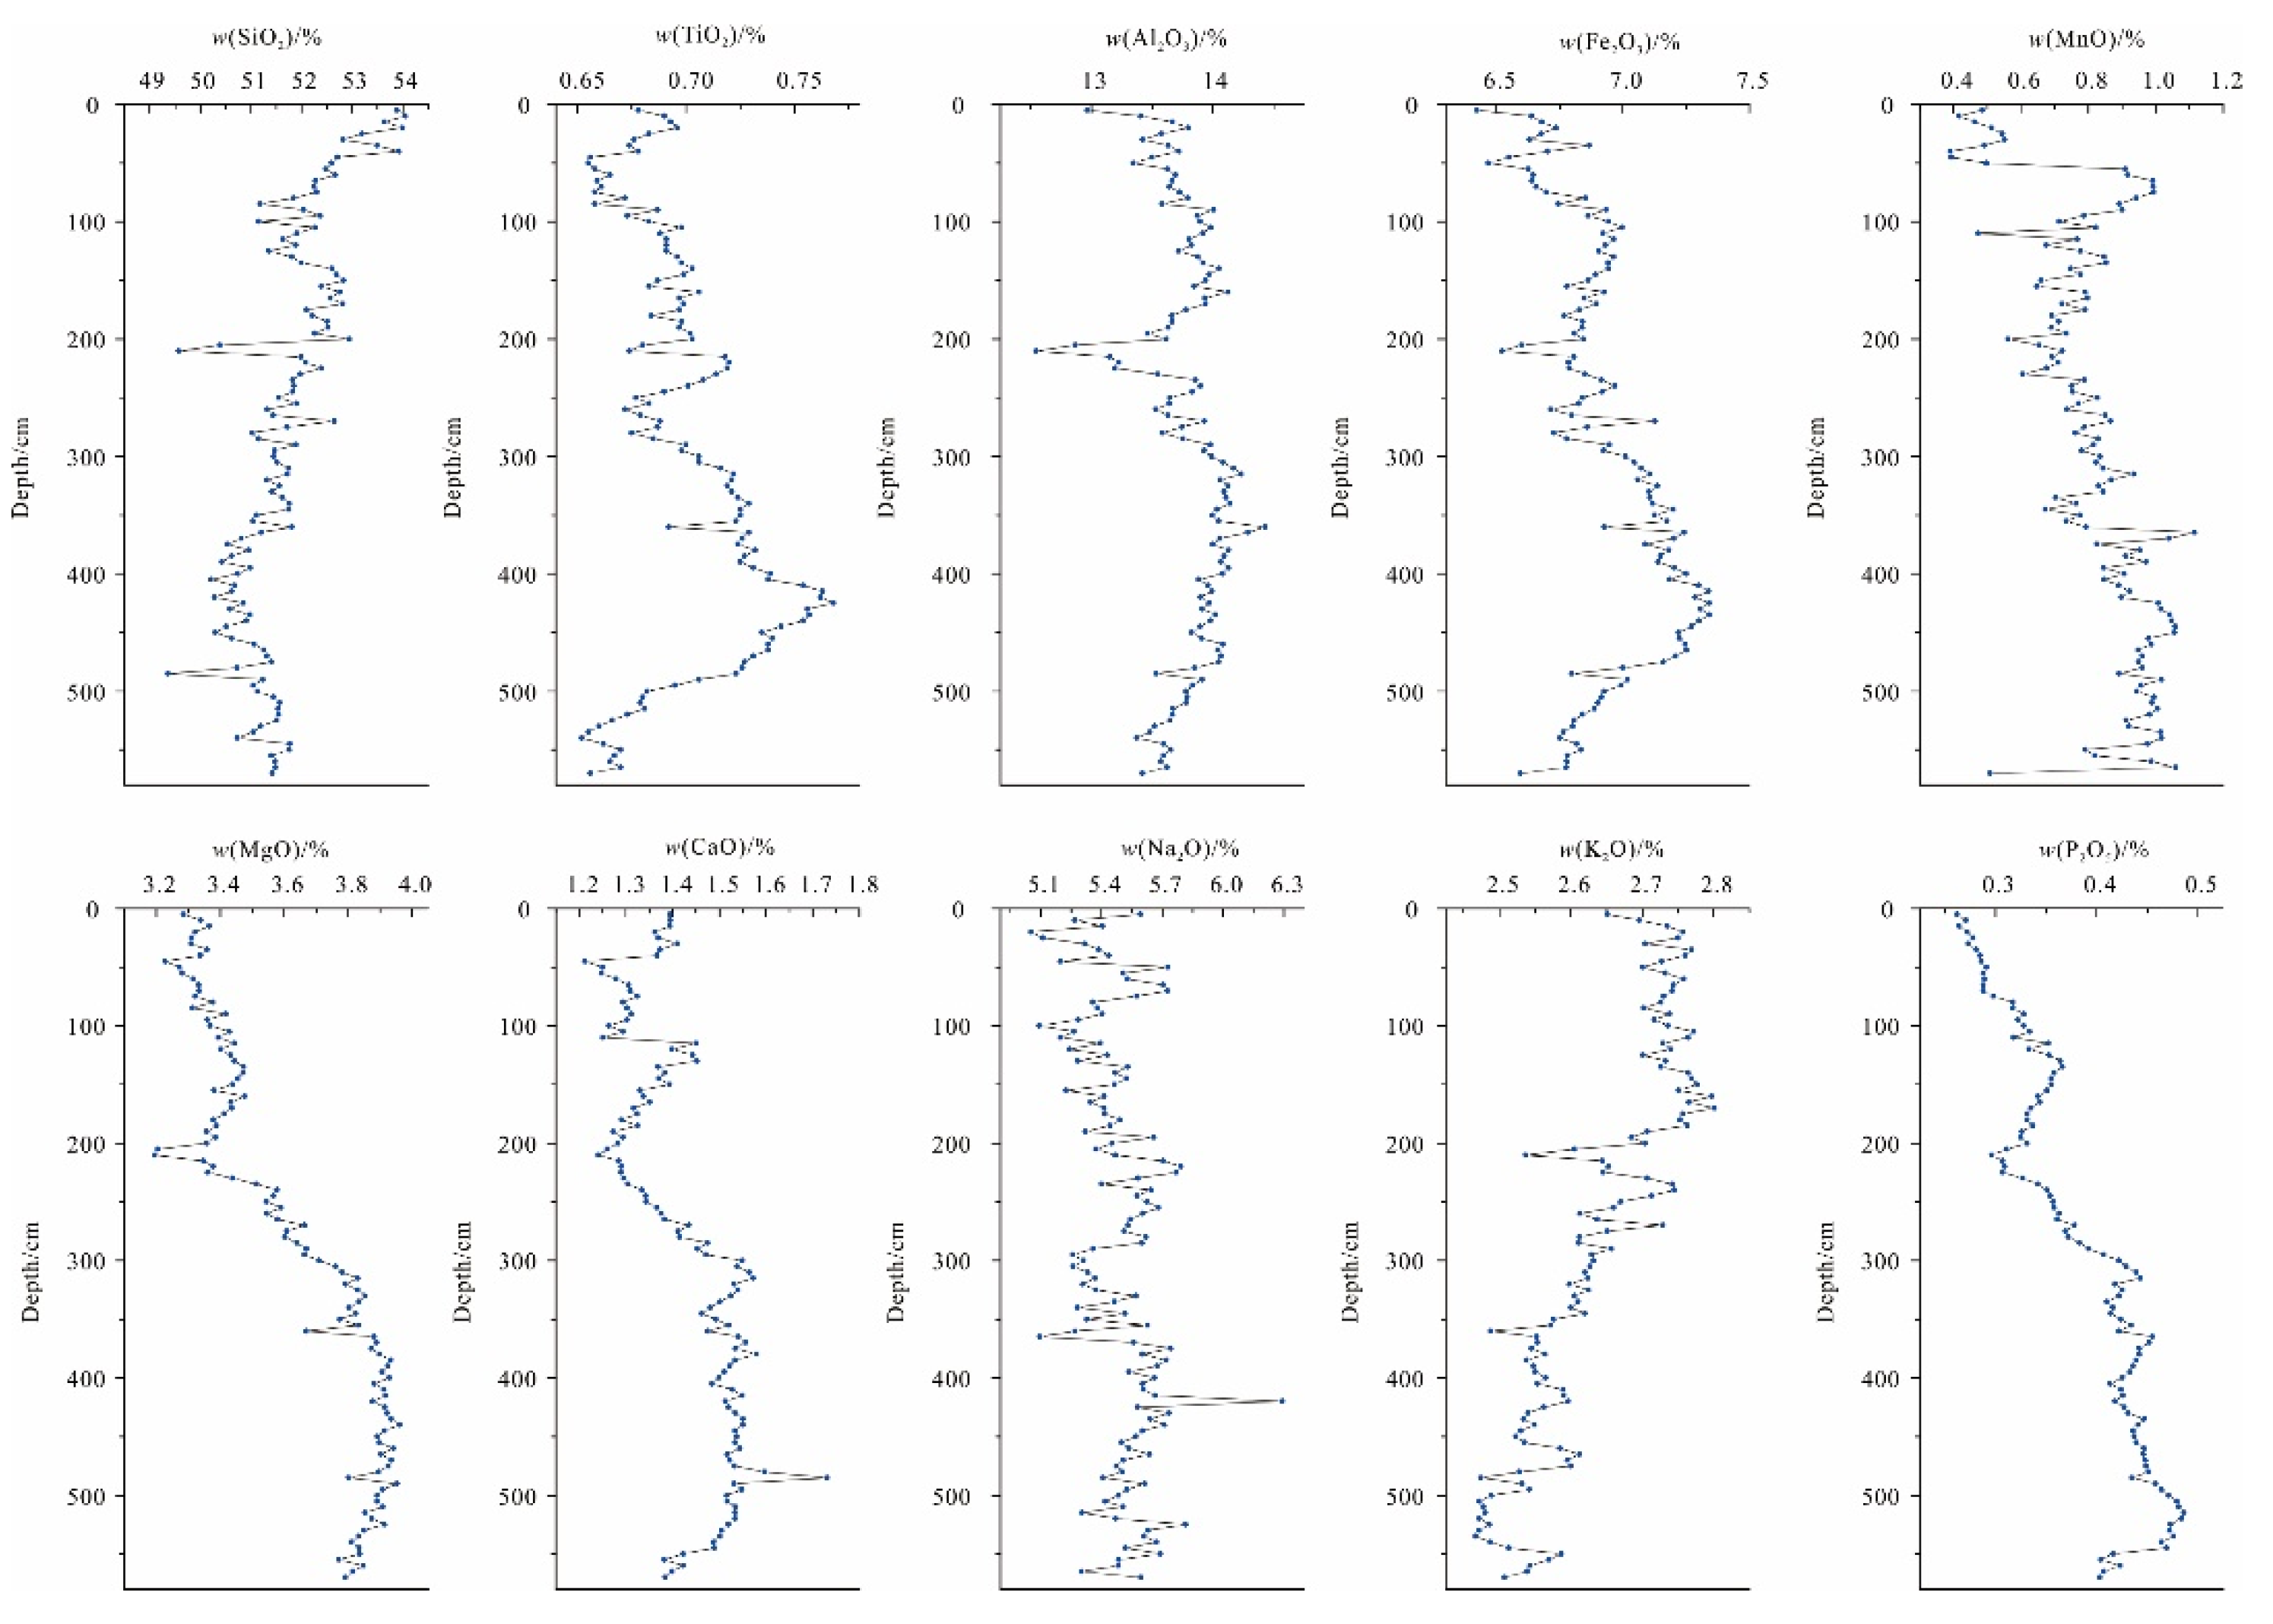
4.3.1. Major Elements
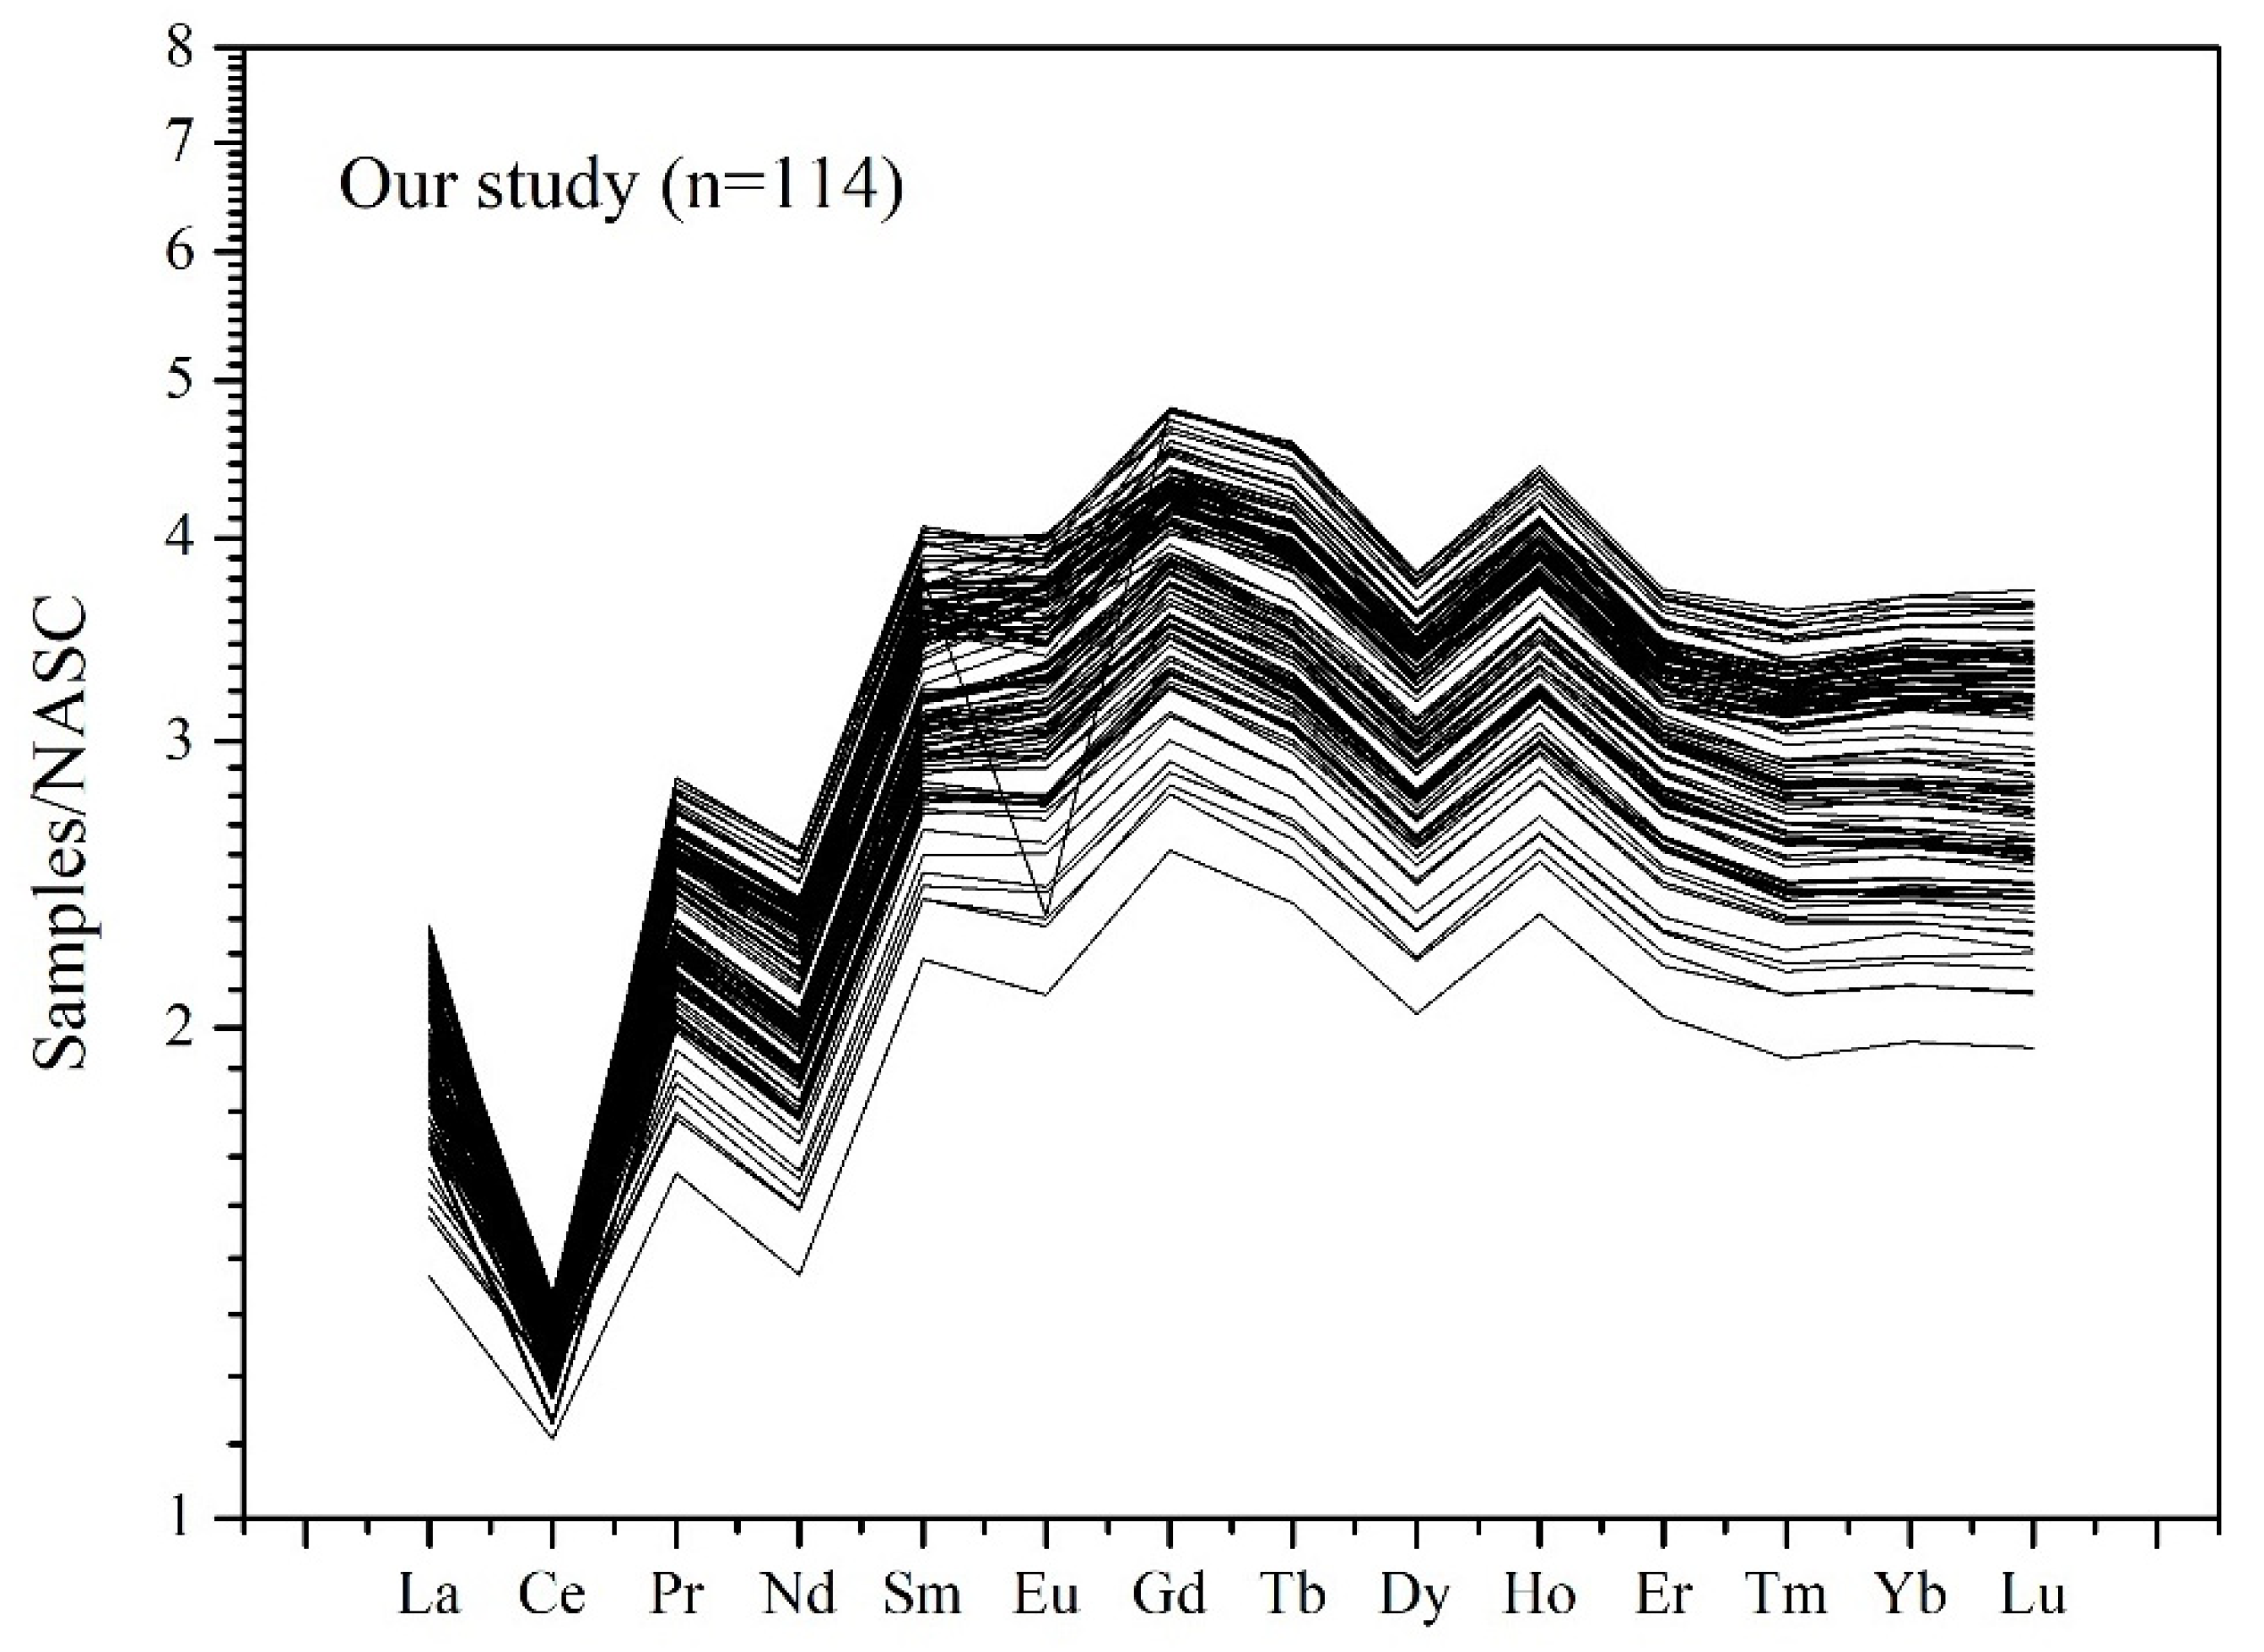
4.3.2. Rare Earth Elements
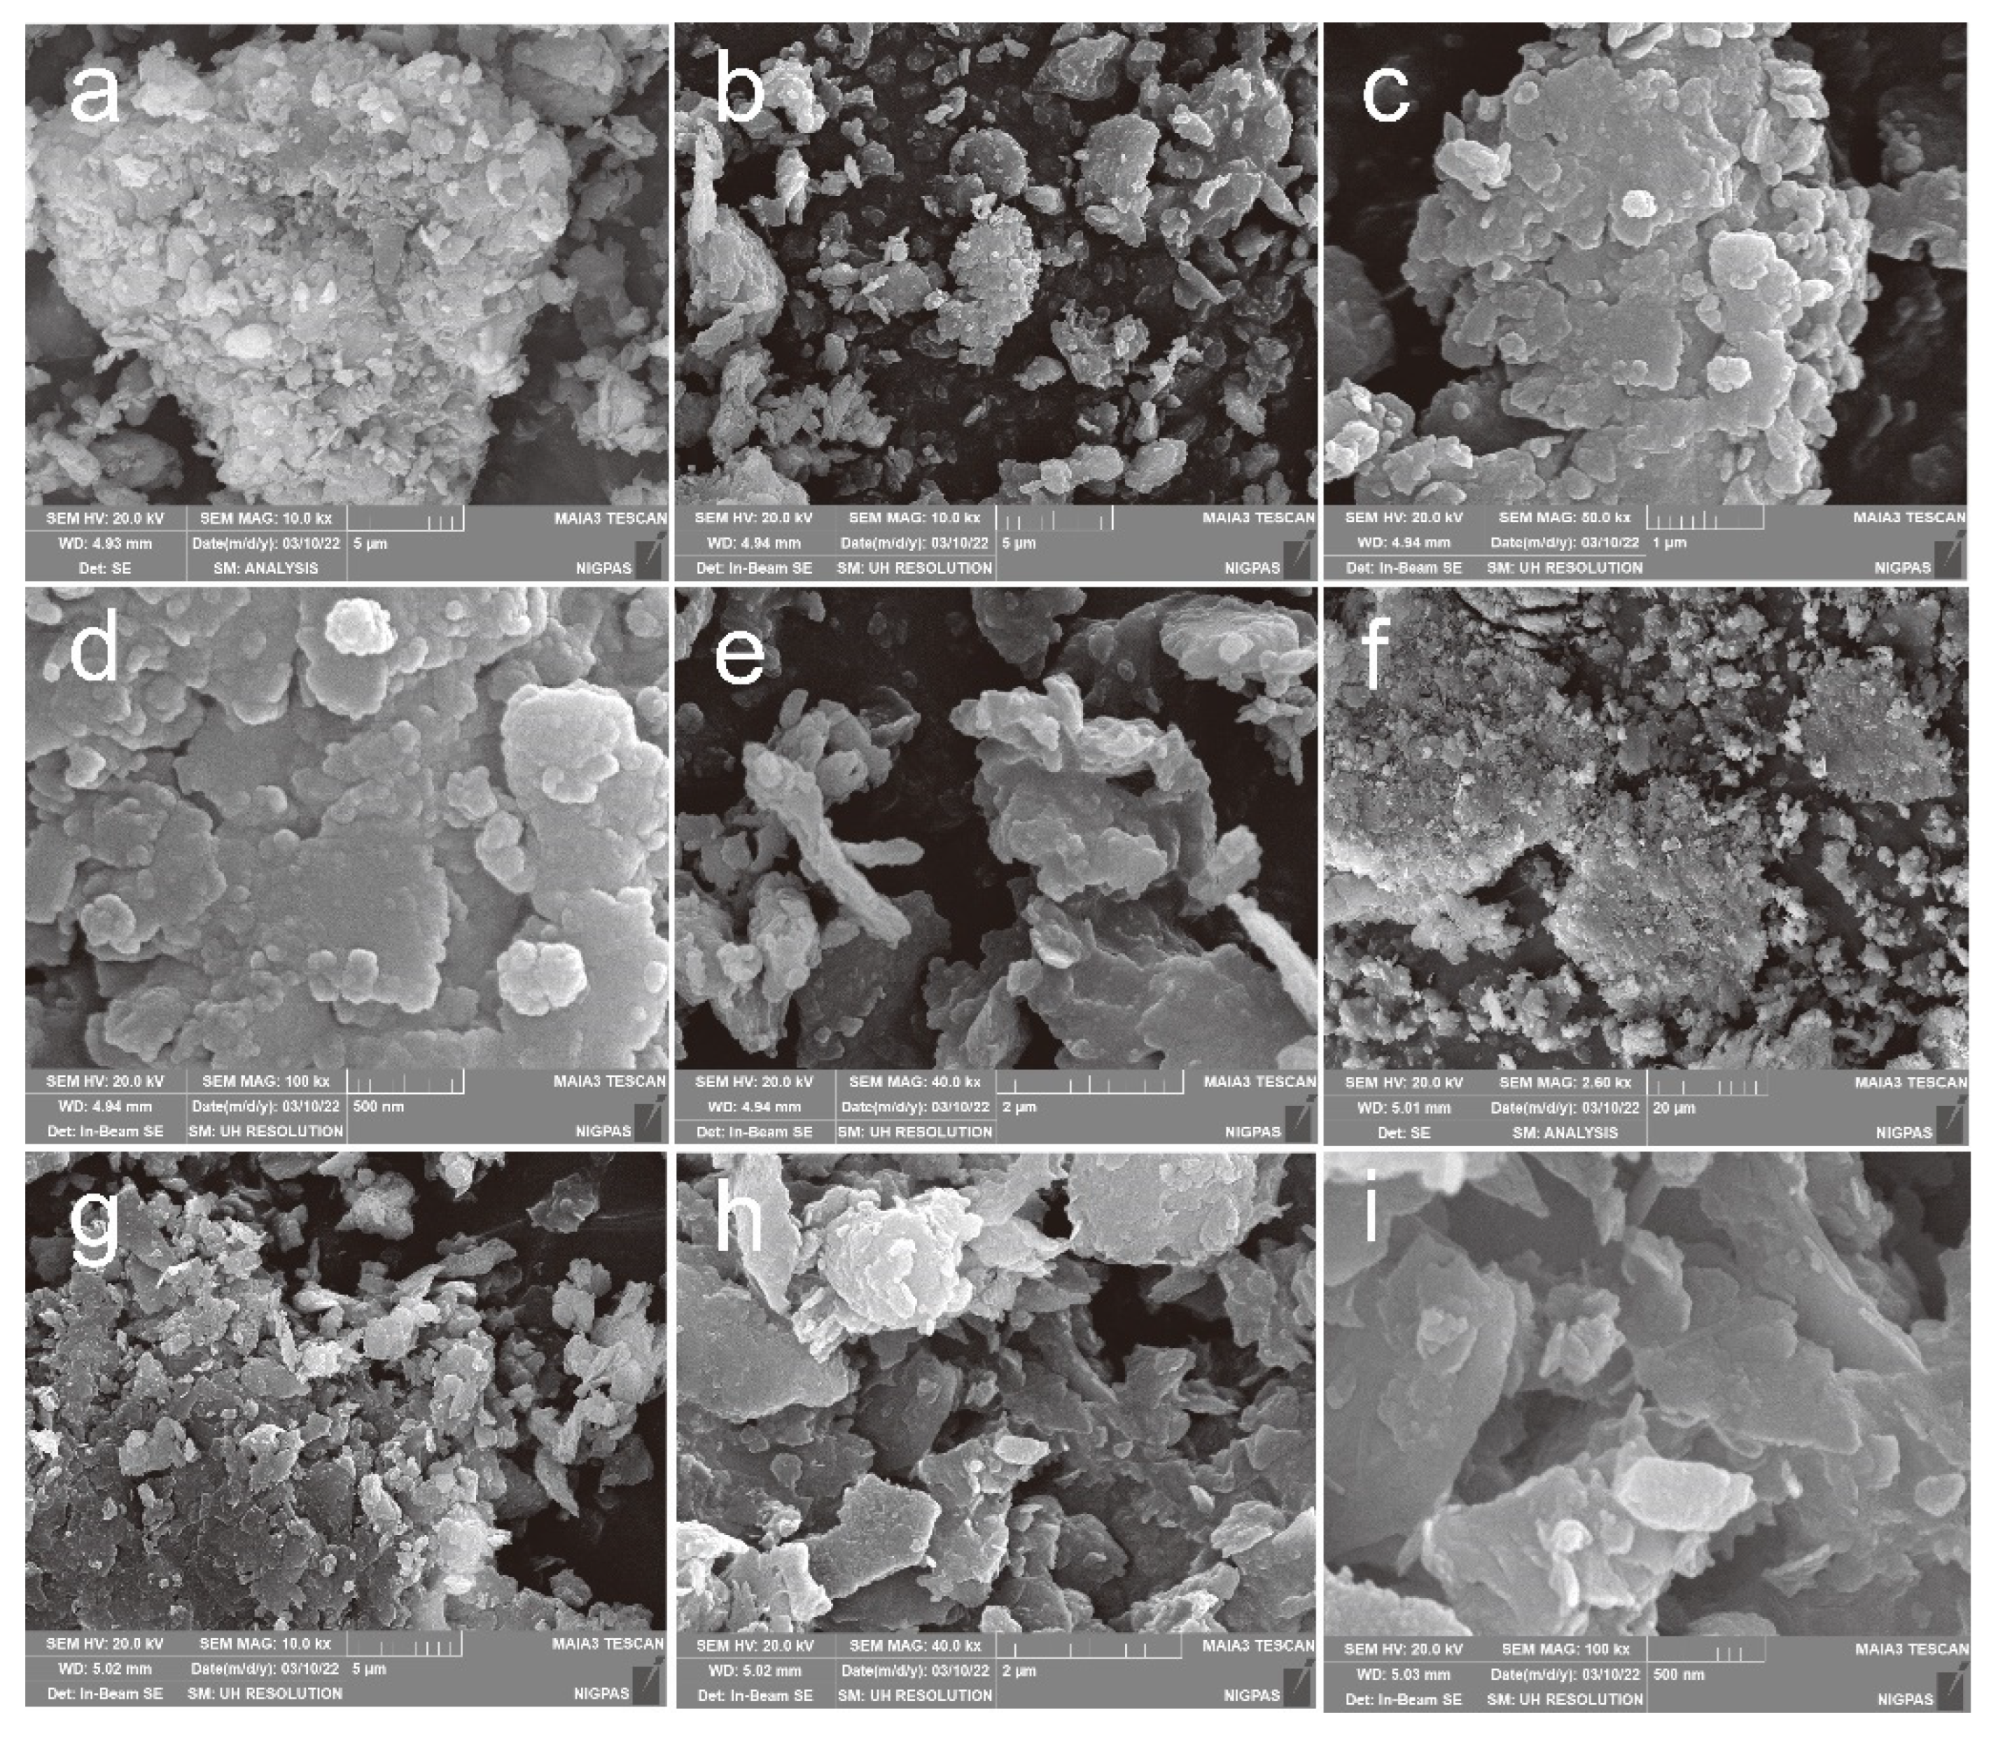
4.4. Scanning Electron Microscopy
5. Discussion
5.1. Sediment Input Sources
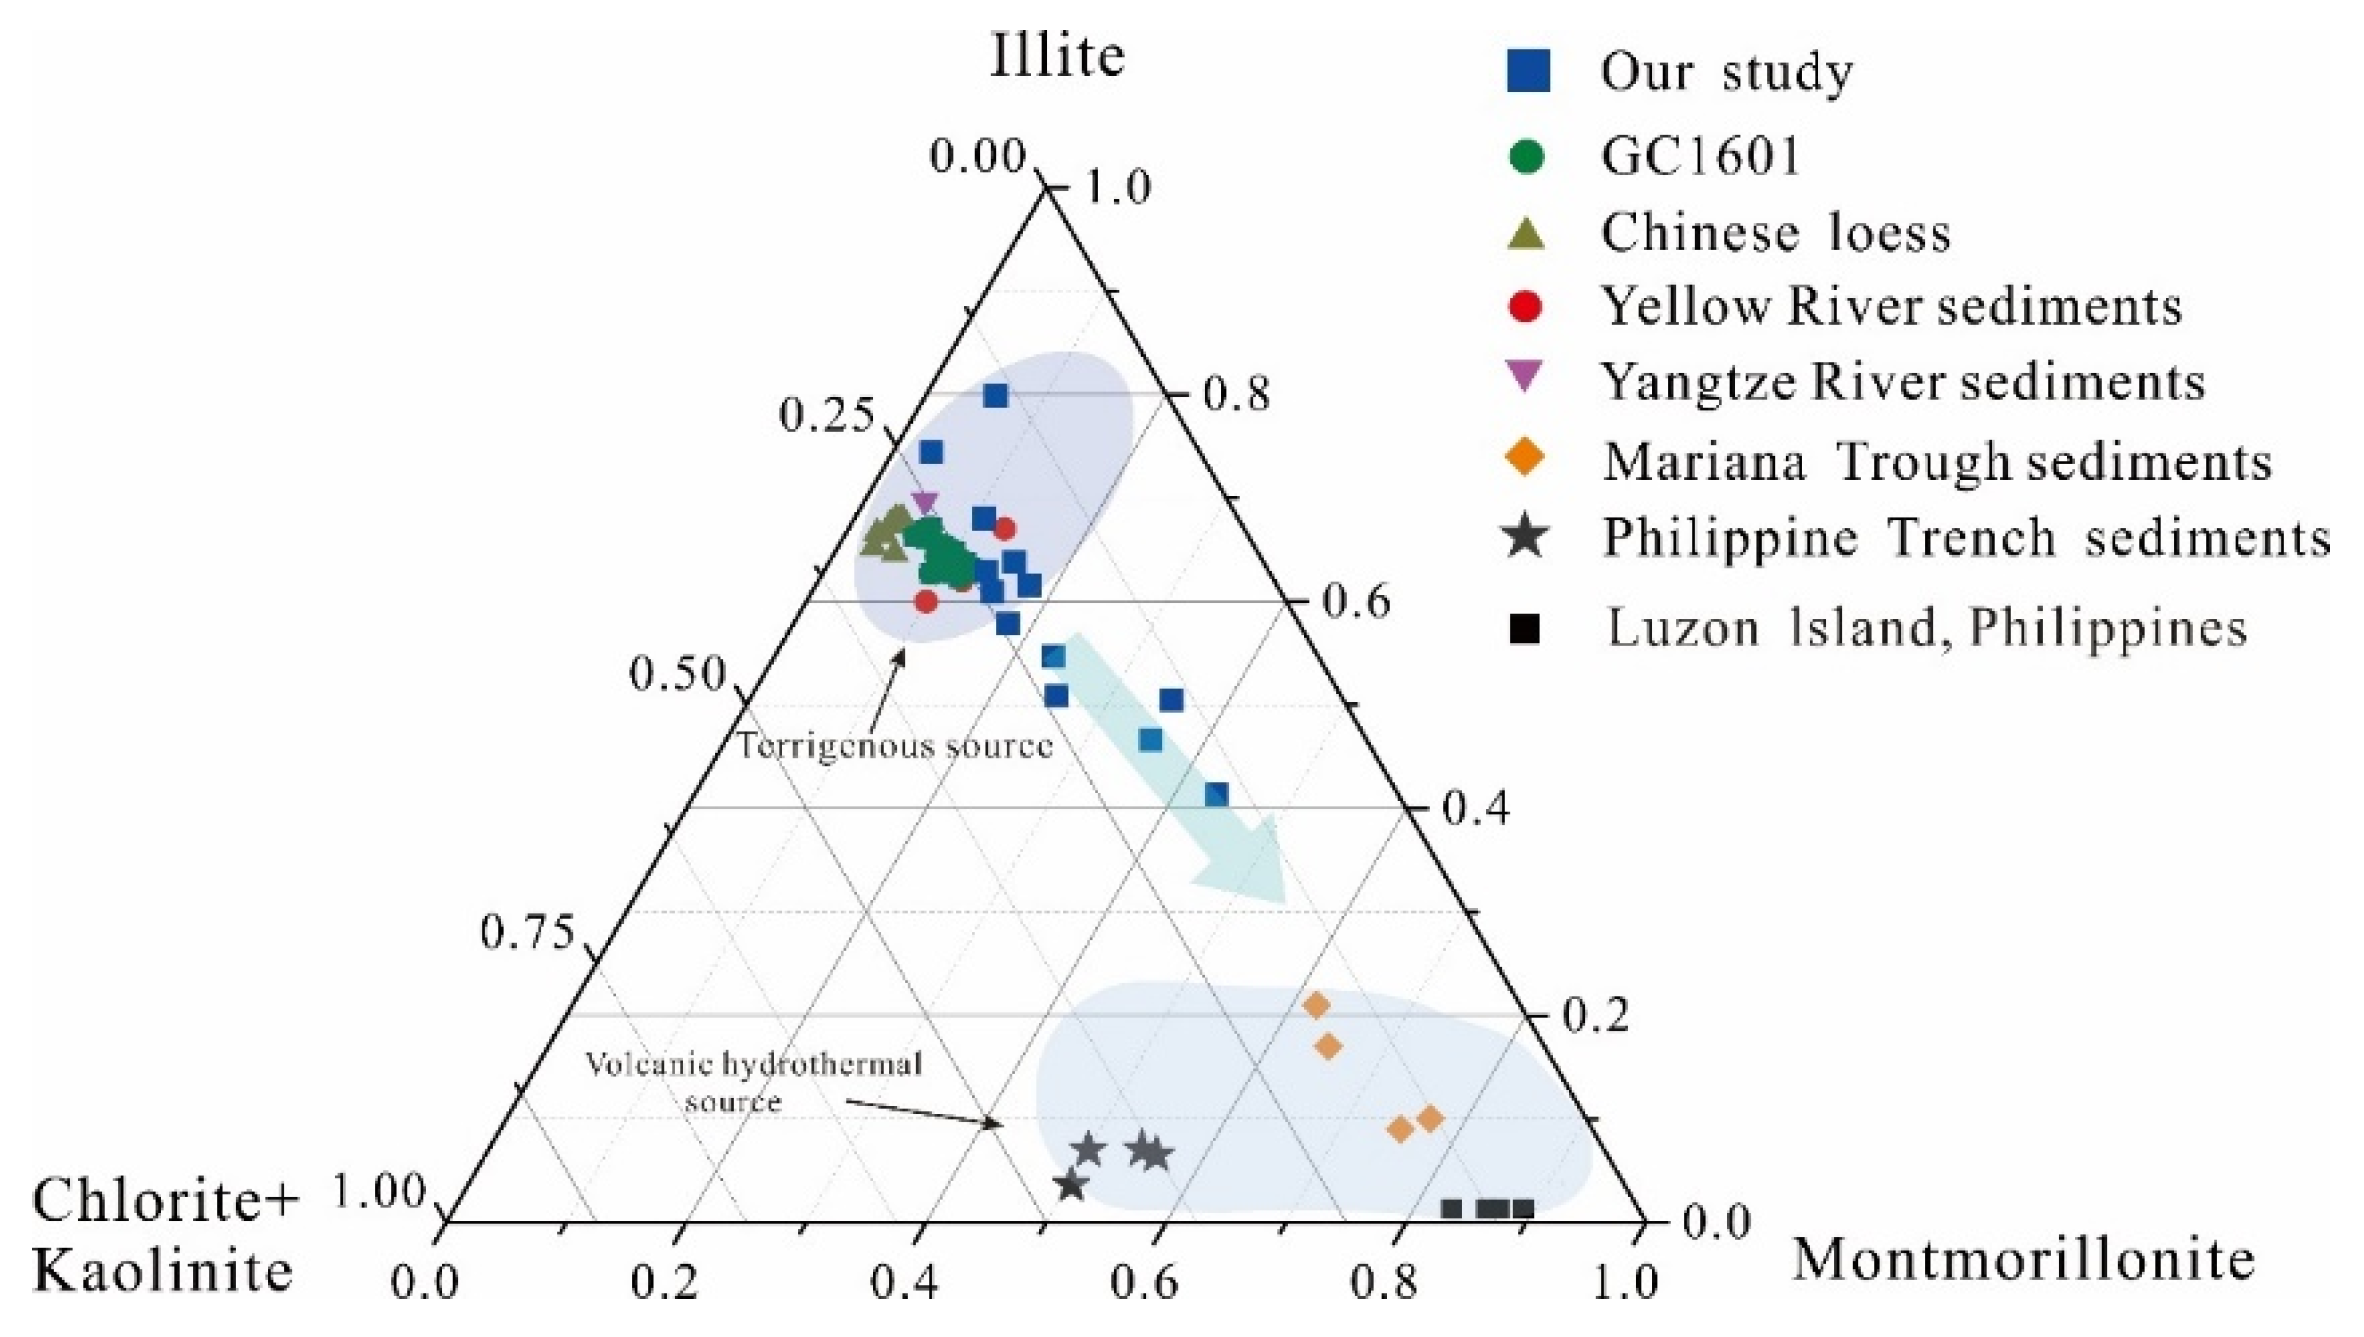
5.1.1. Clay Minerals Evidence
5.1.2. REEs Evidence
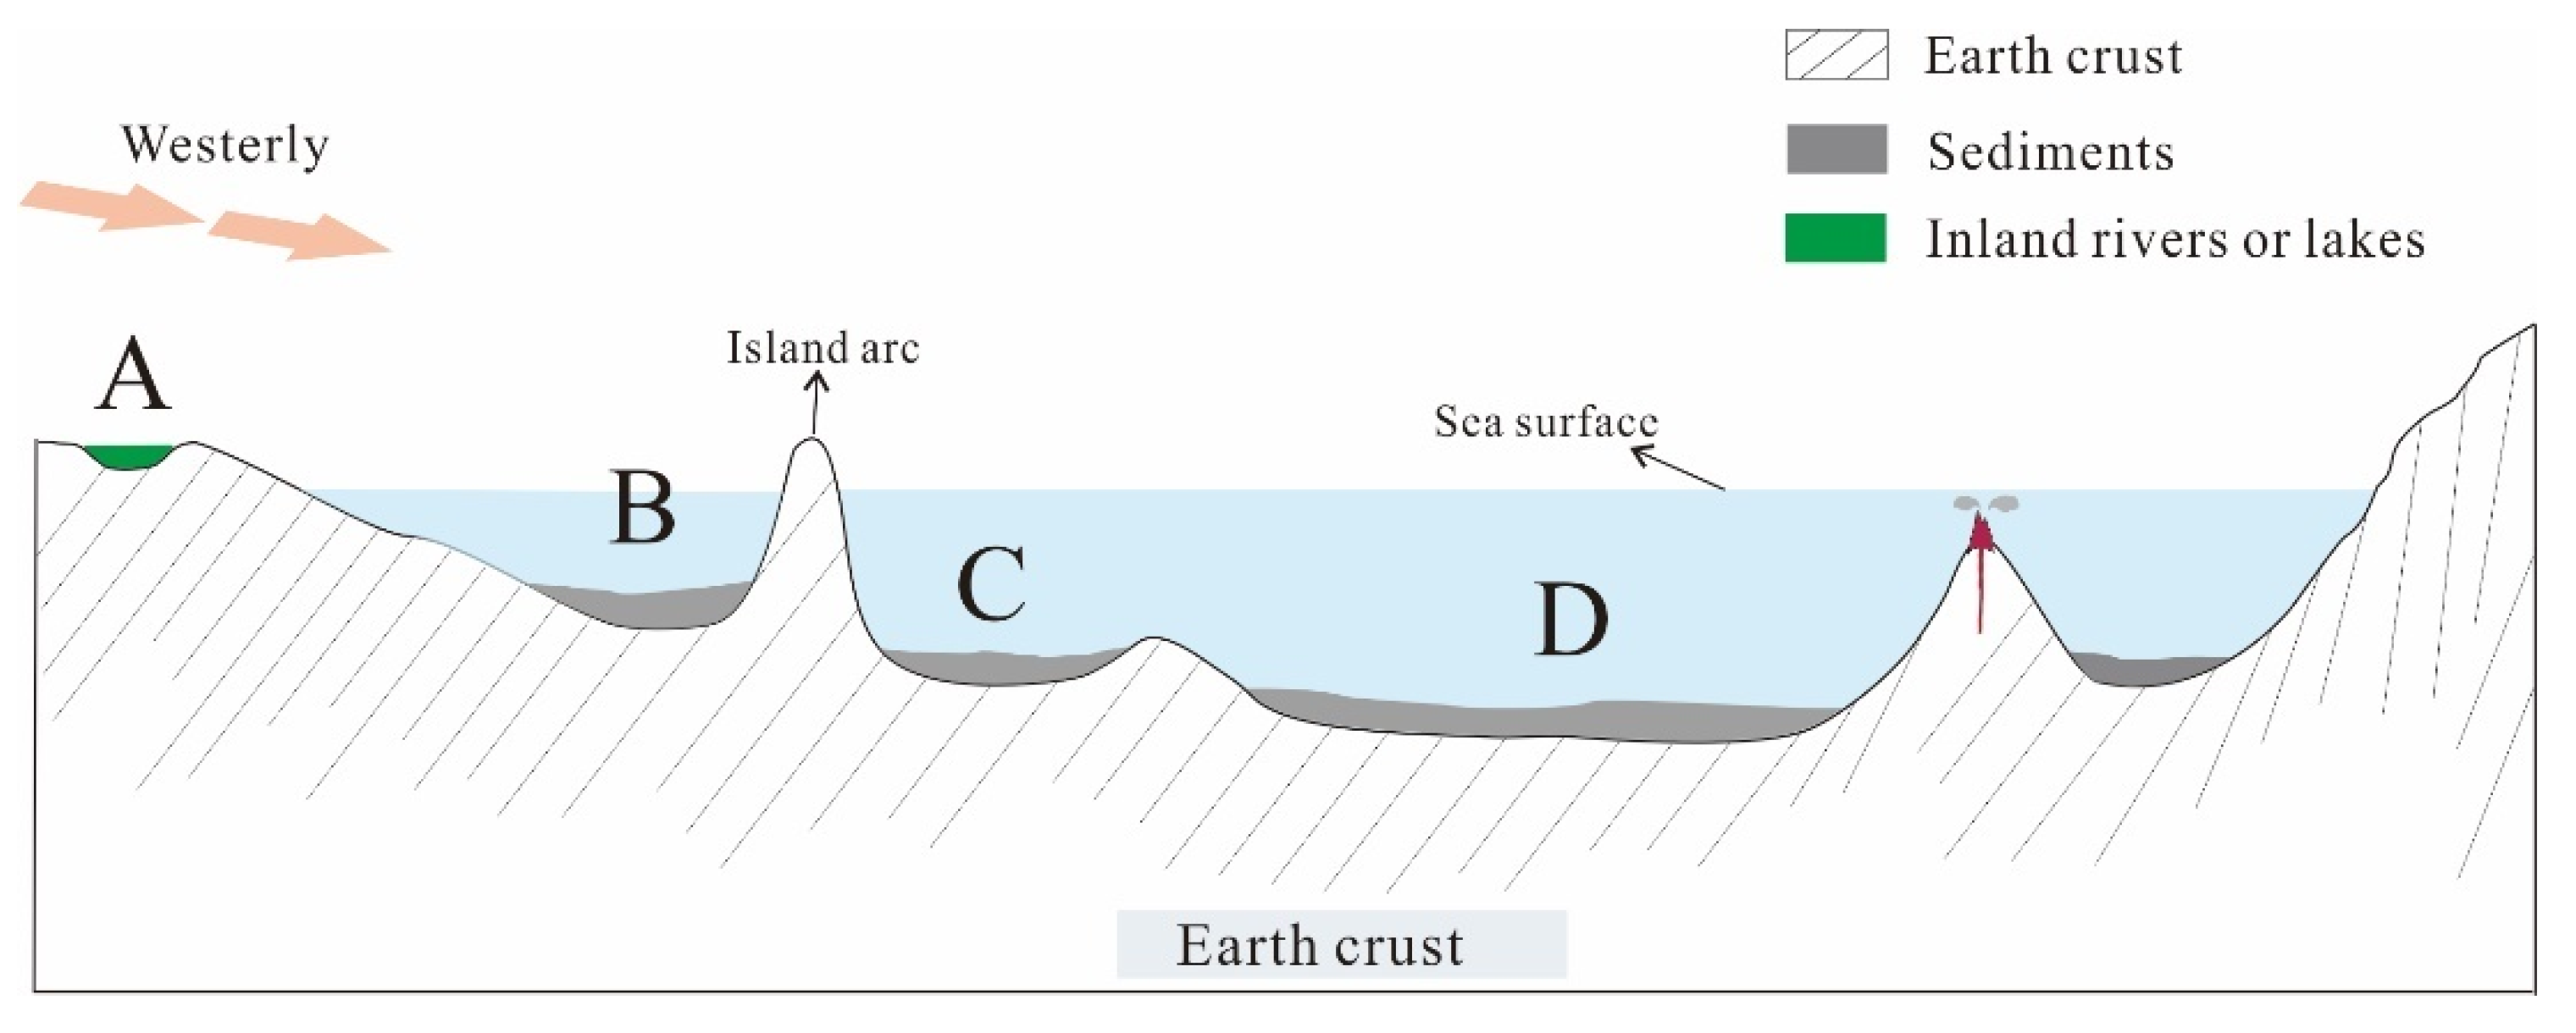
5.2. Sedimentary Source Structure Properties
6. Conclusions
- (1)
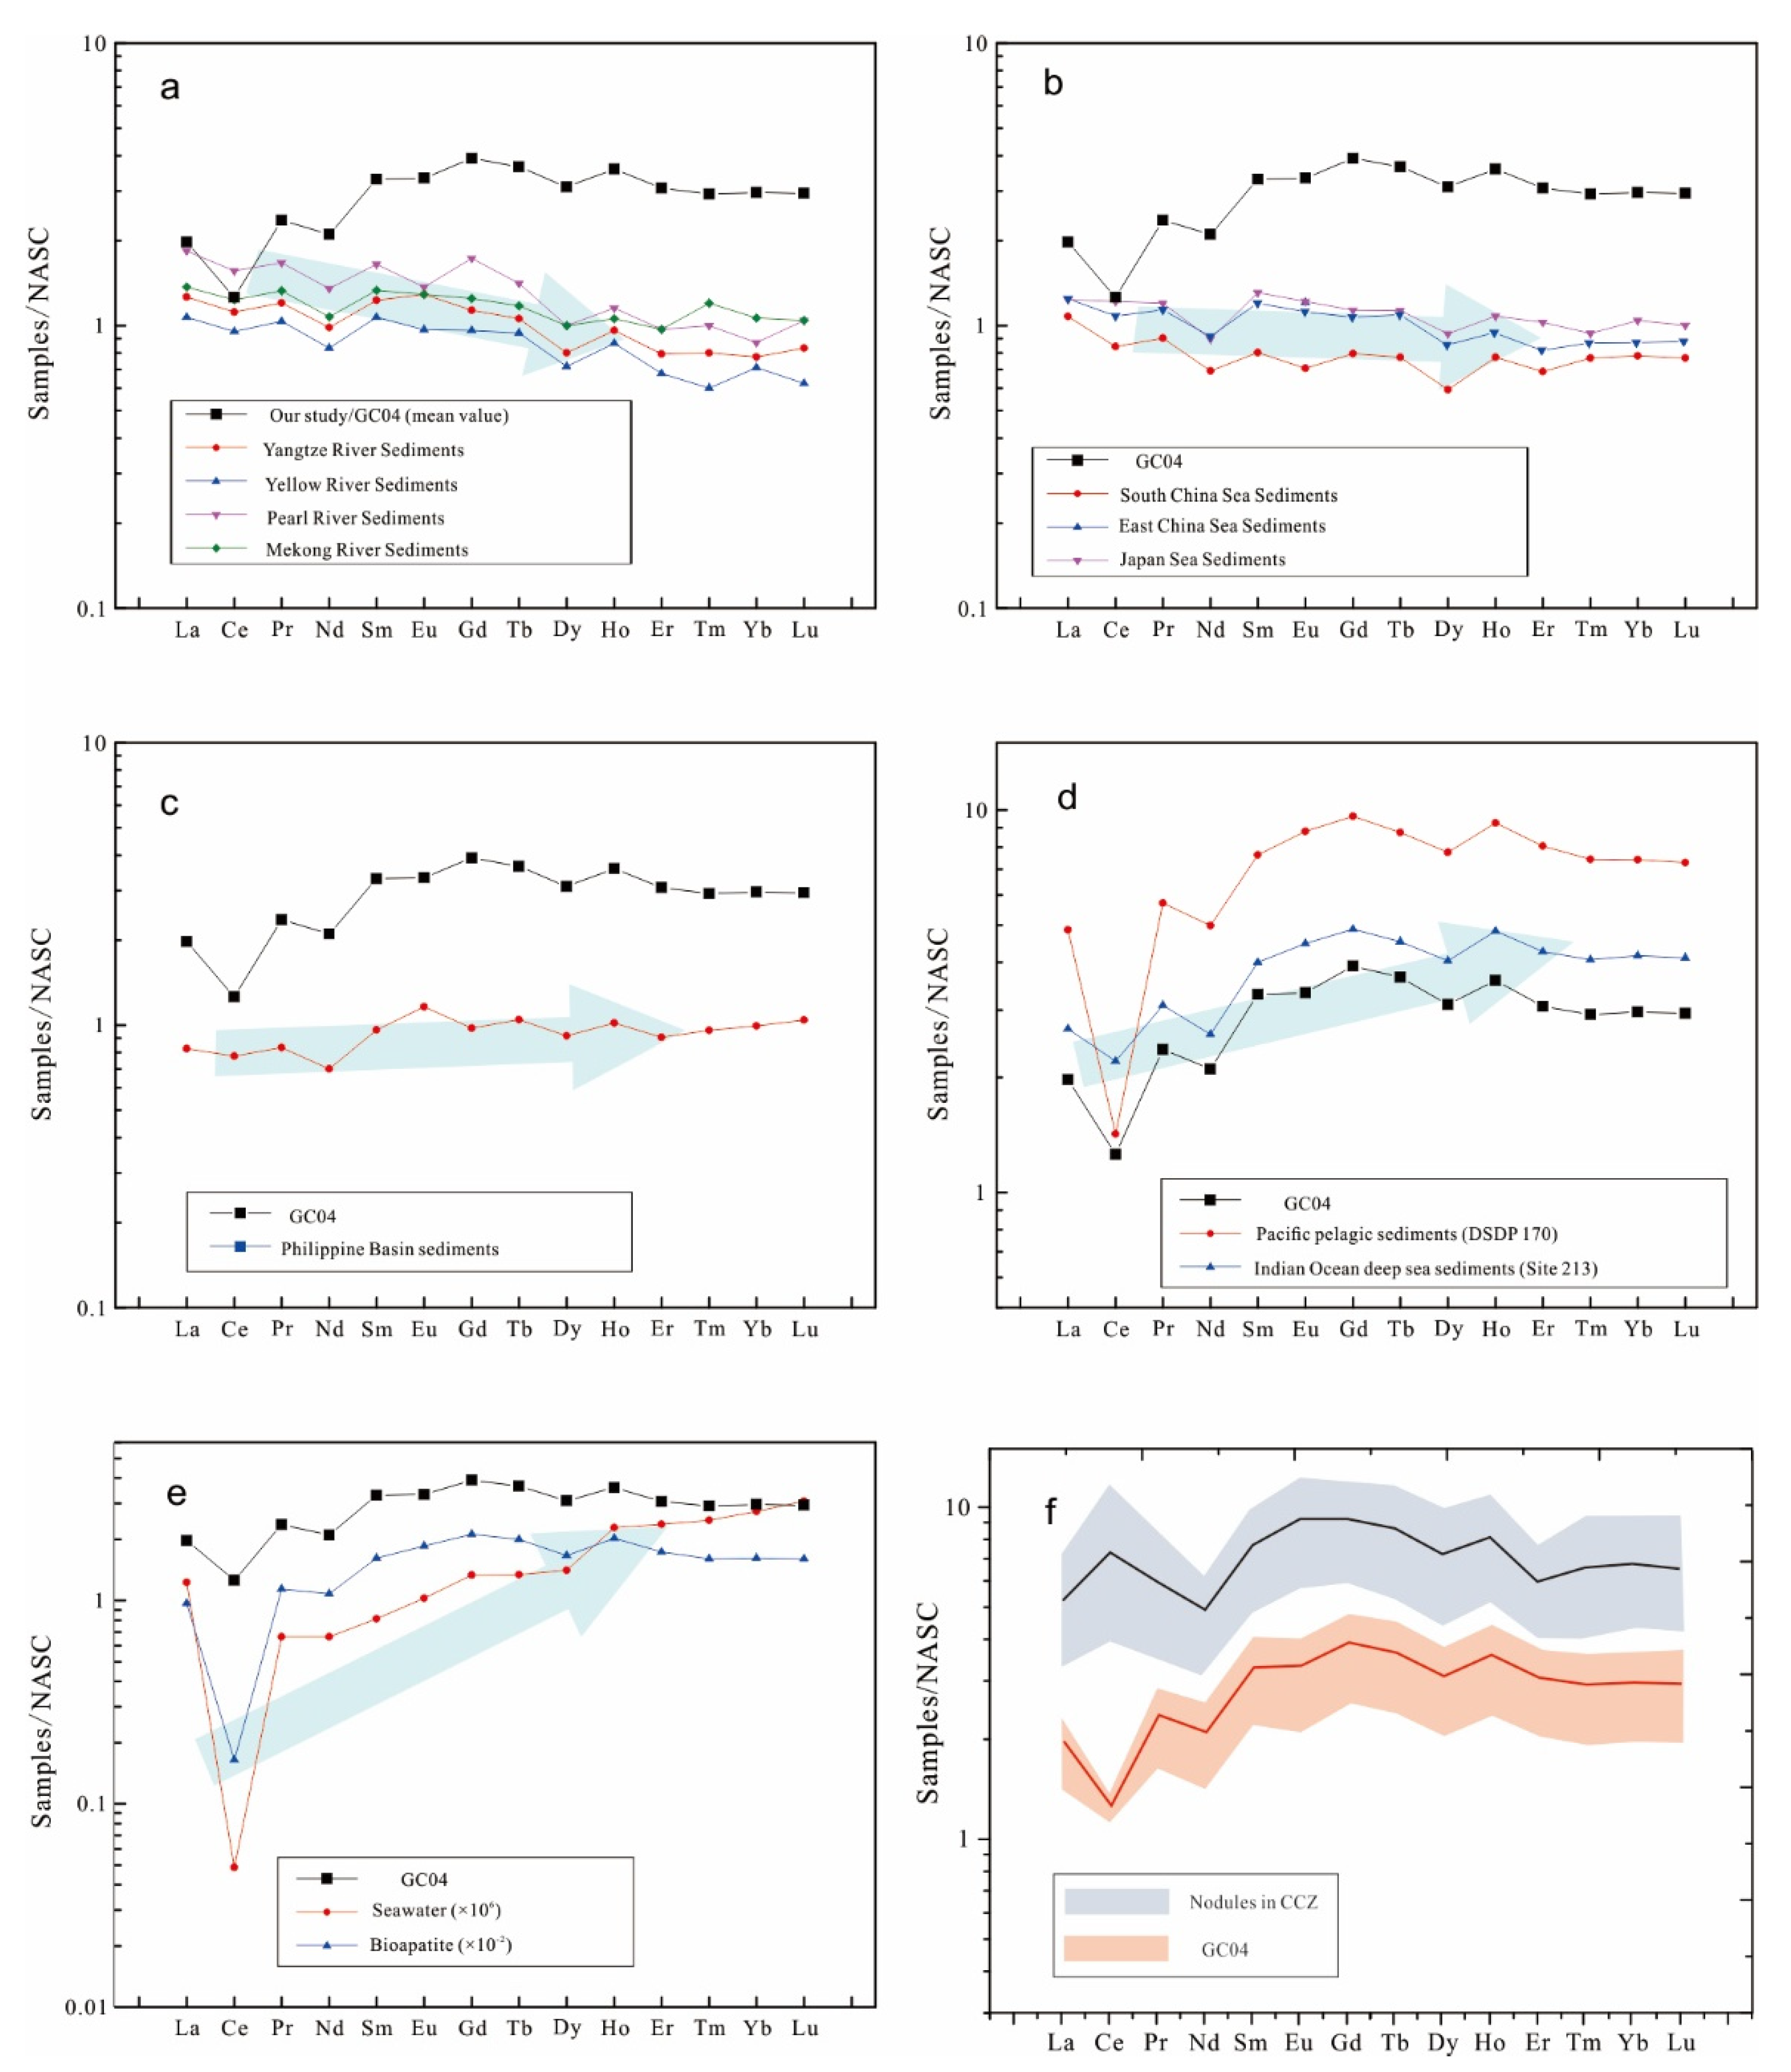
- The sediment type of the GC04 core is radiolarian clay, and the clay minerals assemblage composition of the sediment core is illite–montmorillonite–chlorite–kaolinite. Among the major elements of the core, SiO2 (49.36–54.05%) is the highest major component, followed by Al2O3 and Fe2O3. The REE distribution patterns of all samples are highly consistent, showing obvious negative Ce anomalies, slight Eu anomalies and with more obvious enrichment of HREE than of LREE.
- (2)
- The material sources of sediment in the study area are multi-source, including biogenic, terrigenous, authigenic and local sources, among which biological sources (marine biomass) contribute the most. Terrestrial, local and autochthonous sources also contribute, but to a significantly lesser extent than biogenic sources. The contributions of biogenic and terrigenous sources decrease from surface to bottom of GC04, which is opposite to that of authigenic and local sources.
- (3)
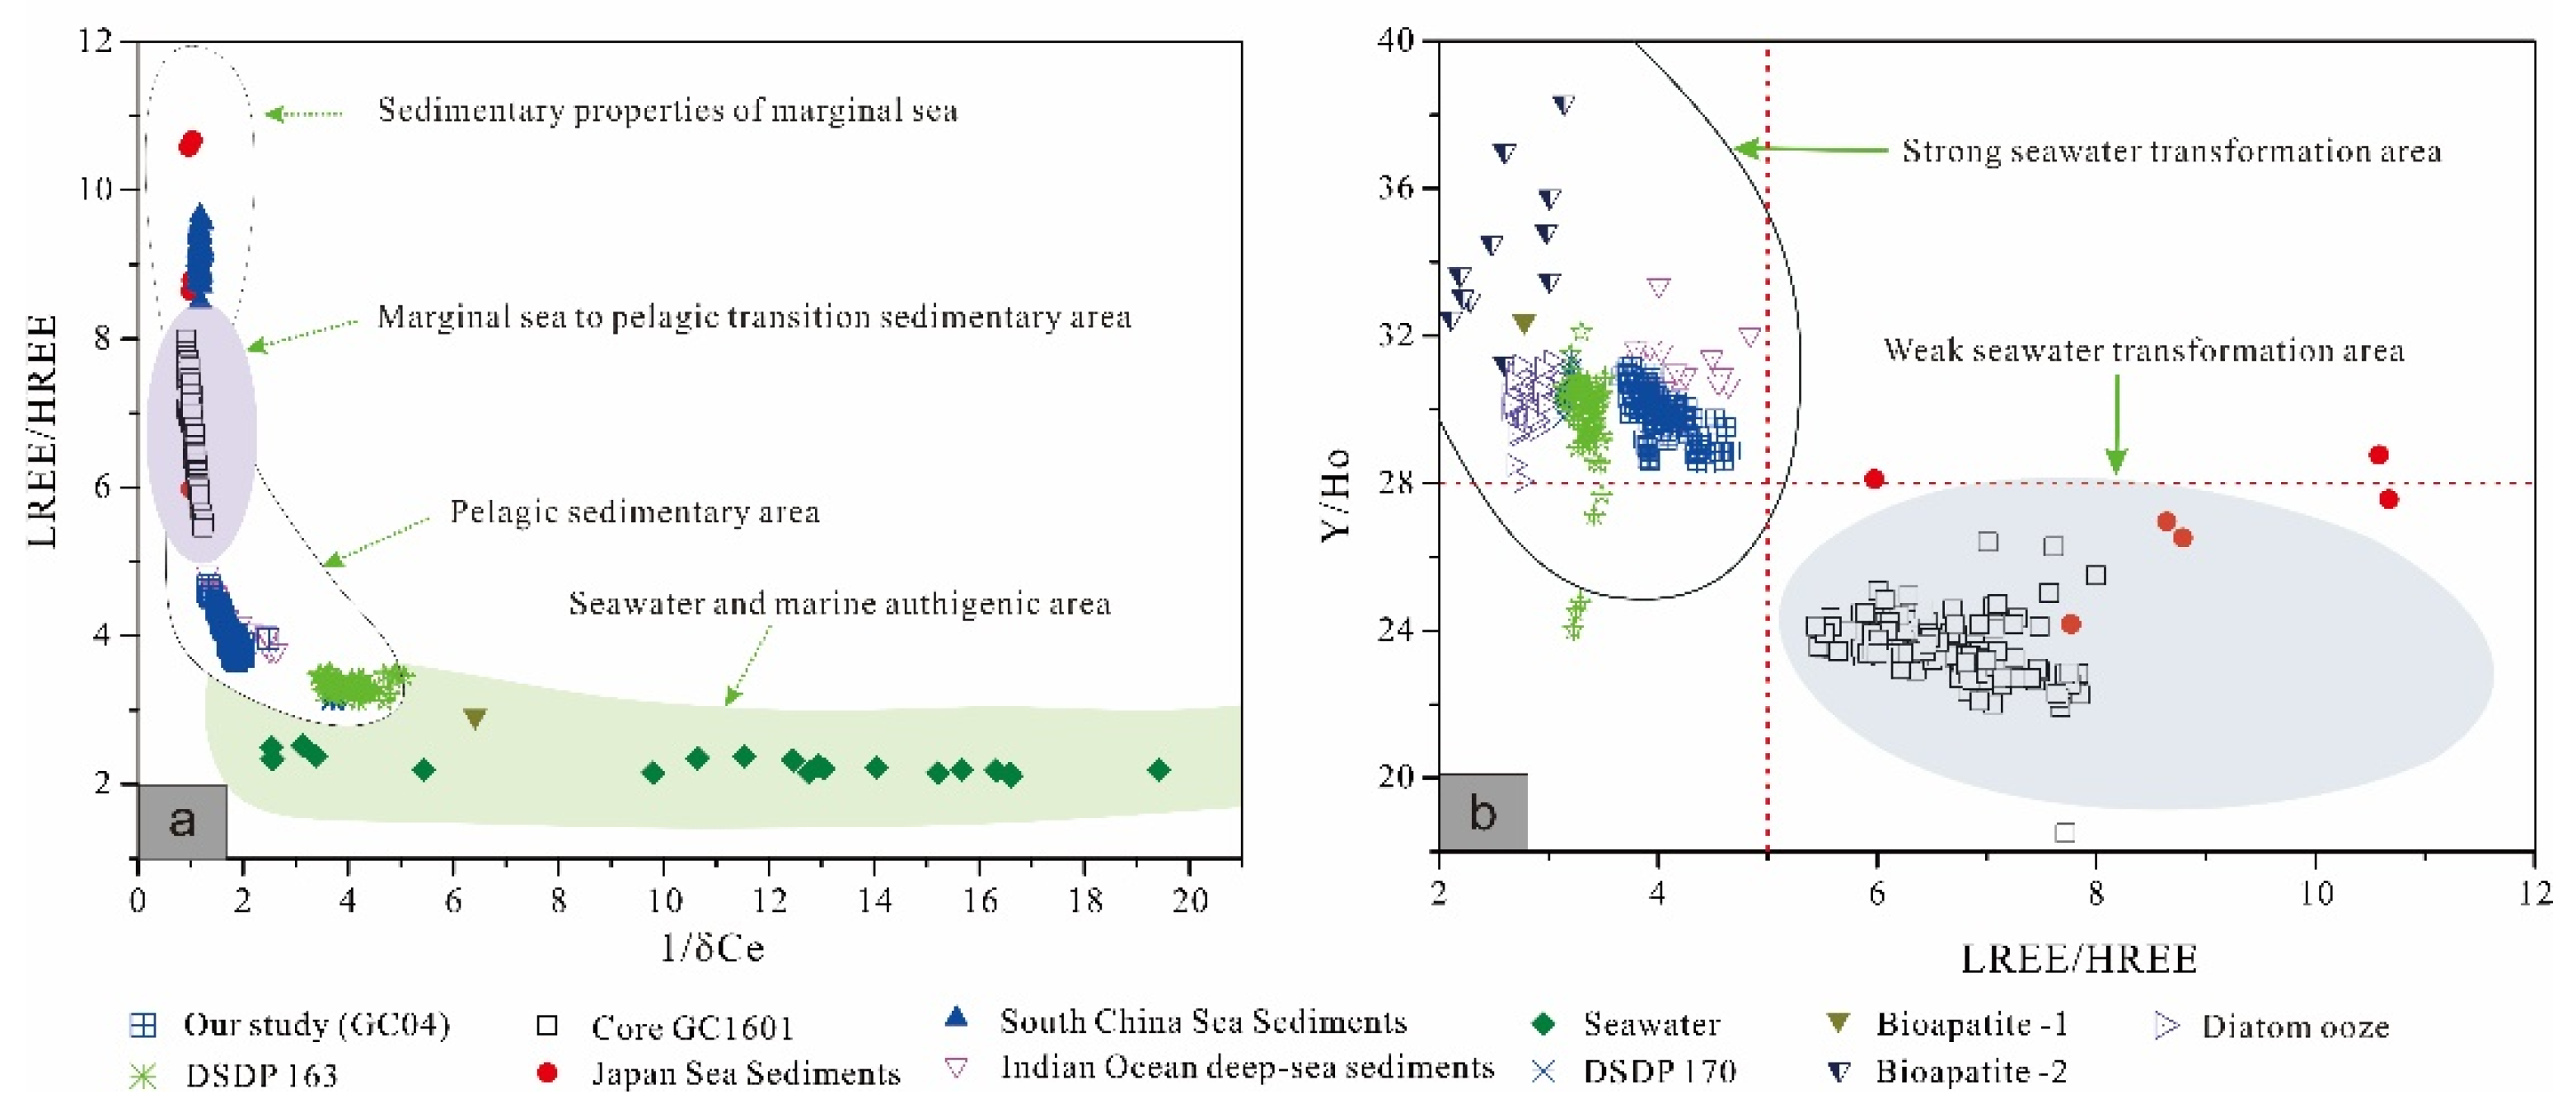
- According to the comparison between the characteristics of REE distribution patterns of sediments in the study area and other tectonic environments, as well as combined with the discrimination of relevant REE parameters, it is suggested that the sedimentary source structure of the study area refer to pelagic sedimentary properties which suffer from a strong ‘seawater effect’.
Supplementary Materials
Author Contributions
Funding
Institutional Review Board Statement
Informed Consent Statement
Data Availability Statement
Acknowledgments
Conflicts of Interest
References
- Yasukawa, K.; Nakamura, K.; Fujinaga, K.; Iwamori, H.; Kato, Y. Tracking the spatiotemporal variations of statistically independent components involving enrichment of rare-earth elements in deep-sea sediments. Sci. Rep. 2016, 6, 29603. [Google Scholar] [CrossRef] [PubMed]
- Dias, S.; Mills, R.; Taylor, R.; Ferreira, P.; Barriga, F. Geochemistry of a sediment push-core from the Lucky Strike hydrothermal field, Mid-Atlantic Ridge. Chem. Geol. 2008, 247, 339–351. [Google Scholar] [CrossRef]
- Yasukawa, K.; Ohta, J.; Miyazaki, T.; Vaglarov, B.S.; Chang, Q.; Ueki, K.; Toyama, C.; Kimura, J.I.; Tanaka, E.; Nakamura, K. Statistic and Isotopic Characterization of Deep-Sea Sediments in the Western North Pacific Ocean: Implications for Genesis of the Sediment Extremely Enriched in Rare Earth Elements. Geochem. Geophy. Geosy. 2019, 20, 3402–3430. [Google Scholar] [CrossRef]
- Dunlea, A.G.; Murray, R.W.; Sauvage, J.; Pockalny, R.A.; Spivack, A.J.; Harris, R.N.; D Hondt, S. Cobalt-based age models of pelagic clay in the South Pacific Gyre. Geochem. Geophy. Geosy. 2015, 16, 2694–2710. [Google Scholar] [CrossRef]
- Halbach, P.; Hebisch, U.; Scherhag, C. Geochemical variations of ferromanganese nodules and crusts from different provinces of the Pacific Ocean and their genetic control. Chem. Geol. 1981, 34, 3–17. [Google Scholar] [CrossRef]
- Dymond, J.; Lyle, M.; Finney, B.; Piper, D.Z.; Murphy, K.; Conard, R.; Pisias, N. Ferromanganese nodules from MANOP Sites H, S, and R—Control of mineralogical and chemical composition by multiple accretionary processes. Geochim. Cosmochim. Acta 1984, 48, 931–949. [Google Scholar] [CrossRef]
- Koschinsky, A.; Hein, J.R.; Kraemer, D.; Foster, A.L.; Halbach, P. Platinum enrichment and phase associations in marine ferromanganese crusts and nodules based on a multi-method approach. Chem. Geol. 2019, 539, 119426. [Google Scholar] [CrossRef]
- Qiu, Z.; Dong, Y.; Ma, W.; Zhang, W.; KY, Y.; Zhao, H. Geochemical characteristics of platinum-group elements in polymetallic nodules from the Northwest Pacific Ocean. Acta Oceanol. Sin. 2020, 39, 34–42. [Google Scholar] [CrossRef]
- Menendez, A.; Rachael, H.J.; Anna, L.; Douglas, C.; Kate, P. Controls on the chemical composition of ferromanganese nodules in the Clarion-Clipperton Fracture Zone, eastern equatorial Pacific. Mar. Geol. 2019, 409, 1–14. [Google Scholar] [CrossRef]
- Wegorzewski, A.V.; Kuhn, T. The influence of suboxic diagenesis on the formation of manganese nodules in the Clarion Clipperton nodule belt of the Pacific Ocean. Mar. Geol. 2014, 357, 123–138. [Google Scholar] [CrossRef]
- Koschinsky, A.; Bau, M.; Marbler, H.; Schmidt, K. Rare valuable metals in marine ferromanganese nodules–contents and accumulation processes. Z. Für Angew. Geologie. 2010, 51, 33–39. [Google Scholar]
- Heller, C.; Kuhn, T.; Versteegh, G.J.; Wegorzewski, A.V.; Kasten, S. The geochemical behavior of metals during early diagenetic alteration of buried manganese nodules. Deep Sea Res. Part I 2018, 142, 16–33. [Google Scholar] [CrossRef]
- Guan, Y.; Sun, X.; Ren, Y.; Jiang, X. Mineralogy, geochemistry and genesis of the polymetallic crusts and nodules from the South China Sea. Ore. Geol. Rev. 2017, 89, 206–227. [Google Scholar] [CrossRef]
- Cha, H.J.; Man, S.C.; Lee, C.B.; Shin, D.H. Geochemistry of surface sediments in the southwestern East/Japan Sea. J. Asian Earth Sci. 2007, 29, 685–697. [Google Scholar] [CrossRef]
- Dou, Y.; Yang, S.; Liu, Z.; Clift, P.D.; Shi, X.; Hua, Y.; Berne, S. Provenance discrimination of siliciclastic sediments in the middle Okinawa Trough since 30 ka: Constraints from rare earth element compositions. Mar. Geol. 2010, 275, 212–220. [Google Scholar] [CrossRef]
- Cha, H.; Lee, C.; Kim, B.; Choi, M.; Ruttenberg, K. Early diagenetic redistribution and burial of phosphorus in the sediments of the southwestern East Sea (Japan Sea). Mar. Geol. 2005, 216, 127–143. [Google Scholar] [CrossRef]
- Song, Y.H.; Man, S.C. REE geochemistry of fine-grained sediments from major rivers around the Yellow Sea. Chem. Geol. 2009, 26, 328–342. [Google Scholar] [CrossRef]
- Qiu, Z.; Ma, W.; Zhang, X.; Dong, Y.; Zhang, W.; Yang, K. Geochemical characteristics of surface sediments in the Northwest Pacific Ocean and their source-indicating significance. J. Zhejiang Univ. Sci. Ed. 2020, 47, 345–354. (In Chinese) [Google Scholar]
- Munksgaard, N.C.; Lim, K.; Parry, D.L. Rare earth elements as provenance indicators in North Australian estuarine and coastal marine sediments. Estuar. Coast Shelf Sci. 2003, 57, 399–409. [Google Scholar] [CrossRef]
- Fangjian, X.; Anchun, L.; Tiegang, L.; Kehui, X.U.; Shiyue, C.; Longwei, Q.; Yingchang, C. Rare earth element geochemistry in the inner shelf of the East China Sea and its implication to sediment provenances. J. Rare Earth. 2011, 2929, 702–709. [Google Scholar]
- Nie, Y.; Liu, X.; Emslie, S.D. Distribution and sources of rare earth elements in ornithogenic sediments from the Ross Sea region, Antarctica. Microchem. J. 2014, 114, 247–260. [Google Scholar] [CrossRef]
- Reykhard, L.Y.; Shulga, N.A. Fe-Mn nodule morphotypes from the NE Clarion-Clipperton Fracture Zone, Pacific Ocean: Comparison of mineralogy, geochemistry and genesis. Oro. Geol. Rev. 2019, 110, 102933. [Google Scholar] [CrossRef]
- Liu, J.; Shi, X.; Chen, L.; Huang, Y.; Wang, Y.; Cui, Y.; Bu, W. REEs and εNd of clay fractions in sediments from the eastern Pacific Ocean—Evidence for clay sources. Sci. China Ser. D Earth Sci. 2004, 34, 552–561. (In Chinese) [Google Scholar]
- Fu, F.; Zheng, Y.; Yao, X.Y.; Ni, J.Y. Mineral and geochemical characteristics of surface sediment clays in the western part of the eastern Pacific CC area. J. Mar. Sci. 2017, 3535, 55–65. (In Chinese) [Google Scholar]
- Jiang, L.; Wang, W.; Liang, J.; Dai, S.; Jiang, M.; Tao, W.; Ma, X. Geochemical Characteristics and Genetic Mechanisms of Sediments from Western Clarion-Clipperton Zone, Pacific Ocean. Acta Sedimentol. Sin. 2021, 39, 1185–1197. (In Chinese) [Google Scholar]
- Ni, J.; Zhou, H.; Pan, J.; Zhao, H.; Hu, C.; Wang, F. Geochemical characteristics of sediments from the COMRA registered pioneer area (CRPA), equatorial northeastern Pacific Ocean. Acta Oceanol Sin. 2001, 4, 553–561. [Google Scholar]
- Hein, J.R.; Mizell, K.; Koschinsky, A.; Conrad, T.A. Deep-ocean mineral deposits as a source of critical metals for high- and green-technology applications: Comparison with land-based resources. Oro. Geol. Rev. 2013, 51, 1–14. [Google Scholar] [CrossRef]
- Qiu, Z.; Ma, W.; Yang, K. Characteristics and significance of platinum-group elements (PGEs) in polymetallic nodules from CCZ, East Pacific. Geol. Sci. Technol. Inf. 2020, 39, 109–117. (In Chinese) [Google Scholar]
- Müller, R.D.; Sdrolias, M.; Gaina, C.; Roest, W.R. Age, spreading rates, and spreading asymmetry of the World’s Ocean crust. Geochem. Geophy. Geosy. 2008, 9, Q04006. [Google Scholar] [CrossRef]
- Jeong, K.S.; Kang, J.K.; Chough, S.K. Sedimentary processes and manganese nodule formation in the Korea Deep Ocean Study (KODOS) area, western part of Clarion-Clipperton fracture zones, northeast equatorial Pacific. Mar. Geol. 1994, 122, 125–150. [Google Scholar] [CrossRef]
- Biscaye, P.E. Mineralogy and sedimentation of recent deep-sea clay in atlantic ocean and adjacent areas and oceans. Geol. Soc. Am. Bull. 1965, 76, 803–832. [Google Scholar] [CrossRef]
- Haskin, L.A.; Haskin, M.A.; Frey, F.A.; Wildeman, T.R. Relative and Absolute Terrestrial Abundances of the Rare Earths. Orig. Distrib. Elem. Symp. 1968, 1, 889–912. [Google Scholar]
- Sattarova, V.V.; Artemova, A.V. Geochemical and micropaleontological character of Deep-Sea sediments from the Northwestern Pacific near the Kuril–Kamchatka Trench. Deep Sea Res. Part II 2015, 111, 10–18. [Google Scholar] [CrossRef]
- Khan, M.; Liu, J.; Liu, S.; Seddique, A.A.; Cao, L.; Rahman, A. Clay mineral compositions in surface sediments of the Ganges-Brahmaputra-Meghna River system of Bengal Basin, Bangladesh. Mar. Geol. 2019, 412, 27–36. [Google Scholar] [CrossRef]
- Ehrmann, W. Implications of late Eocene to early Miocene clay mineral assemblages in McMurdo Sound (Ross Sea, Antarctica) on paleoclimate and ice dynamics. Palaeogeogr. Palaeoclimatol. Palaeoecol. 1998, 139, 213–231. [Google Scholar] [CrossRef]
- Yasukawa, K.; Liu, H.; Fujinaga, K.; Machida, S.; Haraguchi, S.; Ishii, T.; Nakamura, K.; Kato, Y. Geochemistry and mineralogy of REY-rich mud in the eastern Indian Ocean. J. Asian Earth Sci. 2014, 93, 25–36. [Google Scholar] [CrossRef]
- Qiu, Z.; Ma, W.; Tao, C.; Koschinsky, A.; Hu, S. Clay Minerals and Sr-Nd Isotope Compositions of Core CG 1601 in the Northwest Pacific: Implications for Material Source and Rare Earth Elements Enrichments. Minerals 2022, 12, 287. [Google Scholar] [CrossRef]
- Saburo, A.; Toshio, S. Clay minerals in the deep-sea cores from the North Pacific. J. Oceanogr. 1972, 28, 138–144. [Google Scholar]
- Ren, M.; Shi, Y. Sediment discharge of the Yellow River (China) and its effect on the sedimentation of the Bohai and the Yellow Sea. Cont. Shelf Res. 1986, 6, 785–810. [Google Scholar] [CrossRef]
- Yang, S.Y.; Jung, H.S.; Lim, D.I.; Li, C.X. A review on the provenance discrimination of sediments in the Yellow Sea. Earth-Sci. Rev. 2003, 63, 93–120. [Google Scholar] [CrossRef]
- Yang, S.Y.; Jung, H.S.; Choi, M.S.; Li, C.X. The rare earth element compositions of the Changjiang (Yangtze) and Huanghe (Yellow) river sediments. Earth Planet Sci. Lett. 2002, 201, 407–419. [Google Scholar] [CrossRef]
- Köhler, B.; Singer, A.; Stoffers, P. Biogenic nontronite from marine white smoker chimneys. Clays Clay Miner. 1994, 42, 689–701. [Google Scholar] [CrossRef]
- Corliss, J.B.; Lyle, M.; Dymond, J.; Crane, K. The chemistry of hydrothermal mounds near the Galapagos Rift. Earth Planet Sci. Lett. 1978, 40, 12–24. [Google Scholar] [CrossRef]
- Gingele, F.X. Holocene climatic optimum in Southwest Africa—Evidence from the marine clay mineral record. Palaeogeogr. Palaeoclimatol. Palaeoecol. 1996, 122, 77–87. [Google Scholar] [CrossRef]
- Wan, S.; Yu, Z.; Clift, P.D.; Sun, H.; Li, A.; Li, T. History of Asian eolian input to the West Philippine Sea over the last one million years. Palaeogeogr. Palaeoclimatol. Palaeoecol. 2012, 326, 152–159. [Google Scholar] [CrossRef]
- Shi, Y.X.; Dai, X.R.; Li, J.T.; Wang, J.C. Clay minerals in the Late Interglacial Lanzhou Loess Record and their environmental significance. Mar. Geol. Quat. Geol. 1997, 17, 87–94. (In Chinese) [Google Scholar]
- Wan, S.; Li, A.; Clift, P.D.; Stuut, J.W. Development of the East Asian monsoon: Mineralogical and sedimentologic records in the northern South China Sea since 20 Ma. Palaeogeogr. Palaeoclimatol. Palaeoecol. 2007, 254, 561–582. [Google Scholar] [CrossRef]
- Zhang, D. Clay minerals composition and distribution in the Mariana Trough. Adv. Mar. Sci. 1994, 12, 32–39. [Google Scholar]
- Chi, Y.; Li, A.; Jiang, F.; Wang, M. Characterization of clay mineral assemblages and physical source analysis in the eastern Luzon Sea. Mar. Sci. 2009, 33, 80–88. (In Chinese) [Google Scholar]
- Shi, X.F.; Chen, L.R.; Li, K.Y.; Wang, Z.L. Genetic mineralogy of clay sediments in the western Philippine Sea. Mar. Geol. Quat. Geol. 1995, 15, 61–72. (In Chinese) [Google Scholar]
- Liu, Z.; Zhao, Y.; Colin, C.; Siringan, F.P.; Wu, Q. Chemical weathering in Luzon, Philippines from clay mineralogy and major-element geochemistry of river sediments. Appl. Geochem. 2009, 24, 2195–2205. [Google Scholar] [CrossRef]
- Qiu, Z.; Ma, W.; Zhang, X.; Ren, J. Geochemical characteristics of sediments in the southeastern waters of Nanjiao Island and their significance in indicating rare earth resources. Geol. Sci. Technol. Inf. 2019, 38, 205–214. (In Chinese) [Google Scholar]
- Um, I.K.; Man, S.C.; Bahk, J.J.; Song, Y.H. Discrimination of sediment provenance using rare earth elements in the Ulleung Basin, East/Japan Sea. Mar. Geol. 2013, 346, 208–219. [Google Scholar] [CrossRef]
- Webb, G.E.; Kamber, B.S. Rare earth elements in Holocene reefal microbialites: A new shallow seawater proxy. Geochim. Cosmochim. Acta 2000, 64, 1557–1565. [Google Scholar] [CrossRef]
- Shepard, F.P.; Moore, D.G. Post-glacial stratigraphy alog the central Texas coast. J. Sediment Res. 1954, 24, 140. [Google Scholar] [CrossRef]
- Jung, H.S.; Lim, D.; Choi, J.Y.; Yoo, H.S.; Rho, K.C.; Lee, H.B. Rare earth element compositions of core sediments from the shelf of the South Sea, Korea: Their controls and origins. Cont. Shelf Res. 2012, 48, 75–86. [Google Scholar] [CrossRef]
- Chen, L.; Zhang, K.; Fu, J.; Chen, H.; Li, X.; Li, Z. Geochemical characteristics of trace and rare earth elements and their material source indication significance since the deposition of S_2 in the loess paleosol of Mang Shan. Acta Sci. Nat. Univ. Sunyatseni 2018, 57, 14–23. (In Chinese) [Google Scholar]
- Davis, A.S.; Gray, L.B.; Clague, D.A.; Hein, J.R. The Line Islands revisited: New 40Ar/39Ar geochronologic evidence for episodes of volcanism due to lithospheric extension. Geochem. Geophys. Geosyst. 2013, 3, 1–28. [Google Scholar] [CrossRef]
- Alibo, D.S.; Nozaki, Y. Rare earth elements in seawater: Particle association, shale-normalization, and Ce oxidation. Geochim. Cosmochim. Acta 1999, 63, 363–372. [Google Scholar] [CrossRef]
- Haley, B.A.; Klinkhammer, G.P.; Mcmanus, J. Rare earth elements in pore waters of marine sediments. Geochim. Cosmochim. Acta 2004, 68, 1265–1279. [Google Scholar] [CrossRef]
- Gaillardet, J.; Dupré, B.; Allègre, C.J. Geochemistry of large river suspended sediments: Silicate weathering or recycling tracer? Geochim. Cosmochim. Acta 1999, 63, 4037–4051. [Google Scholar] [CrossRef]
- Zhang, C.; Wang, L. Multi-element geochemistry of sediments from the Pearl River system, China. Appl. Geochem. 2001, 16, 1251–1259. [Google Scholar] [CrossRef]
- Xu, F.; Hu, B.; Dou, Y.; Liu, X.; Wan, S.; Xu, Z.; Tian, X.; Liu, Z.; Yin, X.; Li, A. Sediment provenance and paleoenvironmental changes in the northwestern shelf mud area of the South China Sea since the mid-Holocene. Cont. Shelf Res. 2017, 144, 21–30. [Google Scholar] [CrossRef]
- Otosaka, S.; Togawa, O.; Baba, M.; Karasev, E.; Volkov, Y.N.; Omata, N.; Noriki, S. Lithogenic flux in the Japan Sea measured with sediment traps. Mar. Geol. 2004, 91, 143–163. [Google Scholar] [CrossRef]
- Chu, Z.; Hu, Q.; Liu, J.; Gao, J.; Zhu, A.; Gao, J.; Zhang, H. Geochemical characteristics of rare earth elements in surface sediments of the West Philippine Sea and the significance of source indication. Mar. Geol. Quat. Geol. 2016, 36, 53–62. (In Chinese) [Google Scholar]
- Kato, Y.; Fujinaga, K.; Nakamura, K.; Takaya, Y.; Kitamura, K.; Ohta, J.; Toda, R.; Nakashima, T.; Iwamori, H. Deep-sea mud in the Pacific Ocean as a potential resource for rare-earth elements. Nat. Geosci. 2011, 4, 535–539. [Google Scholar] [CrossRef]
- Kon, Y.; Hoshino, M.; Sanematsu, K.; Morita, S.; Tsunematsu, M.; Okamoto, N.; Yano, N.; Tanaka, M.; Takagi, T. Geochemical Characteristics of Apatite in Heavy REE-rich Deep-Sea Mud from Minami-Torishima Area, Southeastern Japan. Resour. Geol. 2014, 64, 47–57. [Google Scholar] [CrossRef]
- Wang, F.; He, G.; Sun, X.; Yang, Y.; Zhao, T. Study of rare earth element fugacity carriers in Pacific rare earth-rich deep-sea sediments. Acta Petrol. Sin. 2016, 32, 2057–2068. (In Chinese) [Google Scholar]
- Zhang, X.; Tao, C.; Shi, X.; Huaiming, L.I.; Huang, M.U.; Huang, D. Geochemical characteristics of REY-rich pelagic sediments from the GC02 in central Indian Ocean Basin. J. Rare Earths 2017, 35, 1047–1058. [Google Scholar] [CrossRef]
- Johannesson, K.H. “Rare earth element geochemistry of scleractinian coral skeleton during meteoric diagenesis: A sequence through”. Sedimentology 2011, 59, 729–732. [Google Scholar] [CrossRef]
- Liu, J.; Xiang, R.; Chen, Z.; Chen, M.; Yan, W.; Zhang, L.; Chen, H. Sources, transport and deposition of surface sediments from the South China Sea. Deep Sea Res. Part I 2013, 71, 92–102. [Google Scholar] [CrossRef]
- Cwab, C.; Lza, C.; Ylab, C.; Jha, C.; Hca, C.; Ming, S. Geochemical record of the sediments in the continental shelf of the northwestern South China Sea: Implications for the provenance and sedimentary evolution. Mar. Geol. 2021, 440, 106582. [Google Scholar]


| Layer/cm | Relative Content of Four Clay Minerals (%) | M/I | Illite | ||||
|---|---|---|---|---|---|---|---|
| Montmorillonite | Illite | Kaolinite | Chlorite | CI | Crystallinity | ||
| 0–10 | 15.0 | 60.9 | 7.1 | 17.0 | 0.25 | 0.28 | 0.222 |
| 60–70 | 10.8 | 68.0 | 7.0 | 14.2 | 0.16 | 0.45 | 0.199 |
| 180–190 | 17.9 | 57.8 | 9.7 | 14.5 | 0.31 | 0.43 | 0.297 |
| 240–250 | 17.8 | 61.5 | 6.7 | 13.9 | 0.29 | 0.44 | 0.248 |
| 270–280 | 25.4 | 50.9 | 9.5 | 14.1 | 0.50 | 0.44 | 0.283 |
| 300–310 | 15.4 | 63.8 | 7.1 | 13.7 | 0.24 | 0.44 | 0.194 |
| 390–400 | 3.2 | 74.4 | 7.9 | 14.5 | 0.04 | 0.50 | 0.161 |
| 420–430 | 35.2 | 50.5 | 6.1 | 8.2 | 0.70 | 0.44 | 0.286 |
| 450–460 | 5.9 | 79.9 | 5.9 | 8.3 | 0.07 | 0.50 | 0.245 |
| 480–490 | 23.3 | 54.6 | 8.7 | 13.3 | 0.43 | 0.54 | 0.225 |
| 510–520 | 13.5 | 62.9 | 9.3 | 14.3 | 0.21 | 0.56 | 0.246 |
| 540–550 | 35.5 | 46.6 | 5.3 | 12.6 | 0.76 | 0.50 | 0.225 |
| 560–570 | 43.6 | 41.3 | 6.3 | 8.8 | 1.05 | 0.55 | 0.252 |
| Max | 43.6 | 79.9 | 9.7 | 17.0 | 1.05 | 0.56 | 0.297 |
| Min | 3.2 | 41.3 | 5.3 | 8.2 | 0.04 | 0.28 | 0.161 |
| Average | 20.2 | 59.5 | 7.4 | 12.9 | 0.39 | 0.47 | 0.237 |
| Ratios | Terrigenous Source | Local Source | Biogenic Sources | Authigenic Source | |
|---|---|---|---|---|---|
| NASC | Chinese Loess | Seamount Basalt | Diatom Ooze | Seawater | |
| La/Yb | 0.33 | 0.38 | 0.54 | 0.28 | 0.49 |
| La/Tb | 0.46 | 0.46 | 0.41 | 0.08 | 0.41 |
| Average | 0.40 | 0.42 | 0.48 | 0.18 | 0.45 |
Publisher’s Note: MDPI stays neutral with regard to jurisdictional claims in published maps and institutional affiliations. |
© 2022 by the authors. Licensee MDPI, Basel, Switzerland. This article is an open access article distributed under the terms and conditions of the Creative Commons Attribution (CC BY) license (https://creativecommons.org/licenses/by/4.0/).
Share and Cite
Qiu, Z.; Tao, C.; Ma, W.; Dias, Á.A.; Hu, S.; Shao, Y.; Yang, K.; Zhang, W. Material Source of Sediments from West Clarion–Clipperton Zone (Pacific): Evidence from Rare Earth Element Geochemistry and Clay Minerals Compositions. J. Mar. Sci. Eng. 2022, 10, 1052. https://doi.org/10.3390/jmse10081052
Qiu Z, Tao C, Ma W, Dias ÁA, Hu S, Shao Y, Yang K, Zhang W. Material Source of Sediments from West Clarion–Clipperton Zone (Pacific): Evidence from Rare Earth Element Geochemistry and Clay Minerals Compositions. Journal of Marine Science and Engineering. 2022; 10(8):1052. https://doi.org/10.3390/jmse10081052
Chicago/Turabian StyleQiu, Zhongrong, Chunhui Tao, Weilin Ma, Ágata Alveirinho Dias, Siyi Hu, Yuexiao Shao, Kehong Yang, and Weiyan Zhang. 2022. "Material Source of Sediments from West Clarion–Clipperton Zone (Pacific): Evidence from Rare Earth Element Geochemistry and Clay Minerals Compositions" Journal of Marine Science and Engineering 10, no. 8: 1052. https://doi.org/10.3390/jmse10081052
APA StyleQiu, Z., Tao, C., Ma, W., Dias, Á. A., Hu, S., Shao, Y., Yang, K., & Zhang, W. (2022). Material Source of Sediments from West Clarion–Clipperton Zone (Pacific): Evidence from Rare Earth Element Geochemistry and Clay Minerals Compositions. Journal of Marine Science and Engineering, 10(8), 1052. https://doi.org/10.3390/jmse10081052