Article

Netting Damage Detection for Marine Aquaculture Facilities Based on Improved Mask R-CNN

1
National Engineering Research Center for Marine Aquaculture, NO.1 Haida South Road, Zhejiang Ocean University, Zhoushan 316022, China
2
School of Fishery, Zhejiang Ocean University, Zhoushan 316000, China
*
Author to whom correspondence should be addressed.
These authors contributed equally to this work.
J. Mar. Sci. Eng. 2022, 10(7), 996; https://doi.org/10.3390/jmse10070996
Submission received: 6 July 2022 / Revised: 18 July 2022 / Accepted: 19 July 2022 / Published: 21 July 2022
(This article belongs to the Section Marine Aquaculture)

Abstract

:
Netting damage limits the safe development of marine aquaculture. In order to identify and locate damaged netting accurately, we propose a detection method using an improved Mask R-CNN. We create an image dataset of different kinds of damage from a mix of conditions and enhance it by data augmentation. We then introduce the Recursive Feature Pyramid (RFP) and Deformable Convolution Network (DCN) structures into the learning framework to optimize the basic backbone for a marine environment and build a feature map with both high-level semantic and low-level localization information of the network. This modification solves the problem of poor detection performance in damaged nets with small and irregular damage. Experimental results show that these changes improve the average precision of the model significantly, to 94.48%, which is 7.86% higher than the original method. The enhanced model performs rapidly, with a missing rate of about 7.12% and a detection period of 4.74 frames per second. Compared with traditional image processing methods, the proposed netting damage detection model is robust and better balances detection precision and speed. Our method provides an effective solution for detecting netting damage in marine aquaculture environments.

1. Introduction

The increase in contemporary demand for high-quality protein has led to marine aquaculture becoming a significant part of producing higher-quality aquaculture products while protecting the ocean environment [1]. Several types of marine aquaculture facilities exist, including deep-sea cage farming, raft farming, deep-sea platform farming, and net enclosure farming [2]. After years of development, the engineering and construction of aquaculture facilities such as cages and net enclosures have made clear progress and greatly improved their resistance to waves [3]. Netting is the main component of aquaculture facilities, but it is easily damaged, with the damage being difficult to detect. The result is a problem in urgent need of a solution. Every year, huge economic losses are caused by the escape of cultured fish due to damaged netting. For example, in Ocean Farm 1, about 16,000 salmon with an average weight of 4 kg escaped due to torn nets in September 2018 [4], and a similar incident happened in August 2020, leading to the escape of an unknown number of salmon, which caused large economic losses to the farm [5]. Netting damage detection has become a significant obstacle restricting the development of marine facility aquaculture.
At present, damage detection for underwater netting systems relies mainly on diver inspection, a process that is inefficient, costly, and inherently risky for the divers. In recent years, various underwater cameras and submersibles have been developed and combined with machine vision algorithms to examine netting for damage in hopes of replacing manual visual inspection [6]. However, traditional machine vision methods often require different image processing algorithms tailored to specific environments, which is a cumbersome process with low reusability [7]. In response, research has shifted to deep learning models [8] that have been successfully applied in other engineering fields, such as U-Net [9], Mask R-CNN [10], YOLO [11], and Cascade R-CNN [12]. Automatic, reliable damage detection using these methods has become an area of great interest in the field of marine aquaculture.
In the case of underwater netting damage detection, there are three implementation schemes typically used for machine (rather than manual) analysis: embedded detection methods, sensor-based digital twin technology [13], and underwater detector-based image analysis methods. The embedded detection method adds metal wire with an insulation layer to each mesh. When the netting is damaged, current is conducted through the seawater and electrodes, enabling the damaged location to be decoded [14,15,16]. However, this method increases the hydrodynamic load of the netting, and the laying and maintenance of the conductors are more costly and difficult than netting without the wire. Digital twin technology is a new approach that outputs the state of the netting based on the data monitored by sensors. By training the artificial neural network with a large quantity of sensing data from numerical simulation models of the netting, a digital twin can be generated to detect whether the net is damaged or not based on the input data such as wave height, period, and tension value [13]. The image analysis method finds damage using computer vision algorithms to identify damage in images of the netting taken underwater by cameras on a remotely operated underwater vehicle (ROUV or just ROV) [17,18]. A traditional image algorithm detects the damaged area by analyzing the characteristics of its features, such as the distribution of mesh nodes [19] and the characteristic gradient curve of mesh holes [20]. This algorithm model is less effective at detecting netting that has deformed under actual high sea conditions. The rapid development of deep learning in engineering fields has also led to its use in marine facility aquaculture [21]. Liao et al. used an improved multiscale fusion algorithm and MobileNet-SSD target detection framework for damage detection using deep-sea netting images collected by an autonomous underwater vehicle (AUV) to detect netting damage quickly [22]. Small areas of damage are not detected correctly, although small areas usually develop into larger ones. Thus, this convolutional neural network (CNN) method still needs to be optimized to enhance the detection accuracy for better application.
CNNs have pushed the field of object detection to a new level and are reliably adaptable to different situations [23]. Object detection frameworks using CNNs are usually categorized as one-stage or two-stage detection frameworks. A one-stage framework directly and quickly generates detection results from the image. Representative examples include SSD [24] and YOLO. Two-stage methods use an R-CNN [25] structure that greatly improves the detection accuracy. Such methods extract the region proposals from the image and then obtain the detection results by secondary correction using the region proposals. Typical implementations combine methods such as Faster R-CNN [26], Mask R-CNN, and Cascade R-CNN with feature extraction techniques such as the Feature Pyramid Network (FPN) [27] and Deformable Convolution Network (DCN) [28]. Two-stage methods thus offer high detection accuracy with a speed that meets the requirements of typical applications.
In this paper, we propose a scheme for underwater netting damage detection in aquaculture facilities using computer vision and deep learning algorithms. To detect damage, we use the Mask R-CNN model. Our scheme then introduces the Recursive Feature Pyramid (RFP) and DCN algorithms to improve the model’s ability to detect the small-size and irregular damage as well as the convolution efficiency. We validate our scheme using actual netting images and compare its results with the detection results from other target detection models to evaluate the performance of this model.

2. Materials and Methods

2.1. Damaged Netting Images Dataset

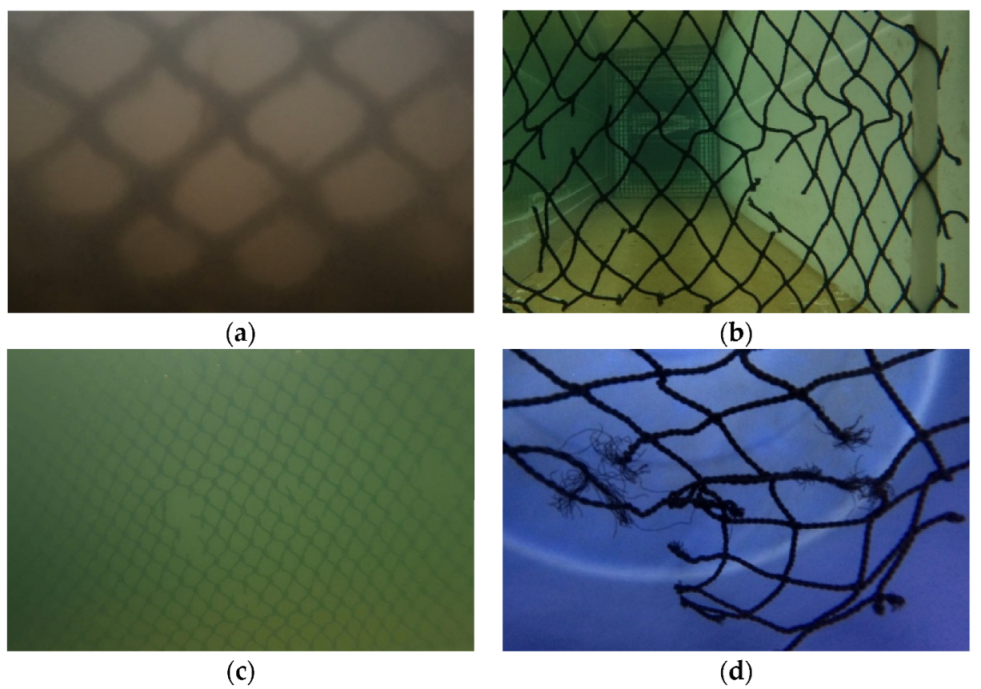
2.1.1. Netting Images Acquisition

The original image dataset used for the experimental training contains images of actually damaged netting from aquaculture facilities and simulated damaged netting from a laboratory wave flume that was captured at 0.2–0.5 m from the netting using a GoPro camera (5312 × 2988 pixels). The structural parameters of the test netting are shown in Table 1. The actual images were collected from a net enclosure facility on Taohua Island and a net cage on Changqi Island in Zhoushan from July to September 2021, covering a variety of sea conditions such as high tide, low tide, and clear and turbid water. The simulated images were created by an MTS tensile machine with artificial abrasion to simulate common netting damage from actual aquaculture, including narrow tears, twine fractures, and irregular holes. Sample images of damaged netting are shown in Figure 1. The dataset contains 2000 images in total, with a 9:1 ratio between simulated laboratory samples to actual samples from an ocean facility.

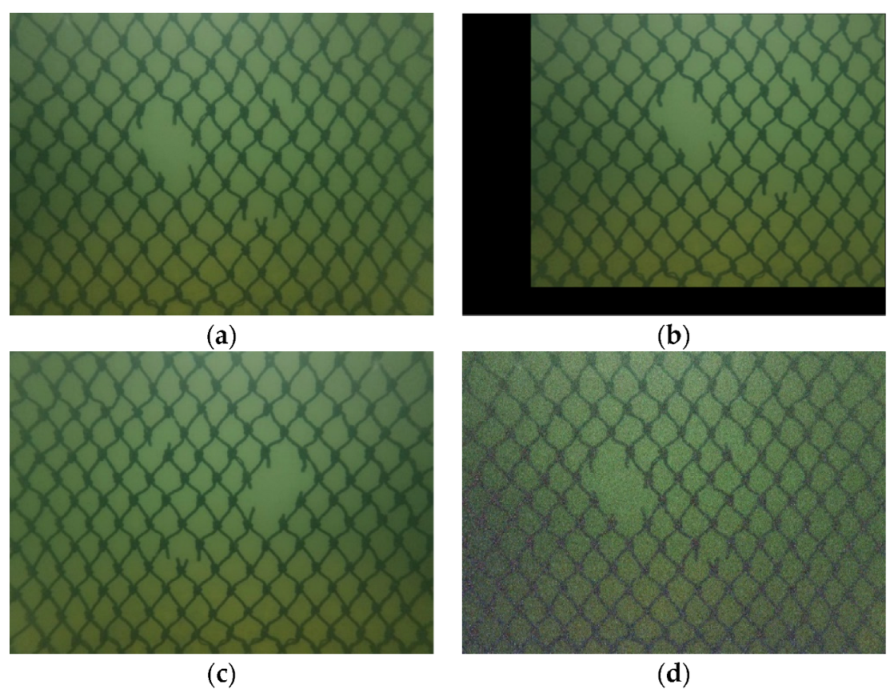
2.1.2. Image Processing

Data augmentation refers to a series of image processing operations that increase the size and diversity of the training sample set in response to overfitting in deep convolutional neural networks. Augmentation is generally used to improve the generalization performance of the model [29]. After translating, mirroring, rotating, and adding noise to the original image (as in Figure 2), the final dataset size was enhanced to 12,000.

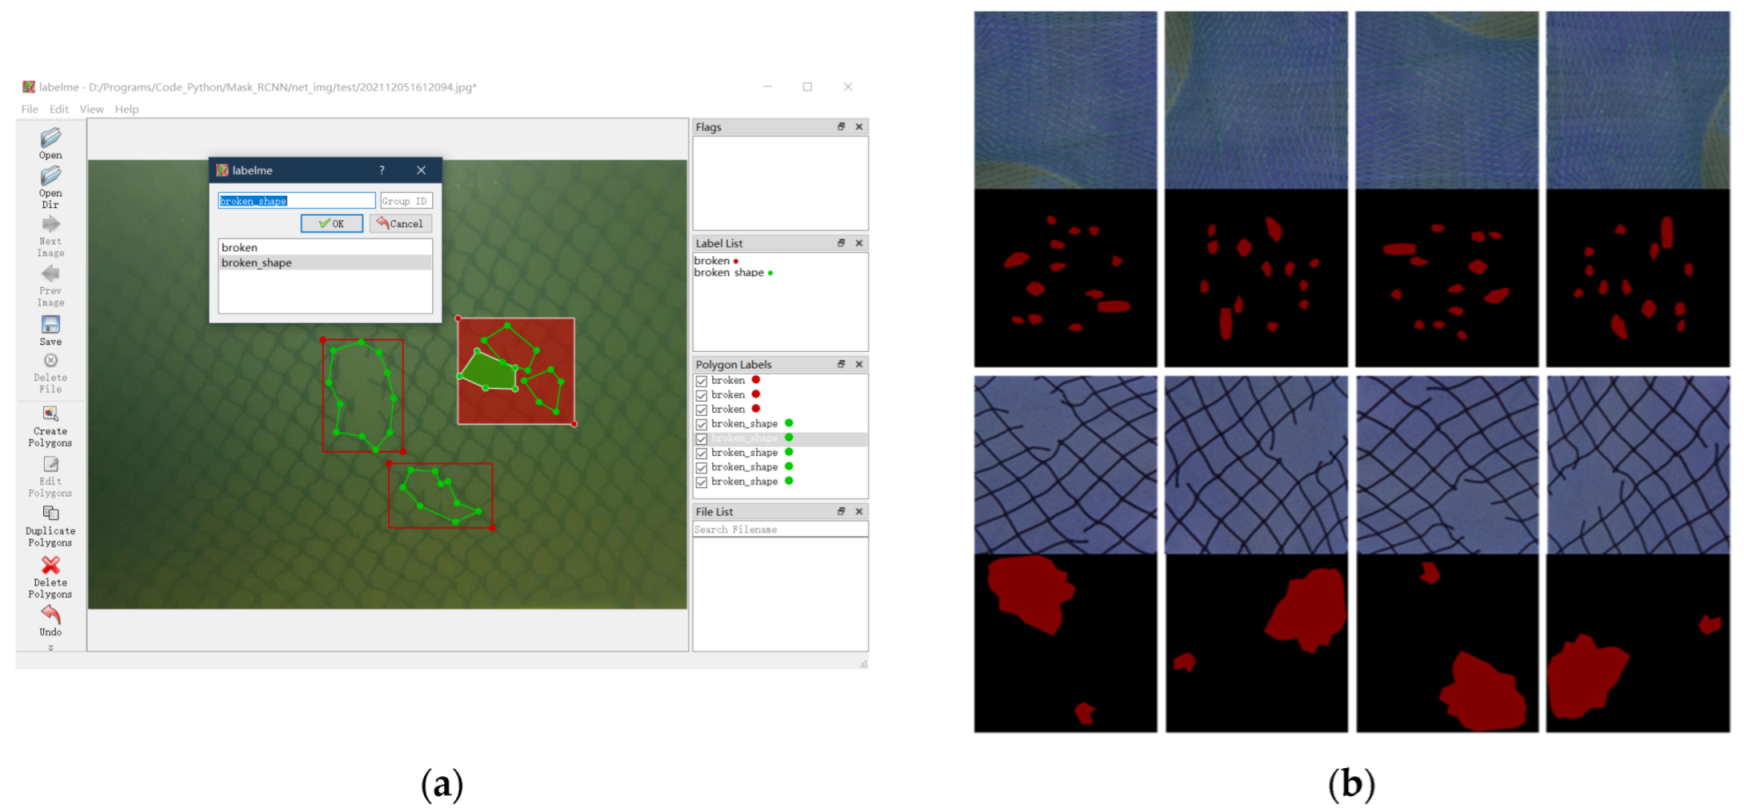
2.1.3. Dataset Annotation

In order to generate training sample sets, we labeled the damaged netting images using LabelMe 4.5.9 (a project created by the MIT Computer Science and Artificial Intelligence Laboratory (CSAIL)) [30]. The process of labeling annotations and some training sample mask layers are shown in Figure 3.

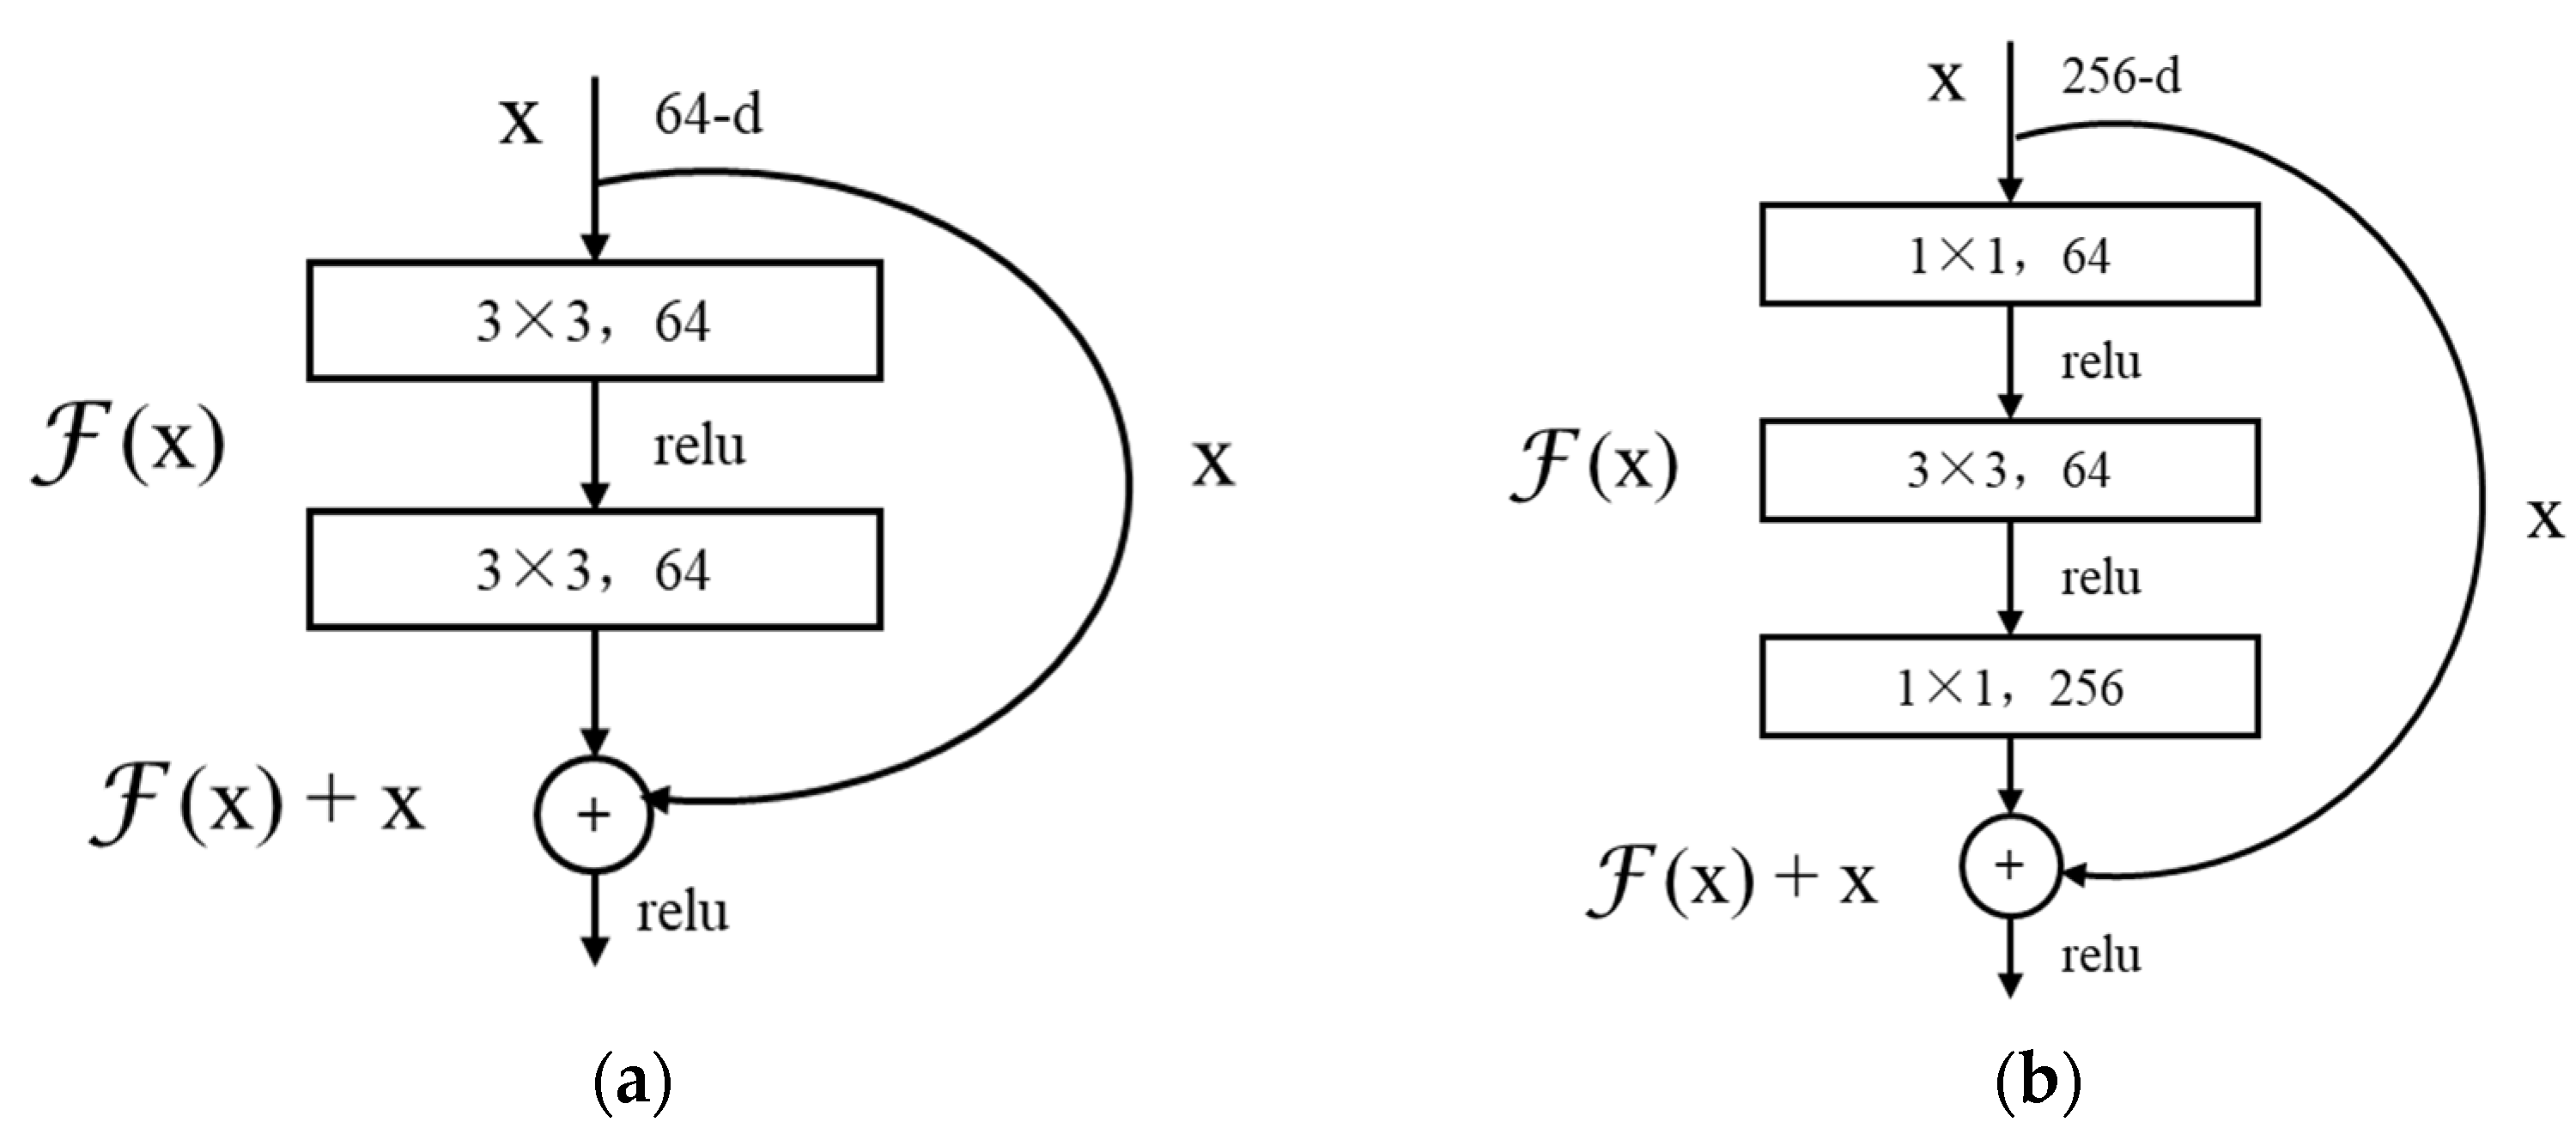
2.2. Basic Network Selection

We use Mask R-CNN for detection, as this method offers the best performance for this need. There are several other competing architectures that are generally comparable in terms of performance in underwater detection: Faster R-CNN, YOLO, SSD, and Cascade R-CNN. Mask R-CNN returns a mask label that performs a finer pixel-to-pixel segmentation of detected objects. In our work, the mask representation is basically used as a secondary task to explore the damaged area. Mask R-CNN has two main stages: region proposal generation, followed by classification and segmentation.
The first stage is implemented based on a backbone CNN architecture to extract image features. The performance of feature extraction is directly related to the depth of the CNNs, but increasing network depth by simply connecting convolutional blocks will cause the model degradation (of training accuracy) problem. The Residual Neural Network (ResNet) [31] solves the degradation problem of the deep model using a residual block structure, extending the number of model layers from 18 to 152 and increasing the network performance with increasing depth. ResNet-101 is used as the backbone of this model because it maintains strong semantic features at different resolution scales. Moreover, the 1 × 1 convolution structures at the head and end of the residual block are designed to reduce and recover the dimensions (shown in Figure 4), which effectively avoids the vanishing gradient and exploding problems.
The output of the backbone is passed to the Region Proposal Network (RPN), and RPN detector heads are connected after each layer, as shown in Figure 5. Based on the extracted fused feature maps from ResNet, the RPN generates a set of variable-sized regions (called Regions of Interest (RoIs)) and rectangular bounding boxes.
In the second stage, the RoIAlign layer properly aligns the feature map corresponding to each variable-sized RoI with the input and warps it into a fixed size. Based on this, object classification and bounding-box regression are performed by the fully connected (FC) layer, and object segmentation is also solved by the pixel-wise operation of images using a Full Convolutional Network (FCN) that outputs a binary mask for each RoI to achieve instance object segmentation, as shown in Figure 6.

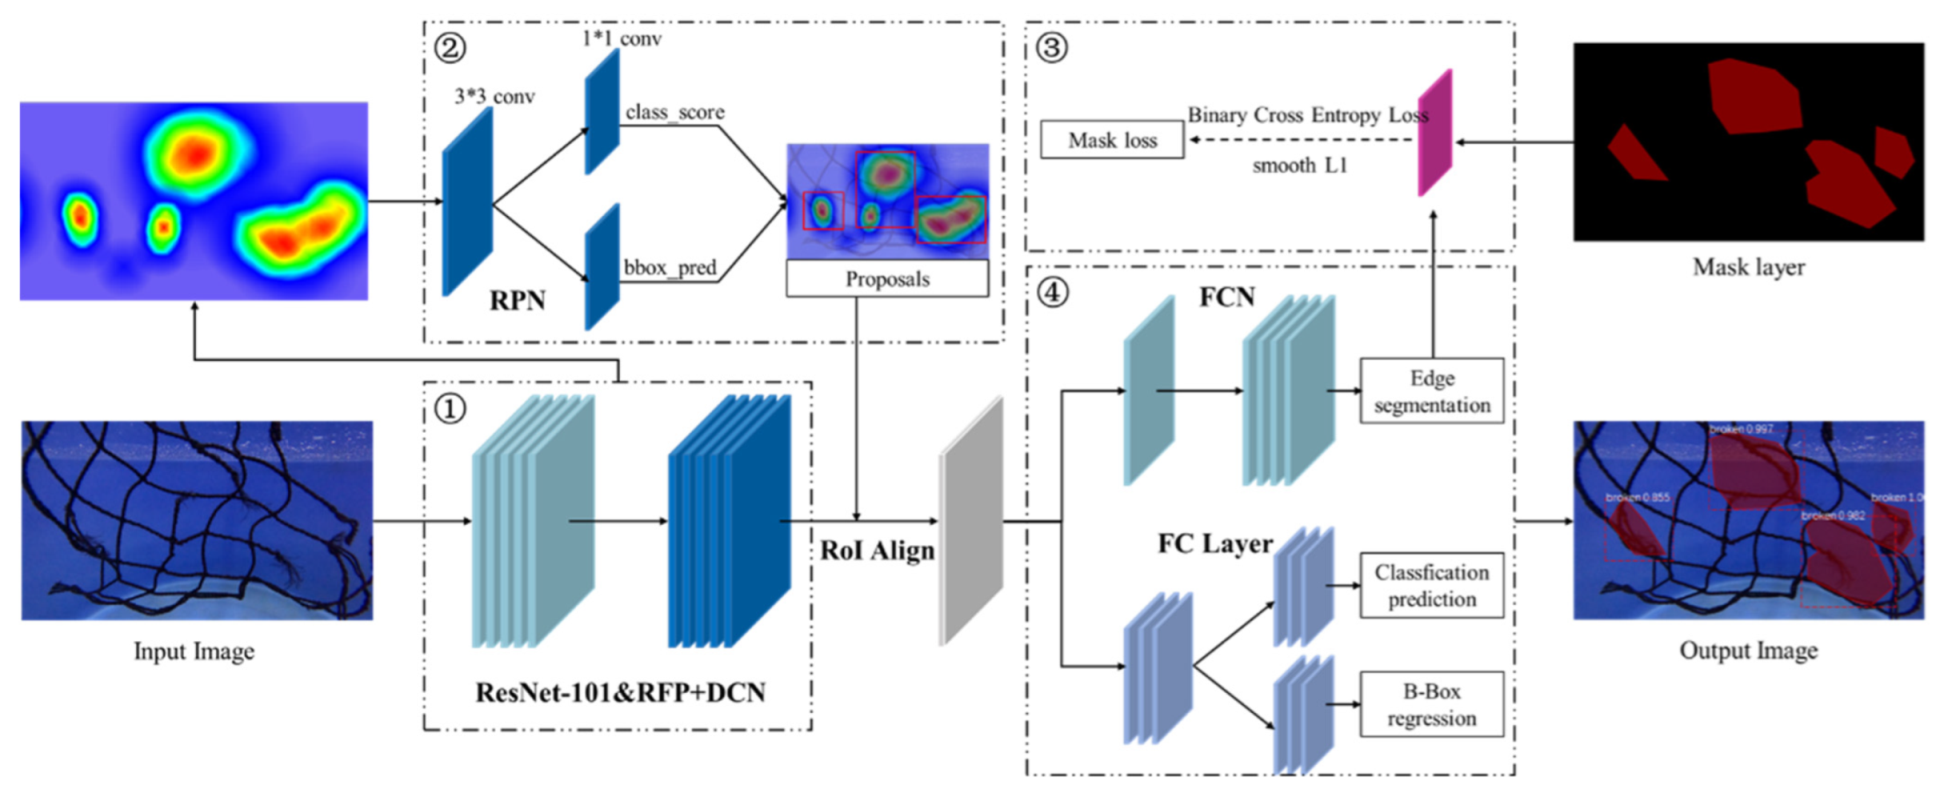
2.3. Construction of the Netting Damage Detection Model

We construct our aquaculture facility netting damage detection model using the deep convolutional neural network method (as shown in Figure 7). ResNet-101 combined with RFP [32] is used as the backbone to extract and fuse the multiscale features of the damage netting images, which effectively solves the problem of detecting damaged areas of small size. Then, the last block of ResNet-101 is replaced by a DCN structure to improve the convolution efficiency of the model for features of irregular mesh holes. The final model is capable of solving the problems encountered in finding damaged nets in marine aquaculture.

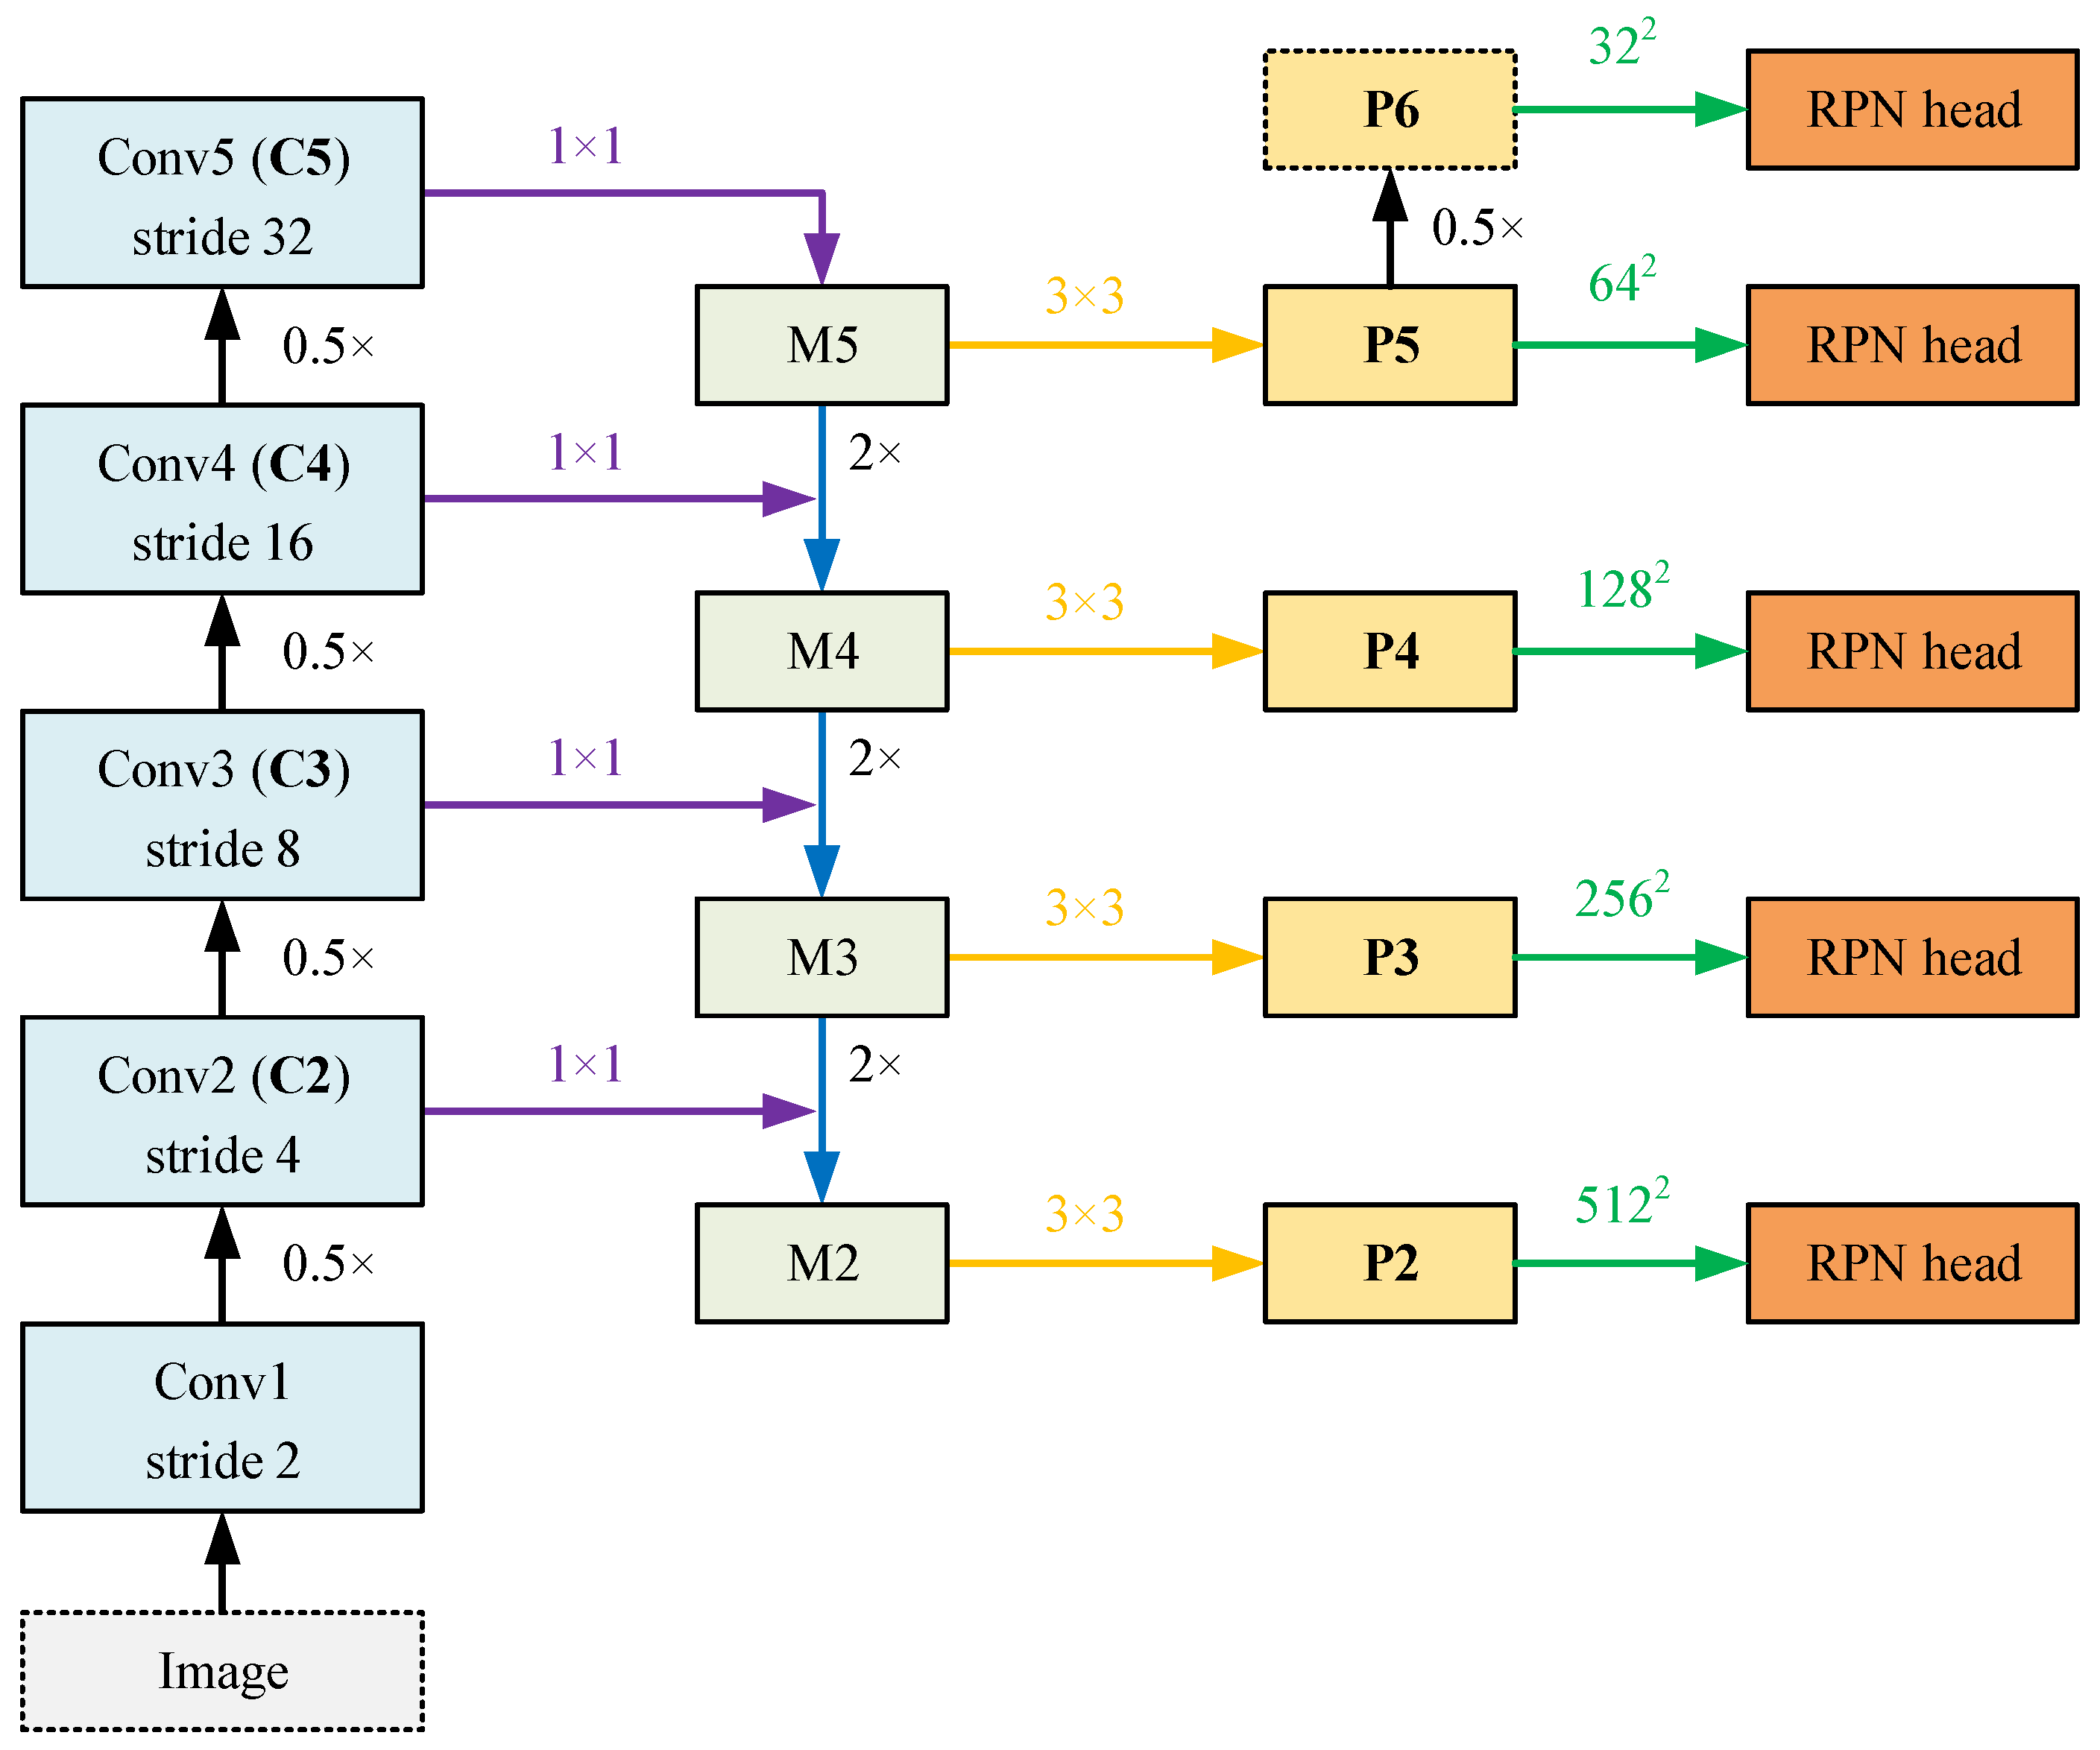
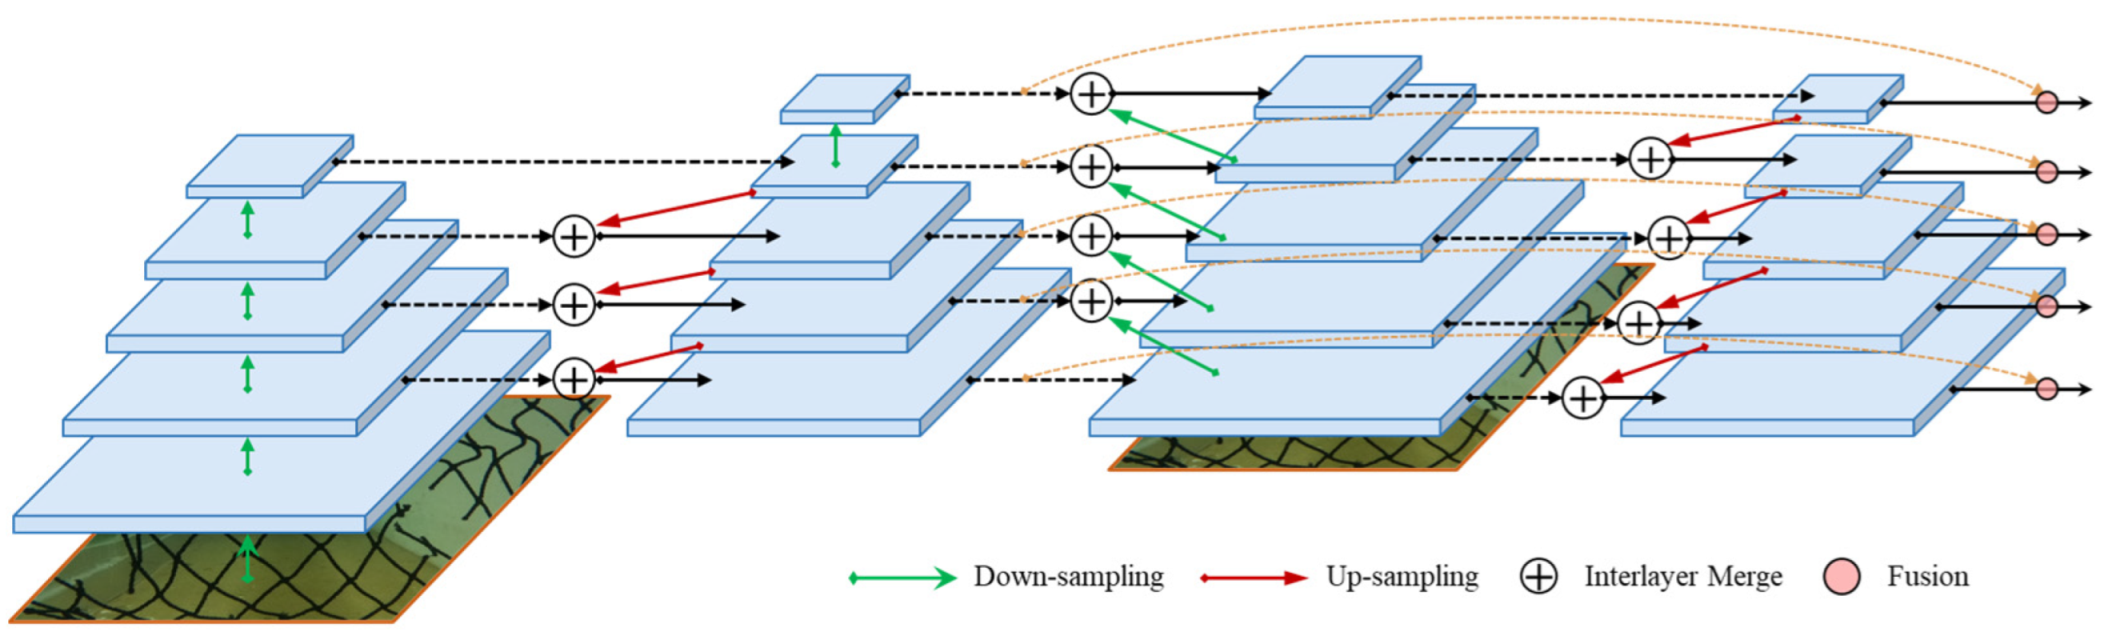
2.3.1. Recursive Feature Pyramid (RFP)

Since the performance of the detection model is determined by the quality of target feature extraction and fusion, the design of the feature extraction network structure is crucial. Netting damage starts very small, so the damage detection model needs a strong ability to extract low-level minute features. Therefore, we use the RFP technique to improve the model feature extraction network by incorporating feedback connections into the bottom-up backbone of FPN. As shown in Figure 8, the RFP structure is unrolled to a 2-step sequential network.
In presenting the RFP, we let Bi denote the stage i operation of the bottom-up backbone, ∀ i = 1, …, N, where N is the number of stages. For example, N = 5 in Figure 8. Fi denotes the i-th layer operation in the top-down FPN, and Ri denotes the feature transformation operation before the i-th layer is recursively connected back to the backbone. Then the output feature yi and the input feature xi of the first step in RFP are defined by
y i = F i ( Y i + 1 , X i ) ,   x i = B i ( x i 1 , R i ( y i ) ) ,
which makes RFP a recursive operation. It can be unrolled as
y i t = F i t ( y i + 1 t , x i t ) ,   x i t = B i t ( x i 1 t , R i t ( y i t 1 ) ) ,
where the number of recursive steps of the operation is denoted by the superscript t, ∀ t = 1,..., T, and T is the maximum number of unrolled iterations.
Thus, the backbone can fuse the feature maps after multiple views, and the RFP-incorporated feedback connections contain the gradient signals of classification and regression at the previous iteration, making it possible to update the backbone parameters directly and greatly improving the model’s ability to detect minute features.

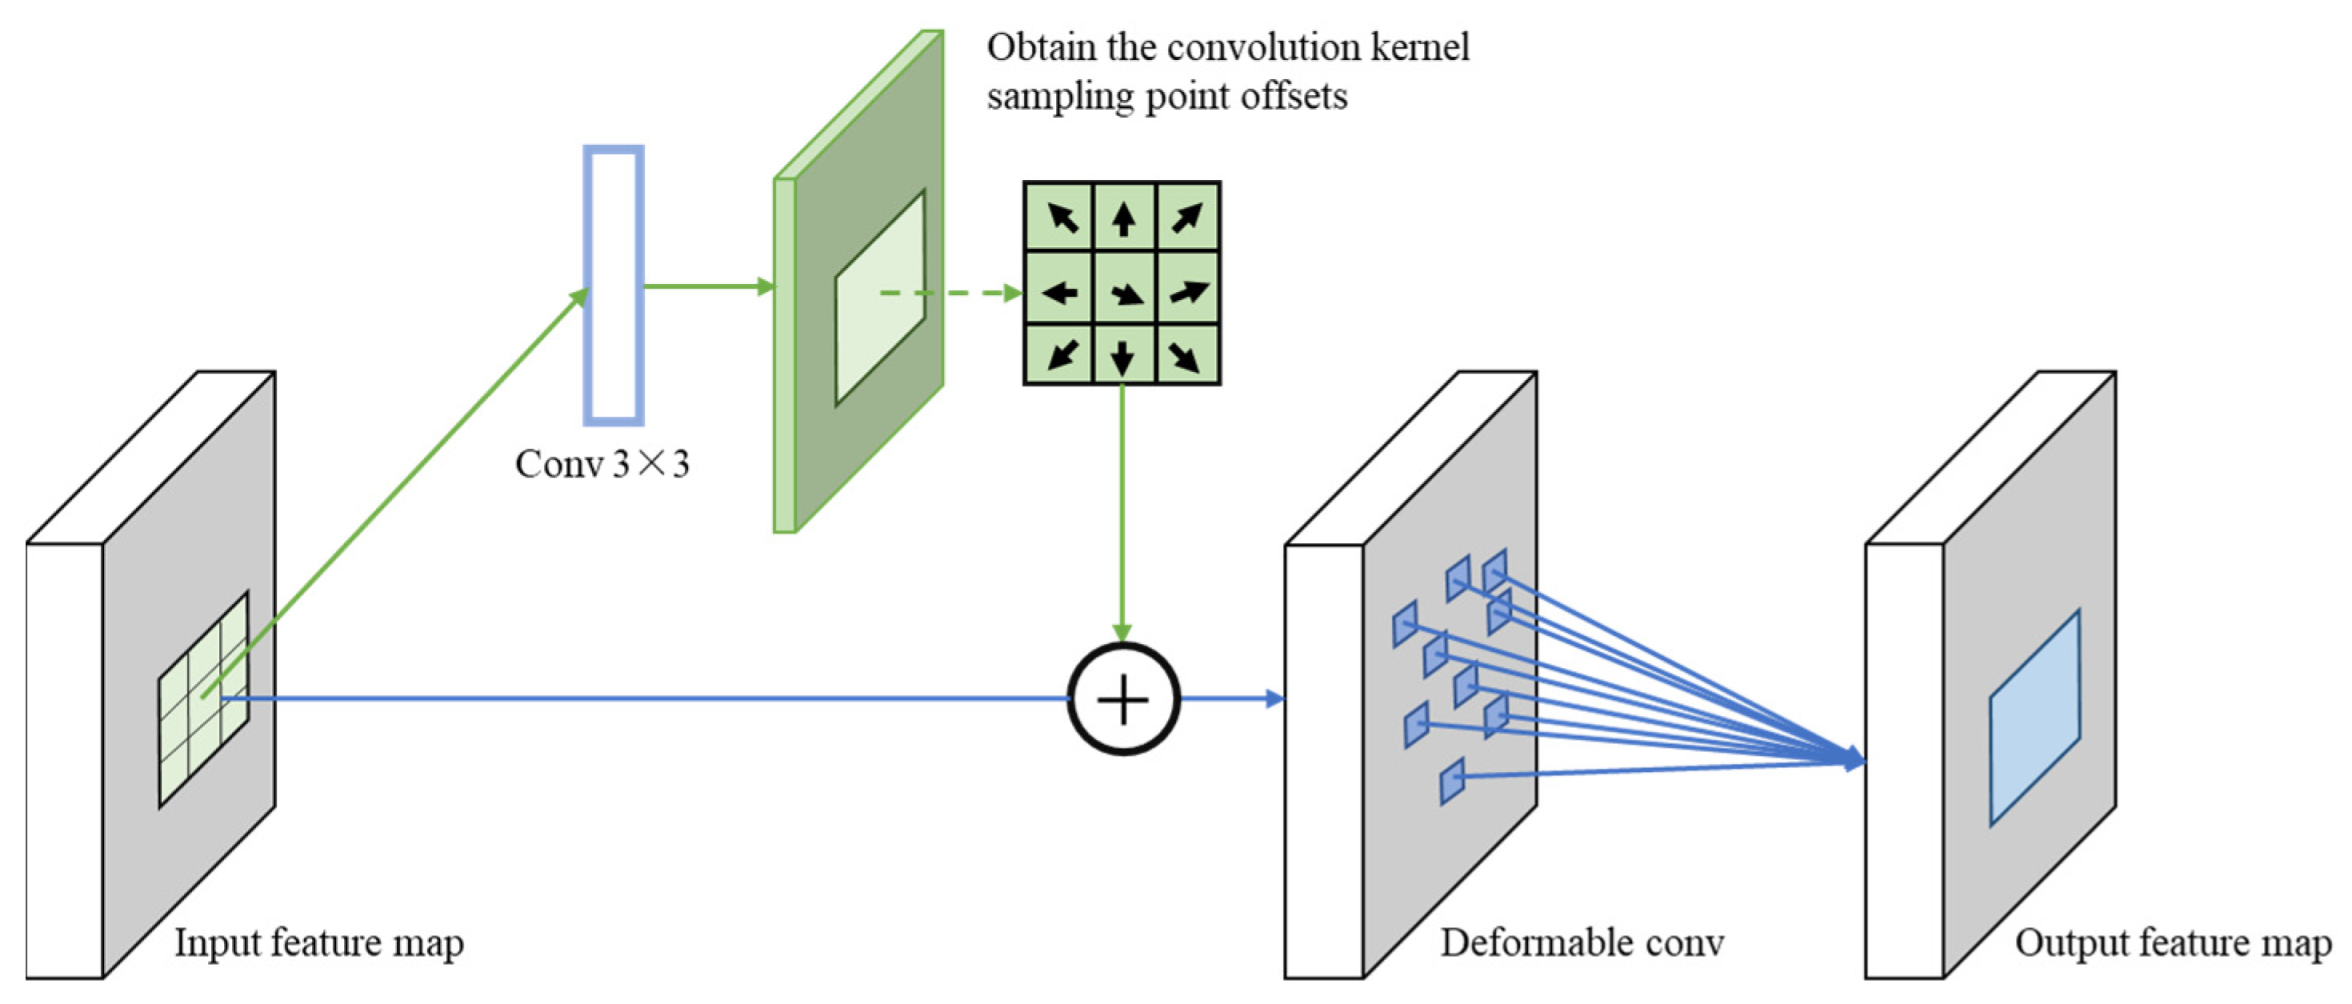
2.3.2. Deformable Convolution Network (DCN)
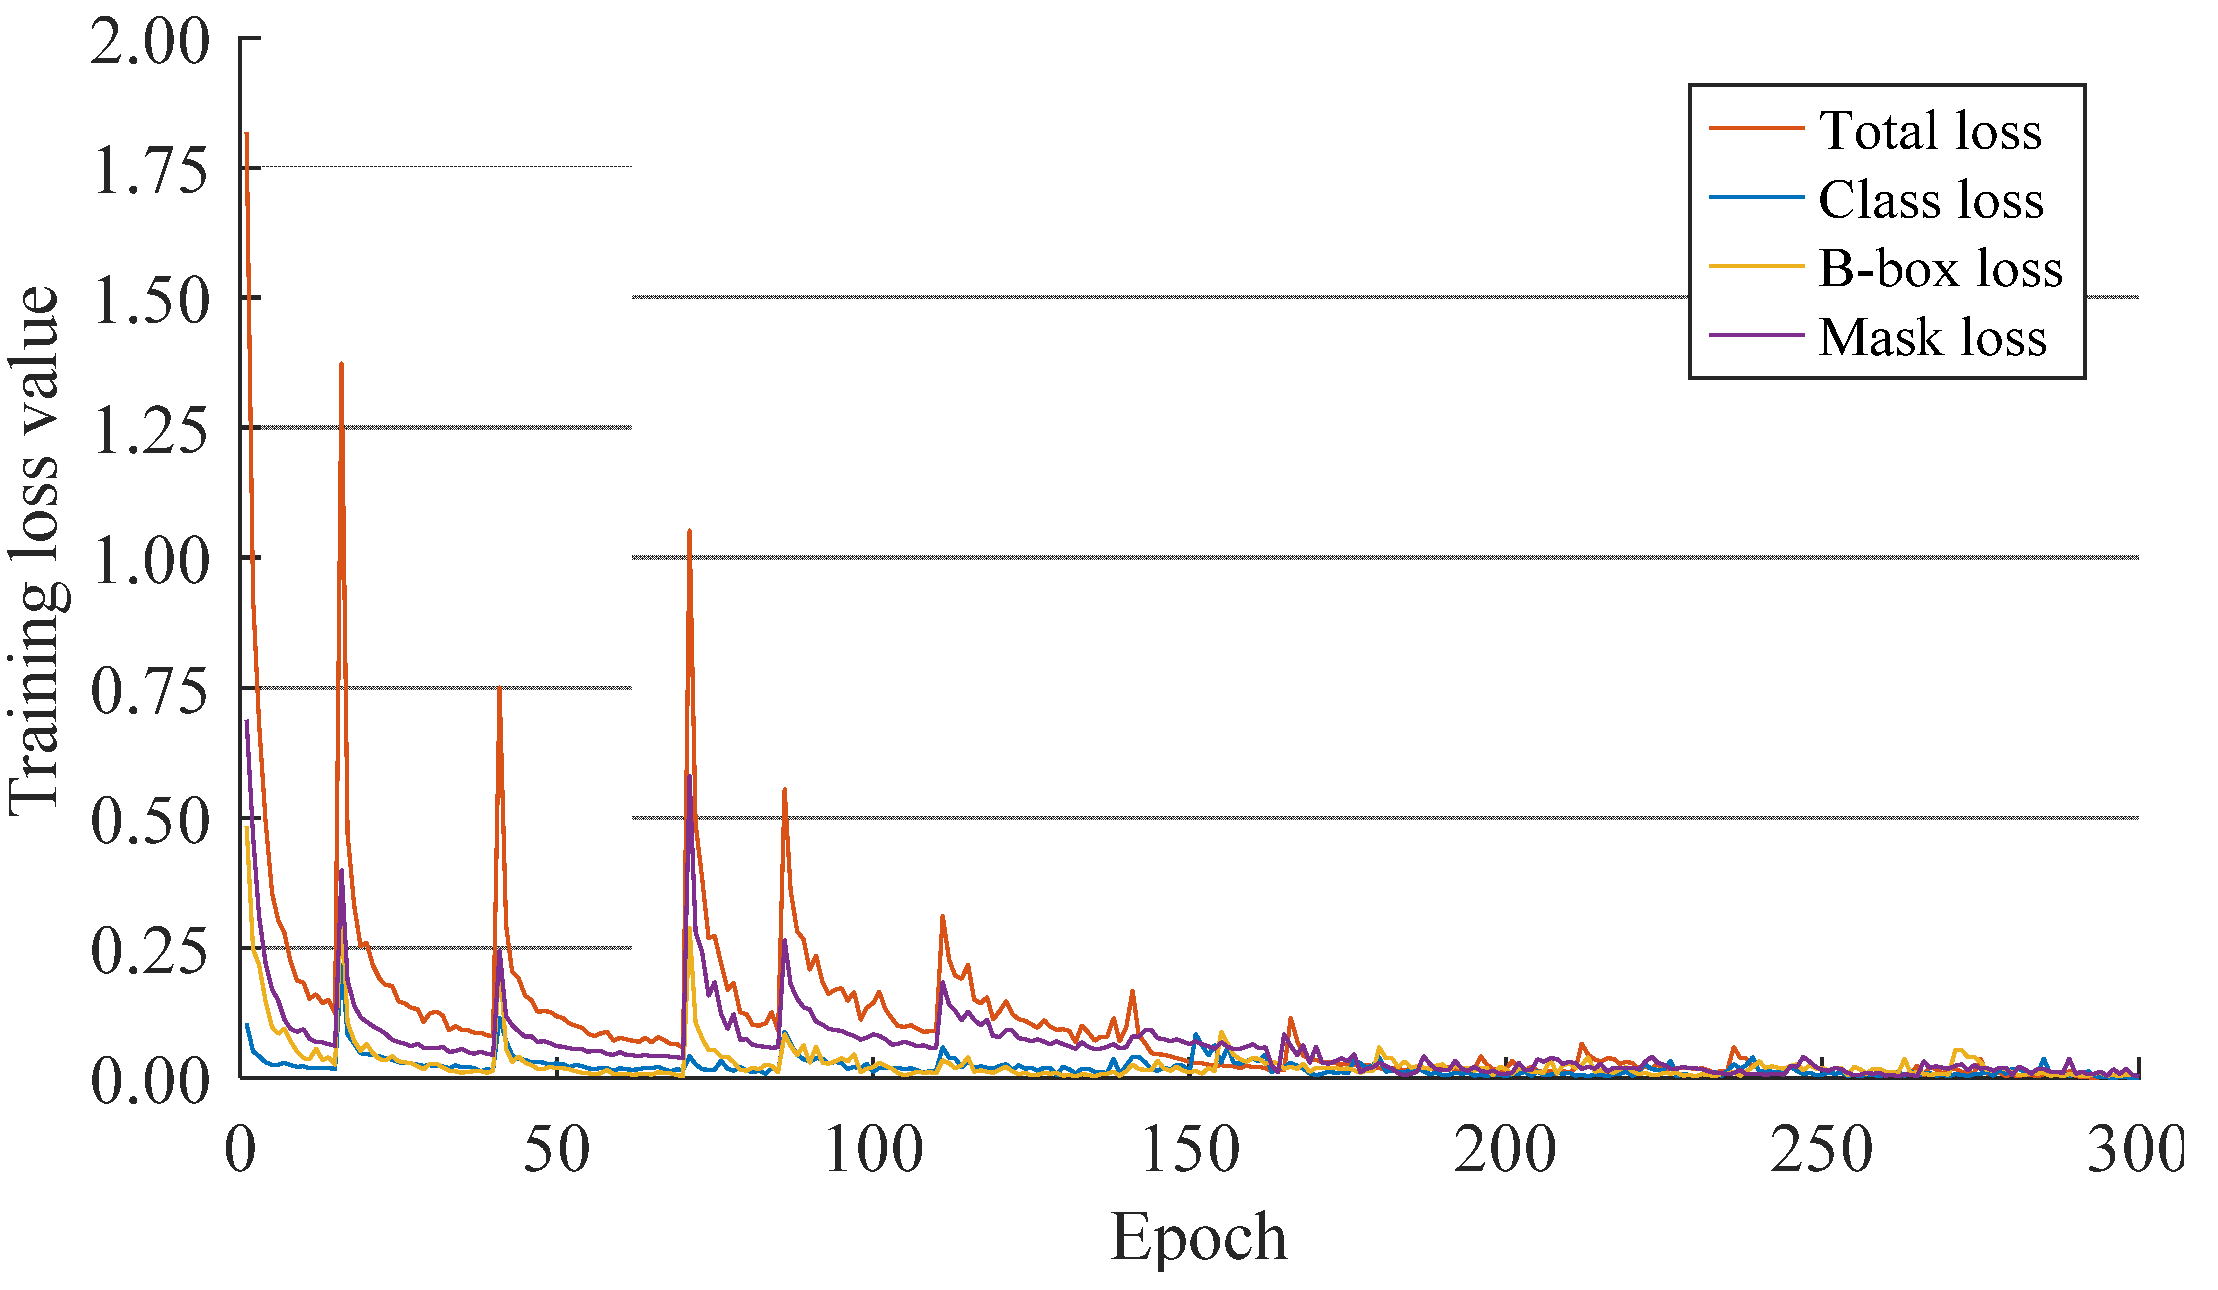
Convolution can be understood as the process whereby the convolution kernel slides along the input in a left–right, top–bottom order, and outputs a new feature map. A 3 × 3 convolution kernel (i.e., the receptive field is 3 × 3) is the most frequently used standard convolution kernel in CNN. However, damaged mesh holes are generally irregular, which leads to low convolution efficiency. In response, the convolution kernel size needs to be increased to improve the receptive field, but this greatly increases the computational effort. Regular convolution kernels do not match the irregular input features and do not meet the detection period and accuracy requirements of some complex shape objects. Then the most intuitive and reasonable solution is to make the convolution kernels irregularly shaped and trainable. The DCN is a convolution structure that can fully adapt to object size variations. Based on the feature map, each sampling point is adaptively offset sampled in the horizontal and vertical directions to achieve irregular sampling, as shown in Figure 9. Without increasing the number of sampling points, the receptive field is expanded, and better features are obtained.
Due to the different causes of damage, the shape and distribution of mesh holes are irregular depending on whether they were caused by twine fractures, narrow tears, or large irregular holes. For such features with more complex deformations, the use of traditional rectangular convolution kernel sampling is not flexible enough and handles the target deformation poorly and inefficiently. Therefore, we introduce DCN into the original backbone to improve the convolution efficiency and accuracy of feature extraction. In addition, since training the offsets of convolution kernel sampling points requires a semantic feature basis, only the last ResNet block of the backbone is replaced by a DCN structure.
The standard convolution process divides the input feature map X into parts of the same size as the convolution kernel R and then performs the convolution operation where the position of each part on the feature map is fixed. Mathematically, this is expressed as
Y ( P 0 ) = r R ω ( r ) X ( P 0 + r ) ,
where X() denotes the input feature mapping, R denotes the set of each sampling point in the convolution kernel, r is the sample point, and ω() is the weight of r.
The deformable convolution is based on the standard convolution with a trainable offset Δri. The output feature map Y on position P0 is calculated as
Y ( P 0 ) = r R ω ( r ) X ( P 0 + r + Δ r i ) .
Since sampling is performed in irregular regions and the increased Δri is generally a floating-point number that does not correspond to the feature points actually present on the feature map, the bilinear interpolation method is used to obtain the offset eigenvalues [28].

2.4. Loss Function

The model has three functional branches: classification prediction, border regression, and mask segmentation branch. The multi-task loss function on each sampling RoI is defined as
L = L c l s + L b b o x + L m a s k ,
where Lcls denotes the classification loss as defined in Equations (6) and (7). Lbbox denotes the regression loss of the detection bounding box as defined in Equations (8) and (9). Lmask denotes the average binary cross-entropy loss of the mask segmentation layer, as shown in Equation (10).
L c l s = 1 N c l s i L c l s ( P i , P i * ) ,
L c l s ( P i , P i * ) = log [ P i * P i + ( 1 P i * ) ( 1 P i ) ] .
In Equations (6) and (7), Pi denotes the probability of the anchor being predicted as a target. Pi* = 1 when the object is detected, and 0 when it is not detected. Ncls is the total number of anchors.
L b b o x = λ 1 N r e g i P i * L r e g ( t i , t i * ) ,
L r e g ( t i , t i * ) = R ( t i t i * ) .
In Equations (8) and (9), ti denotes a vector of four parameterized coordinates for the predicted bounding box. ti* has the same number of dimensions as ti, indicating the offset of the bounding box relative to the actual annotation of the dataset. Nreg is the number of dimensions of the feature map. R is the smooth-L1 function. λ is a balanced parameter such that the two loss functions of classification and regression have essentially the same weights.
L m a s k = y y ln ( 1 y ˜   ) + ( 1 y ) ln ( 1 y   ˜ ) .
In Equation (10), y denotes the actual segmentation output of the binarization mask, and denotes the predicted segmentation output.

2.5. Training

We construct our aquaculture facility netting damage detection model using the deep convolutional neural network method (as shown in Figure 7). ResNet-101 combined with RFP is used as the backbone to extract and fuse the multiscale features of the damage netting images, which effectively solves the problem of detecting damaged areas of small size. Then, the last block of ResNet-101 is replaced by a DCN structure to improve the convolution efficiency of the model for features of irregular mesh holes. The final model is capable of solving the problems encountered in finding damaged nets in marine aquaculture.

2.5.1. Runtime Environment

The experimental training environment consisted of a computer with an Intel Core i9-11900K CPU at 3.50 GHz and an Nvidia RTX 2080Ti GPU running Ubuntu 18.04. We used the TensorFlow-GPU 2.3 deep learning framework (developed by the Google Brain team) with CUDA 10.1 and cuDNN 7.6 for the model training.

2.5.2. Model Parameters

The damaged netting dataset was divided into training and test sets in a 9:1 ratio. The parameters set during model training are shown in Table 2.
The design of the learning rate decay strategy accelerates the convergence of the model in the early stage of training and avoids the oscillation of the loss function when the latter converges to the optimal point. Figure 10 shows the training loss curves of the model and its branches. The loss value gradually converged with larger numbers of training epochs, and the model loss value rapidly converged to below 0.20 after 140 epochs. It then stabilized and converged near 0.01. The loss function did not appear to diverge or stagnate, indicating that the model structure was effectively designed and well trained.

2.6. Evaluation Metrics

In order to evaluate the effect of the model objectively and accurately, we selected Precision–Recall (P-R), average precision (AP), balanced F score (F1-Score), and detection FPS as evaluation indexes. Table 3 shows the confusion matrix used to calculate the values of precision and recall.
Precision is defined as the probability of the actual positive sample among all the predicted positive samples, as shown in Equation (11). The higher its value, the better the model’s ability to distinguish negative samples:
P r e c i s i o n = T P T P + F P .
Recall is defined as the probability of the predicted positive sample among all the actually positive samples, as shown in Equation (12). The higher the Recall value, the better the model’s ability to identify positive samples:
R e c a l l = T P T P + F N .
AP is the average of all Precision values on the P-R curve, which is the integral operation of the P-R curve. Its definition is shown in Equation (13)
A P = 0 1 P ( r ) d r .
F1-score is defined as the harmonic average of Precision and Recall, as shown in Equation (14). The higher the F1-score, the more robust the classification model:
F 1 = 2 × p r e c i s i o n × r e c a l l p r e c i s i o n + r e c a l l .

3. Results and Discussion

We present our results in this section. The first part discusses the ablation experiments we designed to analyze the influence of the RFP and DCN structures on the detection model performance and to validate the effectiveness of the Mask R-CNN+RFP+DCN model. The second part presents the results of the comparison between other models (OpenCV, SSD, YOLOv3, and Cascade R-CNN) and this model and evaluates the performance of a traditional image algorithm, classical CNN framework, and the improved method in detecting netting damage.

3.1. Ablation Experiment Result

To verify the effect of the improvement of the netting damage detection model, Mask R-CNN was incrementally improved by adding RFP and DCN modules to form an extended model. Figure 11 compares the detection results of the model at each stage of the ablation experiment on the test dataset. Netting with a 1.2 mm twine diameter, a 1.5 cm mesh bar length, and multiple small-size damages are shown in the left column of the figure. Netting with a 3.0 mm twine diameter, a 3.0 cm mesh bar length, and an irregular damage are shown in the right column of the figure.
Figure 11 shows that the original model completed the detection of conventional damaged objects, but with inaccurate segmentation and localization of the breakage and several missing small-size objects. After adding the RFP module, the detection results of the model for small-size damage improved significantly with more accurate detection and localization of the damage. This result shows that the method effectively extracted low-level location features from the image and fused them with the high-level semantic features. It better solves the small-size damage which is difficult to detect by previous methods, such as the MobileNet-SSD framework proposed by Liao et al. [22]. The addition of the DCN structure made the convolutional kernel adaptively offset according to the damage shape features, extracting features more efficiently and enhancing the segmentation capability of the model for irregular damage feature masks. The detection results of the model with two improved strategies show that each damaged object was accurately located and finely segmented. Thus, the present model benefits from effectively combining the two improved strategies to solve the netting damage detection problem. In addition, we also analyzed the performance of each stage of the model according to the missing detection rate, average accuracy, F1 score, and detection speed, as shown in Table 4.
The experimental results in Table 4 show that: (1) The use of the RFP structure instead of the ordinary FPN resulted in a 17.38% reduction in the model’s missing detection rate and a 3.50% increase in the average precision, indicating that RFP significantly optimized the model’s damaged objects detection and location performance through the iterative fusion of low-level position features of the image. (2) By improving the feature extraction ability of the model for irregular damage through DCN, the average precision improved to 91.90%, and the detection period was reduced by 7.28%, indicating that DCN structure effectively improved the segmentation performance and convolution efficiency by changing the convolution kernel sampling approach. (3) The missing detection rate of the final model in the test dataset was 7.12%, which was 21.44% lower than that of the original model. The average precision was 94.48%, an improvement of 7.86% over the original model. The model detection processed about 4.74 frames per second.
The preceding detection results and data analysis demonstrate the effectiveness of our proposed model improvement strategy. We conclude that RFP and DCN combine to optimize the detection performance of the model, with RFP contributing the most to the optimization of the model’s missing detection rate and DCN contributing the most to the model’s precision and detection speed.

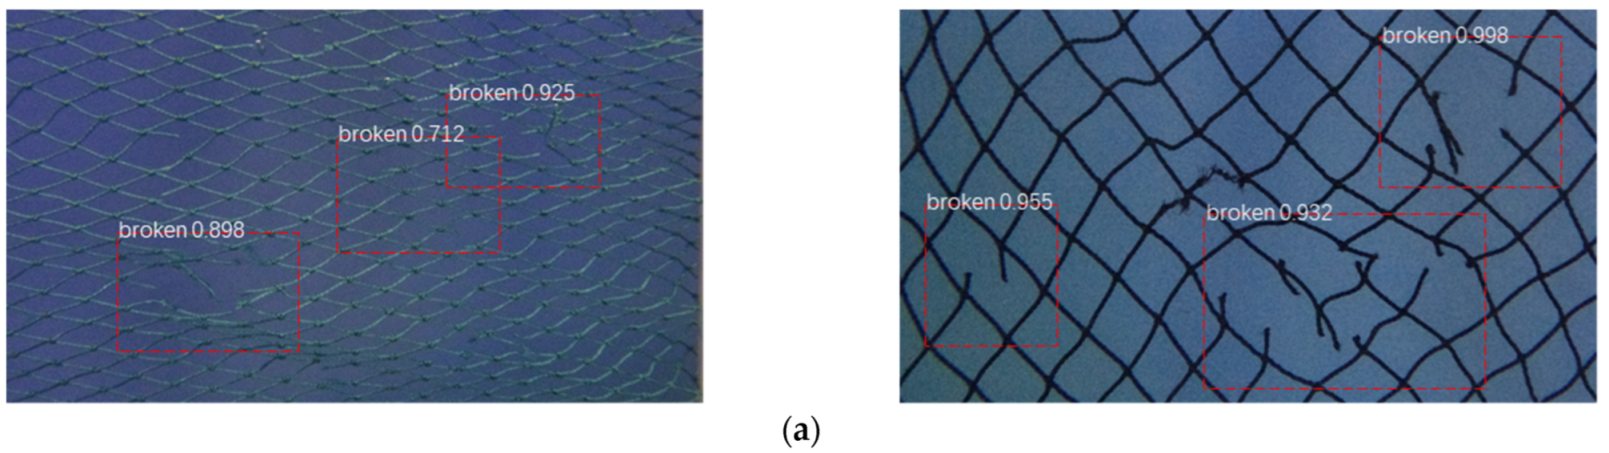
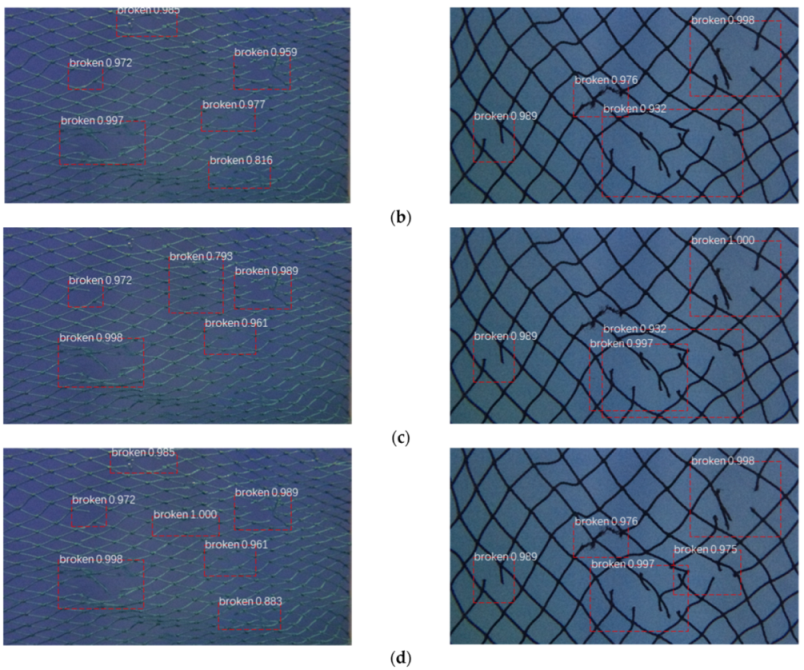
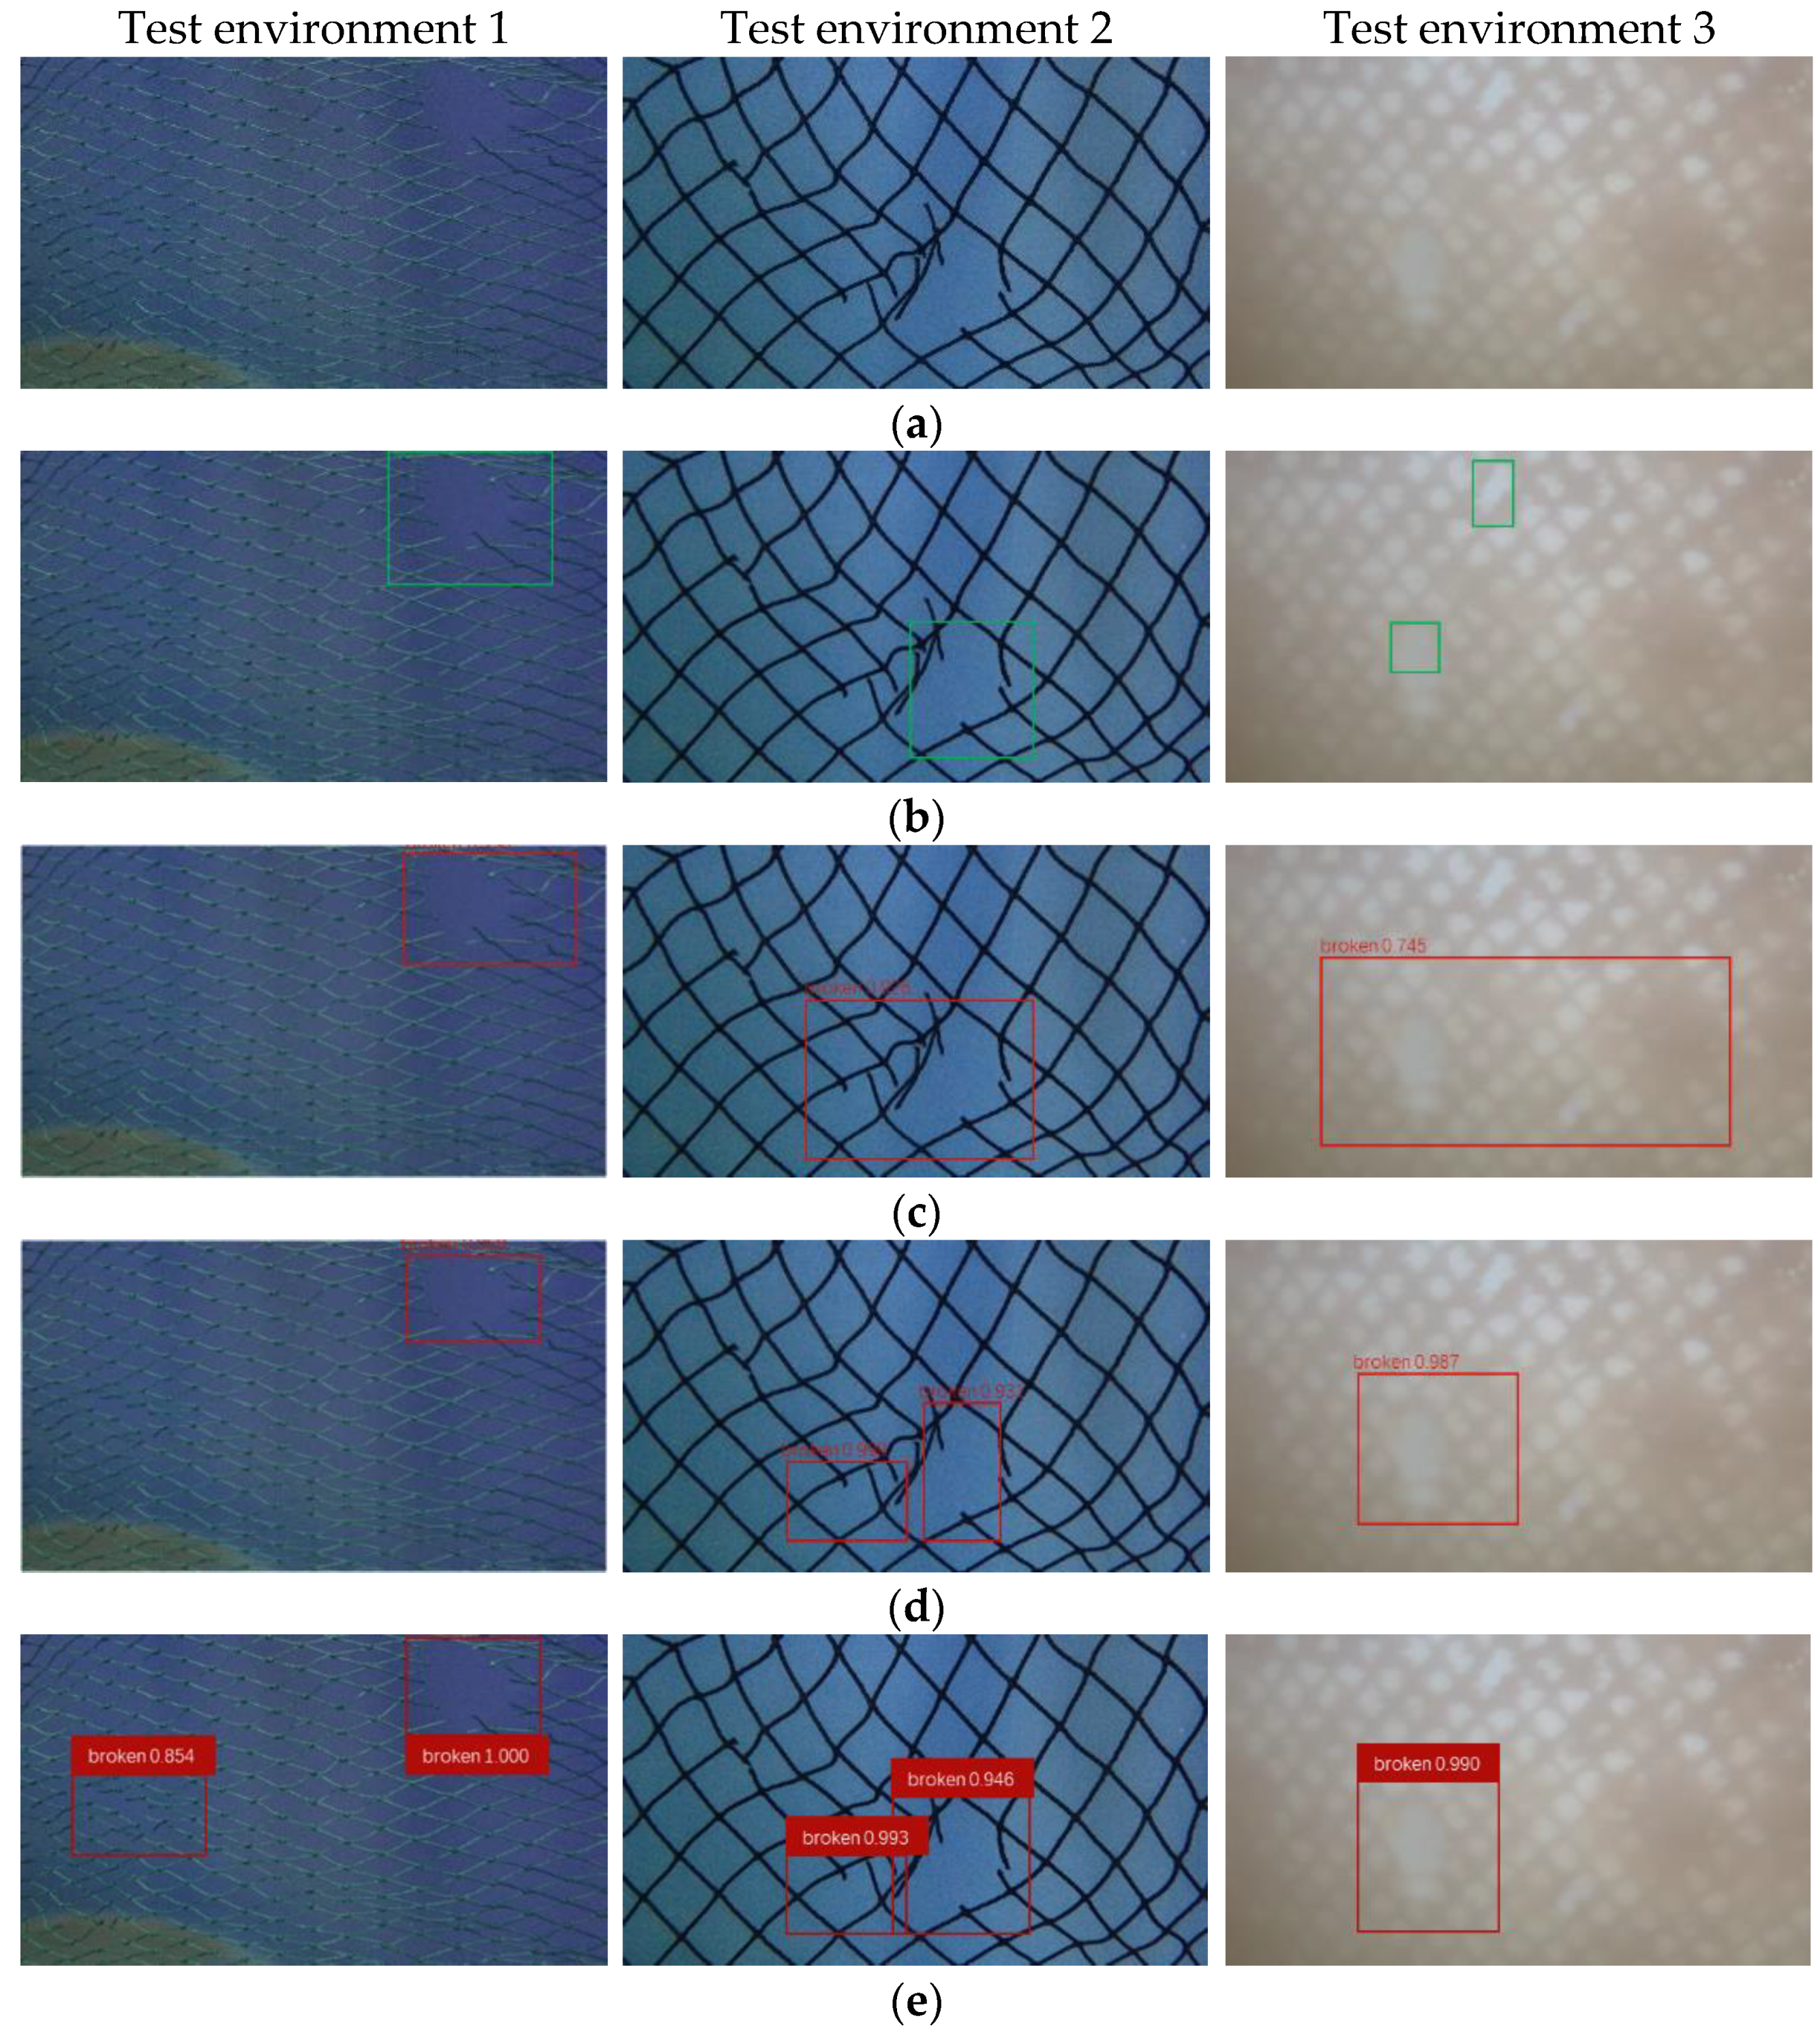
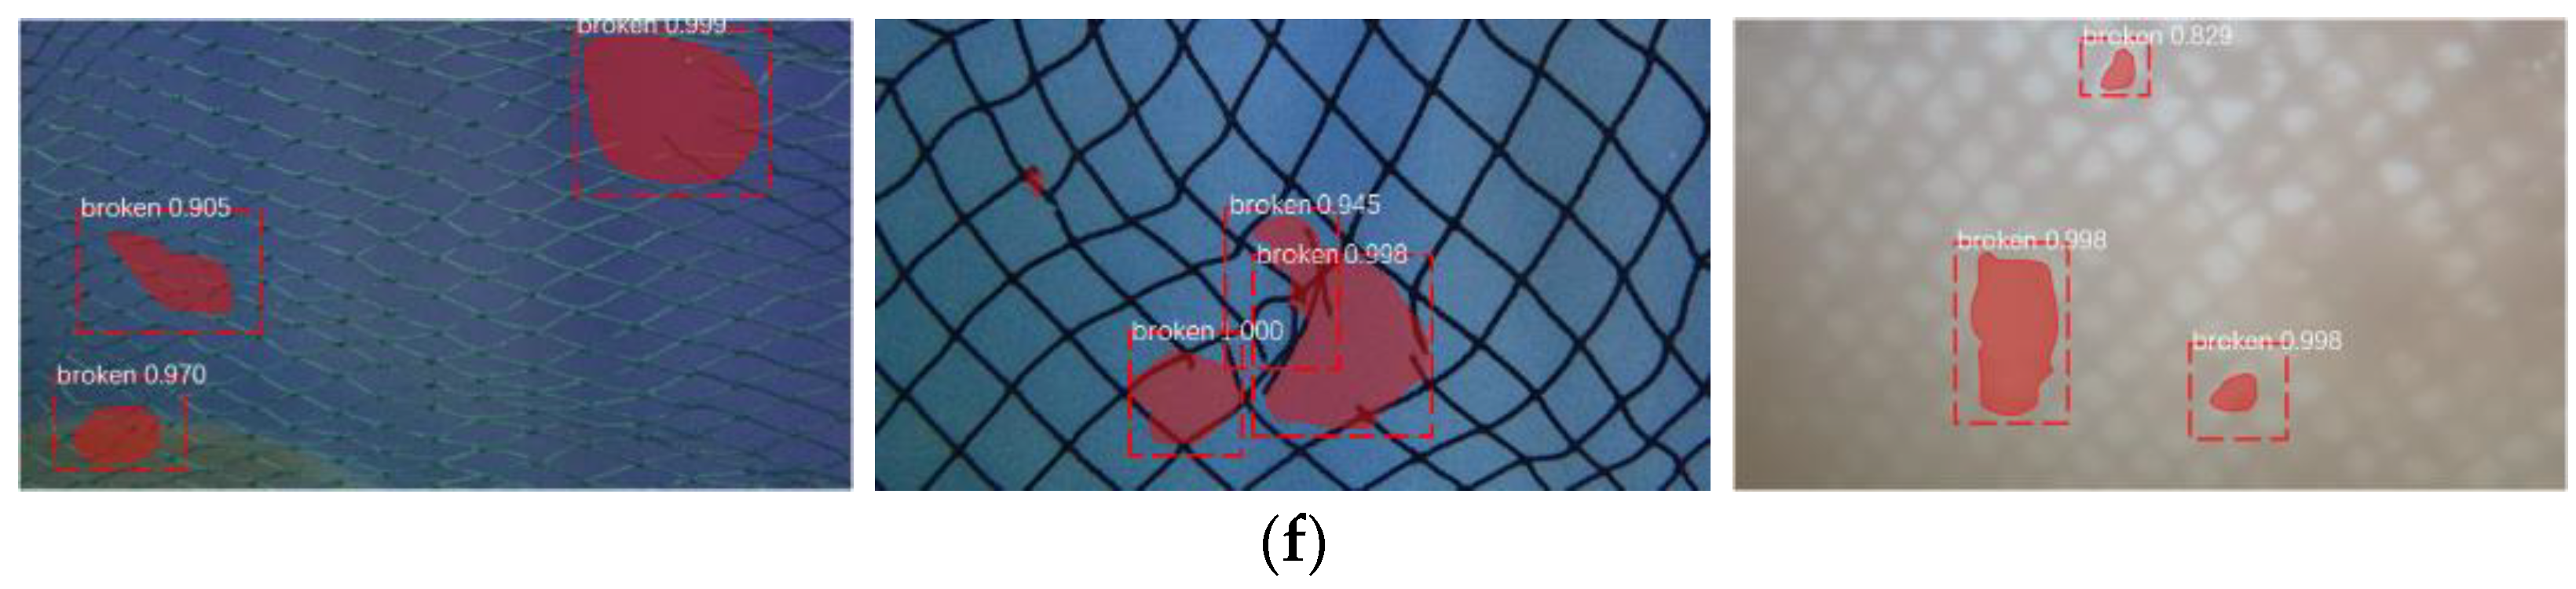
3.2. Model Performance Comparison

We compared our improved Mask R-CNN+RFP+DCN model with OpenCV, SSD, YOLOv3, and Cascade R-CNN models on the test dataset. OpenCV is an image processing method that extracts feature information of the mesh pixel color and contour area to find damage. SSD and YOLOv3 are deep learning one-stage target detection models. Mask R-CNN and Cascade R-CNN are two-stage target detection models. The performance of models was evaluated according to the missing detection rate, average precision, F1-score, and detection FPS. Table 5 shows the comparison result of different netting damage detection models.
Table 5 shows that the missing detection rate of our proposed model was 7.12%, which was 28.68%, 22.09%, 21.44%, and 16.87% lower than that of the SSD, YOLOv3, Mask R-CNN, and Cascade R-CNN models, respectively. The average precision was 94.48%, which increased by 16.50%, 13.21%, 7.86%, and 5.33%, respectively. Because our model is based on a two-stage detection framework incorporating RFP and DCN structures, the model more efficiently extracts and fuses the effective feature information of the high and low layers of the image and improves the detection and segmentation ability of the model on the damaged objects. The improved model does suffer from some drawbacks at a processing speed of 4.74 FPS. Our model is not as fast as other models, but it still meets the performance requirements in practical use. Compared with the traditional methods such as the characteristic gradient curve of mesh holes [20] and OpenCV, the detection effect of this method is more intuitive and has better robustness. The comparison with other methods shows that our model has detection performance exceeding that of competing methods with acceptable processing speed.
The netting damage detection results of each model on the test dataset are shown in Figure 12. The left column is from a container experiment environment with a twine diameter of 1.2 mm and a mesh bar length of 1.5 cm. The center column is from a wave flume experiment environment with a twine diameter of 3.0 mm and a mesh bar length of 3.0 cm. The right column is from an actual aquaculture environment with a twine diameter of 4.8 mm and a mesh bar length of 3.0 cm. The figure shows that all models completed the detection of obviously damaged objects, but our improved model had the best detection results. In the left column, the improved model detected all the damaged objects, while the other models did not easily detect the small and irregular damages in the lower left. In the center column, the damaged objects are connected and irregular. Due to the introduction of the DCN structure, our model had a better location and segmentation performance for irregular damaged objects. In the right column, the seawater is turbid, and the netting has serious biofouling. The other models did not accurately detect the damaged objects. In contrast, our proposed model detected the damage in a complex environment, with the mask segmentation accurately locating the damage.

4. Conclusions

In this paper, we present a Mask R-CNN framework-based model for detecting and locating the underwater netting damage in marine aquaculture environments. Our effort expands on an original model to cope with actual marine conditions, with small-size fractures and irregular damage shapes in various water conditions and other variants. The missing detection rate, detection precision, and detection FPS of the model are significantly improved after adding RFP and DCN structures. We make the following conclusions:
(1)
Our proposed model combining Mask R-CNN, RFP, and DCN detects netting damage in both laboratory and actual marine environments. The missing detection rate of the final model is 7.12%, with an accuracy of 94.48%. The detection processes around 4.74 FPS while using about 231.8 MB of RAM, which satisfies actual application requirements and facilitates the deployment of this method in embedded equipment.
(2)
A dataset of netting damage images was collected and labeled in the simulated laboratory environment and marine aquaculture environment. We performed comparison tests using OpenCV, SSD, YOLOv3, Mask R-CNN, Cascade R-CNN, and the proposed model. The results show that our proposed combination of Mask R-CNN, RFP, and DCN has better detection performance than the others.
(3)
Currently, the research on CNN-based damage detection of underwater netting in aquaculture facilities is scarce. We have constructed an underwater netting damage detection scheme based on computer vision and deep learning that not only detects ordinary netting damage but also accurately detects small-size and irregular damage. This method offers potential for use in actual aquaculture facilities to reduce aquaculture risk and maintenance costs by enabling early repairs to damaged netting.

Author Contributions

Conceptualization, Z.Z. and D.F.; methodology, Z.Z.; validation, Z.Z.; formal analysis, Z.Z.; investigation, F.G.; resources, Z.Z. and X.Q.; data curation, F.G.; writing—original draft preparation, Z.Z.; writing—review and editing, D.F.; supervision, F.G. and X.Q.; project administration, D.F.; funding acquisition, F.G. and D.F. All authors have read and agreed to the published version of the manuscript.

Funding

This research was funded by the National Key Research and Development Projects (Grant No. 2020YFE0200100), the National Natural Science Foundation of China (Grant No. 32002441 and No. 42076213), and the Zhoushan Science and Technology Projects (Grant No. 2022C01003). These financial supports are gratefully acknowledged.

Institutional Review Board Statement

Not applicable.

Informed Consent Statement

Not applicable.

Data Availability Statement

Data available on request from the authors.

Acknowledgments

The authors would like to thank their advisors for their guidance and the reviewers for their constructive suggestions.

Conflicts of Interest

The authors declare no conflict of interest.

References

  1. Zhou, W.B.; Shi, J.G.; Yu, W.W.; Liu, F.L.; Song, W.H.; Gui, F.K. Current situation and development trend of marine seine culture in China. Fish. Inf. Strategy 2018, 33, 259–266. [Google Scholar]
  2. Gui, F.K.; Zhu, H.J.; Feng, D.J. Research progress on hydrodynamic characteristics of marine aquaculture netting. Fish. Mod. 2019, 46, 9–14+21. [Google Scholar]
  3. Yan, G.Q.; Ni, X.H.; Mo, J.S. Research status and development tendency of deepsea aquaculture equipments: A review. J. Dalian Ocean. Univ. 2018, 33, 123–129. [Google Scholar]
  4. Fish Farming Expert. Ocean Farm 1 escape total worked out at 16,000. Available online: https://www.fishfarmingexpert.com/article/ocean-farm-1-escape-total-worked-out-at-16000/ (accessed on 15 April 2021).
  5. Fish Farming Expert. Second escape from Ocean Farm 1. Available online: https://www.fishfarmingexpert.com/article/second-escape-from-ocean-farm-1/ (accessed on 15 April 2021).
  6. Wei, Y.G.; Wei, Q.; An, D. Intelligent monitoring and control technologies of open sea cage culture: A review. Comput. Electron. Agric. 2020, 169, 105119. [Google Scholar] [CrossRef]
  7. O’Mahony, N.; Campbell, S.; Carvalho, A.; Harapanahalli, S.; Hernandez, G.V. Deep Learning vs. Traditional Computer Vision. Advances in Computer Vision. In CVC 2019: Advances in Computer Vision; Springer: Cham, Switzerland, 2019; pp. 128–144. [Google Scholar] [CrossRef] [Green Version]
  8. LeCun, Y.; Bengio, Y.; Hinton, G. Deep learning. Nature 2015, 521, 436–444. [Google Scholar] [CrossRef] [PubMed]
  9. Ronneberger, O.; Fischer, P.; Brox, T. U-net: Convolutional networks for biomedical image segmentation. In International Conference on Medical Image Computing and Computer-Assisted Intervention; Springer: Cham, Switzerland, 2015; pp. 234–241. [Google Scholar]
  10. He, K.M.; Gkioxari, G.; Dollár, P.; Girshick, R. Mask R-CNN. In Proceedings of the 2017 IEEE International Conference on Computer Vision (ICCV), Venice, Italy, 22–29 October 2017; pp. 2980–2988. [Google Scholar] [CrossRef]
  11. Redmon, J.; Divvala, S.; Girshick, R.; Farhadi, A. You Only Look Once: Unified, Real-Time Object Detection. In Proceedings of the IEEE Conference on Computer Vision and Pattern Recognition (CVPR), Las Vegas, NV, USA, 27–30 June 2016; pp. 779–788. [Google Scholar] [CrossRef] [Green Version]
  12. Cai, Z.W.; Vasconcelos, N. Cascade R-CNN: Delving into High Quality Object Detection. In Proceedings of the 2018 IEEE/CVF Conference on Computer Vision and Pattern Recognition, Salt Lake City, UT, USA, 18–23 June 2018; pp. 6154–6162. [Google Scholar] [CrossRef] [Green Version]
  13. Lian, L.K.; Zhao, Y.P.; Bi, C.W.; Xu, Z.J.; Du, H. Research on the Damage Detection Method of the Plane Fishing Net Based on the Digital Twin Technology. Prog. Fish. Sci. 2022, 43, 1–8. [Google Scholar] [CrossRef]
  14. Wan, Y.L.; Qi, C.S.; Pan, H.J. Design of remote monitoring system for aquaculture cages based on 3G networks and ARM-Android embedded system. Procedia Eng. 2012, 29, 79–83. [Google Scholar] [CrossRef] [Green Version]
  15. Peng, A.H.; Liu, C.W.; Lu, B. A deep-water fish cage with cleaning device and data acquisition system. South China Agric. 2016, 10, 169–171. [Google Scholar] [CrossRef]
  16. Chang, Z.Y.; Zhou, X.Y.; Chi, M.T.; Zheng, Z.Q. Fault Characteristics of Breakage on Net Sheet of Aquaculture Net Cage. In Proceedings of the 2019 Prognostics and System Health Management Conference, Qingdao, China, 25–27 October 2019; pp. 1–5. [Google Scholar] [CrossRef]
  17. Lee, J.; Roh, M.; Kim, K.; Lee, D. Design of autonomous underwater vehicles for cage aquafarms. In Proceedings of the 2007 IEEE Intelligent Vehicles Symposium, Istanbul, Turkey, 13–15 June 2007; pp. 938–943. [Google Scholar] [CrossRef]
  18. Schellewald, C.; Stahl, A.; Kelasidi, E. Vision-based pose estimation for autonomous operations in aquacultural fish farms. IFAC-PapersOnLine 2021, 54, 438–443. [Google Scholar] [CrossRef]
  19. Betancourt, J.; Coral, W.; Colorado, J. An integrated ROV solution for underwater net-cage inspection in fish farms using computer vision. SN Appl. Sci. 2020, 2, 1946. [Google Scholar] [CrossRef]
  20. Zhao, Y.P.; Niu, L.J.; Du, H.; Bi, C.W. An adaptive method of damage detection for fishing nets based on image processing technology. Aquac. Eng. 2020, 90, 102071. [Google Scholar] [CrossRef]
  21. Kagemoto, H. Forecasting a water-surface wave train with artificial intelligence- A case study. Ocean. Eng. 2020, 207, 107380. [Google Scholar] [CrossRef]
  22. Liao, W.X.; Zhang, S.B.; Wu, Y.H.; An, D.; Wei, Y.G. Research on intelligent damage detection of far-sea cage based on machine vision and deep learning. Aquac. Eng. 2022, 96, 102219. [Google Scholar] [CrossRef]
  23. Long, J.; Shelhamer, E.; Darrell, T. Fully convolutional networks for semantic segmentation. In Proceedings of the 2015 IEEE Conference on Computer Vision and Pattern Recognition (CVPR), Boston, MA, USA, 7–15 June 2015; pp. 3431–3440. [Google Scholar] [CrossRef] [Green Version]
  24. Liu, W.; Anguelov, D.; Erhan, D.; Szegedy, D.; Reed, S. SSD: Single Shot MultiBox Detector. In Computer Vision—ECCV; Springer: Cham, Switzerland, 2016; pp. 21–37. [Google Scholar] [CrossRef] [Green Version]
  25. Girshick, R.; Donahue, J.; Darrell, T.; Malik, J. Rich feature hierarchies for accurate object detection and semantic segmentation. In Proceedings of the 2014 IEEE Conference on Computer Vision and Pattern Recognition, Washington, DC, USA, 24–28 June 2014; pp. 580–587. [Google Scholar] [CrossRef] [Green Version]
  26. Ren, S.Q.; He, K.M.; Girshick, R.; Sun, J. Faster R-CNN: Towards real-time object detection with region proposal networks. IEEE Trans. Pattern Anal. Mach. Intell. 2017, 39, 1137–1149. [Google Scholar] [CrossRef] [PubMed] [Green Version]
  27. Lin, T.Y.; Dollár, P.; Girshick, R.; He, K.M. Feature Pyramid Networks for Object Detection. In Proceedings of the 2017 IEEE Conference on Computer Vision and Pattern Recognition (CVPR), Honolulu, HI, USA, 21–26 July 2017; pp. 936–944. [Google Scholar] [CrossRef] [Green Version]
  28. Dai, J.F.; Qi, H.Z.; Xiong, Y.W.; Li, Y.; Zhang, G.D. Deformable Convolutional Networks. In Proceedings of the 2017 IEEE International Conference on Computer Vision (ICCV), Venice, Italy, 22–29 October 2017; pp. 764–773. [Google Scholar] [CrossRef] [Green Version]
  29. Buslaev, A.; Parinov, A.; Khvedchenya, E.; Iglovikov, V.I. Albumentations: Fast and Flexible Image Augmentations. Information 2020, 11, 125. [Google Scholar] [CrossRef] [Green Version]
  30. Torralba, A.; Russell, B.C.; Yuen, J. LabelMe: Online image annotation and applications. Proc. IEEE 2010, 98, 1467–1484. [Google Scholar] [CrossRef]
  31. He, K.M.; Zhang, X.Y.; Ren, S.Q.; Sun, J. Deep Residual Learning for Image Recognition. In Proceedings of the 2016 IEEE Conference on Computer Vision and Pattern Recognition (CVPR), Las Vegas, NV, USA, 27–30 June 2016; pp. 770–778. [Google Scholar] [CrossRef] [Green Version]
  32. Qiao, S.Y.; Chen, L.C.; Yuille, A. DetectoRS: Detecting Objects with Recursive Feature Pyramid and Switchable Atrous Convolution. In Proceedings of the 2021 IEEE/CVF Conference on Computer Vision and Pattern Recognition (CVPR), Nashville, TN, USA, 20–25 June 2021; pp. 10208–10219. [Google Scholar] [CrossRef]
Figure 1. Sample images of damaged netting were taken under different conditions. (a) Real marine aquaculture. (b) With wave influence. (c) With still and turbid seawater. (d) With still and clear seawater.
Jmse 10 00996 g001
Figure 2. Augmentation operations on the damaged netting images. (a) Original image. (b) Translation operation. (c) Mirror operation. (d) Gaussian noise.
Jmse 10 00996 g002
Figure 3. Training dataset labeling on (a) LabelMe and (b) their mask layers.
Jmse 10 00996 g003
Figure 4. Structure diagram of the residual block. (a) Residual block in ResNet-18/34. (b) Bottleneck layer in ResNet-101/152.
Jmse 10 00996 g004
Figure 5. The process of feature extraction, feature merging, and proposal generation.
Jmse 10 00996 g005
Figure 6. Object detection process.
Jmse 10 00996 g006
Figure 7. Schematic diagram of the netting damage detection model. Note: ① indicates the backbone for feature extraction, ② indicates the Region Proposal Network, ③ indicates the edge segmentation training branch, and ④ indicates the object detection and classification module.
Jmse 10 00996 g007
Figure 8. The architecture of RFP.
Jmse 10 00996 g008
Figure 9. DCN diagram with 3 × 3 convolution kernel.
Jmse 10 00996 g009
Figure 10. The training loss convergence of the model and its branches.
Jmse 10 00996 g010
Figure 11. Netting damage detection effects of models in the ablation experiment. (a) Mask R-CNN, (b) Mask R-CNN+RFP, (c) Mask R-CNN+DCN, and (d) Mask R-CNN+RFP+DCN.
Jmse 10 00996 g011aJmse 10 00996 g011b
Figure 12. Comparison of detection effects of different models under different environments. (a) Original images, (b) OpenCV, (c) SSD, (d) YOLOv3, and (e) Cascade R-CNN. (f) Our model.
Jmse 10 00996 g012aJmse 10 00996 g012b
Table 1. Structural parameters of the test netting.
ParameterValue
Height0.6-m
Width0.4-m
Twine diameter1.2 mm, 3.0 mm, 4.8 mm
Length of mesh bar1.5 cm, 3.0 cm
MaterialPolyethylene
Table 2. Parameters of the training model.
ParameterValue
Batch size16
Iteration675
Epoch300
Initial learning rate0.01
Decay rate0.98
Dropout rate0.4
Table 3. Confusion matrix.
Prediction
PositiveNegative
ActualTrueTrue Positive (TP)True Negative (TN)
FalseFalse Positive (FP)False Negative (FN)
Table 4. Damage detection results in different improved stage models.
ModelMissing RateAPF1 ScoreFPS
Mask R-CNN28.56%86.62%85.81%4.46
Mask R-CNN+RFP11.18%90.12%89.27%4.20
Mask R-CNN+DCN21.83%91.90%90.11%4.82
Mask R-CNN+RFP+DCN7.12%94.48%94.02%4.74
Table 5. Performance comparison of different models for netting damage detection.
ModelMissing RateAPF1 ScoreFPS
OpenCV56.92%——29.36
SSD35.80%77.98%75.33%5.67
YoloV329.21%81.27%78.79%9.77
Mask R-CNN28.56%86.62%85.81%4.46
Cascade R-CNN23.99%89.15%88.56%2.9
Our model7.12%94.48%94.02%4.74
Publisher’s Note: MDPI stays neutral with regard to jurisdictional claims in published maps and institutional affiliations.

