Abstract
Low-angle lee-side slopes of dunes are commonly developed on the world’s riverbeds, and dune migration associated with sediment transport exert a major influence on riverine processes. However, the catenary-bead dune has been identified in the Yangtze River (YR) Estuary, featuring a higher lee-side angle. To date, the morphological variation and formation reasons of catenary-bead dunes in the YR Estuary remain uncharacterized. In this study, we used a multibeam echo system (MBES) to investigate the bedforms of the YR estuary during 2014–2015, as well as to discuss the seasonal variation of catenary-bead dunes. The results indicate that the catenary-bead dunes of the YR Estuary are characterized by growth during the flood season and extinction during the dry season. The lee-side angle is typically ~16.7°, which is larger than that of other dune types (3.7–8°) in the estuary; moreover, the catenary-bead dunes are higher than other dune types of the same length in the YR Estuary. The relationship between the dune height (H) and length (L) was found to be H = 0.1667L0.603 (R2 = 0.38), while the other dune types yielded the relationship of H = 0.0845L0.758 (R2 = 0.52). Strong runoff superimposing the ebb tide led to the development of catenary-bead dunes. Furthermore, the higher coarse sediment content (69.9–72%) and lower clay content (6.3–6.7%) of the riverbed sediment are favorable for their formation, while the higher curved crest-lines are favorable for the formation of the associated elliptical pits.
1. Introduction
Subaqueous dunes are extensively developed on the beds of rivers, estuaries, and continental shelf environments [1], and range from several meters to kilometers in length [2]. The morphological variation and migration of dunes pose challenges to navigation [3], offshore engineering [4], and flood control projects in the estuarine and coastal areas [4,5]. Therefore, the formation and deformation of dunes are of great concern to geographers, coastal engineers, and marine scientists worldwide [6,7,8], and they have been investigated both in laboratory and field settings [9].
It is well understood that flow dynamics are responsible for controlling dune geometry, producing all types, from simple to dynamics control dune shapes [10]. Ashley (1990) reported that with an increase in flow strength, a riverbed can transform from a flatbed to a dune, then to a dynamic flatbed [2]. As another controlling factor, the different sediment contents (i.e., cohesive or non-cohesive beds) can also lead to different dune geometries under similar flow conditions [11]. For example, the different proportions of cohesive material (mud, clay, and microorganisms) may lead to different dune height and geometry [12,13]. Meanwhile, it is also understood that dune evolution and morphodynamics are related to water depth [14] and riverbed topography [14,15].
Within the Yangtze River (YR) Basin, numerous studies have been conducted on the dunes in the lower reach of the YR and in the YR Estuary. Cheng et al. (2002) obtained high-resolution images of dune movement and reported that the dune scale is larger during the ebb tide period than the flood tide period [16]. The maximum dune length was ~300 m prior to the operation of the Three Gorges Dam (TGD) [17] and the dune length has increased to 441 m after the running of the TGD in the lower reach of the YR [18]. Wang et al. (2011) found that dune characteristics are related to several factors, including the channel geomorphological properties, such as its surrounding sand ridge, as well as the hydrodynamic environment of the flood and ebb channels [19]. The above studies deepen our understanding of the dune development mechanism in the wider YR system. However, within the YR Estuary, a new type of dune has been reported, named the catenary-bead dune [20]. The main difference between catenary-bead dunes and other dune types is whether or not the accompanying elliptical pits are developed. In that initial study, it was found that the number of elliptical pits between the adjacent catenary-bead dunes varied from 2 to 10 and, thereby, increased the angle of the lee-side slopes [20]. Meanwhile, the catenary-bead dunes were also found to have a higher dune height than other dune types of similar length. However, the morphological variation and developmental characteristics of catenary-bead dunes in the dry and flood seasons remain unclear due to the limitations of existing field data, which have not been collected over multiple periods. Additionally, whether this dune type represents an instantaneous state, i.e., post-typhoon dune morphology, is yet to be confirmed.
To investigate these issues, we used a multibeam echo system (MBES) to collect high-resolution bathymetric data of the YR Estuary during the dry and flood seasons in 2014–2015. The primary aims of the study were to: (1) explore morphological differences and developmental characteristics of the bedforms, especially catenary-bead dunes, during the dry and flood seasons, and (2) analyze the possible underlying mechanism of the evolution of catenary-bead dunes in the YR Estuary. The results are expected to have significant implications for understanding of bedform formation and evolution of this new dune type, as well as to yield important information for laboratory simulation studies.
2. Study Area
The YR itself is the longest river in China, with a length of 6300 km (Figure 1a). The YR Estuary features three-level bifurcation and four distributaries that enter the sea. The river delivers large amounts of sediment (500 Mt/y) to its estuary and has formed a 20,000 km2 delta system [21]. The YR has an annual average flow discharge of 29,800 m3/s, and its tidal limit is 560 km upstream of the estuary area [22]. Maximum and minimum daily discharges are 92,000 m3/s and 4600 m3/s, respectively, according to observation data [23]. Between 1950 and 2000, the annual flow discharge and sediment load were 9.05 × 10¹¹ m3 and 4.30 × 10⁸ t, respectively [18].
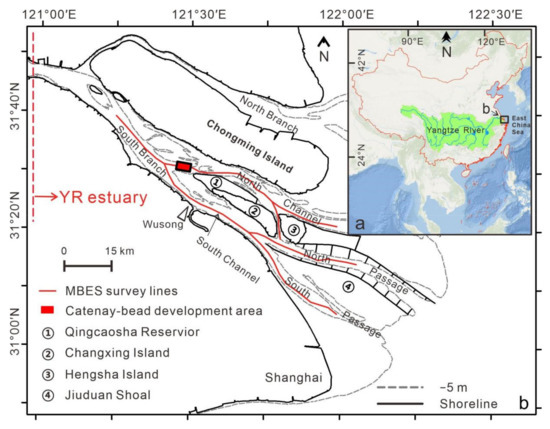
Figure 1.
Maps of study area. (a) Sketch map of the Yangtze River (YR) Basin. (b) Location of the study area and the geomorphic pattern of the YR Estuary.
The first-level bifurcation occurs at Chongming Island, where the channel is split into the North and South branches (Figure 1b). The second-level bifurcation at Changxing Island divides the flow into the North and South channels, and the third-level bifurcation at the Jiuduan Shoal separates the flow into the North and South passages (Figure 1b). The development area of the catenary-bead dunes is located at the end of the South Branch (Figure 1b). In this area, the river channel is characterized by large, unstable sand bars and the navigable channel changes frequently [24]. In addition, the YR Estuary is macro-tidal, with average and maximum tidal ranges of 2.66 m and 4.62 m (Zhongjun station), respectively [25]. However, the spring tidal range can reach up to 4.5 m, while the maximum local current velocity can reach up to 3 m/s [24]. Waves generated in the estuary are mainly controlled by local winds in the river mouth area, with mean and maximum wave heights of 1 m and 6.2 m, respectively [26]. The direction of the summer prevailing wind is known to be SSE–SE, which leads to northward coastal currents. Meanwhile, the direction of the winter prevailing wind is NW–NE and generates southward alongshore currents [27].
3. Methods
A SeaBat 7125 MBES (Teledyne Reson, Slangerup, Denmark) system was utilized to monitor the subaqueous topography the catenary-bead dune field during the flood season (neap tide on 29 October 2014, and spring tide on 1 July 2015) and dry season (spring tide on 4 February 2015). The MBES utilized a compass, motion sensor, depth sensor, sound velocity sensor, and positioning system to control the data accuracy. The compass provided the heading, while the motion sensor was used to measure the attitude, i.e., roll, pitch, and heave of the vessel. The depth sensor was used to collect the water depth in real time, and the sound velocity sensors provided the sound velocity for different areas. A Trimble real-time differential global positioning system (DGPS; Trimble Inc., Sunnyvale, CA, USA) was used to control the position accuracy at the decimeter level. Operationally, the MBES has two choices of working frequency: 400 kHz or 200 kHz. Of these, we selected the 400 kHz mode, for which the central beam angle was 0.5°, with a typical measurement depth of 0.5–150 m and a theoretical vertical water depth resolution of 6 mm. Under this mode, the MBES had 512 beams with a theoretical maximum ping rate of 50 ± 1 Hz. The track-lines were spaced at a covered width that was equal to a distance of 5–6 times the water depth. During the survey, the MBES was fixed on to the left/port side of the vessel. The vessel speed was kept as constant as possible, at 2.5–3.5 m/s. Therefore, spatial resolution in longitudinal direction reached up to 0.35 m, with the maximum vessel speed of 3.5 m/s and an actual minimum ping rate of 10 Hz. In the study area, the overall water depth was less than 20 m. Thus, laterally, the spatial resolution between two points reached up to 0.5 m. All outlier beam signals were deleted using PDS 2000 software, and the mapping resolution was set to 1 × 1 m. The tidal correction was processed using hydrological data. Meanwhile, the base level was calibrated to the mean sea level, which is 202 cm higher than the datum altitude according to the Wusong Tide Station.
A 600-kHz acoustic Doppler current profiler (ADCP) (Teledyne RDI Instruments, Poway, CA, USA) was used to measure the flow velocity, and that sensor was fixed on the right/starboard side of the vessel. The ADCP, which features four transducers inclined at an angle of 20° to the vertical, emits sound pulses backscattered by scattering objects in the water column (objects moving at the same speed as the flow) [28]. The flow velocity was measured at 5-s intervals and the data were processed in open-source MATLAB software. However, the ADCP dataset indicated a blank area near the bottom layer, at the water depth of 0.1 H (with H being water depth). Thus, the bottom velocity in this study was replaced by the velocity near-bed approximately 1–2 m on the riverbed [20]. Two surveys were conducted, with both covering one tidal cycle of approximately 13 h in October 2014 (neap tide) and 20 h in February 2015 (spring tide).
Catenary-bead dunes have variable height and length, therefore, these parameters were measured at least of three cross-section profiles along the dune (Figure 2). Since elliptical pits will add to the dune height, the cross-section profiles were set to pass through the center of these pits. In this study, the maximum dune height (H) and the corresponding dune length (L) were selected as the measured dune height and length, respectively. Meanwhile, only the depth of elliptical pits greater than 0.3 m were calculated (the datum was used as the average water depth of the dune trough surrounding each elliptical pit). The parameters of other dune types also measured using three cross-section profiles along the dune.
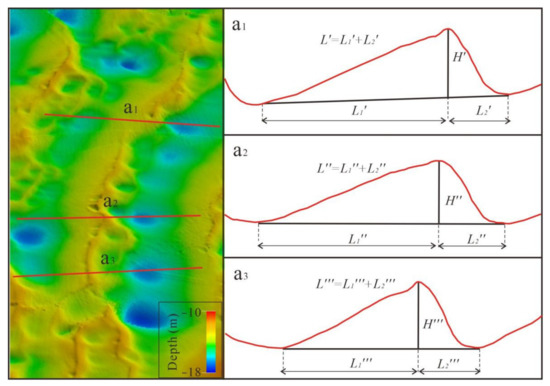
Figure 2.
Map and statistical methods for measuring of catenary-bead dunes. (a1–a3) represent the cross-sections of one catenary-bead dune. H’–H’’’ and L’–L’’’ are the measured dune height and length, respectively.
Thus, the dune parameters were calculated as follows:
H = max (H’, H’, H’’’…)
L = f (H)
In October 2014, two samples of riverbed sediments were collected simultaneously in the catenary-bead dune field. Two samples were collected in February 2015 (see sample locations in Figure 3). The surveying vessel was stopped when sampling riverbed sediments. The upper 3–10 cm of the riverbed sediments was collected by a grab sampler [20]. All samples were analyzed using a Mastersizer 2000 laser diffraction granulometer with a measurement range 0.02–2000 μm.
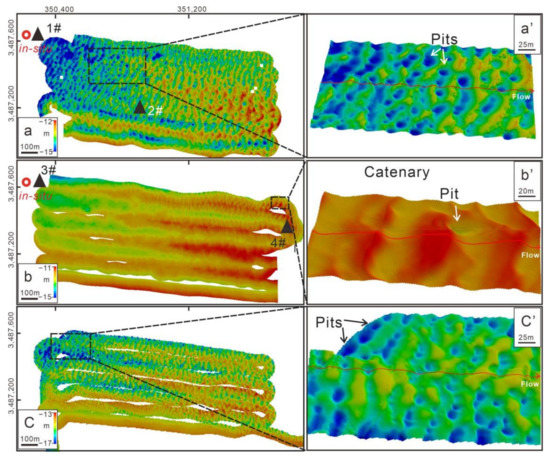
Figure 3.
Bedforms in the South and North Channel of the YR Estuary. (a) October 2014 (adapted from Zheng et al., 2016 [20]); (b) February 2015; and (c) July 2015. Panels (a’–c’) show enlarged views of the areas in the white rectangles. Red circles in Figure 3a,b are locations of flow data collection. Black triangles in Figure 3a,b are locations of sediment samples.
4. Results
4.1. Dune Morphology
4.1.1. Flood Season in October 2014 and in July 2015
Typical catenary-bead dunes were found in the YR estuary (Figure 3a,c). In October 2014, typical catenary-bead dunes were developed with an average dune length of 31.9 m and height of 1.3 m (number of 105). A total of 473 inlaid elliptical pits were identified in these catenary-bead dunes (Figure 3a). Overall, 212 of these inlaid elliptical pits were measured; their maximum and average depth was 2.0 m and 1.0 m, respectively (Table 1).

Table 1.
Parameters of catenary-bead/catenary in the Yangtze estuary.
In July 2015, catenary-bead dunes were again developed in the study area (Figure 3c). A total of 122 catenary-bead dunes developed with an average length of 25.8 m and average height of 1.3 m (number of 82). A total of 378 inlaid elliptical pits were identified, of which 55 pits were measured. The maximum and average depth of these pits was 1.7 m and 0.9 m, respectively (Table 1). Totally, the lee-side angle of catenary-bead dunes is ~16.7°. Meanwhile, a total of 411 dunes (other types, such as linear and curved dunes) along the navigational channel in the YR Estuary were measured (locations see Figure 1b). The results show that the dune height range from 0.2 m to 1.9 m with an average value of 0.8m, while the dune length is of 5.3–69.2 m with an average value of 20.5 m. The lee-side angle is of 3.7–8°.
4.1.2. Dry Season in February 2015
In February 2015, the catenary-bead dunes were absent, and 35 of the other type dunes (i.e., catenary dunes) had developed in the study area (Table 1). The catenary dune length ranged from 14–37.5 m and the height ranged from 0.3–1.1 m (Table 1). Only one elliptical pit was found in the study area with the pit depth of 1.2 m (Figure 3b).
4.1.3. Relationship between Dune Height and Length
The dune height (H) and length (L) of 187 catenary-bead dunes in the YR Estuary during the 2014 and 2015 flood seasons were analyzed (Figure 4), yielding the relationship shown in Equation (3):
H = 0.1667L0.603 (n = 187, R2 = 0.38)
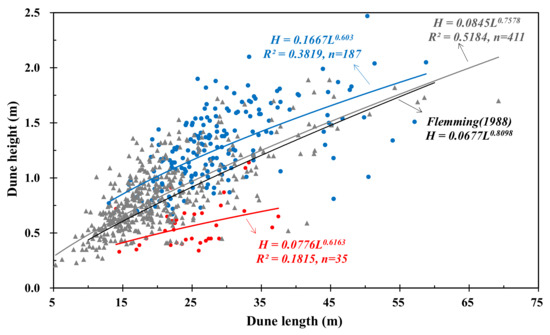
Figure 4.
Relationship between length (L) and height (H) for the catenary-bead dunes (bedform developed in the catenary-bead dune area in flood season, blue line), the other dune type (bedform developed in the catenary-bead dune area in dry season, red line), other dunes in the YR estuary (gray line, locations see the MBES lines area in Figure 1b) and Flemming (1998) line.
Here, n is number of dunes. The dune height (H) and length (L) of 35 catenary dunes in the YR Estuary during the 2015 dry season were analyzed (Figure 4), yielding the relationship shown in Equation (4):
H = 0.0776L0.6163 (n = 35, R2 = 0.182)
Finally, the dune height (H) and length (L) of 411 dunes along the navigational channel in the YR Estuary were analyzed (Figure 1b), yielding the relationship shown in Equation (5):
H = 0.0845L0.7578 (n = 411, R2 = 0.518)
The catenary-bead dune line was located above the Flemming (1988) line and the dune line of the YR Estuary (Figure 4). This phenomenon indicates that the catenary-bead dunes are taller than the other dune types of the same length, which is attributable to the development of the associated elliptical pits.
4.2. Riverbed Sedimentary Characteristics
Two riverbed sediment samples collected during the flood season (October 2014) and two samples collected during the dry season (February 2015) were analyzed. The results show that during the flood season, the riverbed sediments consisted of mostly sand with a median grain size of 118.5–120.7 μm. In the dry season, they consisted of mainly fine silt with a median grain size of 6–10 μm (Table 2). The clay content (<2 μm) was 6.3–6.7% during the flood season (October 2014), which increased to 18–23.9% during the dry season (February 2015; Table 2). The coarse sediment content (>63 μm) decreased from 69.9–72% in the flood season to 2.7–3.3% in the dry season (Table 2).
Table 2.
Grain size characteristics of riverbed sediments in the study area.
4.3. Flow Velocity
Both the flood and dry season surveys in the study area covered a complete tidal cycle, with the neap tide occurring on 29 October 2014 and the spring tide occurring on 4 February 2015. The bottom velocity of the study site was analyzed, and the results show that the maximum bottom velocity of the ebb tide was 0.97 m/s and 0.9 m/s in the flood and dry seasons, respectively (Figure 5).
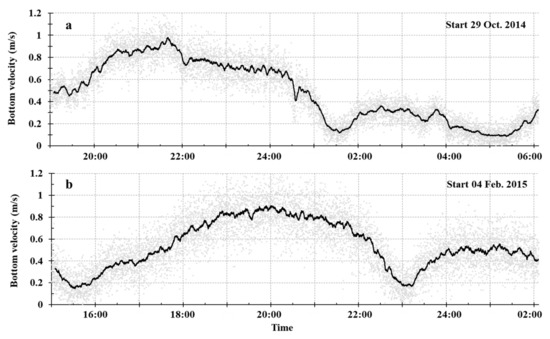
Figure 5.
Neap and spring tide cycles during the (a) flood, and (b) dry seasons.
5. Discussion
Typhoons may influence the dune morphology [3]. In a previous study of catenary-bead dunes, Zheng et al. (2016) suggested that typhoons (e.g., Fenghuang, 23 September 2014) may have influenced the development of the catenary-bead dunes, as typhoons can cause severe hydrodynamic changes [20]. The above views were also supported by Felice et al. (2022) [29] Based on this, the catenary-bead dunes may be considered instantaneous bed forms after the typhoon. Campmans et al. (2017) have also confirmed that storms influence dune morphodynamics [30]. To explore this hypothesis in this study, three-period bathymetry analysis was performed, and it was found that dune development in the YR Estuary was a periodic phenomenon. In the flood season (October 2014 and July 2015), the YR Estuary developed typical catenary-bead dunes with a large number of inlaid elliptical pits (Figure 3a,c). Those pits then vanished in the dry season (February 2015), while the other dune type parameters indicated a reduction in size (Figure 3b). Nevertheless, there was no typhoon that occurred prior to the July 2015 survey date. Therefore, typhoons cannot fully explain the development of these dunes.
Schindler et al. (2016) used a flume channel to determine how the clay content influences dune morphodynamics [11]. They found that the presence of clay can reduce dune height, length, and steepness; thus, different clay contents can yield different dune types as follows: three-dimensional dunes (1.9% clay content), lower-angle dunes (4.7–9.8%), very low-angle dunes partly masked by current ripples (11.9%), and nearly flat riverbeds (12.7–14.1%). These results may help explain the formation of catenary-bead dunes. In the study area, the clay content of the riverbed sediments ranged from 6.3–6.7% during the flood season, which was significantly lower than that during the dry season (18–23.9%) (Table 2). Therefore, the periodic changing of clay contents, i.e., lower clay content in the flood season, may be key to the development of catenary-bead dunes in the YR Estuary. Although the clay contents were higher than the identifying value of 1.9%, we consider that the episodic re-suspension of riverbed sediment in the YR Estuary may have led to the noted decrease of clay contents, as noted by Cheng et al. (2000) [31]. They also found that a large-scale dune formed, accompanied by strong re-suspension in the sedimentary environment of coarse silt and very fine sand. In addition, prior to the three surveys, runoff discharge was measured over 30 days at Datong Station. The data showed a runoff discharge of 31.4 × 10³ and 49.2 × 10³ m3/s during the flood seasons of 2014 and 2015, respectively (Figure 6). However, the runoff discharge was only 12.1 × 10³ m3 s–1 during the 2015 dry season (Figure 6). In the YR Estuary, the flow velocity is typically influenced by runoff discharge as well as the tidal cycle. Runoff discharge contributes towards the flow velocity during the ebb cycle. Thus, in this case, because the tidal cycle remained relatively stable, the velocity was determined by the runoff discharge. The bottom velocities measured in 2014 and 2015 also show that the ebb/flow velocity was greater during the flood season than during the dry season (Figure 5). For example, the maximum bottom velocity of the ebb tide was 0.97 m/s in the flood season and 0.9 m/s in the dry season. This is important because previous research has shown that greater bottom velocity is beneficial for the development of large-scale dunes [32]. The above data support the concept that the bathymetry, flow, and sediment properties in the flood season are of greater benefit for the development of dunes in the YR Estuary than in the dry season.
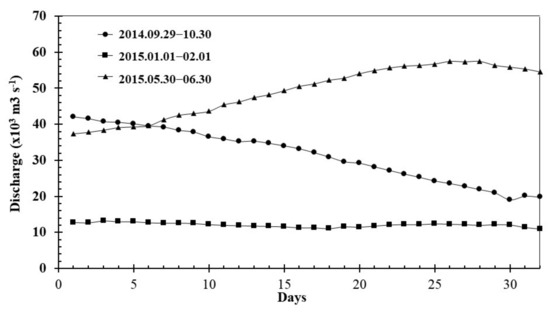
Figure 6.
Runoff discharge at Datong Station.
It has been suggested that the shape of dune ridges may also influence the formation of catenary-bead dunes [33]. Moreover, Leone et al. (2021) found that the injection of the mineral colloidal silica-based grout can change the mechanical strength of non-cohesive and reduce the dune erosion [34]. This seems reasonable because dunes with high curved crest-lines tend to create scour troughs due to the occurrence of intense, large-scale turbulence over the dunes [33,35], thereby generating favorable conditions for turbulence formation on the lee side of dunes. It has been reported that the catenary-bead dunes in the YR Estuary have a high crest-line (ridge crest) with lengths ranging from 34.7 m to 407.8 m [20], which is favorable for the development of elliptical pits. The development of elliptical pits will increase the lee-side angle (Figure 3a). The parameters and lee-side angle of the dunes are shown in Figure 7, indicating that the catenary-bead dune type has a lee-side angle of ~16.7° while the other dune types have a smaller lee-side angle (3.7–8°). In addition, the relationship between dune height and length also support that the catenary-bead dunes in the YR Estuary are taller than the other dune types of the same length (Figure 4). Furthermore, Cisneros et al. (2010) stated that permanent flow separation occurs when the lee-side angle is greater than 10°, whereas the flow is fully developed when the angle is >24° [5]. The data of this study show that the catenary-bead dunes have a higher lee-side angle (>10°); thus, flow separation may have occurred on the lee-side, and increased the depth of the elliptical pits. The results also indicate that in the flood season, the coarser riverbed sediment and strong runoff superimposed on the ebb tide may have led to the development of catenary-bead dunes. Meanwhile, the intensity of runoff in the lower reach of the YR Estuary became weaker, especially near the maximum turbidity zone. Thus, the clay contents increased, which likely led to the other dune type having a smaller lee-side angle (Figure 7b,f). In the end, the other dune type failed to develop into catenary-bead dunes.
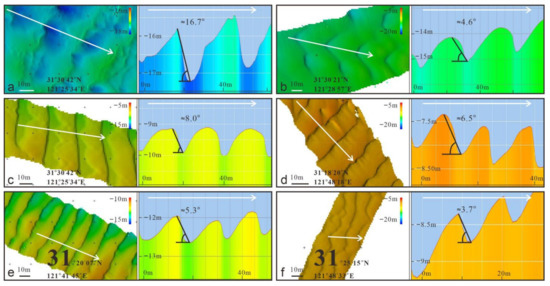
Figure 7.
Dune parameters and lee-side slope angle of dunes in the YR Estuary. (a) catenary-bead dunes with lee-side angle of ~16.7°; (b,d) are curved dunes with lee-side angle of ~4.6–6.5°; (c,e) are liner dunes with lee-side angle of 5.3–8°; (f) the catenary dunes with angle of −3.7°.
6. Conclusions
In this study, three bathymetric surveys were conducted during 2014–2015 in the YR Estuary. The results reveal that the catenary-bead dunes are characterized by growth during the flood season and extinction during the dry season. The lee-side angle of the catenary-bead dunes was found to be ~16.7°, which is larger than that of other dune types (3.7–8°) in the estuary. In addition, the catenary-bead dunes were taller than the other dune types of the same length, with the dune height (H) and dune length (L) yielding a relationship of H = 0.1667L0.603 (R2 = 0.38). Further, the results suggest that strong runoff superimposed on the ebb tide, which leads to their development. Finally, it was found that the combination of higher curved crest-lines is favorable for the formation of elliptical pits.
Author Contributions
Data curation, H.C.; formal analysis, E.L. and Z.L.; methodology, X.G. and Y.C.; software, X.Y.; writing—original draft, S.Z.; writing—review and editing, S.Y., E.L. and Z.L. All authors have read and agreed to the published version of the manuscript.
Funding
This research was funded by Natural Science Foundation of Shandong Province, grant number ZR2020QD083, Postdoctoral Science Foundation funded project, grant number 2018M642693 and Comprehensive survey of the geological environment along the Changjiang River, grant number DD20190260. This paper was also supported by the National Natural Science Foundation of China-The Netherlands Organization for Scientific Research-Engineering and Physical Sciences Research Council (NSFC-NWO-EPSRC) (51761135023).
Data Availability Statement
Data available on request.
Conflicts of Interest
The authors declare no conflict of interest.
References
- Cisneros, J.; Best, J.; Van Dijk, T.; Almeida, R.; Amsler, M.; Boldt, J.; Freitas, B.; Galeazzi, C.; Huizinga, R.; Ianniruberto, M.; et al. Dunes in the world’s big rivers are characterized by low-angle lee-side slopes and a complex shape. Nat. Geosci. 2020, 13, 156–162. [Google Scholar] [CrossRef]
- Ashley, G.M.; Boothroyd, J.C.; Bridge, J.S.; Clifton, H.E.; Twitchell, D.C. Classification of large-scale subaqueous bedforms: A new look at an old problem. J. Sediment. Res. 1990, 60, 160–172. [Google Scholar]
- Lemke, L.; Miller, J.K. Role of Storm Erosion Potential and Beach Morphology in Controlling Dune Erosion. J. Mar. Sci. Eng. 2021, 9, 1428. [Google Scholar] [CrossRef]
- Janssen, M.S.; Miller, J.K. The Dune Engineering Demand Parameter and Applications to Forecasting Dune Impacts. J. Mar. Sci. Eng. 2022, 10, 234. [Google Scholar] [CrossRef]
- Greaver, T.L.; Sternberg, L. Decreased precipitation exacerbates the effects of sea level on coastal dune ecosystems in open ocean islands. Glob. Change Biol. 2010, 16, 1860–1869. [Google Scholar] [CrossRef]
- Sinha, S.; Hardy, R.J.; Blois, G.; Best, J.; Smith, G. A numerical investigation into the importance of bed permeability on determining flow structures over river dunes. Water Resour. Res. 2017, 53, 3067–3086. [Google Scholar] [CrossRef] [Green Version]
- Guala, M.; Heisel, M.; Singh, A.; Musa, M.; Buscombe, D.; Grams, P. A mixed length scale model for migrating fluvial bedforms. Geophys. Res. Lett. 2020, 47, e10.1029. [Google Scholar] [CrossRef]
- Scheiber, L.; Lojek, O.; Götschenberg, A.; Visscher, J.; Schlurmann, T. Robust methods for the decomposition and interpretation of compound dunes applied to a complex hydromorphological setting. Earth Surf. Proc. Landf. 2021, 46, 478–489. [Google Scholar] [CrossRef]
- Best, J. The fluid dynamics of river dunes: A review and some future research directions. J. Geophys. Res. 2005, 110, F04S02. [Google Scholar] [CrossRef]
- Clifford, N.J.; Robert, A.; Richards, K.S. Estimation of flow resistance in gravel-bedded rivers: A physical explanation of the multiplier of roughness length. Earth Surf. Proc. Landf. 2010, 17, 111–126. [Google Scholar] [CrossRef]
- Parsons, D.R.; Schindler, R.J.; Hope, J.A.; Malarkey, J.; Thorne, P.D. The role of biophysical cohesion on subaqueous bed form size. Geophys. Res. Lett. 2016, 43, 1566–1573. [Google Scholar] [CrossRef] [Green Version]
- Kostaschuk, R.A.; Venditti, J.G. Why do large, deep rivers have low-angle dune beds? Geology 2019, 47, 919–922. [Google Scholar] [CrossRef]
- Davidson-Arnott, R.; Hesp, P.; Ollerhead, J.; Walker, I.; Bauer, B.; Delgado-Fernandez, I.; Smyth, T. Sediment budget controls on foredune height: Comparing simulation model results with field data. Earth Surf. Proc. Landf. 2018, 43, 1798–1810. [Google Scholar] [CrossRef]
- Bradley, R.W.; Venditti, J.G. Transport scaling of dune dimensions in shallow flows. J. Geophys. Res Earth Surface 2019, 124, 526–547. [Google Scholar] [CrossRef]
- Ma, X.C.; Yan, J.; Fan, F. Response of bedload transport, submarine topography, and dune internal structures to typhoon processes off Dongfang coast in the Beibu Gulf. Acta Oceanol. Sin. 2013, 32, 27–40. [Google Scholar] [CrossRef]
- Cheng, H.Q.; Li, M.T.; Zhou, T.Y.; Xue, Y.Z. High-resolution micro-topography movement in the Changjiang Estuary. Ocean Eng. 2002, 20, 91–95. [Google Scholar]
- Jing, C.; Wang, Z.; Li, M.; Wei, T.; Chen, Z. Bedform characteristics during falling flood stage and morphodynamic interpretation of the middle–lower Changjiang (Yangtze) River channel, China. Geomorphology 2012, 147–148, 18–26. [Google Scholar]
- Zheng, S.; Hu, H.; Xu, S.; Cheng, H.; Li, Z.; Liu, E. Spatial distribution and response of dunes to anthropogenic factors in the lower Yangtze River. Catena 2022, 212, 106045. [Google Scholar] [CrossRef]
- Wang, Y.H.; Shen, H.T.; Li, J.F.; Mao, Z.C. Geomorphologic features and transport of sand waves in the flood and ebb channels of the Changjiang estuary. J. Oceanol. Limnol. 2011, 42, 330–336. (In Chinese) [Google Scholar]
- Zheng, S.W.; Cheng, H.Q.; Wu, S.H.; Liu, G.W.; Lu, X.J.; Xu, W.X. Discovery and implications of catenary-bead subaqueous dunes. Sci. China Earth Sci. 2016, 46, 18–26. [Google Scholar] [CrossRef]
- Yang, S.L.; Xu, K.H.; Milliman, J.D.; Yang, H.F.; Wu, C.S. Decline of Yangtze River water and sediment discharge: Impact from natural and anthropogenic changes. Sci. Rep. 2015, 5, 12581. [Google Scholar] [CrossRef]
- Guo, X.; Fan, D.; Zheng, S.; Wang, H.; Qin, C. Revisited sediment budget model with latest bathymetric data in the highly altered Yangtze (Changjiang) Estuary. Geomorphology 2021, 391, 107873. [Google Scholar] [CrossRef]
- Zhang, E.; Chen, X.; Wang, X. Water discharge changes of the Changjiang River downstream Datong during dry season. J. Geogr. Sci. 2003, 13, 355–362. (In Chinese) [Google Scholar]
- Chen, J.; Zhu, H.F.; Dong, Y.; Sun, J.M. Development of the Changjiang estuary and its submerged delta. Cont. Shelf Res. 1985, 4, 47–56. [Google Scholar]
- Wu, J.X.; Wang, Y.H.; Cheng, H.Q. Bedforms and bed material transport pathways in the Changjiang (Yangtze) Estuary. Geomorphology 2009, 104, 175–184. [Google Scholar] [CrossRef]
- Wang, Y.; Ping, D.; Oguchi, T.; Chen, S.; Shen, H. Long-term (1842–2006) morphological change and equilibrium state of the Changjiang (Yangtze) Estuary, China. Cont. Shelf Res. 2013, 56, 71–81. [Google Scholar] [CrossRef]
- Zhu, B.; Li, Y.; Yue, Y.; Yang, Y.; Borthwick, A. Alternate erosion and deposition in the Yangtze Estuary and the future change. J. Geogr. Sci. 2020, 30, 145–163. [Google Scholar] [CrossRef] [Green Version]
- Hao, H.; Yang, Z.Y.; Yin, D.W.; Cheng, H.Q.; Hackney, C.R.; Parsons, D.R. The combined effect of discharge and tides on low-angle dune evolution at the tidal current limit of the Changjiang Estuary. Geomorphology 2021, 392, 107917. [Google Scholar]
- Leone, E.; Kobayashi, N.; Francone, A.; Bartolo, S.D.; Strafella, D.; Alessandro, F.D.; Tomasicchio, G.R. Use of Nanosilica for Increasing Dune Erosion Resistance during a Sea Storm. J. Mar. Sci. Eng. 2021, 9, 620. [Google Scholar] [CrossRef]
- Campmans, G.; Roos, P.; de Vriend, H.; Hulscher, S. Modeling the influence of storms on sand wave formation: A linear stability approach. Cont. Shelf Res. 2017, 137, 103–116. [Google Scholar] [CrossRef]
- Cheng, H.Q.; Song, B.; Xue, Y.Z. Mechanics on transport of coarser silt and very fine sand in the Changjiang Estuary_episodic re-suspension and large-scale bedform movement. J. Sediment Res. 2000, 1, 20–27. (In Chinese) [Google Scholar]
- Zhou, J.; Wu, Z.; Zhao, D.; Guan, W.; Zhu, C.; Flemming, B. Giant sand waves on the Taiwan Banks, southern Taiwan Strait: Distribution, morphometric relationships, and hydrologic influence factors in a tide-dominated environment. Mar. Geol. 2020, 427, 106238. [Google Scholar] [CrossRef]
- Felice, D.; Giuseppe, R.T.; Ferdinando, F.; Elisa, L.; Antonio, F.; Daniela, P.; Giuseppe, B.; Giandomenico, F. Beach–Dune System Morphodynamics. J. Mar. Sci. Eng. 2022, 10, 627. [Google Scholar]
- Parsons, D.R.; Best, J.L.; Orfeo, O.; Hardy, R.J.; Kostaschuk, R.; Lane, S.N. Morphology and flow fields of three-dimensional dunes, Rio Paraná, Argentina: Results from simultaneous multibeam echo sounding and acoustic Doppler current profiling. J. Geophys. Res. Earth Surface 2005, 110, F04S03. [Google Scholar] [CrossRef] [Green Version]
- Bartholomae, A.; Ernstsen, V.B.; Flemming, B.W.; Bartholdy, J. Bedform dynamics and net sediment transport paths over a flood-ebb tidal cycle in the Gradyb channel (Denmark), determined by high-resolution multi-beam echosounding. Geogr. Tidsskr. 2004, 104, 45–55. [Google Scholar] [CrossRef]
Publisher’s Note: MDPI stays neutral with regard to jurisdictional claims in published maps and institutional affiliations. |
© 2022 by the authors. Licensee MDPI, Basel, Switzerland. This article is an open access article distributed under the terms and conditions of the Creative Commons Attribution (CC BY) license (https://creativecommons.org/licenses/by/4.0/).