Article

Late Quaternary Evolution of a Submerged Karst Basin Influenced by Active Tectonics (Koločep Bay, Croatia)

1
Ministry of Agriculture, Ul. Grada Vukovara 78, 10000 Zagreb, Croatia
2
Croatian Geological Survey, Sachsova 2, 10000 Zagreb, Croatia
3
Laboratory of Marine Geology and Physical Oceanography, Department of Geology, University of Patras, 26504 Patras, Greece
4
Croatian Hydrocarbon Agency, Miramarska 24, 10000 Zagreb, Croatia
5
Croatian Natural History Museum, Demetrova 1, 10000 Zagreb, Croatia
*
Author to whom correspondence should be addressed.
J. Mar. Sci. Eng. 2022, 10(7), 881; https://doi.org/10.3390/jmse10070881
Submission received: 16 May 2022 / Revised: 17 June 2022 / Accepted: 23 June 2022 / Published: 27 June 2022

Abstract

:
Koločep bay is a 30 km elongated karst basin located between the Elafiti Islands and the mainland with a NW–SE general direction. The bay lies within the seismically active southern Dalmatia zone. Irregular grid sub-bottom profiles and two legacy reflection seismic profiles have been used to determine the overall morphology of the bay and to establish the seismic stratigraphy of its sedimentary infill. Three major seismic–stratigraphic units have been identified in the upper ~50 m of the ~120-meter-thick sedimentary sequence that lies above the karstified limestone bedrock. The karst polje basin was flooded due to sea-level rise before 12.1 kyr BP. The morphology of the bay implies complex influences of Late Glacial meltwater discharges, aeolian sand deposition, the existence of paleo–ponor/karst spring zones and buried Pleistocene river channels. The Pleistocene seismotectonic units are deformed in the NW and SE parts of the basin. The central part of the basin has no signatures of intensive tectonic activity during the Holocene. A major erosion event was identified that led to the formation of a basin within the older sedimentary infill. In the southern part of the basin, we have evidence of Holocene tectonic activity with the formation of erosional scarps on the seafloor of the bay.

1. Introduction

During the geological past, sea-level changes were frequent. The Quaternary is marked by extreme climate changes accompanied by glacial and interglacial intervals. Multiple studies have been based on the Quaternary sea-level changes [1,2,3,4]. During the Last Glacial Maximum (30,000–19,000 cal BP) (LGM), the sea level was about 120 m below sea level (b.s.l.) [3,5]. We can distinguish eustatic (global) and relative (local) sea-level changes [6]. Eustatic sea-level changes during the Quaternary were the consequence of creating and melting continental ice sheets [7] and they were independent from tectonic moving [6,8]. Relative sea-level changes (RSL) can be defined as a change in the sea level concerning the land [6]. Thus, the RSL is the sum of the eustatic, tectonic and glacial–hydro–isostatic influences in a certain area [7,9,10,11], whereas the weight and compaction of the sediment cover can also contribute [6]. The Adriatic Sea is a tectonically active area [12,13,14]. Therefore, it is only possible to reconstruct the RSL. The isolation basins provide a valuable source of data, especially RSL data where the basin sill controls the connection to or isolation from the sea by changes in RSL [15,16]. The consequences of compression with SW–NNE orientation along the eastern coast of the Adriatic Sea and sea-level rise during the Late Pleistocene and Holocene are that the coast parallel anticlines have formed island chains, and opposite to that, the coast parallel synclines have formed bays and channels [17]. Most of the eastern Adriatic coast is formed in limestone and dolomite [18,19]. Under the influence of the karstification processes, numerous types of karst features are formed (karrens, dolines, poljes, caves, pits, karstic river canyons, estavelle, etc.). One of the features that can often be observed in the karst area is the occurrence of estavelles. According to [20]’s definition, an estavelle is an intermittent resurgence or exsurgence of water, active only in wet seasons, which may act alternatively as a swallow hole or as a spring according to ground-water conditions. Most karst features are now under the sea due to the last late Pleistocene–Holocene inundation [21].
The area of interest, Koločep bay, is an area between the mainland and the Elafiti Islands in southern Dalmatia (Figure 1). It is one of the submerged karst basins that exists along the eastern Adriatic coast. Some of the studies conducted in the similar submerged karst basins are described by [22,23,24]. The Elafiti Islands form a chain of islands and islets (Šipan Island, Koločep Island, Lopud Island, Jakljan Island, Olipa Island, Tajan Islet, Crkvina Islet, Ruda Islet, Kosemč Islet, and Ruda Islet) that extend in a NW–SE direction. The wider region is tectonically active and characterized by moderate-to-strong earthquakes [14,25,26].
One of the most widespread and successful research methods in the study of the Quaternary sediment successions is the application of acoustic mapping techniques using a sub-bottom profiler [29,30,31,32]. Acoustic mapping techniques are commonly used for the determination of the geomorphology of the seabed, submerged karst relief, and river channels [30,32,33,34]. Furthermore, with this method, we can detect stratigraphic evidence of past and recent seismic activity and identify displaced seismic horizons, folded and faulted reflectors, erosional bases, and zones of discontinuity [30,31,35]. The application of a single research method, such as the geophysical method, is insufficient for detailed paleoenvironmental reconstructions. Valuable information about environmental changes in the past can only be obtained by the validation of sub-bottom data by the multiproxy investigation of sediment cores [30,36,37,38].
In this paper, we present the results obtained by a combination of sub-bottom profiler data and sediment core analysis and we discuss the Quaternary depositional evolution of the submerged karst basin in Koločep bay. The main goals of the present work are: (1) to identify the seismic stratigraphic structure of a submerged karst polje/basin sedimentary fill; (2) to elaborate a Late Pleistocene/Early Holocene model based on submerged karst basin sediments and buried sinkholes/ponors and paleorivers; (3) and to present evidence of Late Pleistocene to Holocene well-displayed deformation patterns in the submerged basin as a result of intensive tectonic activity comparable to surrounding onshore environments. The depositional environments are interpreted as a result of the interplay between peculiar karst geomorphology, basin fill processes and tectonics under the predominant influence of alternating highstands and lowstands of sea level during the Quaternary. We hypothesize that the Elaphite Islands functioned as a natural barrier during sea levels below 50 m b.s.l., causing the development of terrestrial environments typical of karst poljes. The rising sea led to the submergence of this karst basin. Ultimately, we believe our data will advance our understanding of the Quaternary paleoenvironmental variability in karst basins, leading to a better understanding of the sedimentation in the silled and isolated karst basins influenced by freshwater discharge through karst springs.

2. Study Area

2.1. Geographical Setting

Koločep bay (Koločepski kanal) is an area between the mainland and the Elafiti Islands in the Adriatic Sea (Figure 1). The bay has all the characteristics of a Dalmatian coastline setting within carbonate rocks that have been karstified since the Miocene [39]. The bay is a basin bounded by a chain of islands (the Elafiti Islands) mutually separated by sills, mainly 40 m b.s.l., parallel to the mainland coast. The deepest sill is 50 m b.s.l. and located between the Olipa and Jakljan islands. The coasts are very steep, but most of the basin seabed is almost flat and lies at depths between 59 and 61 m b.s.l.; the basin is closed in the SE part of the bay with a sill between Koločep Island and the mainland at a depth of 30 m b.s.l. The average width of the bay is 1.5 km in its SE part, but is almost 6 km wide in its NW part. The total length of the basin is 27 km (from the saltpans of Ston to Koločep Island) and the maximum depth of the bay is 67 m in a paleochannel structure on the NE coast of Olipa Island.

2.2. Geological Setting

The studied area belongs to the southeastern part of the Adriatic carbonate platform, which is one of the largest Mesozoic carbonate platforms of the peri-Mediterranean region [18]. According to the structural classifications, the area is located in the contact zone of the regional structural units of the Adriatic microplate and the External Dinarides [18,19,40]. Synsedimentary tectonics and eustatic changes during the Jurassic had a major impact on paleogeographic and sedimentary relationships. Large parts of the platform were elevated and karstified, whereas certain areas were submerged [18,41]. Upper Cretaceous and Jurassic limestones, Upper Triassic dolomites, Eocene flysch, Quaternary colluvial, and alluvial deposits predominately make up the surrounding area. Karstification of the limestones and dolomites is well observed in the form of the presence of numerous caves, dolines, karst poljes, and sinkholes. The karst in the study area is developed on top of an 8 km thick carbonate platform formed in the limestone and dolomite of the Mesozoic and Paleogene [18,24]. The present-day coastline is formed by the last sea-level rise during the late Pleistocene and Holocene when the folded, faulted and karstified relief was partially submerged [39,42]. Under the influence of compression tectonics with a maximum stress in a SW–NNE orientation, the final uplift of the Dinarides reached its maximum in the Oligocene/Miocene. Compression led to the extension of the Adriatic Sea and its coast in the NW–SE direction (Dalmatian type of coast) [18,43,44].

2.3. Structural Geology and Seismicity

Koločep bay is a part of a wider area recognized for active tectonics [14,25,45,46,47]. It is characterized by moderate-to-strong earthquakes that are the result of the subduction of the Adriatic microplate under the External Dinarides [25]. The most recent significant earthquake with a magnitude of 6.0 occurred near Ston in 1996 with a hypocenter at 15 km [14,48,49,50]. The mainshock was felt around 400 km away, with numerous aftershocks within 50 km from the main epicenter, which lasted for a year [14]. In Figure 2, it can be easily observed that the spatial distribution of earthquakes is along the NE–SW direction, which corresponds to the striking reverse faulting system dipping towards the NE margin of the Adriatic Sea [50].
Data from the past also indicate significant seismic activity. A good example is the great Dubrovnik earthquake of 1667, which had an epicenter intensity of X° MSC [25,49]. The structural characteristics of this area correspond to the basic tectonic elements of the External Dinarides, namely the domination of folded structural elements, the distinct linearity of the structures, the direction of the Dinaric strike, and the dense network of faults. According to [25,52,53], the most important fault assemblies are the Ploče–Dubrovnik and Pelješac–Dubrovnik faults. The Ploče–Dubrovnik zone has a variable width up to 1.5 km wide. The fault inclination is between 45° and 82°. The Pelješac–Dubrovnik structural assembly is represented by a zone of parallel faults which are 1.5–4.5 km wide. The Koločep bay basin lies between two major seismogenic fault zones: the southern Dubrovnik fault zone and the Mt. Mosor–Mt. Biokovo zone.

2.4. Karst Hydrogeology

According to [53], rocks in the surrounding area are divided into three groups according to the water permeability in hydrogeological functions. The first group is carbonate rocks, which are permeable in this area and represent aquifers. The second group is waterproof and waterless flysch rocks, which do not represent a significant lithostratigraphic formation but, according to their hydrogeological role and location along the reverse faults, influence the karst aquifers [54]. The third group represents unbound and semi-bound Quaternary sediments (colluvial deposits), which can only form aquifers of intergranular porosity in thicker deposits (karst poljes) and have medium, relatively low water permeability [53].
As a result of the hydrogeological relations and due to the lithological composition and structure of rocks, as well as their tectonic position, coastal karst springs and submarine karst springs (vruljas) appear in the hypsometrically lowest parts of the area, which have significant-to-high yields throughout the year [55]. The submarine and coastal karst springs (>30) developed in the Mali Ston channel, Bistrina bay, and surrounding area of Doli–Banići, Slano and Mali Zaton (Figure 3a), and they are considered to belong to the underground flows of the Trebišnjica river basin in Bosnia and Hercegovina [56]. According to [54], in the Dinaric karst region, there are approximately 130 poljes. The drainage of the karst polje is through ponors located along the polje perimeter and at the polje floor within unconsolidated sediments or exposed limestones and dolomites. The Adriatic Sea is an example of regional erosional bases which have a cascade system of poljes (Figure 3b). Poljes become flooded as the spring or recharge capacity of the ponor becomes lower than the inflow quantity of water. The natural plugging of ponors may also lead to intermittent flooding and a longer duration of floods [55] and the formation of lakes.

3. Materials and Methods

3.1. High-Resolution Seismic Survey

A total of 208 km of high-resolution seismic profiles were collected in April 2016 and are presented in this paper. They were recorded with the motorboat “Božja providnost II”. In total, 74 homogeneously distributed seismic lines (Figure 1) within Koločep bay were acquired with a 3.5 kHz ORE Pinger sub-bottom profiler (SBP) for the investigation of the preserved sediment sequence (GeoAcoustics Ltd., Great Yarmouth, UK). SBP data were logged using a Triton SB-Logger (v 7.3, Triton Imaging Inc., Capitola, CA, USA). Due to the dominant (silt) composition of the deposited sediments, the vertical signal penetration reached up to 50 m in the central parts of Koločep bay. The profiler was equipped with two electro-acoustic transducers, serving as both a transmitter and receiver. Obtained data were exported in SEG-Y format, which included the georeferenced reflectance of the acoustic pulse in accordance with the depth from the sea surface. The seismic interpretation was carried out using the GeoSuite AllWorks software (version 2.6.7., Geo Marine Survey System, Rotterdam, the Netherlands). Travel time to depth conversion was made by software with a velocity of 1.500 m/s. Twelve selected profiles are elaborated on and presented in this paper (Figure 1). High-resolution multibeam sonar (MBS, Teledyne RESON model SeaBat T20-P) with surface positioning performed by a differential global positioning system (DGPS) using real-time kinematics (RTK) was used for a survey that targeted the submarine spring zones and seafloor uplifted area (determined during the SBP survey). The MBS survey was performed in cooperation with Geomar d.o.o. (Split, Croatia).

3.2. Sediment Coring

The sediment coring sites were chosen based on the interpretation of SBP data with the intention to penetrate deeper in the subsurface and the erosional surface between them. The core KK-1 (17°50′4,910′’ E; 42°46′0,581′’ N) was extracted from a seafloor depth of 55 m in September 2016. The coring was performed from a coring platform (Croatian Geological Survey “Q2” coring platform, 3 × 4 m) assembled with a tripod tower, winches, and a “Niederreiter 60” (UWITEC, Austria) piston corer. The total length of the sediment core was 470 cm long. The core was stored in a cooling chamber at 4 °C until splitting.

3.3. Sediment Core Analysis

The working half was photo-documented and described then covered with a thin transparent plastic foil and prepared for further analysis. We used non-destructive methods, such as magnetic susceptibility measurements and XRF core scanning. The analysis of the core included radiocarbon dating on datable samples, smear slide inspection, micropaleontological analysis (foraminifera), qualitative analysis of the mineral composition, total nitrogen and organic and inorganic carbon analysis, and grain-size analysis.
Magnetic susceptibility (MS) was measured at a 1 cm resolution with a Bartington MS2E handheld device with the accompanying Multisus program. The analysis of the geochemical composition of sediment core KK-1 was performed at the Institute of Marine Science (CNR-ISMAR) in Bologna using an Avaatech XRF Core Scanner. The scanner was equipped with a Rhodium (Rh) X-ray tube and the core was analyzed at intervals of 1 cm, recorded twice under a 10 and 30 kV tube voltage and a current of 400 mA.
Radiocarbon dating was performed on two handpicked samples containing 10 to 15 mg of shells. Samples from sediment core were dated by accelerator mass spectrometry (AMS) and analyzed at the BETA Analytic Radiocarbon Dating Laboratory, Miami, USA. The 14C ages of marine samples were calibrated using the MARINE 13 calibration curve and DeltaR value 61 +/−30 [57].
Qualitative analysis of the total mineral composition of non-oriented powder samples was determined by X-ray powder diffraction (XRD) with a PANalytical X’Pert Powder X-ray diffractometer (Ni-filter CuKα radiation) using the X’Pert Quantify software package. Mineral phases were identified using HighScore X’Pert Plus and the ICDD (International Centre for Diffraction Data) database (PDF-4/Minerals). The ground sediments were back-loaded and were run using a spinner stage with the following parameters: 4–66° 2θ, 0.02° step size, 45 kV, 40 mA, 0.04 rad Soller slits, 10 mm mask, ¼ incident divergence slit, and anti-scatter slits. For the selected bulk sediments, oriented mounts were prepared on glass slides to characterize clay minerals [58]. Due to the similar mineral composition in all the sediments, nine samples throughout the core were chosen for oriented XRD measurements. One sample of flysch deposits from the catchment area near the village Slano was taken for clay mineral identification. After the removal of carbonates using a buffered sodium acetate solution, the clay-sized sediment suspensions were centrifuged and transferred to the glass slides and left to settle with the preferred orientation. The samples were air-dried, treated with ethylene glycol, and heated at 400 °C and 550 °C. Subsequently, XRD measurements were taken after each treatment in the range of 4–30° 2θ.
Direct measurements of the total carbon (TC) and nitrogen (N) were performed on a CN Thermo Fisher Scientific Flash 2000 NC Analyzer, and the associated program Eager Xperience. The cores were sampled at intervals of 10 cm. The samples were first frozen in a deep freezer and then dried in SP Scientific VirTis BenchTop Pro lyophilizer. Approximately 1–2 g of dry sample was taken from each interval, which was then finely ground. The CN analyzer works on the principle of burning the sample at high temperatures of 900 °C and 680 °C in small tin containers. Each sample was treated with hydrochloric acid (1 g sample + 8 mL 4.2 M HCl) according to the methodology proposed by [59]. The difference between TC and TOC was used for the calculation of total inorganic carbon TIC as a measure of carbonate contents. C/N ratio was calculated by dividing TOC and TN measurements.
Measurements of the grain-size distribution in sediment core KK-1 were performed on a Shimadzu Laser Diffraction Particle Size Analyzer SALD-2300 with a measurement range between 17 nm and 2500 µm. Selected samples were treated with 30% hydrogen peroxide (H2O2) in order to remove organic matter, and sodium hexametaphospate ((NaPO3)6) was added to the samples to prevent particle aggregation. The samples were rinsed in distilled water and sonicated prior to measurements. The mean value of the three selected measurements was calculated in the software package GRADISTAT [60]. The data were processed using the Wing SALD II PC software.

3.4. Legacy Seismic Reflection Profiles of Koločep Bay

Legacy seismic reflection data for the Croatian part of the Adriatic Sea are available for scientific research from the Croatian Hydrocarbon Agency (AZU) database/catalog. Offshore 2D seismic reflection surveys in the Croatian part of the Adriatic Sea started in the northern Adriatic in 1968; today, more than 80,000 km of seismic reflection profiles are archived in the AZU database. The Koločep bay basin was surveyed only along two seismic reflection lines: the first line (AZU catalog number CRO-R-2D14-M-KPSTM-F M-34-88, renamed L1 for ease of use) passes between the islands Olipa and Jakljan (the lowest sill of the basin at −50 m depth) from the South Adriatic Pit into the western part of the Koločep bay basin, and the second traces the NW–SE axis of the Koločep bay basin (AZU catalog number CRO-R-2D14-M-KPSTM-F-M17-88, renamed L2 for ease of use). The bay profiles were acquired by the Croatian national oil company INA in 1988 and were reprocessed by Spectrum Geo (TGS at present) in 2013/2014 for the Croatian government in order to attract investors for potential new hydrocarbon plays. The analysis of the seismic reflection profiles was carried out using IHS Kingdom 2d/3dPak software. To allow a better interpretation of the basin, the SBP survey also traced the L1 and L2 seismic reflection lines (SBP profile T9 and SBP profiles T8, T16 and T17, respectively).

3.5. Legacy Bathymetric Maps

Two published bathymetric map sheets on a scale of 1:25,000 [61,62], produced by the Croatian Hydrographic Institute, were digitized and used to determine the general features of the seafloor in combination with the new SBP data. The maps contain data (contours) on grain size distribution based on the Wentworth 1922 grain size classification, so it is possible to have general insight into the distribution of the sand deposits. The accuracy of the grain size map based on the SBP survey proved to be acceptable at the scale of 1:25,000.

3.6. Statistical Analyses of Geochemical Data

Geochemical data are classical examples of compositional data [63] where information is stored in the ratios between components rather than in their absolute values. This fact requires careful statistical treatment since all problems including compositional data are multivariate in nature, but as stated in [64], this is a problem in conventional approaches. The solution to this is the log-ratio transformation of the data presented by [63], where the author introduces additive log ratio (alr) transformation and centered log ratio (clr) transformation. The latter is used here, and the clr is defined as:
clr ( x ) = [ l n x 1 g m ( x ) ,   l n x 2 g m ( x ) , , l n x D g m ( x ) ] ,
where gm(x) is the geometric mean of the components in x. The clr is an isometry which is frequently convenient for computational issues [65]. The compositional biplot introduced by [66] is based on clr transformation. Clr-transformed variables should not be mistaken for raw variables since they are all connected through gm(x); thus, the interpretation of a compositional biplot differs from that of classical principal component analyses (PCA).
Generally, much more attention is paid to the links between rays than the rays (PCA loadings). Although, rays do possess some interpretability. The center of the biplot represents the mean data set. The ray length is a measure of the variability of the clr components. The length of the link is a measure of the variability of the log-ratio of the two parts involved. Angles between links provide information about the correlation of the two simple log ratios [65]. Through analyses of compositional biplot relations between elements, element groups can be obtained [67]; however, it is important to analyze each lithological unit separately. This is important since different geochemical conditions in different groups will result in the between group variation of the data, while in each separate group, variation will be the consequence of geochemical conditions and not the differences between groups. However, if we want to compare groups to see, for example, where detrital conditions are most pronounced, then the whole data set must be included.

4. Results

Submarine features that were determined from seafloor studies of the bay are a result of a combination of morphological, seismostratigraphic, and sedimentological analyses. The presented SBP profiles were grouped to represent the main features of the basin through the seismostratigraphy of the basin in general (SBP profiles T5, T7, T10), the paleochannels indicating the existence of a Late Glacial river (approx. 19–11.7 ky BP) and/or paleo-sinkhole/ponor (SBP profiles T1, T2, T3, T4 and T6) and Quaternary tectonic activity (SBP profiles T5, T7, T8, T9, T10, T16 and T17), and seismic reflection profiles L1 and L2. The results of core the analysis give a timeframe and the environmental characteristics of the Holocene marine sediments.

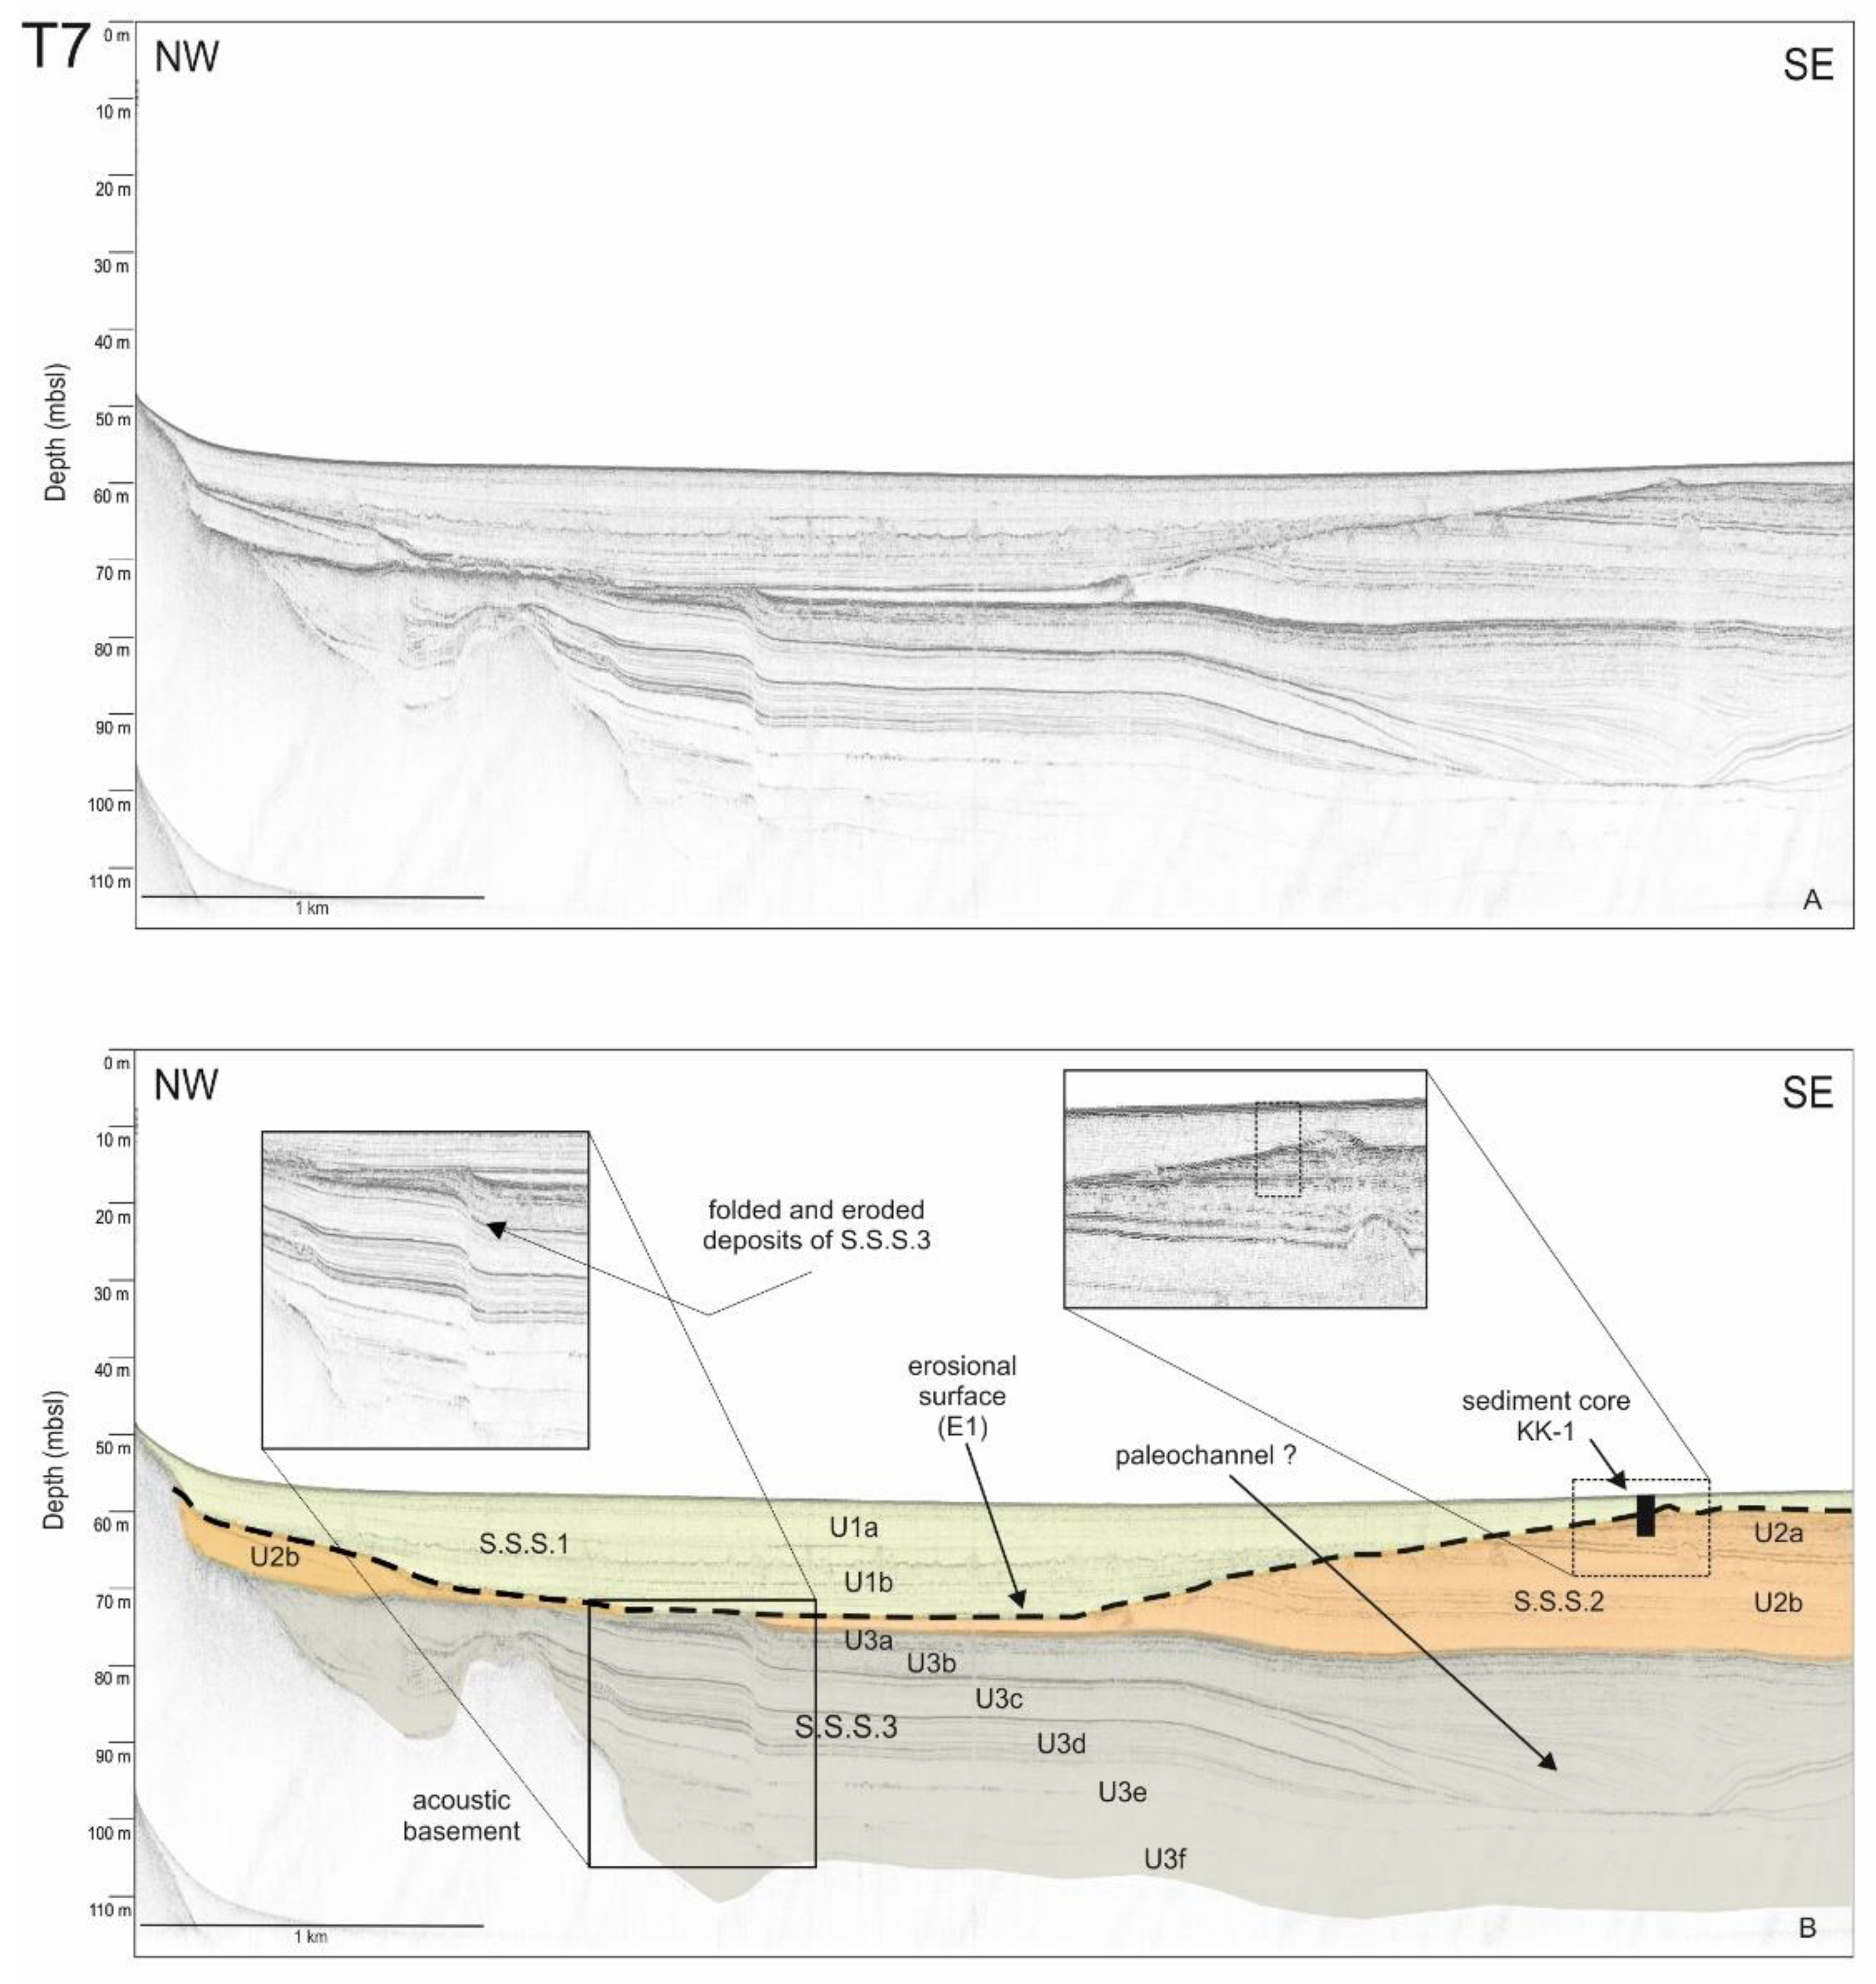
4.1. Mapping Quaternary Submarine Deposits of the Submerged Koločep Karst Basin

The sub-bottom profiler data allowed the identification of the topmost 50 m of the preserved sediment sequence in the bay. We distinguished three major seismostratigraphic sequences—S.S.S.1, S.S.S.2., and S.S.S.3 (from top to bottom, respectively)—separated by well-defined high-amplitude unconformable reflector E1. The sequences were divided into units U1, U2 and U3, which could be traced on all acquired profiles (Figure 4, Figure 5 and Figure 6). The profiles displayed an alternation of semi-transparent seismic facies with moderate–low amplitudes and high-amplitude parallel-bedded and well-stratified seismic facies. The changes in the acoustic character of the seismostratigraphic units imply variation in the lithological and, hence, environmental characteristics of the deposited sediments.
The most recent seismostratigraphic sequence (S.S.S.1) consists of two plane-parallel undisturbed units (U1a and U1b). A wavy low-amplitude reflector separates U1a and U1b. Within U1b, we observed several low-amplitude sub-parallel reflectors. The bottom of S.S.S.1. was bounded by an unconforming E1 erosional surface, which truncated the underlying reflectors. The top of S.S.S.1 reached 65 m b.s.l. (Figure 7) in the center of the bay, with a maximum thickness of 24 m (Figure 8b).
The middle seismostratigraphic sequence (S.S.S.2) also consisted of two units with a sub-parallel reflection configuration (U2a and U2b). U2a was composed of medium-amplitude sub-parallel reflectors and a locally chaotic reflection configuration on top of it, whereas U2b was composed of low-amplitude sub-parallel reflectors of limited lateral continuity. The maximum thickness of the sequence was 22.32 m (Figure 8c). According to their acoustic characteristics, the horizons were sedimentologically different and thus represented different geological environments. S.S.S.2 was eroded at the central and southern part of the bay, and it could only be traced along the margins of the bay. The upper boundary of S.S.S.2 in the bay was at 75 m b.s.l. (Figure 8a).
The lower seismostratigraphic sequence (S.S.S.3) consisted of six sub-parallel, locally folded units (U3a–U3f). According to their acoustic characteristics, the units were deposited alternately, implying changes between similar environments. The horizons could be traced all over the bay. The lowest unit (U3f) represents the acoustic basement of S.S.S.3, whose depth could not be defined due to the penetrative ability of the sub-bottom profiler. Locally, the acoustic basement reached the seafloor surface, forming an underwater island on which some deposited horizons onlapped. We distinguished distinct U-shaped paleochannels within S.S.S.3./U3a and U3b, which incised into previously deposited sediments in the central part of the bay (Figure 4 and Figure 5). In addition, in some areas in the central part, folded units U3a and U3b were eroded (Figure 5 and Figure 6). The maximum observed depth of S.S.S.3 in the bay was 116 m b.s.l. (penetrative ability).

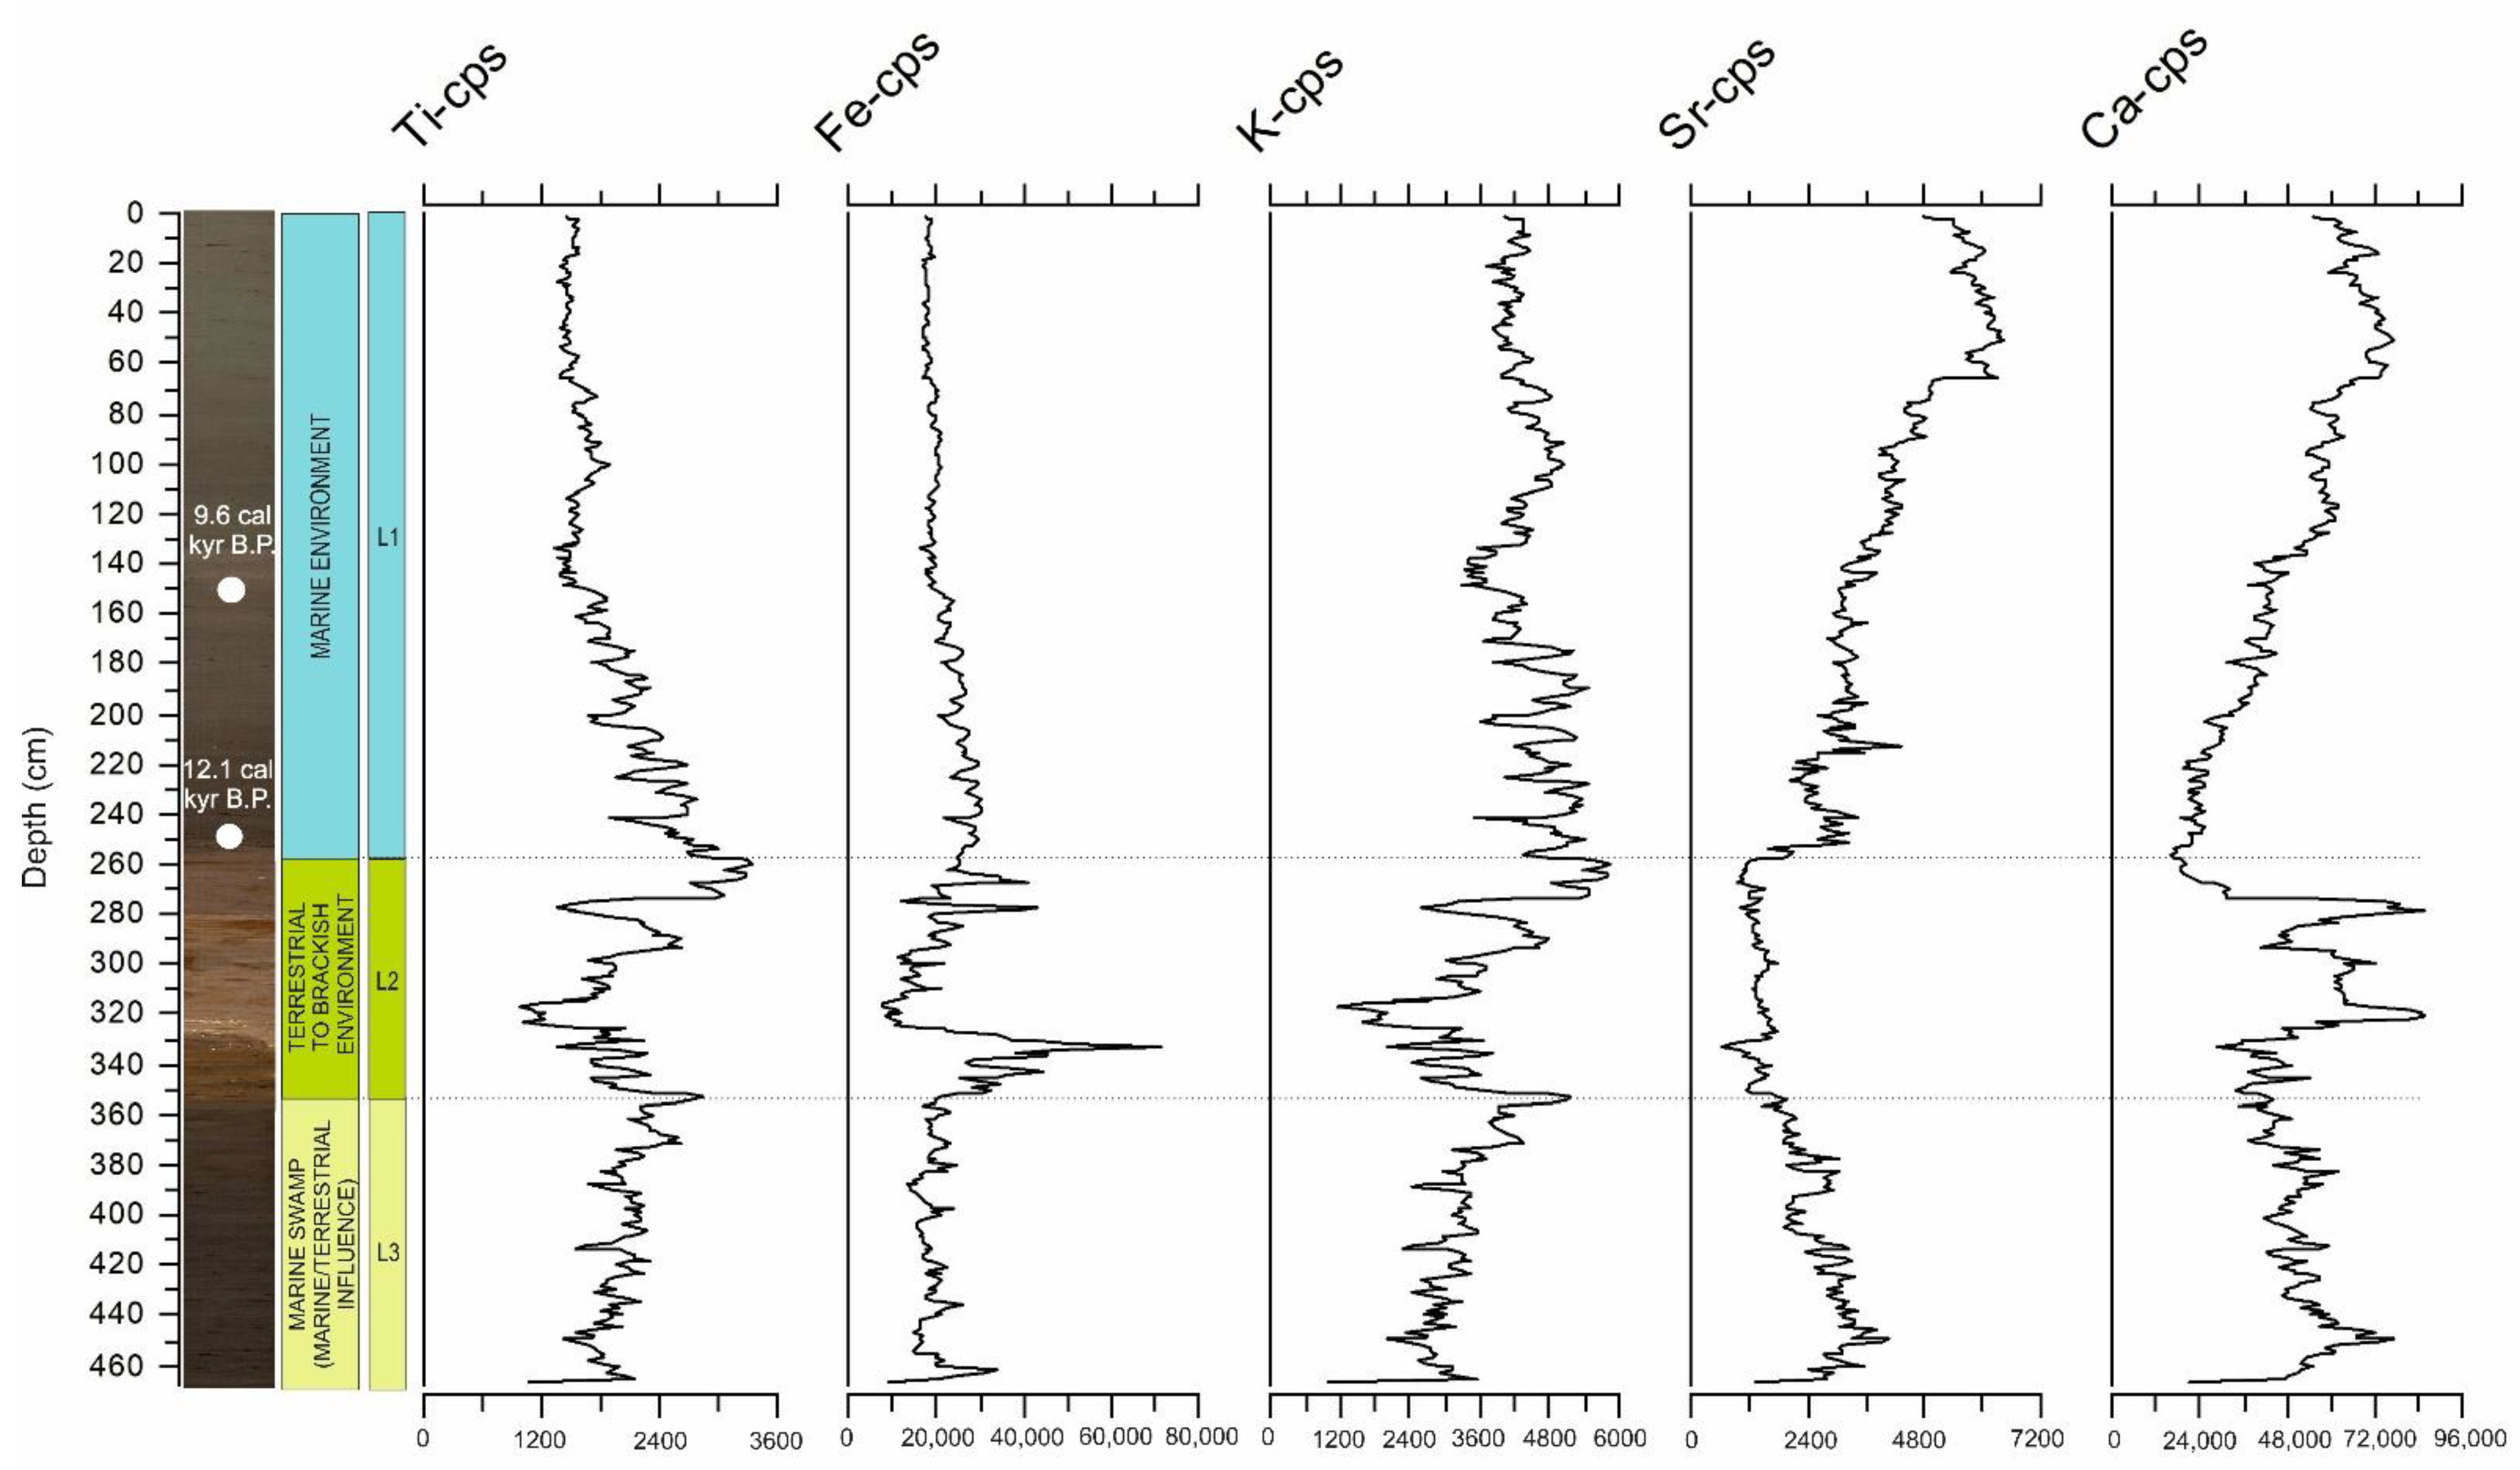
4.2. Sediment Core Lithology and Multi-Proxy Analysis

Sediment core KK-1 (Table 1) and all obtained analyses are shown in Figure 9, Figure 10 and Figure 11. Sediment core KK-1 is divided into three lithological units (L1, L2 and L3) (from top to bottom, respectively) based on lithology, as well as geochemical and micropaleontological composition. The topmost interval from 0 to 2.60 m (L1) was composed of silty clay homogenous dark-grey sediment, with lower values of magnetic susceptibility at the upper part of the unit, while the values in the lower part increased. XRF analysis showed an increase in Sr/Ca and Si/Ca, while other ratios such as Zr/Ti, Zr/Rb and Ca/Fe were lower, and Ti/Sr value decreased. On the graph of Zr/Ti, we can observe a small peak at the depth of 1.30 m (Figure 9). The lower values of Ti and Fe can be observed (Figure 10). This unit is characterized by the high variability of the C/N and TOC ratio (Figure 11). The TIC values slightly decreased from the top to the lower part of the lithological unit. Due to the lack of 14C datable materials, the age of the section remains unsolved. The age of unit L1 is based on two radiometric dates. The youngest age is 9669 Cal BP at a depth of 1.57 m and the oldest is 12,170 Cal BP at a depth of 2.52 m (Table 1, Figure 9). Mineralogical analysis showed the presence of quartz, calcite, Mg–calcite, halite, dolomite, aragonite, feldspar, muscovite/illite, and clay minerals (smectite, chlorite, illite, and kaolinite). At the bottom of the unit, gypsum appeared as a secondary mineral phase due to the oxidation of pyrite and reaction with calcite. The presumed hiatus between units S.S.S.1 and S.S.S.2, recognized by sharp uneven contact between light and dark sediments, could possibly be corelated with the erosional surface in the SBP data (Figure 5B and Figure 6B).
The interval of unit L2 included a section of sediment core from 2.60 to 3.50 m and was a light-brown silty clay sediment that was very compact (Figure 9, Figure 10 and Figure 11). Magnetic susceptibility continued with low values, followed by significantly increased ratios of Ca/Fe, Zr/Ti and Zr/Rb, and an abrupt decrease in Sr/Ca and Si/Ca ratios (Figure 9). Ti/Sr showed high variability within this interval. The ratio of Ti and Fe rose sharply where the ratio of K and Sr was low (Figure 10). The values of C/N slightly decreased, and opposite to that, the TIC values rapidly increased, while the TOC values were extremely low (Figure 11). In the unit, the dominant minerals were quartz, calcite, and dolomite, and of the clay minerals, only smectite, illite, and kaolinite were present.
The lowermost core unit (L3) from 3.50 to 4.70 m was represented with homogenous dark-grey sediment with generally low values of magnetic susceptibility. The exception was the peak at 4.50 m, with the highest magnetic susceptibility within the sediment core (Figure 9). The Ca/Fe, Zr/Ti, Si/Ca and Zr/Rb ratios decreased, whereas the Ti/Sr ratio only slightly decreased (Figure 9). A gradual increase in Sr/Ca towards the base of the core was also observed. Ti and Fe were slightly lower again, while K and Sr returned to a higher ratio (Figure 10). TOC values increased all the way to the end of the sediment core (Figure 11). In this unit, an increase in the sand-sized particles could be observed at 3.90 m of the core (Figure 11). The mineral composition was the same as in unit L1. Smear slide examination revealed various calcareous remains or shells of various benthic organisms (foraminifera, gastropods, and bivalves) present in the L1 unit which were not found in the deeper units. The smear samples analysis with the high Zr/Ti ratio within the L1 unit above the dated section at the 9.6 cal kyr BP contained glass shards that could belong to one of Vesuvius Plinian eruptions of Mercato, with a modelled age of 8.59–0.23 cal kyr BP present in Veliko Jezero on the nearby Mljet Island [23].

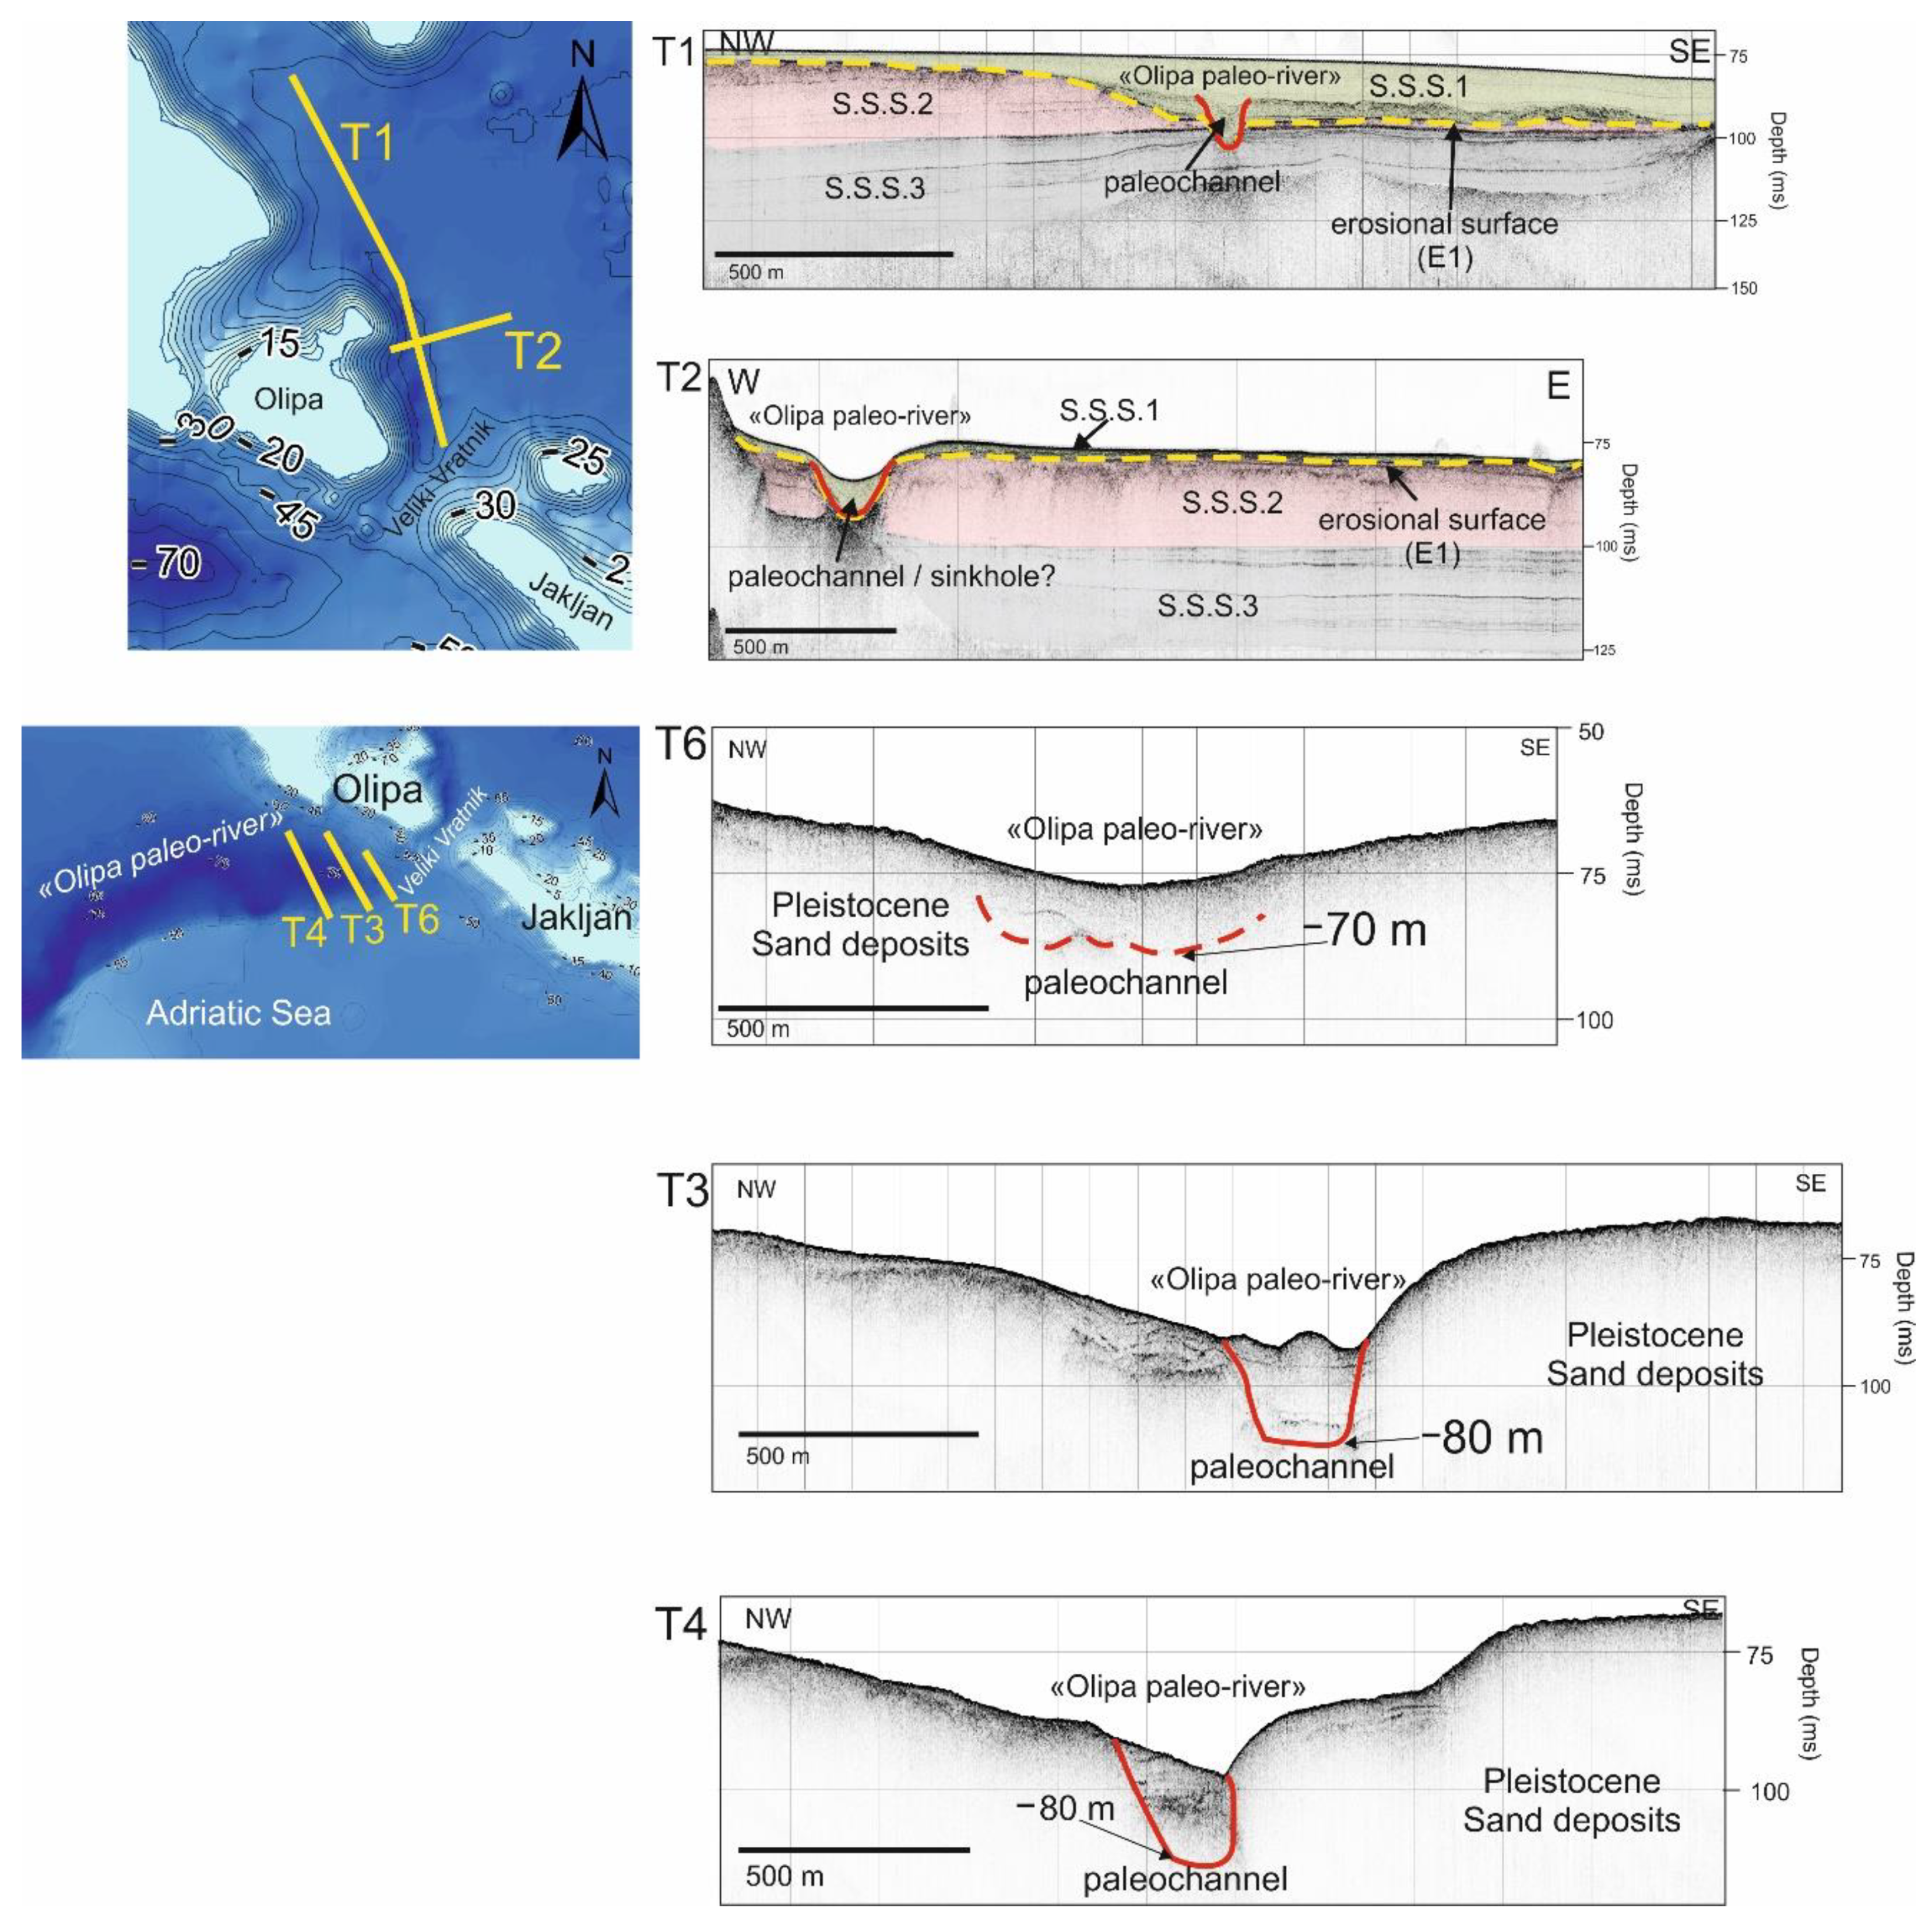
4.3. The Pleistocene “Paleo-River”

The interpreted seismic profile indicated the existence of a U-shape channel (Figure 12 and Figure 13). The U-shape channel was well-observed on seismic tracklines T1, T2, T6, T3 and T4, and was filled with recent sediment deposits. The river incised in the unit S.S.S.3., and on T3 and T4 was 81 m b.s.l. On profile T2, which was inside the bay, the channel still had a U-shape, while the profile of the T1 surface was flattened (Figure 12). The U-shape channel observed on profile T2 represents the deepest part of Koločep bay at 65 m b.s.l. All seismostratigraphic sequences and their units were easily recognizable. Figure 12 shows tracklines T6, T3 and T4 with the canyon of the paleo-river outside of Koločep bay. The surface deposits of sand did not allow the penetration of the acoustic signal deeper into the sediment (Figure 7). Because of that, we cannot discern units beneath the sand. Going from east to west following the paleo-river, the U-shape was more pronounced where the deepest part of the paleo-river canyon outside of Koločep bay was at 85 m b.s.l. Profile T9 (Figure 13) was perpendicular to the sill, and on the SW part sand deposits also blocked the penetration of the acoustic signal deeper into the sediment, while on the NE part, we could clearly observe all seismostratigraphic sequences—S.S.S.1, S.S.S.2. and S.S.S.3—with the erosional surface.

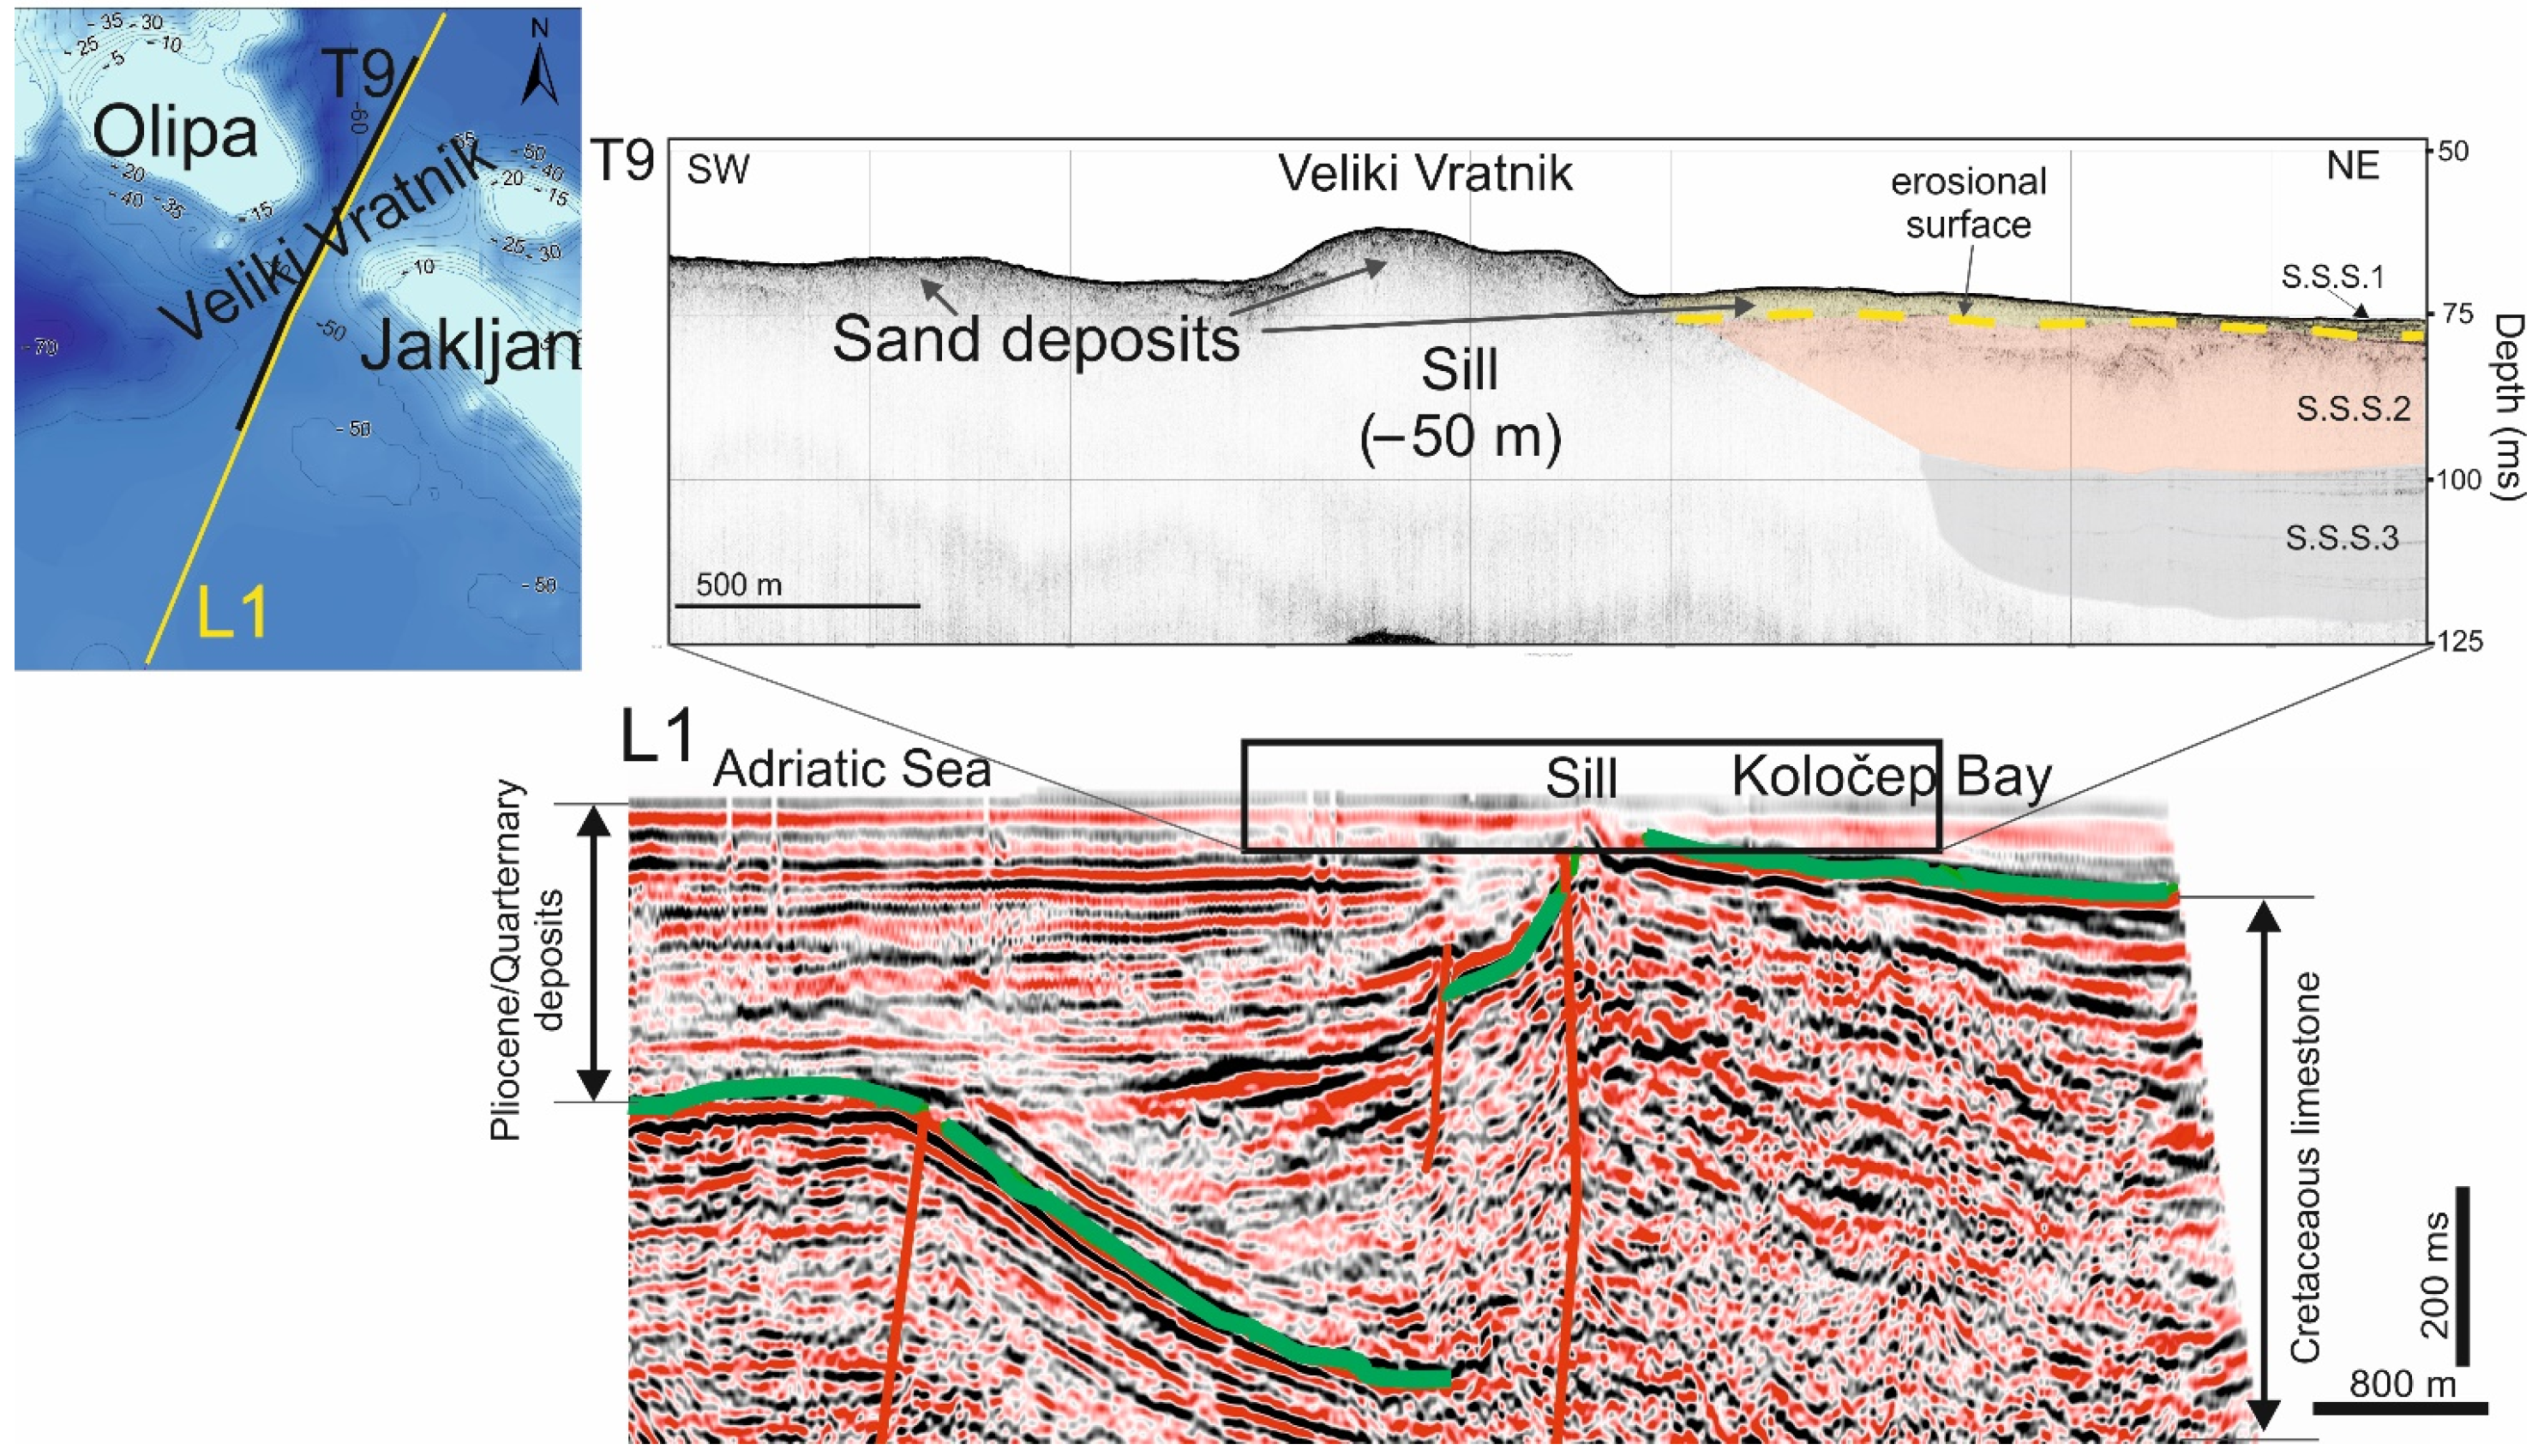
4.4. Evidence of Active Quaternary Submarine Tectonics

Evidence of active Quaternary tectonics is shown in Figure 13, Figure 14 and Figure 15, which correlate 2D seismic data with high-resolution seismic profiles. On profile L1 (Figure 13), a reverse fault was clearly evident, and it was reflected in the broken reflexes that corresponded to the Mesozoic age. The fault was sub-vertical and cut the entire Cretaceous limestone deposit; due to the resolution of the 2D seismic profile and the blanking of the SBP acoustic signals by sand deposits, it was not possible to determine whether the fault(s) reached the seafloor. In the hanging wall of this fault, an anticline was formed which affected the overlying deposits. This influence was clearly observed in the Quaternary deposits, and it represented the sill of about 4 m, which was situated on the edge of Koločep bay. In the SW direction, younger deposits were undisturbed and showed their primary, subhorizontal orientation. Deposits overlying the footwall were thicker compared to the same deposits overlying the hanging wall. On profile L2 (Figure 14), we can observe several normal faults, but they did not have a significant influence on the younger deposits. The fault located in the middle of profile L2 was probably an active feature because it folded the entire sedimentary sequence above. In Figure 14, which shows the high-resolution seismic profile of T17, at the seafloor we can observe about 1.5 m of an uplifted block of Pliocene/Quaternary deposits. The uplift ratio was measured at about 10 m. On this profile, faults also cut only Mesozoic deposits, but deposits at the left and right side of the uplifted block were slightly folded, and they showed a spatially variable thickness, which was probably due to indented paleorelief (profile T8, T16 and T17 in Figure 14). The erosional scarp located between Šipan Island and the mainland (Figure 14), and also clearly seen in the MBS bathymetry (Figure 15), corresponds to the morphologic manifestation due to continuous tectonic activity (uplift) during the Pleistocene and Holocene of the eastern part of Koločep bay.

5. Discussion

Based on the geological interpretation of high-resolution seismic profiles, we determined three seismostratigraphic sequences and identified the existing sill at 50 m b.s.l. in the channel of Veliki Vratnik between the islands Olipa and Jakljan, where the sill had a major influence on the sedimentation regime within the bay. This sill lies along a reverse fault [25,52] elongated in the NW–SE direction along the southern sides of the Olipa and Jakljan islands. The maximum slip rate in this area was 1.0–1.5 mm/yr [45]. Considering active tectonic and tectonic uplift in this area [45,68] combined with the global mean sea-level curve during the Late Quaternary (Figure 16) [1,2,3,4,69], a paleolandscape reconstruction of the Koločep bay karst basin is discussed.

5.1. Paleoenvironmental Reconstruction Based on Core Data

To interpret seismic data, we had to determine the age and depositional environments of the preserved sediment sequence. Based on lithology and conducted analysis, the sediment core was divided into three lithological units, L1, L2 and L3, indicating changes in the depositional environment. Geochemical interpretation was based on the compositional approach [23,65] using the center log-ratio transformation (clr) of geochemical data. In this way, the multivariate nature of the geochemical data was fully acknowledged, which ensured more precise interpretation. First, to discriminate between lithological units, a clr biplot was made for the entire data set (Figure 17). The interpretation of the clr biplot is explained well in [65]. In this way, the affiliation of elements to a certain environment was deciphered; furthermore, variance between clr-transformed variables (elements) was indicative of some geochemical conditions in the depositional system.
Based on the geochemical data and the interpretation of the clr biplot (Figure 17), discrimination between lithological unit (L1, L2, L3) is clearly visible. Principal component PC1, which explains ~53% of the data variation, had positive loadings with the clr-transformed elements (Sr, Br) which were indicative for marine environments, while negative loadings were associated with terrestrial elements (Ti, Rb, Al, Zr, K). Based on these observations, lithological units were divided between marine environments (L1) and probable marine swamps (L2, L3) with variable marine/terrestrial influence.
To unravel geochemical processes, each lithological unit should be studied separately; thus, variance between clr-transformed variables is a consequence of geochemical behavior rather than a consequence of between group variation [23]. In this case, description will start from the bottom of the core with the unit L3, so that changes can be chronologically tracked. The oldest studied sediment was a dark, silty material. Dark color is a consequence of a fairly rich TOC content. The preservation of organic carbon was probably enhanced because of the low oxygen content in the sedimentation basin during the formation of the L3 unit. This can be concluded from the low variance between clr–Fe and clr–Mn and the large variance between those elements and elements which are associated with detrital influence (Ti, Zr, Rb, K, Al). Since Fe and Mn are redox controlled in such a way that they are mobile in low-oxygen environments [70], their geochemical behavior differs from normal detrital elements which are not affected by changing redox conditions. Furthermore, the L3 unit started with lower detrital influence, which slightly increased during sedimentation. At the end of the L3 unit and the beginning of the L2 unit, terrestrial influence slightly decreased, probably as a consequence of the deepening of the marine swamp/lake. In this unit, clr–Fe was more associated with “normal” detrital elements, indicating that no Fe remobilization occurred. Higher oxygen content is indirectly supported with low TOC as well. The end of the unit was characterized with increasing detrital influence which continued into the L1 unit as well. This could be the consequence of threshold erosion into the lake just before and after sea transgression. The topmost unit (L1) comprised homogenous marine sediment where detrital influence gradually decreased as a consequence of sea level rise, which directly moved the shoreline from the coring site.
The units L2 and L3 corresponded to S.S.S.2, while L1 corresponded to S.S.S.1.The lowermost unit L3 was characterized with relatively high TOC content compared to the L2 and L1 units (over 1.1%), and TIC content was also relatively high with values ranging between 3 and 4%.
The uppermost and youngest unit L1 corresponded to S.S.S.1. We describe it as a marine environment. This is supported by higher Sr/Ca and C/N ratios and relatively low values of the Ca/Fe ratio. The values of Sr/Ca were extremely high at the bottom of the L1 unit, so we can say that this is the visible marine influence of the sea rising and gradually establishing marine conditions in the entire bay. The occurrence of volcanic glass shards resulted in the Zr/Ti peak at the depth of 1.30 m (Figure 9). Volcanic glass morphology, together with C14 dating, suggests that Mercato eruption, dated at ~8.5 cal ka BP [23], is a most probable correlative for the found cryptotephra, but this needs to be confirmed with glass geochemistry.

5.2. Paleoenvironmental Reconstruction Considering Sea-Level Fluctuation and the Interpretation of Seismostratigraphic Sequences

The individual acoustic units that we divided from the three seismostratigraphic sequences (S.S.S.1., S.S.S.2. and S.S.S.3.) are interpreted as marine, lacustrine and terrestrial to brackish environments that can be correlated with sediment core data. This is due to the existence of a sill at (today) 50 m b.s.l. that allowed the formation of an isolation basin in Koločep bay which, at lowstands, would be a karst polje with intermittent lakes, while marine ingression would lead to marine sedimentation. This would be similar to the paleoenvironments of the Lošinj channel in the northern Adriatic Sea during the Pleistocene and Holocene [71]. Units U1a, U3c and U3e have been interpreted as marine environments. Two lacustrine environments are interpreted within units U1b and U3d, while the terrestrial to brackish environments are units U2a and U3a. Unit U3b is defined as the transitional environment at the transition between the older marine environment U3c and the younger terrestrial environment U3a. Due to a poor acoustic signal, the lowermost unit U3f could not be defined as those above. Beneath all deposits, in lateral parts of the basin, Cretaceous bedrock, which represents the acoustic basement, was also identified. The L2 seismic reflection profile indicates that, in the central part of Koločep bay basin, the top of Cretaceous bedrock is covered with more than 120 m of younger post-Messinian sediments.
The lower and oldest seismostratigraphic sequences (S.S.S.3.) consisted of parallel, locally faulted, folded, and eroded units. According to their acoustic characteristics, the units were deposited alternately, implying analogous changes between terrestrial and lacustrine environments (sea levels below 50 m b.s.l.) and marine environments (sea level at above 50 m b.s.l.), which we could effectively trace all over the bay. All units within the S.S.S.3. sequence were probably deposited before MIS 4. In the NW part of the bay, units of S.S.S.3. (Figure 5 and Figure 6) were folded and deformed, indicating intensive tectonic activity in the area [12,45] before the deposition of the two younger units. Using the 2D seismic reflection profile L1 (Figure 13) perpendicular to the strait of Veliki Vratnik and profile L2 (Figure 14) along the bay, we observed faults that implied tectonic activity older than S.S.S.3. In contrast to S.S.S.3., in younger S.S.S.1. and S.S.S.2., there was no indication of the same tectonic activity. Therefore, the obtained profiles suggest that intensive tectonic activity in the NW part of the bay which caused deformations during the Holocene. The SE part with an uplifted block observed on profile L2, together with the observations and area [71] related to the paleoseismicity of the whole eastern part of the bay and between Lopud Island and Dubrovnik, indicated tectonic activity even during the Late Holocene.
The middle seismostratigraphic sequence (S.S.S.2.) represents the deposition of terrestrial (U2b) and probably alternating terrestrial to brackish environments with marine terrestrial influence (U2a). The unit was also deposited before LGM. During the deposition of these environments, the sea level was below or near 50 m b.s.l. The sill at 50 m b.s.l. at Veliki Vratnik strait between the islands of Olipa and Jakljan led to the formation of a closed basin within the bay. There is also a possibility that the reverse fault NW–SE strike along the southern slopes of the Olipa and Jakljan islands observed on seismic profile L1 (Figure 13) could have been active at rates observed by [46,68]; we believe that even a slow uplift could affect the sill and isolate the bay from the rest of the area (Figure 18b). As a result of a combination of erosion and uplifting, deposits of S.S.S.2. were eroded in the southern part of the bay. An uplifted block of Pleistocene and Holocene deposits was observed at profile T17 (Figure 14), where we measured uplift up to 10 m. This area is connected to the 1996 Ston earthquake, where the mainshock and one of the aftershocks were detected (Figure 15) [14,50]. Based on the multibeam bathymetry data of the uplifted block (cross-sections 1, 2, 3 and 4 in Figure 15), the erosional scarp on the seafloor had a maximum height of 1.5 m. Based on analysis and the dating of lithophyllum rims, the author of [68] determined that there was an uplift of Lopud Island (Figure 19), which lies on the SE rim of the bay, of approx. 0.42 ± 0.10 m during the 1667 CE Dubrovnik earthquake, as well as an uplift 0.15 ± 0.10 m some 500 to 800 years earlier. Tidal notches above the present mean sea level also indicated an uplift of approximately 0.25 ± 0.15 m. The data on seismicity [14,50] and paleoseismicity [46,68] imply that these events could have contributed to the uplifted seafloor in Koločep bay between Šipan Island and the mainland. The lowest/oldest seismostratigraphic unit S.S.S.3 was most deformed and folded in the western part of the bay, but within the unit, erosional events such as the one between units S.S.S.1. and S.S.S.2. were not observed. The erosional events that led to the formation of a new (small) basin caused by the erosion of the older S.S.S.2 deposits were therefore unique for the youngest period of evolution of the bay. Such formation of new, smaller basins within older paleolake sediments in karst poljes occurred in Prološko blato in Imotsko polje (a karst polje in central Dalmatia) where, due to the formation of a sinkhole/ponor zone, part of the paleolake sediments were eroded, which led to the formation of a new 20 m deep lake [72]. The formation of the new basin by erosion (erosional surface E1) of the deposits of the S.S.S.2. unit in the NW part of the bay implies the transport of sediments from the bay either through a watercourse/river or through a ponor/sinkhole (a “sinking karst river”). The flow of the paleo-river (which we termed the “Olipa paleo-river”) downstream from the Pleistocene Elafiti “highlands” (Figure 20) through the Mljet channel during the LGM discharged into the Adriatic Sea and South Adriatic pit near the NW part of Mljet Island (the reconstruction of the Mljet channel is based solely on bathymetric data and unpublished reports from the Croatian Hydrographic Institute).
In the seismic profiles, we observed a strong reflector (E1) (Figure 4, Figure 5 and Figure 6) which we describe as an erosion event. Erosion started during lowstand when the sea level was 125 to 134 m b.s.l. [3,8]. This formed the boundary between S.S.S.1. and S.S.S.2. This surface had a major impact on the sediments of a significant part of S.S.S.2. and the uppermost units of sequence S.S.S.3. in the central part of the bay. Due to tectonic movements [12,45] during the deposition of S.S.S.3., the southern part of the basin was uplifted, and the maximum depth of the bay is now at the northern part, which can be observed on the bathymetry map along surface E1 (Figure 8a).
During the LGM lowstand, the sea level was 120–135m b.s.l. [2,3,7,69,73], and on the mainland, a cold and dry climate prevailed [4]. In that period, in the southwestern part outside of the bay, aeolian sand was deposited from the Albanian shelf by wind (Figure 21) [74,75,76]. A geomorphological barrier of hills—the Elafiti “highlands” (today the chain of the Elafite Islands)—prevented the eolian sand from being deposited, to a large extent, into the bay, and was mainly deposited on the Elafite “highlands” and the lowlands between Mljet Island and the Elafite Islands (highlands). Today, the sand deposits form a submerged plateau at 40 m b.s.l. (Figure 7). The thickness of the sand deposits within the bay on the northern side of the Olipa and Jakljan Islands (profile T9, Figure 13) is less than 3 m. Within the Pleistocene eolian plateau from the eastern coast of Olipa Island to Mljet Island and the western part of the bay, a paleochannel incision formed up to approx. −80 b.s.l. (Figure 12). The morphology of the bathymetry indicates the existence of the “Olipa” paleo-river (Figure 19). Within these channels, various amounts of marine sediments were deposited during the Holocene, resulting in the modern bathymetry (Figure 16) and the accumulation of up to 10 m of sediment in the paleochannels (Figure 12). We can observe the formation of the river channel going out from the center of the bay passing through Veliki Vratnik from the northern side and continuing along the eastern side of Mljet Island. The formation of the river was probably initiated during MIS 2 and terminated before the end of the Pleistocene when the sea level reached approx. 80 m b.s.l. and the sea intruded the paleochannel from the NW through the Mljet channel, which was flooded at the time.
After LGM, deglaciation led to a rapid rise in sea level. The significant period of rising was at 14.5–14.0 ka BP (“meltwater pulse” MWP-1A) during the warm Bølling–Allerød period [3,77]. In that period, within the bay, the deposition of the Ub1 unit started and probably represented a lacustrine environment. Numerous karst springs on the northeastern side of the bay in the Doli–Slano area (Figure 3a) discharged large quantities of fresh water and sediment from the Trebišnjica river and Popovo polje [56,78]. Today, these springs, located at different depths b.s.l., are manifested as submarine springs (Figure 3). The large amount of freshwater discharge is a consequence of the deglaciation of the ice cover in the eastern Dinaric mountains (also termed coastal Dinarides in glaciology [79]) of Bosnia (and Montenegro), which were repeatedly glaciated during the Quaternary [80,81] (Figure 18). The most intensively studied glacier in the region was on Orjen Mt in Montenegro. Orjen Mt had several generations of glaciers, with the oldest ice cap, which covered a total area of 165.4 km2 reaching down to 500 m above modern sea level during MIS 12. During MIS 6, glaciers covered a total area of 84.9 km2 [80]. A study [82] of Velež and Crvanj Mts glaciations (mountain ranges encircling Nevesinje polje, Figure 3a and Figure 21), which neighbor the recharge area of Koločep bay, gave the maximum extent of glaciers of approx. 28 km2 for Velež Mt and 24 km2 for Crvanj Mt. The maximum extent of the glaciers based on the dating of the lateral moraines gave dates 14.9 ± 1.1 kyr BP for Velež Mt and 11.9 ± 0.9 kyr BP for Crvanj Mt [82]. Compiled glaciation data [79] for the Balkan peninsula indicate that the maximum glaciation extent was up to approx. 17 kyr BP with a similar extent as during MIS 12 and MIS 6. Deglaciation is considered to have occurred from between approx. 17 kyr BP and 13 kyr BP [79]. The young dates given by [82] for Velež Mt and Crvanj Mt are considered to be an unusual record for the region by [79]. The large discharge of freshwater could be the cause of the erosion of the S.S.S.2 unit (erosional surface E1) and the formation of the smaller basin within these deposits. A late deglaciation of the eastern Dinaric mountains in the catchment of Koločep and associated discharges of fresh water through the karst system would have had little effect on the Koločep bay Pleistocene landscape, which had established marine sedimentation prior to 12.1 cal kyr BP based on the dated core KK-1 and would not form the E1 erosion surface. The Late Glacial landscape reconstruction of the wider area is shown in Figure 21.
The “Olipa paleo-river” has left a morphological trace in Koločep bay in the elongated depression on the NNE side of Olipa Island (Figure 18b and Figure 20a), which is also the maximum bathymetric low of the bay of –67 m b.s.l. On the opposite side of Olipa Island, at approx. –70 m b.s.l., a paleochannel takes shape within the eolian sand deposits and continues a deepening course towards Mljet Island and the Mljet channel (Figure 19). The paleochannel is filled with recent marine sediments, and the bottom of the paleochannel is at –75 to –80 m b.s.l. The blanked SBP signal due to the presence of sand deposits in the Veliki Vratnik strait between Olipa Island and Jakljan Island (the 50 m b.s.l. sill) forced us to consider two scenarios of “Olipa paleoriver” morphology. The first scenario included a ponor zone during lowstand on the NNE side of Olipa Island and a karst spring on its SE side (Figure 12), making the Olipa paleo-river a typical karst sinking river (Figure 18b and Figure 20a). When the sea level reached 70 m b.s.l., we believe that the area on the NNE side of Olipa Island during the highstands functioned as an estavelle (schematic in Figure 18b), which means that marine water had an easy inflow to the bay, leading to the formation of a brackish/marine lake in the bay. During the Late Glacial period and before the formation of the estavelle, most of the sediment of the S.S.S.2 was eroded, and the erosional surface E1 was formed. With the formation of the estavelle conditions, the deposition of S.S.S.1 sediment was initiated. This scenario presumes that the Veliki Vratnik sill (50 m b.s.l.) is an extension of Cretaceous limestone (bedrock) of the Olipa and Jakljan islands, covered with a thin layer of sand (Figure 13). The second possible scenario would imply that a paleochannel incised through the limestone bedrock of the Veliki Vratnik strait and the free flow of the Olipa paleo-river from Koločep bay (Figure 18a and Figure 20b), and its burial with sand carried and redeposited by the eastern Adriatic current (EAC, Figure 7) during the Holocene when the Koločep bay was flooded by the sea. The redeposited sand blanks the SBP signal in the strait, so until we survey the strait with a sparker SBP, the question of the nature of the sill and the nature of the paleo-river flow from Koločep bay to the Mljet channel and how it created the modern sill redeposited in the deepest part of the bay and the burial part of the paleochannel, creating the higher sill (Figure 18a and Figure 20b), will stay unresolved. The burial of the paleochannel in the Veliki Vratnik strait is possible due to the strong currents (EAC), which in this area reach maximum flow at the sea surface of 95 cm/s with bottom currents of about 40 cm/s. The general flow of most of the water column was directed towards WNW [83].

6. Conclusions

On the basis of the interpretation of legacy, marine and onshore geological information, seismic profiling, radiocarbon dating, and geochemical data enabled us to reconstruct paleoenvironmental changes in Koločep bay (SE Adriatic Sea, Croatia) during the Late Quaternary.
During glacial–interglacial cycles, the bay underwent alternating cycles of marine and terrestrial environments depending on sea-level variations. During lowstands, the bay represented a typical Dinaric karst polje connected with the hinterland catchment as the lowest of a series of cascading karst poljes mutually connected through karst ponors and springs (Figure 3). The upper sedimentary infill of the bay corresponds to the last glacial–interglacial cycle, containing Holocene marine sediments and post-LGM lake/terrestrial sediments and a major erosional event (E1), which was a Late Glacial freshwater discharge from numerous karst springs (today submarine springs) fed by melting ice in the Dinaric hinterland (in Bosnia and Herzegovina). The freshwater flooded the polje, creating an intermittent lake or water course which formed a paleo-river, which acted as a sinking river that submerged the SE side of Olipa Island and resurged as a karst spring on its southern side flowing through the Mljet channel to the Adriatic Sea northwest of Mljet Island. Another scenario is also possible based on the morphologies of the basin and the paleochannels: the notion that the river did not sink but had a paleochannel that was buried by sand redeposited by the eastern Adriatic current during the Holocene.
The problem of the morphology of the lowest sill (−50 m b.s.l.) connecting the sea with the bay stays unsolved, since the SBP did not penetrate the sand deposits. During periods of connection with the Adriatic Sea (sill at 50 m b.s.l.), the reconstructed sea level correlated well with the eustatic sea level since the dated core implied a marine environment prior to 12.1 cal kyr BP. Both the NE and SE parts of the basin have undergone seismotectonic processes leading to the deformation and folding of the older seismostratigraphic units. These processes in the NW part of the bay based on the morphology of the seismostratigraphic units ceased before the last glacial–interglacial cycle. In the southeastern part of the bay, the seismotectonic activity continued into the Holocene, causing a rupture on the seafloor in the shape of a 1.5 m high erosional scarp. For now, the rupture cannot be interpreted as a co-seismic event related to the 1667 Dubrovnik earthquake, although research indicates that some islands were uplifted by some 50 cm during the event [46]. Understating the dynamics and seismotectonics recorded in the first 50 m of Quaternary deposits in Koločep bay requires detailed studies alongside submarine structures.

Author Contributions

Conceptualization, D.Š. and S.M.; methodology, D.Š., N.I., D.B., I.R. and S.M.; software, D.Š. and O.H.; legacy seismic data interpretation T.D.; validation, D.Š., S.M. and D.B.; formal analysis, D.Š., S.M.; investigation, D.Š., S.M., O.H., G.P., M.G. and D.C.; resources, S.M.; writing—original draft preparation, D.Š. and S.M.; writing—review and editing, D.Š., S.M., D.B., I.R. and N.I.; visualization, D.Š. and S.M.; supervision, S.M.; project administration, S.M. and N.I.; funding acquisition, S.M. and N.I. All authors have read and agreed to the published version of the manuscript.

Funding

This work was funded by Croatian Science Foundation as part of the LoLADRIA project “Lost Lake Landscapes of the Eastern Adriatic Shelf” (LoLADRIA), grant agreement HRZZ-IP-2013-11-9419, and the QMAD project “Sediments between source and sink during a Late Quaternary eustatic cycle: The Krka River and the Mid Adriatic Deep System” grant agreement (IP-04-2019-8505 QMAD). Surveying was also funded through the EMODNet Geology project, grant number EASME/EMFF/2018/1.3.1.8/Lot1/SI2.811048.

Institutional Review Board Statement

Not applicable.

Data Availability Statement

The data that support the findings of this study are available on request from the corresponding LoLADRIA project leader, S.M.

Acknowledgments

The authors would like to thank Xenophon Dimas, George Ferentinos and Margarita Iatrou from the University of Patras for their support during the seismic survey and during the interpretation of the seismic data. The authors acknowledge the help of Hrvoje Burić from the Croatian Geological Survey during the coring campaign, as well as Ivan Gusić a student at that time and Martina Šparica Miko for her assistance in the lab. We also thank Stefano Miserocchi and Annamaria Correggiari from the Italian National Research Council for allowing the use XRF core scanner in Bologna. The Croatian Hydrocarbon Agency is acknowledged for making the legacy seismic profiles available. The authors also thank Marko Bakašun and his crew for assistance in the MBS survey. The authors would like to acknowledge the anonymous reviewers and editors for their valuable comments, which helped to improve the quality of this manuscript.

Conflicts of Interest

The authors declare no conflict of interest. The funders had no role in the design of the study; in the collection, analyses, or interpretation of data; in the writing of the manuscript, or in the decision to publish the results.

References

  1. Antonioli, F.; Anzidei, M.; Lambeck, K.; Auriemma, R.; Gaddi, D.; Furlani, S.; Orrù, P.; Solinas, E.; Gaspari, A.; Karinja, S.; et al. Sea-Level Change during the Holocene in Sardinia and in the Northeastern Adriatic (Central Mediterranean Sea) from Archaeological and Geomorphological Data. Quat. Sci. Rev. 2007, 26, 2463–2486. [Google Scholar] [CrossRef]
  2. Surić, M. Rekonstruiranje Promjena Morske Razine Na Istočnoj Obali Jadrana (Hrvatska)–Pregled, Reconstructing Sea-Level Changes on the Eastern Adriatic Sea (Croatia)–an Overview. Earth 2009, 14, 181–200. [Google Scholar]
  3. Lambeck, K.; Sambridge, M.; Rouby, H.; Purcell, A.; Sun, Y. Sea Level and Global Ice Volumes from the Last Glacial Maximum to the Holocene. Proc. Natl. Acad. Sci. USA 2014, 111, 15296–15303. [Google Scholar] [CrossRef] [Green Version]
  4. Benjamin, J.; Rovere, A.; Fontana, A.; Furlani, S.; Vacchi, M.; Inglis, R.H.; Galili, E.; Antonioli, F.; Sivan, D.; Miko, S.; et al. Late Quaternary Sea-Level Changes and Early Human Societies in the Central and Eastern Mediterranean Basin: An Interdisciplinary Review. Quat. Int. 2017, 449, 29–57. [Google Scholar] [CrossRef] [Green Version]
  5. Peltier, W.R.; Fairbanks, R.G. Global glacialice volume and Last Glacial Maximum duration from an extended Barbados sea level record. Quat. Sci. Rev. 2006, 25, 3322–3337. [Google Scholar] [CrossRef]
  6. Rovere, A.; Raymo, M.E.; Vacchi, M.; Lorschied, T.; Stocchi, P.; Gómez-Pujol, L.; Harris, D.L.; Casella, E.; O’Leary, M.J.; Hearty, P.J. The analysis of Last Interglacial (MIS 5e) relative sea-level indicators: Reconstructing sea-level in a warmer world. Earth Sci. Rev. 2016, 159, 404–427. [Google Scholar] [CrossRef] [Green Version]
  7. Lambeck, K.; Chappell, J. Sea Level Change through the Last Glacial Cycle. Science 2001, 292, 679–686. [Google Scholar] [CrossRef]
  8. Fairbanks, R.G. A 17,000-Year Glacio-Eustatic Sea Level Record: Influence of Glacial Melting Rates on the Younger Dryas Event and Deep-Ocean Circulation. Nature 1989, 342, 637–642. [Google Scholar] [CrossRef]
  9. Antonioli, F. Sea Level Change in Italy during Last 300 Ka. A Review. Biogeogr. J. Integr. Biogeogr. 2003, 24, 23–32. [Google Scholar] [CrossRef] [Green Version]
  10. Lambeck, K.; Antonioli, F.; Purcell, A.; Silenzi, S. Sea-Level Change along the Italian Coast for the Past 10,000 Yr. Quat. Sci. Rev. 2004, 23, 1567–1598. [Google Scholar] [CrossRef]
  11. Lambeck, K.; Purcell, A. Sea-Level Change in the Mediterranean Sea since the LGM: Model Predictions for Tectonically Stable Areas. Quat. Sci. Rev. 2005, 24, 1969–1988. [Google Scholar] [CrossRef]
  12. Anderson, H.; Jackson, J. Active Tectonics of the Adriatic Region. Geophys. J. R. Astron. Soc. 1987, 91, 937–983. [Google Scholar] [CrossRef]
  13. D’Agostino, N.; Avallone, A.; Cheloni, D.; D’Anastasio, E.; Mantenuto, S.; Selvaggi, G. Active Tectonics of the Adriatic Region from GPS and Earthquake Slip Vectors. J. Geophys. Res. Solid Earth 2008, 113, 1–19. [Google Scholar] [CrossRef]
  14. Govorčin, M.; Herak, M.; Matoš, B.; Pribičević, B.; Vlahović, I. Constraints on Complex Faulting during the 1996 Ston-Slano (Croatia) Earthquake Inferred from the DInSAR, Seismological, and Geological Observations. Remote Sens. 2020, 12, 1157. [Google Scholar] [CrossRef] [Green Version]
  15. Balascio, N.L.; Zhang, Z.; Bradley, R.S.; Perren, B.; Dahl, S.O.; Bakke, J. A Multi-Proxy Approach to Assessing Isolation Basin Stratigraphy from the Lofoten Islands, Norway. Quat. Res. 2011, 75, 288–300. [Google Scholar] [CrossRef] [Green Version]
  16. Long, A.J.; Woodroffe, S.A.; Roberts, D.H.; Dawson, S. Isolation Basins, Sea-Level Changes and the Holocene History of the Greenland Ice Sheet. Quat. Sci. Rev. 2011, 30, 3748–3768. [Google Scholar] [CrossRef] [Green Version]
  17. Benac, Č.; Juračić, M.; Blašković, I. Tidal Notches in Vinodol Channel and Bakar Bay, NE Adriatic Sea: Indicators of Recent Tectonics. Mar. Geol. 2008, 248, 151–160. [Google Scholar] [CrossRef]
  18. Vlahović, I.; Tišljar, J.; Velić, I.; Matičec, D. Evolution of the Adriatic Carbonate Platform: Palaeogeography, Main Events and Depositional Dynamics. Palaeogeogr. Palaeoclimatol. Palaeoecol. 2005, 220, 333–360. [Google Scholar] [CrossRef]
  19. Prtoljan, B.; Jamičić, D.; Cvetko Tešović, B.; Kratković, I.; Markulin, Ž. The Influence of Late Cretaceous Synsedimentary Deformation on the Cenozoic Structuration of the Middle Adriatic, Croatia. Geodin. Acta 2007, 20, 287–300. [Google Scholar] [CrossRef]
  20. Monroe, W.H. Glossary of Karst Terminology, 1st ed.; Geological Survey Water Supply Paper: Washington, DC, USA, 1970; p. 29. [Google Scholar] [CrossRef]
  21. Surić, M. Submarine karst of Croatia—Evidence of former lower sea levels. Acta Carsologica 2002, 31, 89–98. [Google Scholar] [CrossRef] [Green Version]
  22. Brunović, D.; Miko, S.; Hasan, O.; Papatheodorou, G.; Ilijanić, N.; Miserocchi, S.; Correggiari, A.; Geraga, M. Late Pleistocene and Holocene Paleoenvironmental Reconstruction of a Drowned Karst Isolation Basin (Lošinj Channel, NE Adriatic Sea). Palaeogeogr. Palaeoclimatol. Palaeoecol. 2020, 544, 109587. [Google Scholar] [CrossRef]
  23. Razum, I.; Miko, S.; Ilijanić, N.; Petrelli, M.; Röhl, U.; Hasan, O.; Giaccio, B. Holocene Tephra Record of Lake Veliko Jezero, Croatia: Implications for the Central Mediterranean Tephrostratigraphy and Sea Level Rise. Boreas 2020, 49, 653–673. [Google Scholar] [CrossRef]
  24. Dean, S.; Pappalardo, M.; Felja, I.; Juračić, M.; Boschaian, G. Karst landforms and prehistoric settlement patterns: A case study from Korčula Island (Croatia). Geogr. Fis. Dinam. Quat. 2020, 43, 31–43. [Google Scholar] [CrossRef]
  25. Kuk, V.; Prelogović, E.; Dragičević, I. Seismotectonically Active Zones in the Dinarides. Geol. Croat. 2000, 53, 295–303. [Google Scholar]
  26. Herak, M.; Herak, D.; Markušić, S. Revision of the Earthquake Catalogue and Seismicity of Croatia, 1908–1992. Terra Nov. 1996, 8, 86–94. [Google Scholar] [CrossRef]
  27. Navetić, L.J.; Petrović, V. Basic Geological Map of Trebinje M 1:100,000 K 34–37; Institute for Geological Survey: Sarajevo, Bosnia and Herzegovina; Federal Geological Survey: Beograd, Yugoslavia, 1964–1965.
  28. Raić, V.; Papeš, J.; Ahac, A.; Korolija, B.; Grimani, I.; Marinčić, S. Basic Geological Map of Ston M 1:100,000 K 33–48; Institute for Geological Survey: Sarajevo, Bosnia and Herzegovina; Federal Geological Survey: Zagreb, Yugoslavia, 1967–1968.
  29. Çaǧatay, M.N.; Eriş, K.; Ryan, W.B.F.; Sancar, Ü.; Polonia, A.; Akçer, S.; Biltekin, D.; Gasperini, L.; Görür, N.; Lericolais, G.; et al. Late Pleistocene-Holocene Evolution of the Northern Shelf of the Sea of Marmara. Mar. Geol. 2009, 265, 87–100. [Google Scholar] [CrossRef]
  30. Gràcia, E.; Bartolome, R.; Lo Iacono, C.; Moreno, X.; Stich, D.; Martínez-Diaz, J.J.; Bozzano, G.; Martínez-Loriente, S.; Perea, H.; Diez, S.; et al. Acoustic and Seismic Imaging of the Adra Fault (NE Alboran Sea): In Search of the Source of the 1910 Adra Earthquake. Nat. Hazards Earth Syst. Sci. 2012, 12, 3255–3267. [Google Scholar] [CrossRef] [Green Version]
  31. Beckers, A.; Hubert-Ferrari, A.; Beck, C.; Bodeux, S.; Tripsanas, E.; Sakellariou, D.; De Batist, M. Active Faulting at the Western Tip of the Gulf of Corinth, Greece, from High-Resolution Seismic Data. Mar. Geol. 2015, 360, 55–69. [Google Scholar] [CrossRef] [Green Version]
  32. Gasperini, L.; Marzocchi, A.; Mazza, S.; Miele, R.; Meli, M.; Najjar, H.; Michetti, A.M.; Polonia, A. Morphotectonics and Late Quaternary Seismic Stratigraphy of Lake Garda (Northern Italy). Geomorphology 2020, 371, 107–427. [Google Scholar] [CrossRef]
  33. Micallef, A.; Le Bas, T.P.; Huvenne, V.A.I.; Blondel, P.; Hühnerbach, V.; Deidun, A. A Multi-Method Approach for Benthic Habitat Mapping of Shallow Coastal Areas with High-Resolution Multibeam Data. Cont. Shelf Res. 2012, 39–40, 14–26. [Google Scholar] [CrossRef] [Green Version]
  34. Hasan, O.; Miko, S.; Brunović, D.; Papatheodorou, G.; Christodolou, D.; Ilijanić, N.; Geraga, M. Geomorphology of Canyon Outlets in Zrmanja River Estuary and Its Effect on the Holocene Flooding of Semi-Enclosed Basins (The Novigrad and Karin Seas, Eastern Adriatic). Water 2020, 12, 2807. [Google Scholar] [CrossRef]
  35. Korbar, T.; Markušić, S.; Hasan, O.; Fuček, L.; Brunović, D.; Belić, N.; Palenik, D.; Kastelic, V. Active Tectonic in the Kvarner Region (External Dinarides, Croatia)—An Alternative Approach Based on Focused Geological Mapping, 3D Seismological, and Shallow Seismic Imaging Data. Front. Earth Sci. 2020, 8, 582797. [Google Scholar] [CrossRef]
  36. Knies, J.; Nowaczyk, N.; Müller, C.; Vogt, C.; Stein, R. A multyproxy approach to reconstruct the environmental changes along the Eurasian continental margin over last 150,000 years. Mar. Geol. 2000, 163, 317–344. [Google Scholar] [CrossRef] [Green Version]
  37. Del Bianco, F.; Gasperini, L.; Giglio, F.; Bortoluzzi, G.; Kljaic, Z.; Ravaioly, M. Seafloor morphology of the Montenegro/N. Albania Continental Margin (Adriatic Sea-Central Mediterranean). Geomorphology 2014, 226, 202–216. [Google Scholar] [CrossRef]
  38. Bunzel, D.; Schmiedl, G.; Lindhorst, S.; Mackensen, A.; Reoild, J.; Romanhu, S.; Betzler, C. A multi-proxy analysis of Late Quaternary ocean and climate variability of the Maldives, Inner Sea. Clim. Past 2017, 13, 1791–1813. [Google Scholar] [CrossRef] [Green Version]
  39. Pikelj, K.; Juračić, M. Eastern Adriatic Coast (EAC): Geomorphology and Coastal Vulnerability of a Karstic Coast. J. Coast. Res. 2013, 29, 944–957. [Google Scholar] [CrossRef]
  40. Korbar, T. Orogenic evolution of the External Dinarides in the NE Adriatic region: A model constrained by tectonostratigraphy of Upper Cretaceous to Paleogene carbonates. Earth Sci. Rev. 2009, 96, 296–312. [Google Scholar] [CrossRef]
  41. Tišljar, J.; Vlahović, I.; Velić, I.; Sokač, B. Carbonate Platform Megafacies of the Jurassic and Cretaceous Deposits of the Karst Dinarides. Geol. Croat. 2002, 55, 139–170. [Google Scholar] [CrossRef]
  42. Surić, M. Submerged karst–Dead or alive? Example from the Eastern Adriatic coast (Croatia). Geoadria 2005, 10, 5–19. [Google Scholar] [CrossRef] [Green Version]
  43. Von Richthofen, F. Fuhrer für Forschungreisende; Verlag Von Gebrudek Janecke: Hannover, Germany, 1901; p. 734. [Google Scholar]
  44. Kelletat, D.H. Dalmatian Coasts. In Encyclopedia of Coastal Science (Encyclopedia of Earth Sciences Series); Schwartz, M., Ed.; Springer: Dordrecht, The Netherlands, 2005; pp. 355–356. [Google Scholar]
  45. Kastelic, V.; Vannoli, P.; Burrato, P.; Fracassi, U.; Tiberti, M.M.; Valensise, G. Seismogenic Sources in the Adriatic Domain. Mar. Pet. Geol. 2013, 42, 191–213. [Google Scholar] [CrossRef] [Green Version]
  46. Faivre, S.; Bakran-Petricioli, T.; Herak, M.; Barešić, J.; Borković, D. Late Holocene Interplay between Coseismic Uplift Events and Interseismic Subsidence at Koločep Island and Grebeni Islets in the Dubrovnik Archipelago (Southern Adriatic, Croatia). Quat. Sci. Rev. 2021, 274, 107284. [Google Scholar] [CrossRef]
  47. Faivre, S.; Bakran, P.T.; Herak, M.; Barešić, J.; Horvatić, D.; Borković, D. Late Holocene relative sea-level change and palaeoearthquakes at the Elafiti islands (Southern Adriatic, Croatia). In Proceedings of the “Women in Geomorphology” Online One day Workshop, Online Meeting, 8 March 2022. [Google Scholar]
  48. Markušić, S.; Herak, M. Seismic Zoning of Croatia. Nat. Hazards 1998, 18, 269–285. [Google Scholar] [CrossRef]
  49. Herak, M.; Herak, D.; Markušić, S.; Ivančić, I. Numerical Modeling of the Ston-Slano (Croatia) Aftershock Sequence. Stud. Geophys. Geod. 2001, 45, 251–266. [Google Scholar] [CrossRef]
  50. Markušić, S. Seismicity of Croatia. In Earthquake Monitoring and Seismic Hazard Mitigation in Balkan Countries; Husebye, E.S., Ed.; NATO Science Series IV: Earth/Environmental Sciences; Springer: Dordrecht, The Netherlands, 2008; Volume 81, pp. 81–98. [Google Scholar] [CrossRef]
  51. Herak, M.; Marić, K.; Kuk, K.; Stipčević, J.; Herak, D.; Kuk, V.; Markušić, S.; Allegretti, I. HVSR of Ambient Noise in Ston (Croatia): Comparison with Theoretical Spectra and with the Damage Distribution after the 1996 Ston-Slano Earthquake. Bull. Earthq. Eng. 2009, 8, 483–499. [Google Scholar] [CrossRef]
  52. Prelogović, E.; Pribičević, B.; Ivković, Ž.; Dragičević, I.; Buljan, R.; Tomljenović, B. Recent structural fabric of the Dinarides and tectonically active zones important for petroleum-geological exploration in Croatia. Nafta 2004, 55, 155–161. [Google Scholar]
  53. Šundov, M. Geomorfologija Konavala, Dubrovačkog Primorja, Elafita i Pelješca; Merdijani: Samobor, Croatia, 2012; p. 186. [Google Scholar]
  54. Milanović, P.T. Karst Istočne Hercegovine i Dubrovačkog Priobalja; Asocijacija Speleloških Organizacija Srbije: Beograd, Serbia, 2006; p. 362. [Google Scholar]
  55. Stevanović, Z.; Kukurić, N.; Treidel, H. Characterization of Transboundary Aquifers in Dinaric Karst-A Base for Sustainable Water Management at Regional and Local Scale. In Proceedings of the IAH 2012 Congress, Niagara Falls, ON, Canada, 16–21 September 2012; Volume 10. [Google Scholar]
  56. Vranješ, M.; Prskalo, M.; Džeba, T. Hidrologija i Hidrogeologija Sliva Neretve i Trebišnjice, Osvrt na Izgradnju Dijela HE Sustava-Gornji Horizonti. Electron. Collect. Pap. Fac. Civ. Eng. 2013, 5, 1–23. [Google Scholar]
  57. Reimer, P.J.; Edouard Bard, B.; Alex Bayliss, B.; Warren Beck, B.J.; Paul Blackwell, B.G.; Christopher Bronk Ramsey, B. IntCal13 and Marine13 Radiocarbon Age Calibraion Cuvres 0–50,000 Years Cal Bp. Radiocarbon 2013, 55, 1869–1887. [Google Scholar] [CrossRef] [Green Version]
  58. Moore, D.M.; Reynolds, R.C. X-Ray Diffraction and the Identification and Analysis of Clay Minerals, 2nd ed.; Oxford University Press: Oxford, UK, 1997; p. 378. [Google Scholar]
  59. Wai Ting Tung, J.; Tanner, P.A. Instrumental Determination of Organic Carbon in Marine Sediments. Mar. Chem. 2003, 80, 161–170. [Google Scholar] [CrossRef]
  60. Blott, S.J.; Pye, K. Gradistat: A Grain Size Distribution and Statistics Package for the Analysis of Unconsolidated Sediments. Earth Surf. Process. Landf. 2001, 26, 1237–1248. [Google Scholar] [CrossRef]
  61. Hydrographic Map Mljet I.–Olipa I. Sheet Number 70, Scale 1:25,000; Hydrographic Institute of the Republic of Croatia: Split, Croatia, 1986.
  62. Hydrographic Map Olipa I.–Slano. Sheet Number 71, Scale 1:25,000; Hydrographic Institute of the Republic of Croatia: Split, Croatia, 1987.
  63. Aitchison, J. The Statistical Analysis of Compositional Data; Chapman and Hall: London, UK, 1986; p. 416. [Google Scholar] [CrossRef]
  64. Chayes, F. On correlation between variables of constant sum. J. Geophys. Res. 1960, 65, 4185–4193. [Google Scholar] [CrossRef]
  65. Pawlowsky-Glahn, V.; Egozcue, J.J.; Tolosana-Delgado, R. Modeling and analysis of compositional data, 1st ed.; John Wiley & Sons: Chichester, UK, 2015; p. 272. [Google Scholar] [CrossRef]
  66. Aitchison, J.; Greenacere, M. Biplots of compositional data. J. R. Statis. Soc. Ser. C Appl. Statis. 2002, 51, 375–392. [Google Scholar] [CrossRef] [Green Version]
  67. Razum, I.; Miko, S.; Ilijanić, N.; Hasan, O.; Šparica Miko, M.; Brunović, D.; Pawlowsky-Glahn, V. A compositional approach to the reconstruction of geochemical processes involved in the evolution of Holocene marine flooded coastal karst basins (Mljet Island, Croatia). Appl. Geoch. 2020, 116, 104574. [Google Scholar] [CrossRef]
  68. Faivre, S.; Bakran-Petricioli, T.; Barešić, J.; Horvatić, D. Lithophyllum Rims as Biological Markers for Constraining Palaeoseismic Events and Relative Sea-Level Variations during the Last 3.3 ka on Lopud Island, Southern Adriatic, Croatia. Glob. Planet. Change 2021, 202, 103517. [Google Scholar] [CrossRef]
  69. Waelbroeck, C.; Labeyrie, L.; Michel, E.; Duplessy, J.C.; Mcmanus, J.F. Sea-Level and Deep Water Temperature Changes Derived from Benthic Foraminifera Isotopic Records. Quat. Sci. Rev. 2002, 21, 295–305. [Google Scholar] [CrossRef]
  70. Tribovillard, N.; Algeo, T.J.; Lyons, T.; Riboulleau, A. Trace metals as paleoredox and paleoproductivity proxies: An update. Chemic. Geol. 2006, 232, 12–32. [Google Scholar] [CrossRef]
  71. Surić, M.; Juračić, M. Late Pleistocene-Holocene Environmental Changes-Records from Submerged Speleothems along the Eastern Adriatic Coast (Croatia). Geol. Croat. 2010, 63, 155–169. [Google Scholar] [CrossRef]
  72. Ivkić, F.I.; Ilijanić, N.; Miko, S.; Hajek, T.V.; Hasan, O.; Kordic, B. Late Quaternary sedimentological and geomorphological processes in the Prološko Blato karst polje (Imotsko polje, Croatia). In Proceedings of the 6th Regional Scientific Meeting on Quaternary Geology: Seas, Lakes and Rivers, Ljubljanja, Slovenia, 27–29 September 2021. [Google Scholar]
  73. Rohling, E.J.; Fenton, M.; Jorissen, F.J.; Bertrand, P.; Ganssen, G.; Caulet, J.P. Magnitudes of sea-level lowstands of the past 500,000 years. Nature 1998, 394, 162–165. [Google Scholar] [CrossRef]
  74. Babić, L.; Zupanič, J.; Vidović, J.; Razum, I.; Lužar-Oberiter, B.; Crnjaković, M. Preservation of Hanging Aeolian Deposits in Insular Karst Depressions: Sediment Sources and Implications for the Pleistocene Palaeogeography of the SE Adriatic Archipelago. Aeolian Res. 2013, 11, 171–189. [Google Scholar] [CrossRef]
  75. Kovačić, M.; Pavelić, D.; Vlahović, I.; Marković, F.; Wacha, L.; Kampić, Š.; Rončević, S.; Drempetić, D. Pleistocene Alluvial and Aeolian Deposits with Tephra on the Island of Lopud (Eastern Mid-Adriatic, Croatia): Provenance, Wind Regime, and Climate Controls. Quat. Int. 2018, 494, 92–104. [Google Scholar] [CrossRef]
  76. Razum, I.; Lužar-Oberiter, B.; Zaccarini, F.; Babić, L.; Miko, S.; Hasan, O.; Ilijanić, N.; Beqiraj, E.; Pawlowsky-Glahn, V. New Sediment Provenance Approach Based on Orthonormal Log Ratio Transformation of Geochemical and Heavy Mineral Data: Sources of Eolian Sands from the Southeastern Adriatic Archipelago. Chem. Geol. 2021, 583, 120451. [Google Scholar] [CrossRef]
  77. Zecchin, M.; Ceramicola, S.; Lodolo, E.; Casalbore, D.; Chiocci, F.L. Episodic, Rapid Sea-Level Rises on the Central Mediterranean Shelves after the Last Glacial Maximum: A Review. Mar. Geol. 2015, 369, 212–223. [Google Scholar] [CrossRef]
  78. Milanović, P. Field Trip 1- Bosnia & Herzegovina: The Popovo Polje–The Vjeternica Cave–Croatia: The Palata Spring–The Mali Zaton Bay–The Ombla Spring–Dubrovnik Old Town and Fortress (UNESCO Heritage Site)–the Dubrovnik (Plat) HEP–Konavoski Dvori the Ljut. In FIELD Trip Guide: Trebinje, June 2014.—Beograd: DIKTAS Project: Faculty of Mining and Geology, Department for Hydrogeology; Milanović, P., Stevanović, Z., Čokorilo, I.M., Eds.; Faculty of Mining and Geology, Department for Hydrogeology: Beograd, Serbia, 2014; p. 69. [Google Scholar]
  79. Ruszkiczay-Rüdiger, Z.; Kern, Z.; Temovski, M.; Madarász, B.; Milevski, I.; Braucher, R.; ASTER Team. Last deglaciation in the central Balkan Peninsula: Geochronological evidence from the Jablanica Mt. (North Macedonia). Geomorph. Elsevier 2020, 351, 106985. [Google Scholar] [CrossRef]
  80. Hughes, P.D. Little Ice Age Glaciers in the Balkans: Low Altitude Glaciation Enabled by Cooler Temperatures and Local Topoclimatic Controls. Earth Surf. Process. Landf. 2010, 35, 229–241. [Google Scholar] [CrossRef]
  81. Hughes, P.D.; Woodward, J.C. Quaternary Glaciation in the Mediterranean Mountains: A New Synthesis. Geol. Soc. Lond. Spec. Publ. 2016, 433, 1–23. [Google Scholar] [CrossRef]
  82. Žebre, M.; Sarıkaya, M.A.; Stepišnik, U.; Yıldırım, C.; Çiner, A. First 36Cl cosmogenic moraine geochronology of the Dinaric mountain karst: Velež and Crvanj Mountains of Bosnia and Herzegovina. Quat. Sci. Rev. 2019, 208, 54–75. [Google Scholar] [CrossRef] [Green Version]
  83. Leder, N.; Paklar, B.G.; Grbec, B.; Matić, F. Characteristics of The Eastern Adriatic Current in The Coastal Area Between Dubrovnik and Bar. In Proceedings of the 8th International Maritime Science Conference, Budva, Montenegro, 11–12 April 2019. [Google Scholar]
Figure 1. (A) General study site location is in the red square; (B) bathymetry data of Koločep bay and geological map (geological map modified from [27,28]) draped over shaded relief with plotted sub-bottom profiler (SBP) tracklines, 2D seismic lines, and KK-1 sediment core location marked with black point on trackline 17. Legend: T = Triassic; J = Jurassic; K = Cretaceous; Pc = Paleocene; E = Eocene; al = alluvium (Quaternary).
Jmse 10 00881 g001
Figure 2. The spatial distribution of earthquakes from years 1471–2014, with a combination of numerous aftershocks within the 50 km radius around Ston which lasted for a year (modified from [50,51]).
Jmse 10 00881 g002
Figure 3. (a) Wide area of Doli–Slano littoral with larger karst poljes in the hinterland. Scattered appearances of ponors and springs and their underground connection (modified from [27,28,54]). (b) A–A’: schematic typical cross-section of cascade system through the karstic poljes of Dinarides (modified from [54]); B: recorded multibeam data; and C: recent submarine springs (vrulja) in the Doli–Slano area (photo taken by S. Miko).
Jmse 10 00881 g003
Figure 4. (A) High-resolution seismic profile of seismic line T5 and (B) its stratigraphic interpretation. The location of the line is shown in Figure 1.
Jmse 10 00881 g004
Figure 5. (A) High-resolution seismic profile of seismic line T7 and (B) its stratigraphic interpretation with sediment core. The location of the line is shown in Figure 1.
Jmse 10 00881 g005
Figure 6. (A) High-resolution seismic profile of seismic line T10 and (B) its stratigraphic interpretation. The location of the line is shown in Figure 1.
Jmse 10 00881 g006
Figure 7. Bathymetric map based on the surface of seismostratigraphic sequence S.S.S.1. combined with the legacy bathymetric data, generally following the −55 m contour in the bay. The sand deposits are based on the legacy bathymetric map, data [61,62], and the SBP survey.
Jmse 10 00881 g007
Figure 8. (a) Depth of the erosional surface E1, i.e., the surface of the seismostratigraphic sequence S.S.S.2, showing how the sediment basin looks before the deposition of S.S.S.1; (b) the layer thickness of seismostratigraphic sequence S.S.S.1.; (c) the layer thickness of seismostratigraphic sequence S.S.S.2.
Jmse 10 00881 g008
Figure 9. Sediment core KK-1 and lithological units with variability of MS and elemental ratios obtained using the XFR core scanner. The core penetrates unit S.S.S.1–unit U1a (lithological unit L1) and unit S.S.S.2–unit 2a (lithological units L2 and L3). The hiatus is the erosional surface between units S.S.S.1 and S.S.S.2. On the Zr/Ti graph, the peak in the black circle represents the sample with a high Zr/Ti ratio younger than the 9.6 cal kyr BP, containing glass shards that could belong to one of the Vesuvius Plinian eruptions of Mercato, with a modelled age of 8.59–0.23 cal kyr BP present in Veliko Jezero on the nearby Mljet Island [23].
Jmse 10 00881 g009
Figure 10. Sediment core KK-1 and lithological units with Ti, Fe, K, Sr, and Ca variation.
Jmse 10 00881 g010
Figure 11. Sediment core KK-1 and lithological units in correlation with a variability of grain size, TOC, TIC and C/N ratios.
Jmse 10 00881 g011
Figure 12. Pleistocene paleo-river channel of “Olipa River” observed on profiles T1 and T2 inside of Koločep bay, and Pleistocene paleo-river channel of “Olipa River” observed on profiles T6, T3 and T4 outside of Koločep bay towards Mljet Island.
Jmse 10 00881 g012
Figure 13. Interpreted seismic section 2D seismic profile L1 correlated with high-resolution seismic profile T9. On the profile L1, the red vertical lines represent reverse faults, and the green line represents the karstified Mesozoioc carbonate boundary. The T9 profile shows the depositions of aeolian sand, which are blown from the Albanian shelf, and sill, which is covered with deposits of sand.
Jmse 10 00881 g013
Figure 14. Two-dimensional seismic profile of L2 correlated with high-resolution seismic profiles T8, T16 and T17. On profile L2, the red vertical lines represent faults, and the green line represents the Mesozoic boundary. On profile T17, we can observe an uplifted block that uplifted Pleistocene and Holocene deposits. Due to uplift in this area, sediment sequence S.S.S.2 is completely eroded.
Jmse 10 00881 g014
Figure 15. Multibeam bathymetry data of Pleistocene and Holocene uplifting with the cross-section through the block (MBS profiles 1, 2, 3 and 4) and profile 5, which is parallel to the structure. The figure shows a mainshock (after [50]) and one of the numerous aftershocks [14] of the 1996 Ston earthquake in the vicinity of the uplifted block.
Jmse 10 00881 g015
Figure 16. Seismostratigraphic sequences correlated with the Late Pleistocene–Holocene sea-level curve (modified from [4]).
Jmse 10 00881 g016
Figure 17. Compositional biplot: (a) all environments included; (b) discrimination between lithological unit L1 (marine environments), L2, and L3 (marine swamps with variable marine/terrestrial influence).
Jmse 10 00881 g017
Figure 18. Cascade system of karstic poljes with two possible scenarios in relation to RSL from LGM to the Holocene, considering (a): open channel area with the intermittent surface flow of Olipa River during LGM (A); Late Glacial rivers with high discharge from springs erode sediment from the karst poljes (B); formation of a shallow karst lake with short surface flow of the Olipa River and rising sea level (C); sea level rise with ingression through the paleochannel of Olipa River, and the formation of shallow lagoons (D); fine sediment accumulation during the Holocene in the deepest parts of the bay and the burial part of the paleochannel of the Olipa River by sand redeposited by strong eastern Adriatic currents creating a sill at −50 m (E); (b) intermittent surface flow of the Olipa River through the karst poljes and submergence in the ponor, forming a resurgent stream on the southern side of the carbonate sill during LGM under the influence of tectonic activity (F); high discharge from springs and erosion of sediment in the poljes and flow through the ponor and resurgent streams of the Olipa River during the Late Glacial period (G); formation of a shallow karst lake with short surface flow of the Olipa River with the formation of costal springs and rising sea level (H); sea level rise with ingression through the paleochannel of Olipa River and the formation of a shallow lagoon (I); fine sediment accumulation in the deepest parts of the bay and burial in parts of the paleochannel of the Olipa River by sand redeposited on the carbonate sill by strong eastern Adriatic currents creating a sill at −50 m during the Holocene (J).
Jmse 10 00881 g018
Figure 19. Bathymetric map over DEM with main faults in the area. The area marked with a red–dashed circle shows tectonically deformed Pleistocene and Holocene sediments observed on 2D seismic profiles. Yellow (1667 AD seismic event) and orange (1520 AD seismic event) marks show uplifted segments of the coast of the islands Lopud (modified from [68]) and Koločep and Grebeni islets by major co-seismic events in the area, with estimated uplift (modified from [46]).
Jmse 10 00881 g019
Figure 20. Detailed map from Figure 20 with two possible scenarios of the flow of the Olipa River during lowstand. (a) Surface flow of the “Olipa” River through the poljes and submergence in a ponor zone, forming a resurgent stream on the southern side of the carbonate sill with flow towards Mljet Island; (b) surface flow of “Olipa” River from the Koločep Late Glacial lake through a river channel between Olipa Island and Jakljan Island with flow towards Mljet Island. Both scenarios imply the formation of a paleochannel in the Pleistocene eolian sand deposits.
Jmse 10 00881 g020
Figure 21. Wide area of Doli–Slano littoral with larger karst poljes in the hinterland. Scattered appearances of ponors and springs and their underground connection (modified from [27,28,54]) with important faults in the area [52]. The figure shows the area during the sea level at −120 m. The area represents the land on which aeolian sands were deposited, with a lake within the karst polje and paleo-river flowing outside of the polje. Detailed map (Figure 20) of the area with paleo spring and paleo ponor of the Olipa paleo-river with 2 possible scenarios of flow.
Jmse 10 00881 g021
Table 1. Location of the sediment core, radiocarbon AMS dating, and sample age calibration based on the MARINE 13 curve [57].
Core NameTotal Core Length (cm)CoordinatesLaboratory NumberSample Depth (cm)Materialδ 13C (‰)Conventional Radiocarbon Age (B.P.)Probability (%)Calibrated Age
(Cal B.P.)
KK-1470(X) 17°50′4, 910″ EBeta-468182157–158shell+1.39050 ± 3095.4%9669
(Y) 42°46′0, 581″ NBeta-468183251.5–253.5shell+1.410,780 ± 3095.4%12,170
Publisher’s Note: MDPI stays neutral with regard to jurisdictional claims in published maps and institutional affiliations.

