
Hydrodynamic Responses of a Barge-Type Floating Offshore Wind Turbine Integrated with an Aquaculture Cage


Abstract
:1. Introduction
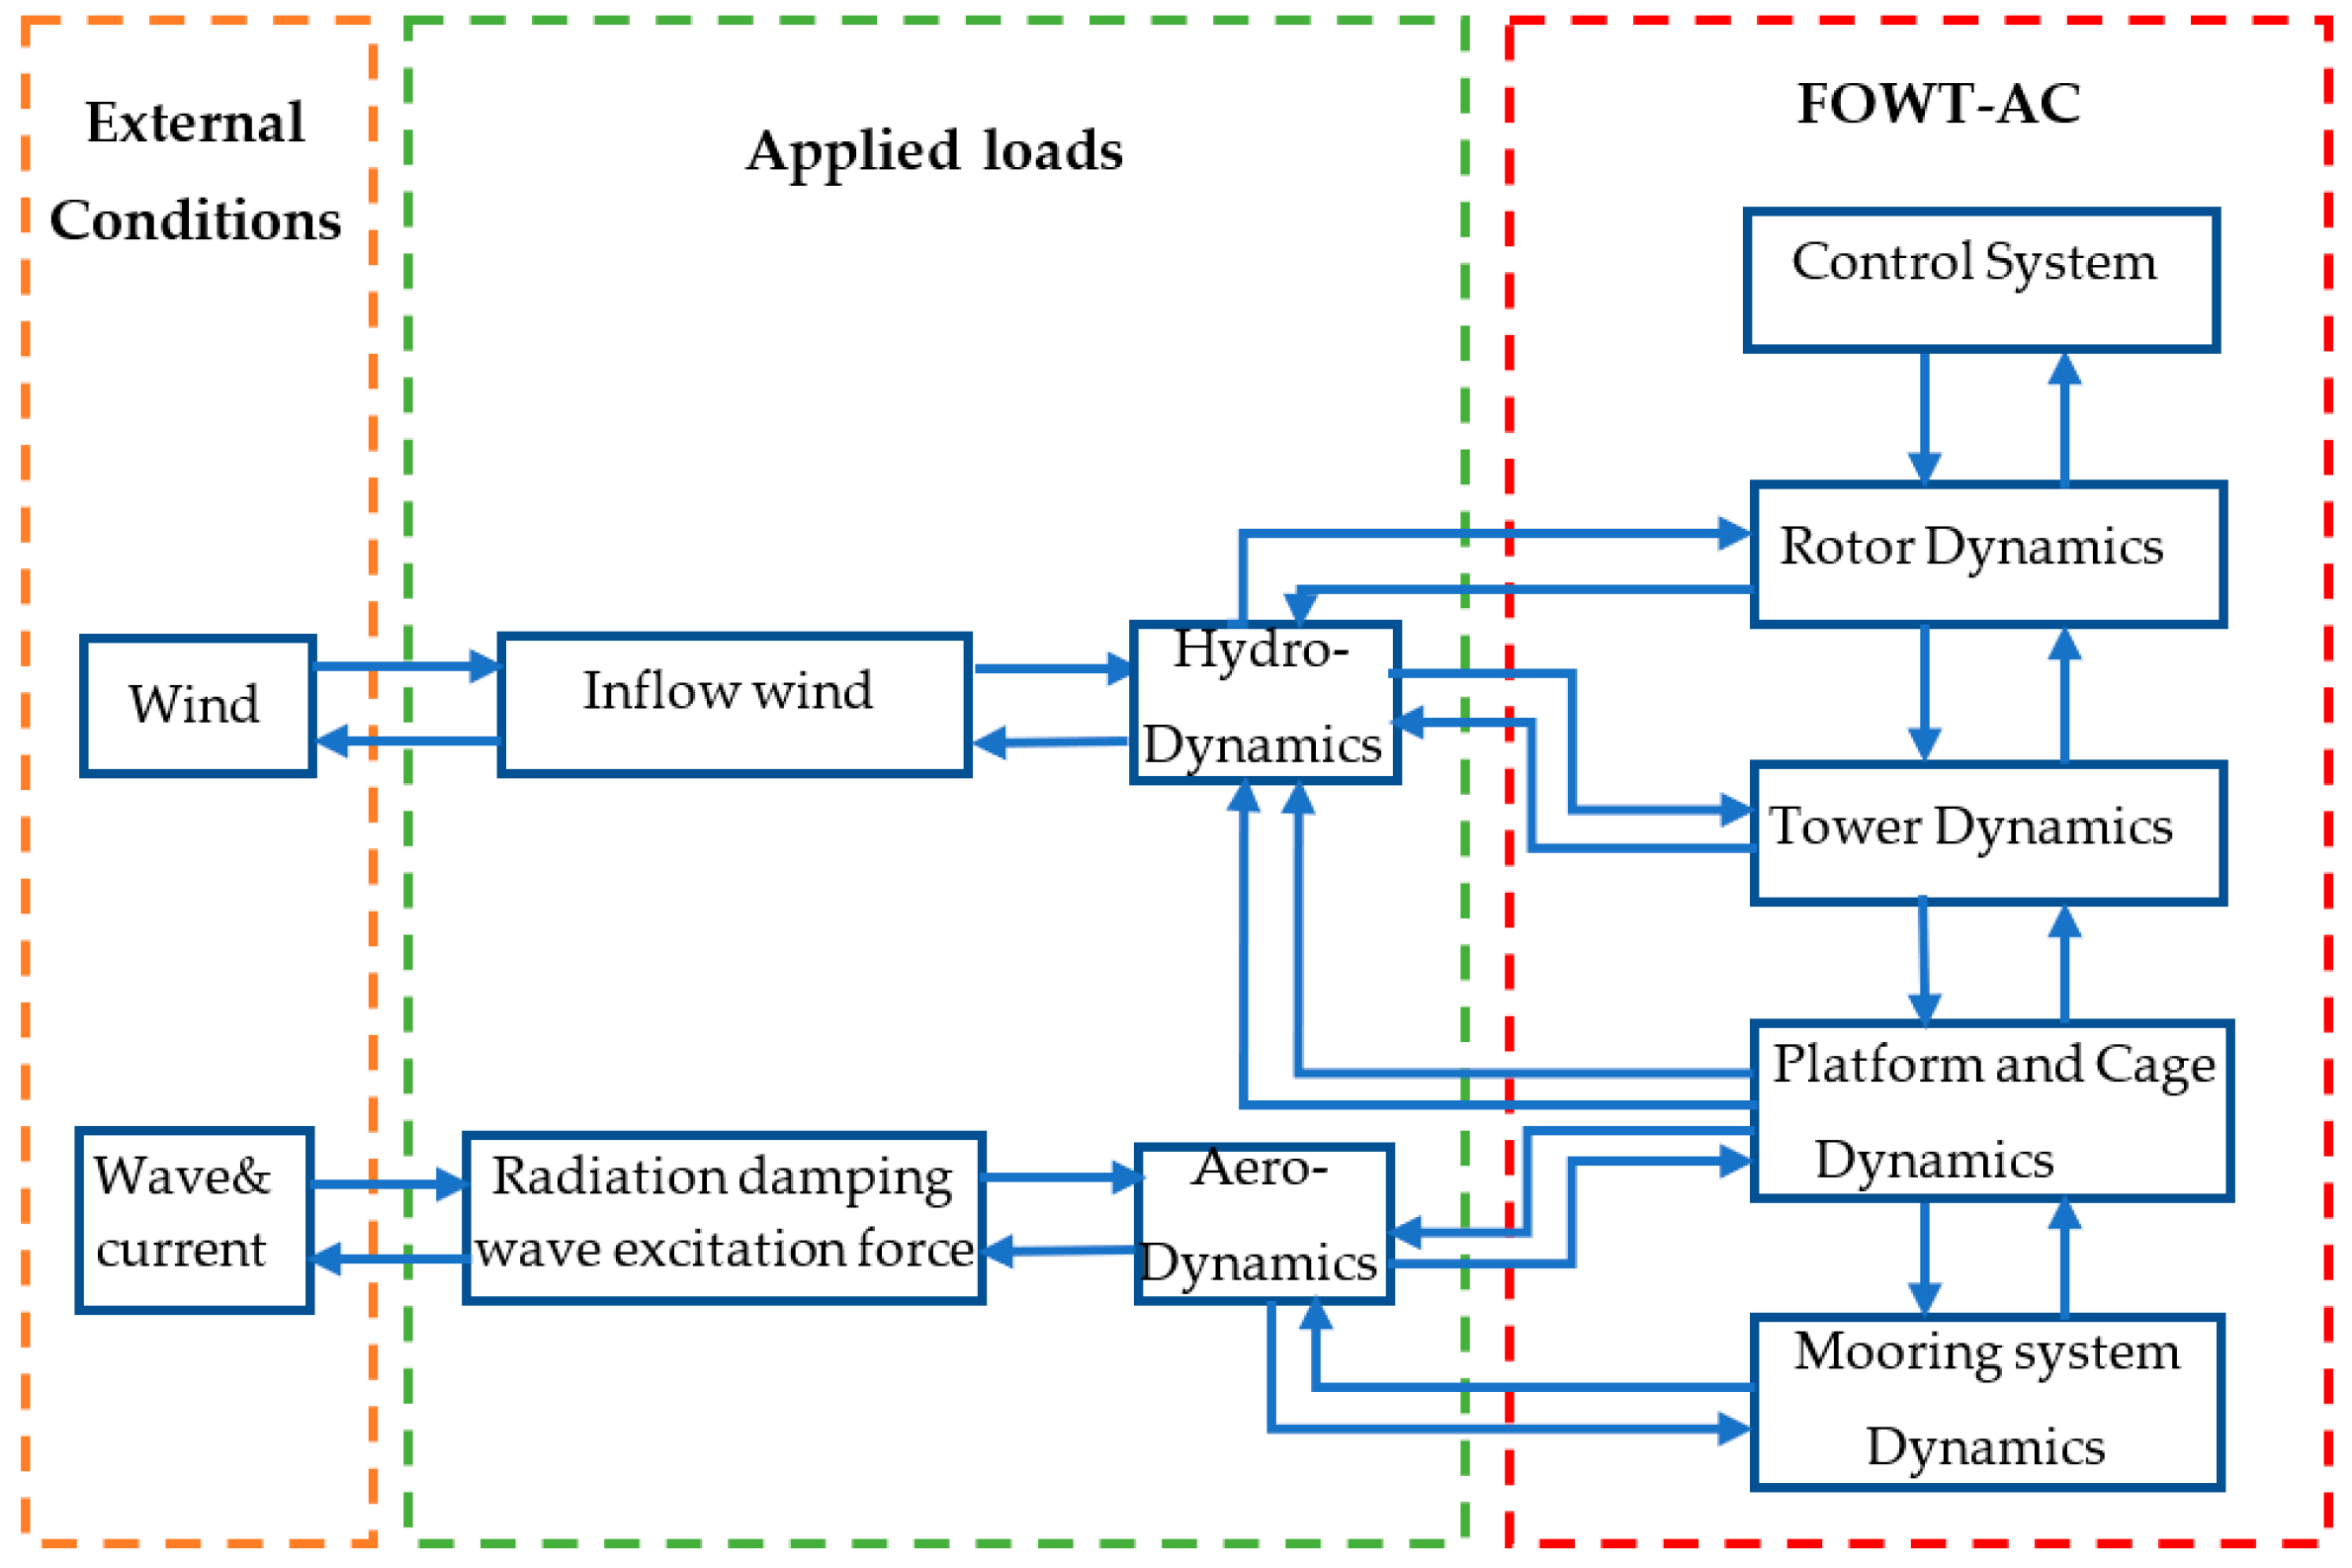
2. Theoretical Methods
2.1. Equation of Motion in the Time Domain
2.2. Potential Flow Theory
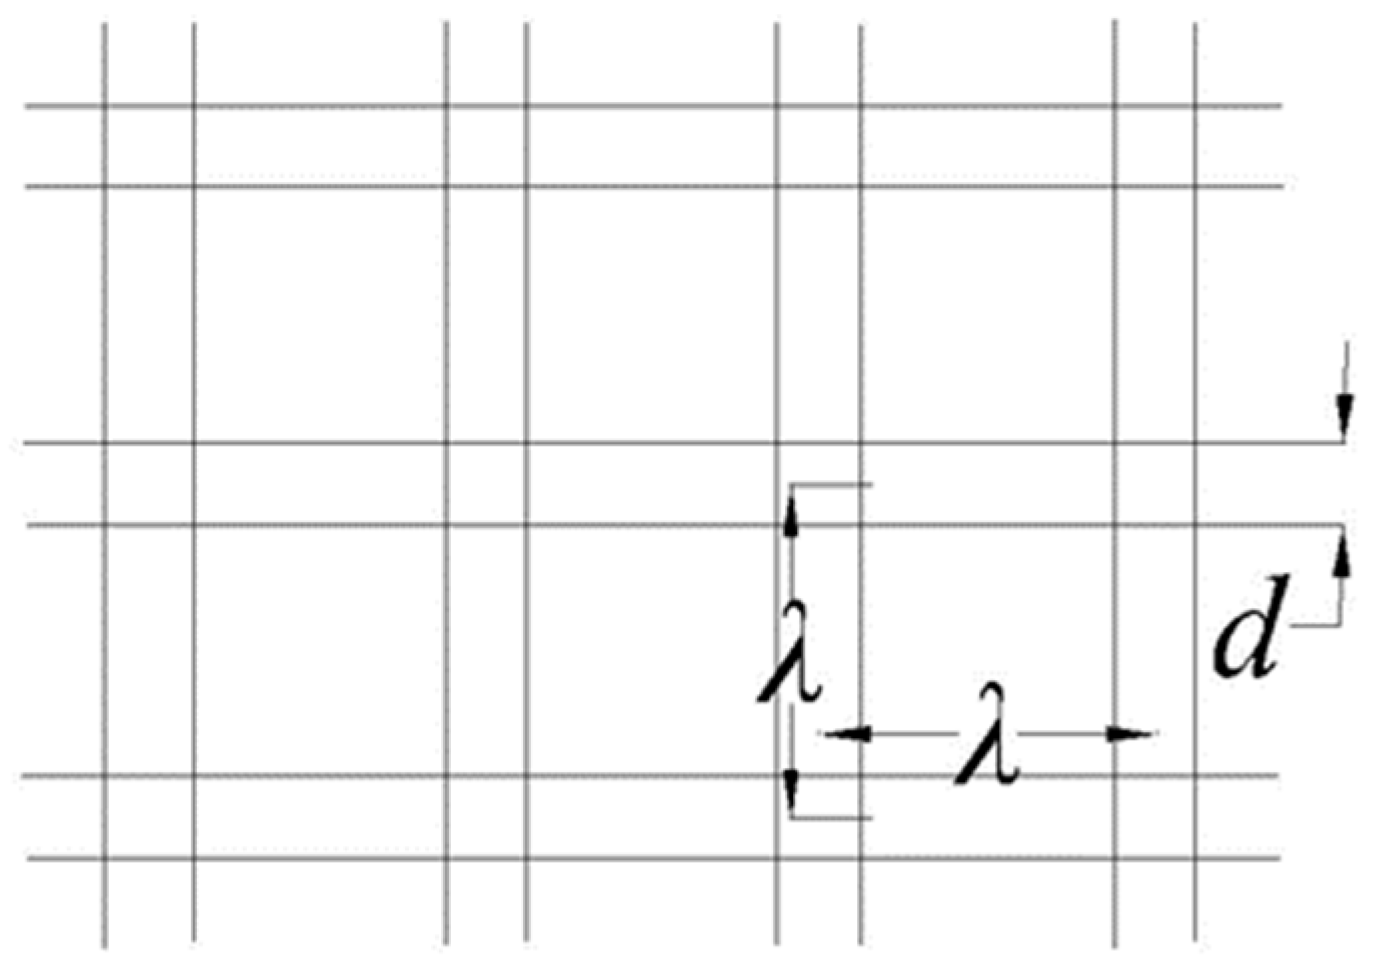
2.3. Mesh Grouping Method
- (1)
- The nets should be kept equal in quantity before and after grouping.
- (2)
- Similar geometric scales should be maintained before and after grouping.
- (3)
- The nets before and after grouping should be kept equal to the hydrodynamic force.
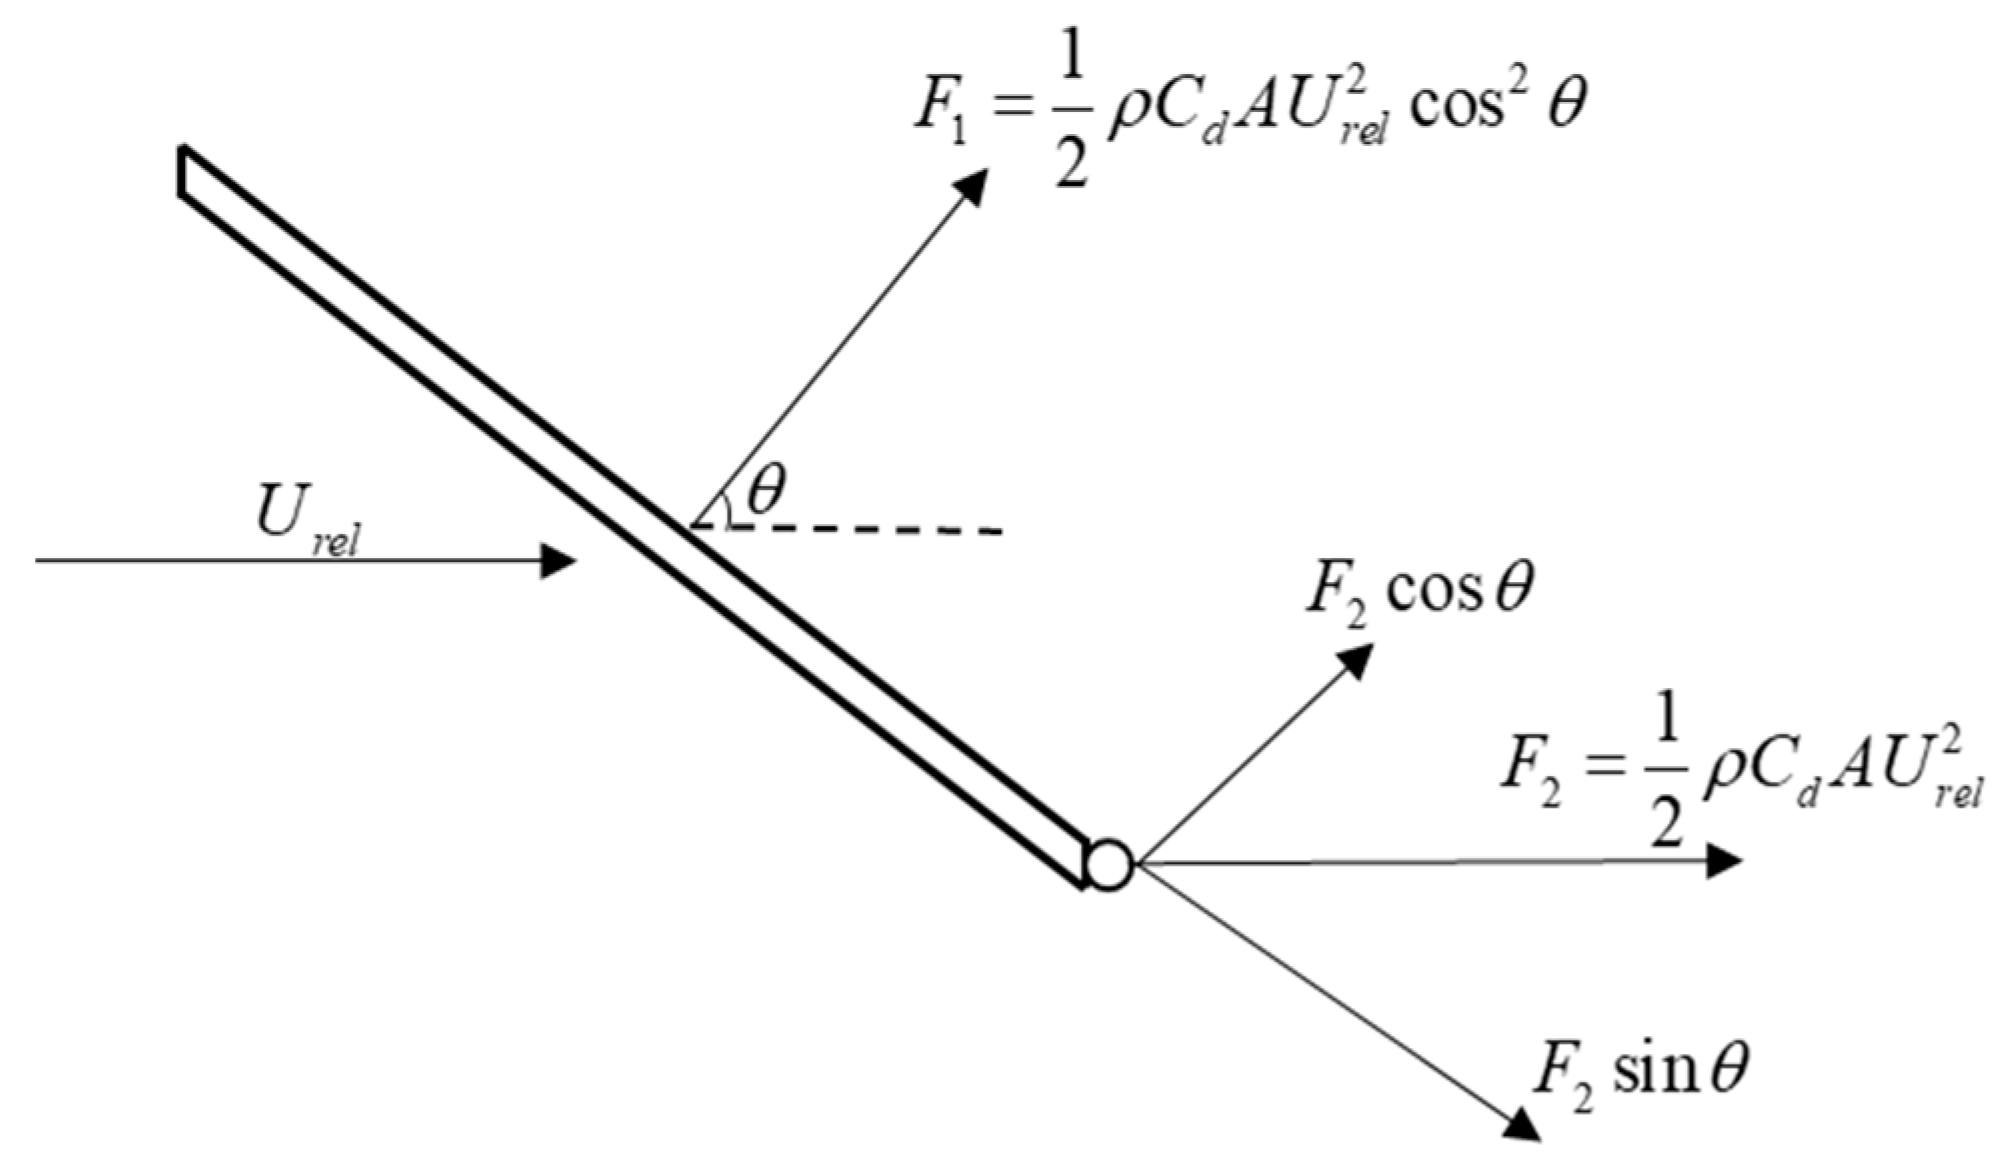
2.4. Hydrodynamic Force of Netting
2.5. Mooring Lines Tension
3. Numerical Model and Model Testing
3.1. Design of the FOWT-AC
3.2. Numerical Model
3.3. Environmental Conditions
3.4. Model Validation
4. Results and Discussion
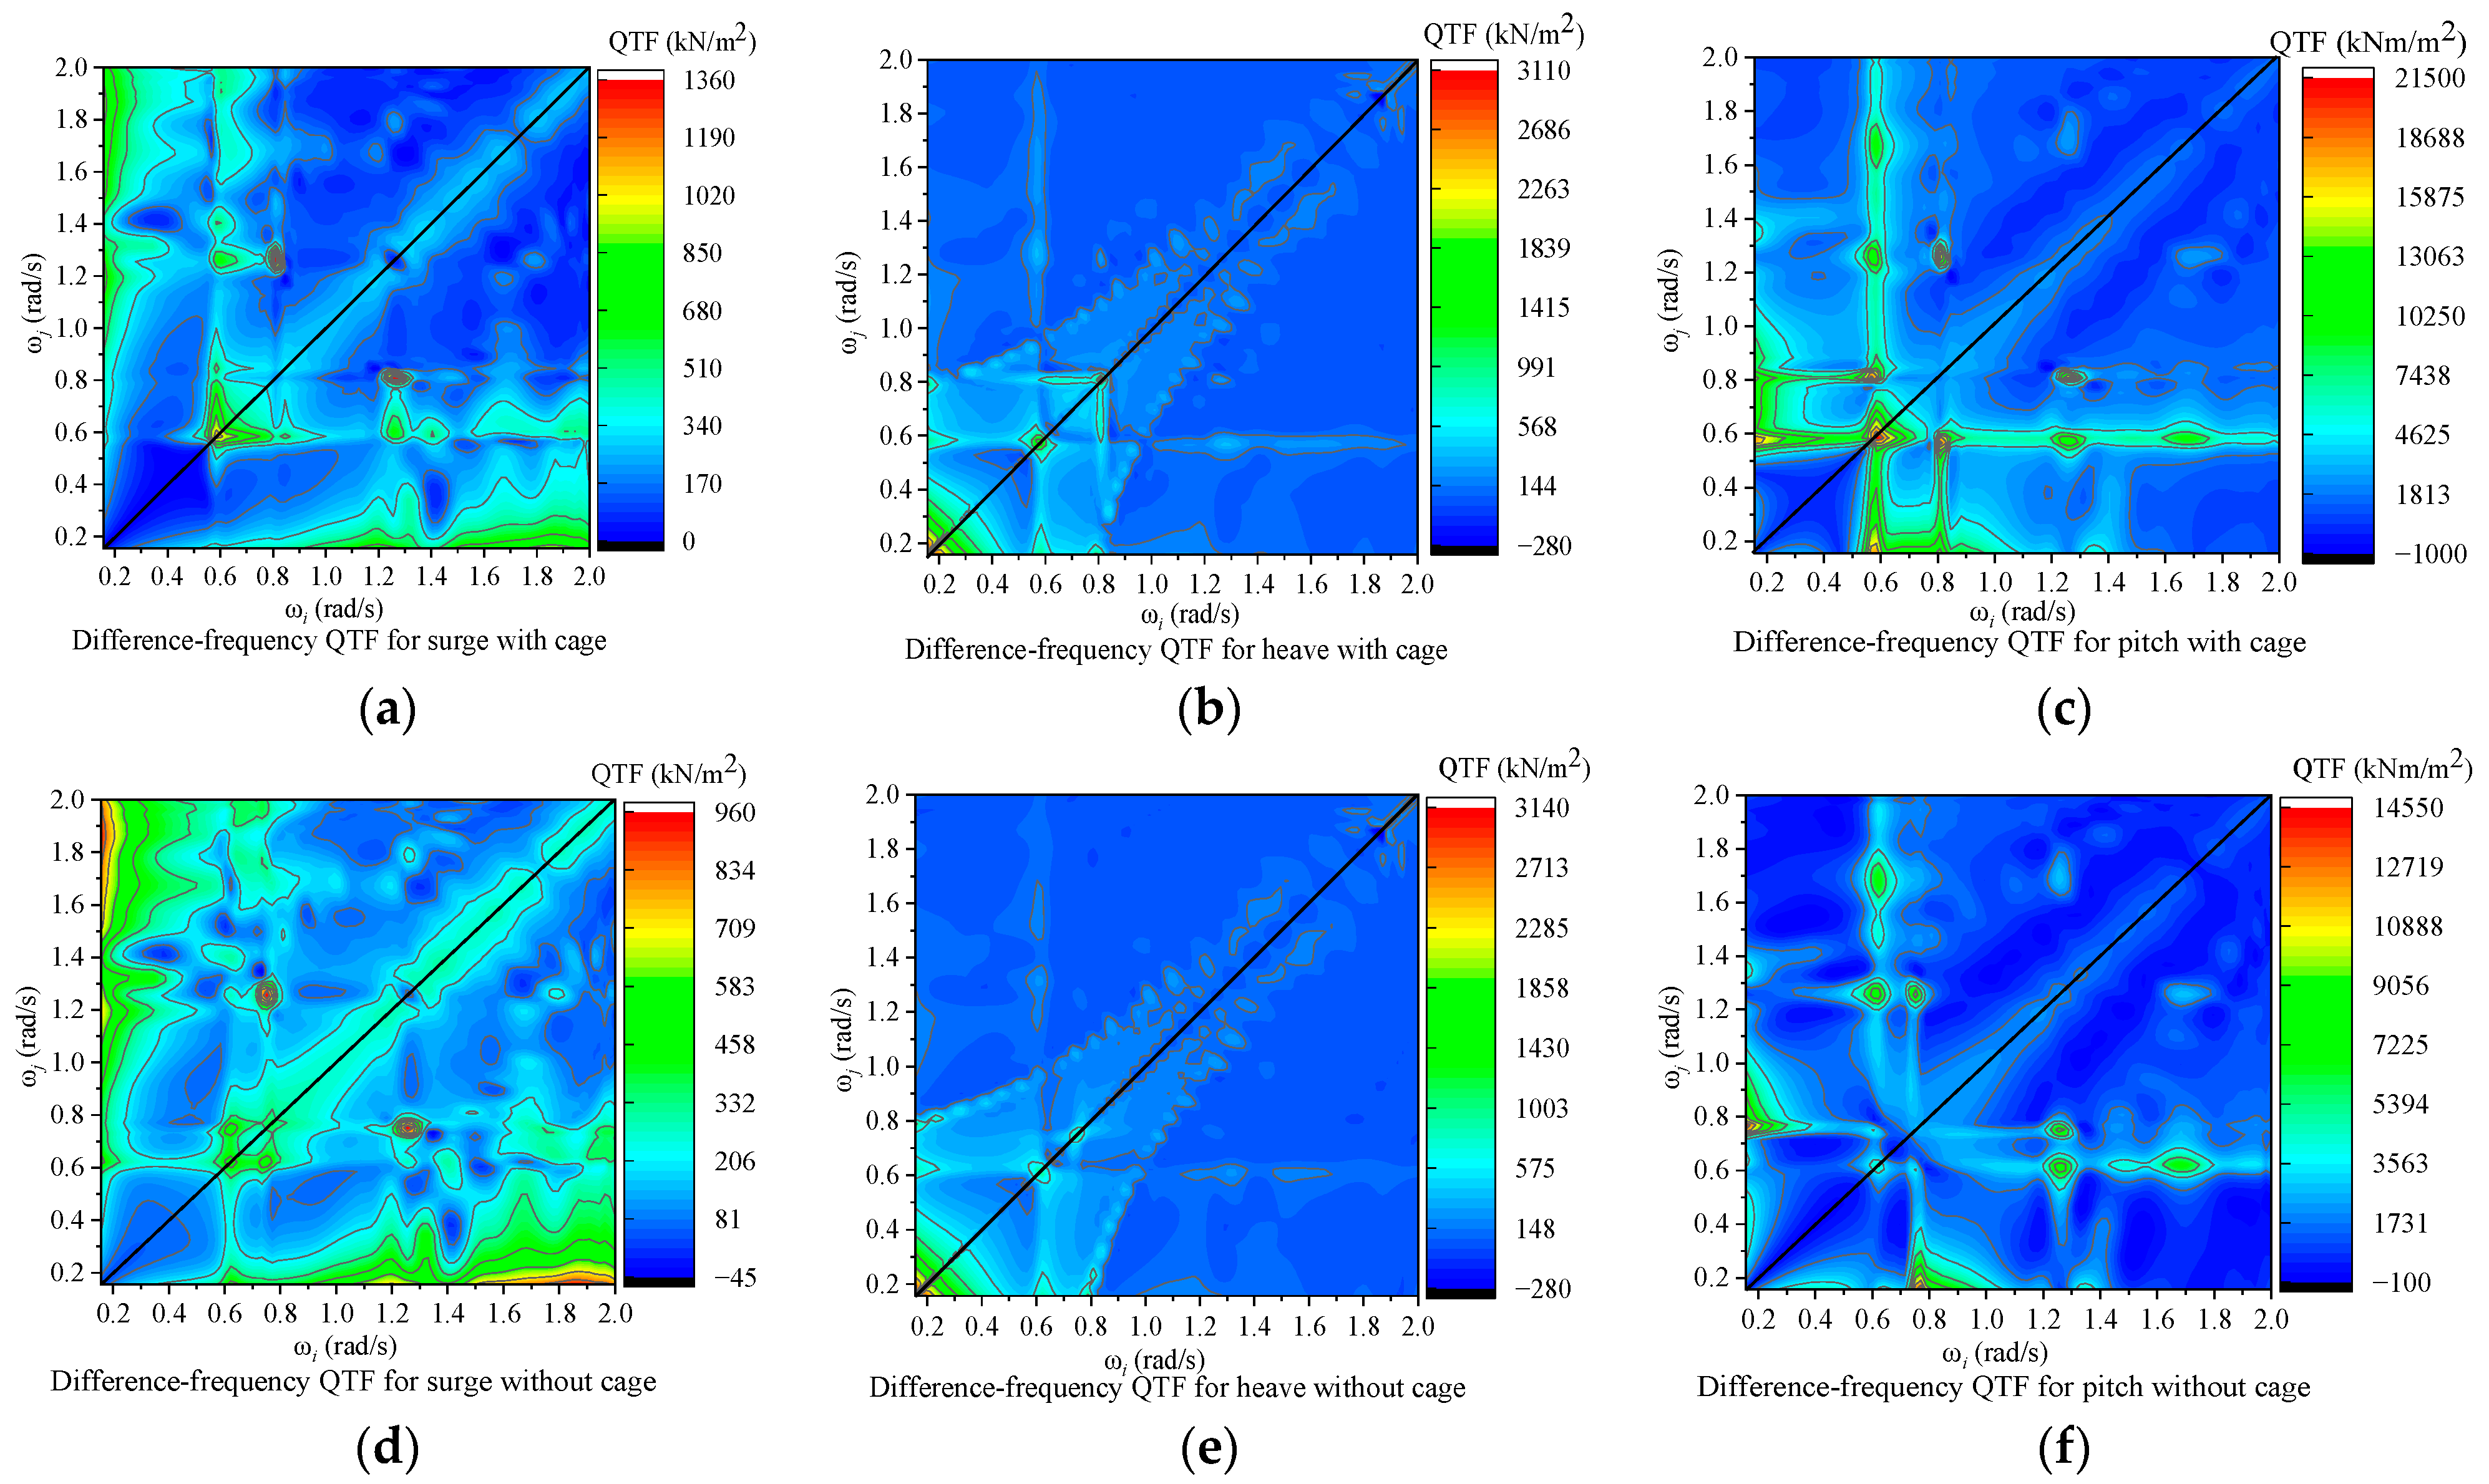
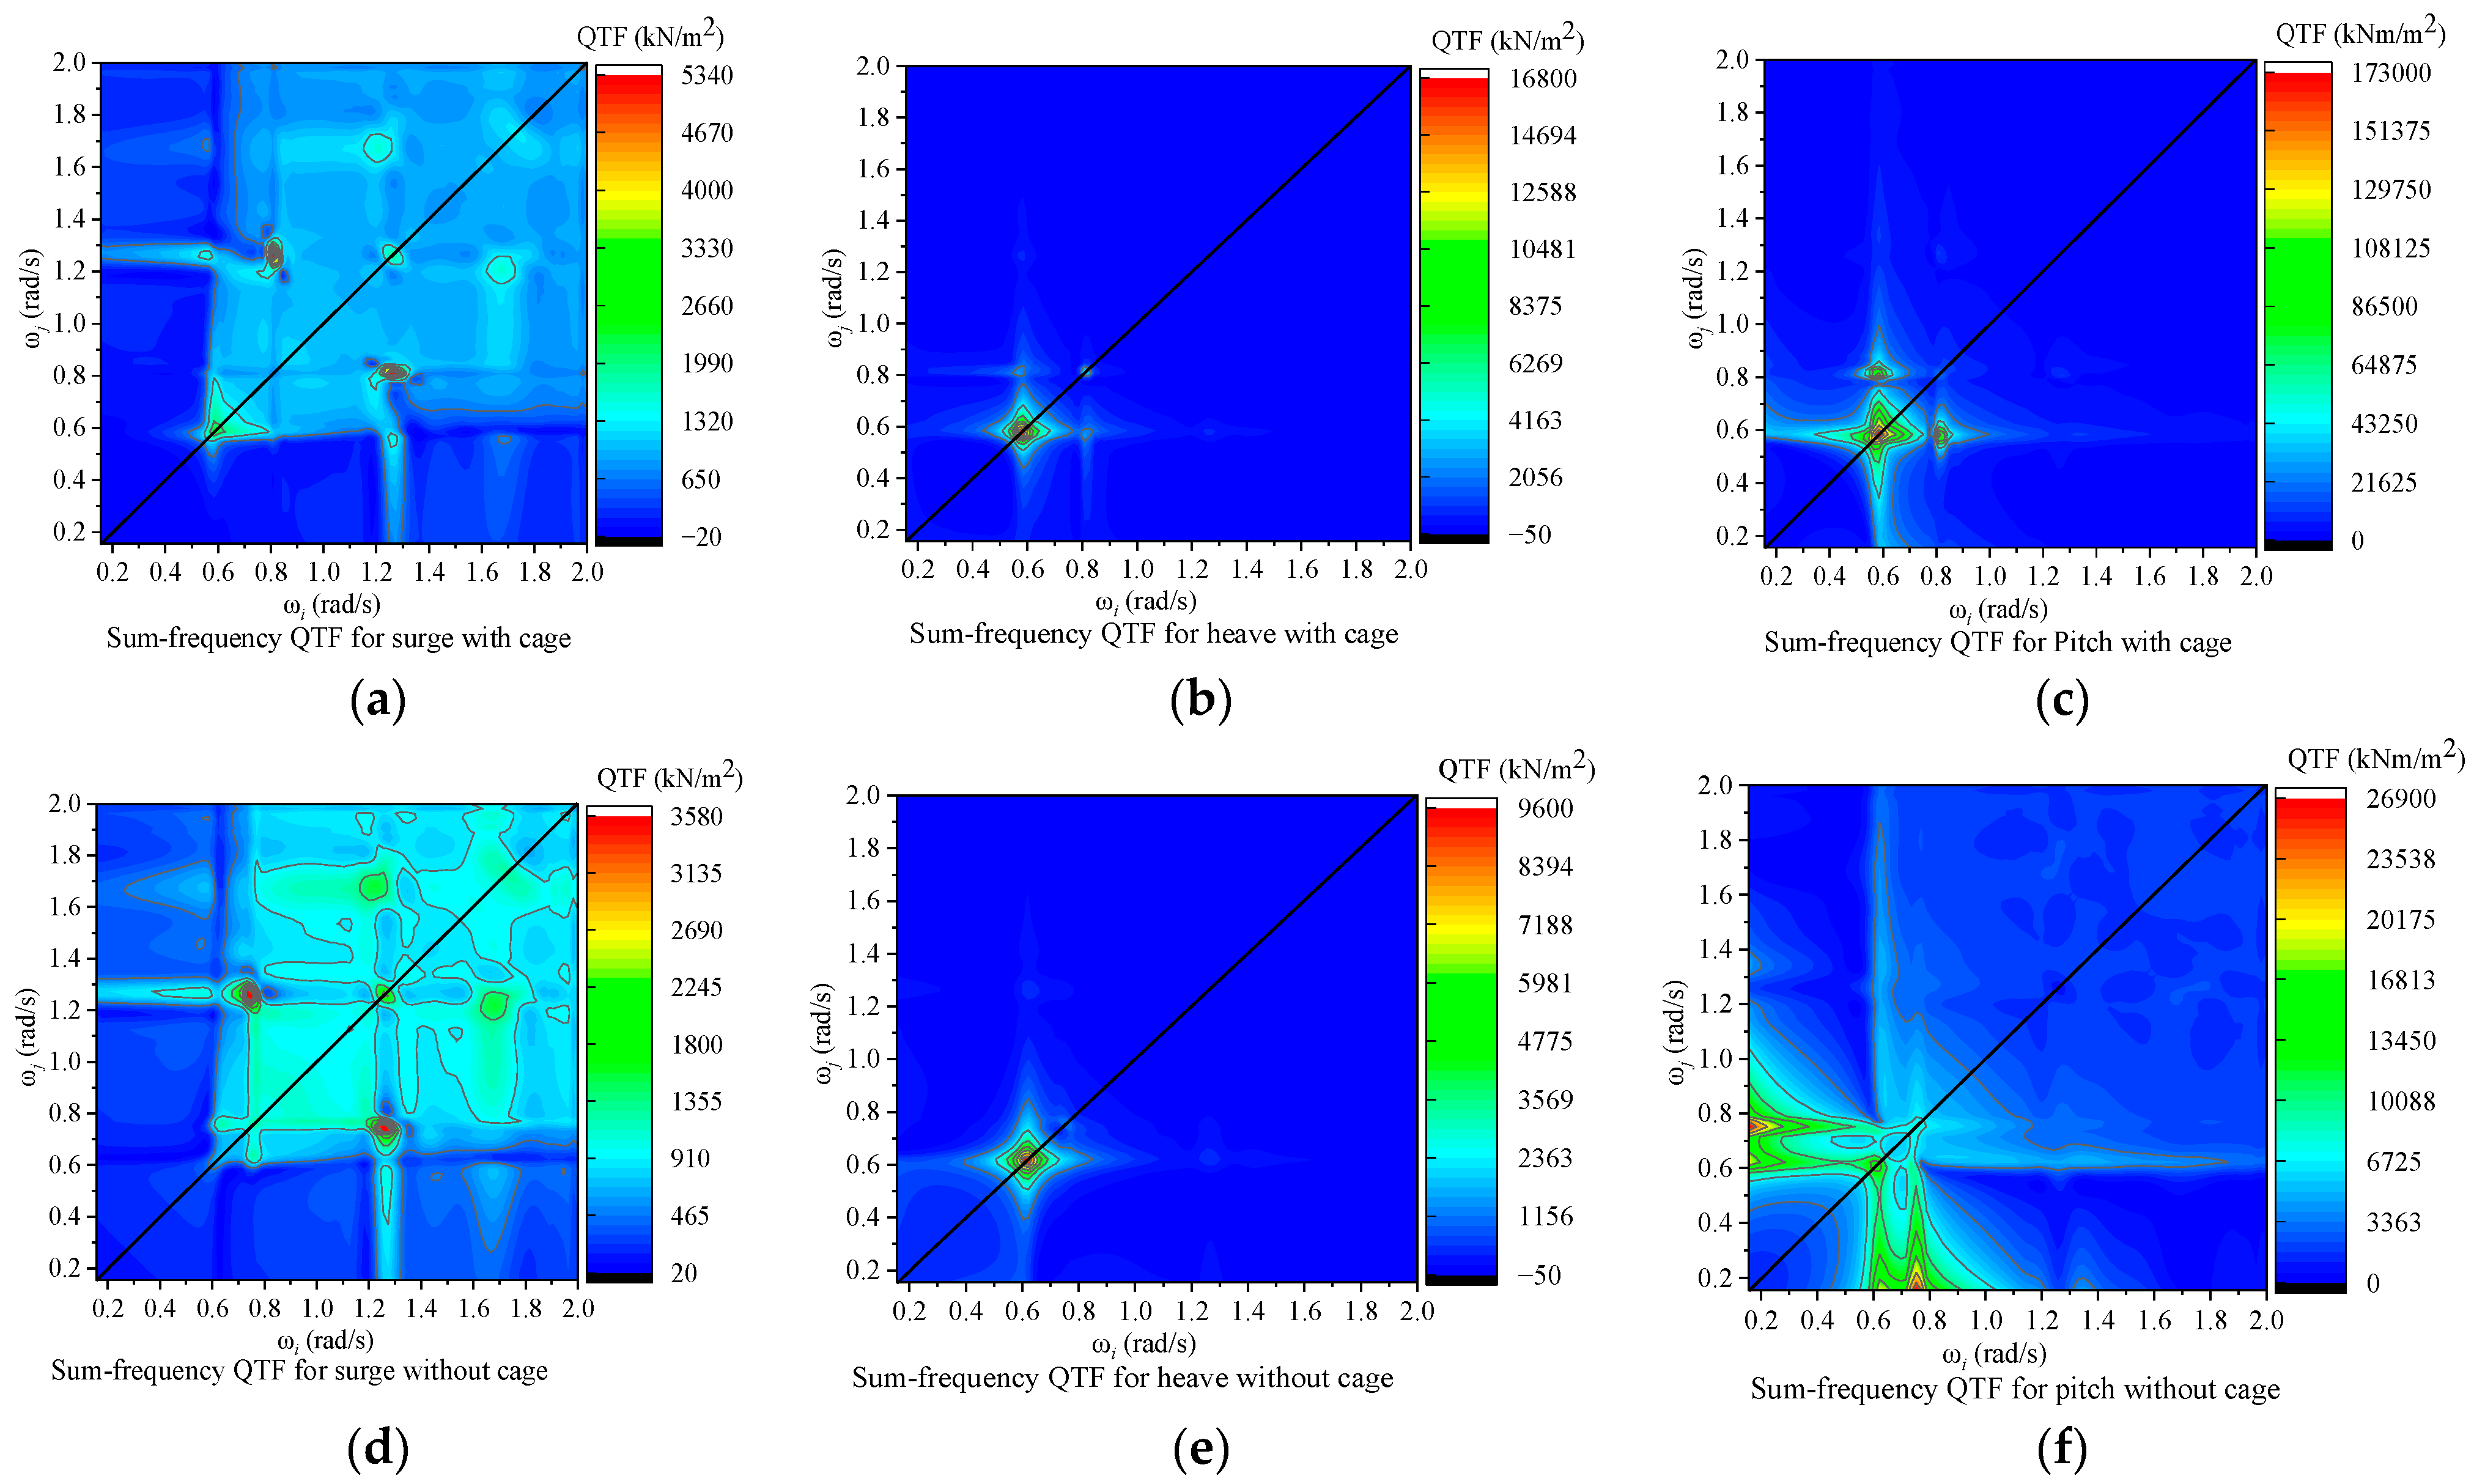
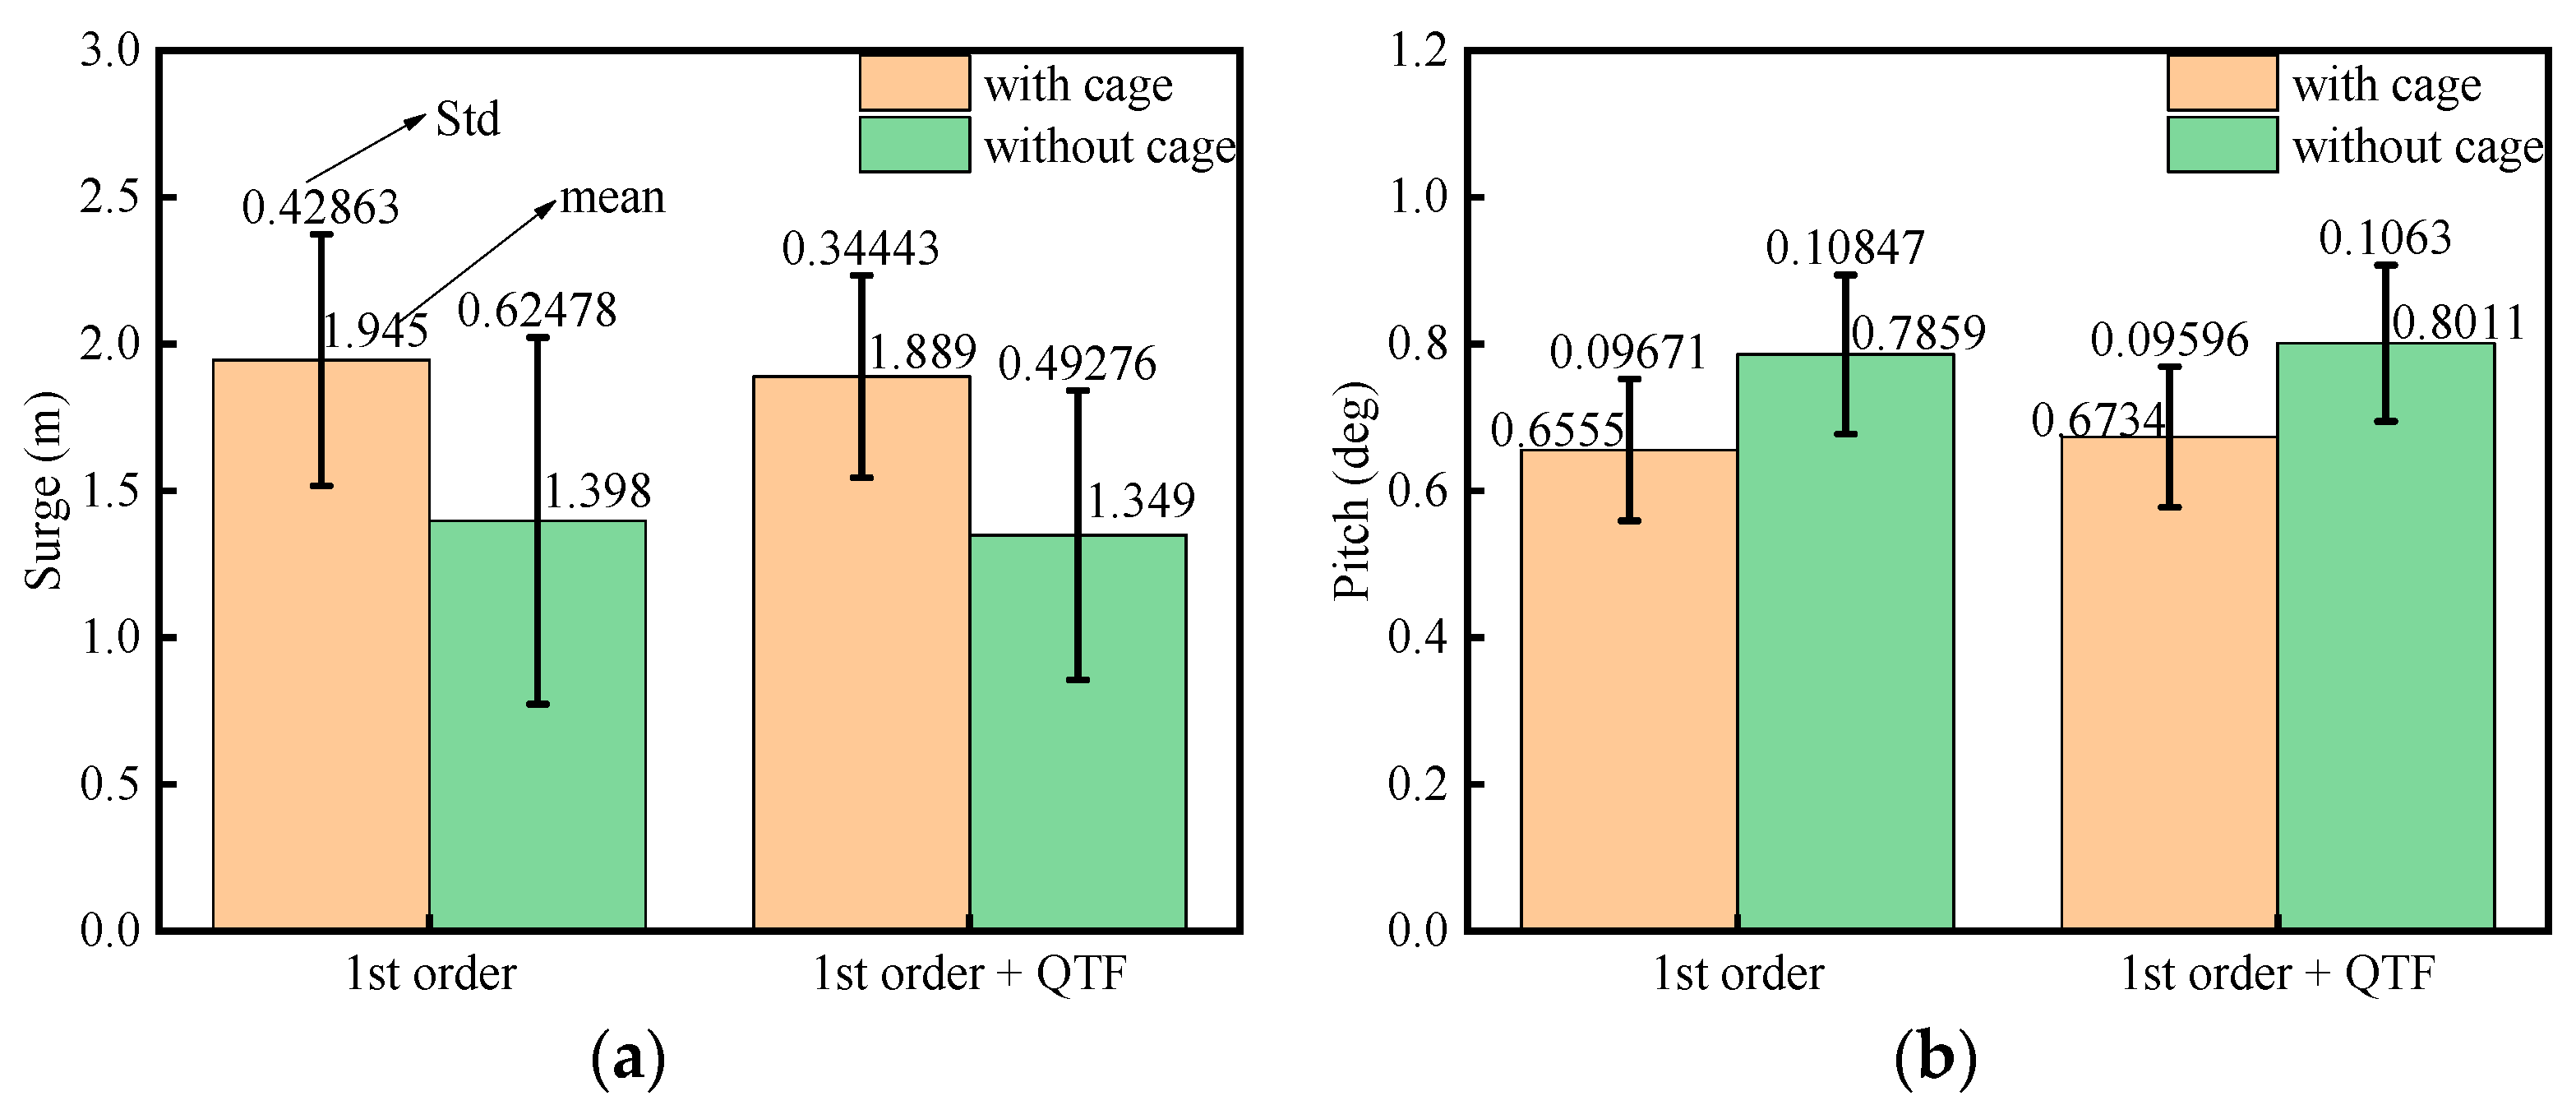
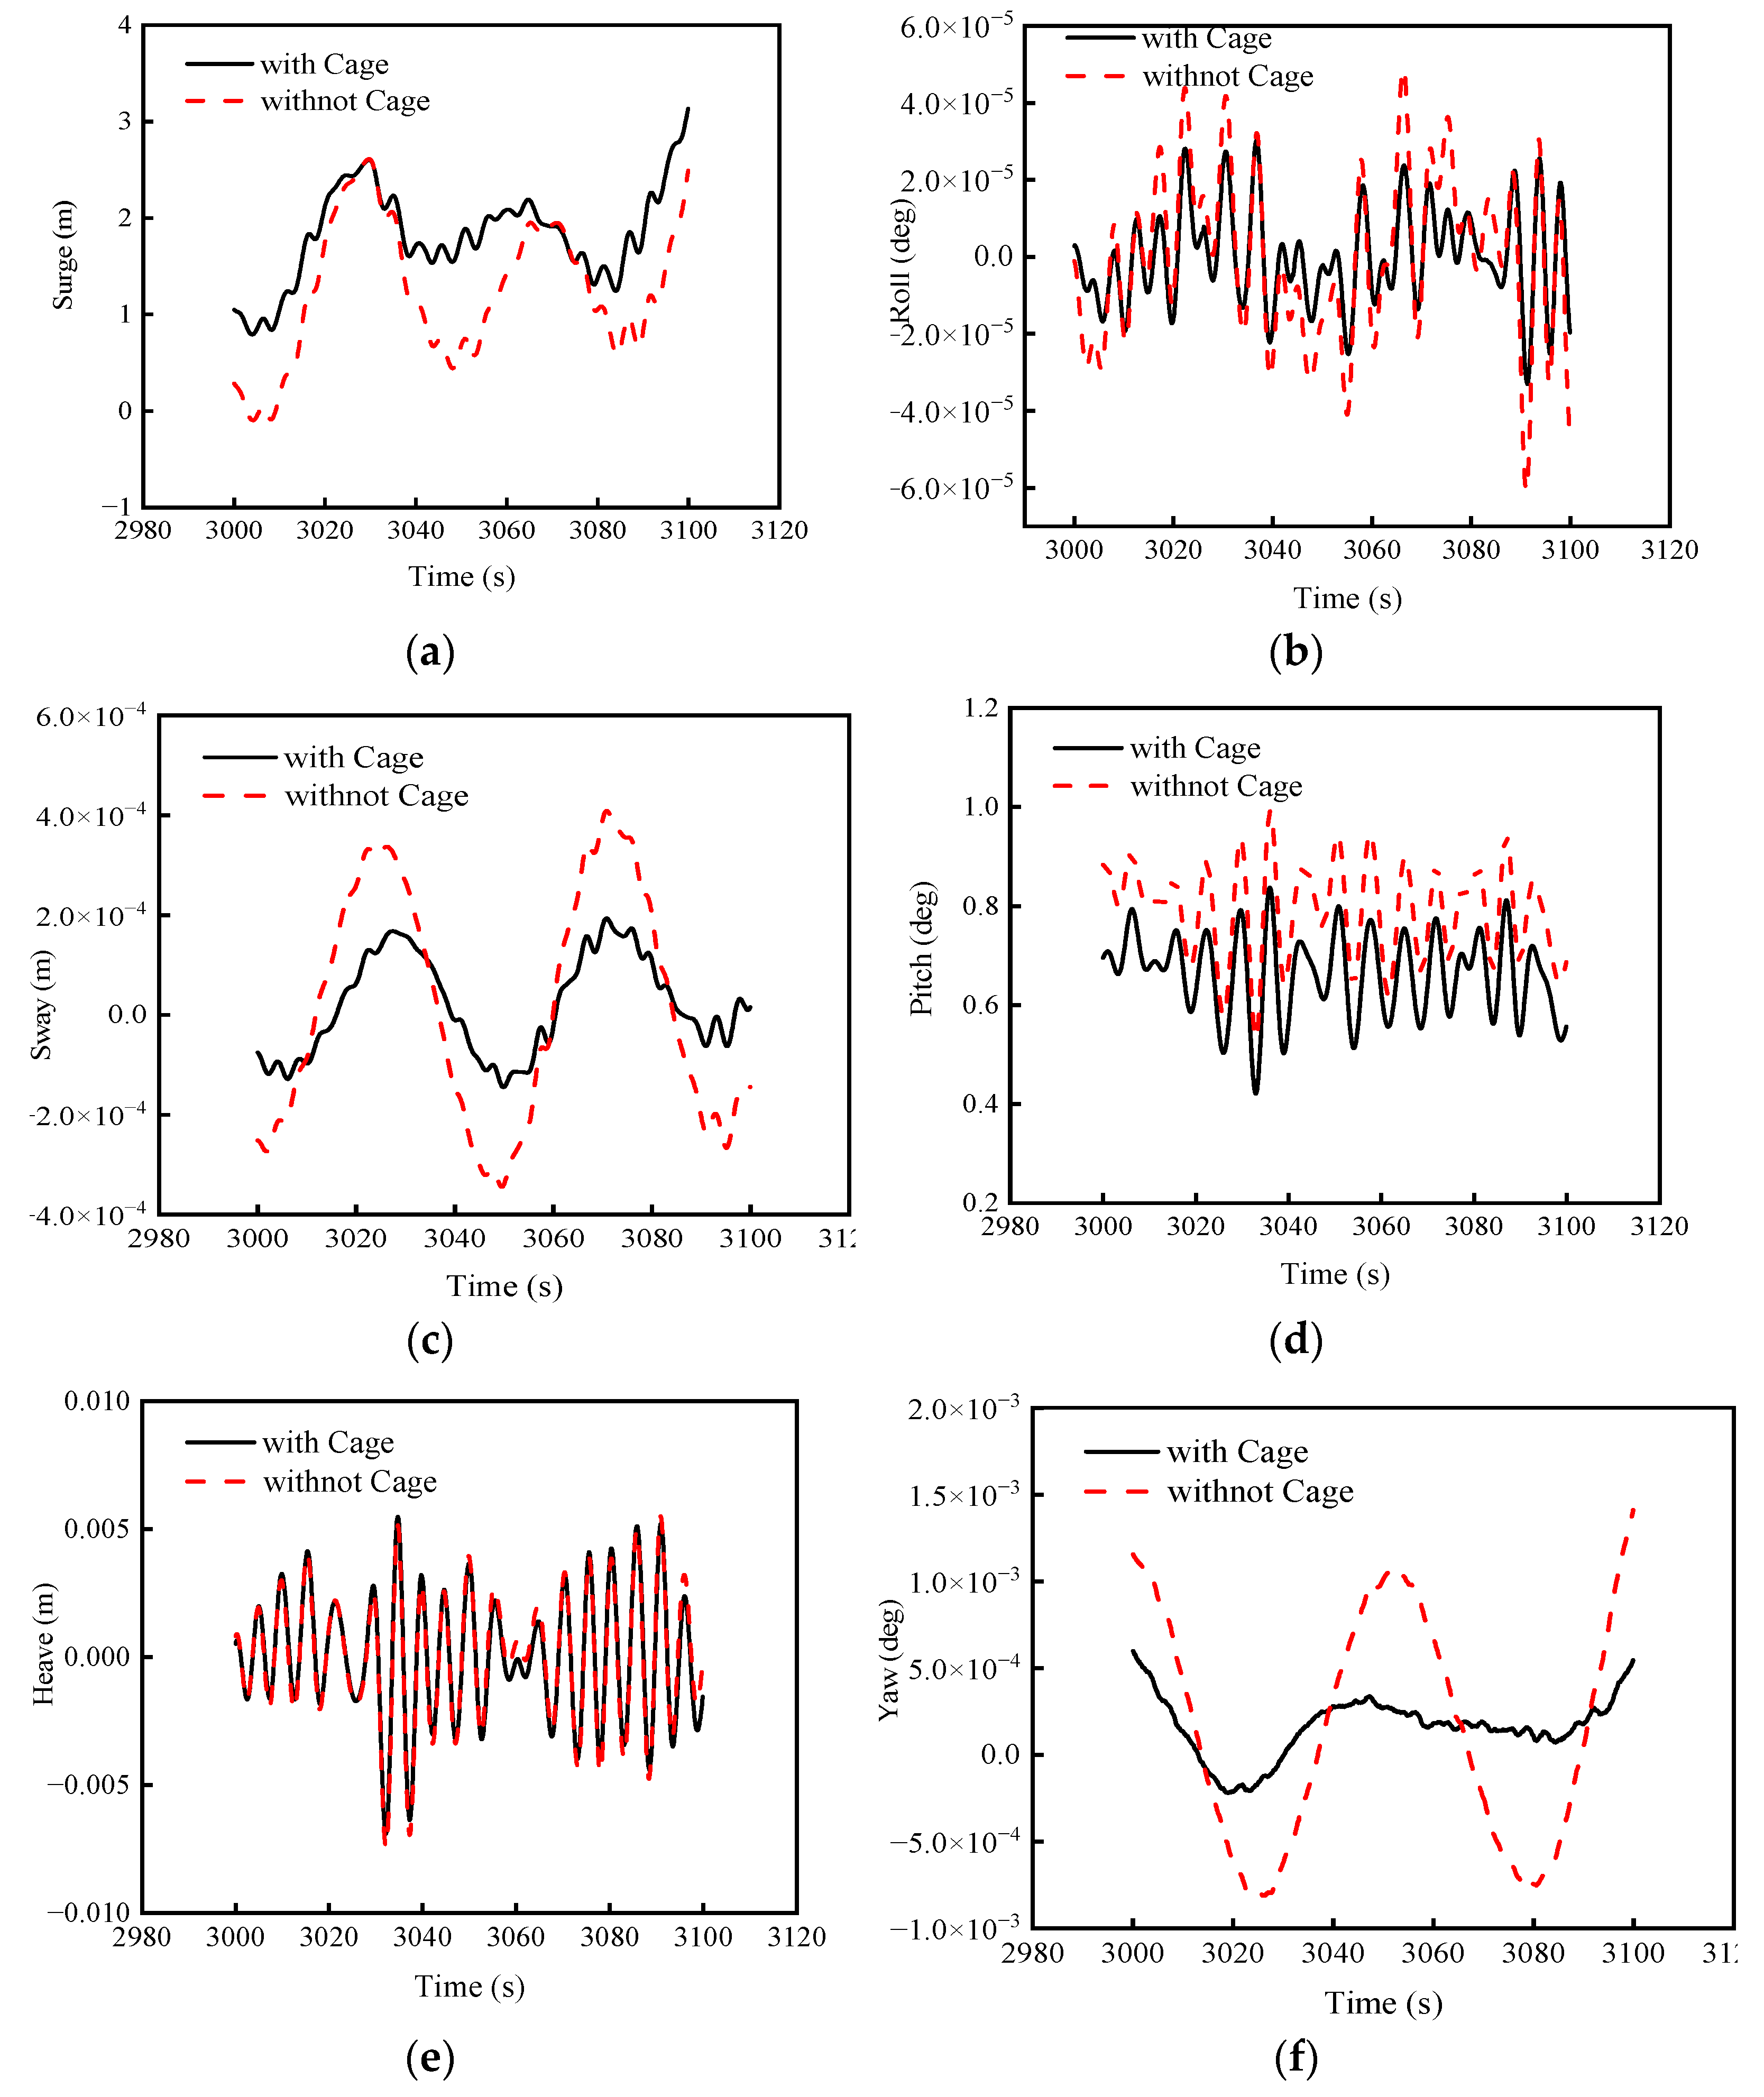
4.1. Effect of Second-Order Wave Loads on Motion Responses of Coupled Structures
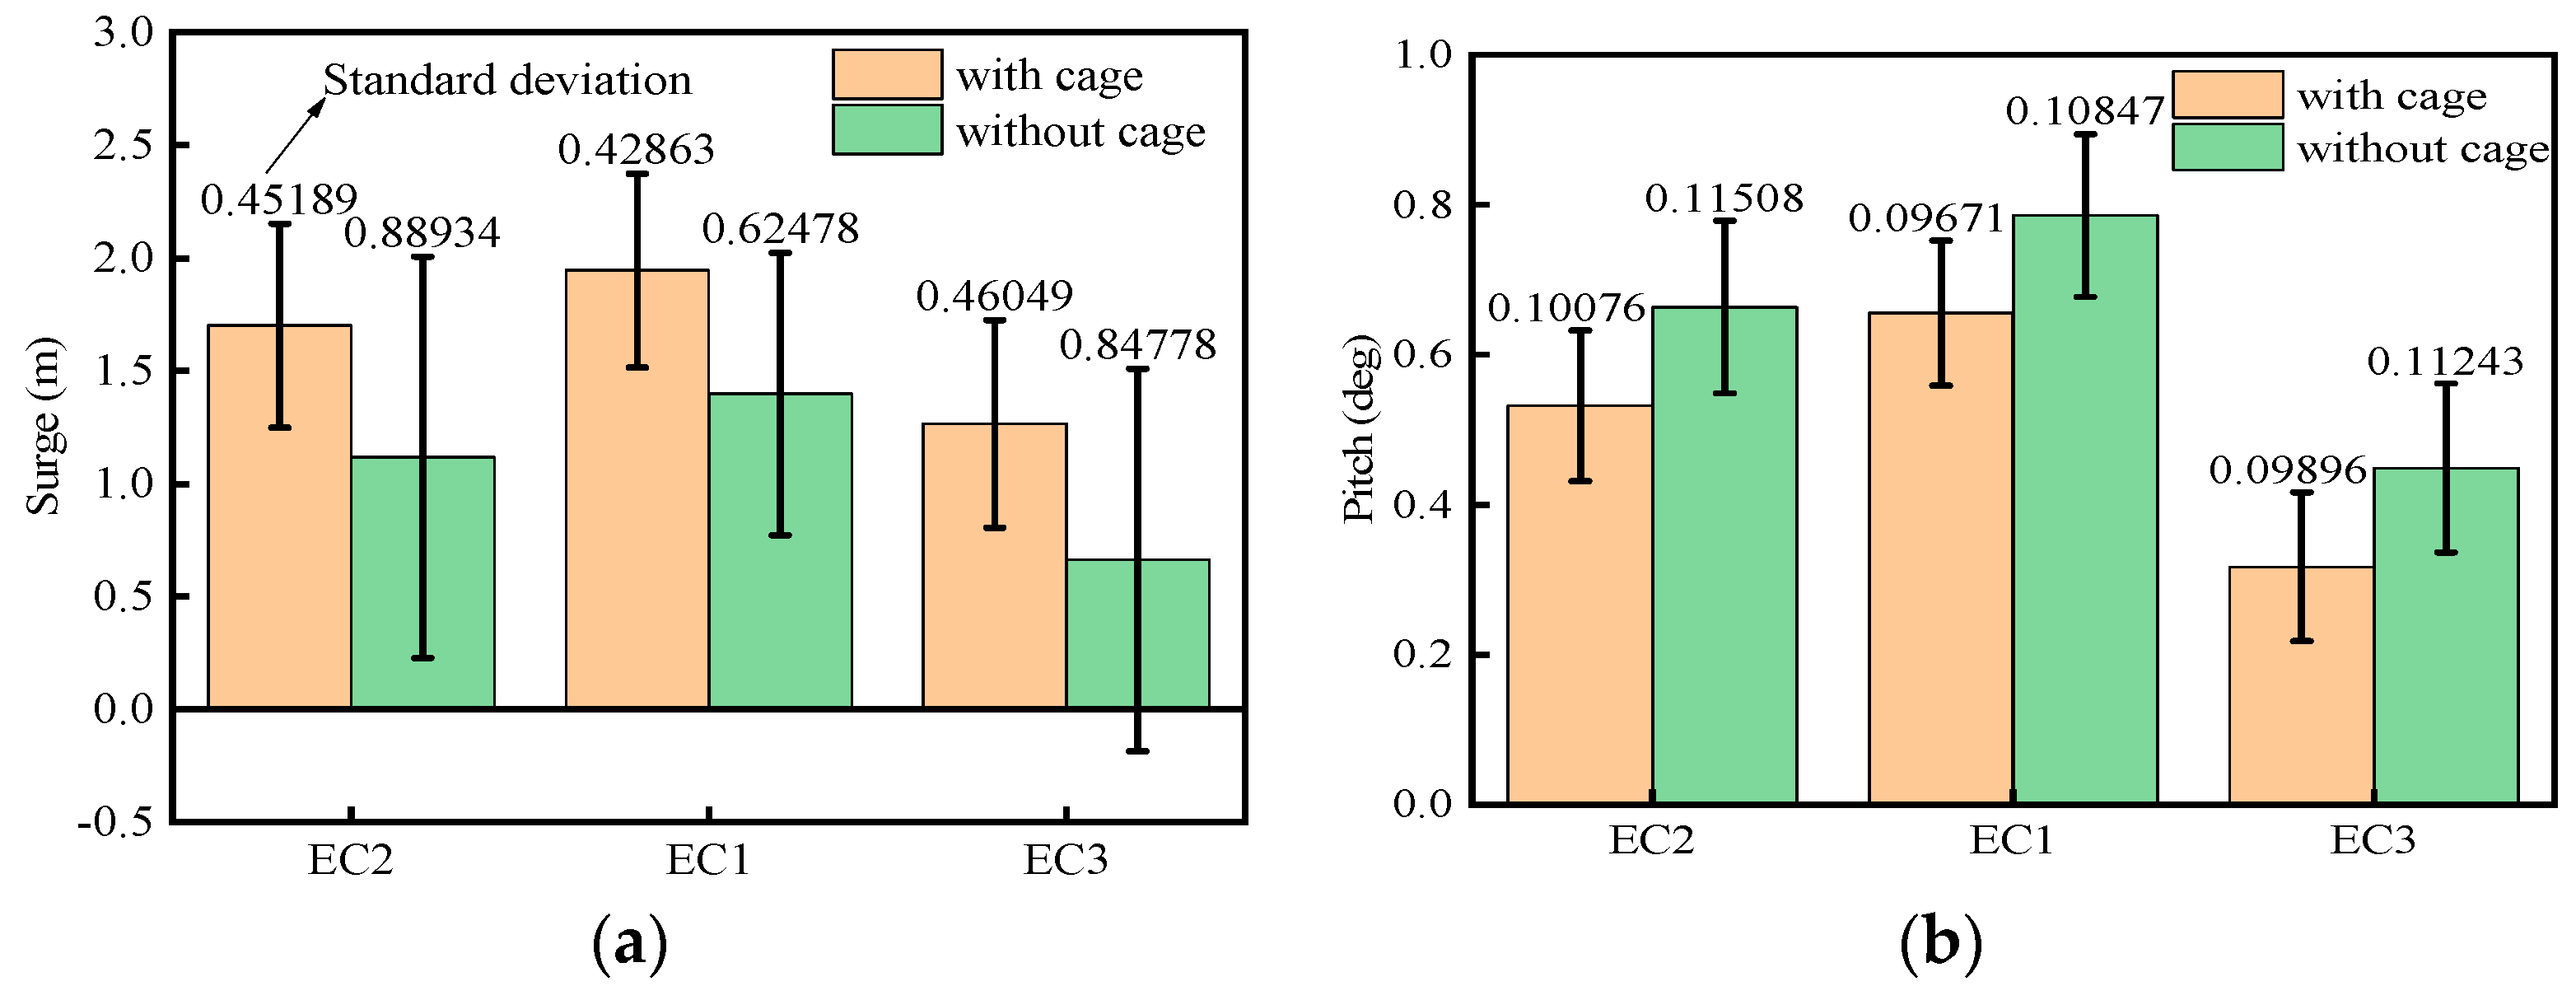
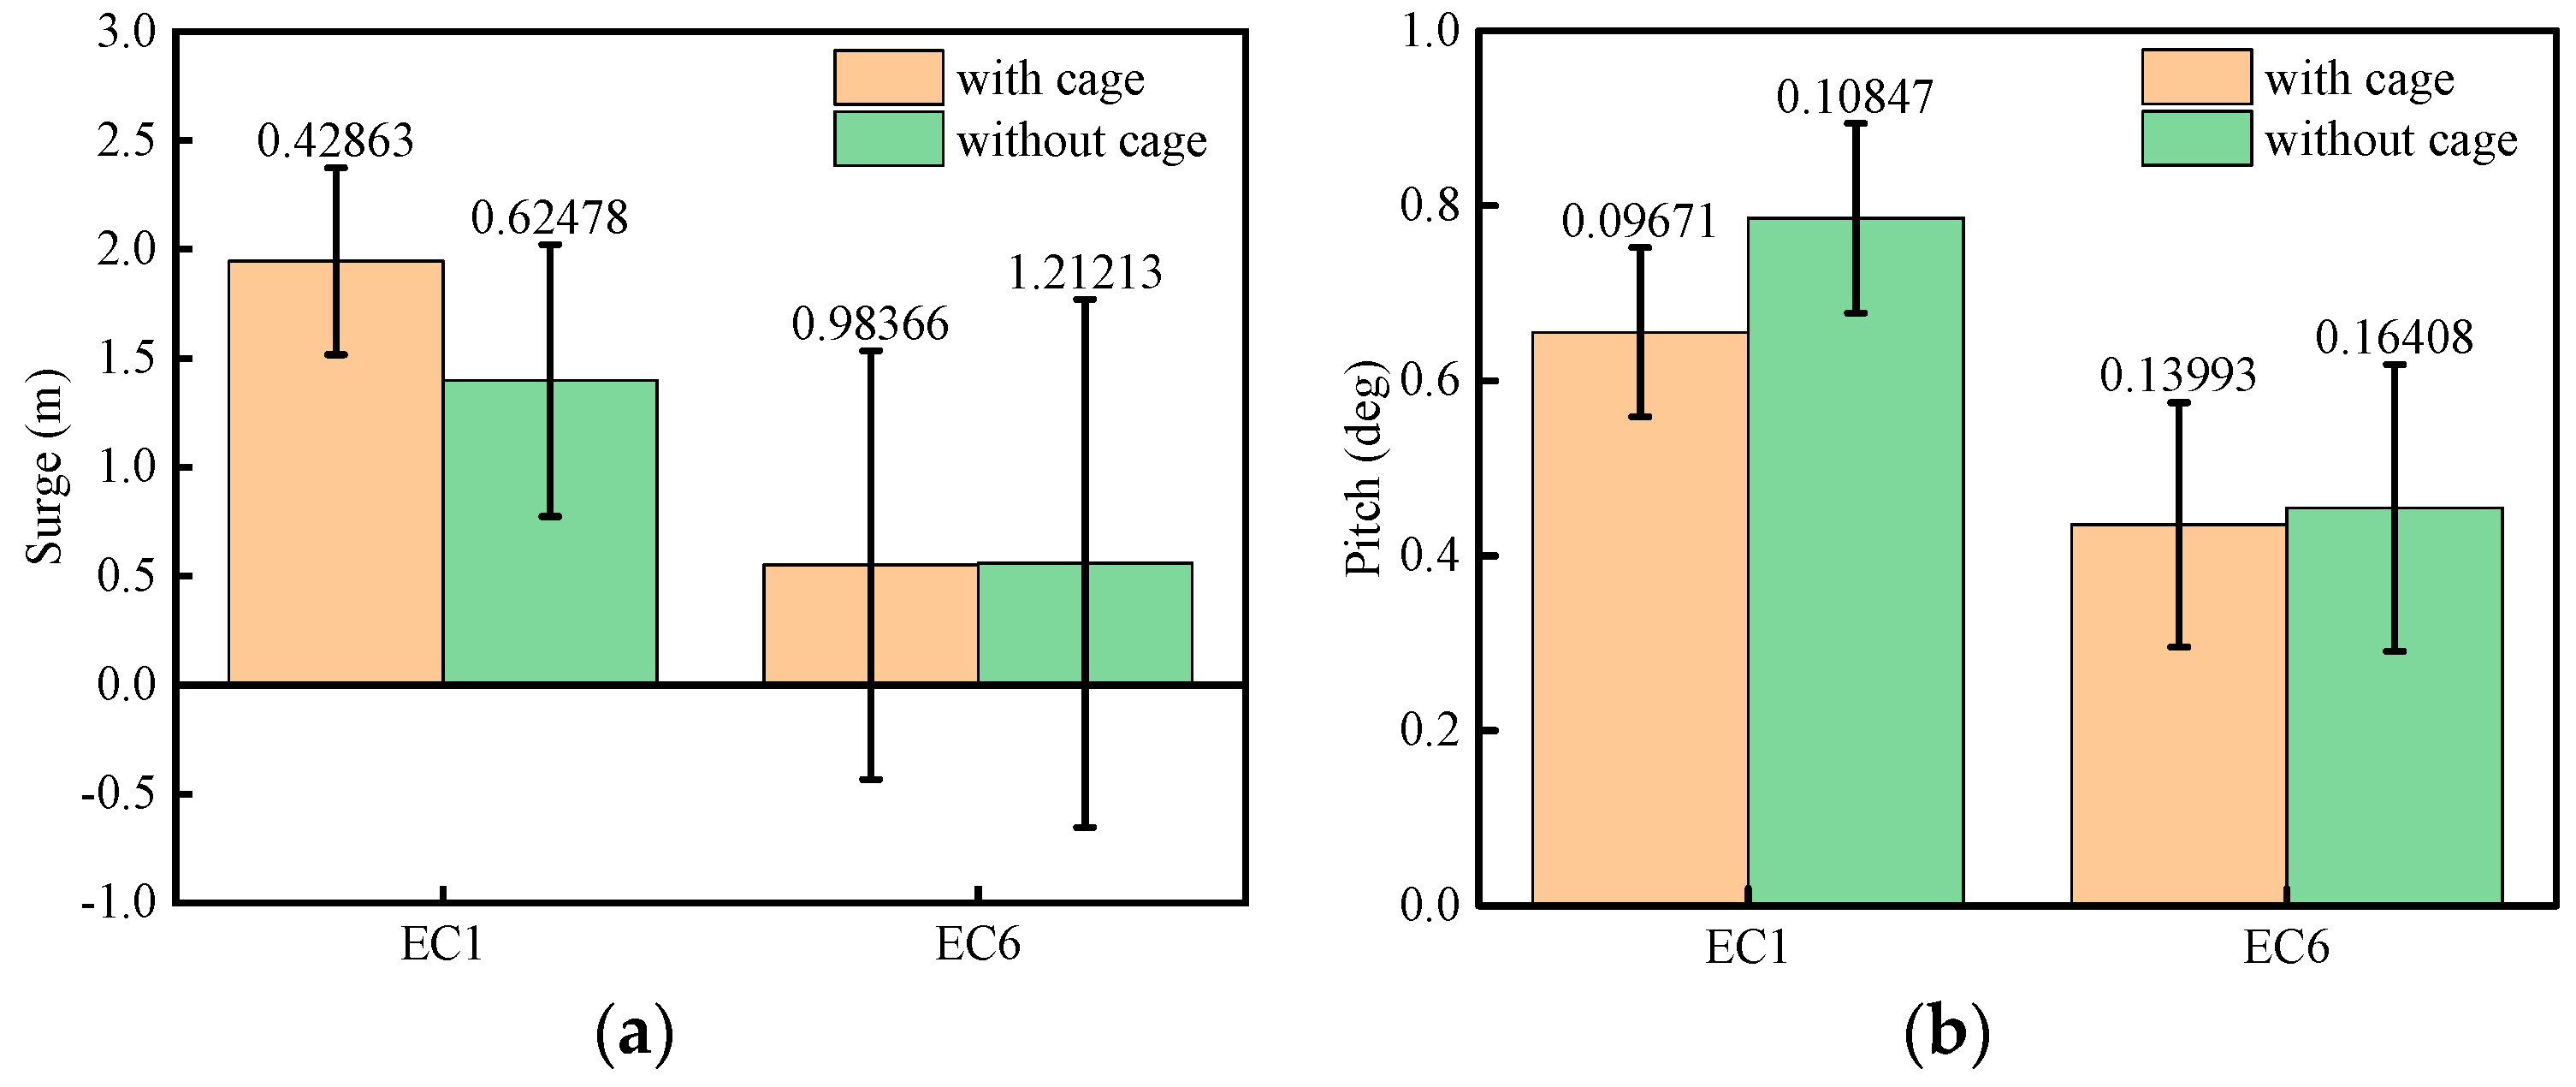
4.2. Dynamic Analysis
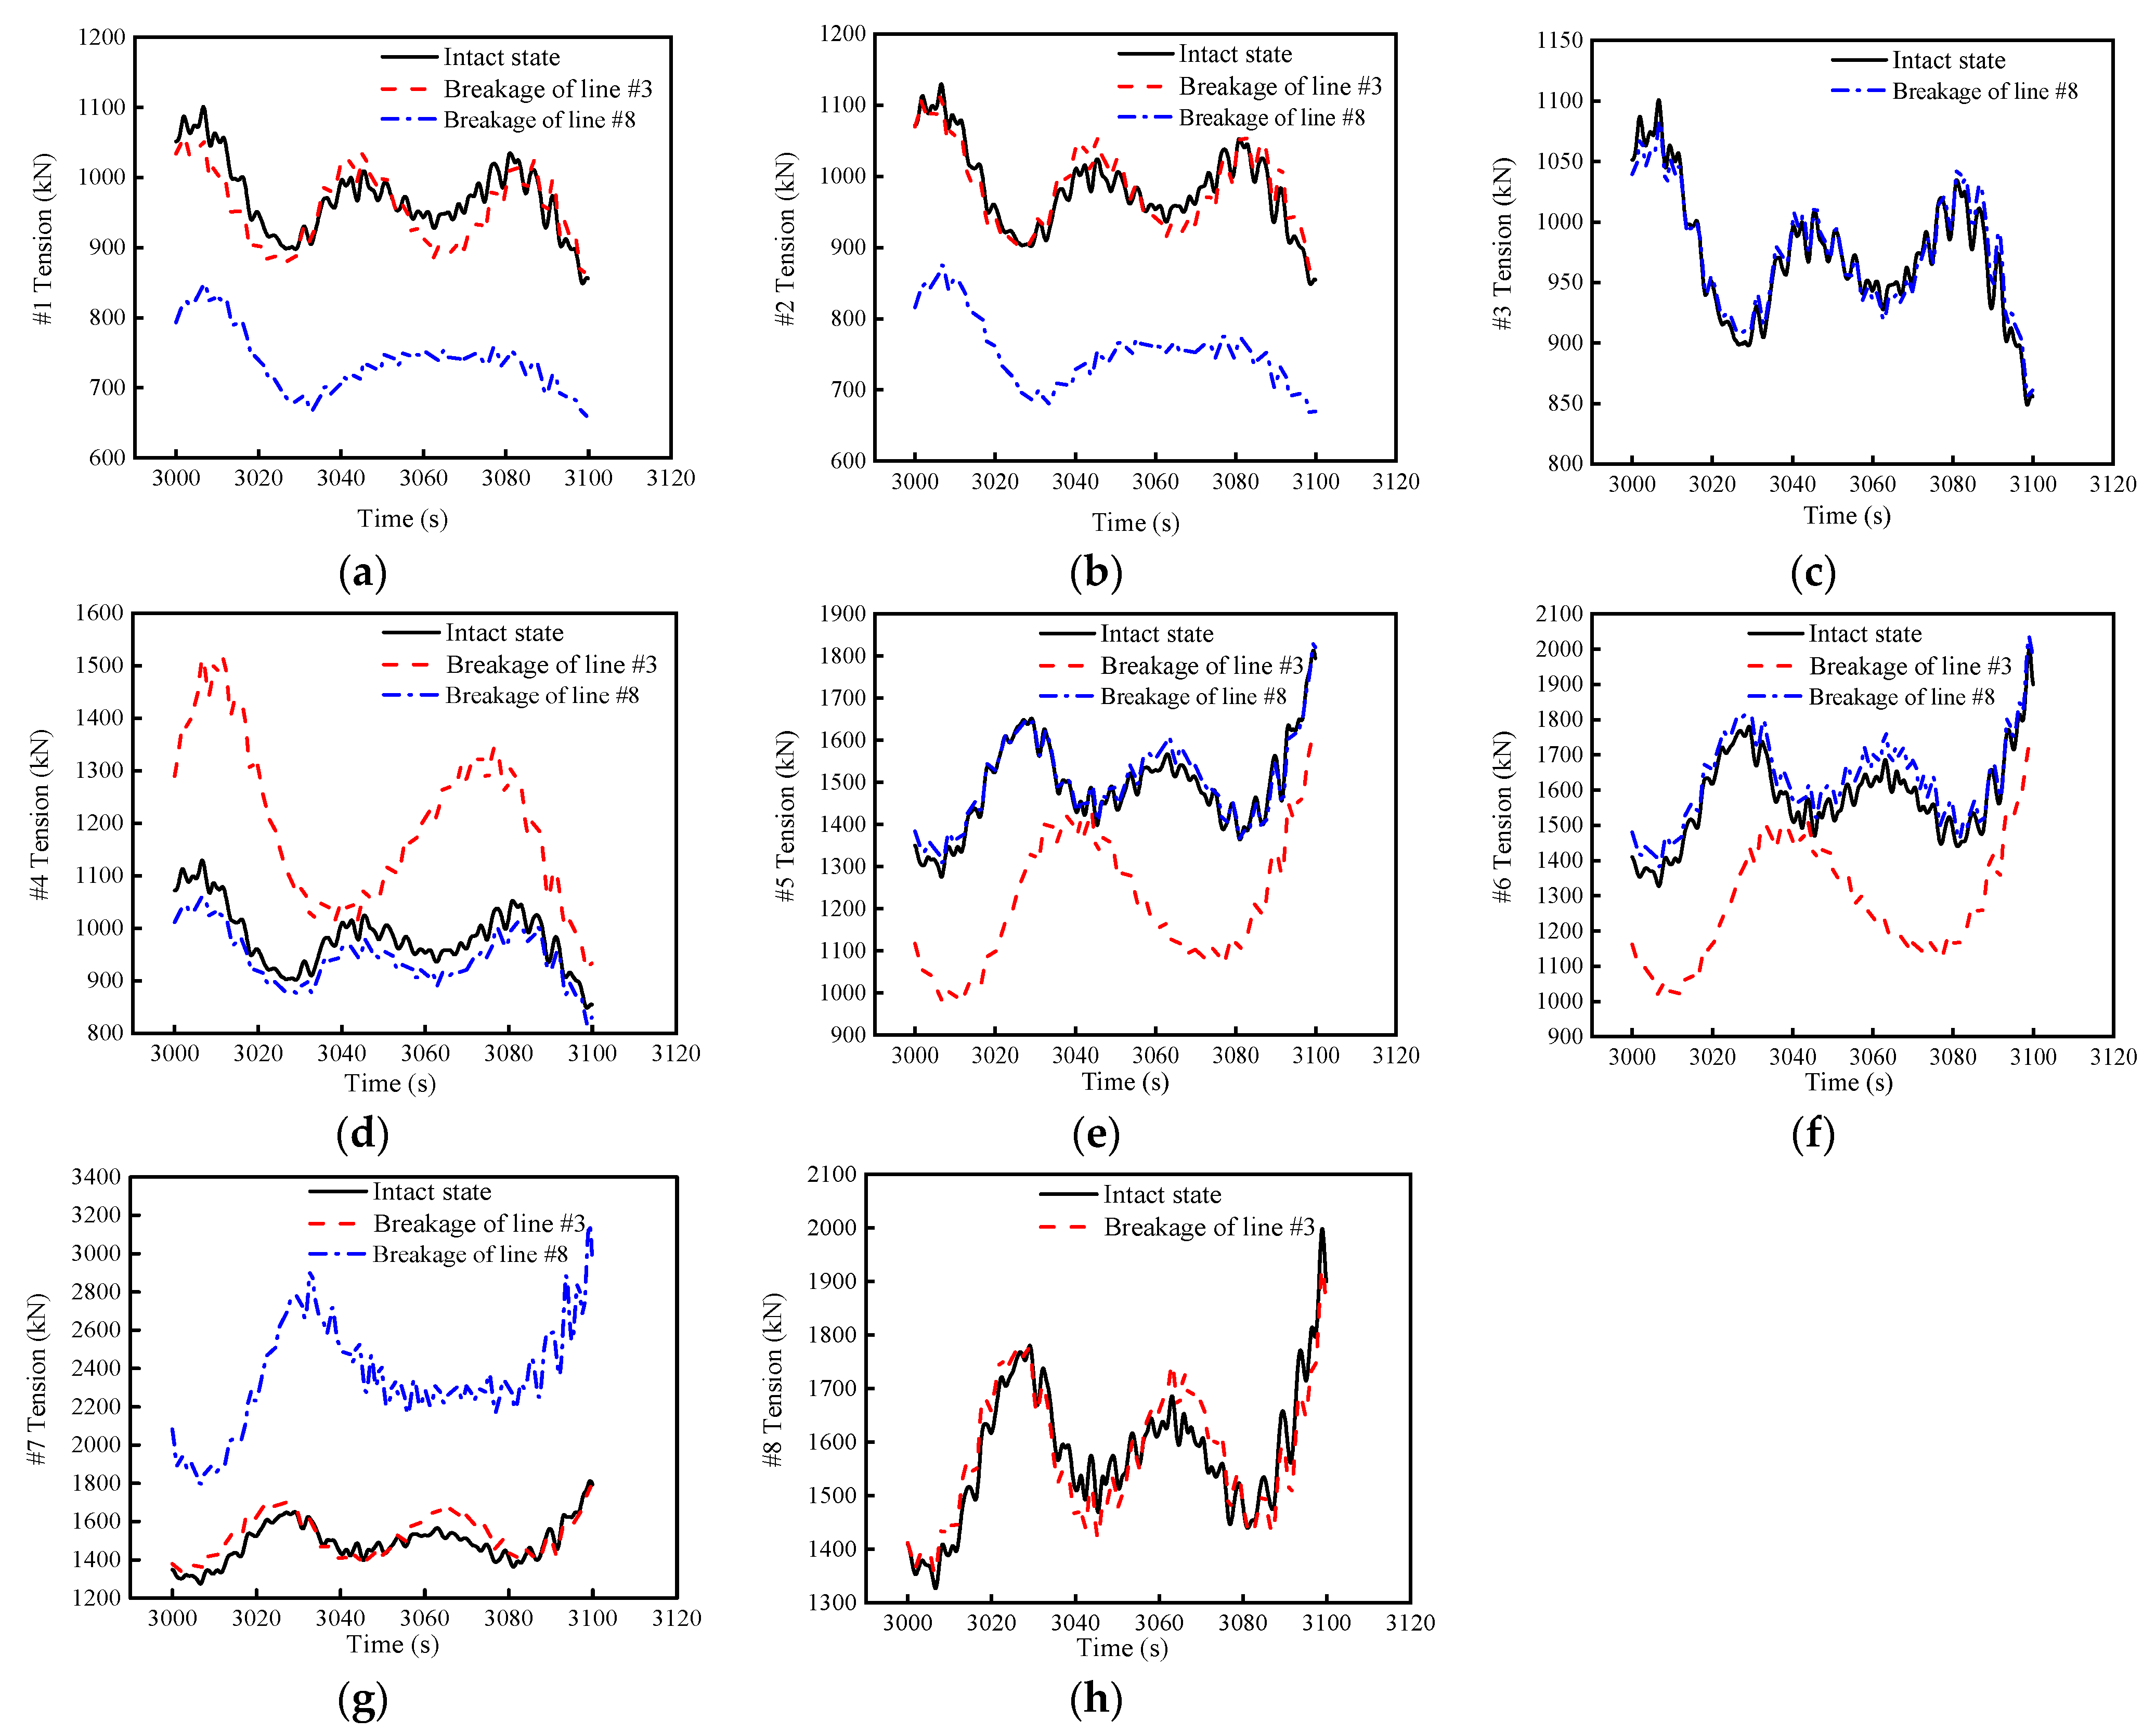
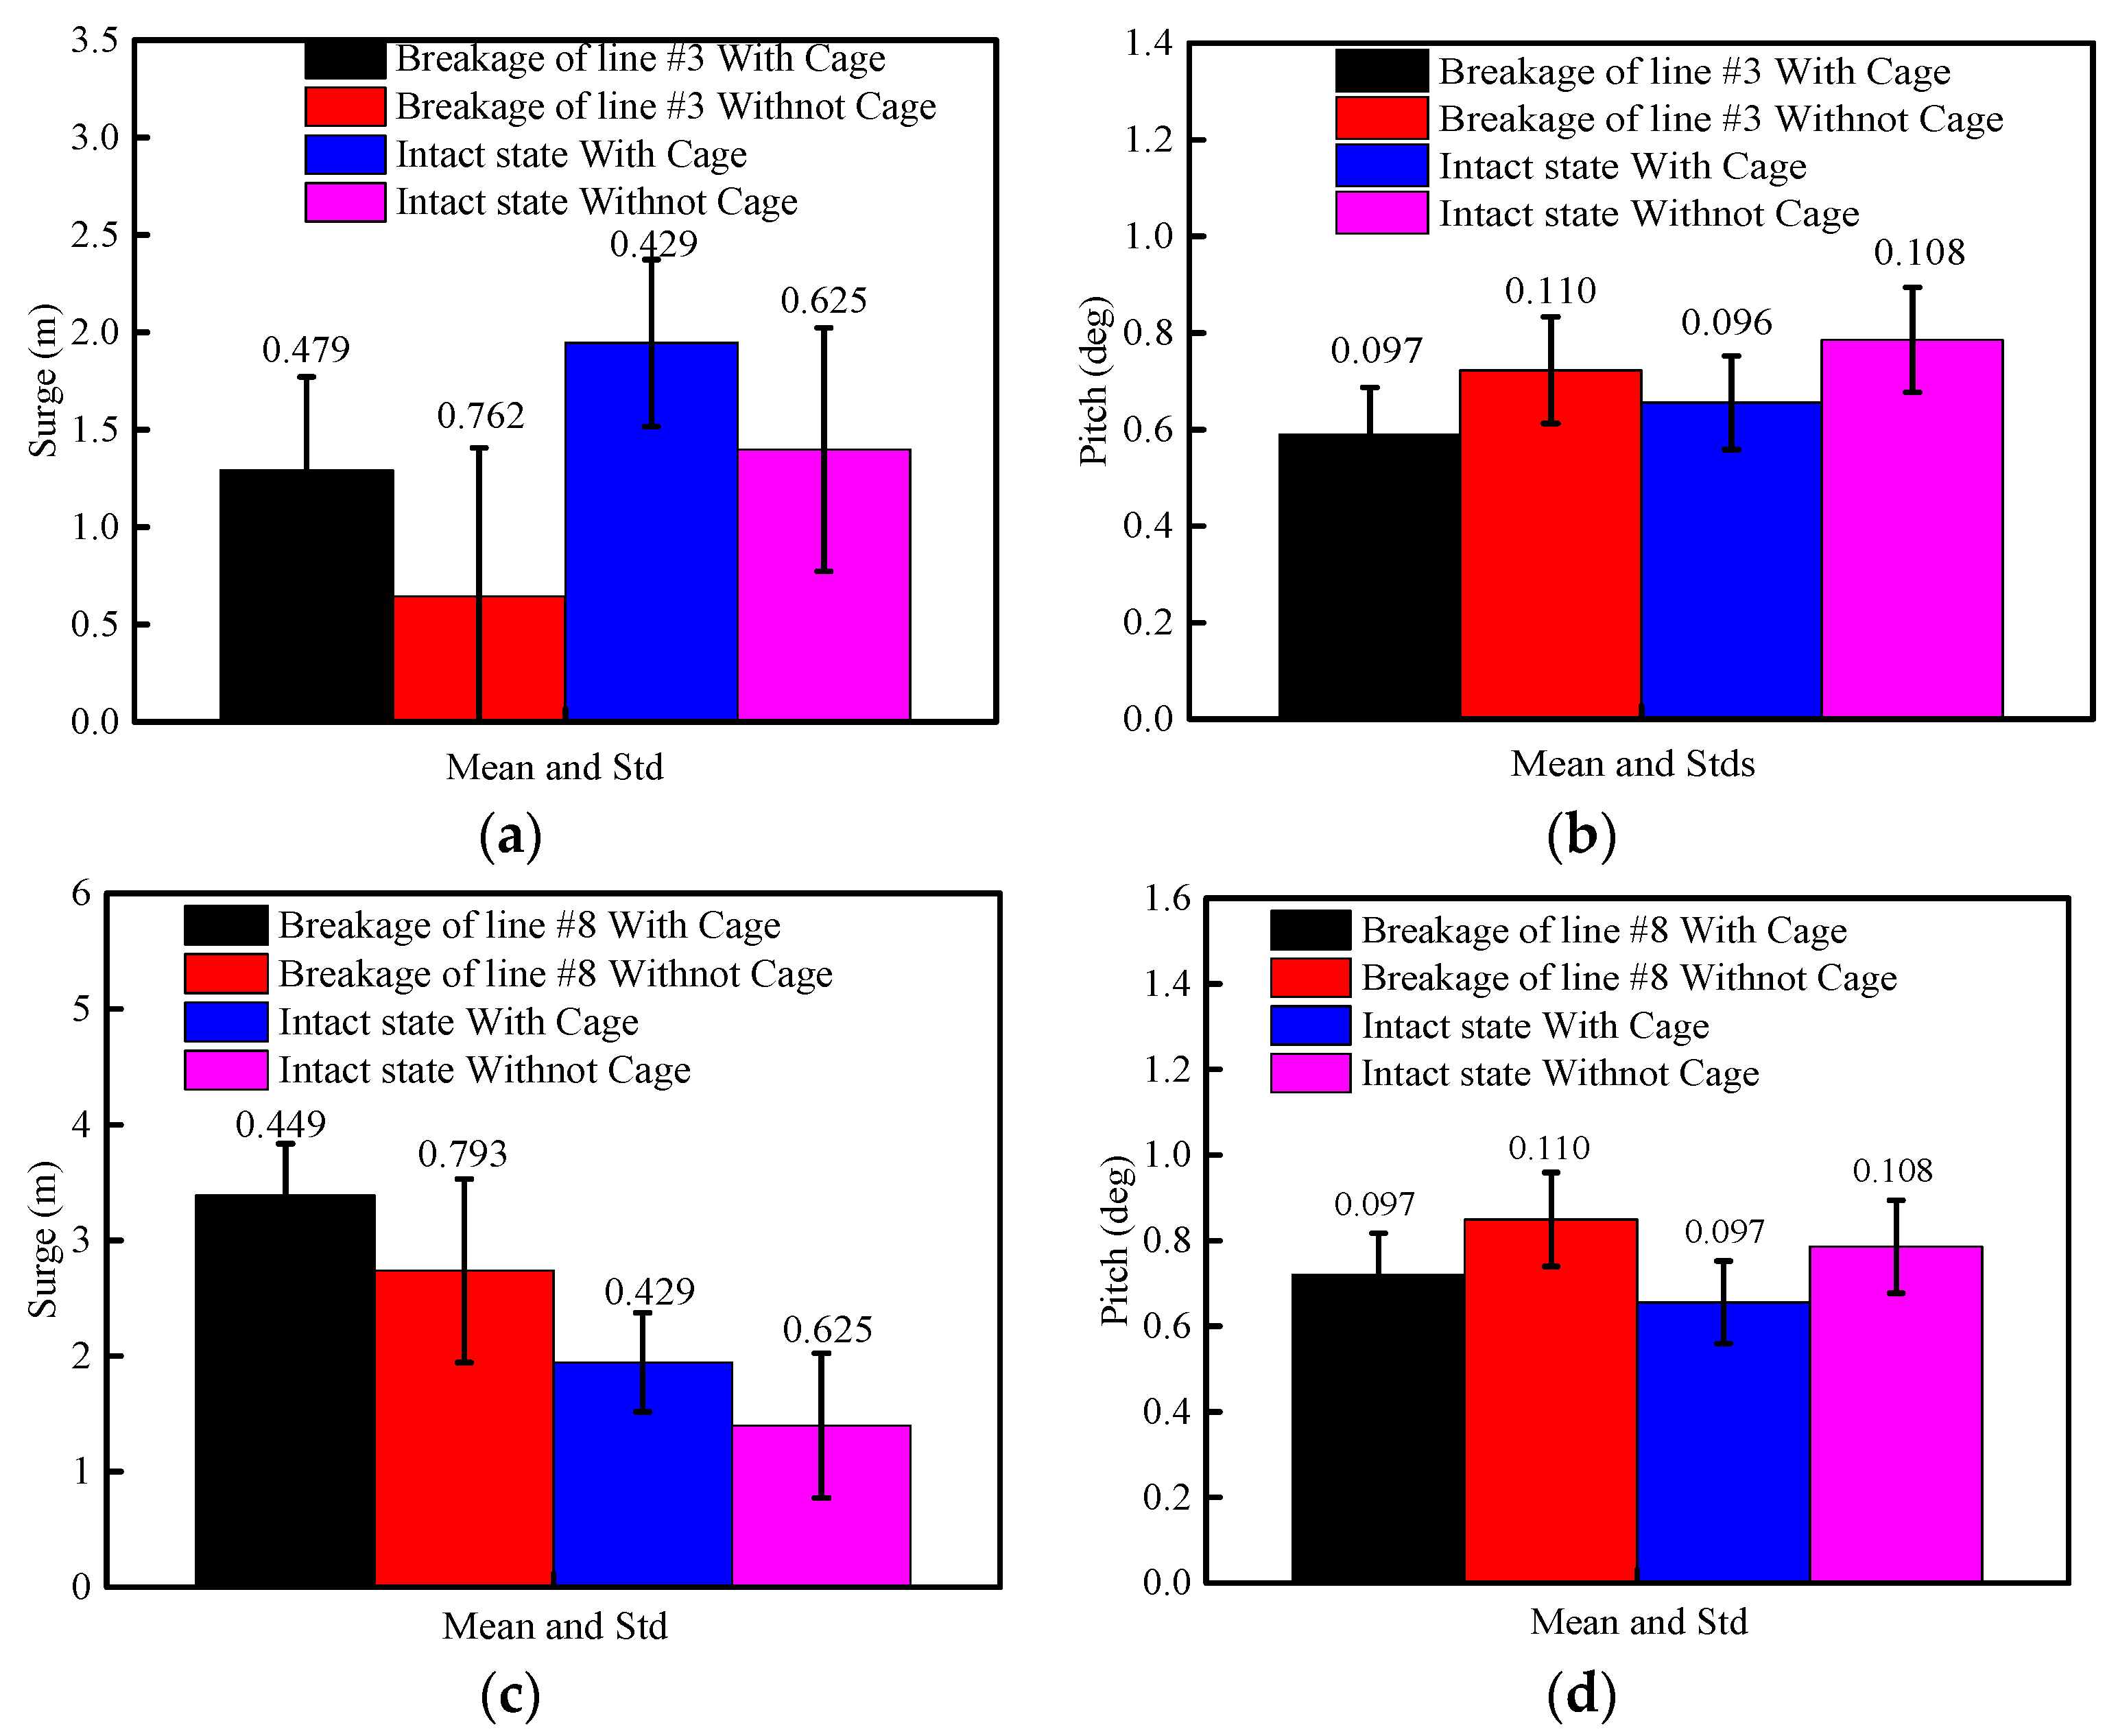
4.3. Dynamic Analysis of Coupled Structures with Mooring Line Failure
5. Conclusions
- (1)
- The presence of the aquaculture cage has improved the natural period of the heave, pitch, and roll. Except for surge, the maximum values of the motions of the barge-type FOWT-AC are smaller than barge-type FOWT. There is a reduction in the standard deviation of the motion response due to the presence of the aquaculture cage. Therefore, the barge-type FOWT-AC is generally more stable during normal operation.
- (2)
- The effect of second-order wave excitation on the dynamic responses of floating structures is considered in detail, and it is noted that the differential-frequency relative to the sum-frequency has a larger range of effects on the coupled structure. Because the second-order wave loads are not of the same order of magnitude as the first-order wave loads, they have little effect on the motion response of the coupled structures when the structural resonance is not induced.
- (3)
- By comparing the influence of the presence or absence of currents, it can be concluded that the presence of currents has a strong influence on the dynamic response of coupled structures, making the motion response increase significantly because of the increasing of the external loads on the barge-type FOWT-AC. The surge motion of the barge-type FOWT-AC can even reach up to 3.54 times greater when the current is 1 m/s than when there is no current, so the effect of currents cannot be neglected in the hydrodynamic analysis.
- (4)
- The breakage of one mooring line causes less tension on its diagonal mooring lines, more tension on the other mooring line at the same fairlead, and little change in tension on the remaining mooring lines. When the upstream mooring line breaks, it has a greater effect on the motion response of the coupled structure and the mooring tension than the accident of downstream mooring line breakage. More importantly, compared to barge-type FOWT, the standard deviation of the barge-type FOWT-AC is smaller and relatively more stable after mooring line breakage.
6. Future Work
Author Contributions
Funding
Institutional Review Board Statement
Informed Consent Statement
Data Availability Statement
Conflicts of Interest
References
- Cao, Q.; Xiao, L.; Cheng, Z.; Liu, M. An Experimental Study on Dynamic Behavior of a New Concept of 10 MW Semi-Submersible Wind Turbine. Ocean. Eng. 2020, 232, 109138. [Google Scholar] [CrossRef]
- Leble, V.; Barakos, G. Demonstration of a Coupled Floating Offshore Wind Turbine Analysis with High-Fidelity Methods. J. Fluids Struct. 2016, 62, 272–293. [Google Scholar] [CrossRef] [Green Version]
- Oguz, E.; Clelland, D.; Day, A.H.; Incecik, A.; López, J.A.; Sánchez, G.; Almeria, G.G. Experimental and Numerical Analysis of a TLP Floating Offshore Wind Turbine. Ocean Eng. 2018, 147, 591–605. [Google Scholar] [CrossRef] [Green Version]
- Ding, Q.; Chun, L.I.; Cheng, X.; Zhou, Y.E. Performance of Barge Platform for Floating Wind Turbines. J. Univ. Shanghai Sci. Technol. 2015, 5, 425–432. [Google Scholar]
- Li, J.; Tang, Y.; Yeung, R.W. Effects of Second-Order Difference-Frequency Wave Forces on a New Floating Platform for an Offshore Wind Turbine. J. Renew. Sustain. Energy 2014, 6, 033102. [Google Scholar]
- Jonkman, J. Definition of the Floating System for Phase IV of OC3; No. NREL/TP-500-47535; National Renewable Energy Lab. (NREL): Golden, CO, USA, 2010.
- Robertson, A.; Jonkman, J.; Masciola, M.; Song, H.; Goupee, A.; Coulling, A.; Luan, C. Definition of the Semisubmersible Floating System for Phase II of OC4; No. NREL/TP-5000-60601; National Renewable Energy Lab. (NREL): Golden, CO, USA, 2014.
- Ren, Y.; Vengatesan, V.; Shi, W. Dynamic Analysis of a Multi-column TLP Floating Offshore Wind Turbine with Tendon Failure Scenarios. Ocean Eng. 2022, 245, 110472. [Google Scholar] [CrossRef]
- Ikoma, T.; Tan, L.; Moritsu, S.; Aida, Y.; Masuda, K. Motion Characteristics of a Barge-Type Floating Vertical-Axis Wind Turbine with Moonpools. Ocean Eng. 2021, 230, 109006. [Google Scholar] [CrossRef]
- Anagnostopoulos, S.A. Dynamic response of offshore platforms to extreme waves including fluid-structure interaction. Eng. Struct. 1982, 4, 179–185. [Google Scholar] [CrossRef]
- Istrati, D.; Buckle, I. G: Effect of fluid-structure interaction on connection forces in bridges due to tsunami loads. In Proceedings of the 30th US-Japan Bridge Engineering Workshop, Washington, DC, USA, 21–23 October 2014. [Google Scholar]
- Utsunomiya, T.; Yoshida, S.; Ookubo, H.; Sato, I.; Ishida, S. Dynamic Analysis of a Floating Offshore Wind Turbine Under Extreme Environmental Conditions. J. Offshore Mech. Arct. Eng. 2014, 136, 21901. [Google Scholar] [CrossRef]
- Chen, J.; Hu, Z.; Fei, D. Comparisons of Dynamical Characteristics of a 5 MW Floating Wind Turbine Supported by a Spar-buoy and a Semi-submersible using Model Testing Methods. J. Renew. Sustain. Energy 2018, 10, 053311. [Google Scholar] [CrossRef] [Green Version]
- Cao, Q.; Xiao, L.; Guo, X.; Liu, M. Second-Order Responses of a Conceptual Semi-Submersible 10 MW Wind Turbine Using Full Quadratic Transfer Functions. Renew. Energy 2020, 153, 653–668. [Google Scholar] [CrossRef]
- Choisnet, T.; Favre, M.; Lyubimova, M.; Rogier, E. A Robust Concrete Floating Wind Turbine Foundation for Worldwide Applications. In Proceedings of the Grand Renewable Energy Conference, Tokyo, Japan, 27 July–1 August 2014; p. O-WdOc-2-7. [Google Scholar]
- Chuang, T.; Yang, W.; Yang, R. Experimental and Numerical Study of a Barge-Type FOWT Platform Under Wind and Wave Load. Ocean Eng. 2021, 230, 109015. [Google Scholar] [CrossRef]
- Peng, Z.; Zhao, H.; Li, X. New ductile fracture model for fracture prediction ranging from negative to high stress triaxiality. Int. J. Plast. 2021, 145, 103057. [Google Scholar] [CrossRef]
- Zhao, H.; Lie, S.; Zhang, Y. Fracture assessment of mismatched girth welds in oval-shaped clad pipes subjected to bending moment. Int. J. Press. Vessel. Pip. 2018, 160, 1–13. [Google Scholar] [CrossRef]
- Zhao, H.; Lie, S.; Zhang, Y. Fatigue assessment of cracked pipes with weld misalignment by using stress intensity factors. Int. J. Fatigue 2018, 116, 192–209. [Google Scholar] [CrossRef]
- Yang, Y.; Bashir, M.; Li, C.; Wang, J. Investigation on Mooring Breakage Effects of a 5 MW Barge-Type Floating Offshore Wind Turbine Using F2A. Ocean Eng. 2021, 233, 108887. [Google Scholar] [CrossRef]
- Zhao, Y.; Guan, C.; Bi, C.; Liu, H.; Cui, Y. Experimental Investigations on Hydrodynamic Responses of a Semi-Submersible Offshore Fish Farm in Waves. J. Mar. Sci. Eng. 2019, 7, 238. [Google Scholar] [CrossRef] [Green Version]
- Li, L.; Ong, M.C. A Preliminary Study of a Rigid Semi-Submersible Fish Farm for Open Seas. In Proceedings of the ASME 2017 36th International Conference on Ocean, Offshore and Arctic Engineering, Trondheim, Norway, 25–30 June 2017; American Society of Mechanical Engineers: New York, NY, USA, 2017; p. V009T12A044. [Google Scholar]
- Jin, J.; Su, B.; Dou, R.; Luan, C.; Gao, Z. Numerical Modelling of Hydrodynamic Responses of Ocean Farm 1 in Waves and Current and Validation Against Model Test Measurements. Mar. Struct. 2021, 78, 103017. [Google Scholar] [CrossRef]
- Moe, H.; Fredheim, A.; Hopperstad, O.S. Structural Analysis of Aquaculture Net Cages in Current. J. Fluids Struct. 2010, 26, 503–516. [Google Scholar] [CrossRef]
- Xu, T.J.; Dong, G.H.; Zhao, Y.P.; Li, Y.C.; Gui, F.K. Analysis of Hydrodynamic Behaviors of Gravity Net Cage in Irregular Waves. Ocean Eng. 2011, 38, 1545–1554. [Google Scholar] [CrossRef]
- He, W.; Yttervik, R.; Olsen, G.P.; Ostvik, I.; Jimenez, C.; Impelluso, T.; Schouten, J.; Bellotti, G. A Case Study of Multi-Use Platform: Aquaculture in Offshore Wind Farms. Poster no 54, EWEA Offshore 2015 Copenhagen, 10–12 March 2015. Available online: https://www.vliz.be/projects/mermaidproject/images/PDFs/EWEA_PO054_FinalSubmission15022015.pdf (accessed on 27 April 2022).
- Lei, Y.; Zhao, S.X.; Zheng, X.Y.; Li, W. Effects of Fish Nets on the Nonlinear Dynamic Performance of a Floating Offshore Wind Turbine Integrated with a Steel Fish Farming Cage. Int. J. Struct. Stab. Dyn. 2020, 3, 2050042. [Google Scholar] [CrossRef]
- Chu, Y.I.; Wang, C.M. Hydrodynamic Response Analysis of Combined Spar Wind Turbine and Fish Cage for Offshore Fish Farms. Int. J. Struct. Stab. Dyn. 2020, 9, 2050104. [Google Scholar] [CrossRef]
- Liang, L.; Ruzzo, C.; Collu, M.; Gao, Y.; Arena, F. Analysis of the Coupled Dynamic Response of an Offshore Floating Multi-Purpose Platform for the Blue Economy. Ocean Eng. 2020, 217, 107943. [Google Scholar]
- Wang, Y.; Shi, W.; Michailides, C.; Wan, L.; Kim, H.; Li, X. WEC shape effect on the motion response and power performance of a combined wind-wave energy converter. Ocean Eng. 2022, 250, 111038. [Google Scholar] [CrossRef]
- Li, L.; Collu, M.; Ruzzo, C.; Failla, G.; Abhinav, K.A.; Arena, F. Analysis of the Coupled Dynamics of an Offshore Floating Multi-Purpose Platform: Part A—Rigid Body Analysis. In Proceedings of the International Conference on Offshore Mechanics and Arctic Engineering, Scotland, UK, 9–14 June 2019; American Society of Mechanical Engineers: New York, NY, USA, 2019. [Google Scholar]
- Abhinav, K.; Collu, M.; Ke, S.; Binzhen, Z. Frequency domain analysis of a hybrid aquaculture-wind turbine offshore floating system. In Proceedings of the ASME 2019 38th International Conference on Ocean, Offshore and Arctic Engineering, Scotland, UK, 9–14 June 2019; American Society of Mechanical Engineers: New York, NY, USA, 2019. [Google Scholar]
- Zheng, X.; Zheng, H.; Lei, Y.; Li, Y.; Wei, L. An offshore floating wind–solar–aquaculture system: Concept design and extreme response in survival conditions. Energies 2020, 13, 604. [Google Scholar] [CrossRef] [Green Version]
- Belibassakis, K.A. A boundary element method for the hydrodynamic analysis of floating bodies in variable bathymetry regions. Eng. Anal. Bound. Elem. 2008, 32, 796–810. [Google Scholar] [CrossRef]
- Westphalen, J.; Greaves, D.M.; Raby, A.; Hu, Z.Z.; Causon, D.M.; Mingham, C.G.; Omidvar, P.; Stansby, P.K.; Rogers, B.D. Investigation of wave-structure interaction using state of the art CFD techniques. Open J. Fluid Dyn. 2014, 4, 18. [Google Scholar] [CrossRef] [Green Version]
- Ren, B.; Jin, Z.; Gao, R.; Wang, Y.X.; Xu, Z.L. SPH-DEM modeling of the hydraulic stability of 2D blocks on a slope. J. Waterw. Port Coast. Ocean. Eng. 2014, 140, 04014022. [Google Scholar] [CrossRef]
- Hasanpour, A.; Istrati, D.; Buckle, I. Coupled SPH–FEM Modeling of Tsunami-Borne Large Debris Flow and Impact on Coastal Structures. J. Mar. Sci. Eng. 2021, 9, 1068. [Google Scholar] [CrossRef]
- Tsui, Y.Y.; Huang, Y.C.; Huang, C.L.; Lin, S.W. A finite-volume-based approach for dynamic fluid-structure interaction. Numer. Heat Transf. Part B Fundam. 2013, 64, 326–349. [Google Scholar] [CrossRef]
- Xiang, T.; Istrati, D. Assessment of Extreme Wave Impact on Coastal Decks with Different Geometries via the Arbitrary Lagrangian-Eulerian Method. J. Mar. Sci. Eng. 2021, 9, 1342. [Google Scholar] [CrossRef]
- Zhao, Y.; Li, Y.; Dong, G.; Gui, F.; Wu, H. An Experimental and Numerical Study of Hydrodynamic Characteristics of Submerged Flexible Plane Nets in Waves. Aquac. Eng. 2008, 38, 16–25. [Google Scholar] [CrossRef]
- Zhao, Z.; Wang, W.; Shi, W.; Li, X. Effects of Second-Order Hydrodynamics on an Ultra-Large Semi-Submersible Floating Offshore Wind Turbine. Structures 2020, 28, 2260–2275. [Google Scholar] [CrossRef]
- Zhao, Z.; Shi, W.; Wang, W.; Qi, S.; Li, X. Dynamic analysis of a novel semi-submersible platform for a 10 MW wind turbine in intermediate water depth. Ocean Eng. 2021, 237, 109688. [Google Scholar] [CrossRef]
- Yu, M.; Hu, Z.; Xiao, L. Wind-Wave Induced Dynamic Response Analysis for Motions and Mooring Loads of a Spar-Type Offshore Floating Wind Turbine. J. Hydrodyn. 2015, 26, 865–874. [Google Scholar]
- Jonkman, J.M. Dynamics Modeling and Loads Analysis of an Offshore Floating Wind Turbine; University of Colorado at Boulder: Boulder, CO, USA, 2007. [Google Scholar]
- ANSYS. AWQA User Manual; ANSYS: Canonsburg, PA, USA, 2011. [Google Scholar]
- Nallayarasu, S.; Saravanapriya, S. Experimental and Numerical Investigation on Hydrodynamic Response of Spar with Wind Turbine Under Regular Waves. Int. J. Ocean. Clim. Syst. 2013, 4, 239–260. [Google Scholar] [CrossRef] [Green Version]
- Ruzzo, C.; Fiamma, V.; Nava, V.; Collu, M.; Failla, G.; Arena, F. Progress on the Experimental Set-Up for the Testing of a Floating Offshore Wind Turbine Scaled Model in a Field Site. Wind Eng. 2016, 40, 455–467. [Google Scholar] [CrossRef] [Green Version]
- Rajeswari, K.; Nallayarasu, S. Hydrodynamic Response of Three- and Four-Column Semi-Submersibles Supporting a Wind Turbine in Regular and Random Waves. Ships Offshore Struct. 2021, 16, 1050–1060. [Google Scholar] [CrossRef]
- DNV DNV-RP-0286; Coupled Analysis of Floating Wind Turbine. DNV: Oslo, Norway, 2019.
- Song, G.; Bin, T. Wave Elevation for an Array of Columns Under Wave–Current Interactions. J. Offshore Mech. Arct. Eng. 2022, 144, 021201. [Google Scholar] [CrossRef]
- Isaacson, M.; Baldwin, J. Wave–current effects on large offshore structures. Can. J. Civ. Eng. 1989, 16, 543–551. [Google Scholar] [CrossRef]
- Zhao, H.; Lie, S.; Zhang, Y. Elastic-plastic fracture analyses for misaligned clad pipeline containing a canoe shape surface crack subjected to large plastic deformation. Ocean Eng. 2017, 146, 87–100. [Google Scholar] [CrossRef]
- Zhao, H.; Lie, S.; Zhang, Y. Strain-based J-estimation scheme for fracture assessment of misaligned clad pipelines with an interface crack. Mar. Struct. 2018, 61, 238–255. [Google Scholar] [CrossRef]
- Peregrine, D.H.; Bredmose, H.; Bullock, G.; Obrhai, C.; Müller, G.; Wolters, G. Water wave impact on walls and the role of air. Coast. Eng. 2004, 2005, 4005–4017. [Google Scholar]
- Istrati, D.; Buckle, I.; Lomonaco, P.; Yim, S. Deciphering the tsunami wave impact and associated connection forces in open-girder coastal bridges. J. Mar. Sci. Eng. 2018, 6, 148. [Google Scholar] [CrossRef] [Green Version]
- Douglass, S.; Chen, Q.; Olsen, J.; Edge, B.; Brown, D. Wave Forces on Bridge Decks; U.S. Department of Transportation, Federal Highway Administration, Office of Bridge Technology: Washington, DC, USA, 2006.
- Allsop, W.; Cuomo, G.; Tirindelli, M. New prediction method for wave-in-deck loads on exposed piers/jetties/bridges. Coast. Eng. 2006, 2007, 4482–4493. [Google Scholar]
- Denson, K.H. Wave Forces on Causeway-Type Coastal Bridges; Water Resources Research Institute, Mississippi State University: Stackville, MS, USA, 1978. [Google Scholar]
- Azadbakht, M.; Yim, S.C. Effect of trapped air on wave forces on coastal bridge superstructures. J. Ocean Eng. Mar. Energy 2016, 2, 139–158. [Google Scholar] [CrossRef] [Green Version]
- Istrati, D.; Buckle, I. Role of trapped air on the tsunami-induced transient loads and response of coastal bridges. Geosciences 2019, 9, 191. [Google Scholar] [CrossRef] [Green Version]
- Xiang, T.; Istrati, D.; Yim, S.C.; Buckle, I.G.; Lomonaco, P. Tsunami loads on a representative coastal bridge deck: Experimental study and validation of design equations. J. Waterw. Port Coast. Ocean Eng. 2020, 146, 04020022. [Google Scholar] [CrossRef]


| Parameters | Value |
|---|---|
| Barge size (W × L × H) (m) | 60 × 60 × 15 |
| Moonpool (W × L × H) (m) | 10 × 10 × 15 |
| Draft (m) | 10 |
| Mass (kg) | 32,200,282 |
| COG (m) | (−0.37, 0, −4.86) |
| Roll inertia (kg/m3) | 9,660,000,000 |
| Pitch inertia (kg/m3) | 9,660,000,000 |
| Yaw inertia (kg/m3) | 19,300,000,000 |
| Parameters | Value |
|---|---|
| Rotor, nacelle, tower mass (t) | 110, 240, 347.46 |
| Hub height (m) | 90 |
| COG (m) | (20.0, 0.0, 70.6) |
| Rotor, hub diameter (m) | 126,3 |
| Roll inertia (kg/m3) | 240,000,000 |
| Pitch inertia (kg/m3) | 240,000,000 |
| Yaw inertia (kg/m3) | 480,000,000 |
| Rotor, nacelle, tower mass (t) | 110, 240, 347.46 |
| Parameters | Value |
|---|---|
| Diameter of side column, diagonal column and equivalent net (m) | 1.5, 0.8, 0.4 |
| The thickness of the side column and diagonal column (m) | 0.02 |
| Diameter of the equivalent net (m) | 0.4 |
| Distance of adjacent equivalent net (m) | 5 |
| Weight of equivalent net (g/m2) | 590 |
| Parameters | Value |
|---|---|
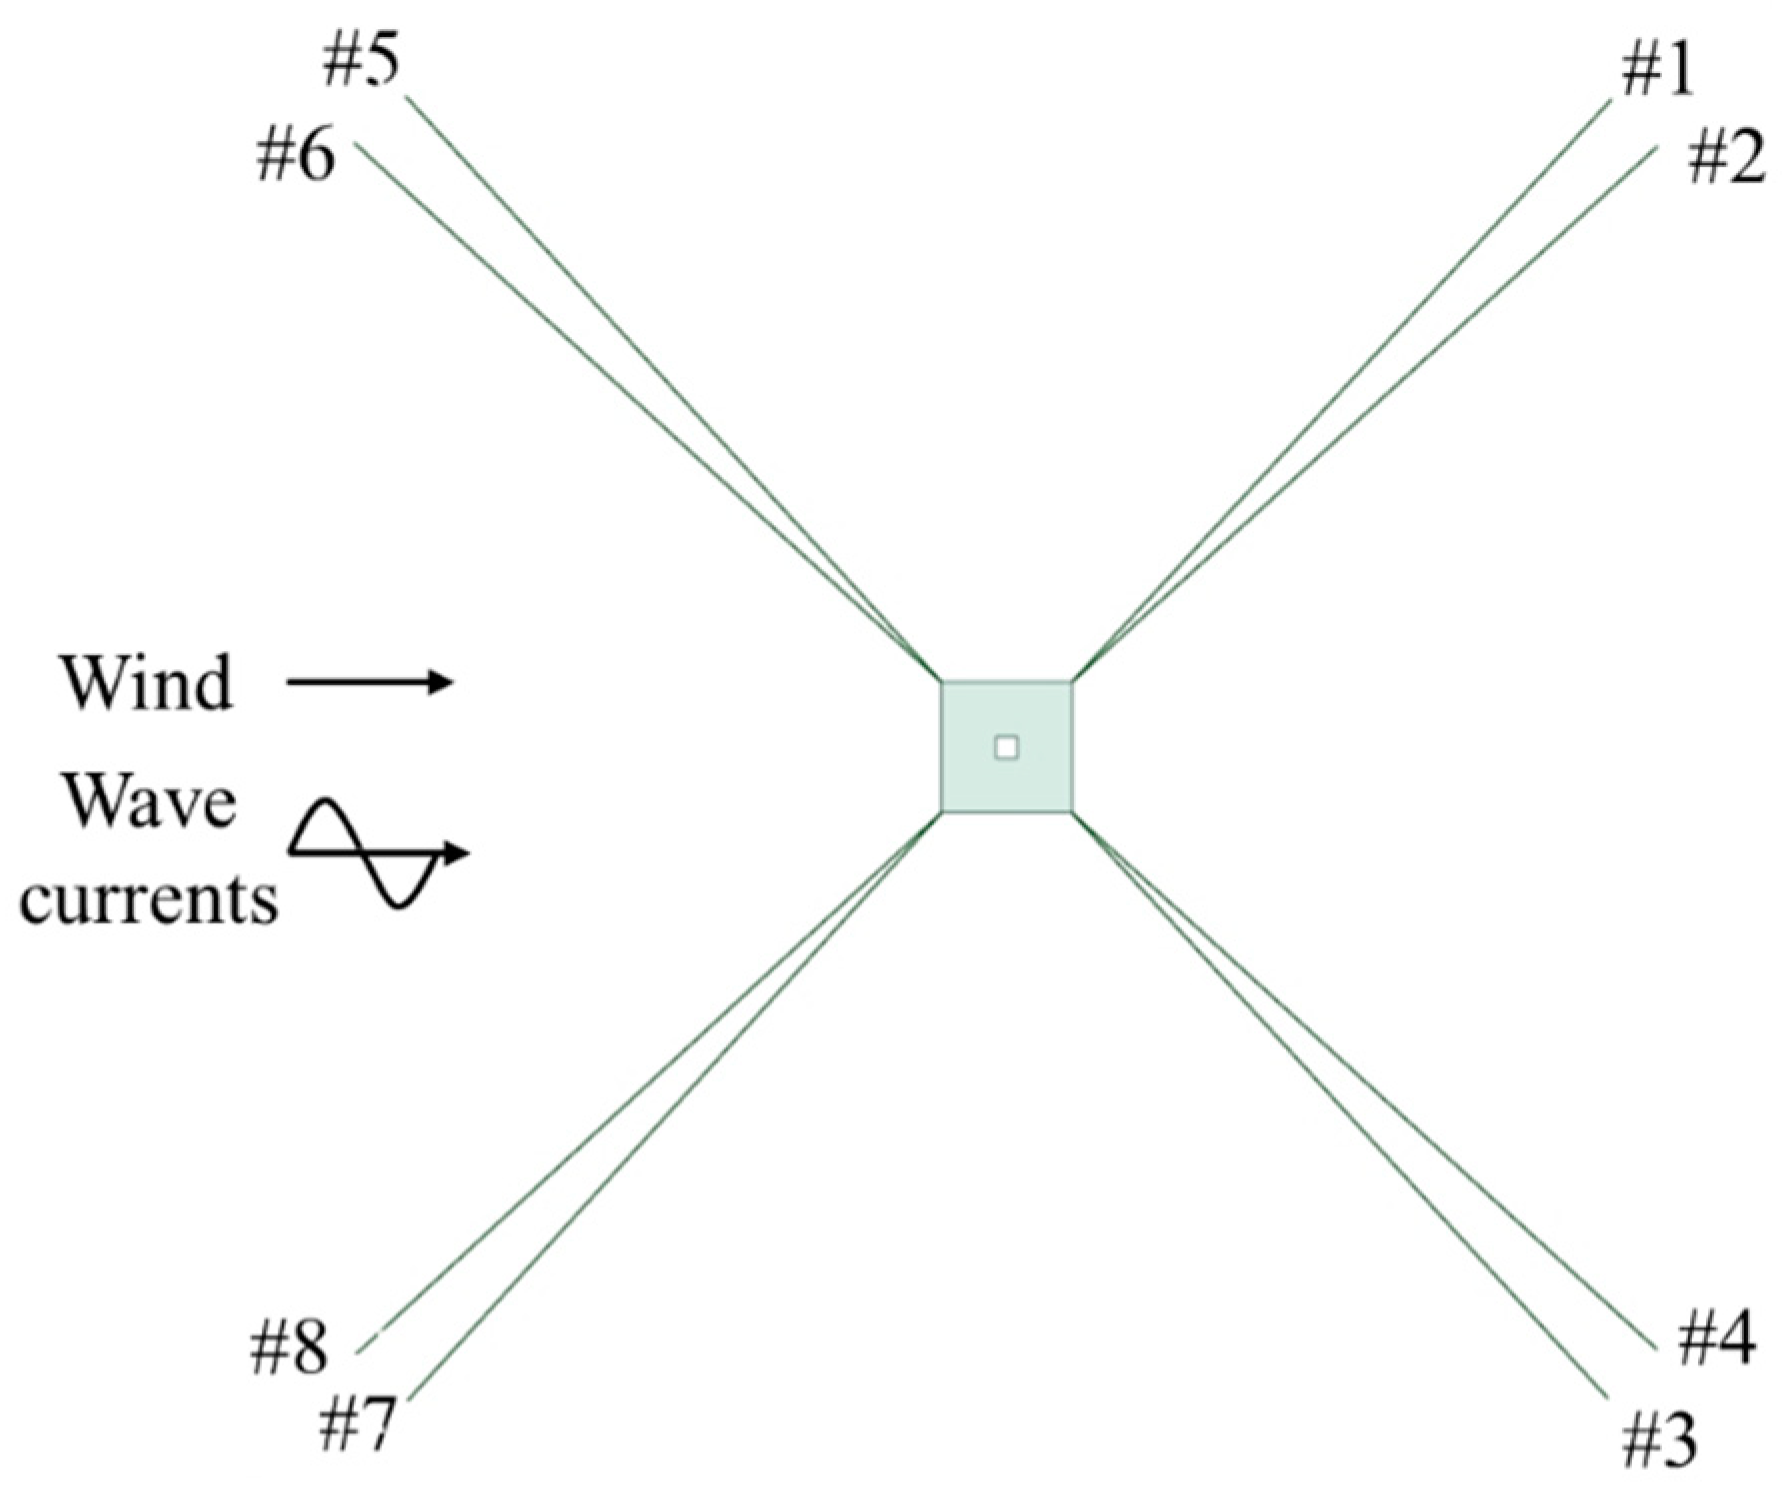
| Number of mooring lines | 4 × 2 |
| Anchor between adjacent lines | 5°/85° |
| Water depth (m) | 50 |
| Radius to anchor form the platform centerline (m) | 408 |
| Unstretched mooring line length (m) | 375 |
| Mooring line diameter (m) | 0.162 |
| Catalog breaking load (kN) | 9319 |
| Equivalent mooring line mass density (kg/m) | 522.25 |
| Wind Speed (m/s) | Hs (m) | Tp (m) | Current Speed (m/s) | Number of the Broken Line | Turbine Status | |
|---|---|---|---|---|---|---|
| EC1 | 11.4 | 3.2 | 5.7 | 1 | no | Operating |
| EC2 | 8 | 3.2 | 5.7 | 1 | no | Operating |
| EC3 | 25 | 3.2 | 5.7 | 1 | no | Shutdown |
| EC4 | 11.4 | 1.67 | 5.17 | 1 | no | Operating |
| EC5 | 11.4 | 5.52 | 9.4 | 1 | no | Operating |
| EC6 | 11.4 | 3.2 | 5.7 | 0 | no | Operating |
| EC7 | 11.4 | 3.2 | 5.7 | 1 | #3 | Operating |
| EC8 | 11.4 | 3.2 | 5.7 | 1 | #8 | Operating |
| With Cage | Without Cage | |
|---|---|---|
| Surge | 45.59 s | 44.28 s |
| Heave | 9.98 s | 9.96 s |
| Pitch | 10.82 s | 10.09 s |
| Yaw | 51.66 s | 51.66 s |
| Surge | 45.59 s | 44.28 s |
| Mean of Surge | Std of Surge | Mean of Pitch | Std of Pitch | |
|---|---|---|---|---|
| With cage | 2.88% | 19.88% | 2.73% | 0.77% |
| Without cage | 3.51% | 21.13% | 1.95% | 2.00% |
Publisher’s Note: MDPI stays neutral with regard to jurisdictional claims in published maps and institutional affiliations. |
© 2022 by the authors. Licensee MDPI, Basel, Switzerland. This article is an open access article distributed under the terms and conditions of the Creative Commons Attribution (CC BY) license (https://creativecommons.org/licenses/by/4.0/).
Share and Cite
Zhai, Y.; Zhao, H.; Li, X.; Shi, W. Hydrodynamic Responses of a Barge-Type Floating Offshore Wind Turbine Integrated with an Aquaculture Cage. J. Mar. Sci. Eng. 2022, 10, 854. https://doi.org/10.3390/jmse10070854
Zhai Y, Zhao H, Li X, Shi W. Hydrodynamic Responses of a Barge-Type Floating Offshore Wind Turbine Integrated with an Aquaculture Cage. Journal of Marine Science and Engineering. 2022; 10(7):854. https://doi.org/10.3390/jmse10070854
Chicago/Turabian StyleZhai, Yuting, Haisheng Zhao, Xin Li, and Wei Shi. 2022. "Hydrodynamic Responses of a Barge-Type Floating Offshore Wind Turbine Integrated with an Aquaculture Cage" Journal of Marine Science and Engineering 10, no. 7: 854. https://doi.org/10.3390/jmse10070854
APA StyleZhai, Y., Zhao, H., Li, X., & Shi, W. (2022). Hydrodynamic Responses of a Barge-Type Floating Offshore Wind Turbine Integrated with an Aquaculture Cage. Journal of Marine Science and Engineering, 10(7), 854. https://doi.org/10.3390/jmse10070854