1. Introduction
Maritime accidents are one of the main obstacles to the development of the maritime industry. According to the International Maritime Organization’s safety and shipping accident report 2021 [
1], a total of 2703 accidents occurred globally in 2020, with 49 total losses. Among the total losses, there were 18 cargo ship accidents, accounting for 36.73%, which was the primary type of ship involved; 10 fishing vessel accidents, accounting for 20.41%, was the second type of ship; 5 passenger ships accidents, accounting for 10.20%, the third most common type of ship where the total losses occur. Various mishaps have not only resulted in the loss of lives and property damage but have also contaminated the environment to varying degrees. At the same time, their dangers have also daunted many people who would like to engage with this domain [
2]. As a result, it is necessary to further investigate the mechanism of marine accidents to enhance relevant safety management, minimize various possible dangers, and limit the occurrence of maritime accidents.
People have been paying attention to the research on accidents for a long period of time, including regarding the relationship between different accidents and the internal relationships of a single accident, especially in industries with high-risk factors, such as the petroleum and chemical industries [
3,
4]. Many scholars [
5,
6,
7] use the domino effect to research the concealed relationships behind accidents; safety management regulations have been formulated in a targeted manner to contain potential safety hazards from the initial event and improve the level of safety production, that is, to stifle the problem at the source. Despite that, the definition of the domino effect is still varying, and few agreements have been developed in the scientific field [
8]. Most of the definitions are directly linked to negative phenomena such as accidents, losses, etc. [
9,
10], which is probably because the domino effect is often utilized to analyze accidents and loss. In this paper, we present a definition of the domino effect that does not have a negative tendency; in an interconnected system, modest starting energy might begin a chain reaction that eventually leads to massive changes. There are both good cases and bad examples of this. The benign domino effect, for example: the more you work, the luckier you become; the accumulation of little steps leads to a thousand miles; the accumulation of small streams leads to rivers and oceans; and so on. While the malignant domino effect includes: a thousand miles of dykes collapsing due to an ant’s nest; excessive drinking can lead to a collision between ships and cause environmental pollution; negligence can lead to the degradation of the working environment and the death of people through transferring; and so on. The domino effect has been widely accepted; however, in the field of maritime accidents, the application of the domino effect is rarely found. Through the analysis of a significant number of marine accidents, research has proven the domino effect exists in maritime accidents, which is one of the rare relevant studies [
11].
To bridge this gap, this research proposes a domino effect model to examine and research maritime accidents. Firstly, a statistical analysis of the MAIB reports is carried out, then the model based on TAR mining technology is used to mine the chain mechanism behind the accidents to create accident prevention and safety management methods in order to decrease marine accidents. The main innovation of this paper is to apply the domino model to uncover the sequential triggering events and propagation modes that cause accidents, the propagation modes emphasize the human factors among them and is not limited to the interaction between accidents.
2. MAIB and Accidents Analysis
MAIB is an independent agency under the British Department of Transport—Marine Accident Investigation Branch, located in Southampton, mainly investigating British ships around the world and all ships in British territorial waters. Its mission is “to help prevent further avoidable accidents from occurring, not to establish blame or liability.” [
12] The investigation reports cannot be utilized in any form of court proceedings, as regulated by the UK Merchant Shipping Act. The report covers establishing the cause of the accident and providing suggestions to enhance safety standards and steps taken by the Investigation Branch.
Since the investigation report is not used to pursue legal responsibility, all stakeholders have no worries, which ensures the objectivity of the report from the beginning. This is the primary reason for including its investigation report in this article. Until 10 March 2022, a total of 996 reports were published on its official website [
13], of which 377 investigation reports are based on merchant ships of 100 gross tonnage or greater and serve as the data basis for this research. The reason for setting the standard of merchant ships of 100 gross tonnage and above are as follows:
(1) This study is to help the advancement of the maritime industry, so it is focused on merchant ships;
(2) Ships under 100 gross tonnage are more concentrated in river transportation and less in sea transportation (except fishing boats), which is inconsistent with the aim of this paper;
(3) Ships under 100 gross tonnage and ships over 100 gross tonnage have substantial differences in navigation waters and itineraries and should be researched individually.
To facilitate statistical analysis and model calculation, it is important to establish a database containing all accident information, as shown in
Table 1:
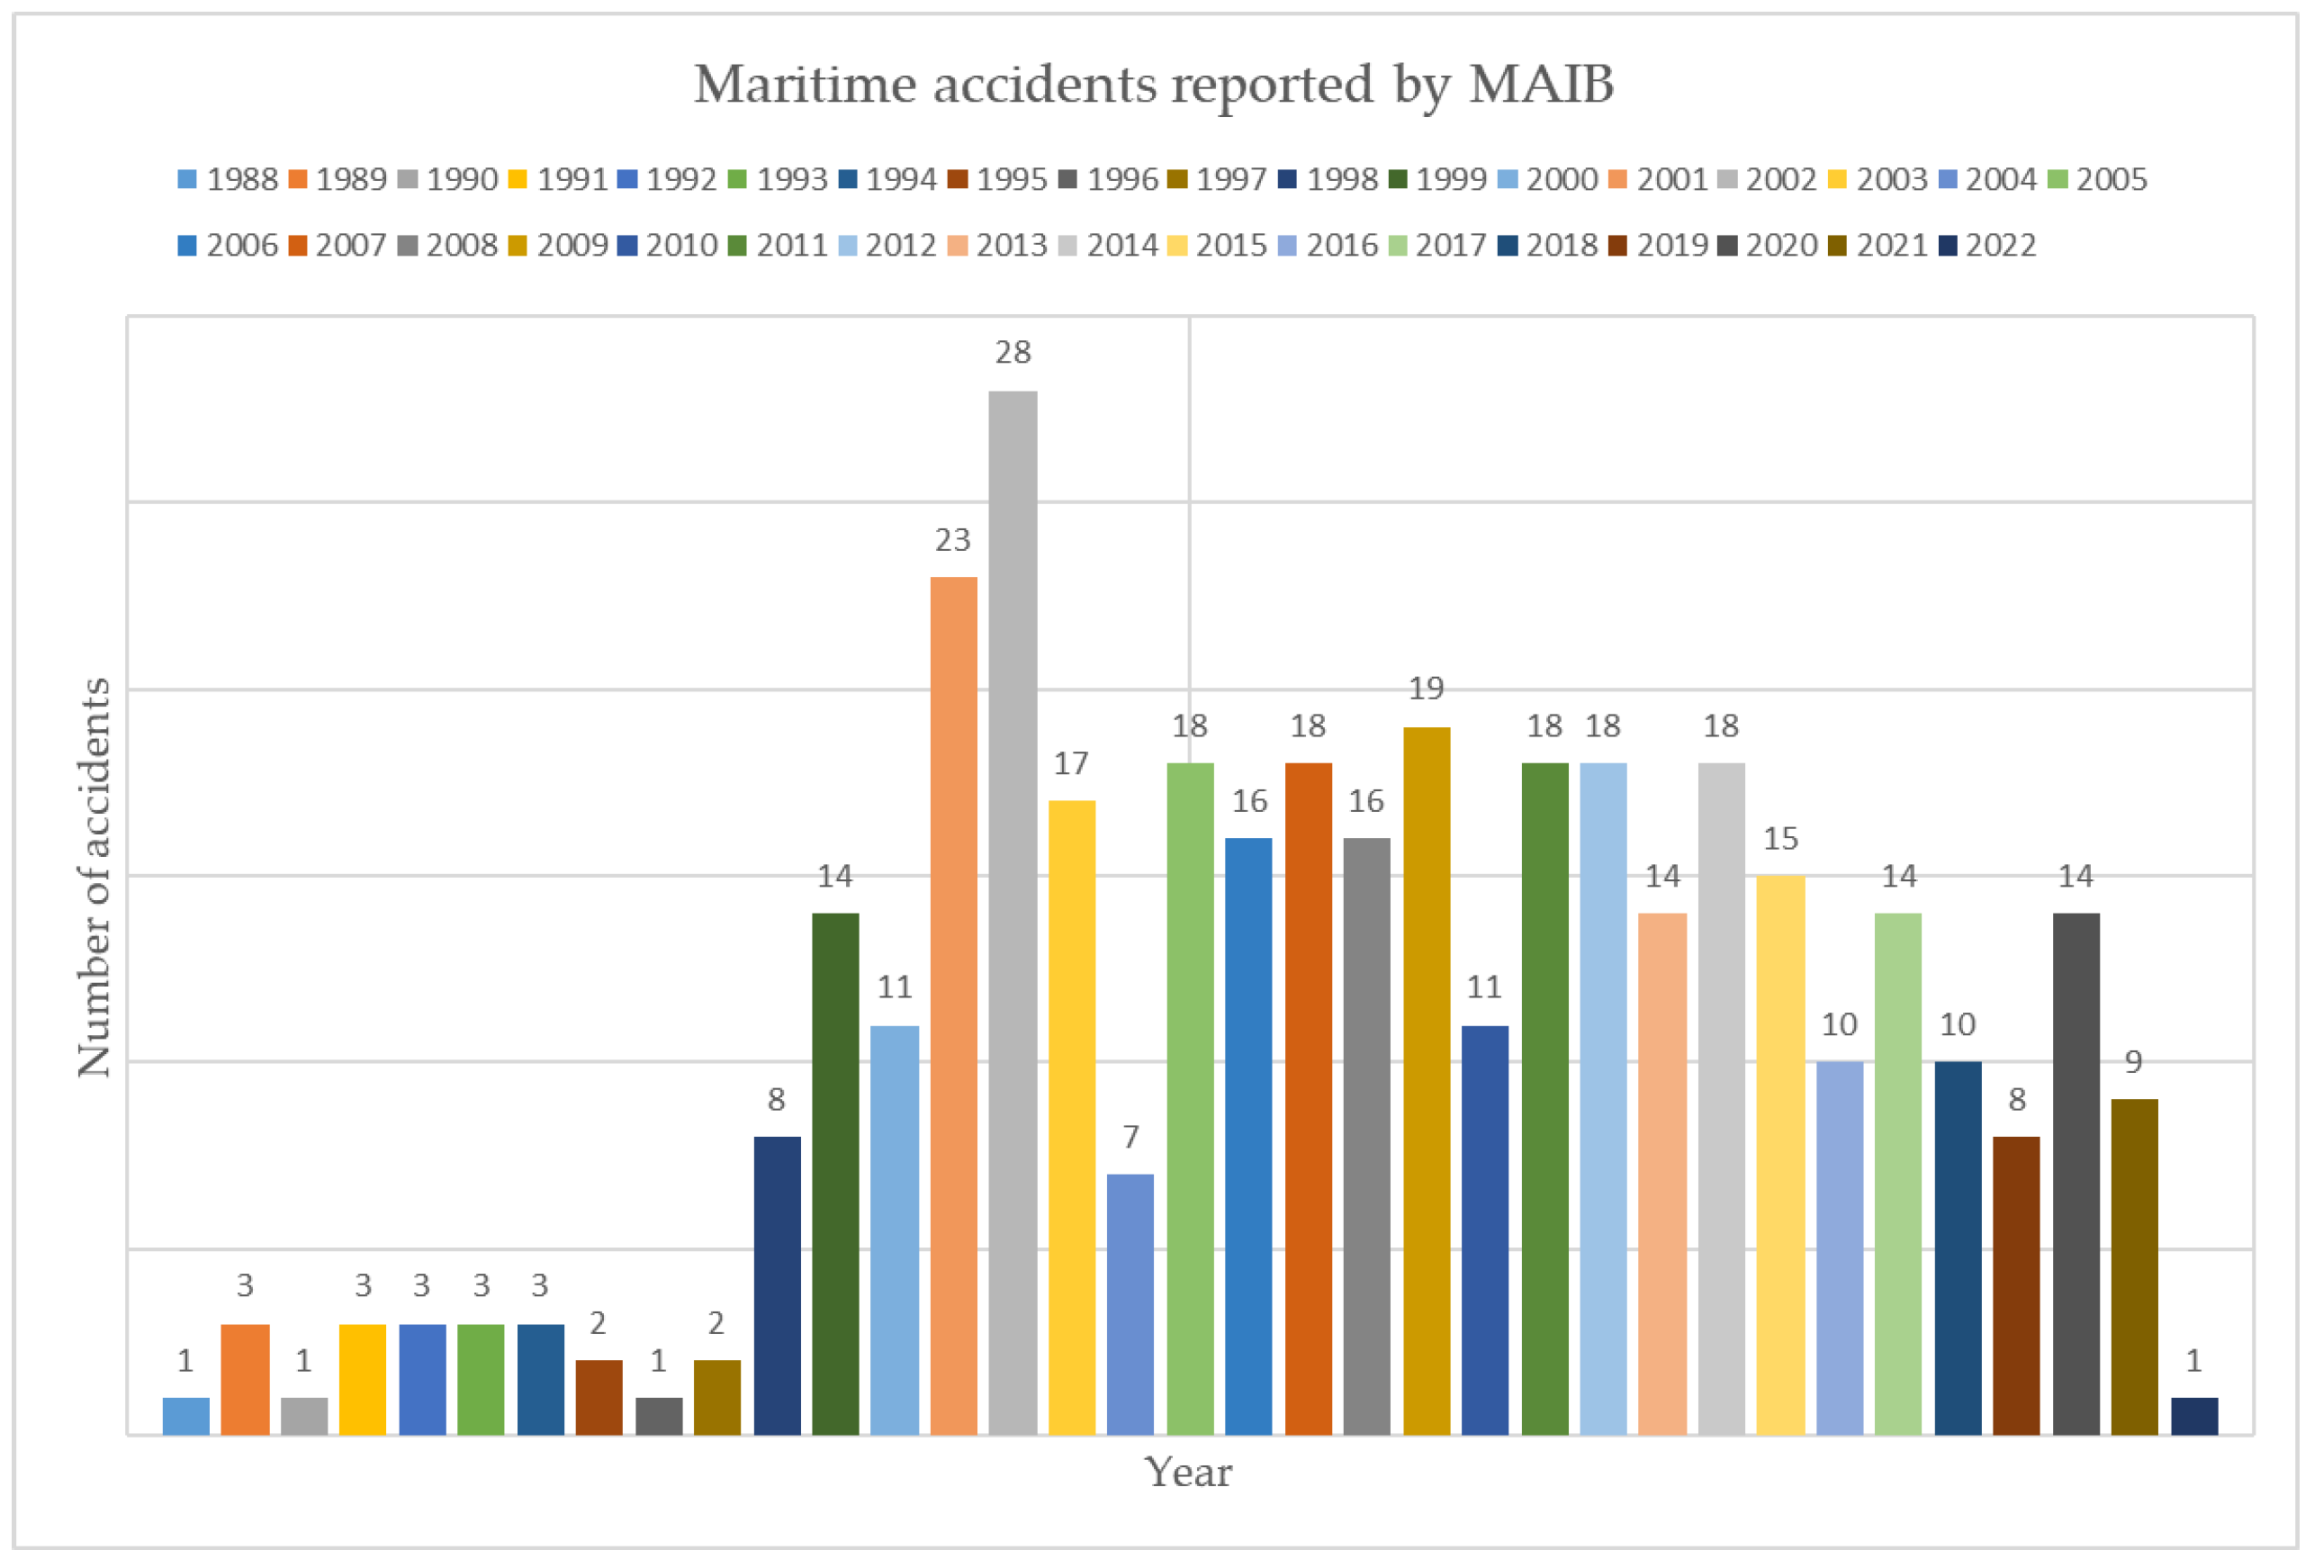
Figure 1 shows the distribution of annual accidents after processing the database. It can be seen that the first report was given in 1988. The number of accident reports before 1998 was relatively small, no more than three, which was probably because many accidents were not reported; the number of the reports in 2002 are 28 cases, which is the largest. There is presently just one report in 2022, according to the report’s gathering time. In fact, in the 10 years from 2002 to 2021, the number of maritime accidents has generally shown a slow downward trend. This is easy to understand. Shipboard navigation equipment has been continuously updated and has become more intelligent, which is of great help to the safety of navigation, the management level of shipping companies is becoming more efficient with the popularization of network technology, and the crew’s safe working awareness has greatly improved; all of these have played positive roles in the assurance of navigation safety.
In addition, due to the influence of the natural environment and social-economic activities, the distribution of maritime accidents each month also reveals great differences. According to
Figure 2, the number of accidents in December is the highest, followed by the number of accidents in March, and the least in April. In previous months, the number of accidents was about 30. According to the findings, accidents are more likely to occur in December. As December is approaching the end of the year, the annual holiday of western countries is also at this time (Christmas to New Year’s Day). As a result, economic activity expands dramatically, as seen by unusually busy marine traffic in terms of shipping, necessitating special attention.
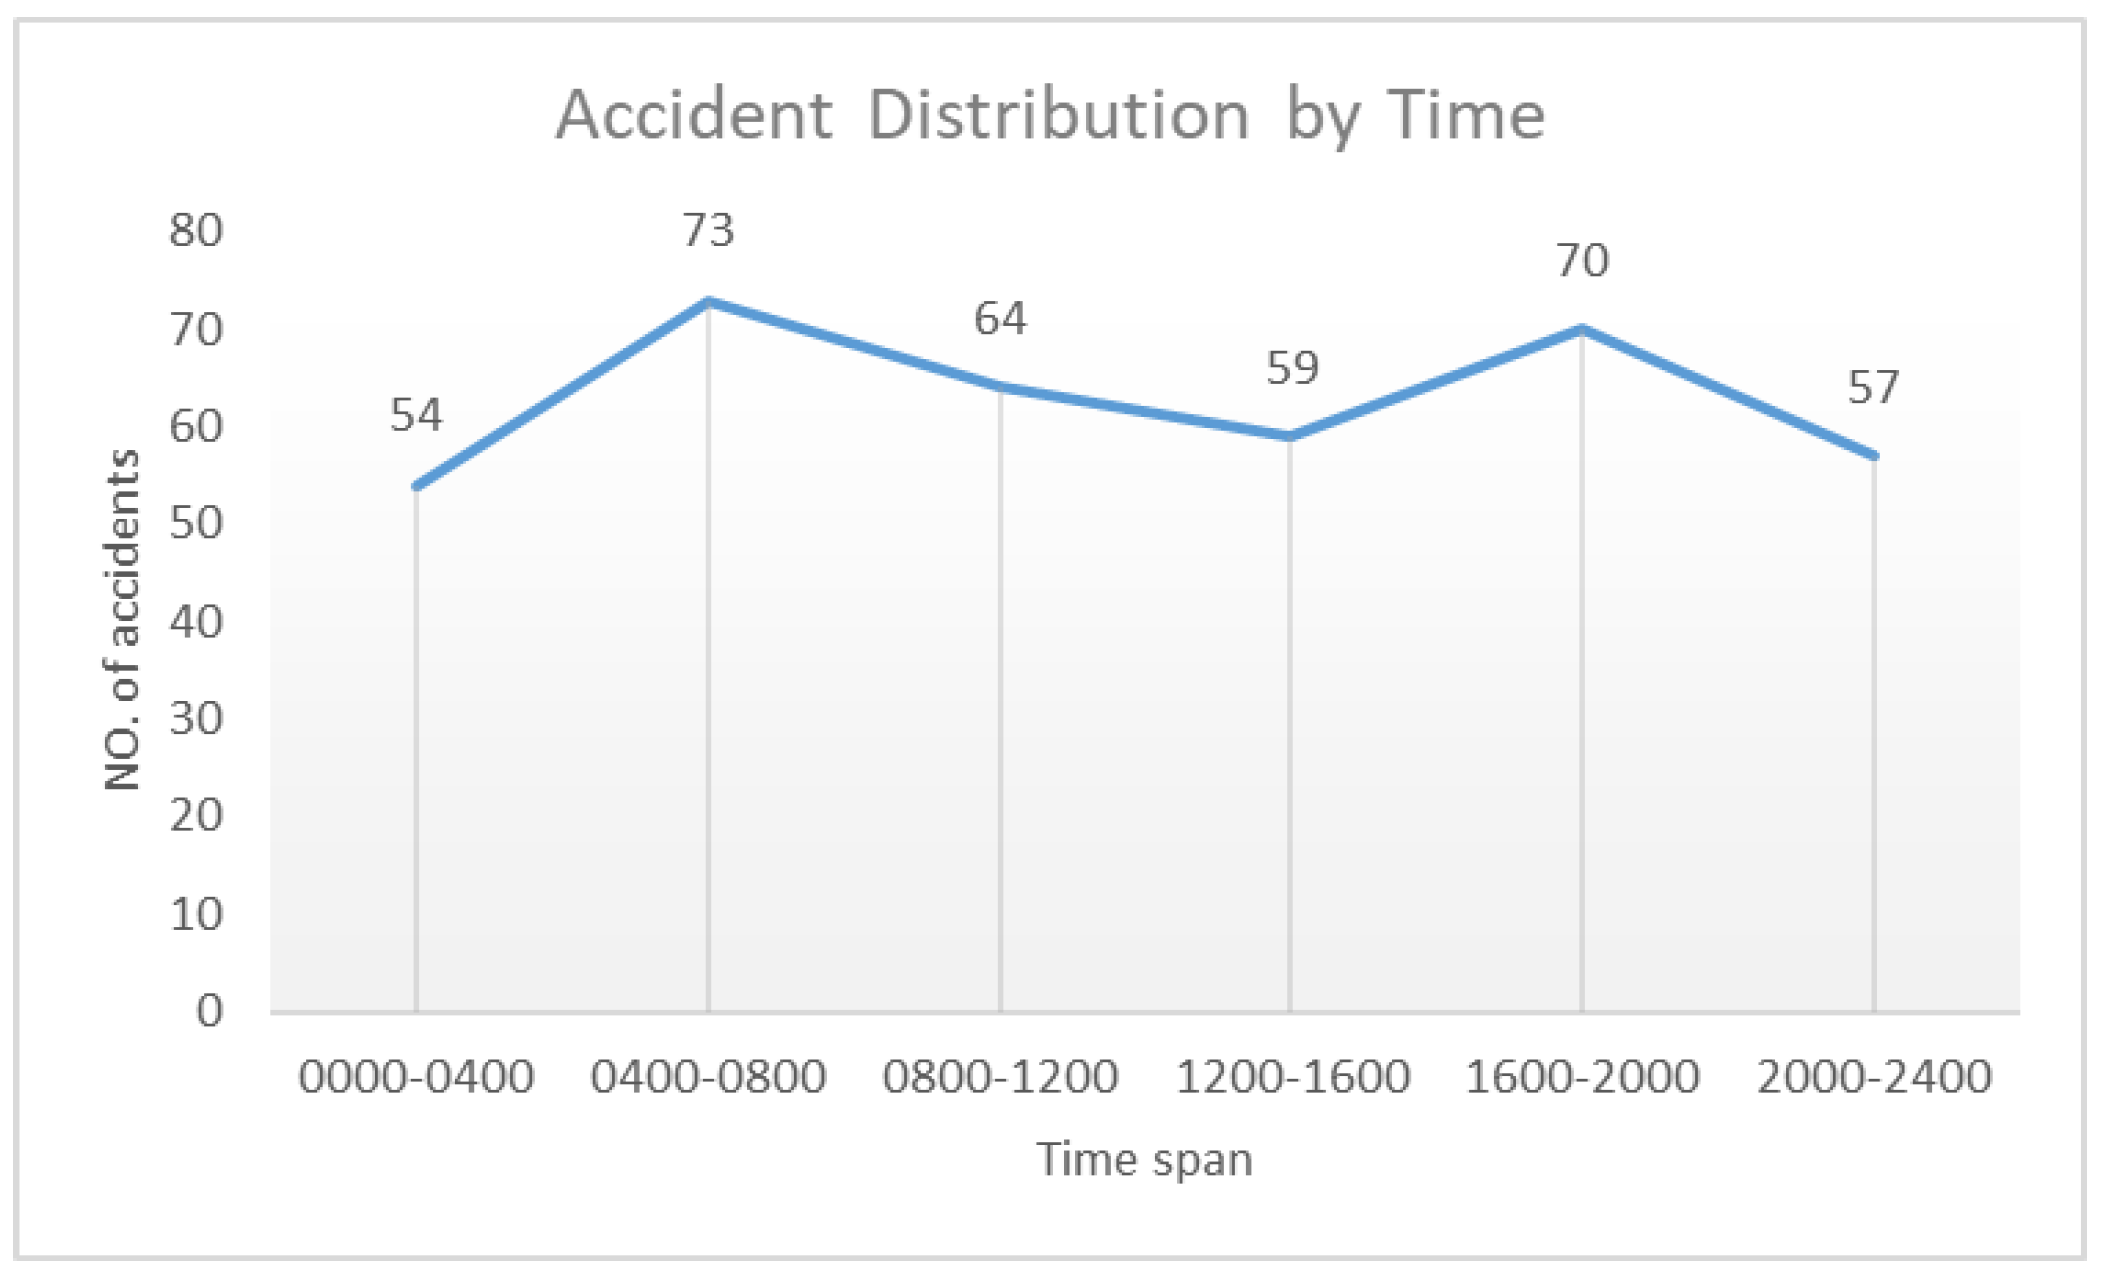
Figure 3 divides the day into six time-parts and tallies the number of accidents that occurred within each phase. Each segment corresponds to the duty time of the deck officers. The purpose of this division is to discover the human factors behind the accident. It can be observed that the number of accidents in the 0400–0800 and 1600–2000 time periods is higher than in the other periods, while the number of accidents in the 0000–0400 time period is somewhat lower. According to the data findings, the gap between the periods with the highest and least accidents is 19. Although this is not obvious, indicating that there is a high probability of accidents occurring in each period. The 0400–0800 and 1600–2000 time periods have the highest chance of accidents.
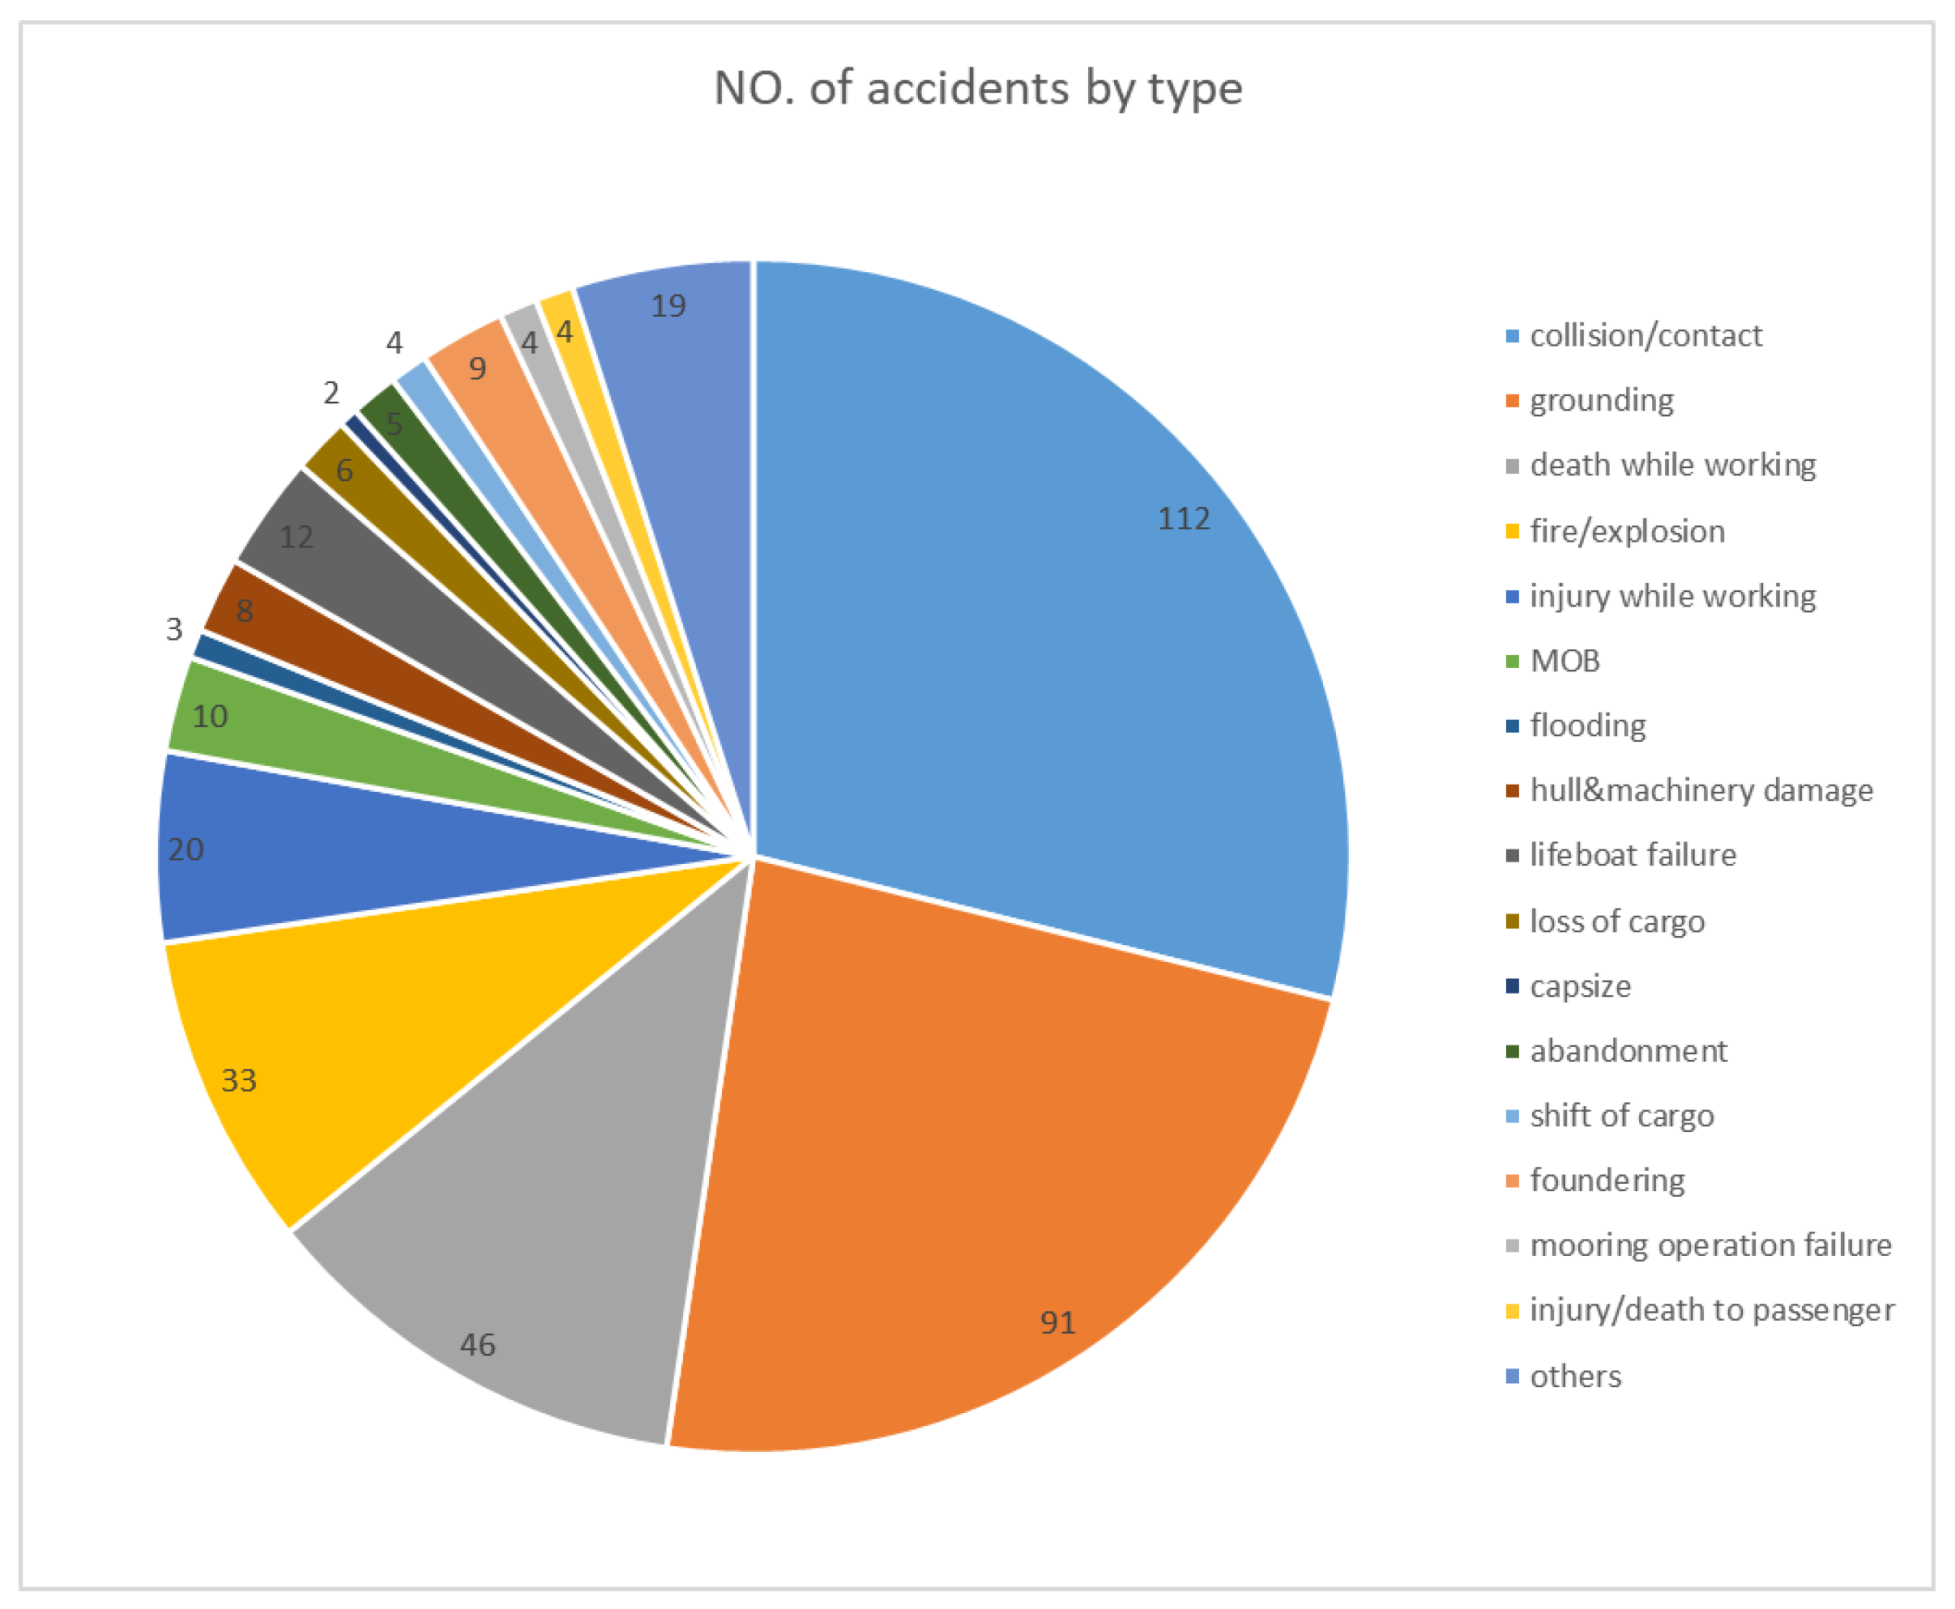
Figure 4 shows the answers to the categories of accidents.
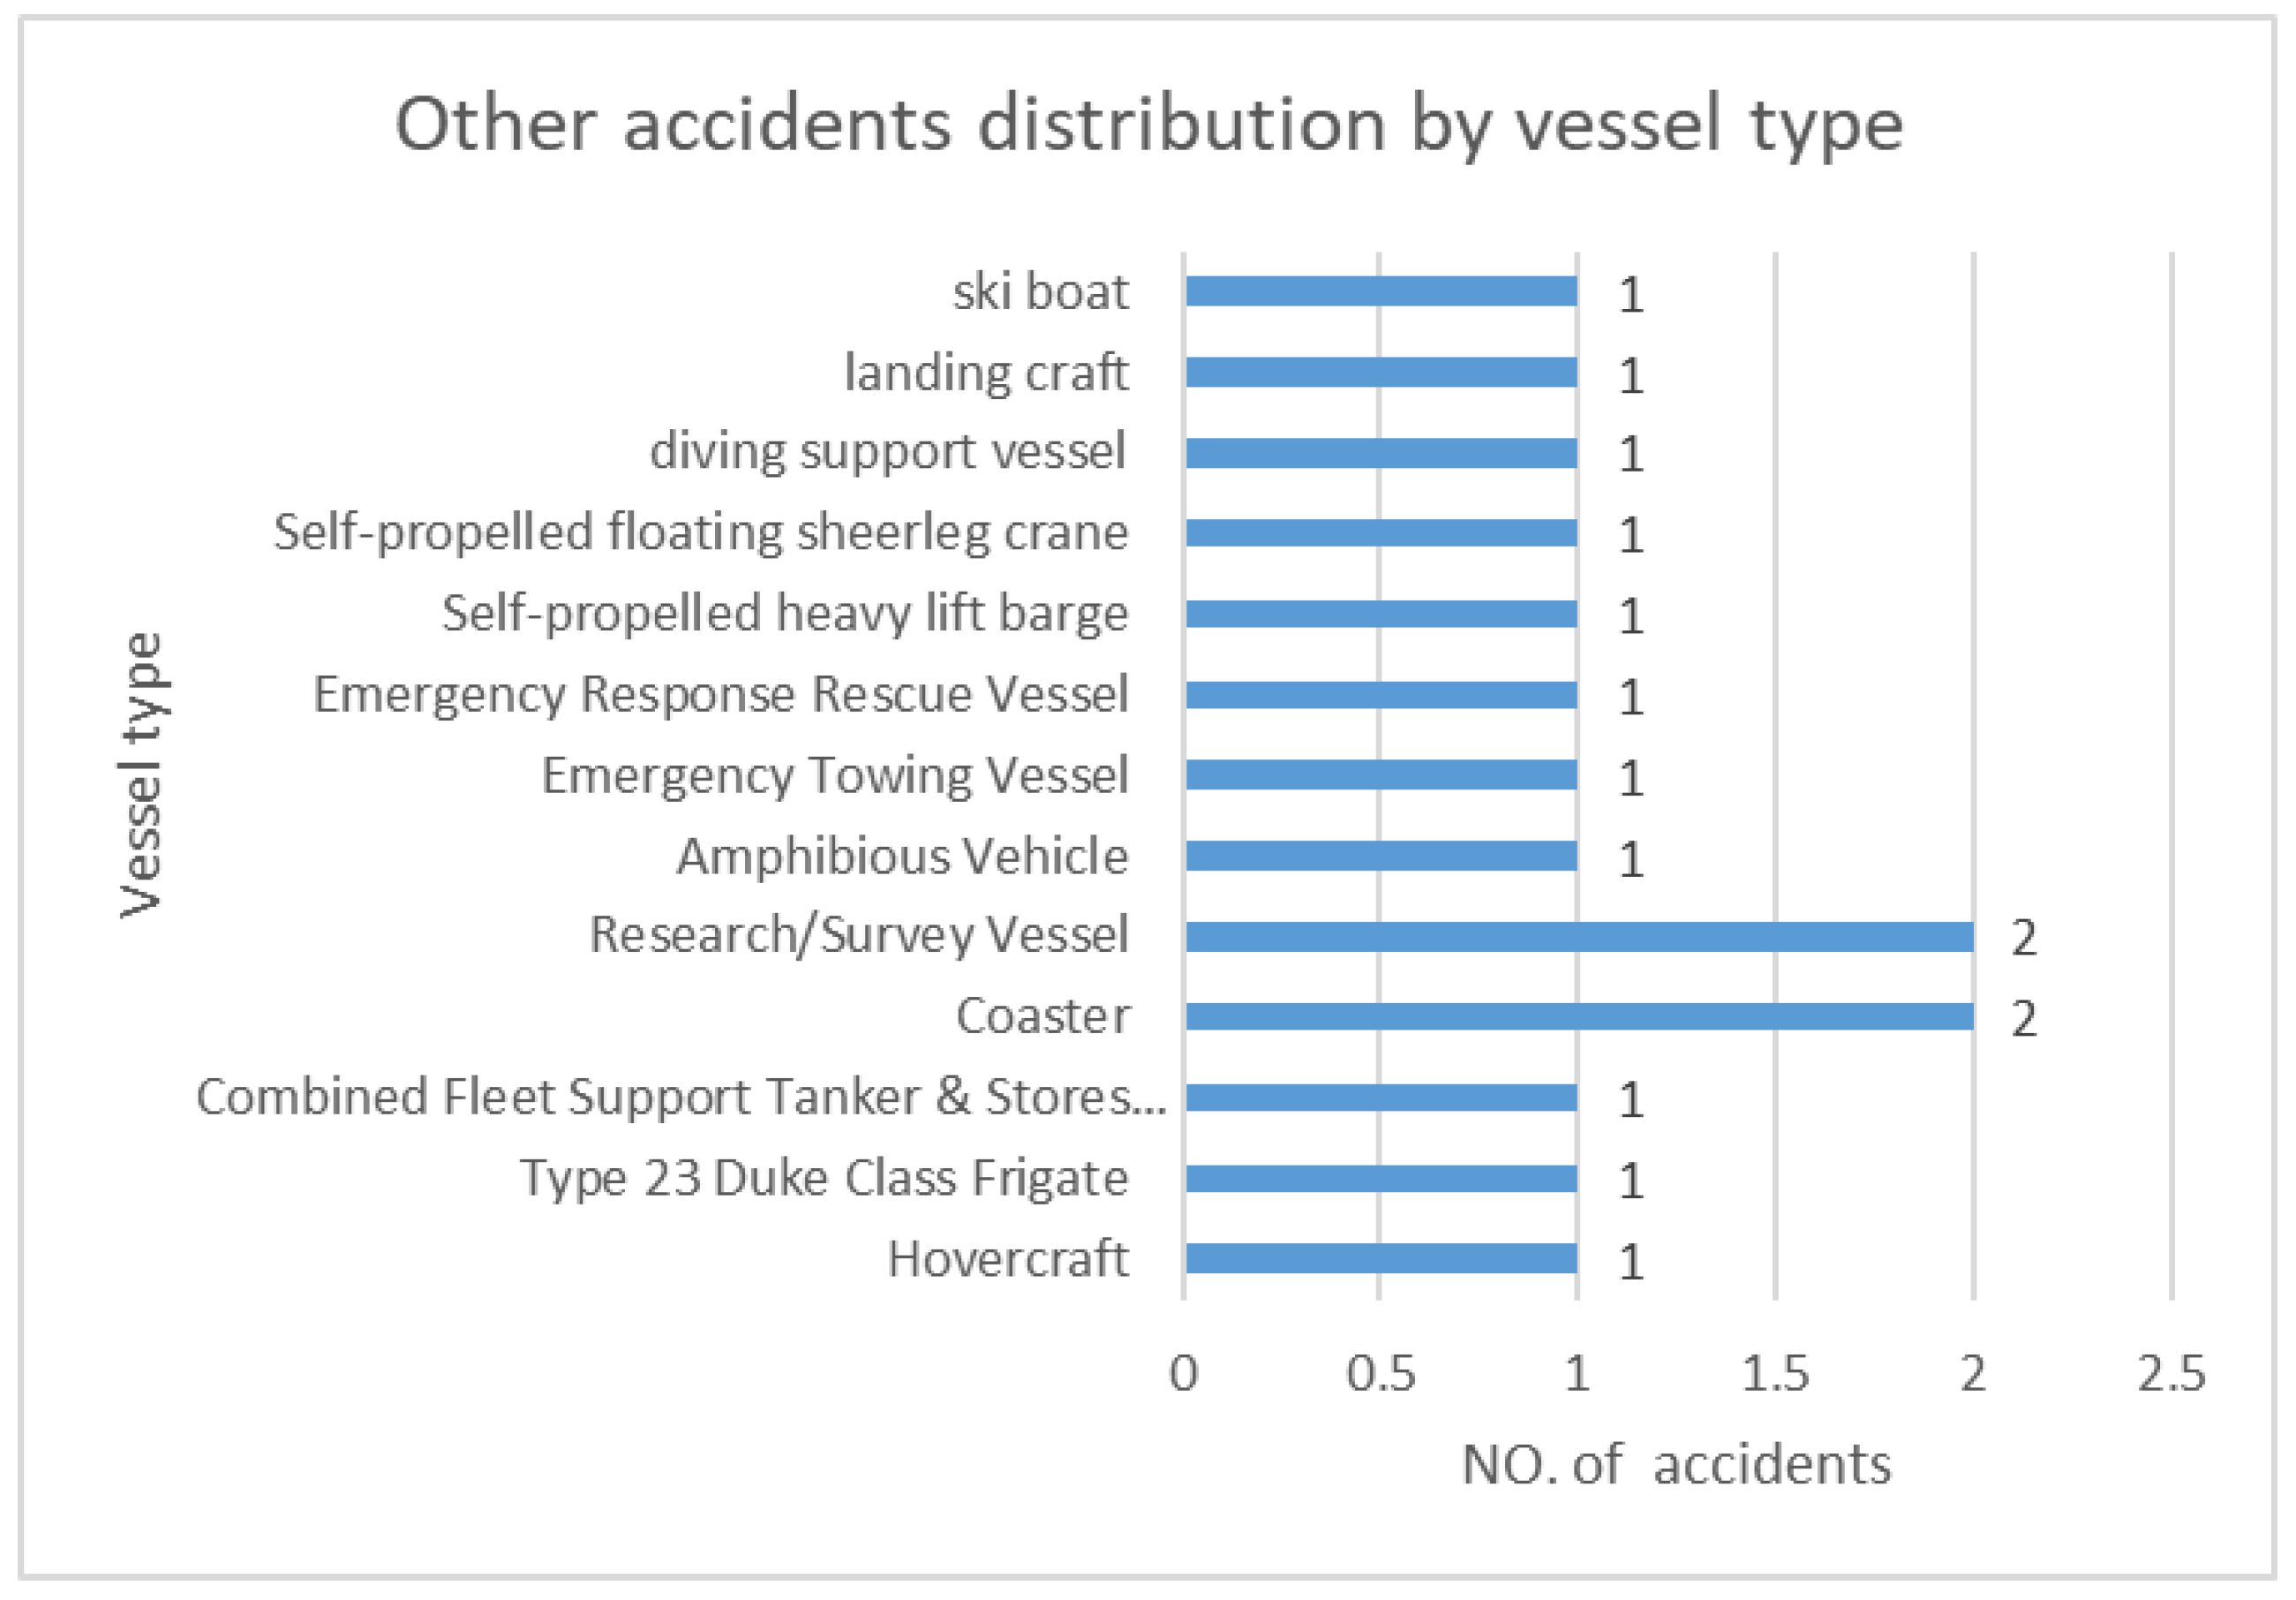
Figure 4 shows that of the more than 20 types of accident, collision/contact, grounding, and death while working are the top three types of accidents, while fire/explosion, injuries while working, lifeboat failure, and man overboard are listed as the 4th to 7th types of high-frequency accidents. There are up to 14 different categories of accidents categorized as “others”, as shown in
Figure 5. They are categorized as “others” due to their uncommon occurrence and low frequency.
A variety of accidents not only have a direct connection with the time of the accident but also concerning their carriers-vessel. As a result, it is vital to determine which type of ship is constantly involved in accidents.
Figure 6 depicts accident data by ship type, with the Ro-Ro ship having the most accidents, and general cargo ships and container ships ranking second and third, respectively. Oil/chemical tankers, bulk carriers, fishing vessels, cruise ships, and passenger ships are also prone to accidents. While it is evident that tugboats, yachts, and other similar vessels should not be included in the list of specified ship categories, they appeared because these ships were involved in accidents involving commercial ships of more than 100 gross tonnage, so the information was aggregated. It can be seen from the figure that the number of accidents with these ships is small. On the one hand, because these ships are infrequently met on commerce ship routes, the probability of accidents is quite low. On the other hand, accidents still exist so they should not be ignored.
Figure 6 does not list all the ship types; the “others” types can be found in
Figure 7.
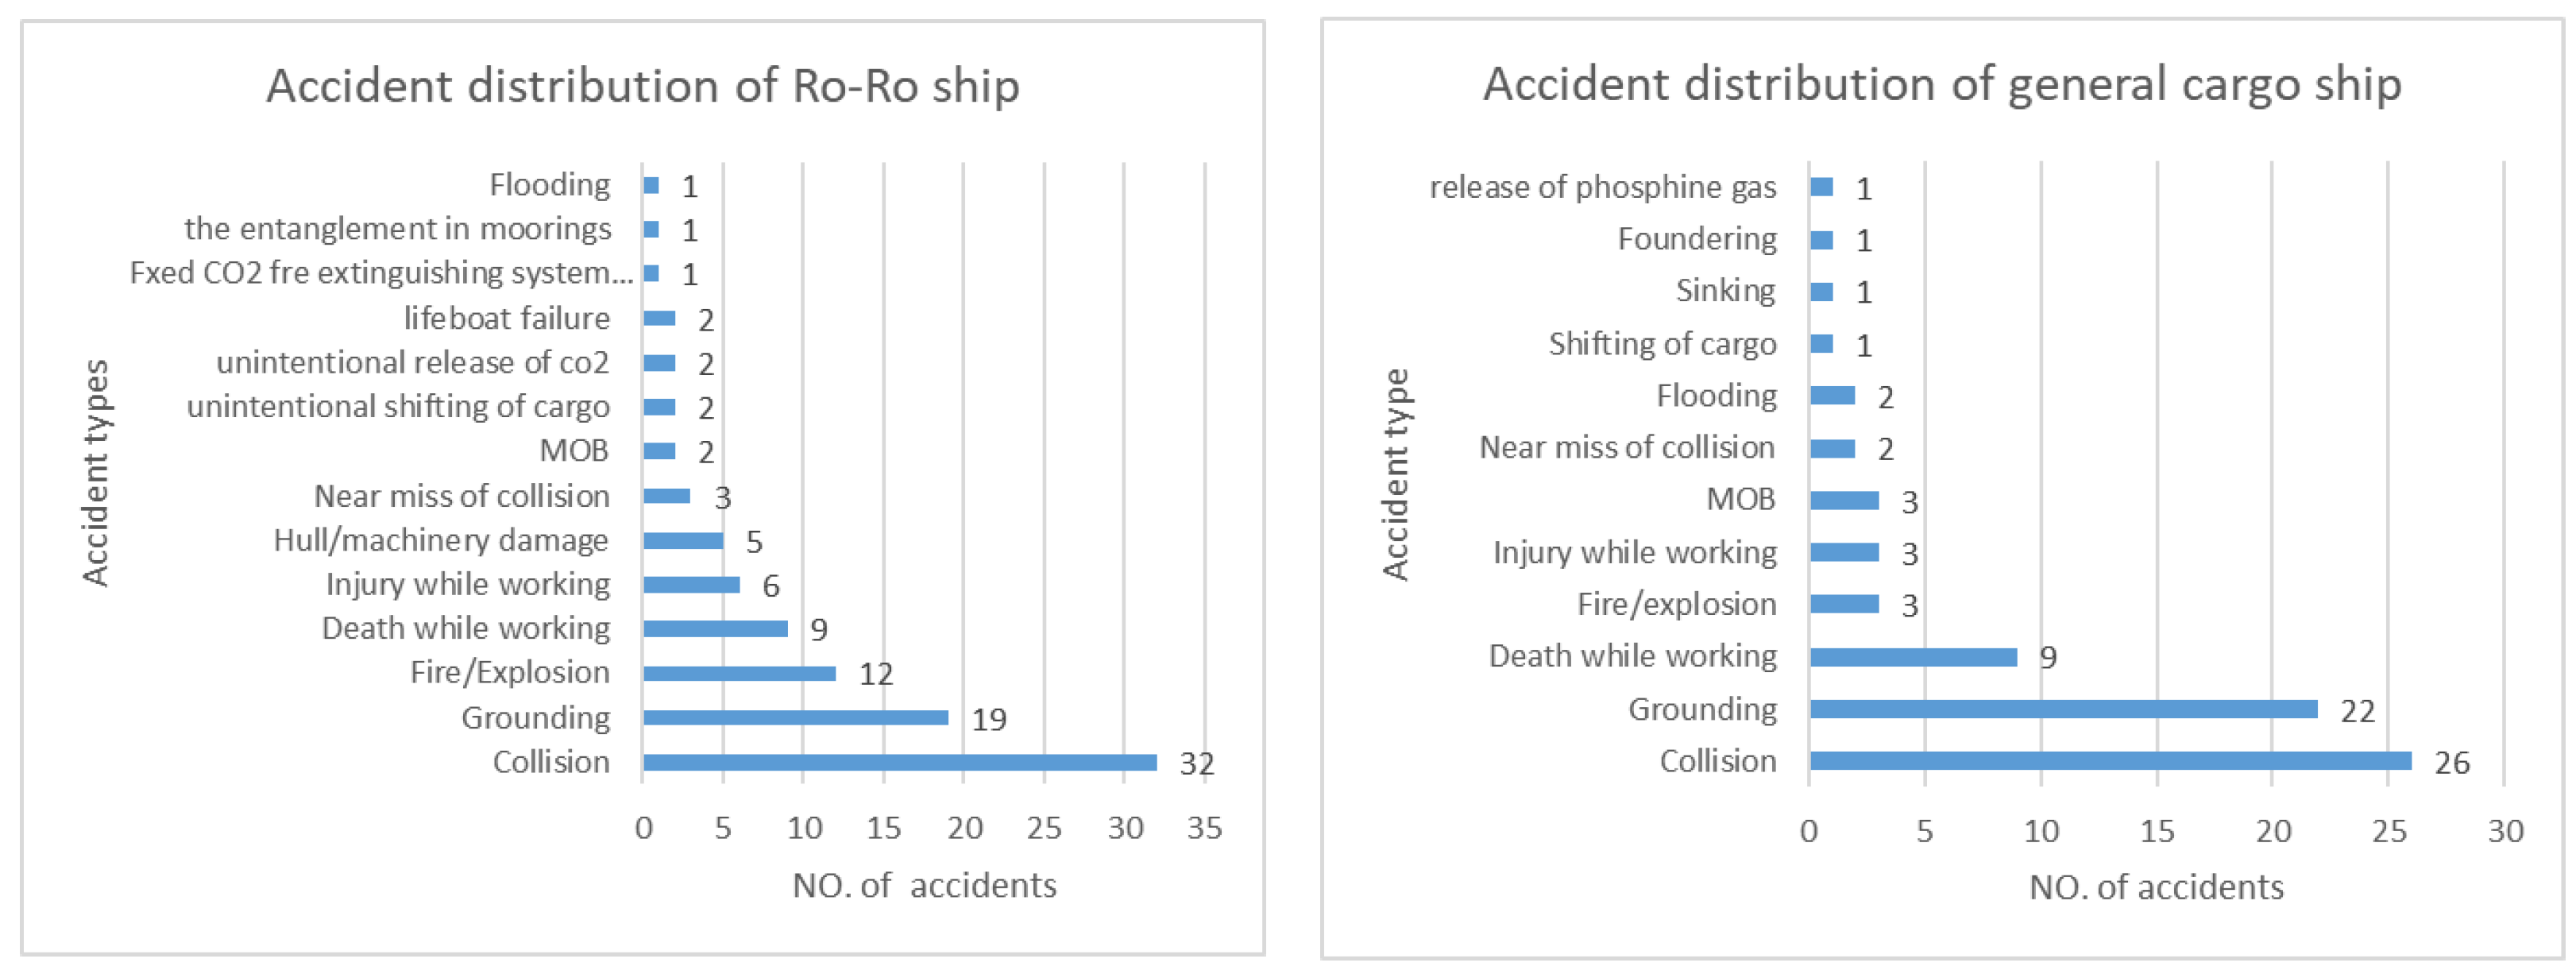
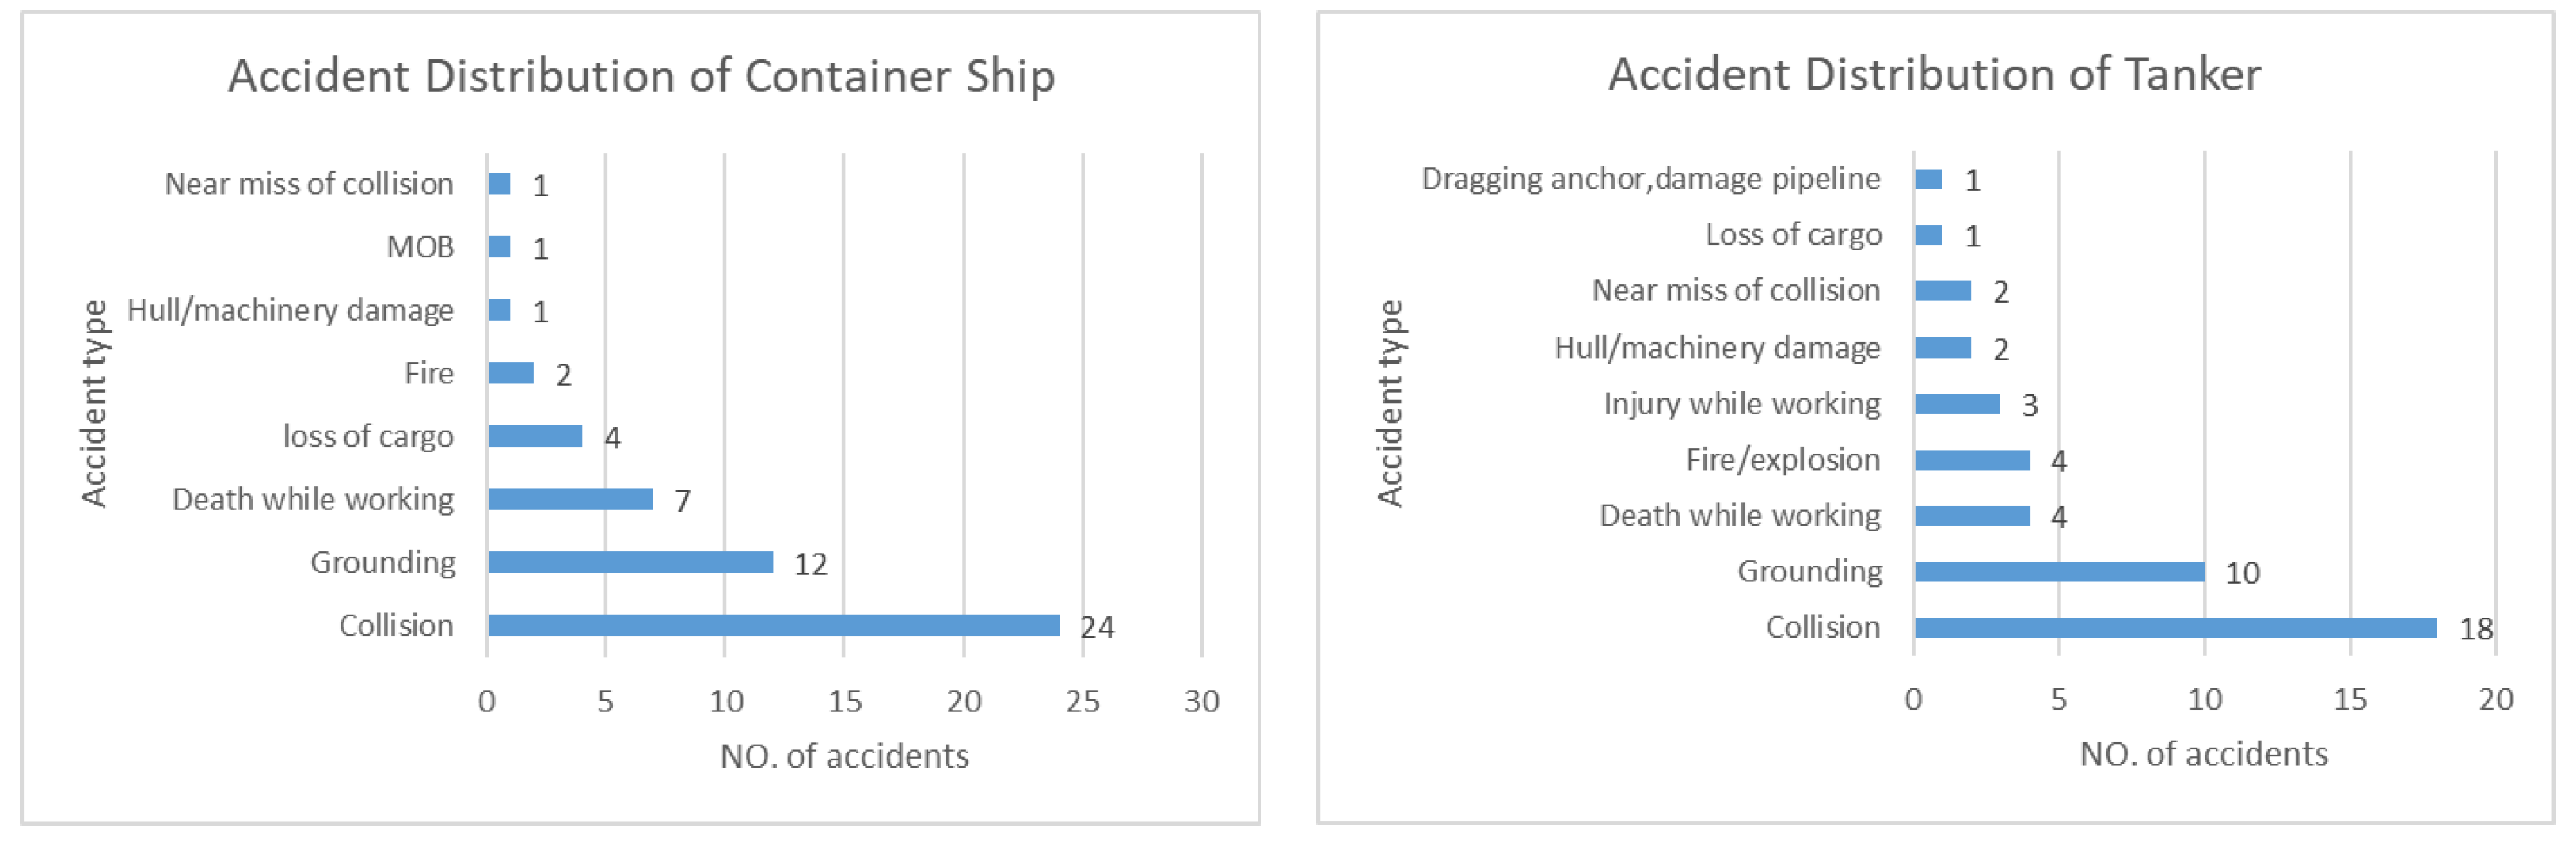
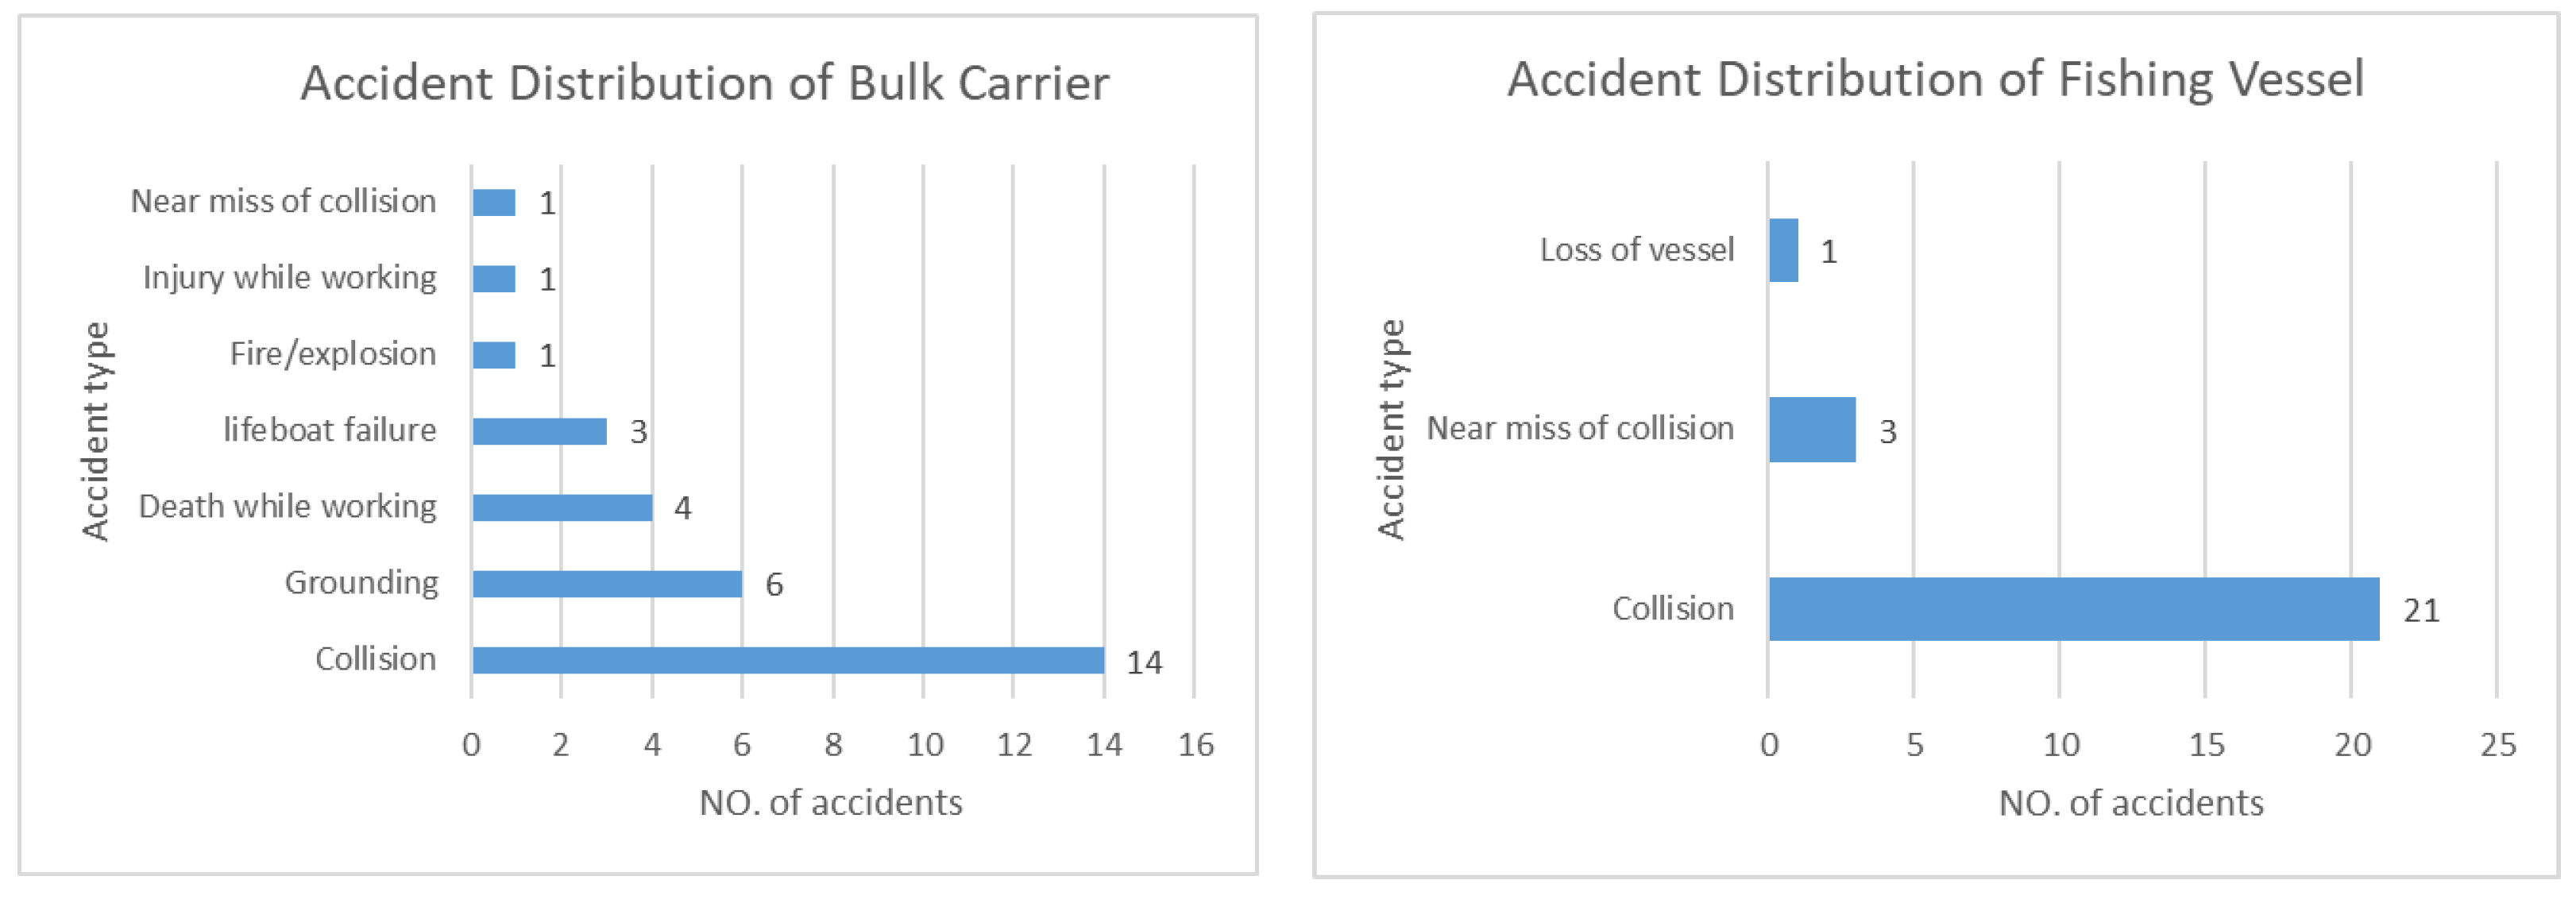
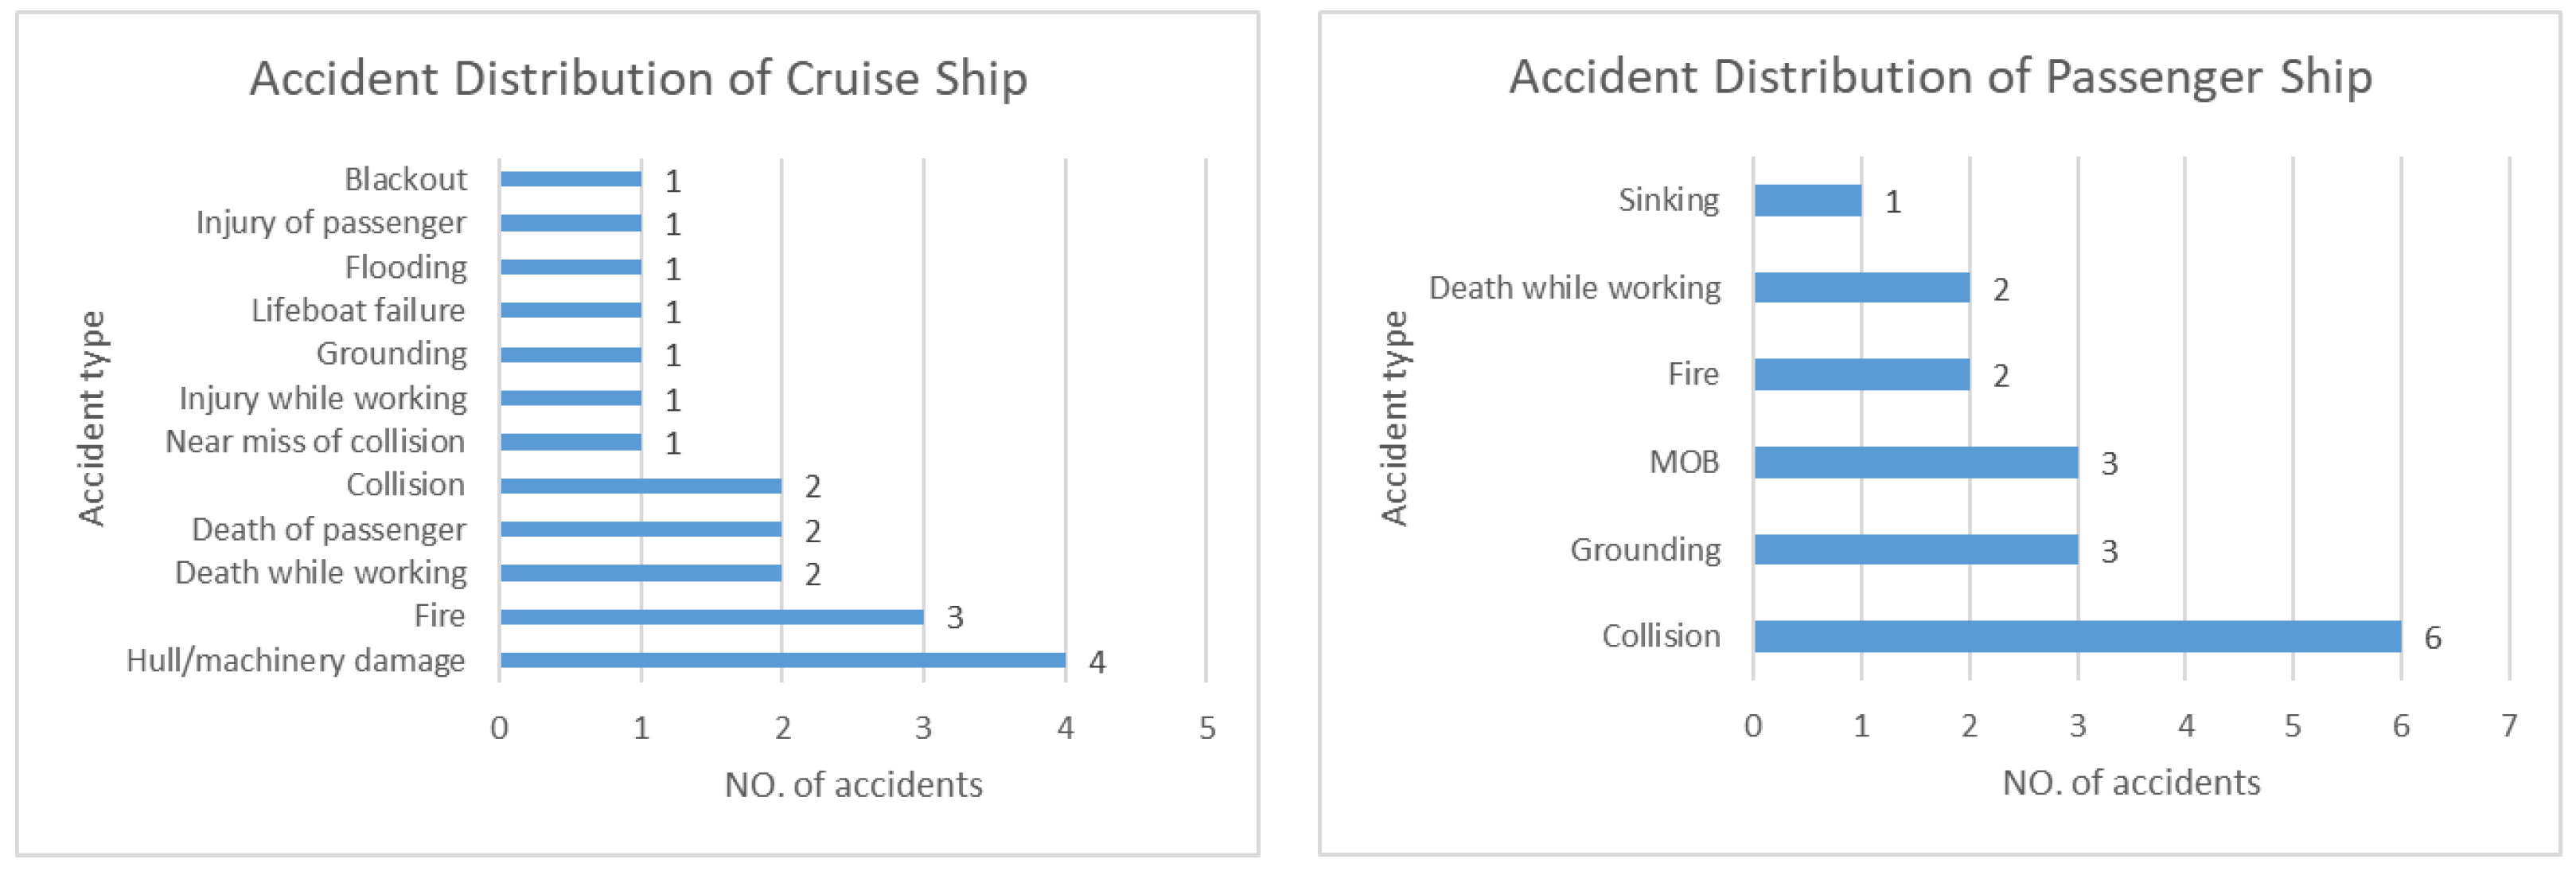
Given the great differences in accidents caused by different ship types, it is necessary to perform a specific analysis of the accidents caused by each type of ship to deeply analyze and excavate the implicit internal connection.
Figure 8,
Figure 9,
Figure 10 and
Figure 11 show the analytical results for the top eight accident ship types. Except for cruise ship, the most common accident among the other seven categories of ships is a collision. It can be seen that collisions are the primary problem threatening the safety of ships, and the most common accident for a cruise ship is hull or machinery damage. The second highest-ranked accident was grounding (excluding fishing boat and cruise ship), and the third highest-ranked and subsequent accident categories varied by ship type. To summarize, collision and grounding are the two most serious threats to merchant ship safety. This finding is congruent with the research articles [
14,
15,
16].
3. Domino Effect Model Based on TAR
The temporal association rule mining algorithm was originally developed by Das, G. [
17]. It is a widely used machine learning algorithm that adds a time dimension to the association rule algorithm in order to mine and discover hidden relationships between and within different types of accidents from the perspective of the domino effect, as well as revealing its triggering patterns between correlated factors and accidents. It can be expressed as follows:
where
X represents an event pattern and
Y represents another event pattern; it indicates that when
X occurs,
Y is likely to occur within t time.
The three key indicators of the temporal association rule are support, confidence, and lift. Support
S denotes the likelihood that both
X and
Y(t) occur in the same transaction, whereas confidence
C denotes the conditional probability that
Y(t) appears in the transaction if
X appears in the transaction. The lift value
L is the confidence of a rule divided by the frequency of the
Y(t) that appears in the rule.
where
T is the total number of transactions.
The goal of the temporal association rule is to mine the strong association rules that exist between transactions. We can understand the chain of accident transactions that are likely to occur from these strong rules, allowing us to give assistance regarding decisions for accident prevention and safety management.
An ideal temporal association rule should have high confidence and high support. Rules with low support are considered to occur by chance, while rules with low confidence are less reliable. As a result, minimum levels of confidence and support should be established. The support threshold provides the lowest degree of support required for the existence of an association link between a collection of transactions, whereas the confidence threshold defines the minimum dependability of a temporal association rule.
The lift value determines how much the presence of X affects the presence of Y(t). When the value is equal to 1, the existence of X and Y(t) are independent of each other and do not correlate; when the value is less than 1, the existence of X will suppress the appearance Y(t); when the lift value is greater than 1, the existence of X promotes the appearance of Y(t); and the greater the lift value, the greater the lifting effect.
To facilitate program processing, the leading factors and middle factors in
Table 1 need to be transformed, as shown in
Table 2:
The analysis in
Section 2 suggests that the high-frequency accidents vary in terms of ship types. We utilize the model for individual computations to correctly dig up the hidden information underlying the accidents and minimize mutual interference between various ships, the computation results are shown in
Table 3,
Table 4,
Table 5,
Table 6,
Table 7,
Table 8,
Table 9 and
Table 10. The strong association rules derived from the calculation results are summarized in
Table 11.
It can be seen that Ro-Ro ships have seven strong association rules in
Table 3. Most of them are regarding collision, grounding, hull damage, and death while working. All of their
L values are over 1 in terms of Equation (4). Fishing vessels have three rules from
Table 8, collision and subsequent crew death are the main accidents seen on them, and the factors that lead to collision include the failed bridge team and the violation of COLREGS (COLREGS are the International Regulations for Preventing Collisions at Sea, which comprise the maritime traffic rules that apply to all vessels upon the high seas and in all waters connected therewith, which are navigable by seagoing vessels). In the case of cruise ships, hull damage due to equipment failure is the sole substantial correlation rule. This result is inseparable from its high level of safety management and the high efficiency of accident prevention mechanisms. As demonstrated and described in
Table 11, the TARs of the other ships mostly center around accident chains with collision, grounding, and death while working as important nodes.
The strong association rules of the eight ship types have many commonalities and similarities. As illustrated in
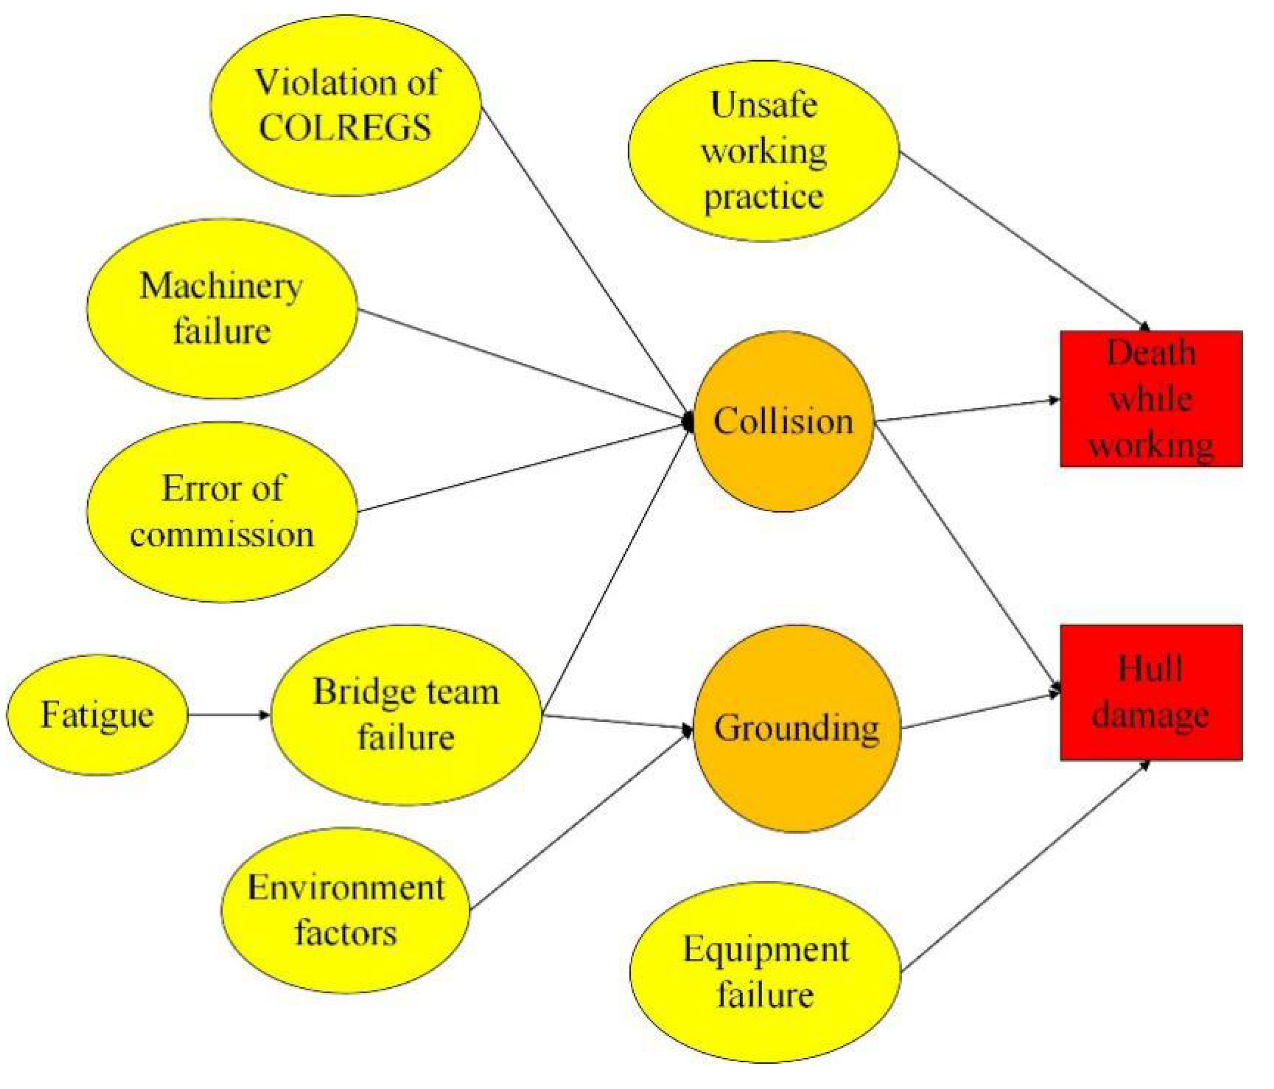
Figure 12, they may be further summarized in the following general high-frequency accident chains. The yellow modules in the diagram are either leading or intermediate factors. The orange and red modules reflect mishaps. From these accident chains, we can gain a better understanding of the formation mechanisms of a maritime accident. With this information, we may make targeted enhancements to operators’ safety management.
4. Discussion
The domino effect is well known and has been explored by many scholars but seldom in connection with maritime accidents. This work has advanced this step forward; the MAIB marine accident data were gathered and evaluated, and the domino effect model based on TAR was used to determine the formation mechanism behind the accidents. The findings demonstrate that most maritime accidents do not happen in an isolated manner but in a way that is similar to the domino effect, namely, they are transmitted one by one through a sequence of influencing events, finally resulting in the accidents. Referring to the visualization module in
Figure 12, it is easy to see that the yellow sections of the eight modules, i.e., unsafe working practices, violations of COLREGS, machinery failures, error of commission, fatigue, bridge team failure, environment factors, and equipment failure, are the areas that need to be focused on.
Table 12 shows how they may be retrieved in detail. A number of instances are provided, but they are not exhaustive. They are all based on MAIB investigation reports. That is, the contributing variables include not just research remarks but also accidents from previous marine tragedies. So, a good resource of accident chains and the contributing factors can be treated as a database and reference for maritime accident prevention and the upgrading of the safety management system.
5. Conclusions
Maritime accidents happening all the time and as of yet, they are unlikely to come to an end. Their genesis is complicated, and the immediate contributing factors are easy to detect but difficult to avoid. The cause is the accident chains hidden under the surface. The MAIB reports are used as the database in this work, which was processed and analyzed using the TAR-based domino effect model. The findings of this study can be summarized in the following two aspects:
(1) The following features of marine accidents are revealed by an examination of MAIB accident reports. The overall number of accidents each year is gradually decreasing, December is the most accident-prone month of the year, and collisions and grounding are the most common forms of accidents. Ro-Ro ships, general cargo ships, container ships, oil/chemical tanker, bulk carriers, fishing vessels, cruise ships, and passenger ships are the top eight ship types involved in accidents.
(2) The strong association rules calculated according to the domino effect model is the chain of accidents mechanism, as indicated in
Figure 12. The primary contributing elements are mostly the leading factors of the accident chains. The accident chains can be viewed as the Swiss cheese model [
19], which includes several active and latent failures. As a result, the accident chains could help us identify and comprehend all the contributing components, including hidden and immediate causes. They have been listed in detail in
Table 12. The results can provide some valuable insights for implementing targeted strategies to minimize the occurrence of marine accidents and improve maritime safety.
However, despite the findings, this article has shown some limitations. Firstly, the data source of the maritime accidents could be extended to enhance the credibility of the research findings. For example, the accident reports from Australian Transport Safety Board (ATSB), Federal Bureau of Maritime Casualty Investigation (BSU, Hamburg, Germany), National Transport Safety Board (NTSB, Washington, D.C., USA), Transportation Safety Board of Canada (TSB, Gatineau, Quebec) and Japan Transport Safety Board (JTSB, Tokyo, Japan) could be utilized. Secondly, the model used in this paper can only apply to sequential trigger events and propagation modes, not to non-sequential accident propagation modes, the study of which could be an improvement in future research. Thirdly, this research paid much attention to the human factor that causes the accidents and comparatively overlooked other factors, e.g., traffic intensity and geographical factors. Finally, in view of the limited data, this study does not apply the model to cruise ships and passenger ships.


