Article

Use of Hybrid Causal Logic Method for Preliminary Hazard Analysis of Maritime Autonomous Surface Ships

1
School of Transportation and Logistics Engineering, Wuhan University of Technology, 1040 Heping Avenue, Wuhan 430063, China
2
National Engineering Research Center for Water Transport Safety, Wuhan University of Technology, 1040 Heping Avenue, Wuhan 430063, China
3
Inland Port and Shipping Industry Research Co., Ltd., Shaoguan 512100, China
4
Intelligent Transportation Systems Research Center, Wuhan University of Technology, 1040 Heping Avenue, Wuhan 430063, China
5
Chinese Flight Test Establishment, 8 Shifeiyuan Road, Xi’an 710089, China
6
Department of Mechanical Engineering, Aalto University, 02150 Espoo, Finland
7
School of Navigation, Wuhan University of Technology, 1040 Heping Avenue, Wuhan 430063, China
*
Author to whom correspondence should be addressed.
J. Mar. Sci. Eng. 2022, 10(6), 725; https://doi.org/10.3390/jmse10060725
Submission received: 20 April 2022 / Revised: 21 May 2022 / Accepted: 23 May 2022 / Published: 25 May 2022

Abstract

:
Recently, the safety issue of maritime autonomous surface ships (MASS) has become a hot topic. Preliminary hazard analysis of MASS can assist autonomous ship design and ensure safe and reliable operation. However, since MASS technology is still at its early stage, there are not enough data for comprehensive hazard analysis. Hence, this paper attempts to combine conventional ship data and MASS experiments to conduct a preliminary hazard analysis for autonomy level III MASS using the hybrid causal logic (HCL) method. Firstly, the hazardous scenario of autonomy level III MASS is developed using the event sequence diagram (ESD). Furthermore, the fault tree (FT) method is utilized to analyze mechanical events in ESD. The events involving human factors and related to MASS in the ESD are analyzed using Bayesian Belief Network (BBN). Finally, the accident probability of autonomy level III MASS is calculated in practice through historical data and a test ship with both an autonomous and a remote navigation mode in Wuhan and Nanjing, China. Moreover, the key influence factors are found, and the accident-causing event chains are identified, thus providing a reference for MASS design and safety assessment process. This process is applied to the preliminary hazard analysis of the test ship.

1. Introduction

Thanks to the rapid development of the artificial intelligence and 5G technology, autonomous ships will become one of the key transportation vehicles in the future [1,2,3]. Nowadays, several companies and organizations have performed research on MASS. The vehicle ferry Falco successfully navigated autonomously during its voyage between Parainen and Nauvo, and its return journey was conducted under remote control [4]. Wärtsilä successfully tested such innovative technology into a voyage, during which a vessel was automatically controlled by a software, while manual intervention and control was still possible at any time [5]. YARA and Kongsberg are building a ship named “YARA Birkeland”, which will be the world’s first fully electric and autonomous container vessel upon completion [6]. DNV GL built a 1:20 scale model of MASS to investigate sensor fusion and collision avoidance [7]. The AAWA project aimed to produce the preliminary specifications for the next generation of advanced ship solutions [8]. Finally, the MUNIN research project developed a technical concept for the operation of an unmanned merchant ship and assessed its technical, economic and legal feasibility [9]. In order to clarify the definition of autonomous ships, the International Maritime Organization (IMO) defines autonomous ships as maritime autonomous surface ships (MASS). MASS is classified into four degrees according to their autonomy level, as follows [10,11]. Note that, during the navigation of MASS, the MASS can change the autonomy level according to the scenario:
  • Autonomy level I: Ship with automated processes and decision support: Seafarers are on board to operate and control shipboard systems and functions. Some operations may be automated;
  • Autonomy level II: Remotely controlled ship with seafarers on board: The ship is controlled and operated from another location, but seafarers are on board;
  • Autonomy level III: Remotely controlled ship without seafarers on board: The ship is controlled and operated from another location. There are no seafarers on board;
  • Autonomy level IV: Fully autonomous ship: The operating system of the ship is able to make decisions and determine actions by itself.
The safety of MASS will become a key issue for autonomous ship operations. MASS should have the desired level of safety, i.e., at least the same safety level as conventional ships [12]. Researchers believe that, compared to conventional ships, MASS are more economical and safer due to the reduction in crew on board [13,14]. Moreover, changed technologies, systems and procedures also bring new influence factors [15,16,17]. Thus, there is an urgent need for a risk assessment of MASS to assist MASS design.
Maritime risk assessments are considered a hotspot for MASS [18,19,20]. Due to complexity and novelty of MASS, several studies were performed for hazard identification, which is the basis for risk assessment. Fan et al. proposed a framework for the identification of factors that influence the navigational risk of remotely controlled MASS without crew on board [21]. It classifies a total of 55 influence factors into ship-related, human-related, environment-related and technology-related factors. More in detail, failure of onboard equipment may result in the degradation or failure of functions related to propulsion. At the same time, the results show that the majority of these influence factors are related to human error. Kretschmann et al. [22] found 23 identified hazards with acceptable risk based on a formal safety assessment (FSA). These hazards are related to various influence factors such as weather, equipment and cyber security. Human errors may be related to remote monitoring, control and maintenance. At the same time, this study shows that a failure of the power and propulsion system will lead to unacceptable consequences. Wróbel et al. [19] reviewed a hundred maritime accident reports, analyzing various safety hazards that lead to accidents for conventional ships based on what-if and human factors analysis and classification system for marine accident (HFACS-MA) methods, and considering the impact of these safety hazards on MASS. The results show the existence of the human factor in unmanned systems’ operation, as long as people are involved in operation. In summary, almost all studies on MASS hazard identification mentioned the complexity and diversity of MASS influencing factors, as well as the significant influence of mechanical failure and human error.
Based on hazard identification, some studies have been conducted to analyze equipment failure and human error. In relation to the human error in SCC, Ramos et al. [23] divided the possible human error process into four stages, and established an event tree model of the MASS. Moreover, they classified the influencing factors, describing their differences across various human factor reliability analysis methods and the shortcomings of the current behavior influencing factor set, simulating the human–machine interaction process and proposing an avoidance based on hierarchical task analysis. Man et al. [24] invited six participants to conduct a scenario-based simulation as proposed operators in the SCC. Their conclusions suggest that human factor issues, such as psychophysical and perceptual limitations of operators, decision-making latencies and automation bias, may remain in systems assembled by assumed reliable technological components. Zhang et al. [11] presented a model based on the Technique for Human Error Rate Prediction (THERP) and on Bayesian Network, which can depict the causal relationship focused on human–autonomy collaboration and perform a quantitative assessment. Unlike for human errors, research on equipment failure focuses mainly on power and propulsion systems. Bolbot et al. [25] analyzed the hazards related to the electric propulsion system based on the System theoretic process analysis (STPA) method. In addition, Bolbot et al. [26] combined event tree analysis (ETA), fault tree and STPA method to analyze a simplified diesel electric propulsion system and identify the hazardous scenarios leading to a blackout. Wang et al. [27] determined the weakness of the ship power system and put forward a design of the ship power plant. These studies provided a reference for MASS designers in case of human error or equipment failure. However, they overlooked the influence of individual factors on the safety of the entire MASS, and often neglected the mutual influence of different factors.
The hazard scenario of MASS usually gradually evolves from a hazard event. Different outputs of safety barriers in this process will lead to different end states. The interaction among influence factors needs to be taken into consideration in this complex process [28]. Thieme et al. [29] formulated nine criteria and used them to assess 64 relevant ship risk models since 2005. The results show that none of them are suitable to be directly used for MASS risk assessment. In fact, MASS risk assessment should comprehensively include various influence factors, instead of only analyzing specific factors. Accordingly, new methods have been applied for MASS risk assessment. The STPA method has been applied to MASS, as it can analyze the interactions between its components. Valdez Banda et al. [30] applied the STPA to analyze the safety hazards in the foreseen functioning of two concepts of autonomous ferries operating in urban waterways in, and near, the city of Turku in Finland. Employing the STPA, a safety-controlled structure and hazard list has been created for the system to ensure that remotely controlled ships do not have a negative impact on maritime safety [18]. Wróbel et al. [31] applied the STPA to identify the hazards, formulate hazard mitigation and improve the safety performance of autonomous ships. In addition, Utne et al. [16] proposed a framework combining STPA and Bayesian Belief Networks to establish an online risk model for autonomous ships. In parallel, Ramos et al. [32] proposed the human–system interaction in autonomy (H-SIA) method, which consists of an event sequence diagram (ESD) and concurrent task analysis (CoTA), to analyze the system as a whole and focus on the interactions between sub-systems. At the same time, Ramos et al. [28] extended the H-SIA to include the paths to failure through the Fault Tree (FT). However, these approaches can only be used in qualitative analyses, and are not suitable to perform quantitative analyses. The relationship of potential hazards of MASS can be easily described by these qualitative methods. However, the failure probability and sensitivity of potential hazards cannot be obtained. The results have limited contribution to the safety design of MASS.
Since MASS is still in the experimental stage and concept stage rather than the operation stage, there are insufficient data to quantitatively analyze the risk of MASS. A preliminary risk analysis should take place to evaluate the ability of the MASS to operate safely and reliably during the concept and experimental stages [12]. In this study, we want to develop a model which can perform a preliminary hazard analysis of MASS. For the function during concept stage, the historical data such as failure rate are used for qualitative analysis. For the function during the experimental stage, the experimental data of the MASS model are used to develop the quantitative model. This result will be used to further improve the performance of MASS experiment. At the same time, the data can assist in judging whether these concepts of MASS are suitable or not and help develop the function which is still in the concept stage.
The shift from conventional ships to autonomous ships is a gradual process [21]. Compared with conventional ships, the MASS will be equipped with an autonomous system (AS) that may help or replace human decision-making and action. At the highest level of autonomy, MASS can be controlled by AS completely. Given the current development of MASS technology, in the near future, MASS will have a constrained autonomy, and their operation will be supervised or controlled by a shore control center (SCC) [33]. Autonomy level III MASS will be an important stage with the participation of AS and operators in SCC. According to the elaboration of autonomy level III, MASS are equipped with AS, an advanced sensor module, a SCC, a satellite communication equipment, alarm devices, other facilities and without anyone onboard. Various sensors will provide sufficient data for AS system and SCC to identify the navigation status and environment. The AS system can control navigation according to the surrounding environment and ship condition; in case of hazardous events, it will propose strategies to guarantee the safety of MASS. At the same, the operator in SCC will supervise the operation of MASS, including the operating environment, decision proposed by AS, etc. The remote operator has the highest right to take over the control of MASS at any time. In case the AS system cannot propose effective measures or a situation develops in a particularly difficult direction, the SCC can take over the control of the MASS and dispatch a professional team to deal with problems [34]. Above all, the autonomy level III MASS is a suitable object to conduct a preliminary hazards analysis for MASS.
The hybrid causal logic (HCL) methodology provides a vehicle for the identification and communication of cause–effect relations including those associated with human, organization and system hardware and software, and the physical and regulatory environment of the system [35]. The HCL method uses ESD as the first layer to describe system behavior, and then provides a more detailed picture of the contributing causes by using FTs. Fault tree analysis is the one of the popular techniques used for reliability studies for a complicated system [36]. Fault trees are widely used in mechanical systems with obvious structure and causal logic such as the aviation industry and offshore systems. Mohaghegh et al. [37] applied the HCL method to include the organizational roots of risk. Groth et al. [38] introduced a software platform for the HCL method and applied it to analyze a type of aviation accidents. Røed et al. [39] discussed the applicability of HCL to the offshore industry and its relationships with the barrier and operational risk analysis project (BORA). Sklet et al. [40] applied the HCL to analyze the installation-specific factors with respect to technical systems, operational conditions, and human and organizational factors. Thus, the HCL method is a suitable tool to analyze MASS, as it includes various influence factors.
Based on these considerations, this article hopes to introduce the HCL method into MASS to assist the early design of MASS. Taking contact hazards as an example, this paper applies the experimental MASS model and historical data to conduct hazard analysis on MASS. The ESD was applied to define the hazard scenario, focusing on the interaction between AS and operators in the SCC. For non-human-related events (such as mechanical failure) that can be decomposed into the equipment level, we applied the FT to develop a branch model to analyze in detail the influence factors. The concept of the mechanical system of MASS and the failure data of conventional ships were used to conduct a preliminary analysis. As for human- and organization-related events, due to their uncertainties, we applied the Bayesian Belief Network (BBN) to analyze in detail the influence factors based on the experimental statistics This process was applied to demonstrate a case study of a test ship, equipped with an autonomous navigation mode and a remote navigation mode in Wuhan and Nanjing, China.
The rest of this paper is organized as follows. Section 2 describes the HCL methodology used to develop the model. Section 3 presents the MASS hazard scenarios. Section 4 introduces the quantitative case study of contact scenario. Finally, Section 5 presents the conclusions of this study and the future work.

2. Methodology

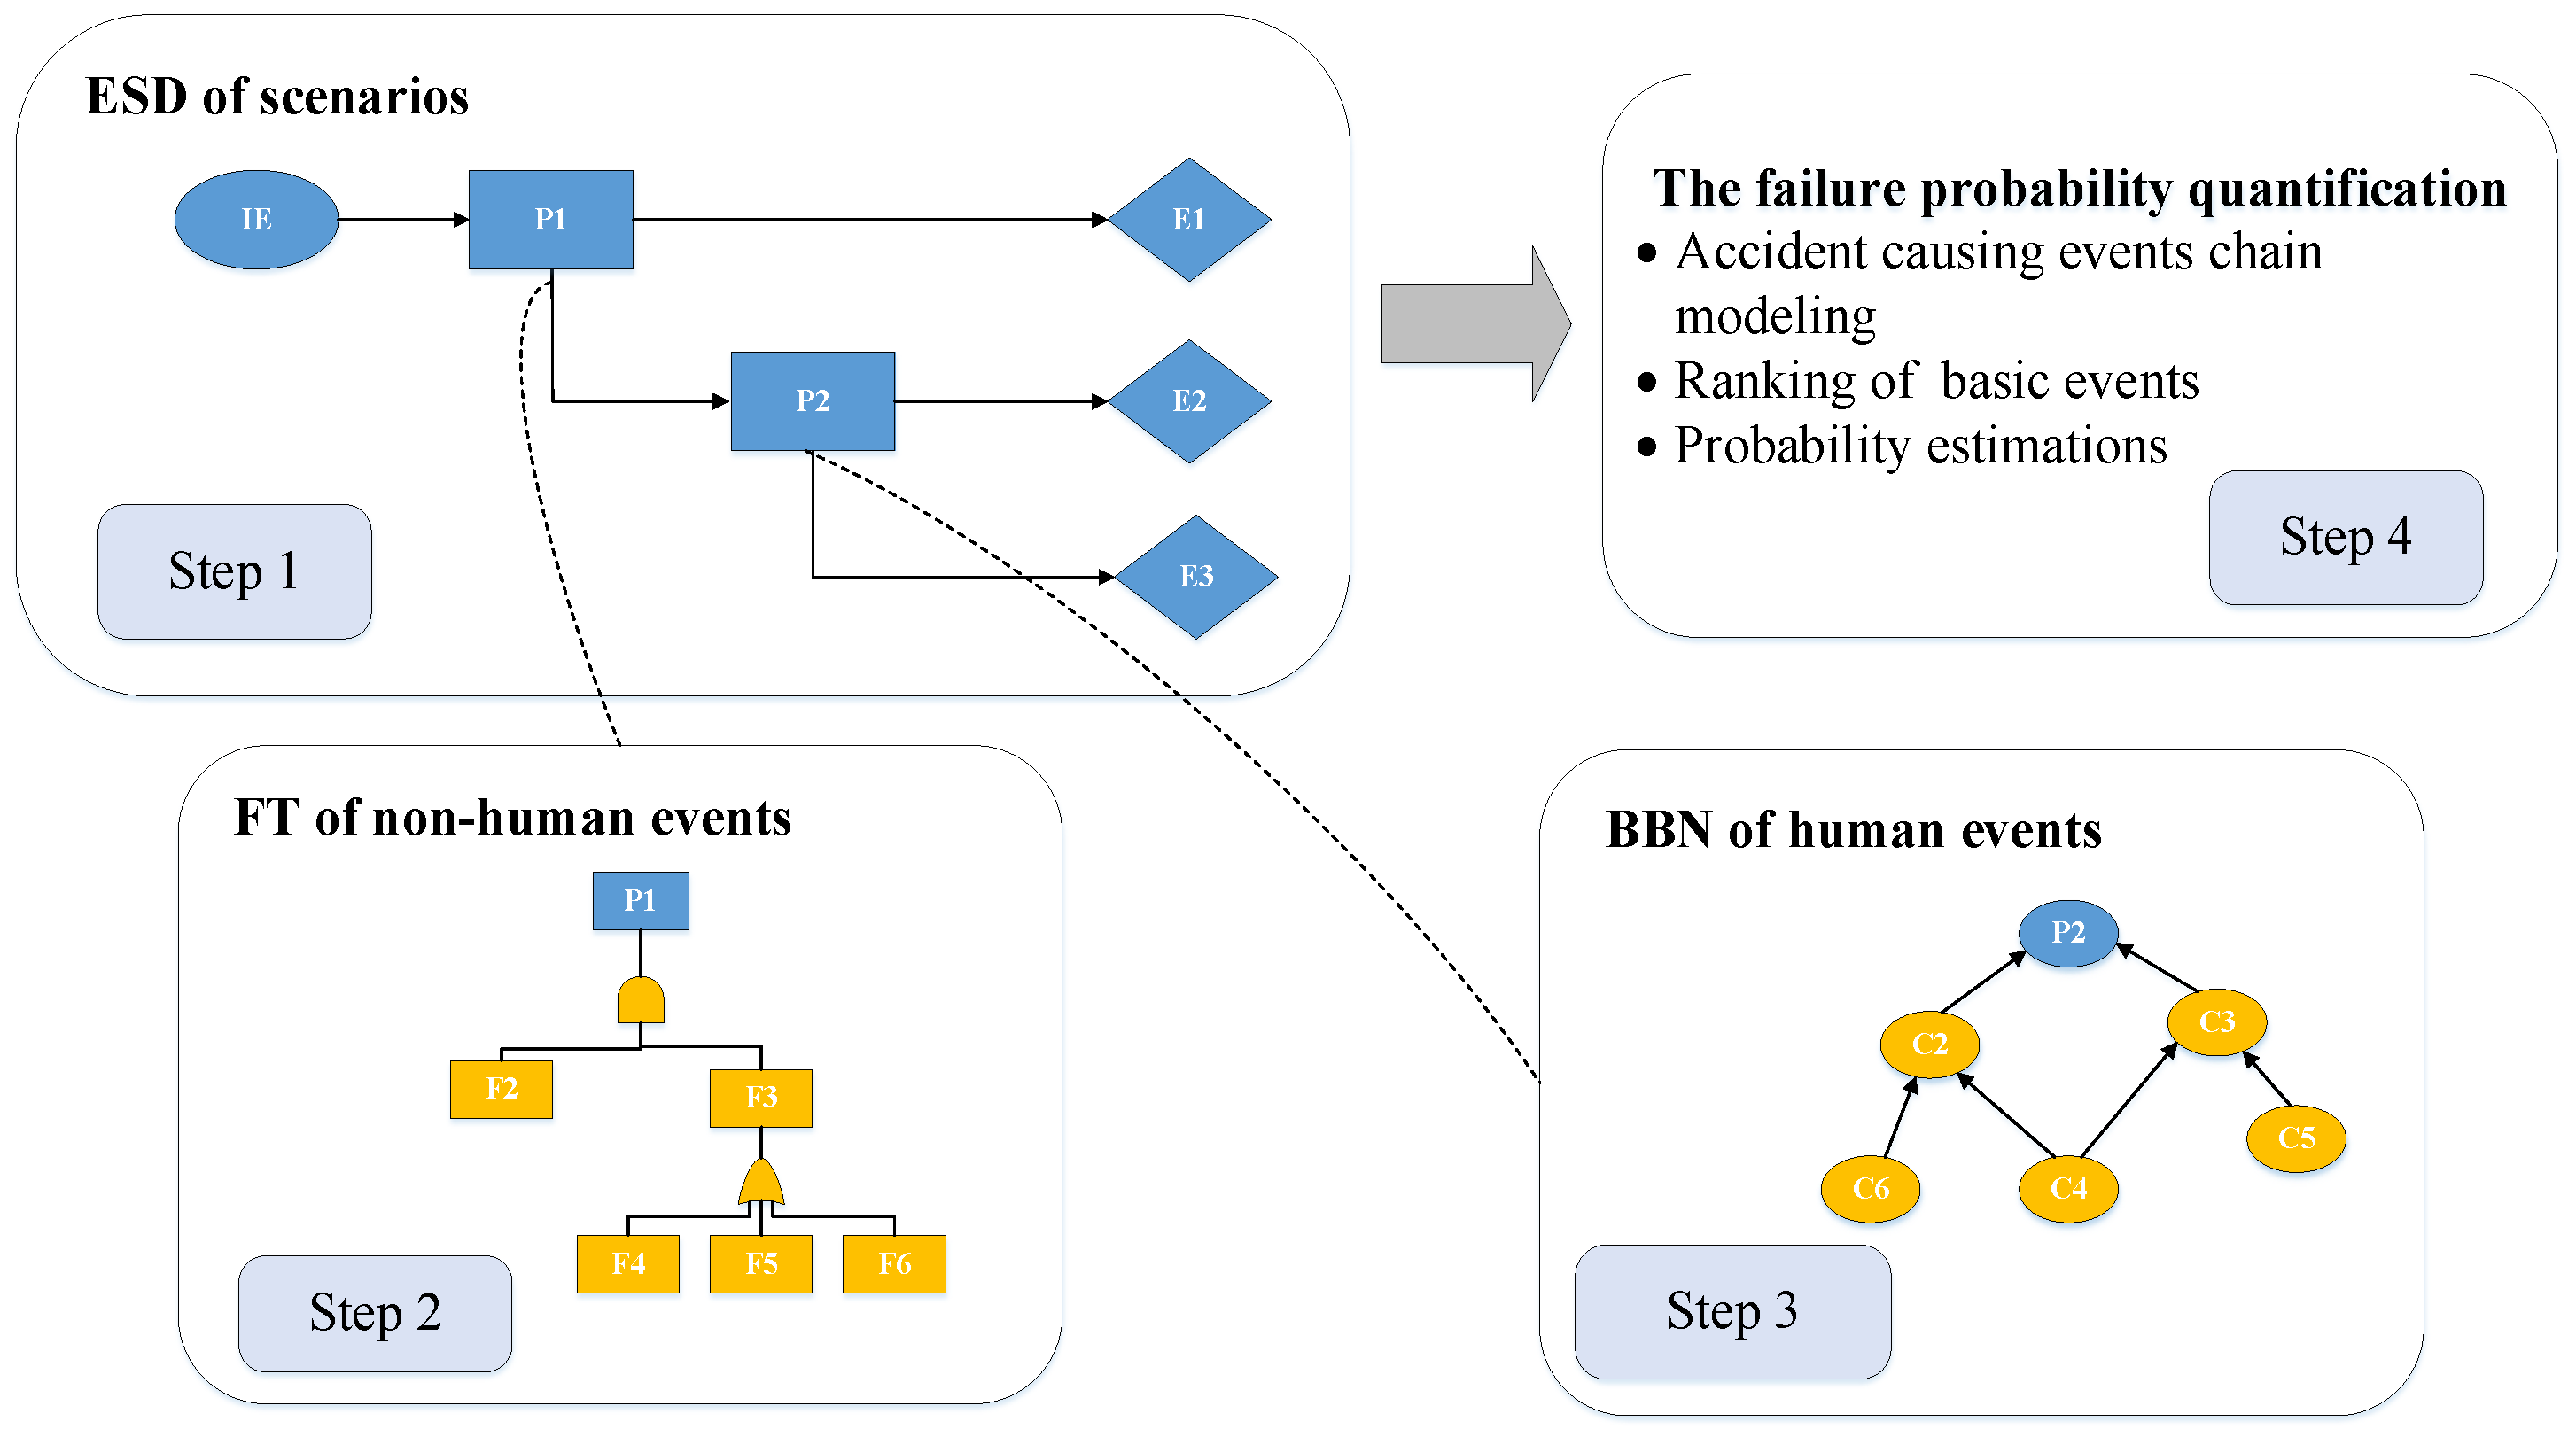
HCL methodology is a powerful modeling tool for developing hazards scenarios and search the more detail potential hazards. Figure 1 presents the main framework and the flowchart of the HCL method. The application of HCL can be divided into 4 steps and described in detail below.
Step 1: Development of a MASS hazard scenario using ESD. ESDs are used to define the system hazard scenarios. The ESD presents a temporal sequence of events, from an initiating event to various end states. The initiating event (IE) is commonly a hazardous event or a source of risk. Once a hazardous event occurs, some safety barriers, regarded as pivotal events in ESD, should be adopted to prevent or mitigate the hazard. The output of safety barriers (i.e., normal or failure of operation) determines whether or not the hazardous event evolves into an accident. Different pivotal events and their output will lead to different end states, such as safe or accident states. In order to determine the probability of each end state, the probability of each pivotal event output (i.e., normal or failure of operation) must be obtained. According to the characteristics of pivotal events, their detailed influence factors can be analyzed using FT and BBN. In this study, the equipment events were analyzed using FT, as shown in Step 2. The events involving human factors were analyzed using BBN, as shown in Step 3.
Step 2: Analysis of mechanical events using FT. The FT is used to develop a branch model to quantitative analyze mechanical events in ESD. Fault tree analysis is the one of popular techniques used for reliability studies for a complicated system. The system failure event is regarded as top event. The subsystem failure events which may cause the top events are identified and linked to top event through logical connective function (such as AND/OR gate) [36]. Fault trees are widely used in mechanical systems with obvious structure and causal logic such as the aviation industry and offshore systems. The quantitative analysis of the fault tree first needs to convert the logical structure established by it into an equivalent probability expression. Once the failure rate and operation time are obtained, the failure probability of the basic event can be calculated. Thus, according to the equivalent probability expression, the failure probability of the top event can also be obtained.
Step 3: Analysis of events related to human factors using BBN. Unlike for mechanical events, the events related to human factors are non-deterministic and uncertain, and can be effectively analyzed using BBN. The BBN network consists of nodes and directed arcs. The events involving human factors in ESD are regarded as target nodes in the BBN network. The detailed influence factors of the events involving human factors are regarded as sub-nodes. The nodes are divided into various states according to their characteristics and requirements, while the arcs between nodes represent the direct influences. Similar to FT, the BBN also allows us to quantify the probability of events in the ESD when the probability of root nodes and conditional probability table are obtained (see further details in Section 3.3).
Step 4: Quantification of the failure probability. The probability of events in ESD are calculated in Steps 2 and 3. This way, we obtain the occurrence of various end states by logics. At the same time, the hazard scenario can be expressed by the accident-causing events. These chains of events can be ranked according to their probabilities. In addition, important measures are adopted to provide information about the criticality of basic events according to their contribution to the overall system performance (see Section 4 for further details).

3. HCL Model for the Hazard Scenario for Mass

The preliminary hazards analysis for MASS should at least cover the relevant hazards such as collision/contact, grounding, unable to detect, etc. [12,41,42,43]. In this section, we take contact with foreign objects/obstacles (non-detected and detected) as an example. Contact refers to ships striking or being struck by an external object include floating object, fixed object or flying object. According to the definition of the contact scenario, several experiments were carried out in the Tangxun Lake in Wuhan and in the Qinhuai River in Nanjing, China [44]. Through the experiments and historical database, the hazard model for contact scenarios of MASS is developed.

3.1. Develop a MASS Hazard Scenario Using ESD

It is important to understand the entire process of MASS contact scenarios. Once an external object occurs, the AS and the operators in the SCC have a responsibility to detect it and avoid [28]. The MASS will strike or be struck by an external object if the course/speed of the vessels does not change.
To assist in the analysis of the contact scenarios for MASS, the ESD is used to develop a model. IE usually refers to potentially hazardous events that may lead to accidents. In the contact scenario, the initiating event (IE) is commonly an external object appears on the planned sailing route. For a better description, several pivotal events and end states of the contact scenario are classified into three stages: (1) hazardous event perception; (2) decision-making; and (3) execution based on the experimental situation combined with experts’ knowledge [21,28,45]. They are described as follows:
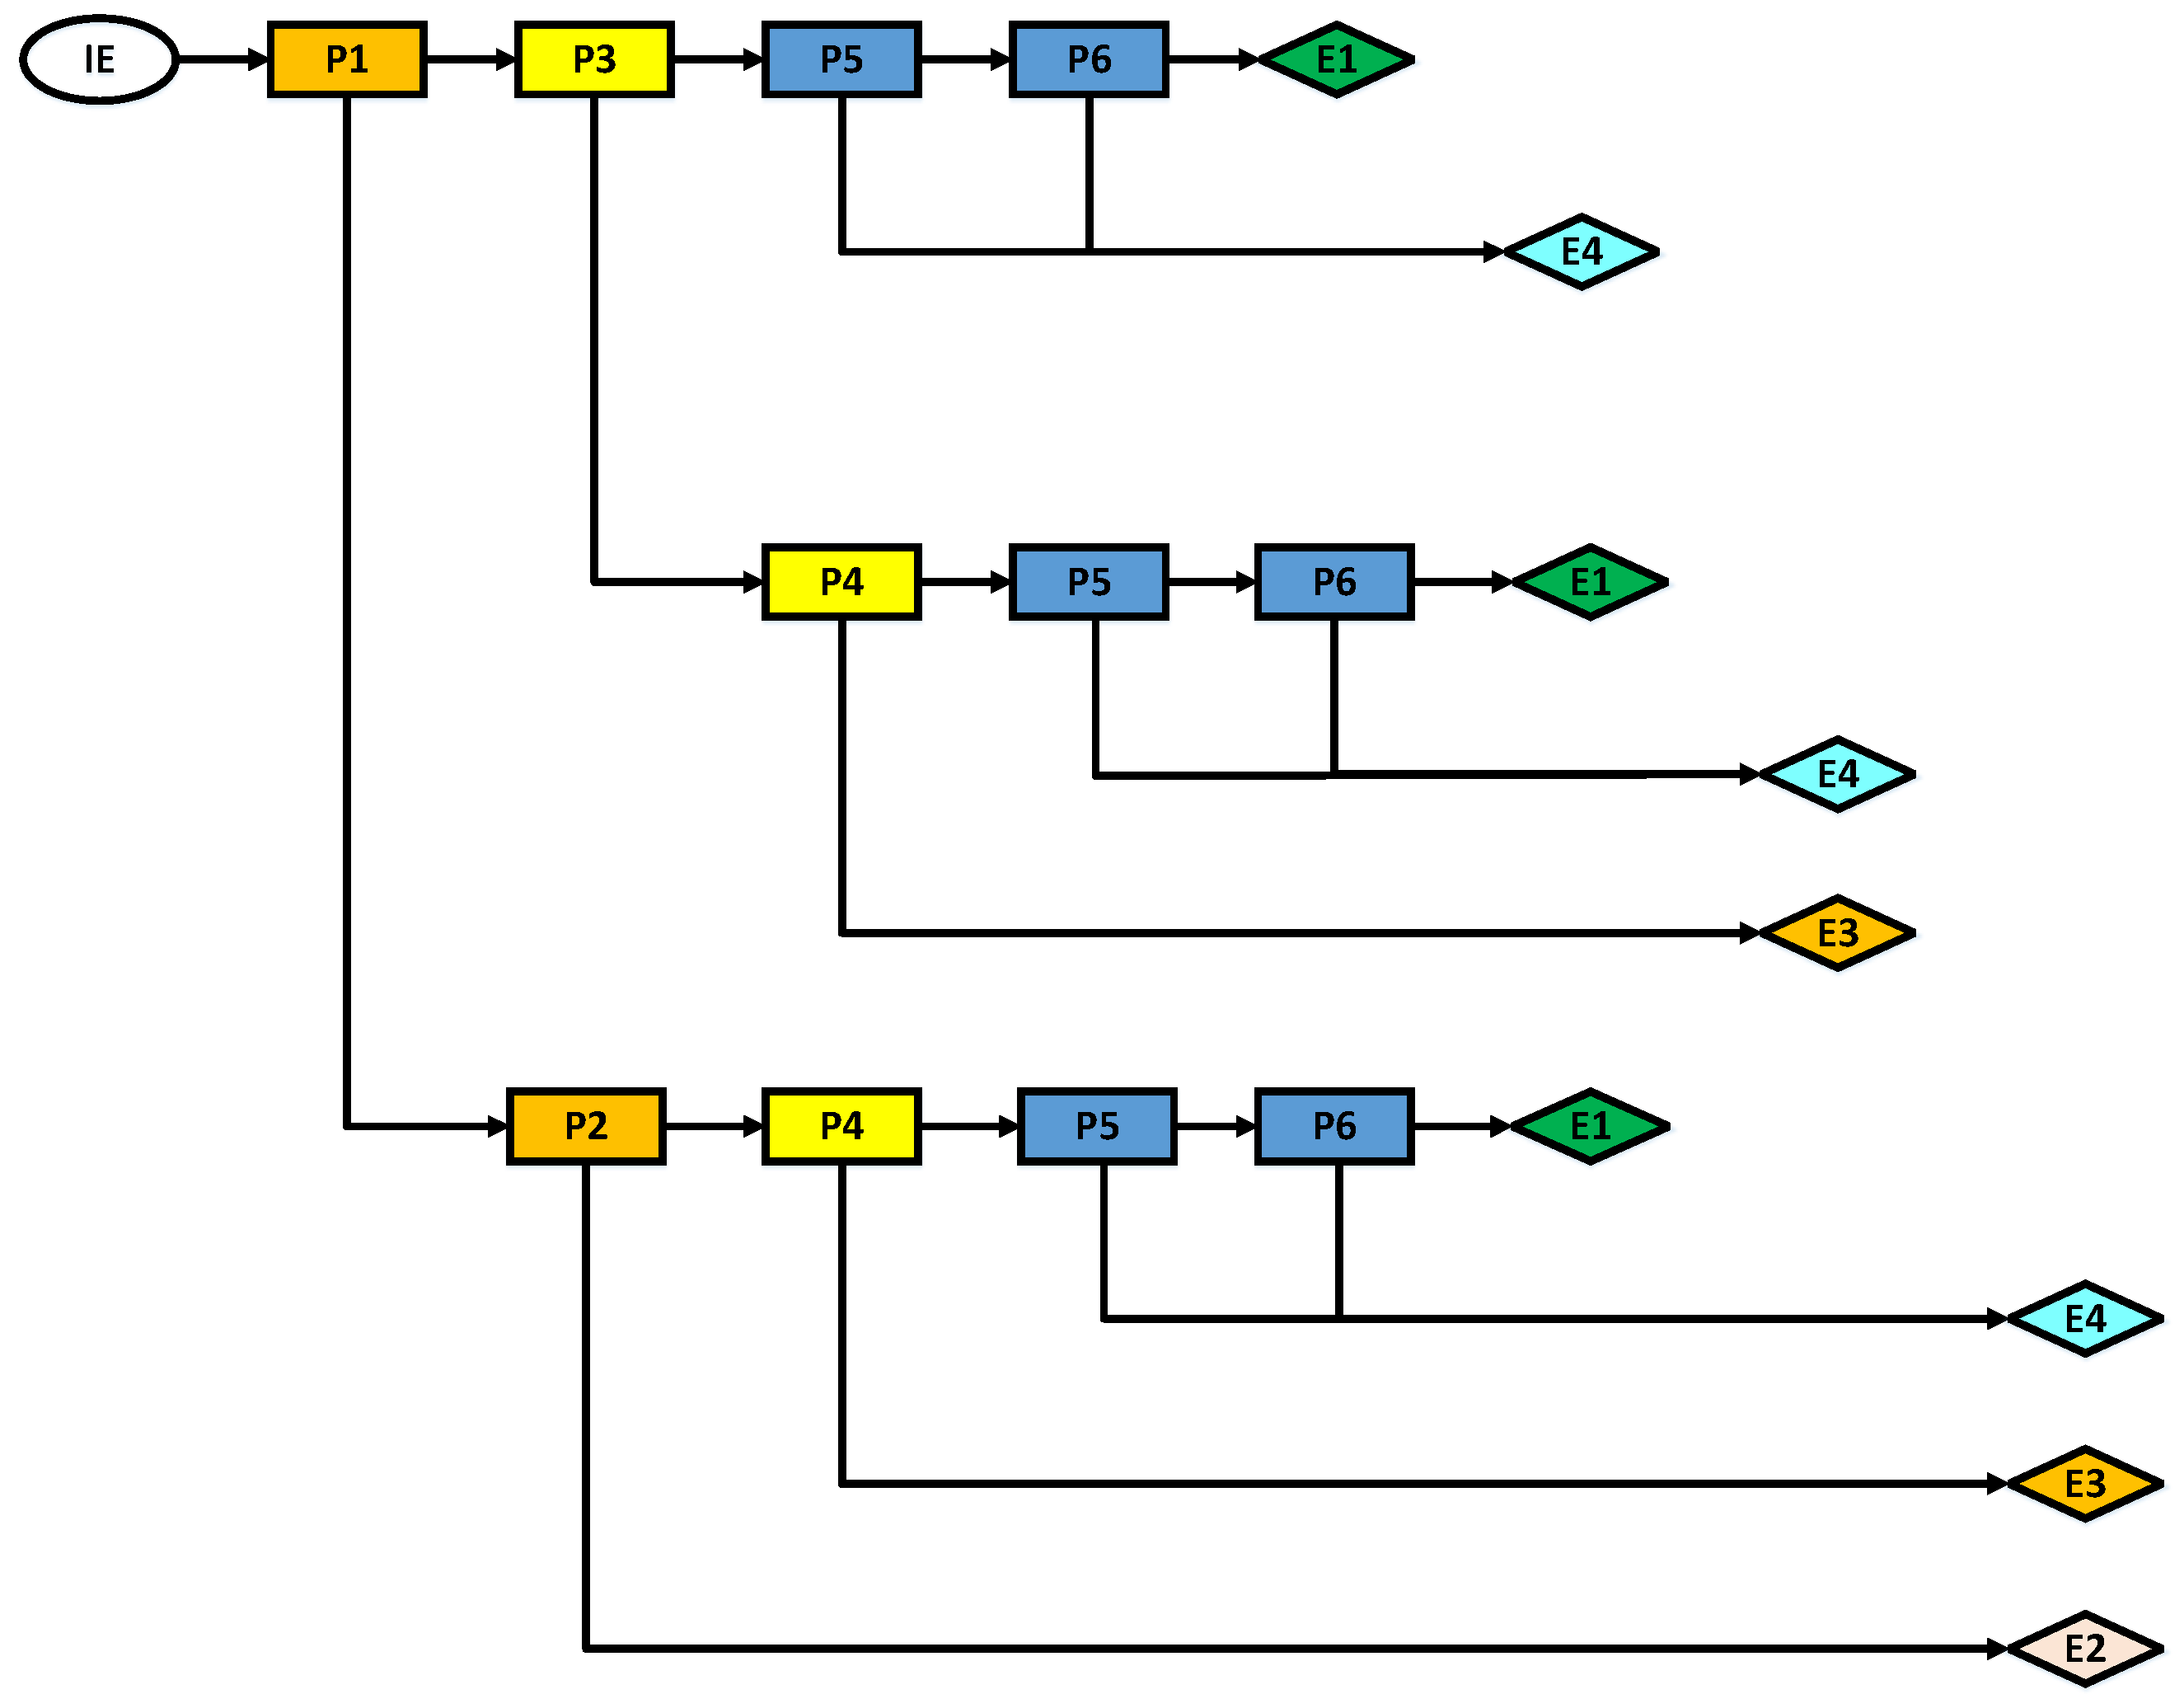
  • λPerception stage: In this stage, the external object is perceived by the MASS; accordingly, information should be acquired based on sensors and human perceptions. Through the analysis of information, the MASS can detect the external object in two ways [12]. The first way mainly relies on sensing devices and AS and is labeled as ‘detection by AS’ (P1). Accordingly, the MASS is equipped with various sensing devices that ensure a timely perception of hazardous events. The second way is labeled as ‘detection by SCC’ (P2), where operators in SCC should monitor the MASS in case the external object is not perceived by the sensing devices. A failure in the perception stage will directly lead to an accident.
  • λDecision-making stage: In this stage, an agent (either the AS or the operators in the SCC) should propose an effective strategy to prevent contact with external objects according to the data and information gathered at the perception stage. This covers situation assessment, diagnosis and response planning [28]. In this stage, the AS should control the ship and propose a strategy to avoid the external events, an occurrence labeled as ‘control by AS’ (P3). If the AS cannot propose an effective strategy, the operators in the SCC should take over the control of MASS, an occurrence labeled as ‘remote control by the SCC’ (P4).
  • λExecution stage: In this stage, the MASS should successfully execute the strategy selected at the decision-making stage. More in detail, the actuators will operate a control system to change the course/speed according to the strategy [12]. In this study, the execution system mainly includes the ‘steering system’ (P5) and the ‘power and propulsion system’ (P6).
The normality or failure of operation of pivotal events will lead to different end states. In this study, four end states were determined. In the ‘normal navigation’ (E1) end state, the MASS successfully avoid the objects and has the ability to continue navigation. In ’accident due to perception failure’ (E2), the MASS does not recognize external objects and struck with them. In ’accident due to decision-making failure’ (E3), the MASS does not propose effective strategies to avoid the external object. Finally, in ’accident due to execution failure’ (E4), the MASS does not adjust the speed and course lead in a timely manner due to a mechanical failure resulting in a contact accident.
The description of the pivotal events and of the end states in the contact scenario is presented in Table 1. At the same time, the ESD model for the MASS contact scenario was elaborated and is shown in Figure 2.

3.2. Analysis of Mechanical Events Using FT

In order to prevent the contact accident, MASS needs to adjust the course and speed which mainly relied on steer system and power and propulsion system. In this study, we developed a model for the MASS power and propulsion system using the FT method as an example.
Since there is no MASS in operation, its mechanical system structure and failure data cannot be obtained. In the current study, the researchers usually use the failure data of conventional ships to continue the research about the MASS [49]. Thus, in this section, we will develop a FT for the mechanical events of MASS based on the MUNIN report and DNV GL guideline.
In conventional ships, machinery problems have a very high frequency of causing minor incidents which, however, will be more severe in MASS without maintenance [22]. The power and propulsion system of a conventional ship, which includes the main engine, the propeller and the auxiliary system, is considered to be the cause of major ship technical failures. Thus, the normal operation of the mechanical system is key for MASS navigation. There are different opinions about the MASS power and propulsion system. Some projects, such as the AAWA project and the ReVolt project, selected batteries as power source because they have a good efficiency and can ensure zero emissions [8]. In the MUNIN project, the diesel engine propulsion line was selected as the propulsion system [22]. Although the forms of power and propulsion are different, it is commonly accepted that MASS should be purposely built with redundant energy propulsion systems. In this study, we adopted the requirement that MASS should be arranged with a minimum of two independent propulsion lines, as proposed by DNV GL. In parallel, each propulsion line should have a sufficient capacity to meet the specifications for normal operation [12]. This arrangement has two advantages: (i) the two propulsion lines are redundant; and (ii) two independent propulsion lines can prevent common cause failures. In this study, considering that the energy provided by the battery is not enough to support long-term sailing, the diesel electric propulsion was selected as the power and propulsion system. The equipment in the power and propulsion system is shown in Table 2.
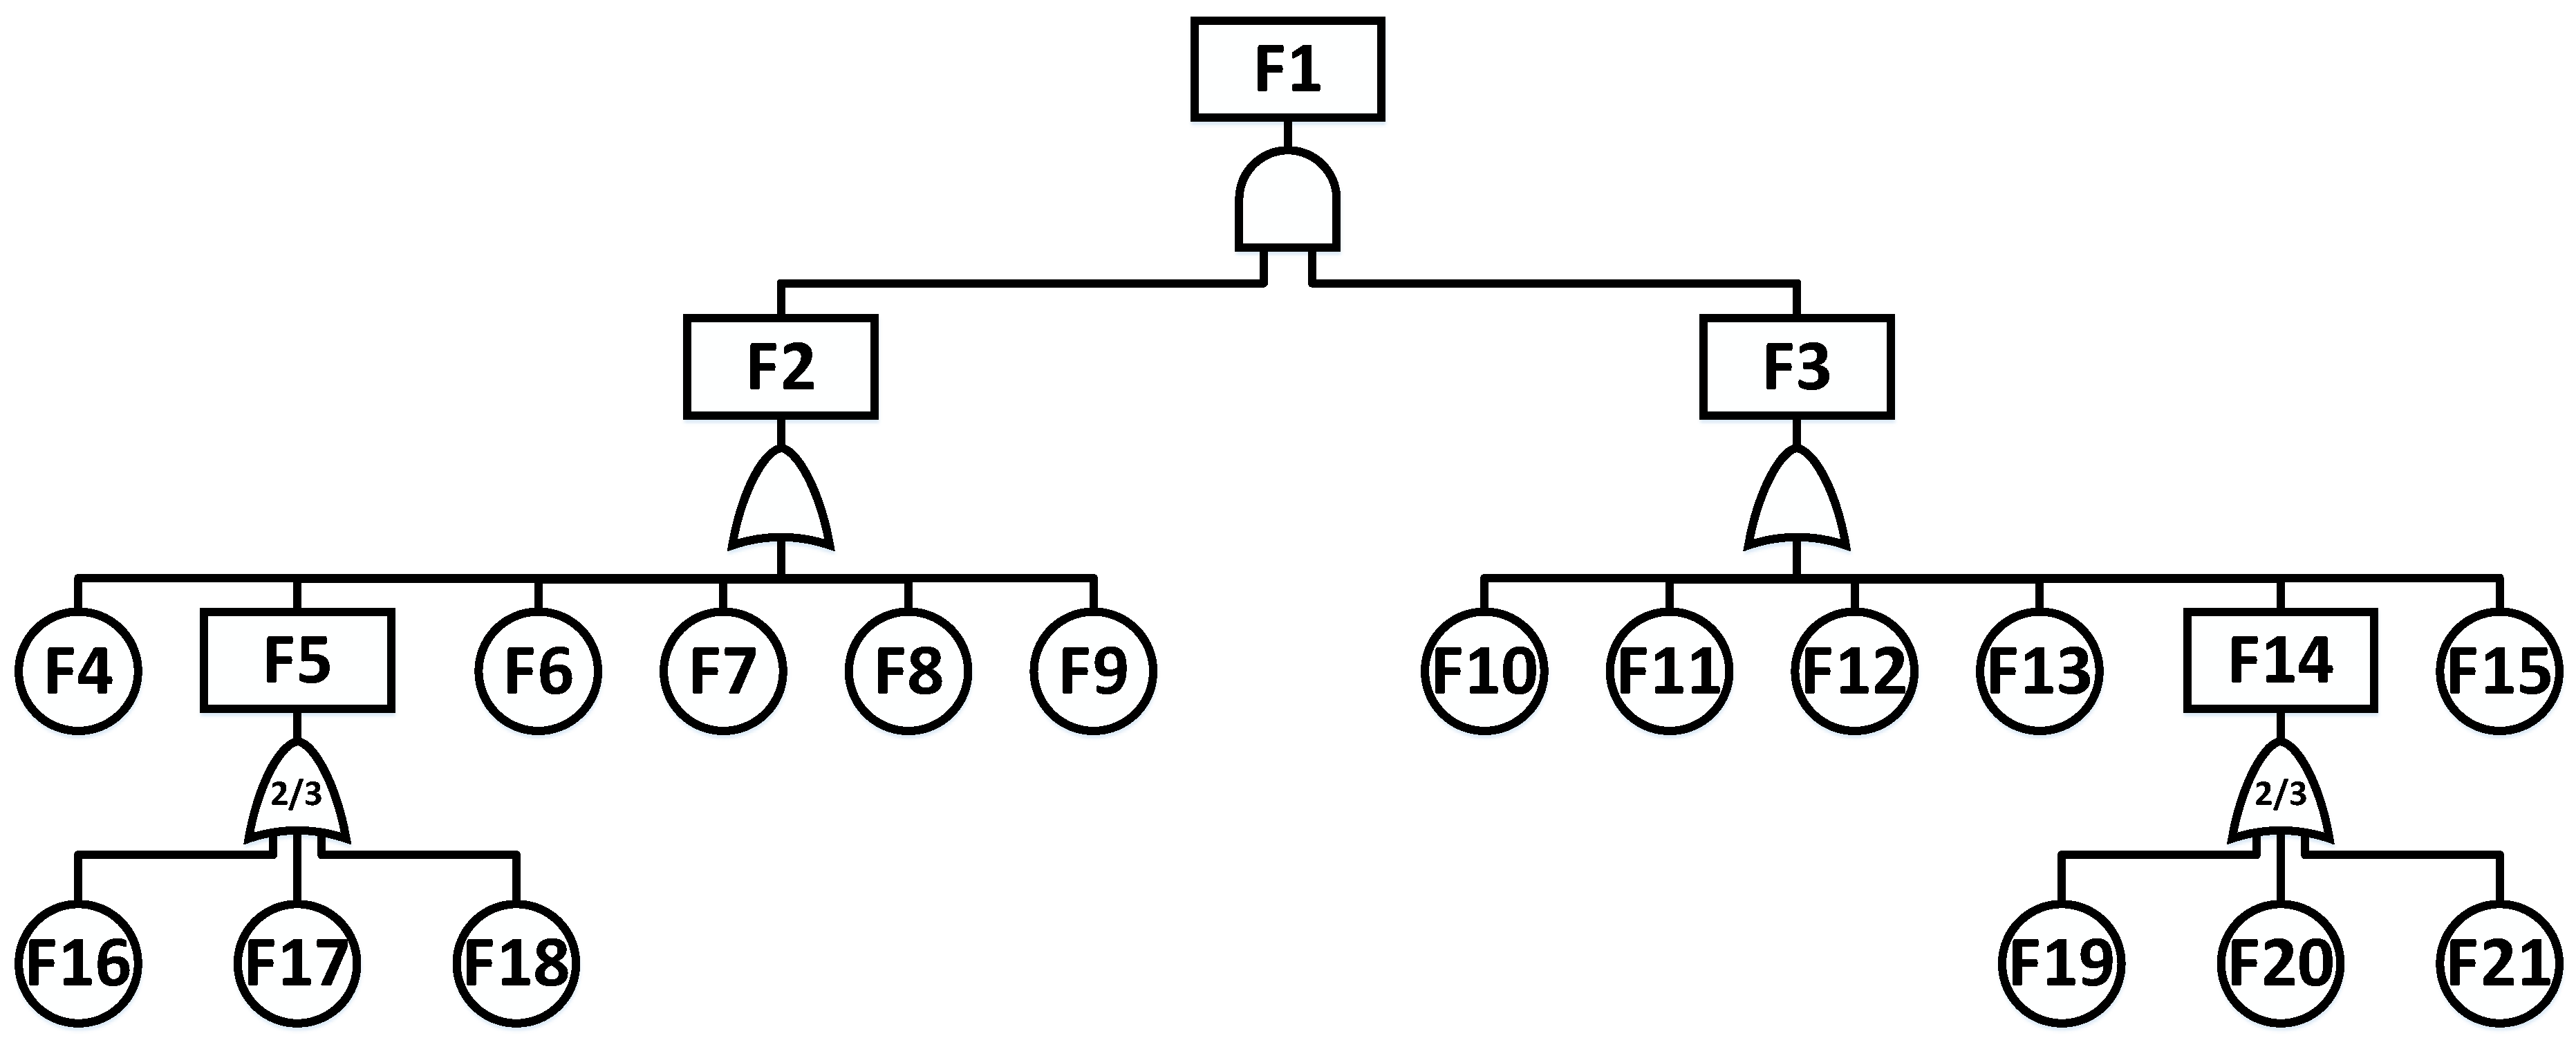
According to the FT logic and to the equipment of diesel electric propulsion, we established the FT of diesel electric propulsion systems for MASS. The failure of operation of the ‘power and propulsion system’ (P6) was regarded as the top event and was labeled as F1. A failure of both the first diesel electric propulsion line (F2) and the second diesel electric propulsion line (F3) will lead to propulsion loss (F1). The second diesel electric propulsion line (F2) has the same arrangement as, and is independent from, the first diesel electric propulsion line (F1). We took the first propulsion line as an example. The single diesel electric propulsion line can be decomposed into three elements: power plant, distribution and loads. The power plant (F5) includes three diesel generators (F16, F17 and F18), two of which can provide sufficient power. Multiple diesel generator sets feed a fixed-frequency high-voltage electrical bus (F6), upon which the distribution depends to dispatch power according to the load. In this section, we only consider the load of the propulsion. This bus feeds the electrical propulsion motor drive, in most cases through a transformer (F7). The electric propulsion motor (F9) drives a frequency converter (F8) to control the shaft line speed and the propeller (F10) to provide propulsion to the MASS [51]. The propulsion system failure was modeled by using FT, as shown in Figure 3. The nodes in the FT are shown in Table 3.

3.3. Analysis of Events Related to Human Factors Using BBN

Although autonomy level III MASS have no crew on board, the human error in the SCC can still lead to contact, especially in the remote driving mode. In this step, we used BBN to develop a branch model for the ‘remote control by the SCC’ (P4), which was defined as the target node of the BBN model (C1). The influence of the detailed variables on the ‘remote control by the SCC’ (C1) is mainly reflected in the form of the various nodes in the network. We first investigate the historical literature to obtain potential influence factors with their associated definitions and descriptions. After that, develop and apply contact scenarios in Tanxun Lake and Qinhuai River, and remotely control MASS ships to conduct contact avoidance experiments. After experimentation and expert judgment, 15 influence factors that influence the ‘remote control by SCC’ (C1) are regarded as sub-nodes, as shown in Table 4. The process employed is as follows:
(1)
Determination of BBN nodes
The ‘remote control by the SCC’ (C1) is influenced not only by the operators’ performance, but also by the ship condition and operating environment. Different from the ‘remote control by SCC’ (C1), which is a binary node, these influence factors have multiple states. The sub-nodes are classified into multiple states according to the criteria presented in Table 5.
(2)
Analysis of BBN nodes
The label C1 refers to a situation where the operators in the SCC remotely control the ship and handle the hazardous events. This node is mainly related to three aspects: ‘operators’ performance’ (C2); ‘ship’s condition’ (C3); and ‘operating environment’ (C4).
The label C2 refers to the operators’ performance during the remote control of MASS in the contact scenario. During the remote driving mode, the SCC will assign a group of people including a supervisor, an engineer and a captain to remotely drive the MASS. After a long work schedule, the operators may be in a state of ‘fatigue’ (C5). ‘Situational awareness’ (C6) refers to operators’ awareness of the current emergency situation of MASS. ‘experience’ (C7), ‘communication and collaboration’ (C8) and ‘ship’s feedback (C9) influence the ‘situational awareness’ (C6). In terms of ‘experience’ (C7), the crew group should not only master the ability of remote driving, but also have experience in handling various hazardous events. ‘Communication and collaboration’ (C8) means that the crew group needs to exchange information and collaborate to propose effective strategies.
The SCC operators cannot handle hazardous events without the support of ship’s function. The label C3 refers to whether or not the ship can capture and deliver the necessary information needed by the SCC, which depends on ‘software performance’ (C10), ‘SCC’s feedback’ (C11) and ‘operating environment’ (C4). ‘Ship’s feedback’ (C9) and ‘SCC’s feedback’ (C11) refer to the quality of the data and information transferred between the ship and the SCC, which depends on ‘software performance’ (C10) and ‘communication quality’ (C12). In turn, ‘communication quality’ (C12) is related to ‘communication bandwidth’ (C13) and “operating environment” (C4), and determines the sufficient and timely delivery of information. In case of insufficient communication between the ship and the SCC, ‘software performance’ (C10) should give priority to providing the urgently needed information, which affects both the ‘ship’s feedback’ (C9) and ‘SCC’s feedback’ (C11).
The label C4 refers to the surrounding environment of MASS, it includes ‘weather conditions’ (C14) and ‘traffic density’ (C15), which will affect the difficulty of remote driving. After determining the nodes, and according to the relationship between them, a model of remote control error was developed, as shown in Figure 4.

4. Case Study

A case study of preliminary hazard analysis of MASS contact scenario based on experimental data, historical data and experts’ judgement is presented. According to the definition of the contact scenario, several experiments were carried out in the Tangxun Lake in Wuhan and in the Qinhuai River in Nanjing, China [44]. The experimental ship employed is a 1:7 scale MASS model with three operation modes, namely remote driving, crew maneuvering and autonomous driving [45,48,56]. It weighs 5.5 ton and is about 7.2 m in length. Its profile and propeller rudder are consistent with MASS. The ship is equipped with various sensors, a laser radar, cameras and other hardware, which allow us to obtain the surrounding weather, traffic and other navigation environment information in a timely manner. In this quantitative analysis, the events related to the autonomous navigation are all obtained from experimental data. The mechanical systems of MASS are determined through the quantitative analysis of historical data.

4.1. Quantification of the Nodes of the FT Model

Quantitative analysis of the FT consists of transforming its logical structure into an equivalent probability expression by “minimal cut set” method at first [36]. Take the F2 FT as an example, the logical structure of F2 is transformed into equivalent probability expression in Equation (1).
P F 2 = P F 4 + P F 6 + P F 7 + P F 8 + P F 9 + P F 16 × P F 17 + P F 16 × P F 18 + P F 17 × P F 18
In order to quantify the failure of top events, the failure probability of basic events (equipment) in FT had to be obtained. Because the MASS power and propulsion line is the same as conventional ships, the existing failure data on the power and propulsion system of conventional ships and other industries could be used to estimate the failure probability of the power and propulsion system. The failure rate of each component in FT is shown in Table 6.
In this study, the following assumptions were made in the development of the FT to calculate the failure probability of the propulsion system:
  • λThe failure rate of each component is a constant value.
  • λDuring MASS navigation, no maintenance and repair activities are performed. In this study, the voyage of the MASS was considered to last 30 days, or 720 h.
  • λWhile the MASS is in the port, the SCC should dispatch engineers to repair and maintain the system. This is a perfect-repair process, which means that the power and propulsion system can be the same as the new equipment.
  • λFailure processes are modeled with an exponential distribution.
The probability of failure P was calculated based on the fact that the equipment’s failure rate λ and the period per hour t were known, as follows [60]:
P ( t ) = 1 e λ t
Using Equation (2), failure probabilities of the basic events (the failure probability of equipment) in the power and propulsion system could be obtained. Based on the equivalent probability expression and failure probability of basic events, the failure probability of the diesel electric propulsion 1st line (F2) was calculated as equal to 7.36 × 10⁻², as shown in in Equation (3).
P F 2 = P F 4 + P F 6 + P F 7 + P F 8 + P F 9 + P F 16 × P F 17 + P F 16 × P F 18 + P F 17 × P F 18 = 1 e 1.50 × 10 6 × 24 × 30 + 1 e 6.74 × 10 5 × 24 × 30 + 1 e 6.47 × 10 7 × 24 × 30 + 1 e 2.66 × 10 5 × 24 × 30 + 1 e 5.00 × 10 6 × 24 × 30 + 3 × 1 e 5.00 × 10 6 × 24 × 30 × 1 e 5.00 × 10 6 × 24 × 30 = 0.0736
Similar to the diesel electric propulsion 1st line (F2), the failure probability of the propulsion system (F1) is 5.41 × 10⁻³. Compared to conventional ships, which only have one propulsion line, the failure probability of the MASS propulsion system is lower. Moreover, the value of the normal operation of the ‘power and propulsion system’ (P6) is 0.9946.

4.2. Quantification of the Nodes in BBN Model

Based on the proposed BBN model and on the multiple states of nodes, experiments were conducted from October 2019 to November 2019 in a section of the Qinhuai River in Nanjing, to simulate the MASS contact scenario. Conventional ships include mainly passenger cruise ships, cleaning boats, patrol boats and others. Ferries and docks are present on both sides of the riverbank; there are several bridges above the water area, and the river channel is narrow. The experimental MASS model and the surrounding environment are shown in Figure 5. We selected some representative risk scenarios in the experiment, simultaneously recording all the information on the MASS model. In parallel, we determined the current states of related risk factors and the conditional probability distribution of the intermediate variables according to interviews and observations.

4.2.1. Prior Probability Determination of Each Root Node

By analyzing the record of the experiments, we regarded the frequency of occurrence of each root node as the prior probability. For objective factors, such as communication bandwidth, the communication bandwidth is recorded and classified in every experiment. In the experiment, the percentage of the number of times in which the communication bandwidth state is good, medium or bad is regarded as the prior probability. Subjective data that reflect the operators’ performance, such as experience and fatigue, were evaluated through interviews. Taking the experience node as an example, an operator who has no remote control experience, has undergone remote control training and has sufficient remote control experience will be the experimental personnel. The percentage of the total number of experiments performed by these three types of people is regarded as the prior probability. The prior probability of each root node is shown in Table 7.

4.2.2. Conditional Probability Table (CPT) Estimation

Both the arcs and the CPTs in the BBN reflect the causal relationship between the nodes. For the BBN, there are large number of CPTs that need to be determined. At the same time, it is difficult to accurately quantify the limited experimental data. Therefore, we adopted the method proposed by Røed et al. [39] to allocate CPTs. This method provides a structured way to derive the CPTs, thereby making it relatively less time-consuming. It is structured as follows. At the same time, this article provides a suitable way to convert experimental statistics into CPT:
  • Determination of the relative importance weights between parent nodes and child node.
First, different parent nodes affecting the same child node have different degrees of importance, which can be addressed by assigning a weight w i for each parent i through expert judgement. The sum of the weight of all parent nodes should be equal to 1. To this end, we adopted the interval type-2 fuzzy analytic hierarchy process (IT2FAHP) method proposed by Hu et al. [61]. The linguistic terms for importance as shown in Table 8. Based on the experimental certainty of the MASS model in the Qinhuai River in Nanjing, China, and the previously established BBN, a questionnaire on the importance of the parent nodes was designed and used to query three experts. To achieve a single view on the importance of parent nodes, we used the TIT2-WAA operation to aggregate the fuzzy judgment proposed by three experts. After TIT2-WAA operation, the fuzzy weight of each parent node was obtained. Finally, the fuzzy weights were defuzzified and normalized to obtain the relative weights of each parent node. The rationality of the result was further corrected through expert opinions. Taking the “operator performance” node as an example, the hierarchical structure is shown in the Figure 6. Three MASS remote operators gave a judgment on the relative importance of the two nodes, as shown in Table 9. After TIT2-WAA operation and defuzzification, the relative weights of fatigue ‘C5′ and situation awareness ’C6′ are 0.4 and 0.6. The more detailed method and equation are in Hu et al. [61]. The relative weights of all nodes in the BBN are shown in Table 10.
  • Determination of the weight distance between the parent node state and the child state.
After that, the distance between the parent node state and the child node state should be determined. The distance represents the difference between the parent node state and the child node state. The probability of a state of a child node is close to or equal to the state of its parent node. Therefore, if the parent node is in a ‘good’ state, the probability that the child node is in a good state should be greater than a medium state than a bad state. Taking the node ‘communication quality’ (C12) as an example, if ‘operating environment’ (C4) and ‘communication bandwidth’ (C13) are in a good state, the probability that ‘communication quality’ will be in a good state is bigger than that in a medium and bad state. Røed et al. [39] argued that no matter how large the difference between the state of the parent node and the child node, the relative distance can be reflected by obtaining the absolute value of distance. However, Li et al. [62] contended that the state of the child node, i.e., whether it is better or worse than the state of the parent node, influences the distance. The change in a different direction should be recorded with different importance. This means that the positive distance and the negative distance can be weighted, and then they cancel each other. In this study, we adopted the method proposed by Li et al. [62]. The good, medium and bad states of each node are marked as a, b and c, respectively. The formula to calculate the weighted distance is shown in Equation (4):
D j = i = 1 n D i j × w i , D j 0 , 2
where i , j a , b , c and D i j refers to the distance between the state of the parent node i and the state of the child node j. If the parent node is in a “good (a)” state, and the child node is in a “medium (b)” state, then the corresponding distance value is 1. n is the number of parent nodes corresponding to the child node and w i represents the relative weight value of the corresponding parent nodes.
We took the node ‘communication quality’ (C12) as an example, as shown in Figure 7. C12 has two parent nodes, i.e., ‘operating environment’ (C4) and ‘communication bandwidth’ (C13). We assumed that the parent nodes C4 and C13 are in a “good (a)” and “medium (b)” state, respectively. At the same time, assuming that C12 node is in a “good (a)” state, the distance between C12 and C4 is 0; correspondingly, the distance between C12 and C13 is −1. As shown in Table 8, the weights of C4 and C13 are w C 4 = 0.36 and w C 13 = 0.64 , respectively, and its weighted distance is. D a = w c 4 × 0 + w c 13 × 1 = 0.36 × 0 + 0.64 × 1 = 0.64 Similarly, D b = 0.36 and D c = 1.36 .
  • Determination of the CPTs of the child nodes.
The CPTs of the child nodes were determined based on experimental statistics, following Røed et al. [39], who calculated it using Equation (5). The good, medium and bad states of each node were marked as a, b and c, respectively.
P j = e R D j j = a c e R D j , P j [ 0 , 1 ]
In Equation (5), the numerator represents the probability distribution in each state, where j a , b , c and R refers to the modified index value. The higher the R index, the lower the probability that the child node in focus is in a state derived from its parents’ states.
The R value was determined using the statistical data of the MASS model experiment. First, we selected representative statistical data in the record as the basis. For example, when the C12 is obtained, C4 is in a “good (a)” state and C13 is in a “medium (b)” state. Second, the upper limits and the “medium (b)” state of the data’s probability distribution were used to calculate the value of R When C4 is in a “good (a)” state, C13 is in a “medium (b)” state; in this case, there are 33 sets of data selected by the experiment, 9 of which are for C4 in a “good (a)” state, and the other 24 for C4 in a “medium (b)” state, with 0 groups for C4 in a “bad (c)” state. Therefore, the upper limit probability value of 0.27 and the intermediate state probability value of 0.73 could be used for calculation. The calculation process of the R value of the C12 node is shown in Equations (6) and (7) as follows:
P a / P b = e R D a 1 j = 1 3 e R D j e R D b 1 j = 1 3 e R D j = 0.27 0.73 = 0.37
P a / P b = e 0.64 R / e 0.36 R = 0.37 R = 3.55
The values of D a , D b , D c were calculated according to Equation (4). For example, when the parent node C13 is in a “good (a)” state, C4 is in a “good (a)” state and the weighted distance among the “good (a)”, “moderate (b)” and “bad (c)” states of the C12 node are D a = 0 , D b = 1 , D c = 2 , respectively. After obtaining the D and R values, the conditional probability distribution of this child node could be obtained as shown in Equations (8)–(10):
P a = e R D a j = 1 3 e R D j = e 0 R e 0 R + e 1 R + e 2 R = e 0 × 3.55 e 0 × 3.55 + e 1 × 3.55 + e 2 × 3.55 = 0.9713
P b = e R D b j = 1 3 e R D j = e 1 R e 0 R + e 1 R + e 2 R = e 1 × 3.55 e 0 × 3.55 + e 1 × 3.55 + e 2 × 3.55 = 0.02790
P c = e R D c j = 1 3 e R D j = e 2 R e 0 R + e 1 R + e 2 R = e 2 × 3.55 e 0 × 3.55 + e 1 × 3.55 + e 2 × 3.55 = 0.0008
The CPT of “communication quality” (C12) is shown in Table 11. Similarly, we obtained other weighted distances for each combination of any state of the parent that pushes the child node in different states. The BBN model can be quantified by inputting the obtained CPTs and the prior probability of the collected root node.

4.2.3. Failure Probability Quantification of Remote Control Errors

The ‘remote control by the SCC’ (C1) is a binary node (success, failure), as such, it is completely different from the other nodes, which have multiple states. Thus, the ‘remote control by the SCC’ (C1) cannot be calculated using the aforementioned method. Røed et al. [39] proposed applying the barrier and operational risk analysis (BORA) method to calculate the probability of a binary node. This method is articulated in three steps.
First, the basic probability of the event in focus is assigned through the use of historical genetic data combined with a model. Then, the maximum deviation from the basic error probability of the target node, by considering the worst and best states of its parent node, is determined. The values of the adjustment factors proposed by Røed were adopted [39], as shown in Table 12.
Finally, the conditional probability of the target node is determined. Accordingly, the CPTs were calculated based on the parent node states and the adjustment factors Q i as follows:
P j = P b a s i s i = 1 n w i k = a c P i k Q i k P j 0 , 1
where P i k is the probability of each parent i to be in each state k = a , b , c ; Q i k is the corresponding adjustment factor according to Table 10; and w i is the weight of the parent nodes i, whose sum is 1. The index j indicates the possible states of the event we are considering (i.e., success or failure).
According to experiment statistics and literature review, the basic probability of the remote control error is 8.58 × 10⁻³ [11]. The ‘remote control by the SCC’ (C1) has three parent nodes, i.e., ‘operators’ performance’ (C2), ‘ship’s condition’ (C3) and ‘operating environment’ (C4). When the weights and the probability distributions of three parent nodes are known, the ‘remote control by the SCC’ (C1) can be calculated, as shown in Table 13. After calculation, the failure probability of the ‘remote control by the SCC’ (C1) is 7.722 × 10⁻³. Therefore, the success probability of ‘remote control by SCC’ is 0.9923.

4.3. Failure Probability Quantification of the MASS Contact Scenario

Once the normal operation and failure probability of pivotal events are calculated, several end states probability in the MASS contact scenario are obtained. As shown in Section 4.2 and Section 4.3, the probability of several events in ESD was calculated. The probability that the ‘power and propulsion system’ (P6) works normally, calculated by using the FT model in Section 4.2, is 0.9946. The probability of success of the ‘remote control by the SCC’ (P4), calculated by using the BBN model in Section 4.3, is 0.9923. In the same way, the normal operation and failure probability of other pivotal events was calculated according to the experiment and historical data. Different outputs of pivotal events will lead to different end states, such as safe or accident states, with different probabilities. After calculating the probability of each pivotal event in ESD, we could obtain the probability of each end state in the MASS hazard scenarios, according to the following steps:
  • Calculation of the end states’ probability of the MASS contact scenario.
The probability of each end state was obtained according to the HCL quantitative calculation method. The probability values of all end states are listed in Table 14.
As shown in Table 14, the probability of MASS avoiding the external events and continuing operation is 9.45 × 10⁻¹. According to the Table 14, the failure of perception stage and execution stage is the main cause of contact accidents. Thus, the perception stage of MASS is the first safety barrier of hazard scenario. It is necessary to ensure that the sensor equipment and the perception of the operator can perceive the risk and ensure that the risk will be detected immediately. For the execution stage of MASS, although the MASS is equipped with a redundant system, it is still very likely to cause an accident. The probability of the contact scenario can be mitigated by shortening the sailing time.
  • Calculation of the accident-causing event chains.
In the HCL method, through the combination of the ESD model, the FT model and the BBN model, the events in the ESD model were extended to the FT and the BBN, and then different accident-causing event chains and their probability could be obtained. We selected the five accident-causing event chains with the highest risk and they are shown in Table 15.
As shown in Table 15, the accident-causing event chain with the highest risk is the one that leads to accident end state, due to the failure to perceive the danger (E2). This shows that the perception stage is the most important stage in the MASS hazard scenarios. Secondly, the second main cause of accident-causing event chains is that the operators in the SCC did not propose an effective strategy which leads to accident end state (E3). Thus, it is necessary to train remote operators and maintain the equipment, while at the same time MASS should avoid sailing in bad environmental conditions. Thirdly, most of the occurrences in all accident-causing event chains relate to the failure of the mechanical system (E4), which is the last guarantee for the safe navigation of the MASS. Before the voyage, detailed planning and preparation work should be carried out. Reasonable remedial measures are an important way to effectively improve the safety of the MASS. Finally, the third, fourth and fifth accident-causing event chains involved the failure of operation of the steering system and of the propulsion system. Therefore, in order to guarantee the safety of MASS, it is necessary to design a redundant steering and propulsion system, as well as to propose a maintenance plan for the mechanical system. Through appropriate technical solutions, the MASS risk can be reduced to an acceptable level.
  • Identification of the influence factors in the power and propulsion system leading to a failure of the MASS emergency response process (E4).
The reliability of the propulsion system has relatively the largest impact on MASS navigation accidents. In order to support the future design of the MASS power and propulsion system, it is necessary to identify the most influencing equipment in the power and propulsion system. Using the existing evaluation indicators comprehensively, the basic events or risk factors with the highest impact on risk can be identified for improvement. The Fussell–Vesely (VF) importance measure is an evaluation criterion that represents the impact of components on the total failure probability of a system [63]:
V F ( S , e ) = P ( e S ) = P ( S e ) P ( S ) = P ( S e ) P ( e ) P ( S )
When the MASS has an accident, we selected E4 to measure the importance factors. As shown in Table 16, the failure of the converter, failure of the diesel generator and failure of the electric motor are the most important factors. Therefore, priority should be given to the maintenance of this equipment. In the future design, a more reasonable redundancy design and maintenance plan will improve propulsion reliability, especially of the converter, the diesel generator and the electric motor.
  • Identification of the influence factors in the remote driving mode.
In order to analyze the influence of each factor contributing to the failure of remote driving, the sensitivity of the BN model of remote driving is analyzed in this section. First, the probability of each parent node is assigned the value of one. Then, the probability variation table of target node is obtained. Take the weather condition (C14) as an example, set the probability of being in a “good” state to 100%, obtain the probability of C2, C3 and C4. Based on the Equation (11), the failure probability of “remote driving” is 0.00619. Similarly, the other nodes in BN are assessed. Figure 8 shows the probability change in “remote driving” after adjusting each node. The sensitivity of the nodes affecting remote driving is ranked as follows: C 10 > C 14 > C 7 > C 15 > C 13 > C 8 > C 5 .
Based on the result, “software performance” (C10) is the most sensitivity node. During the remote driving, the software should be more attention. At the same time, the external influence factors such as “weather condition” (C14) and “traffic density” (C15) will significantly affect the failure probability of remote driving. Among the influence factors related to the operator, “experience” (C7) is the most important factor. In summary, the software in SCC should be updated in time to ensure high availability and quality. The SCC should strengthen the training about contact scenarios in case the operator is unfamiliar with remote driving or does not understand external object avoidance rules.

5. Conclusions and Future Work

With the increase in the use of automation technology in the maritime industry, MASS risk influence factors are increasingly various and complex. This paper is an attempt to conduct a preliminary hazard analysis of MASS in the design and experimental stages based on the conceptual design of MASS, historical data and experiments of conventional ships. The applicability of the HCL method to MASS was demonstrated through a case study of a contact scenario for a MASS model ship. Key conclusions can be summarized as follows:
  • The use of the HCL method allows a clear classification of the pivotal events of the hazard scenarios.
  • The paper established a branch model to analyze the events in the ESD and used FT and BBN to analyze influence factors in a more detailed way according to their characteristics.
  • The importance of more detailed influencing factors is quantified based on the FT and BBN method.
  • The HCL method provides a quantitative calculation result of the MASS hazardous scenario and presents a way to verify whether the conceptual design of MASS is reasonable and can help find the weak links in the MASS experiment.
Based on the analysis and test ship, redundant design for MASS is necessary. For example, the operators in the SCC can perceive the risk in case of AS system failure. In relation to the power and propulsion system, at least two independent power and propulsion lines can mitigate the failure probability. However, the development of MASS is still in an early phase. With the development of technology, more risk influence factors will arise and the cooperation between AS and the operators in the SCC will be further discussed. For example, the control priority between the operators in the SCC and AS may change with the development of technology. Moreover, this paper analyzed in detail both mechanical and human events, while overlooking software events. In the future, an important problem to address is how to include software events in risk assessments. The failure probability and the conclusions of the present study can be used as references for the design of MASS.

Author Contributions

Writing—original draft preparation, Z.H., K.Z.; writing—review and editing, D.Z., J.Z. and F.Z.; methodology: Z.H., K.Z. and M.Z.; conceptualization: D.Z., J.Z. and F.Z.; funding acquisition, D.Z. All authors have read and agreed to the published version of the manuscript.

Funding

The research was supported by the Hubei Provincial Natural Science Foundation of China (2019CFA039), the Natural Science Foundation of China (No.52071247) and the innovation and entrepreneurship team import project of Shaoguan city (201208176230693).

Institutional Review Board Statement

Not applicable.

Informed Consent Statement

Not applicable.

Data Availability Statement

Not applicable.

Conflicts of Interest

We declare that we have no financial and personal relationships with people or organizations that can inappropriately influence our work. There is no professional or other personal interest of any nature or kind in any product, service and/or company that could be construed as influencing the position presented in, or in the review of, the manuscript entitled, ‘Use of the Hybrid Causal Logic Method for Hazard Identification of Maritime Autonomous Surface Ship Operation’.

References

  1. Lyu, H.; Yin, Y. COLREGS-constrained real-time path planning for autonomous ships using modified artificial potential fields. J. Navig. 2019, 72, 588–608. [Google Scholar] [CrossRef]
  2. Chen, Z.; Chen, D.; Zhang, Y.; Cheng, X.; Zhang, M.; Wu, C. Deep learning for autonomous ship-oriented small ship detection. Saf. Sci. 2020, 130, 104812. [Google Scholar] [CrossRef]
  3. Yuan, X.; Zhang, D.; Zhang, J.; Zhang, M.; Guedes Soares, C. A novel real-time collision risk awareness method based on velocity obstacle considering uncertainties in ship dynamics. Ocean. Eng. 2021, 220, 108436. [Google Scholar] [CrossRef]
  4. Rolls-Royce. Rolls-Royce and Finferries Demonstrate World’s First Fully Autonomous Ferry. Available online: https://www.rolls-royce.com/media/press-releases/2018/03-12-2018-rr-and-finferries-demonstrate-worlds-first-fully-autonomous-ferry.aspx (accessed on 11 April 2022).
  5. Wärtsilä. World’s First Autodocking Installation Successfully Tested by Wärtsilä. Available online: https://www.wartsila.com/media/news/26-04-2018-world-s-first-autodocking-installation-successfully-tested-by-wartsila-2169290 (accessed on 11 April 2022).
  6. Kongsberg.com. Autonomous Ship Project, Key Facts about YARA Birkeland. Available online: https://www.kongsberg.com/maritime/support/themes/autonomous-ship-project-key-facts-about-yara-birkeland (accessed on 11 April 2022).
  7. DNV. The ReVolt—DNV. Available online: https://www.dnvgl.com/technology-innovation/revolt/index.html (accessed on 11 April 2022).
  8. Jokioinen, E.; Poikonen, J.; Jalonen, R.; Saarni, J. Remote and Autonomous Ships-The Next Steps; Rolls Royce Plc: London, UK, 2016. [Google Scholar]
  9. Burmeister, H.C.; Bruhn, W.; Rødseth, Ø.J.; Porathe, T. Autonomous unmanned merchant vessel and its contribution towards the e-Navigation implementation: The MUNIN perspective. Int. J. e-Navig. Marit. Econ. 2014, 1, 1–13. [Google Scholar] [CrossRef] [Green Version]
  10. International Maritime Organization (IMO). IMO Takes First Steps to Address Autonomous Ships. Available online: http://www.imo.org/en/MediaCentre/PressBriefings/Pages/08-MSC-99-MASS-scoping.aspx (accessed on 12 September 2020).
  11. Zhang, M.; Zhang, D.; Yao, H.; Zhang, K. A probabilistic model of human error assessment for autonomous cargo ships focusing on human–autonomy collaboration. Saf. Sci. 2020, 130, 104838. [Google Scholar] [CrossRef]
  12. DNVGL-CG-0264; Class Guideline—Autonomous and Remotely Operated Ships. DNV GL: Bærum, Norway, 2018. Available online: https://rules.dnv.com/docs/pdf/DNV/cg/2018-09/dnvgl-cg-0264.pdf (accessed on 19 April 2022).
  13. Utne, I.B.; Schjølberg, I.; Roe, E. High reliability management and control operator risks in autonomous marine systems and operations. Ocean. Eng. 2019, 171, 399–416. [Google Scholar] [CrossRef]
  14. Burmeister, H.C.; Bruhn, W.C.; Rødseth, Ø.J.; Porathe, T. Can unmanned ships improve navigational safety? In Proceedings of the Transport Research Arena, Paris, France, 14–17 April 2014.
  15. Goerlandt, F. Maritime Autonomous Surface Ships from a risk governance perspective: Interpretation and implications. Saf. Sci. 2020, 128, 104758. [Google Scholar] [CrossRef]
  16. Utne, I.B.; Rokseth, B.; Sørensen, A.J.; Vinnem, J.E. Towards supervisory risk control of autonomous ships. Reliab. Eng. Syst. Saf. 2020, 196, 106757. [Google Scholar] [CrossRef]
  17. Zhou, X.Y.; Liu, Z.J.; Wang, F.W.; Wu, Z.L.; Cui, R.D. Towards applicability evaluation of hazard analysis methods for autonomous ships. Ocean. Eng. 2020, 214, 107773. [Google Scholar] [CrossRef]
  18. Wróbel, K.; Montewka, J.; Kujala, P. System-theoretic approach to safety of remotely-controlled merchant vessel. Ocean. Eng. 2018, 152, 334–345. [Google Scholar] [CrossRef]
  19. Wróbel, K.; Montewka, J.; Kujala, P. Towards the assessment of potential impact of unmanned vessels on maritime transportation safety. Reliab. Eng. Syst. Saf. 2017, 165, 155–169. [Google Scholar] [CrossRef]
  20. Bačkalov, I. Safety of autonomous inland vessels: An analysis of regulatory barriers in the present technical standards in Europe. Saf. Sci. 2020, 128, 104763. [Google Scholar] [CrossRef]
  21. Fan, C.L.; Wróbel, K.; Montewka, J.; Gil, M.; Wan, C.P.; Zhang, D. A framework to identify factors influencing navigational risk for Maritime Autonomous Surface Ships. Ocean. Eng. 2020, 202, 107188. [Google Scholar] [CrossRef]
  22. Kretschmann, L.; Rodseth, O.; Tjora, A. Report D9. 2: Qualitative Assessment. Maritime Unmanned Navigation through Intelligence in Networks (MUNIN); MUNIN: Munich, Germany, 2015. [Google Scholar]
  23. Ramos, M.A.; Utne, I.B.; Mosleh, A. On factors affecting autonomous ships operators performance in a Shore Control Center. In Proceedings of the Probabilistic Safety Assessment and Management 4, PSAM, Los Angeles, CA, USA, 14 September 2018. [Google Scholar]
  24. Man, Y.; Weber, R.; Cimbritz, J.; Lundh, M.; MacKinnon, S.N. Human factor issues during remote ship monitoring tasks: An ecological lesson for system design in a distributed context. Int. J. Ind. Ergon. 2018, 68, 231–244. [Google Scholar] [CrossRef]
  25. Bolbot, V.; Theotokatos, G.; Boulougouris, E.; Vassalos, D. Comparison of diesel-electric with hybrid-electric propulsion system safety using System-Theoretic Process Analysis. In Royal Institution of Naval Architects—International Conference on Power and Propulsion Alternatives for Ships, London, UK, 22–23 January 2019; RINA: London, UK, 2019. [Google Scholar]
  26. Bolbot, V.; Theotokatos, G.; Vassalos, D. Using system-theoretic process analysis and event tree analysis for creation of a fault tree of blackout in the Diesel-Electric Propulsion system of a cruise ship. In Proceedings of the 13th International Marine Design Conference, IMDC, Espoo, Finland, 10–14 June 2018. [Google Scholar]
  27. Wang, T.; Liu, J.; Zeng, F. Application of QFD and FMEA in ship power plant design. In Proceedings of the 10th International Symposium on Computational Intelligence and Design, ISCID, Hangzhou, China, 9–10 December 2017. [Google Scholar]
  28. Ramos, M.A.; Thieme, C.A.; Utne, I.B.; Mosleh, A. Human-system concurrent task analysis for maritime autonomous surface ship operation and safety. Reliab. Eng. Syst. Saf. 2020, 195, 106697. [Google Scholar] [CrossRef]
  29. Thieme, C.A.; Utne, I.B.; Haugen, S. Assessing ship risk model applicability to Marine Autonomous Surface Ships. Ocean. Eng. 2018, 165, 140–154. [Google Scholar] [CrossRef]
  30. Banda, O.A.V.; Kannos, S.; Goerlandt, F.; van Gelder, P.H.; Bergström, M.; Kujala, P. A systemic hazard analysis and management process for the concept design phase of an autonomous vessel. Reliab. Eng. Syst. Saf. 2019, 191, 106584. [Google Scholar] [CrossRef]
  31. Wróbel, K.; Montewka, J.; Kujala, P. Towards the development of a system-theoretic model for safety assessment of autonomous merchant vessels. Reliab. Eng. Syst. Saf. 2018, 178, 209–224. [Google Scholar] [CrossRef]
  32. Ramos, M.A.; Utne, I.B.; Mosleh, A. Collision avoidance on maritime autonomous surface ships: Operators’ tasks and human failure events. Saf. Sci. 2019, 116, 33–44. [Google Scholar] [CrossRef]
  33. Porathe, T.; Hoem, Å.; Rødseth, Ø.J.; Fjørtoft, K.; Johnsen, S.O. At least as safe as manned shipping? Autonomous shipping, safety and “human error”. Safety and Reliability–Safe Societies in a Changing World. In Proceedings of the European Safety and Reliability Conference, ESREL, Trondheim, Norway, 17–21 June 2018. [Google Scholar]
  34. Wróbel, K.; Krata, P.; Montewka, J.; Hinz, T. Towards the development of a risk model for unmanned vessels design and operations. Trans. Nav. Int. J. Mar. Navig. Saf. Sea Transp. 2016, 10, 267–274. [Google Scholar] [CrossRef] [Green Version]
  35. Mosleh, A.; Dias, A.; Eghbali, G.; Fazen, K. An integrated framework for identification, classification, and assessment of aviation systems hazards. In Probabilistic Safety Assessment and Management; PSAM: London, UK, 2004. [Google Scholar]
  36. Wang, C. Hybrid Causal Logic Methodology for Risk Assessment; University of Maryland: College Park, MD, USA, 2007. [Google Scholar]
  37. Mohaghegh, Z.; Kazemi, R.; Mosleh, A. Incorporating organizational factors into Probabilistic Risk Assessment (PRA) of complex socio-technical systems: A hybrid technique formalization. Reliab. Eng. Syst. Saf. 2009, 94, 1000–1018. [Google Scholar] [CrossRef]
  38. Groth, K.; Wang, C.; Mosleh, A. Hybrid causal methodology and software platform for probabilistic risk assessment and safety monitoring of socio-technical systems. Reliab. Eng. Syst. Saf. 2010, 95, 1276–1285. [Google Scholar] [CrossRef]
  39. Røed, W.; Mosleh, A.; Vinnem, J.E.; Aven, T. On the use of the hybrid causal logic method in offshore risk analysis. Reliab. Eng. Syst. Saf. 2009, 94, 445–455. [Google Scholar] [CrossRef]
  40. Sklet, S.; Aven, T.; Hauge, S.; Vinnem, J.E. Incorporating human and organizational factors in risk analysis for offshore installations. In Proceedings of the 16th European Safety and Reliability Conference, ESREL, Gdynia-Sopot-Gdansk, Poland, 27–30 June 2005. [Google Scholar]
  41. Zhang, M.; Zhang, D.; Goerlandt, F.; Yan, X.; Kujala, P. Use of HFACS and fault tree model for collision risk factors analysis of icebreaker assistance in ice-covered waters. Saf. Sci. 2019, 111, 128–143. [Google Scholar] [CrossRef]
  42. Zhang, M.; Conti, F.; Le Sourne, H.; Vassalos, D.; Kujala, P.; Lindroth, D.; Hirdaris, S. A method for the direct assessment of ship collision damage and flooding risk in real conditions. Ocean. Eng. 2021, 237, 109605. [Google Scholar] [CrossRef]
  43. Zhang, M.; Zhang, D.; Fu, S.; Kujala, P.; Hirdaris, S. A Predictive Analytics Method for Maritime Traffic Flow Complexity Estimation in Inland Waterways. Reliab. Eng. Syst. Saf. 2022, 220, 108317. [Google Scholar] [CrossRef]
  44. WUT. Autonomous Ship Test. Available online: http://wts.whut.edu.cn/zxxw/201910/t20191024_414554.shtml (accessed on 3 September 2020).
  45. Yan, X.; Ma, F.; Liu, J.; Wang, X. Applying the navigation brain system to inland ferries. In Proceedings of the 18th Conference on Computer and IT Applications in the Maritime Industries, COMPIT, Tullamore, Ireland, 25–27 March 2019. [Google Scholar]
  46. Man, Y.; Lundh, M.; Porathe, T.; MacKinnon, S. From desk to field-Human factor issues in remote monitoring and controlling of autonomous unmanned vessels. Procedia Manuf. 2015, 3, 2674–2681. [Google Scholar] [CrossRef]
  47. Chen, P.; Huang, Y.; Mou, J.; van Gelder, P.H.A.J.M. Probabilistic risk analysis for ship-ship collision: State-of-the-art. Saf. Sci. 2019, 117, 108–122. [Google Scholar] [CrossRef]
  48. Wang, T.; Wu, Q.; Zhang, J.; Wu, B.; Wang, Y. Autonomous decision-making scheme for multi-ship collision avoidance with iterative observation and inference. Ocean. Eng. 2020, 197, 106873. [Google Scholar] [CrossRef]
  49. Eriksen, S.; Utne, I.B.; Ltzen, M. An rcm approach for assessing reliability challenges and maintenance needs of unmanned cargo ships. Reliab. Eng. Syst. Saf. 2021, 210, 107550. [Google Scholar] [CrossRef]
  50. Ådnanes, A.K. Maritime Electrical Installations and Diesel Electric Propulsion; ABB AS Marine: Oslo, Norway, 2003. [Google Scholar]
  51. Geertsma, R.D.; Negenborn, R.R.; Visser, K.; Hopman, J.J. Design and control of hybrid power and propulsion systems for smart ships: A review of developments. Appl. Energy 2017, 194, 30–54. [Google Scholar] [CrossRef]
  52. Bolvashenkov, I.; Kammermann, J.; Herzog, H.G. Reliability assessment of a fault tolerant propulsion system for an electrical helicopter. In Proceedings of the 12th International Conference and Exhibition on Ecological Vehicles and Renewable Energies, EVER, Monte Carlo, Monaco, 11–13 April 2017. [Google Scholar]
  53. Porathe, T.; Prison, J.; Man, Y. Situation awareness in remote control centres for unmanned ships. In Proceedings of the Human Factors in Ship Design & Operation, London, UK, 26–27 February 2014. [Google Scholar]
  54. Wahlström, M.; Hakulinen, J.; Karvonen, H.; Lindborg, I. Human factors challenges in unmanned ship operations–insights from other domains. Procedia Manuf. 2015, 3, 1038–1045. [Google Scholar] [CrossRef] [Green Version]
  55. Hogg, T.; Ghosh, S. Autonomous merchant vessels: Examination of factors that impact the effective implementation of unmanned ships. Aust. J. Marit. Ocean. Aff. 2016, 8, 206–222. [Google Scholar] [CrossRef]
  56. Yang, F.; Liu, J.; Li, S.; Ma, F. Virtual-Real Interaction Tests for Functional Testing of Smart Ships. In Proceedings of the 30th International Ocean and Polar Engineering Conference. International Society of Offshore and Polar Engineers, Shanghai, China, 11–16 October 2020. [Google Scholar]
  57. OREDA. Offshore Reliability Data Handbook, 4th ed.; DNV: Oslo, Norway, 2003. [Google Scholar]
  58. IAEA-TECDOC-478. Component Reliability Data for use in Probabilistic Safety Analysis; IAEA: Vienna, Austria, 1988. [Google Scholar]
  59. Markus, H.; Knut, E.K.; Jose, I.A. Towards a Design Framework for Maritime Asset Servitization. In Proceedings of the 30th European Safety and Reliability Conference and the 15th Probabilistic Safety Assessment and Management Conference, Venice, Italy, 1–5 November 2020. [Google Scholar]
  60. Leoni, L.; BahooToroody, A.; De Carlo, F.; Paltrinieri, N. Developing a risk-based maintenance model for a Natural Gas Regulating and Metering Station using Bayesian Network. J. Loss Prev. Process Ind. 2019, 57, 17–24. [Google Scholar] [CrossRef]
  61. Hu, J.; Zhang, Y.; Chen, X.; Liu, Y. Multi-criteria decision making method based on possibility degree of interval type-2 fuzzy number. Knowl. Based Syst. 2013, 43, 21–29. [Google Scholar] [CrossRef]
  62. Li, P.C.; Zhang, L.; Dai, L.C.; Li, X.F. Study on operator’s SA reliability in digital NPPs. Part 3: A quantitative assessment method. Ann. Nucl. Energy 2017, 109, 82–91. [Google Scholar] [CrossRef]
  63. Meng, F.C. Relationships of Fussell–Vesely and Birnbaum importance to structural importance in coherent systems. Reliab. Eng. Syst. Saf. 2000, 67, 55–60. [Google Scholar] [CrossRef]
Figure 1. Framework and flowchart of the HCL method.
Jmse 10 00725 g001
Figure 2. ESD model of the MASS contact scenario.
Jmse 10 00725 g002
Figure 3. FT of the power and propulsion system.
Jmse 10 00725 g003
Figure 4. BBN model for MASS remote control.
Jmse 10 00725 g004
Figure 5. The Shore Control Center, several models of ships and the MASS model.
Jmse 10 00725 g005
Figure 6. The hierarchical structure of C2 node.
Jmse 10 00725 g006
Figure 7. Relationship between C4, C13 and C12.
Jmse 10 00725 g007
Figure 8. Sensitivity analysis of remote driving mode.
Jmse 10 00725 g008
Table 1. Description of the nodes in the proposed ESD model.
StageLabelEventDescriptionReference
Perception stageP1Detection by ASDuring the navigation of MASS, equipment such as sensors, laser and range finder should detect navigational hazards or abnormal operational conditions all the time.[34]
P2Detection by SCCDuring navigation, the MASS should transmit images and sounds to the SCC, so that the operators may detect the hazardous event.[28]
Decision-making stageP3Control by ASThe AS should choose the optimal maneuver to stop the hazardous event according to the information gathered.[28]
P4Remote control
by SCC
When the situation requires navigational operation from the SCC, the operators in the SCC will go into the situation handling room to handle the risk.[46]
Execution stageP5Steer systemThe steer system has the responsibility to actuate ship motion. The MASS should control the direction to avoid the hazardous event.[16]
P6Power and propulsion systemThe power and propulsion system has the responsibility to actuate ship motion. The MASS should control the speed to avoid the hazardous event.[47]
End stateE1Normal navigationThe MASS successfully handles the hazardous event and continues navigation.[28]
E2Accident due to perception failureMASS does not recognize external objects and struck with it.[11]
E3Accident due to decision-making failureMASS does not propose an effective strategy to avoid the object.[11]
E4Accident due to execution failureMASS does not timely adjust the speed and course lead due to a mechanical failure resulting in a contact accident.[48]
Table 2. Description of the components of the power and propulsion system.
EventDescriptionReferences
Bus barThe bus dispatching power according to the load.[50]
TransformerThe transformer has the responsibility to obtain different voltage levels and sometimes also to phase shift.[50]
ConverterThe frequency converter has the responsibility to control the shaft line speed.[51]
Electric motorThe electrical motor is the commonly used device for the conversion of electrical power into mechanical power.[50]
Diesel generatorDiesel engines supply power to the electric generator shaft.[52]
PropellerThe electric propulsion motor drives the propeller to provide propulsion.[51]
Table 3. Nodes in the FT of the power and propulsion system.
NodeEvent
F1Power and propulsion system
F2Diesel electric propulsion 1st line
F3Diesel electric propulsion 2nd line
F4, F15Propeller
F5, F14Power plants
F6, F13Bus bar
F7, F12Transformer
F8, F11Converter
F9, F10Electric motor
F16, F17, F18, F19, F20, F21Diesel generator
Table 4. The influence factors of remote control.
LabelNodeDescriptionReferences
C1Remote control
by SCC
The MASS switches into remote control. The operators in the SCC should send updated route information or directly control the MASS and propose a strategy to handle hazardous events.[32]
C2Operators’ performanceOperators’ performance during remote control.[53]
C3Ship conditionThe various technical aspects of the ship condition, including, but not limited to, communication and engine conditions.[54]
C4Operating environmentWeather conditions and traffic density.[13]
C5FatigueAlthough more advanced technology can reduce operators’ fatigue, a long work schedule may still lead to fatigue.[11]
C6Situational awarenessThe operators should ensure an appropriate situation awareness of the MASS, despite the physical distance with the crew and vessel.[9]
C7ExperienceThe operators should have the theoretical knowledge of and experience in remote control in a virtual environment.[11]
C8Communication and collaborationThe SCC is articulated into specific roles (e.g., supervisor, captain and engineer), which need to communicate and collaborate with each other to handle hazardous events.[46]
C9Ship’s feedbackThe MASS should establish a two-way communication with the SCC. The ship’s feedback means that the information is transferred from the ship to the SCC.[31]
C10Software performanceThe onboard software decides the operation of the MASS and the communication with the SCC.[55]
C11SCC’s feedbackThe MASS should establish a two-way communication with the SCC. The ship’s feedback means that the information is transferred from the SCC to the ship.[31]
C12Communication qualityQuality of the communication between the SCC and the ship. [33]
C13Communication bandwidthAvailable communication bandwidth during operations.[12]
C14Weather
conditions
Heavy weather conditions may push the ability to control the ship to the limit, while at the same time affecting communication.[30]
C15Traffic densityTraffic density could be specified based on the relevance of potential accident risks in the area.[13]
Table 5. Multiple states and description of the sub-nodes in BBN.
LabelNodeStateDescription
C2Operators’ performanceGood (a)The operators are able to operate the ship and to handle hazardous events.
Medium (b)The operators are able to fulfil basic requirements for ship operation.
Bad (c)Failure by the operators to operate the ship as required.
C3Ship’s conditionGood (a)The automated function can assist the operator to drive well.
Medium (b)The automated function can meet the basic driving requirements.
Bad (c)The automated function cannot meet the driving requirements.
C4Operating environmentGood (a)The environment has no impact on remote driving.
Medium (b)The environment has a slight impact on remote driving.
Bad (c)The environment has a serious impact on remote driving.
C5FatigueGood (a)The operator does not feel tired at all.
Medium (b)The operator is slightly tired.
Bad (c)The operator feels tired after a long time of operation.
C6Situational awarenessGood (a)The operator can clearly judge the situation.
Medium (b)The operator can basically judge the situation.
Bad (c)The operator cannot accurately judge the situation.
C7ExperienceGood (a)Operators have sufficient remote driving experience.
Medium (b)Operators have some remote driving experience.
Bad (c)Operators do not have remote driving experience.
C8Communication and collaborationGood (a)Communication is performed as required, obtaining useful results.
Medium (b)Communication meets basic information delivery requirements.
Bad (c)Failure to communicate and collaborate as required.
C9Ship’s feedbackGood (a)The ship can feedback sufficient information.
Medium (b)The ship can feedback information related to driving.
Bad (c)The ship gives no feedback on the ship’s situation.
C10Software performanceGood (a)The software can meet the driving requirements well.
Medium (b)The software can meet the basic driving requirements.
Bad (c)The software cannot meet the driving requirements.
C11SCC’s feedbackGood (a)The SCC has a timely response to the ship.
Medium (b)The SCC can feedback information related to driving.
Bad (c)The SCC does not respond to the ship in time.
C12Communication qualityGood (a)Information can be transmitted well between the ship and the SCC.
Medium (b)Incomplete information is transmitted, but sufficient to drive.
Bad (c)Sufficient information cannot be transmitted.
C13Communication bandwidthGood (a)Approaching the maximum value.
Medium (b)Within the normal range of communication equipment.
Bad (c)Only a small amount of information can transmit.
C14Weather
conditions
Good (a)Have almost no effect on ships.
Medium (b)Have a certain impact on ships.
Bad (c)Have a greater impact on ship control.
C15Traffic densityGood (a)More than three ships.
Medium (b)The ship encounters other ships.
Bad (c)No ships around when the ship is sailing.
a, b, c represent the abbreviations for the good, medium and bad states, respectively.
Table 6. Equipment failure rate data in the FT model.
LabelEquipmentFailure Rate (hour)References
F16, F17, F18, F19, F20, F21Diesel generator7.59 × 10−5[57]
F6, F13Electric bus1.50 × 10−6[58]
F9, F10Electric motor6.74 × 10−5[57]
F7, F12Main transformer6.47 × 10−7[58]
F8, F11Converter2.66 × 10−5[58]
F4, F15Propeller5.00 × 10−6[59]
Table 7. Prior probability of each root node.
NodeNameGood (a)Medium (b)Bad (c)
C5Fatigue0.88020.10300.0168
C7Experience0.65930.22010.1206
C8Communication and collaboration0.82640.12200.0516
C10Software performance0.34070.43960.2198
C13Communication bandwidth0.42860.15380.4176
C14Weather conditions0.80210.14290.0549
C15Traffic density0.70330.19780.0989
a, b, c represent the abbreviations for the good, medium and bad states, respectively.
Table 8. Linguistic terms for importance.
Linguistic VariableTrapezoidal Interval Type-2 Fuzzy Sets
Absolutely Strong (AS)((7,8,9,9;1,1),(7.2,8.2,8.8,9.0;0.8,0.8))
Very Strong (VS)((5,6,8,9;1,1),(5.2,6.2,7.8,8.8;0.8,0.8))
Fairly Strong (FS)((3,4,6,7;1,1),(3.2,4.2,5.8,6.8;0.8,0.8))
Slightly Strong (SS)((1,2,4,5;1,1),(1.2,2.2,3.8,4.8;0.8,0.8))
Equal (E)((1,1,1,1;1,1),(1,1.1,1,1;1,1))
If candidate I has one of the above linguistic variables assigned to it when compared with candidate j, then j has reciprocal value when compared with i.Reciprocals of above
Table 9. The relative importance of C5 and C6 nodes.
Operator 1stOperator 2ndOperator 3rd
C5C6C5C6C5C6
C5EEE1/SSEE
C61/EESSEEE
Table 10. Relative weight of the parent nodes.
Parent NodeChild NodeRelative Weight
Weather conditions (C14)Operating environment (C4)0.6
Traffic density (C15)0.4
Communication bandwidth (C13)Communication quality (C12)0.64
Operating environment (C4)0.36
Communication quality (C12)Ship’s condition (C3)0.42
Ship’s feedback (C9)0.16
Software performance (C10)0.42
Communication quality (C12)SCC’s feedback (C11)0.48
Software performance (C10)0.52
Software performance (C10)Ship’s feedback (C9)0.55
Communication quality (C12)0.45
Ship’s feedback (C9)Situation awareness (C6)0.43
Experience (C7)0.21
Communication and collaboration (C8)0.36
Fatigue (C5)Operators’ performance (C2)0.4
Situation awareness (C6)0.6
Operators’ performance (C2)Remote control
by SCC (C1)
0.215
Ship’s condition (C3)0.215
Operating environment (C4)0.57
Table 11. CPT of ‘communication quality’ (C12).
NodeState and Probability
C13 abc
C4 abcabcabc
C12a0.97140.72440.16920.26450.02040.02040.023150.00770.0008
b0.02780.26790.80760.71500.71500.71500.80760.26790.0278
c0.00080.00770.02310.02040.26440.26450.16920.72430.9714
a, b, c represent the abbreviations for the good, medium and bad states, respectively.
Table 12. Adjustment factors for the basis error probabilities.
State of the Parent NodeAdjustment Factor Q
Good (a)0.1
Medium (b)1.0
Bad (c)10
a, b, c represent the abbreviations for the good, medium and bad states, respectively.
Table 13. Probability of the ‘remote control by the SCC’ (C1) and its parent node.
NodeStateProbability
Operators’ performance (C2)Good (a)0.5206
Medium (b)0.4489
Bad (c)0.0304
Ship’s condition (C3)Good (a)0.3416
Medium (b)0.5629
Bad (c)0.0955
Operating environment (C4)Good (a)0.7000
Medium (b)0.2585
Bad (c)0.0415
Remote control by the SCC (C1)Success0.9923
Failure0.0077
a, b, c represent the abbreviations for the good, medium and bad states, respectively.
Table 14. Failure probability of the end states.
End StateEnd State TypeProbability
E1Normal navigation9.45 × 10−1
E2Contact due to perception stage failure3.67 × 10−2
E3Contact due to decision-making stage failure1.68 × 10−3
E4Contact due to execution stage failure1.66 × 10−2
Table 15. Five accident-causing event chains with the highest risk.
No.Accident-Causing Event Chains *Probability
1IE-P1(0)-P2(0)-End 23.676 × 10⁻²
2IE-P1(0)-P2(1)-P4(0)-End 31.671 × 10⁻³
3IE-P1(1)-P3(1)-P5(1)-P6(0): F8,F11-End 41.795 × 10⁻⁴
4IE-P1(1)-P3(1)-P5(0)-End 41.234 × 10⁻⁴
5IE-P1(1)-P3(1)-P5(1)-P6(0): F9,F11-End 48.421 × 10⁻⁵
* The normal functioning of the pivotal event is marked as 1; its failure is marked as 0.
Table 16. The VF of the power and propulsion system equipment across accident end states.
LabelComponentVF
F8, F11Converter0.02651
F16, F17, F18, F19, F20, F21Diesel generator 0.01445
F9, F10Electric motor0.01243
F6, F13Bus bar0.00151
F7, F12Transformer0.00104
F4, F15Propeller0.00046
Publisher’s Note: MDPI stays neutral with regard to jurisdictional claims in published maps and institutional affiliations.

