Article

Turbulent Heat Fluxes in a Mediterranean Eddy Quantified Using Seismic and Hydrographic Observations

College of Meteorology and Oceanography, National University of Defense Technology, Changsha 410073, China
*
Author to whom correspondence should be addressed.
J. Mar. Sci. Eng. 2022, 10(6), 720; https://doi.org/10.3390/jmse10060720
Submission received: 12 April 2022 / Revised: 17 May 2022 / Accepted: 19 May 2022 / Published: 24 May 2022
(This article belongs to the Section Physical Oceanography)

Abstract

:
Mediterranean eddies (meddies) play an essential role in transferring heat, salinity and momentum into the Atlantic Ocean. The rate of heat (and salt) flux from the meddy and its ultimate lifetime are key proxies to understanding how meddies impact the redistribution of heat and salt in the ocean system. A Mediterranean eddy was observed in the Gulf of Caidz in 2007 using seismic and hydrographic data. The spatial distribution of turbulent dissipation rates around the meddy is estimated from the seismically derived internal wave spectra subrange using fine-scale parameterization. Turbulent dissipated rates are lowest ( 10 11   W / k g ) within the core of the meddy but rise by nearly two orders of magnitude at the upper and lower boundaries, where signs of double diffusive convection are observed. Along the left flank of the meddy, thermohaline intrusions and interleaving of water masses are found in inverted temperature and salinity profiles, transporting heat laterally from the warm core to the Atlantic water with a flux of around 470   W m 2 . The meddy presented in this study is shown to decay in 2 years, primarily due to the heat loss associated with thermohaline intrusions. For the first time, heat fluxes around the meddy and its lifetime are quantified using seismic oceanography data, and the methods proposed here can be applied to more seismic datasets in the global oceans.

1. Introduction

Submesoscale coherent vortices (SCVs), with a limited vertical extent of hundreds of meters, populate the interior ocean [1]. The interaction between subsurface currents and topographic features (e.g., capes or promontories), which is followed by submesoscale instabilities, is the primary reason for the generation of SCVs [2,3,4,5]. These submesoscale coherent vortices trap material within their cores and due to their long lifetimes (years) can transport material for tens of thousands of kilometres, therefore playing an important role in the redistribution of heat, salt and nutrients in the ocean system [5,6]. Although rare, observations of submesoscale coherent vortices exist across the global oceans [7,8] but the most well-known are meddies, or Mediterranean eddies. Meddies transport most of the Mediterranean outflow water into the wider Atlantic Ocean [9,10], and the signatures of Mediterranean outflow are found as far as the South Atlantic and the Antarctic Circumpolar Current (ACC), affecting not only the temperature–salinity of the Atlantic Ocean but also the world ocean in general [11,12].
Mediterranean eddies have been a hot topic due to their essential role in transferring heat, salinity and momentum [9,10]. Although rare, conventional hydrographic data were collected to investigate the role of meddies in the dispersion of salt and heat to the Atlantic. For instance, an anticyclonic eddy (named “Sharon”) was tracked for two years and its movements, evolution, turbulent mixing and decay were also monitored [13]. This well-known, comprehensive hydrographic dataset of meddy “Sharon” facilitates a number of research works on revealing mixing processes around the meddy and associated heat fluxes [14,15,16,17,18].
Due to the extremely high temperature and salinity of the meddy compared to that of the Atlantic Sea water, the periphery of the meddy is an ideal candidate for double-diffusive effects. Double diffusive convection is driven by the fact that temperature diffuses approximately 100 times faster than salt in sea water. There are two forms of double-diffusive convection: “diffusive convection” and “salt fingers”. Diffusive convection (also known as “diffusive layers”) requires that both temperature and salinity have negative vertical gradients (i.e., cold fresh seawater over warm salty water): diffusive convection is therefore observed to dominate in the upper half of meddies [14]. On the contrary, positive vertical gradients of temperature and salinity (i.e., warm salty seawater over cold freshwater) is a requisite for salt-finger mixing, which was typically observed below the core of meddies [14,16,17]. In addition to diffusive convection and salt fingering, heat and salt can also be lost from the meddy through thermohaline lateral intrusions, which are commonly observed at oceanic fronts where density compensated thermohaline gradients can stir laterally [19,20,21]. Thermohaline intrusions are commonly observed at the edge of meddies, where the warm salty core water abut the relative cold fresh Atlantic water. Previous studies suggest that the decay of a meddy is predominantly caused by the heat loss associated with thermohaline intrusions, over and above double-diffusive effects [13,18].
However, limitations in the horizontal resolution of more traditional hydrographic observations prevent detailed imaging and understanding of the fine scale phenomena that mix and stir heat and salt out of the meddy core. For instance, due to the sparse deployment of hydrographic instruments such as conductivity–temperature–depth (CTD) casts and microstructure profilers, there is a significant lack of high-resolution observations of dissipation rates within meddies, preventing us from linking dissipation rates with corresponding fine-scale mechanisms. However, this limitation can be addressed by exploiting seismic oceanography (SO) methods. This technique utilizes acoustic energy reflected at changes in acoustic impedance (i.e., high temperature, and to a lesser extent salinity gradients) within the water columns [22,23,24]. Compared to conventional hydrographic acquisition data, seismic images of the water column are distinguished by excellent vertical and horizontal resolutions of the order of 20 meters [23]. Up to now, seismic oceanography data have been used to investigate various oceanic phenomena with unprecedented horizontal resolutions in the global oceans, such as eddies [25,26,27], ocean fronts [22,28], internal waves and turbulent mixing [29,30,31,32,33]. Moreover, it is demonstrated that internal wave and turbulence regimes can be identified in the horizontal spectra of vertical displacements derived from seismic undulations [29,34]. Therefore, seismic images can be used to calculate the spatial distribution of turbulence dissipation in different oceans [30,32,33]. Thanks to the development in seismic oceanography, meddies are captured by highresolution (O(10 m)) seismic sections, and the corresponding temperature and salinity field can be inverted [35,36,37], shedding light on understanding fine scale phenomena around meddies. Seismic images have also been used to explore the mixing processes around the meddy. For instance, Song et al. [38] qualitatively analyzed the mixing mechanisms of one meddy imaged using acoustic methods, suggesting both eddy stirring and thermohaline intrusions take part in the variance cascade. Biescas et al. [39] showed that thermohaline staircases were able to be captured by seismic sections, in which different staircase layers interacted with a meddy, and a seamount and internal waves were observed. Bai et al. [40] estimated the quantitative mapping of diffusivities around a meddy using seismic horizontal spectra. However, those diffusivities derived from seismic data were not ground-truthed using hydrographic observations (i.e., CTD and Lowered Acoustic Doppler Current Profile (LADCP)), and the uncertainties associated with derived diffusivities were not quantified, neither. Although small scale mixing mechanisms such as thermohaline intrusions and staircases have been observed in seismic images [38,39], mixing processes and resultant heat fluxes around meddies have not yet been presented or computed from temperature and salinity sections inverted from seismic data. Turbulent dissipation rates, which are normally measured by microstructure profilers, are widely used to compute heat fluxes associated with seasonal sea ice [41], thermohaline staircases [42], environmental forcing factors [43], etc. Recently, by exploiting turbulent dissipation rates derived from seismic reflections, Gunn et al. [28] estimated vertical heat fluxes due to the diapycnal mixing of a front in the Brazil–Falkland Confluence, demonstrating the possibility of estimating heat fluxes from seismic oceanographic data. However, when considering heat fluxes within a meddy, different mixing processes (e.g., diffusive convection, salt fingers and thermohaline intrusions) need to be accounted for separately. This work demonstrates that seismic oceanography data, for the first time, can be used to estimate heat fluxes and therefore the lifetime of a meddy.
This study focuses on a meddy collected by the Geophysical Oceanography (GO) research survey in 2007 [44]. Firstly, temperature and salinity sections of high lateral resolution are inverted from seismic sections. Secondly, the spatial distribution of dissipation rates around the meddy is computed from seismic data along with uncertainties, then compared with that computed from CTD/LADCP data. It is the first time that turbulent dissipation estimated from the internal wave subranges of seismic horizontal slope spectra are compared with co-located in-situ hydrographic estimates. Finally, we identify different mixing mechanisms around the meddy through hydrographic and inverted seismic oceanography data. The heat flux associated with each mixing process is estimated, and the meddy decay time is computed.

2. Seismic and Hydrographic Data Acquisition

The EU-funded Geophysical Oceanography (GO) project was conducted to collect coincident oceanography and multichannel seismic data for the first time and also to capture meddies at the Mediterranean outflow. As part of the GO dataset, the seismic survey GOLR12 was acquired on the 7 May 2007 in the Gulf of Cadiz by the RRS Discovery (Figure 1). Six bolt 1500 LL airguns were used as the seismic source with a designed bandwidth of 5–70 Hz. One 2400 m long SERCEL streamer, with 192 channels and 12.5 m group spacing, was towed behind the vessel to record the acoustic reflection energy.
Coincident hydrographic measurements are used to calibrate the seismic data. Twenty-four expendable bathythermographs (XBTs) with a spacing around 2.3 km were deployed from the RSS Discovery coincident with seismic data acquisition. There were three CTD and LADCP casts deployed every ~20 kilometers by another ship called FS Poseidon, a few hours before or after the seismic acquisition. Both the CTD and LADCP instruments were attached to a steel frame and lowered simultaneously, before reaching 2000 m in depth.

3. Methods

3.1. Seismic Processing

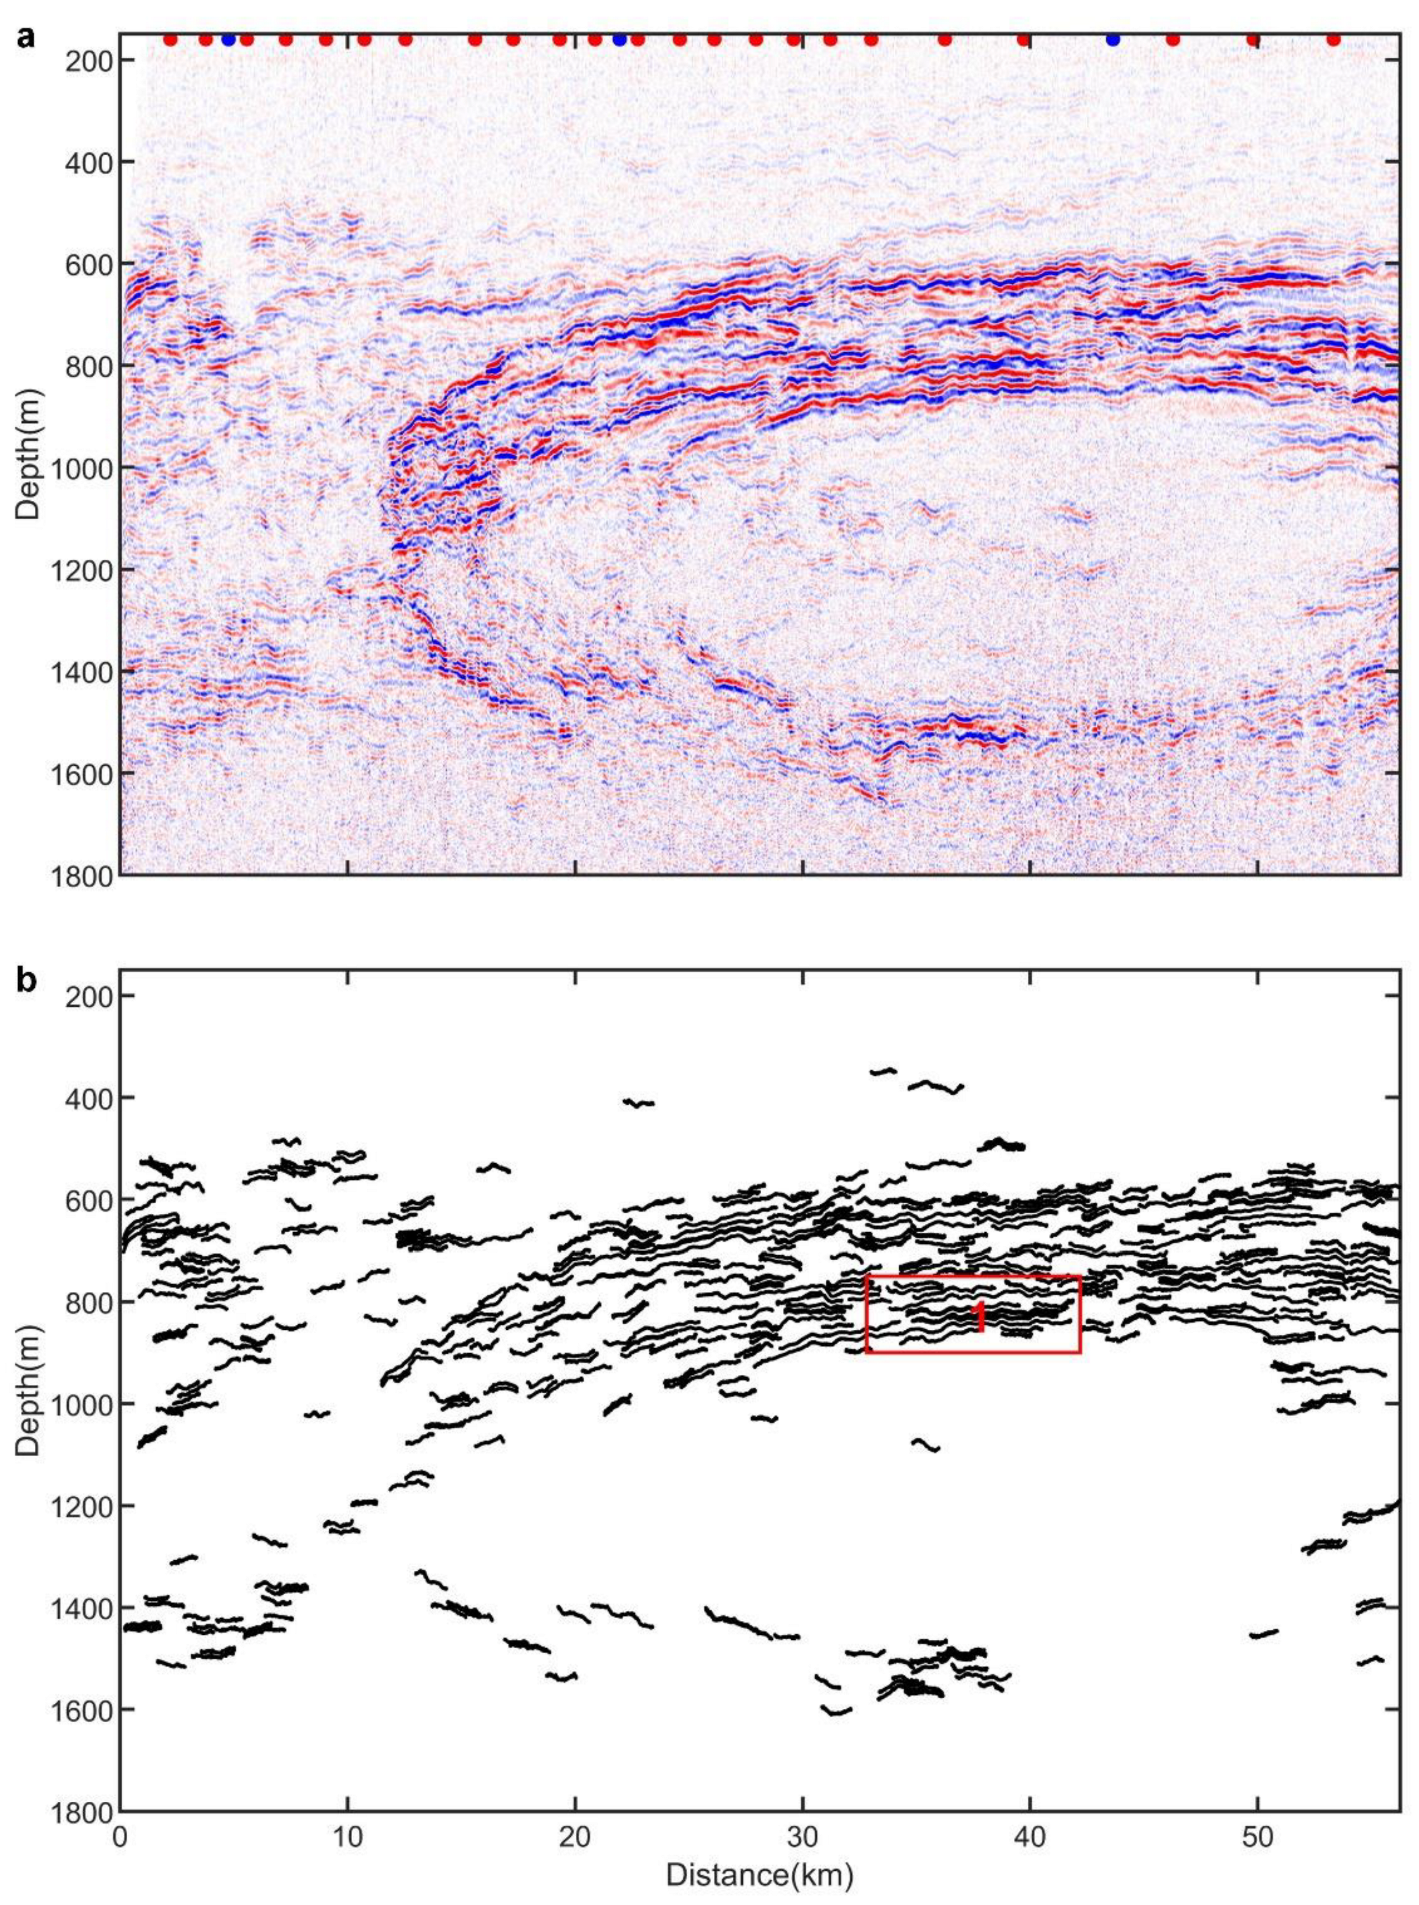
A seismic processing flow was applied to this survey to obtain the optimal seismic stack section (Figure 2a) for turbulent dissipation estimates and later inversions of temperature and salinity. Bandpass-filtering, direct wave removal and amplitude correction were applied to raw shot gathers before they were sorted into common midpoint (CMP) gathers, which is a group of traces from the same lateral location or source–receiver mid-point. A normal moveout is applied to CMP gathers using optimal velocities from the velocity analysis. Finally, all the traces in the same CMP gather were stacked and averaged to generate the final stack section with an enhanced signal-to-noise ratio. True reflectivity coefficients, which were essential for the later inversion, were extracted from the stack section using a re-weight deconvolution strategy. The processing flow and parameters are described in more detailed in [37].

3.2. Temperature and Salinity Inversion

In spite of high resolutions of O(10 m), seismic images cannot directly provide us with temperature and salinity data as they map acoustic impedance changes that are related to the vertical gradients of temperature and salinity. Therefore, it is necessary to apply the inversion technique to extract temperature and salinity information from seismic data and coincident hydrographic data. The conventional linearized inversion approach [35,36] has been used to invert the temperature and salinity sections of meddies, but it is not able to quantify the uncertainties in inverted results. Tang et al. [45] proposed a Bayesian Markov Chain Monte Carlo (MCMC) inversion technique to spatially quantify uncertainties in inverted results. However, this MCMC method relied upon highly continuous acoustic reflection horizons, which are rarely present in real oceanic environments due to complex water structures, instabilities and unstable seismic acquisition conditions. Instead, we used a spatially iterative MCMC method [37] to sidestep those limitations. This adapted MCMC method is shown to perform better in inverting meddies, which typically display rapidly changing temperatures and salinities and disrupted reflection horizons at their boundaries [37].
Firstly, we construct the prior model (Figure 2 of [37]) using all the temperature profiles from XBT casts and corresponding salinity profiles estimated using a non-linear temperature–salinity model, which is derived from the three coincident CTD casts using the neural network approach [46]. Then, the inversion process is conducted at each CMP point where the prior model is iteratively updated to incorporate both the hydrographic data and all the previous inversion results (Figure 3 of [37]), until the whole section has been inverted. Finally, we obtain the high-resolution fields of temperature and salinity (Figure 5 of [37]), associated with mean uncertainties of 0.16 °C and 0.055 psu. The detailed inversion process can be found in Xiao et al. [37].

3.3. Turbulent Dissipation Rates Estimate

In this section, turbulent dissipation rates are computed from both seismic and hydrographic data, along with their uncertainties.

3.3.1. Horizontal Slope Spectra from Seismic Reflections

Seismic reflections are extracted (Figure 2b) and spectrally analyzed. Seismic reflection horizons are normally assumed to follow the isopycnals and isothermals [36,47,48], or at least the internal wave field perturbs both isothermals and isopycnals in a similar way [30]. Here, we followed those previous assumptions.
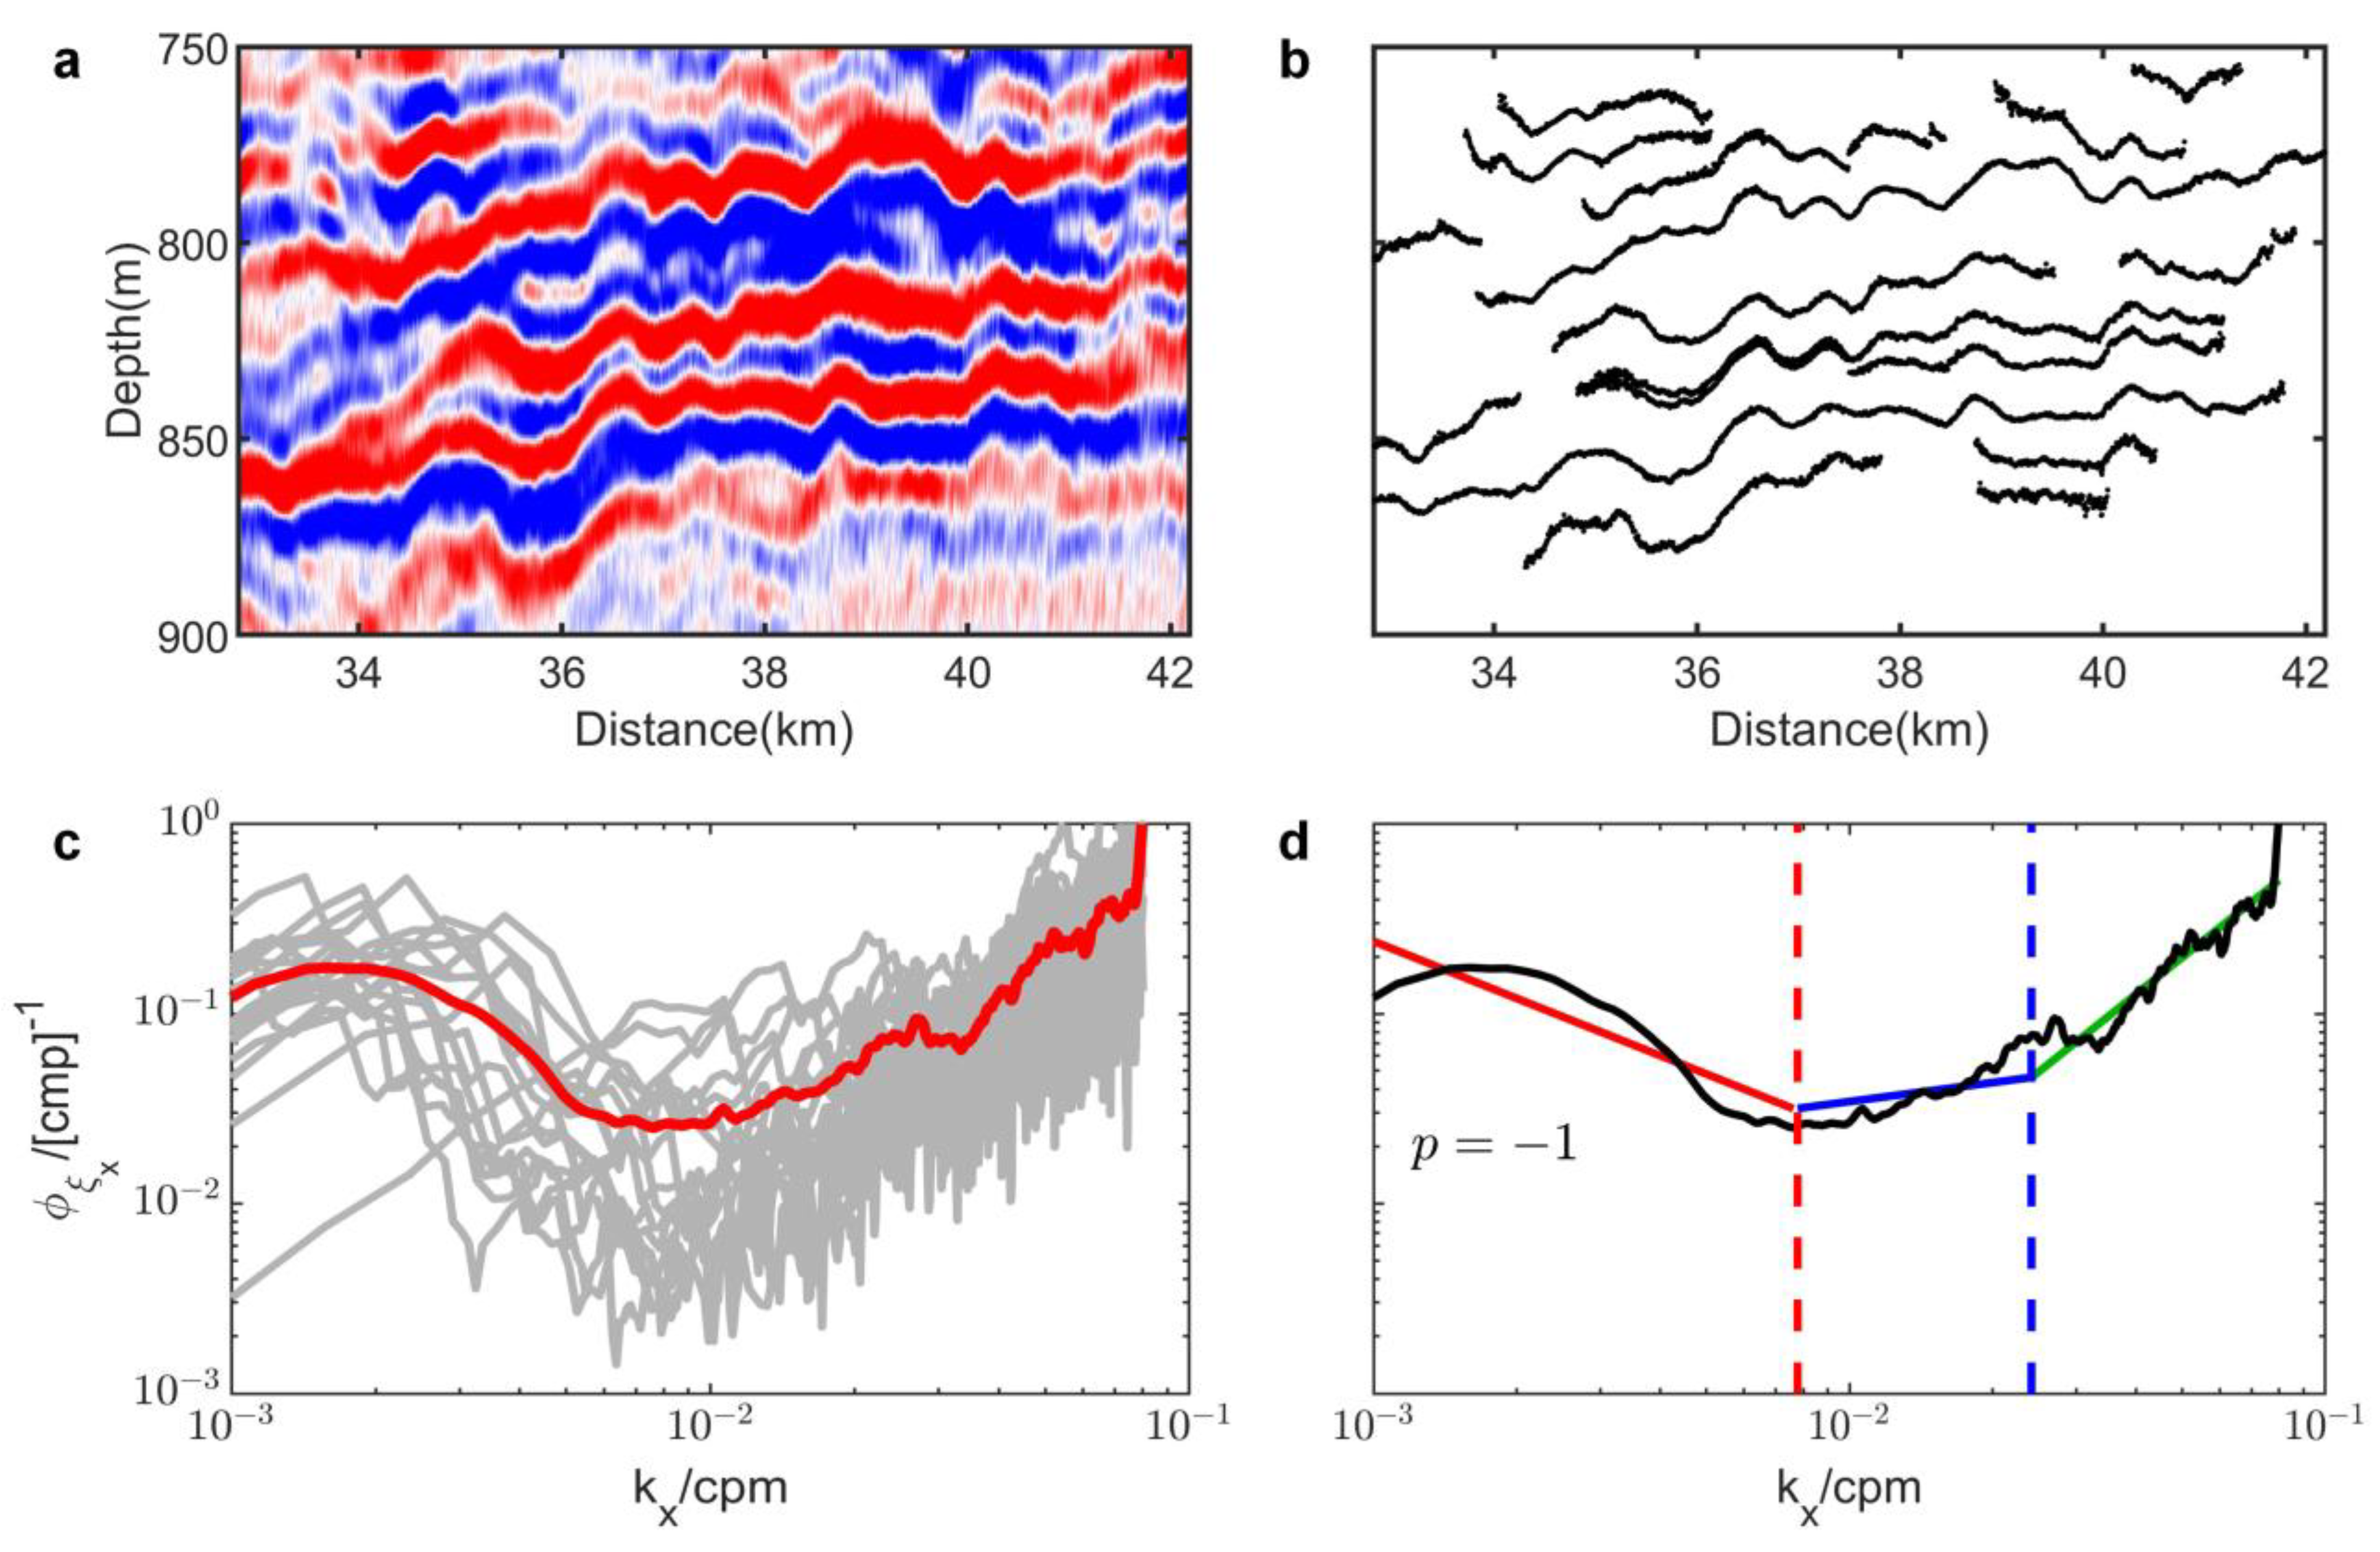
Firstly, the whole seismic section is divided into half-overlapping boxes of 9 km length and 150 m depth following the methods in [29], and one box at the top edge of the meddy is shown in Figure 3a,b. The turbulent dissipation rate is assumed to be identical in each box. The box size was carefully chosen to meet the following requirements: the box should be large enough to contain a sufficient number of reflectors for spectral analysis, but not too large to include areas with different turbulent features. Secondly, within each box, the amplitude of each reflector was normalized to ±1 by performing a Hilbert transform [49]. Finally, contours of the ±0.6 values of normalized amplitudes were tracked and then averaged along the length to obtain the preliminary reflectors [30]. Reflectors less than 1 km were discarded to ensure each spectrum had a sufficient resolution in wavenumber. In summary, 1284 reflectors were tracked across the seismic section with a total length of 2355 km. The average length of a single reflector was 1.83 km. The whole seismic section was divided into 231 boxes, and 145 of them were found to contain trackable reflectors.
To calculate the power spectra of vertical displacement ϕ ξ , each reflector was linearly detrended and then spectrally analyzed using the multi-taper Fourier transform [50]. Power spectra were converted to horizontal slope spectra ϕ ξ x using Equation (1), where k x is the horizontal wavenumber. This conversion enables positive/negative slopes to be more easily differentiated by eye, making the crossover of internal wave and turbulence regimes more evident.
ϕ ξ x = ( 2 π k x ) 2 ϕ ξ
Within each box, all spectra were averaged (Figure 3c) to increase the signal-to-noise ratio. For each averaged spectrum, to precisely identify the internal wave, turbulence and noise regime, a theoretical model was introduced. Then, this model was fitted to the measured slope spectra by minimizing the difference between them [30]. From low to high wavenumber, each slope spectrum is made up of internal wave, turbulence and noise regimes, given that all three regimes exist. In each regime, the relation between horizontal slope spectra and the wavenumber is given by a power law ϕ ξ x   k x p , while p has different values for each regime. For the internal wave subrange, previous studies of internal wave models suggest an exponent from −1 to 0 [31,51,52,53]. For the turbulence subrange, the exponent value is 1/3 according to the Batchelor model [54]. The noise spectrum has a slope of +2 since the white noise (has a slope of 0) is multiplied by ( 2 π k x ) 2 . By fitting the model to each spectrum, subranges can be identified in the log space, as shown in Figure 3d.
For all the spectra in 145 boxes, few spectra whose internal wave or turbulence regimes were covered by noise were discarded. Overall, 137 spectra contained internal wave subranges, and 109 of them showed turbulence regimes. To verify the consistency between the theoretical model and spectra, a best fit straight line for each spectral regime was obtained using the least square method [30]. For the internal wave subrange of each spectrum, it was found that the slope of the internal wave had an average of −0.95 and a standard deviation of 0.36 (shown in Figure A1), which is consistent with the theoretical IW slope range (−1,0). However, the averaged turbulence slope was found to be 1.18 (more than three times the reference turbulence slope 1/3) and a standard deviation of 0.55 (see appendix). The potential reason is that the noise in turbulence spectra was not completely filtered out; thus, the noise spectra contaminated the turbulence spectra and enhanced the fitted slope. However, those spectra could neither be fully identified as noise since their slopes were not as high as +2. Jun et al. [55] showed that after applying the machine learning noise attenuated algorithm, the noise parts of the slope spectra were converted to IW and turbulence spectra. This result also supports our “spectra contamination” theory.
Since the horizontal slope spectra of seismic reflection undulations contained reliable internal wave subranges, we then computed the dissipation rates from those internal wave regimes using fine-scale parameterizations [30,56,57]. This method enabled us to estimate turbulent dissipation indirectly by comparing measured internal wave spectra and the Garrett–Munk (henceforth GM) model predictions. The turbulent dissipation rate ε is given by [30]
ε = ε 0 ( N N 0 ) 2 f cosh 1 ( N / f ) f 30 cosh 1 ( N 0 / f 30 ) R ω ( R ω + 1 ) 6 2 R ω 1 ϕ ξ x 2 ϕ ξ x G M 2
where ε 0 = 6.37 × 10 10   W k g 1 and N 0 = 5.2 × 10 3   r a d s 1 are the canonical GM dissipation rate and buoyancy frequency at 30° latitude [57]. N is the field buoyancy frequency, and a high-resolution buoyancy frequency section is calculated from the inverted temperature and salinity (Figure A2). R ω   is the shear-to-strain ratio, which is computed from shear and strain spectra using CTD/LADCP data (discussed in Section 3.3.2). The f 30 is the Coriolis effect at 30° latitude. The f is assumed to be constant across the whole seismic section and calculated using the latitude at the center of the seismic line, 36.3° N. ϕ ξ x G M is the reference GM model spectrum of the GM76 model [51,52], which is chosen following Dickinson et al. [30]. The angular brackets denote the variance of spectra over the internal wave subrange. Each dissipation rate is computed inside the corresponding box, and therefore the spatial distribution of turbulent dissipation rates is acquired, as analyzed in Section 4.1.1.

3.3.2. Strain and Shear Spectra from Hydrographic Data

During the seismic survey, three CTD/LADCP casts were deployed by the ship FS Poseidon, which followed the seismic survey ship and deployed the CTD/LADCP just after the seismic survey. Here we estimate the turbulent dissipation rates from those casts for comparison with seismically derived values. We then extract mixing rates from the hydrographic data following the fine-scale parameterization processing flow [58].
Strain (denoted as ξ z ) represents the perturbation of isopycnals by internal waves and is computed using Equation (3).
ξ z = N 2 N r e f 2 N r e f 2
where N is the buoyancy frequency calculated from the CTD measured temperature and salinity. N r e f is the background buoyancy frequency profile at each CTD station and estimated using adiabatic levelling over a pressure range of 400 dB [59]. The temperature and salinity profiles are sampled every 1 m. Strain profiles are divided into half-overlapping segments of length 300 m. Segments are constructed from top to bottom as the meddy is close to the sea surface, and the first segment is centered at depth 300 m. Finally, the strain spectra are computed in each segment.
Shear, V z , is the vertical gradient of the horizontal current velocity, which is measured by the LADCP. The shear spectra are given as follows:
S [ V z / N ] = S [ u z / N ] + S [ v z / N ]
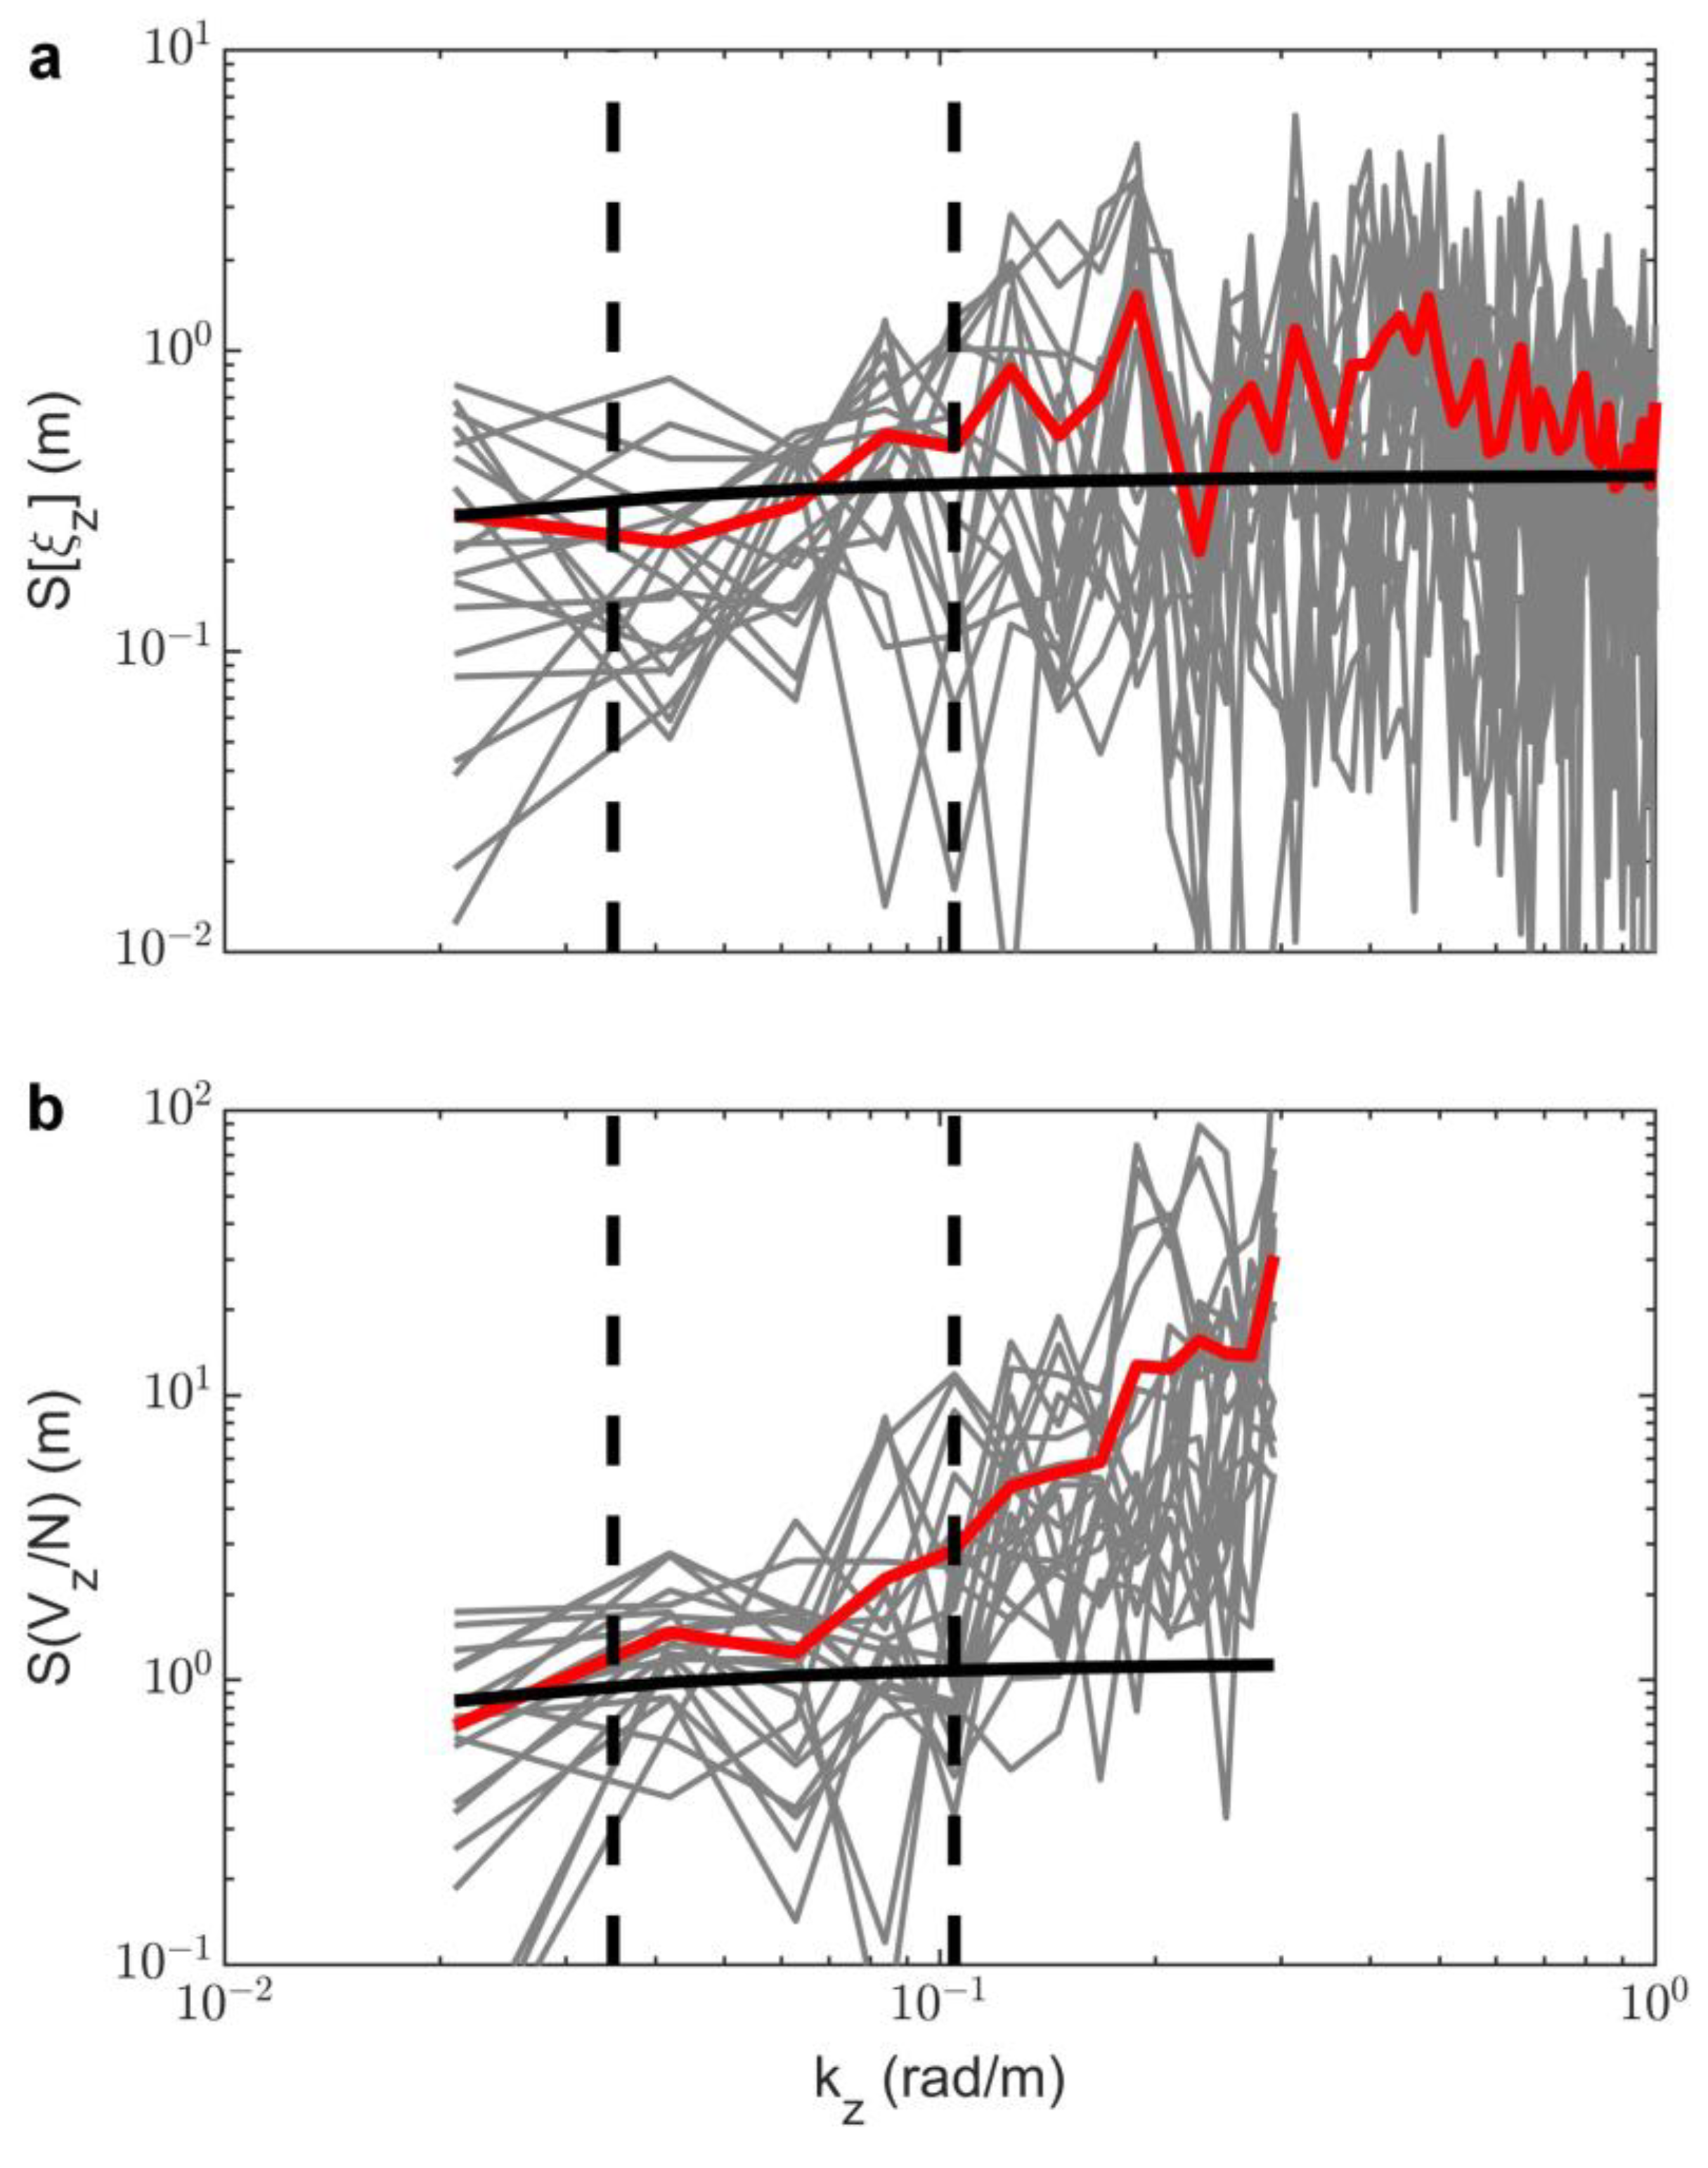
where u z and v z represent the vertical gradient of the zonal and meridional velocity components, respectively. The sampling rate of LADCP is 10 m. The same segments are used for shear spectra. Strain and shear spectra are shown in Figure 4. The shear and strain spectra are integrated in the same wavenumber range between 60 m and 180 m. This wavenumber bandwidth is carefully chosen to avoid noise and the high-wavenumber drop-off.
Then, turbulent dissipation rates are estimated from both strain and shear spectra using fine-scale parameterization [60,61]:
ε s t r a i n = ε 0 ( N N 0 ) 2 f cosh 1 ( N / f ) f 30 cosh 1 ( N 0 / f 30 ) R ω ( R ω + 1 ) 6 2 R ω 1 ϕ ξ z 2 ϕ ξ z G M 2
R ω = S [ V z / N ] S [ ξ z ]
where the buoyancy frequency N is calculated using the CTD measured temperature and salinity and averaged in each spectral segment. ϕ ξ z G M is the GM76 strain spectrum, while ϕ ξ z is the measured spectrum derived from CTD data. The reference GM76 and measured spectra are integrated using the same range: 60 m to 180 m. R ω is the shear-to-strain ratio, which is calculated using the variance of shear and strain spectra, representing the frequency content of the internal field, at each segment. R ω is assumed to be constant for studies lacking shear or strain data (e.g., [30]). However, since assuming a constant value for R ω incorrectly can introduce significant error [62], we calculate the field Rw from CTD/LADCP data to acquire more accurate turbulent dissipation rates.

3.3.3. Uncertainty Estimates

In order to estimate the uncertainty associated with ε , the logarithmic form of Equation (2) (denoted as g ε in Equation (7)) is calculated because log 10 ( ε ) approximately obeys a normal distribution, e.g., [30,63].
g ( ε ) = log 10 ( ε ) = log 10 ( C ) + log 10 [ N 2 cosh 1 ( N / f ) R ω ( R ω + 1 ) R ω 1 E a 2 ]
where E a represents the ratio of variances of the horizontal slope spectrum and the corresponding GM spectrum inside the internal wave subrange; thus, E a is given by E a = ϕ ξ x / ϕ ξ x G M . C is a constant related to the reference buoyancy frequency, reference dissipation rate and the Coriolis effect at 30° latitude.
Thus, the uncertainty of ε is only determined by three physical parameters: the buoyancy frequency N , the shear-to-strain ratio R ω and the variance ratio E a . Assuming that the three parameters are weakly dependent, the uncertainty of log 10 ( ε ) is computed using the uncertainty propagation theory [64] to give
σ ( g ( ε ) ) = ( f N ) 2 σ 2 ( N ) + ( f R ω ) 2 σ 2 ( R ω ) + ( f E a ) 2 σ 2 ( E a )
Finally, the uncertainty of the turbulent dissipation rate is estimated from E a ratio and shear-to-strain ratio R ω uncertainties, while the contribution from buoyancy frequency is subtle and thus neglected. Both the log 10 ( ε ) of seismic and hydrographic estimates have the average final uncertainty around 0.6 logarithmic units. The details can be found in Appendix B.

3.4. Turner Angle

Previous observations have shown that double-diffusive convection occurs at the periphery of a meddy [14,16]. In order to quantify the susceptibility to double diffusion, the Turner angle (hereafter denoted as T u ) is introduced [65,66] as follows:
T u = tan 1 [ α ( θ / z ) β ( S / z ) , α ( θ / z ) + β ( S / z ) ]
where α and β are coefficients of thermal expansion and saline contraction, respectively. θ is the potential temperature, and S is salinity. When T u < 45 ° , stratifications are stable. T u > 90 °   indicates gravitational instabilities. 45 ° < T u < 90 ° corresponds to salt fingering instabilities, while 90 ° < T u < 45 ° corresponds to diffusive convection.

3.5. Heat Fluxes

Heat fluxes out of the meddy are associated with three processes, which are diffusive layers at the top edge of meddy, salt fingers at the bottom edge of meddy and thermohaline intrusions along the flanks of meddy (observation evidence is shown in Section 4.2). Therefore, each heat flux is computed separately.

3.5.1. Diffusive Layers

Diffusive layers phenomena dominate at the top edge of the meddy and convey the heat content out of the meddy core vertically upwards. The vertical heat flux is calculated in accordance with Fick’s laws of diffusion [67]:
F t o p = ρ C p K T t o p T z t o p
where T z t o p is the averaged vertical temperature gradient in the top edge region, C p is the isobaric heat capacity of seawater, and ρ is the density of seawater. K T t o p is the diapycnal diffusivity for the diffusive layers at the top edge of the meddy and takes the form
K T t o p = Γ ε N 2
where Γ is the mixing efficiency and N is the local buoyancy frequency [68]. The Osborn equation [68] gives reliable estimates for diffusivity with diffusive layers if we take Γ = 1 .

3.5.2. Salt Fingers

For salt fingers at the bottom edge of the meddy, vertical heat flux is given by
F b o t = ρ C p K T b o t T z b o t
where the diapycal diffusivity of salt fingers is calculated by
K T b o t = Γ s f ε N 2
The mixing efficiency for salt fingers Γ s f is calculated using [69,70,71]
Γ s f = R ρ 1 R ρ γ 1 γ
where γ is the heat/salt buoyancy flux ratio and R ρ is the density ratio, relating to the turner angle Tu:
R ρ = tan ( T u + 45 ° )

3.5.3. Thermohaline Intrusions

Thermohaline intrusions can occur because of the presence of warm salty water lying next to cold fresh water [19,20]. The potential energy in lateral water mass differences drives lateral mixing through double-diffusive mixing [21]. On the mesoscale (frontal), it can be assumed that the thermohaline anomalies produced by the lateral intrusion are balanced by the vertical mixing of heat across the intrusions [72]. The isopycnal thermal diffusivity K T I s i d e s is given by
K T I s i d e s = K T D s i d e s ( T i z ) 2 ¯ T f x 2
where T i and T f represent the temperature at the intrusion scale and frontal scale, respectively. T f x represents the horizontal gradient of temperature in the frontal scale, denoted as T x in the later text for convenience. Since the T x represents an overall gradient temperature across the front [18,72], regardless of the temperature changes inside the frontal area, we assume a constant T x across the frontal area and estimate it by computing the slope of best fitting straight line. T i z represents the vertical temperature gradient—the depth step here is 1 m [8]. T i z is averaged laterally in the frontal area to suppress noise. K T D s i d e s represents the diapycnal diffusivity due to double-diffusive processes, estimated using Equation (11). K T D s i d e s ( T i z ) 2 ¯ is the average over the entire intrusive region.
The heat flux associated with lateral intrusions is calculated using
F l = ρ C p K T I s i d e s T x

4. Result

4.1. Dissipation Rates around the Meddy

4.1.1. Spatial Distribution of Dissipation Rates

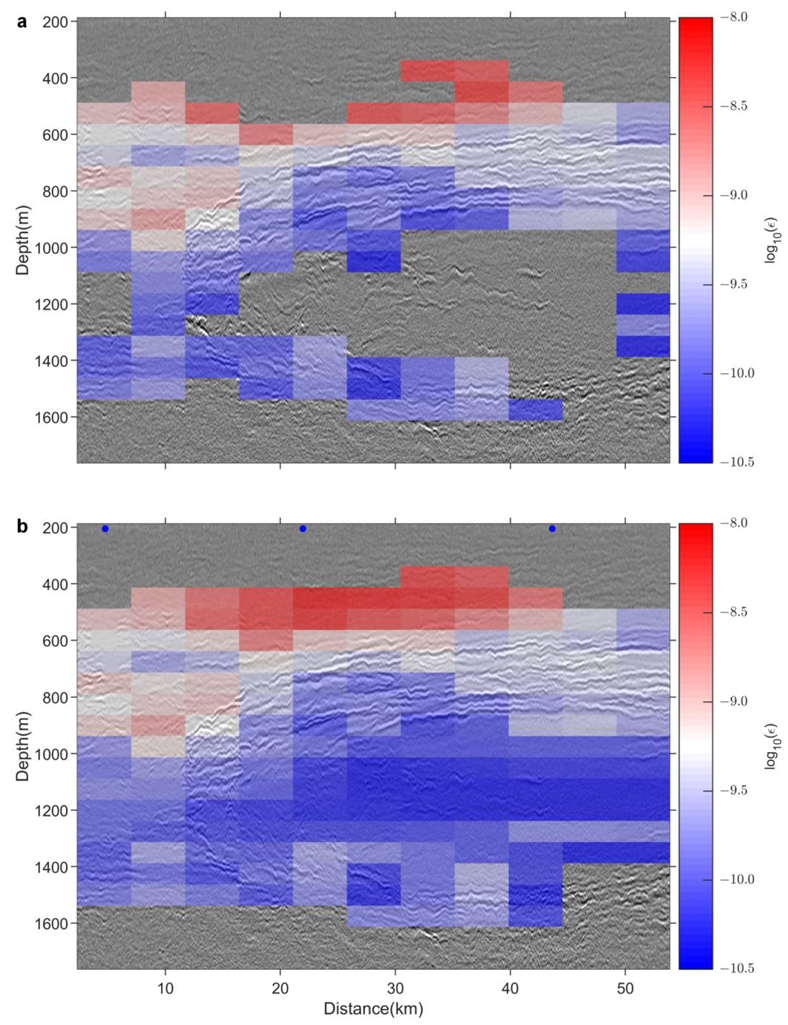
The spatial distribution of turbulent dissipation rates is shown in Figure 5. Note that there are only a few areas with dissipation rate estimates within the center of the meddy due to the low stratification (Figure A2) and thus lack of trackable reflectors. Computed turbulent dissipation rates vary by nearly two orders of magnitude across the meddy, with variability following the spatial features of the meddy as captured in the seismic stacked section (Figure 2a).
Dissipation rates are the lowest (averaged ε of 6.39 × 10 11   W k g 1 between 900 m and 1400 m) in the meddy core, reaching as low as 2.30 × 10 11   W k g 1 in individual sections. In contrast, an enhancement in turbulent dissipation rate is witnessed at the top and bottom edges of meddy with averages of 3.20 × 10 10   W k g 1 and 1.01 × 10 10   W k g 1 , respectively. The maximum turbulent dissipation rate ( 2.38 × 10 9   W k g 1 ) is found at the top edge of the meddy. Suppressed turbulent dissipation is found within the meddy core, while relatively high dissipation rates surround the meddy. This spatial pattern of dissipation around the meddy is consistent with previous research [7,73,74] and also shown to be a common feature of anticyclonic eddies in general [75].
The reason for suppressed dissipation rates within the meddy could be related to two mechanisms. Firstly, the weakest stratification is found inside the meddy core, leading to a reduction in wave shear, which results in weaker energy transfer to dissipation scales [75]. This mechanism is more directly expressed in Equation (2), in which the dissipation rate is driven by internal wave scales with the square of local buoyancy frequency. Secondly, a weakly stratified eddy core can act to modify the propagating internal waves, and thus high frequency waves are reflected away [7]. The elevated ε at the top and bottom edges of the meddy suggest physical mechanisms that facilitate the mixing in those areas. For instance, diffusive convection is found to dominate in the upper half of the meddy [14], while salt-finger phenomena facilitate mixing below the core of the meddy [14,16,17]. These different physical mechanisms that typically occur at the top and bottom edges of meddies could explain why the turbulent dissipation rate at the upper boundary is different from that at the lower boundary. Moreover, high dissipation rates at the top and bottom edges of the meddy may be associated with enhanced internal wave breaking: for example, Sheen et al. [7] found that internal wave energy was reflected from a Southern Ocean sub-surface eddy center and evolved toward critical layer breaking along the eddies upper and lower boundaries.

4.1.2. Comparison of Dissipation Rates from the Seismic and Hydrographic Data

The turbulent dissipation rate estimated from the CTD/LADCP casts can be compared with that from the seismic survey in detail since they were acquired at the same location and similar time, along with their corresponding uncertainties. The seismic acquisition and the CTD/LADCP deployments are independent, while dissipation rates from the seismic and hydrographic data use the same R ω derived from the CTD/LADCP data, as it cannot be computed from the seismic data.
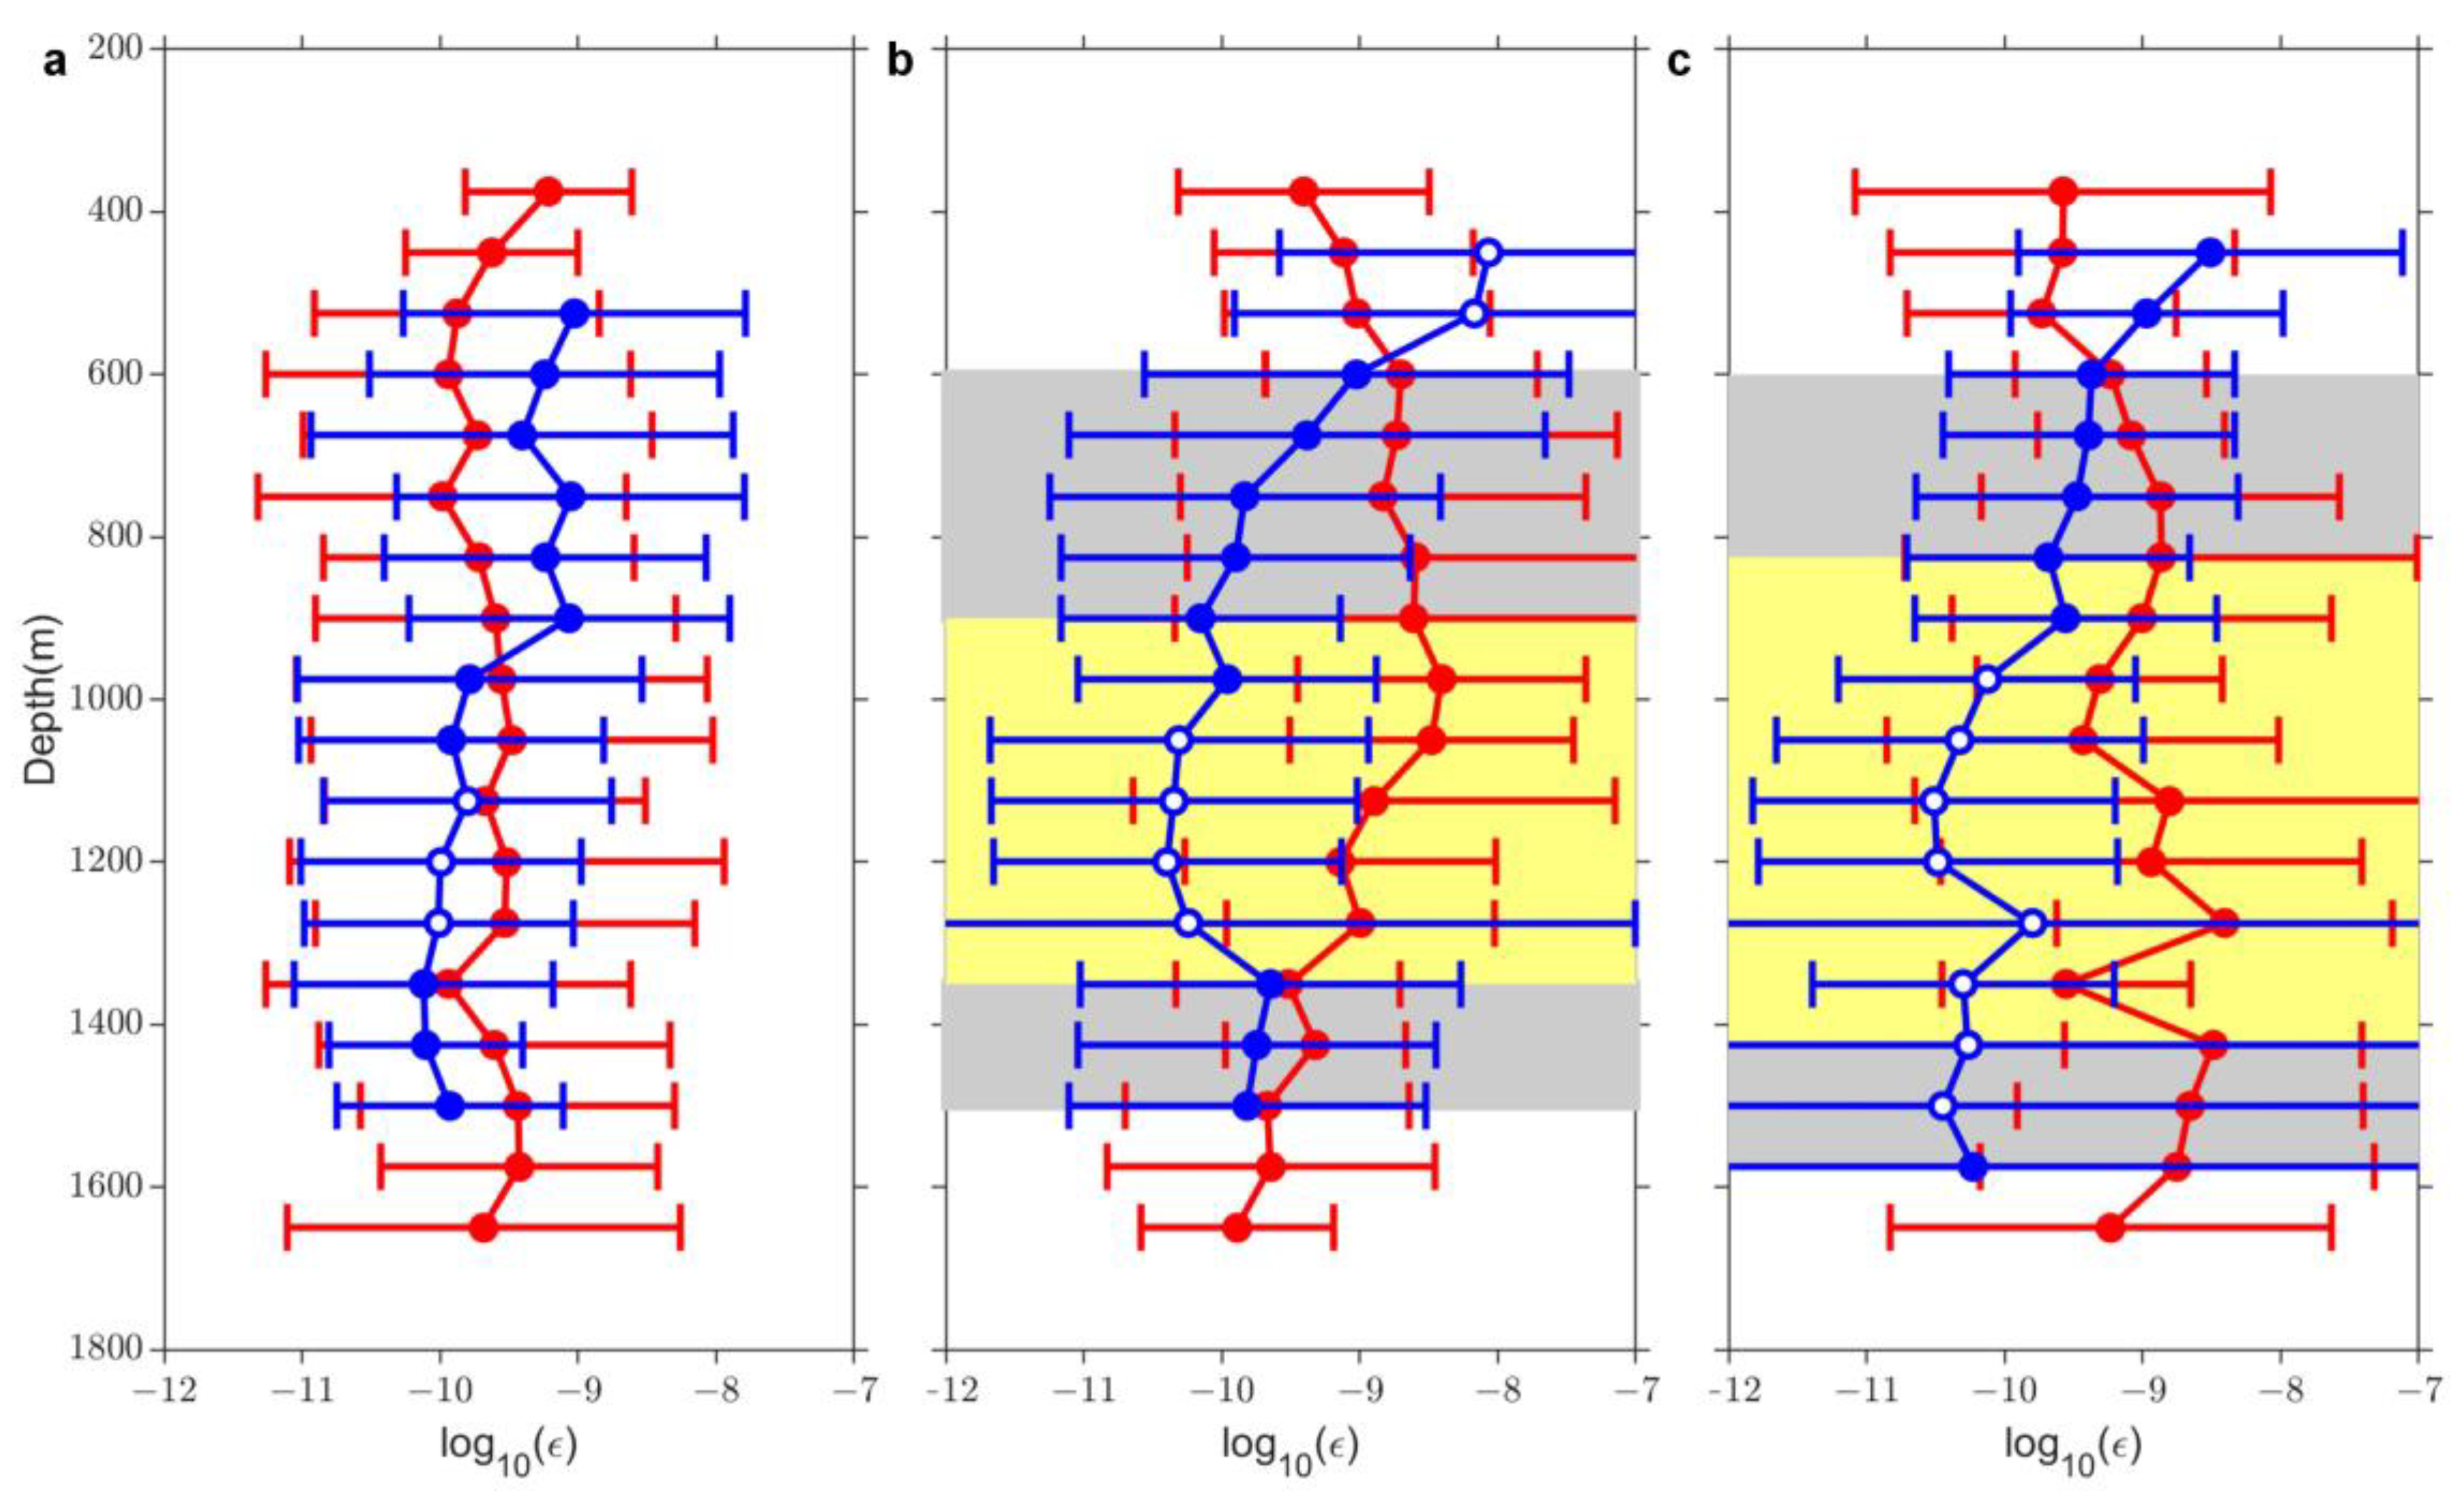
Outside the meddy (Figure 6a), log 10 ( ε ) values from two methods are nearly independent with depth, and both vary between -10 and -9 logarithmic units. All the log 10 ( ε ) from the seismic method are within the uncertainty ranges of log 10 ( ε ) from hydrographic data, and vice versa.
Within the region of the meddy (Figure 6b,c), log 10 ( ε ) computed from the seismic data and from hydrographic casts matches well at the meddy edge areas (e.g., depths 600 m to 900 m and 1300 m to 1500 m), with a mean absolute difference of 0.78 logarithmic units. However, discrepancies between the two methods are as large as 1.8 logarithmic units inside the core of the meddy. This discrepancy could be explained by three factors. Firstly, it is related to the fact that most of the estimates inside the core of meddy are interpolated from a few seismic tracked lines—the homogeneous core lacks seismic reflectors. Insufficient reflectors in low-stratified regions are an intrinsic problem of seismic data. Secondly, the low dissipation in the meddy core is not apparent in the CTD/LADCP data. This discrepancy might be because the vertical resolution is not high enough to resolve the vertical variations of dissipation rates inside the core, since the length of the spectral vertical bin (300 m) is close to the scale of the meddy core (500 m). Finally, both seismic and hydrographic methods potentially introduce errors at the same time, resulting in this discrepancy. The fine-structure parameterizations are shown to potentially overestimate the turbulent dissipation by up to 1 logarithmic unit, compared to that measured using microstructure profilers, as has also been found in other studies away from quiescent open-ocean regions [58,61].
As for uncertainties, we noticed that most of the 95% CI ranges (four times the uncertainty) of dissipation rates from both seismic and hydrographic data are around two orders of magnitude, while a few of them reach up to four orders of magnitude. The mean uncertainty in log 10 ( ε ) from seismic data (0.61 logarithmic units) is consistent with the findings of Dickinson et al. [30], who also estimated turbulent dissipation rates from seismic internal wave subranges and reported an average uncertainty of 0.5 ± 0.2 logarithmic units. As for turbulent dissipation rates from hydrographic data, the mean uncertainty in log 10 ( ε ) is 0.62 logarithmic units. Although on face value, this uncertainty is double the 0.3 logarithmic units found by Dickinson et al. [30], here we present a more realistic uncertainty by considering the uncertainty of R ω from the field hydrographic data, while Dickinson et al. [30] did not consider the uncertainty of R ω due to the lack of LADCP data.
Overall, 90% of dissipation estimates from the seismic image fall within the 95% CI of those computed from hydrographic casts, and vice versa, justifying that seismic dissipation estimates and their uncertainties.

4.2. Observation of Mixing Processes around the Meddy and Associated Heat Fluxes

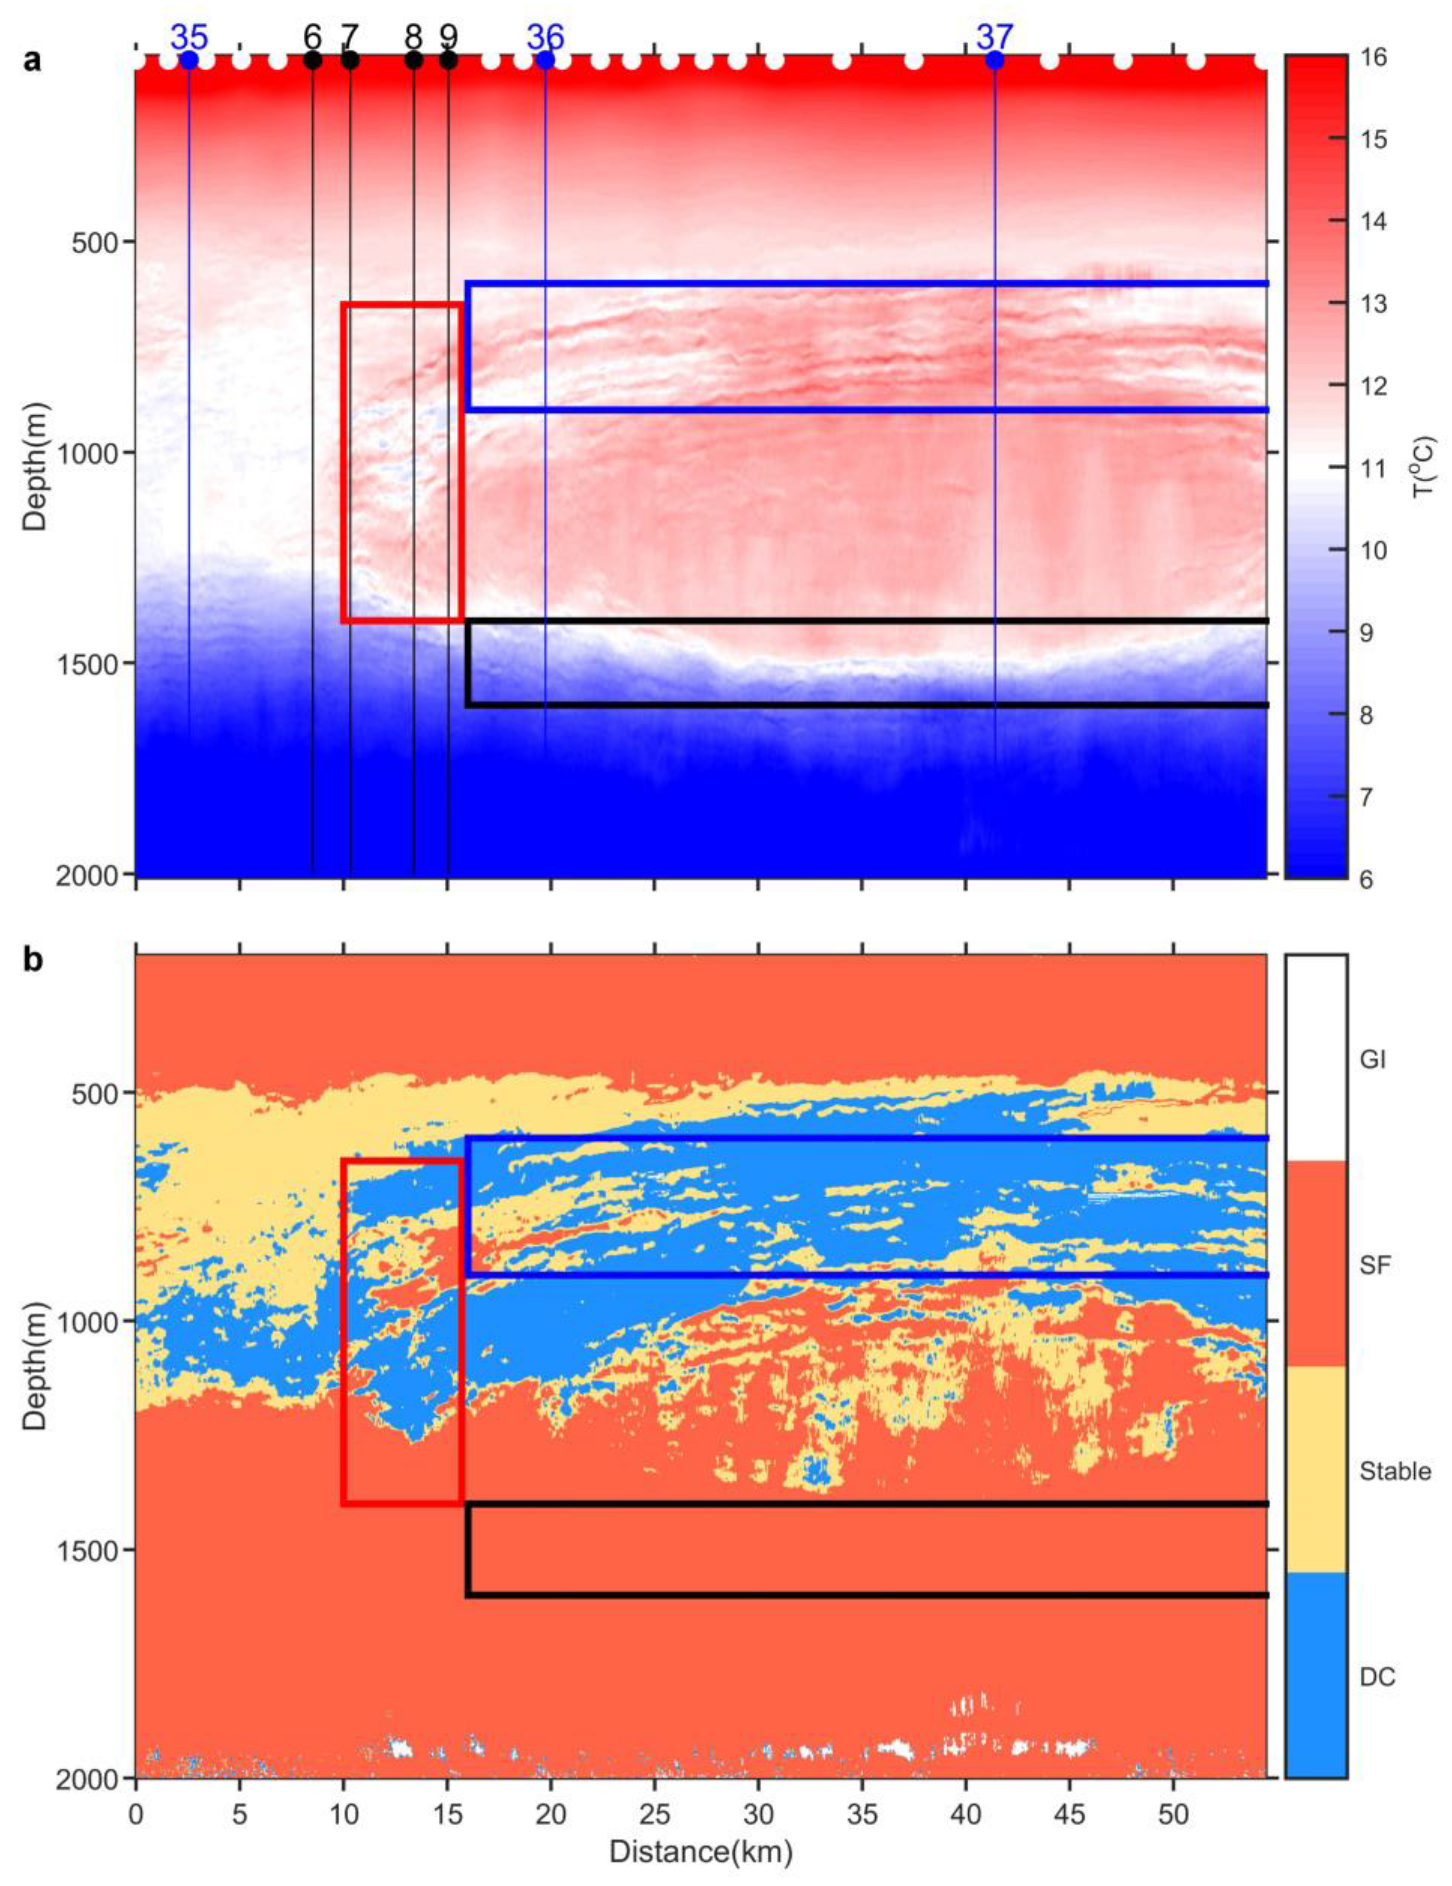
An elevated ε around the meddy indicates the presence of processes that facilitate the mixing. In this section, we focus on different mixing processes observed around the meddy and then quantify their contributions to heat fluxes. In order to analyze processes that remove heat and salt from the meddy core, the periphery of this meddy is divided into three parts (Figure 7a): the top edge (cold, fresh water overlies warm, salty water), the bottom edge (warm, salty water overlies cold fresh water) and the left edge (cold, fresh water abuts warm, salty water), which are prone to the diffusive layers effect, salt fingers effect and thermohaline intrusions, respectively [13,14,18].
In order to investigate stratification situations across the whole meddy, Turner angle profiles are calculated at each CMP point using the high-resolution inverted temperature and salinity data, as shown in Figure 7b. The Turner angle indicates that almost all of the area above the meddy or below the core of the meddy (salinity maximum) is subject to salt fingering, while the upper half of the meddy is subjected to diffusive convection. Although a relatively large area is prone to salt fingering, highly organized and clear salt finger phenomena are only found near the lower interface according to the observations in [76]. Stratification is stable outside the meddy. At the left edge of the meddy, interleaving signatures of diffusive convection and salt fingers imply the presence of alternating layers of cold/fresher and warm/salty water. It should be noticed that there are some small snippets around 2000 m depth showing gravitational instabilities, which are potentially caused by the extremely high uncertainties of inverted temperature and salinity (see Figure 5 in [37]). In the following sections, we present the hydrographic and seismic observations of diffusive layers, salt fingers and lateral thermohaline intrusions and estimate their associated heat fluxes.

4.2.1. Diffusive Layers and Salt Fingers

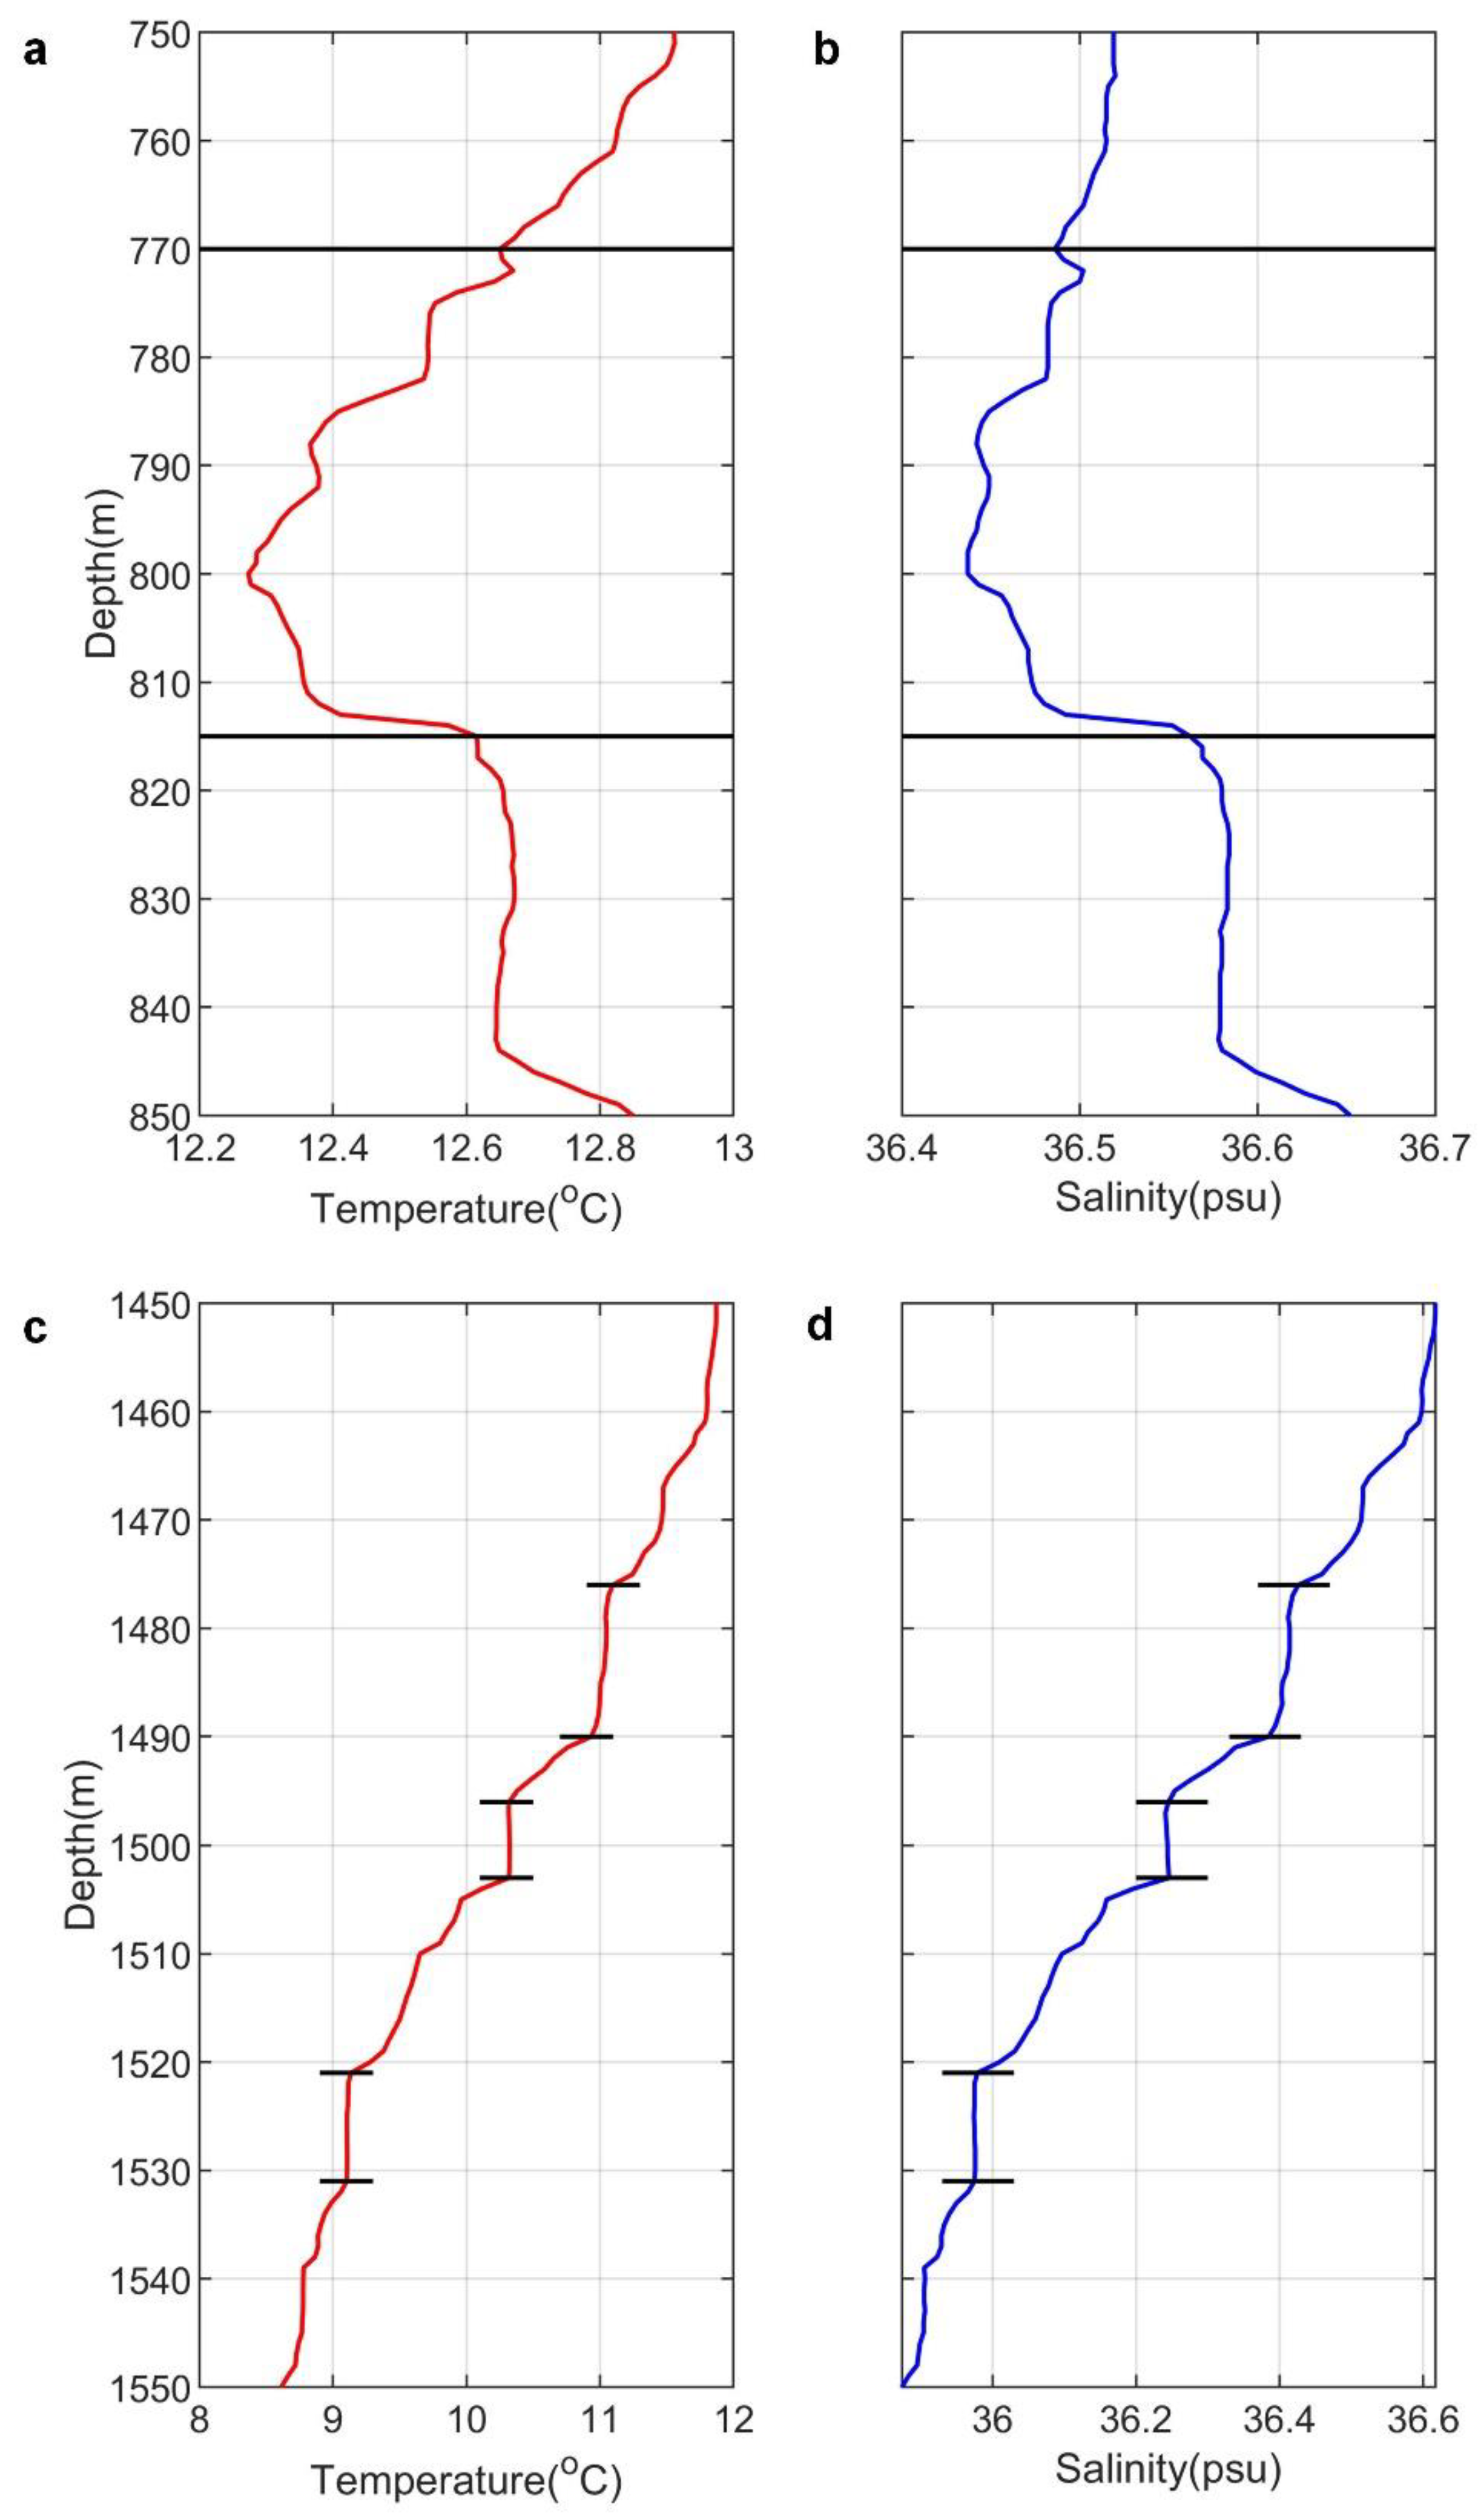
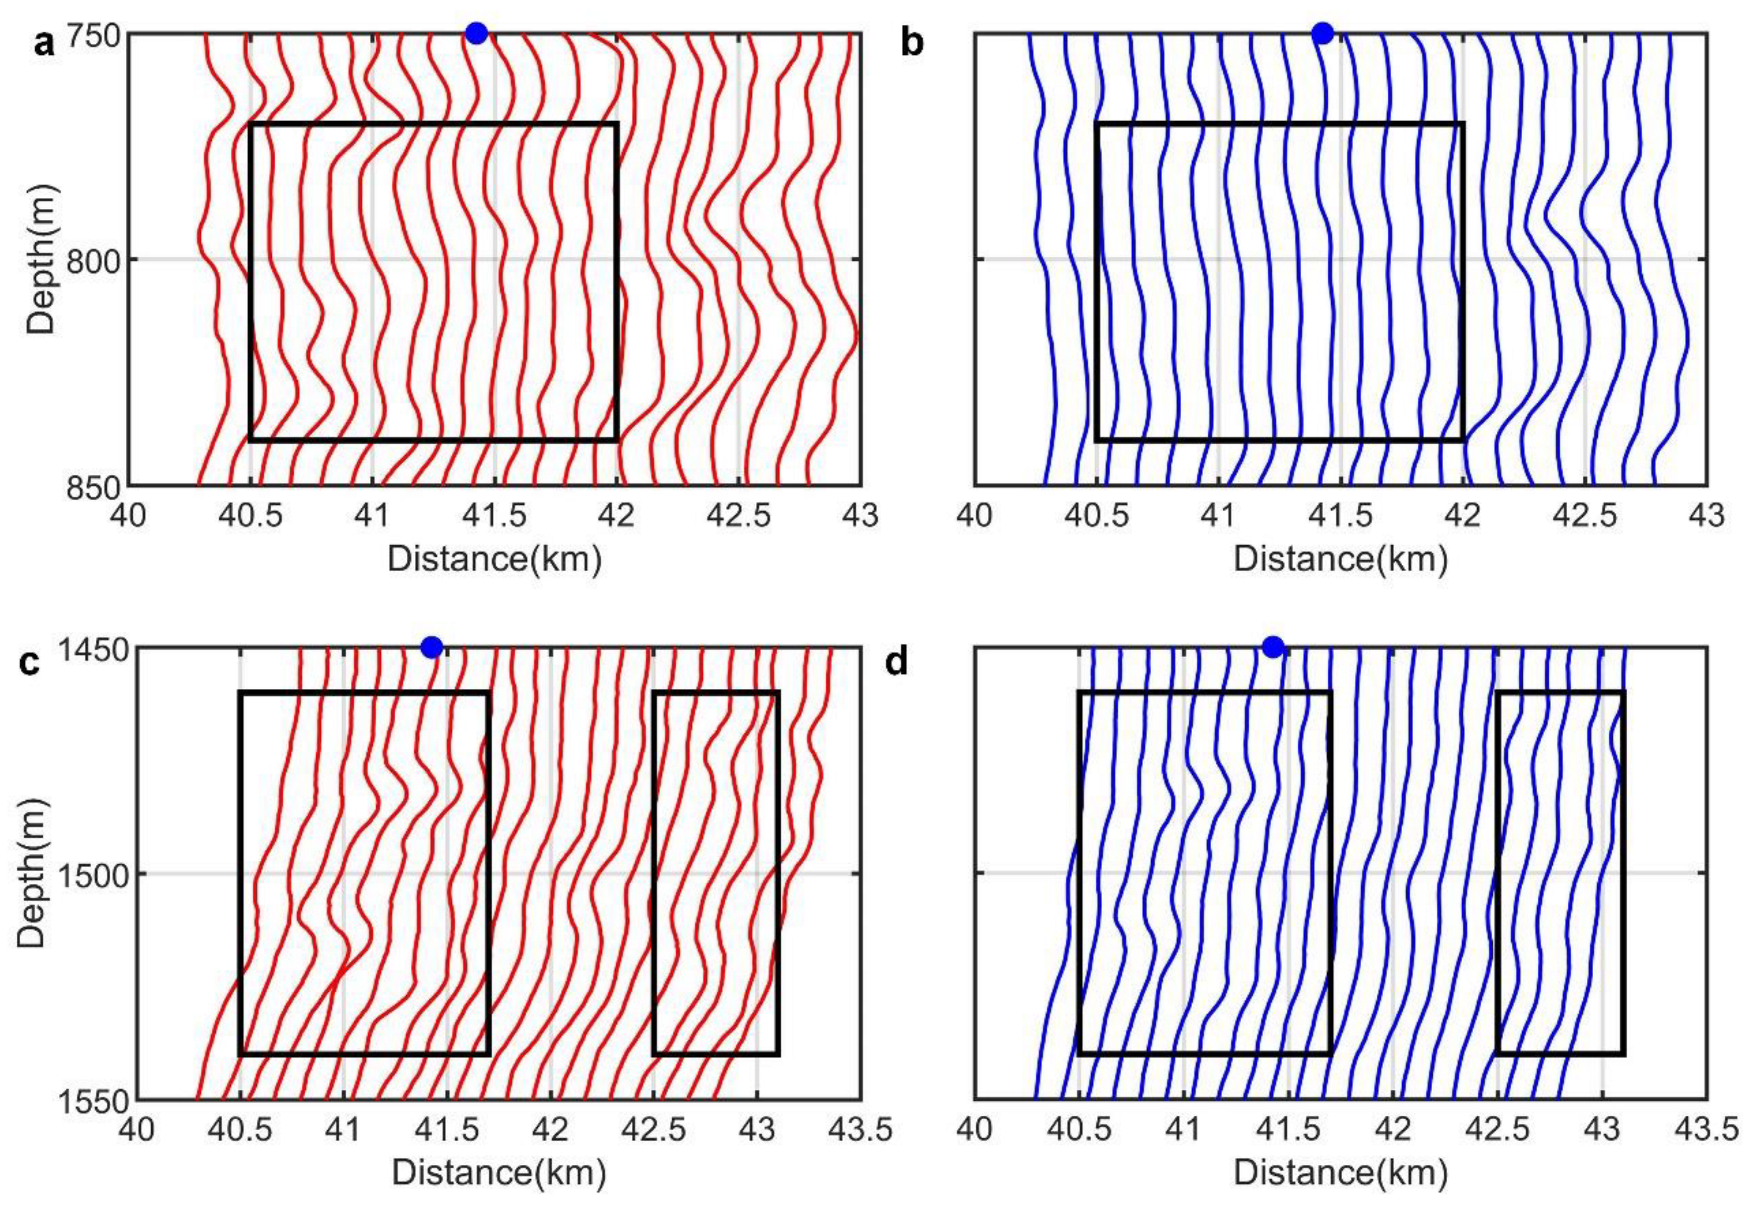
Since CTD 37 is located at the horizontal center of the meddy, and a clear structure of diffusive convection at the meddy top boundary, stable stratification in the meddy core and salt fingers at the meddy base can be observed; thus, the profile of CTD 37 is further analyzed to investigate diffusive layers and salt fingers effects, rather than that of CTD 36, which is closer to the left edge of the meddy and might be affected by thermohaline intrusions. Identified by the signs of well-mixed layers separated by sharp interfaces with high gradients in both temperature and salinity [8], clear staircase structures are observed at both the top and bottom edges of this meddy (Figure 8). It should be noted that the average step height of the salt finger staircases is around 10 m, which is the same as the observations in [77] in the Mediterranean outflow. Those layers are also presented in individual profiles of inverted temperature and salinity, as shown in Figure 9. However, the tendencies of staircases in inverted profiles are weaker compared to those in CTD cast 37, although the CTD and the acoustic survey actually imaged the same phenomenon. This is potentially due to the acquisition mechanism of seismic data. Sharp staircases are blurred and become ringy after convolved with source wavelets and cannot be fully recovered even after deconvolution.
Based on the presence of staircases in both hydrographic and seismic inverted profiles and the local Turner angle, we assumed that the elevated turbulent dissipation rates were mainly due to double-diffusive convection. Using Equation (11), we have K T t o p = 2.32 × 10 5   m 2 s 1 . The averaged vertical temperature gradient in this region T z t o p is 2.2 × 10 3   ° C m 1 . Substituting K T t o p and T z t o p into Equation (10), we have F t o p = 0.20   W m 2 , associated with diffusive layers.
Then, we analyzed the salt fingers phenomenon conveying heat vertically downwards at the bottom edge of meddy. We obtain R ρ = 1.4 from the local Turner angle following Equation (15). Here, we take γ = 0.7 following [71]. Thus, the diffusivity of salt fingering is K T b o t = 1.25 × 10 5   m 2 s 1 using Equation (13). The vertical gradient of temperature at the bottom edge area is given by T z b o t = 1.8 × 10 2   ° C m 1 . The average heat flux at the bottom area is given by Equation (12); thus, we have the heat flux F b o t of 0.89   W m 2 , associated with salt fingers.

4.2.2. Thermohaline Intrusions

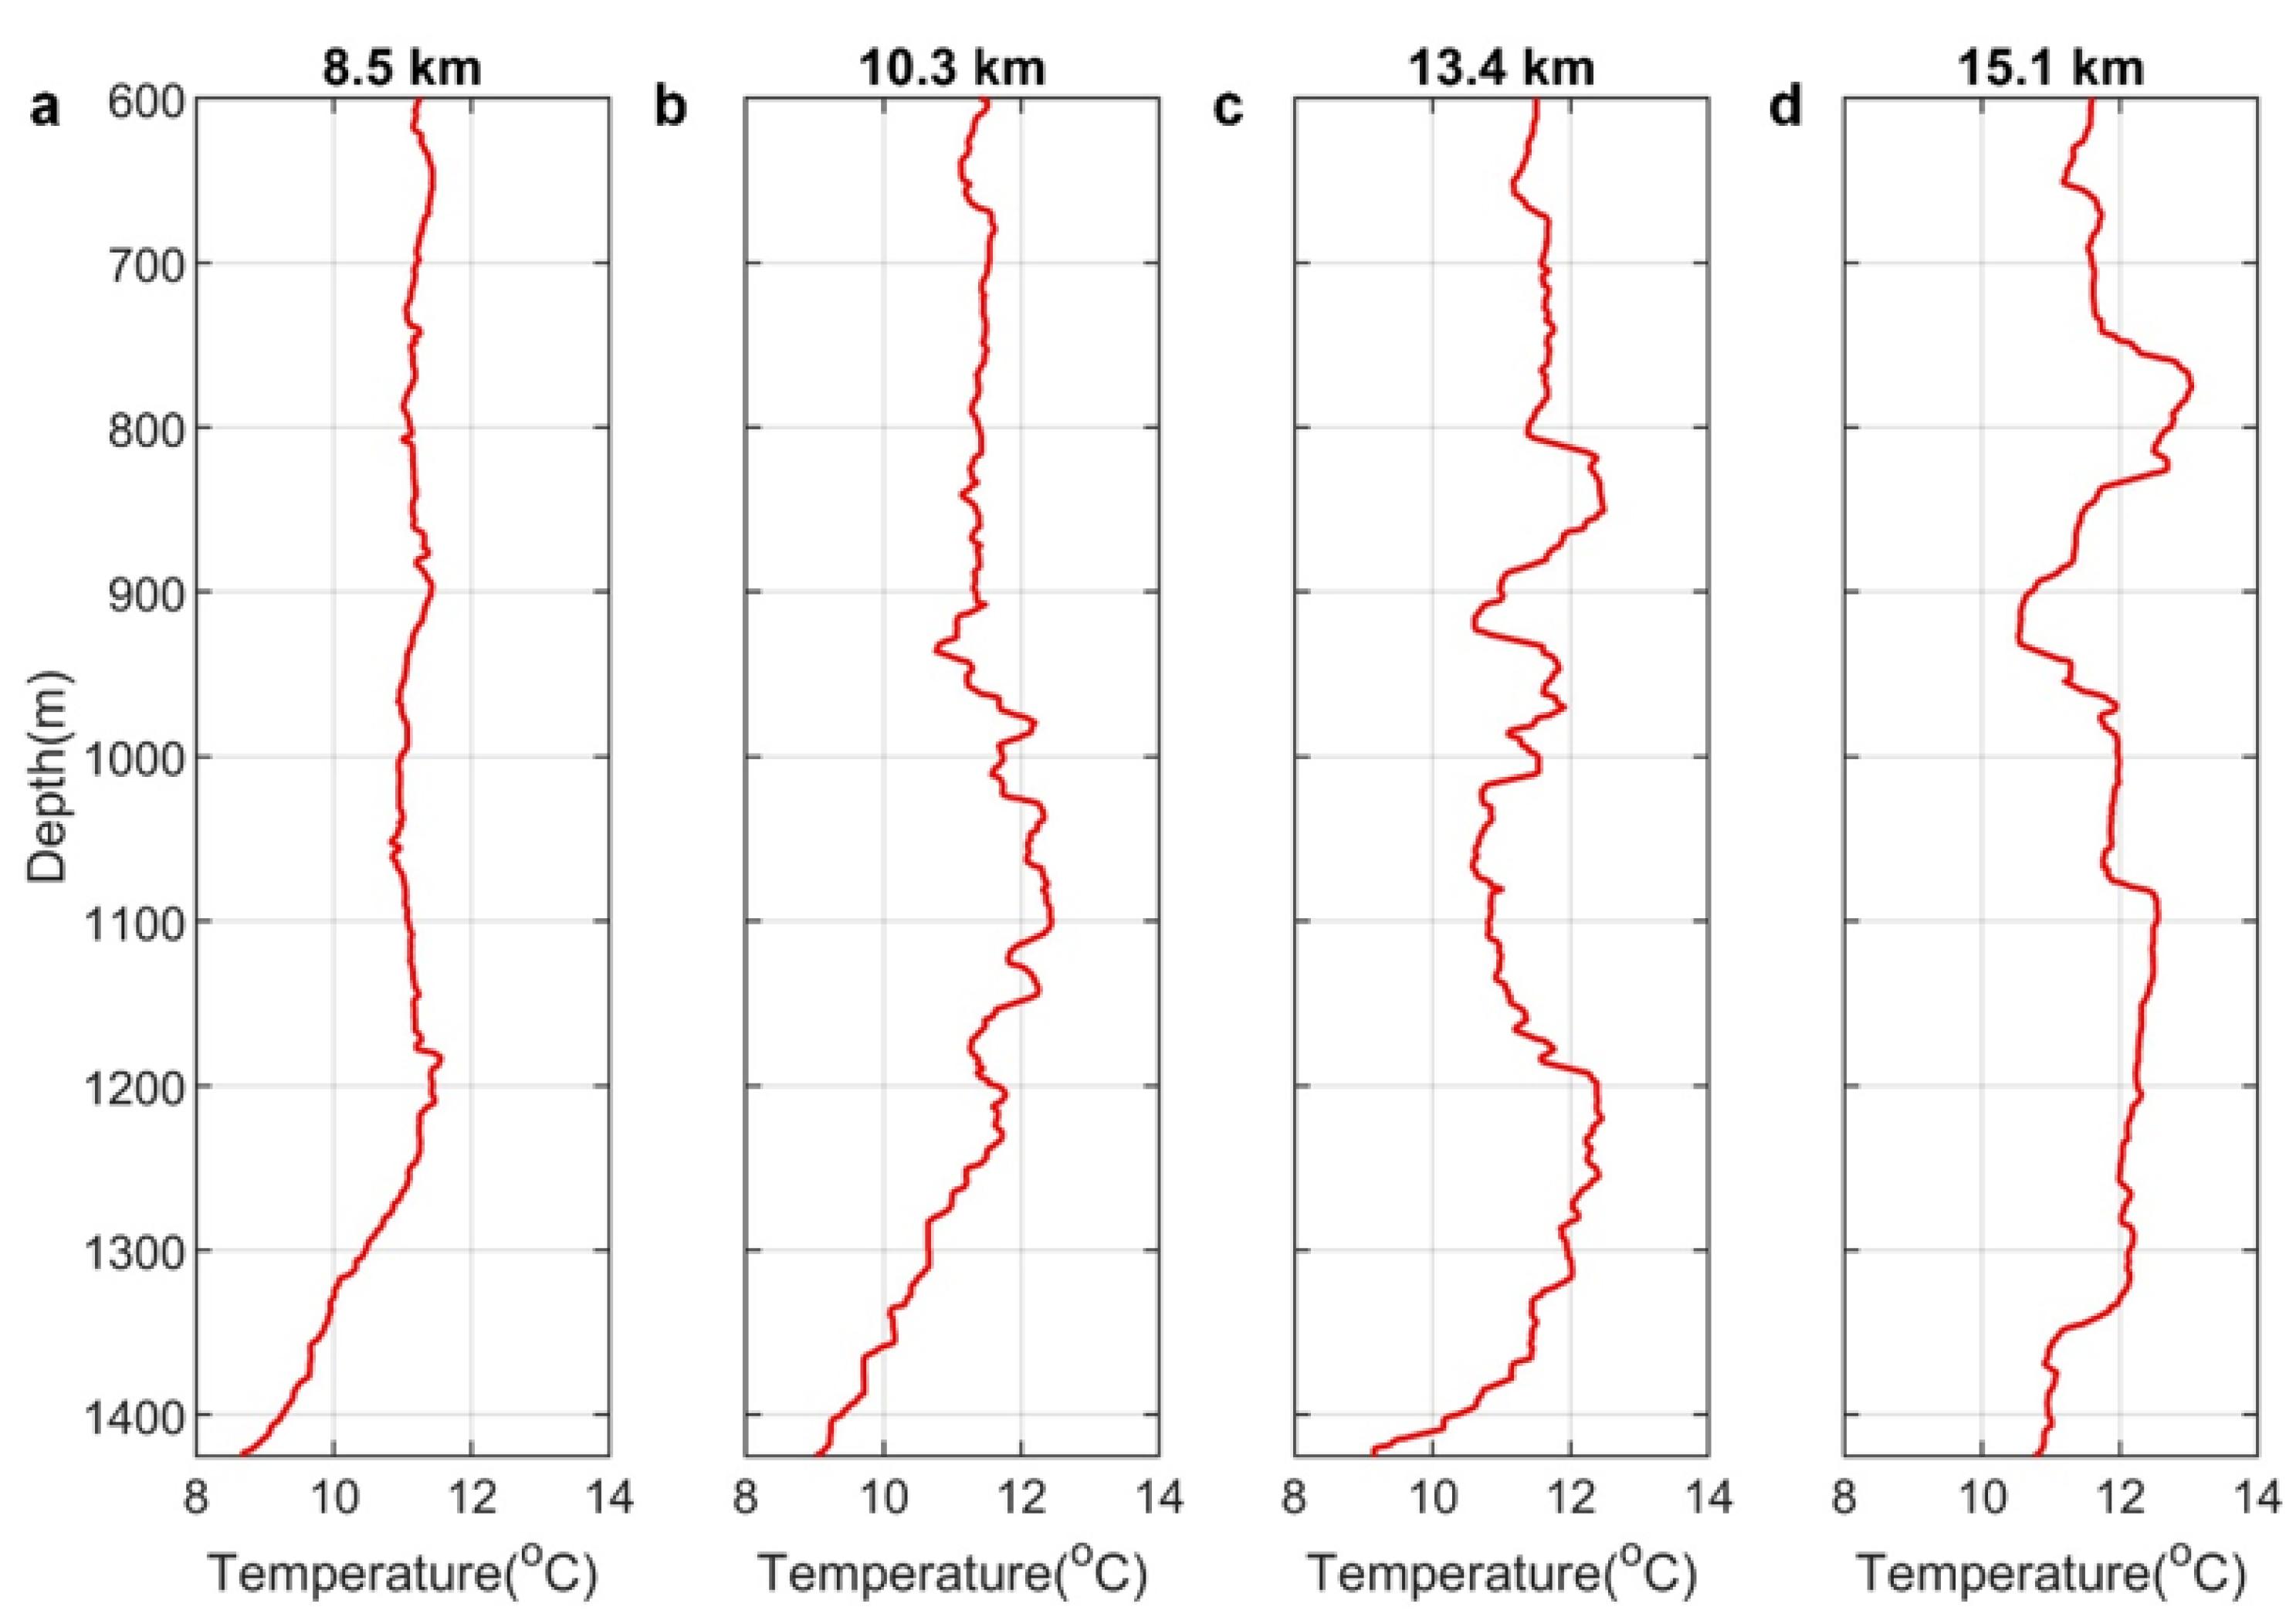
In order to identify the thermohaline intrusion phenomena and corresponding locations, we firstly analyzed four XBTs near the left edge of the meddy (Figure 10). The right edge of the meddy is not completely shown in Figure 2a due to the ending of the seismic survey; thus, we only focus on the left edge here. At 8.5 km (Figure 10a) (left to frontal area), the temperature is relatively smooth along the depth. However, some signs of intrusion can be observed around 900 m and 1200 m, where alternating layers of cold and warm waters are observed, with a scale of 20 m. The XBT 7 at 10.3 km and XBT 8 at 13.4 km are inside the frontal area. A layered structure of ~50 m is found in the temperature profiles of these two XBTs from 900 m to 1200 m. When the distance increases to 15.1 km, fewer layered structures of less than 50 m are shown in Figure 10d, indicating the end of this frontal area. Overall, the intrusion scale from the XBT measurement is from 20 m to 50 m, which agrees with the range of 10–50 m suggested by Ruddick and Hebert [15].
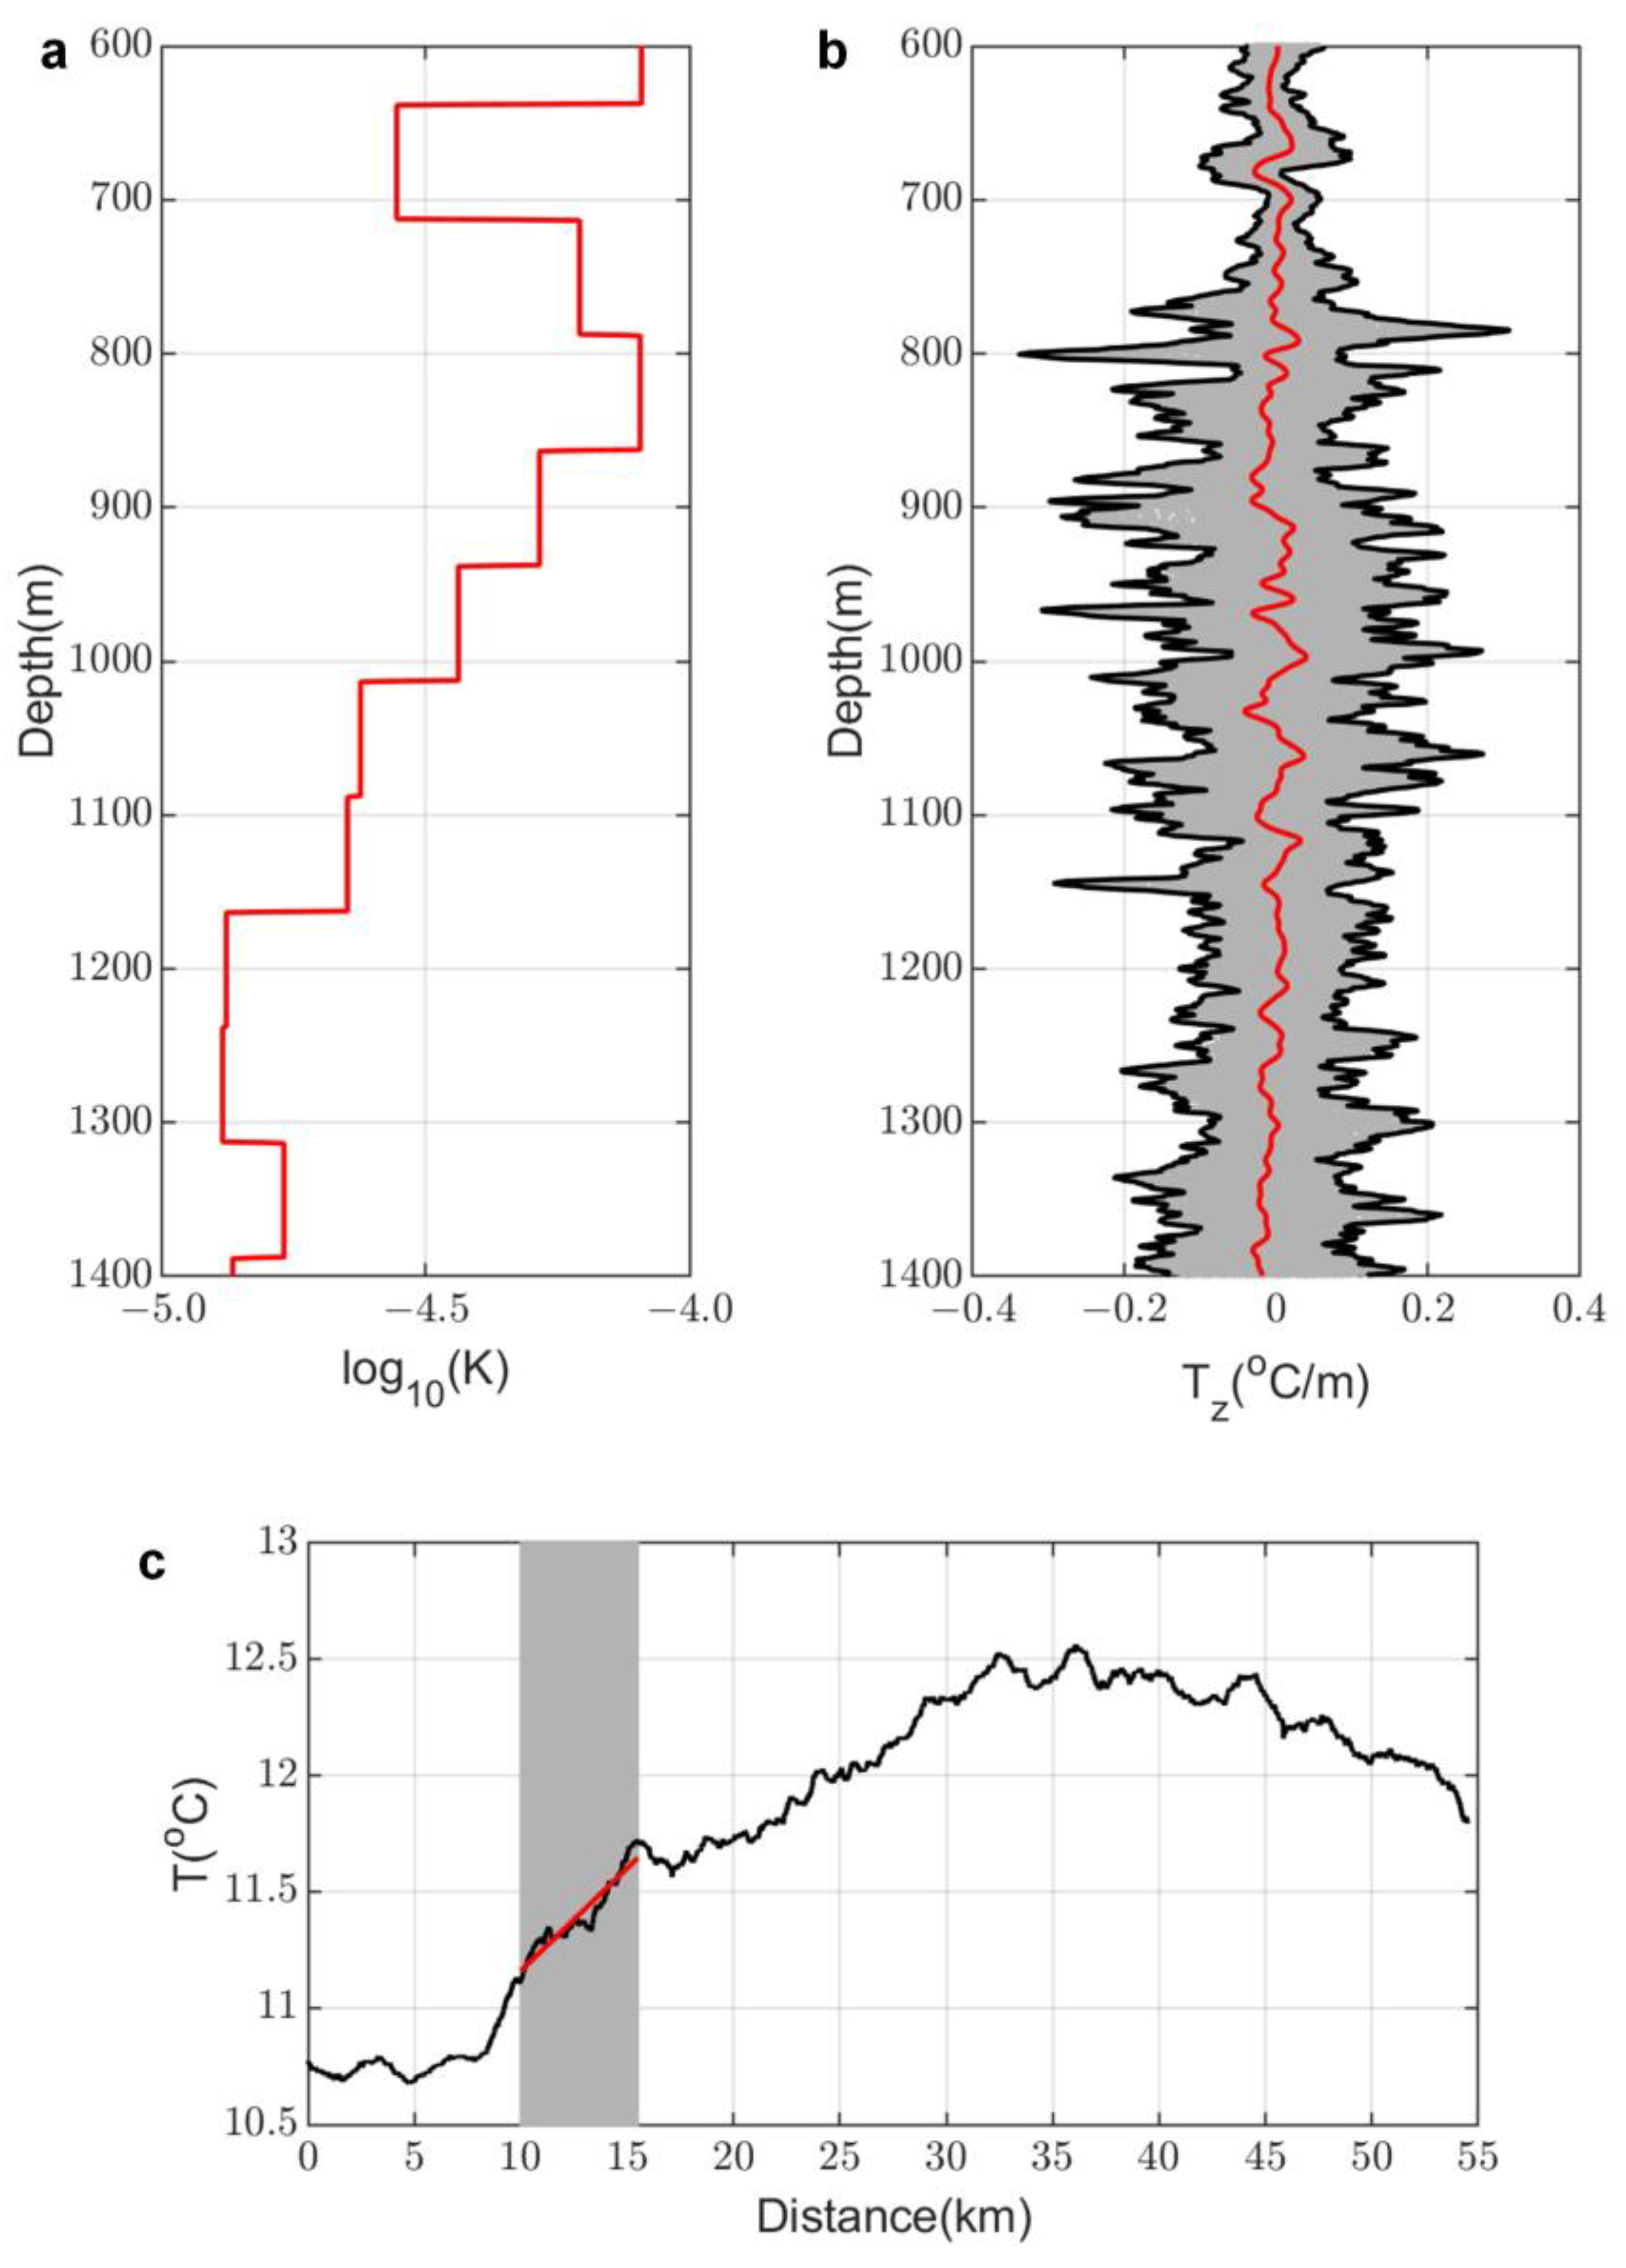
Although the hydrographic data indicate the phenomena of thermohaline intrusions, there are only two XBTs in the frontal area (around 10 km and 15 km). The low lateral resolution of hydrographic data prevents us from precisely identifying the frontal area and further estimating of the lateral heat flux. Thanks to the inverted TS sections, alternating layers of cold/fresher water and warm/salty water indicate the presence of lateral intrusions on a much higher horizontal resolution (Figure 11). The intrusion area is bound by the region 10 km to 15.5 km horizontally and 600 m to 1400 m vertically, enabling us to compute the lateral heat flux.
The diffusivity K T D s i d e s and vertical temperature gradients in the frontal region are shown in Figure 12a,b. We averaged the temperature vertically (between 600 m and 1400 m) inside the intrusion area (Figure 12c). The temperature levels off at around 10.7   ° C between 0 km and 9 km, representing the temperature of Atlantic water outside the eddy. Then, the temperature steadily increases to 12.5   ° C at 30 km. Finally, the temperature remains stable at 12.5   ° C from 30 km to 40 km, corresponding to the relatively warm Mediterranean water in the meddy core. By fitting a straight line to the temperature profile in the intrusion area (Figure 12c), we find that the temperature derivate along the frontal area is T x = 8.8 × 10 5   ° C m 1 . K T l s i d e s is estimated to be 0.96   m 2 s 1 using Equation (16).
Then, we analyzed the uncertainty associated with the lateral diffusivity, which is determined by the diapycnal diffusivity, K, the lateral temperature gradient, T x , and the vertical temperature gradient, T z . Derived from turbulent dissipation rates estimated from seismic data, diffusivities log 10 K used here are accurate within two logarithmic units. Note that diffusivities derived from seismic data have a similar uncertainty level to those from microstructure observations, since measured ε and χ from microstructure profilers have uncertainties of 2–3 logarithmic units [78]. Since the diapycnal diffusivity, K, makes a much bigger contribution to the uncertainties than T x and T z , we only focus on the effect of T x and T z uncertainties on the lateral heat diffusivity estimates.
Since the T x is affected by the definition of the frontal area, we modify the length and position of the frontal area within the range between 10 km and 15.5 km in order to quantify their effects on T x , as shown in Table 1. Meanwhile, we also investigated the effect of the differential depth step of Tz on lateral diffusivities, as shown in Table 2.
From Table 2, the lateral heat flux range, accounting for uncertainties in temperature gradients, is 0.95 to 1.79   m 2 s 1 , and the average diffusivity 1.35   m 2 s 1 is used for meddy lifetime estimation. The heat flux associated with lateral intrusions is 468.82   W m 2 using Equation (17).

4.3. Eddy Lifetime

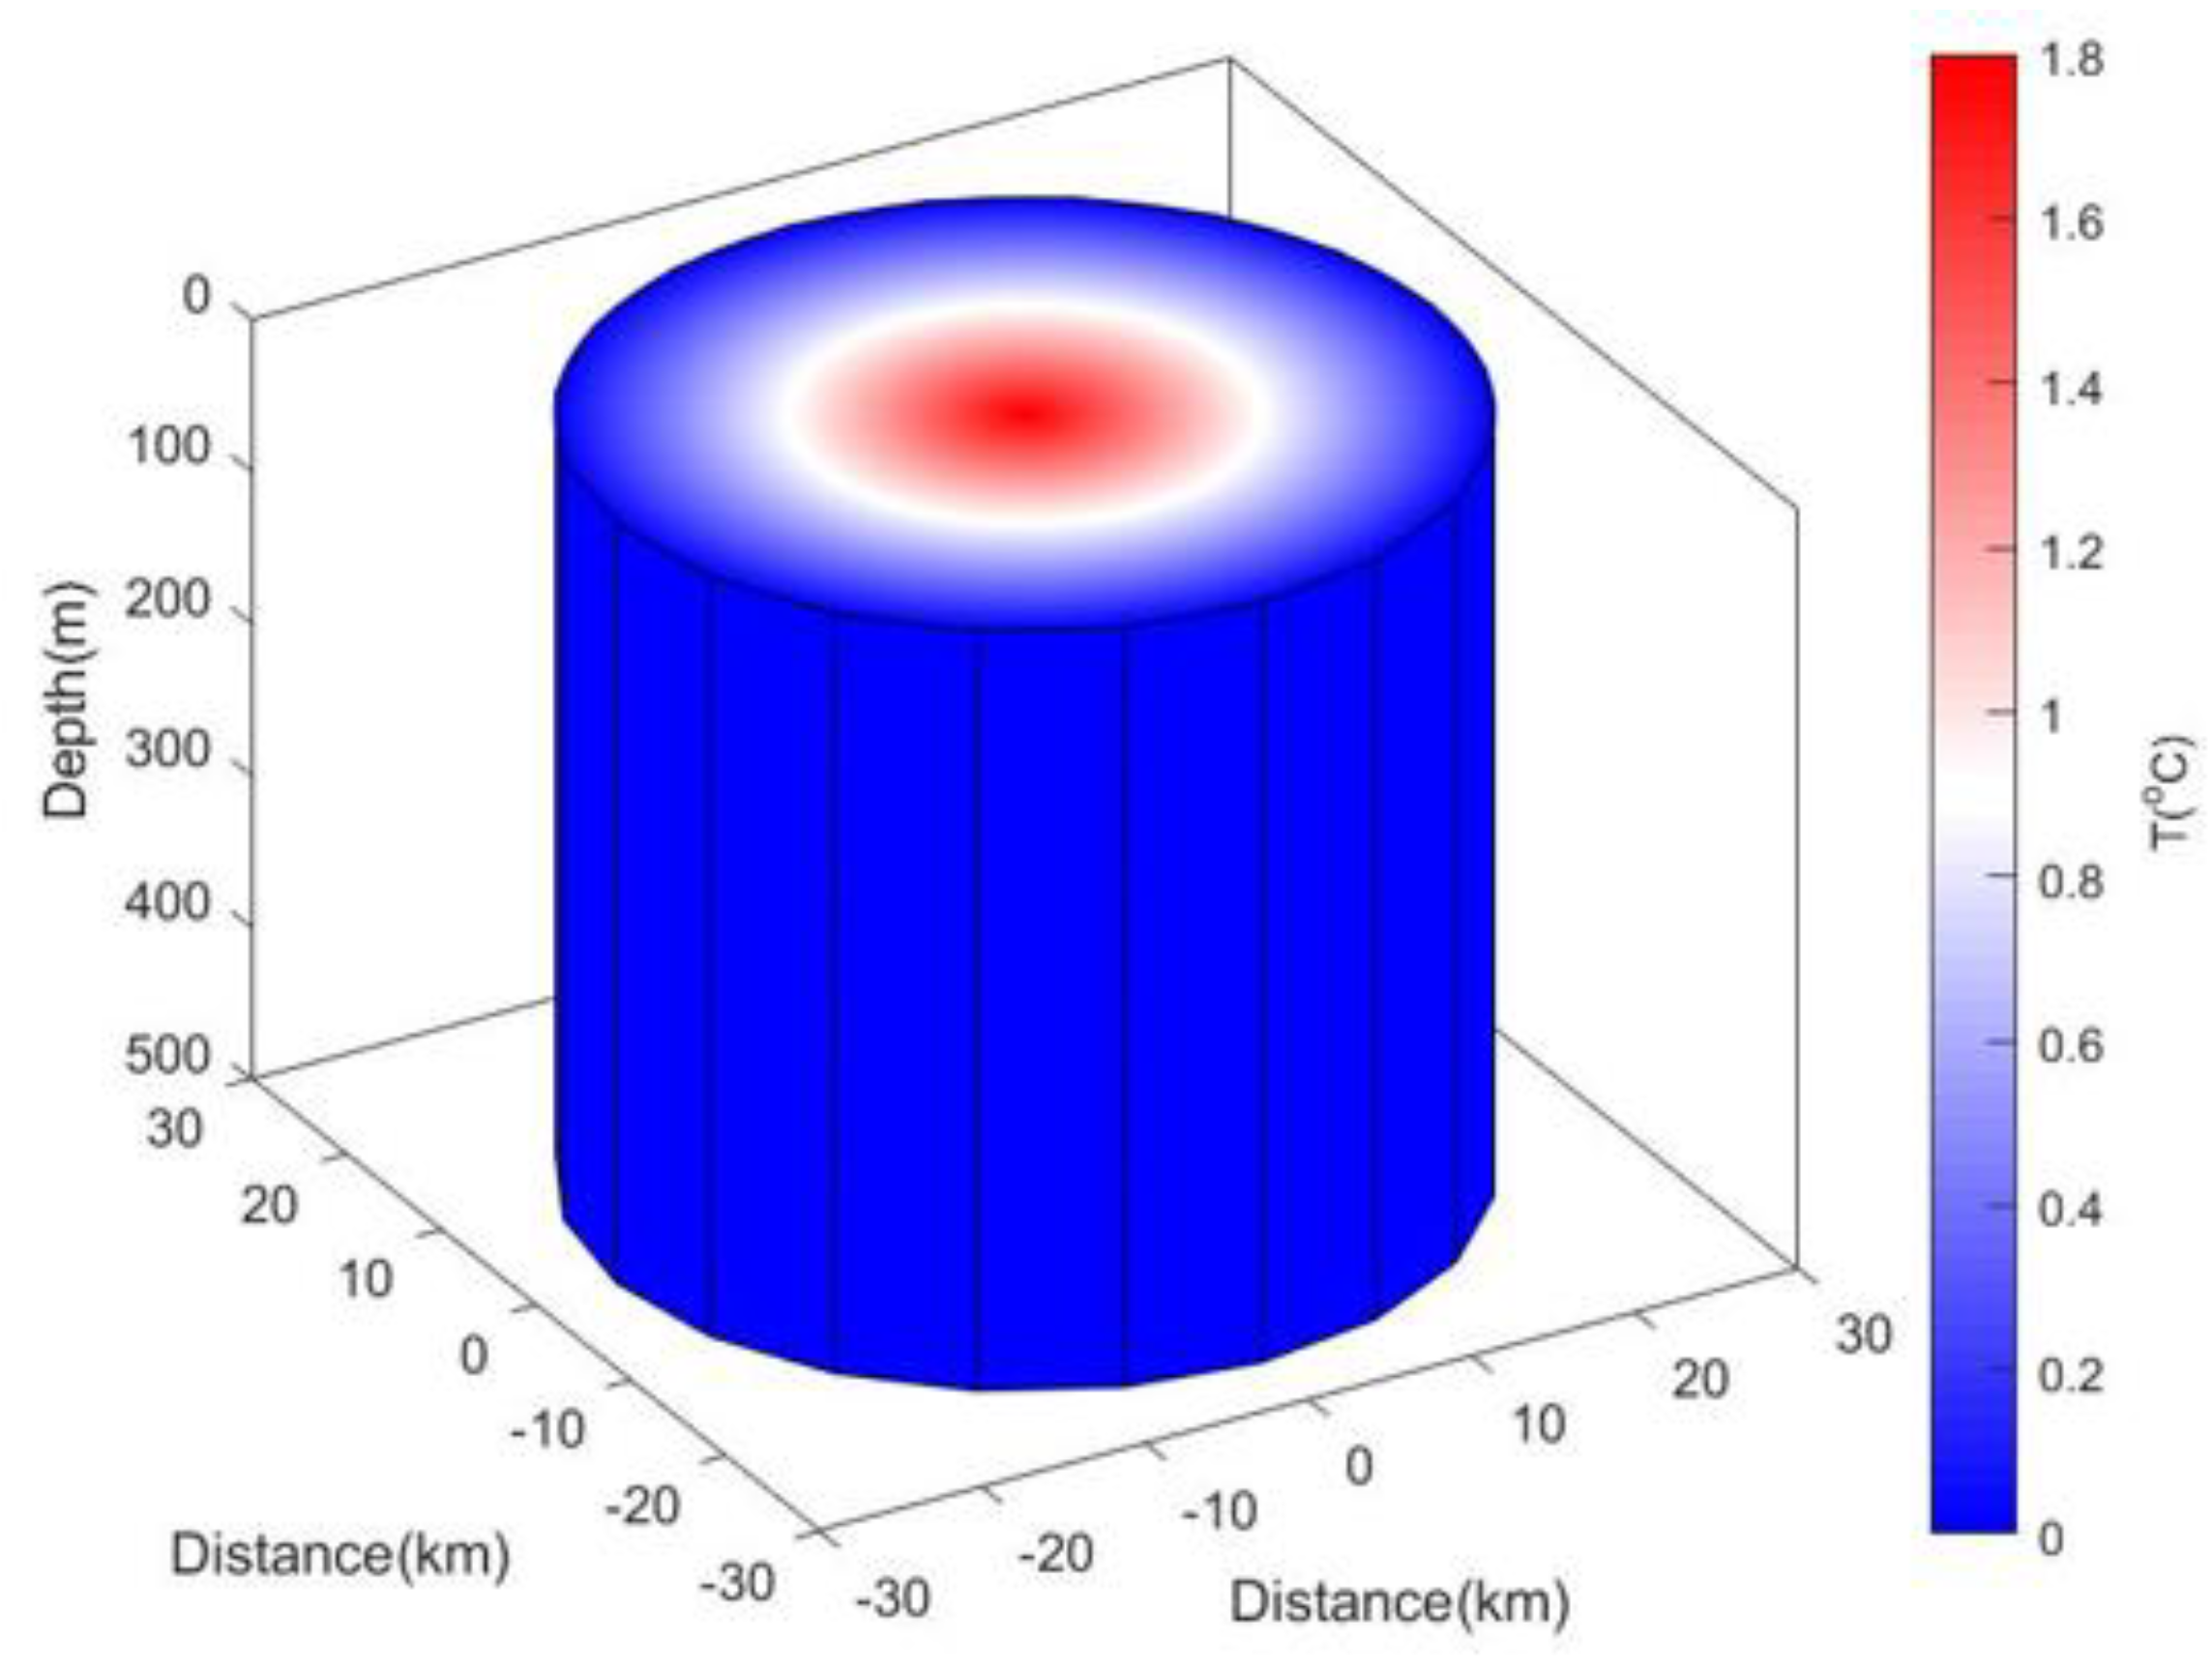
We modeled the meddy here as a cylinder with a height h of 500 m and a radius r of 25 km (Figure 13).
The total heat content anomaly is given by the integral of all the heat inside the cylinder:
H = ρ C p D Δ T ( x , y , z ) d x d y d z
where Δ T is the temperature anomaly inside the meddy, given by
Δ T ( x , y , z ) = T a ( 1 x 2 + y 2 r )
where T a = 1.8   ° C is the maximum temperature anomaly between the meddy core ( 12.5   ° C ) and surrounding Atlantic water ( 10.7   ° C ), and r = 25 km is the radius of this meddy. In order to simplify the question, we assume that the temperature anomaly is independent of depth and linearly decreases with the distance to the center, reaching zero at the edge of the meddy (max distance). Finally, the total heat anomaly content of this meddy is H = 2.32 × 10 18   J .
The area heat flux power P is given by the multiplication of heat flux F and the area S,
P = F S
and the corresponding decay time is given by
t = H P
After substituting fluxes and areas of top, bottom and left edges of this meddy, the decay time due to each process is shown in Table 3. We found the total heat transport out of the meddy due to each process: (1) diffusive layers at the top of the meddy transport 0.4 GW, (2) salt fingers at the bottom of the meddy transport 1.75 GW, and (3) lateral thermohaline intrusions at the meddy flanks transport 36.82 GW. Assuming that the transport remains constant in the future, the meddy presented here has a decay time of around 2 years, primarily due to the heat loss associated with thermohaline intrusions.

5. Discussion

5.1. Turbulent Dissipation Rates and Heat Fluxes

Firstly, we showed that the internal wave subranges of horizontal seismic displacement slope spectra can be used to estimate the turbulent dissipation around the meddy and its spatial variability. Dissipation estimates reveal that the boundaries of the meddy have a dissipation rate of 10 10 10 9   W / kg , while the core of the meddy has a dissipation rate of 10 11 10 10   W / kg . This spatial pattern of dissipation agrees with previous studies of interior eddies [7,73,74,75]. The suppressed dissipation within the meddy core is linked to the weak stratification, while the elevated ε at the top and bottom edges of the meddy is likely due to the enhanced mixing by double-diffusive instability phenomena, or the breaking of internal waves. Uncertainties for dissipation estimates have been carefully computed, and the mean final uncertainty of seismic log 10 ( ε ) is 0.6 logarithmic units, similar to the mean uncertainty ( 0.5 ± 0.2 logarithmic units) found in [30]. Finally, we compared for the first time turbulent dissipation rates estimated from internal wave regimes in seismic horizontal slope spectra with concurrent CTD/LADCP data along with their uncertainties. Dissipation rates from these two methods overall show good consistency within the 95% CI; however, some discrepancy was apparent within the lower dissipation meddy core, perhaps due to a lower signal-noise-ratio, a lack of seismic reflectors or the limited vertical resolution of CTD/LADCP estimates.
Although several studies have exploited seismic data to compute turbulence dissipation rates, only few have ground-truthed the method through comparison with dissipation rates estimated from in-situ hydrographic data. Holbrook et al. [33] showed that diapycnal diffusivities derived from turbulence subranges of horizontal slope spectra matched well with those from three coincident in-situ XCPs offshore Nicaragua. In the Gulf of Mexico, Dickinson et al. [30] found the mean diapycnal diffusivity value calculated from seismic survey closely agreed with that from legacy CTD data. However, those CTDs were deployed 8 years later near the seismic line, and the seismically derived diapycnal diffusivities are not spatially compared with values from CTD data at each single CTD deployment location. This work represents the first verification that the turbulent dissipation estimated from the internal wave subrange of seismic horizontal spectra match those of in-situ, concurrent hydrographic data. Thus, it is implied that, in general, seismic data could be a good substitute to estimate the spatial distribution of turbulence features, with the benefit of increased spatial resolution. Dissipation estimates from the turbulent spectral regimes were limited due to noise and thus could not be validated, although this ideally side-steps assumptions of fine-scale parameterizations: future work may apply the noise attenuation algorithm suggested by [55].
Mixing processes around a meddy are described and analyzed in this study. The diffusive layers, salt finger mixing and thermohaline intrusions are observed in the high-resolution inverted temperature salinity sections. Heat fluxes associated with different mechanisms are estimated, and we found the total heat losses due to lateral thermohaline intrusions are over an order of magnitude greater than those associated with diffusive convection or salt fingers. Lateral thermohaline intrusions are the primary reason for the decay of the meddy, and this result agrees with the previous results [18,79]—see Table 3.
Our results suggest that the lateral heat diffusivity of the observed meddy is between 0.95   to 1.79   m 2 s 1 . This lateral heat diffusivity agrees with the finding of [18], who reported a lateral heat flux of 1   to 5   m 2 s 1 estimated using the Joyce equation [72] with the diffusivities measured from field microstructure profilers. Moreover, our results also match well with those of [79] on meddies, who simulated lateral intrusions driven by double-diffusive mixing and found a lateral diffusivity of 1.6   m 2 s 1 . Notice that the simulated meddy (with radius of 30 km and height of 400m) has a similar size to the meddy presented in this work (radius of 25 km and 500 m), enabling us to compare the simulation results with our results from field observations directly and faithfully.
Joyce’s model [72] has been applied widely to deduce lateral frontal flux. However, a constant value of thermal diffusivity is normally assumed to be 10 4   m 2 s 1 [21] due to the lack of field microstructure observations. For example, Ruddick and Hebert [15] firstly estimated the K T = 1 × 10 4   m 2 s 1 by assuming an advection diffusion heat balance and then applied the Joyce’s model and found a salt lateral diffusivity of O (1 m). After assuming K T ~ 10 4   m 2 s 1 , Hebert et al. [17] deduced the lateral diffusivity of 1 2   m 2 s 1 , or 2 4   m 2 s 1 depending on the estimate bulk using Joyce’s model. Similar to [18], the work presented here provides a more precise lateral heat flux by using diffusivities derived from the field seismic data, rather than from assumptions or approximations. Finally, this lateral heat flux range is proven to be robust by varying parameters used in Joyce’s model. We deduce the eddy’s demise time through estimated heat fluxes from diffusive convection at the meddy top, salt fingering at the meddy bottom and lateral intrusions at the frontal area (the left edge of meddy). The decay of the meddy is found to be dominated by the heat loss from lateral mixing, and the corresponding demise time is 2 years on average from the seismic acquisition time. These findings agree with previous research on the meddy Sharon [13,18]. Similarly, anticyclonic eddies in the Arctic Ocean have lifetimes of around 1 year as the result of decay through thermohaline intrusions [8,80]. Hebert [16] estimated the vertical salt loss by salt fingering and computed the salinity decay time scale of 20 years, which is comparable to 40 years in this paper.

5.2. The Feasibility of Seismic Oceanography on Investigating the Meddy Oceanography

For the first time, dynamics and heat fluxes of one meddy are systematically and quantitatively analyzed using the inverted temperature–salinity section from seismic oceanography data. The lateral heat flux and corresponding meddy decay time match well with previous observational and numerical results. The success of using SO data to image and also quantify the meddy characteristics can be explained by the intrinsic advantages of SO data from three aspects.
Firstly, the high resolutions and full depth coverage of SO enable us to identify processes around the meddy from the mesoscale to fine scale. For example, the horizontal scale of the frontal area can be estimated from the whole temperature-salinity section, and then thermohaline intrusions (i.e., vertical scale of 20 to 50 m) are also observed in single inverted profiles with lateral spacing of around 6 m (i.e., CMP spacing). Secondly, the spatial distribution of diffusivities can be faithfully estimated from the seismic data [29,30,33], laying the foundation for the analysis of fine-scale processes around the meddy and enabling us to link local diffusivities with corresponding phenomena. The diffusivity estimated from seismic slope spectra has an uncertainty of around 2 logarithmic units, similar to the uncertainty of 2–3 in measured diffusivity using micro-profilers. Therefore, the seismic method is a suitable substitute for a microstructure profiler. Finally, vertical derivatives of temperature and salinity are derived from the inverted profiles at high resolutions: temperature gradients are actually “directly measured” by acoustic surveys at each CMP location since the seismic reflectivity is mostly associated with fluctuations in temperature [23]. Therefore, the vertical and lateral temperature/salinity gradients, which are essential for quantifying the heat flux, can be estimated from SO data with confidence.
This study is the first to utilize and combine two well-developed SO techniques, temperature and salinity inversion and extracting diffusivity from seismic sections, revealing the potential of SO for observing and quantifying the detailed physical phenomena around a meddy, linking meso-scale dynamics through to fine-structure and small-scale mixing. It would be interesting to apply these techniques to other interior submesoscale processes in the global oceans such as the Southern Ocean. In the future, the micro-profilers can be deployed along a seismic cruise to calibrate the turbulent dissipation rate estimated from seismic data.

6. Conclusions

A meddy captured by the acoustic method was analyzed comprehensively, and its corresponding high-resolution temperature, salinity and turbulent dissipation fields were presented.
Seismic reflection undulations were spectrally analyzed to derive corresponding horizontal spectra of vertical displacements, whose internal wave regimes were found to match the Garrett–Munk model well. Then, the spatial distribution of turbulent dissipation rates around the meddy was estimated using fine parameterizations. Turbulent dissipation rates were found to be the lowest ( 10 11   W / k g ) within the core of the meddy, which reflects away internal wave energy. On the contrary, turbulent dissipation rates rise by more than one order of magnitude at the upper and lower edges of the meddy ( 10 10 10 9   W / k g ), potentially caused by mixing processes associated with double-diffusive convection. Turbulent dissipation rates were also estimated from strain and shear spectra using CTD/LADCP casts deployed on the GO cruise. Turbulent dissipation rates estimated from seismic data and coincident hydrographic observations agreed well within uncertainty ranges, and seismically derived dissipation rates using internal wave regimes were ground-truthed for the first time.
Double-diffusive effects around the meddy were investigated. Turner angles derived from inverted temperature and salinity sections indicated that the top edge of the meddy is prone to diffusive convection while the bottom edge of the meddy is dominated by salt fingering mixing. Staircase structures caused by double-diffusive convection were also observed at the top and bottom edges of the meddy. The interleaving of water masses, as the sign of thermohaline intrusions, was found at the sides of the meddy thanks to the high lateral resolutions of inverted temperature sections from the seismic data. Heat fluxes around the meddy due to different mixing processes were computed using seismic oceanographic data for the first time, and we found the heat flux due to lateral thermohaline intrusions to be 470   W m 2 , which is over two orders of magnitude greater than those associated with diffusive convection and salt fingers. The decay of this meddy is found to be dominated by the heat loss from lateral mixing, and the corresponding demise time is two years on average from the seismic acquisition time.

Author Contributions

Conceptualization, W.X.; Formal analysis, W.X.; Investigation, W.X.; Methodology, W.X.; Visualization, W.X. and Z.M.; Writing—original draft, W.X.; Writing—review and editing, W.X. and Z.M. All authors have read and agreed to the published version of the manuscript.

Funding

This research received no external funding.

Institutional Review Board Statement

Not applicable.

Informed Consent Statement

Not applicable.

Data Availability Statement

Not applicable.

Conflicts of Interest

The authors declare no conflict of interest.

Appendix A

Figure A1. The histogram of the slopes of best-fitting lines in the subrange of (a) internal wave and (b) turbulence.
Jmse 10 00720 g0a1
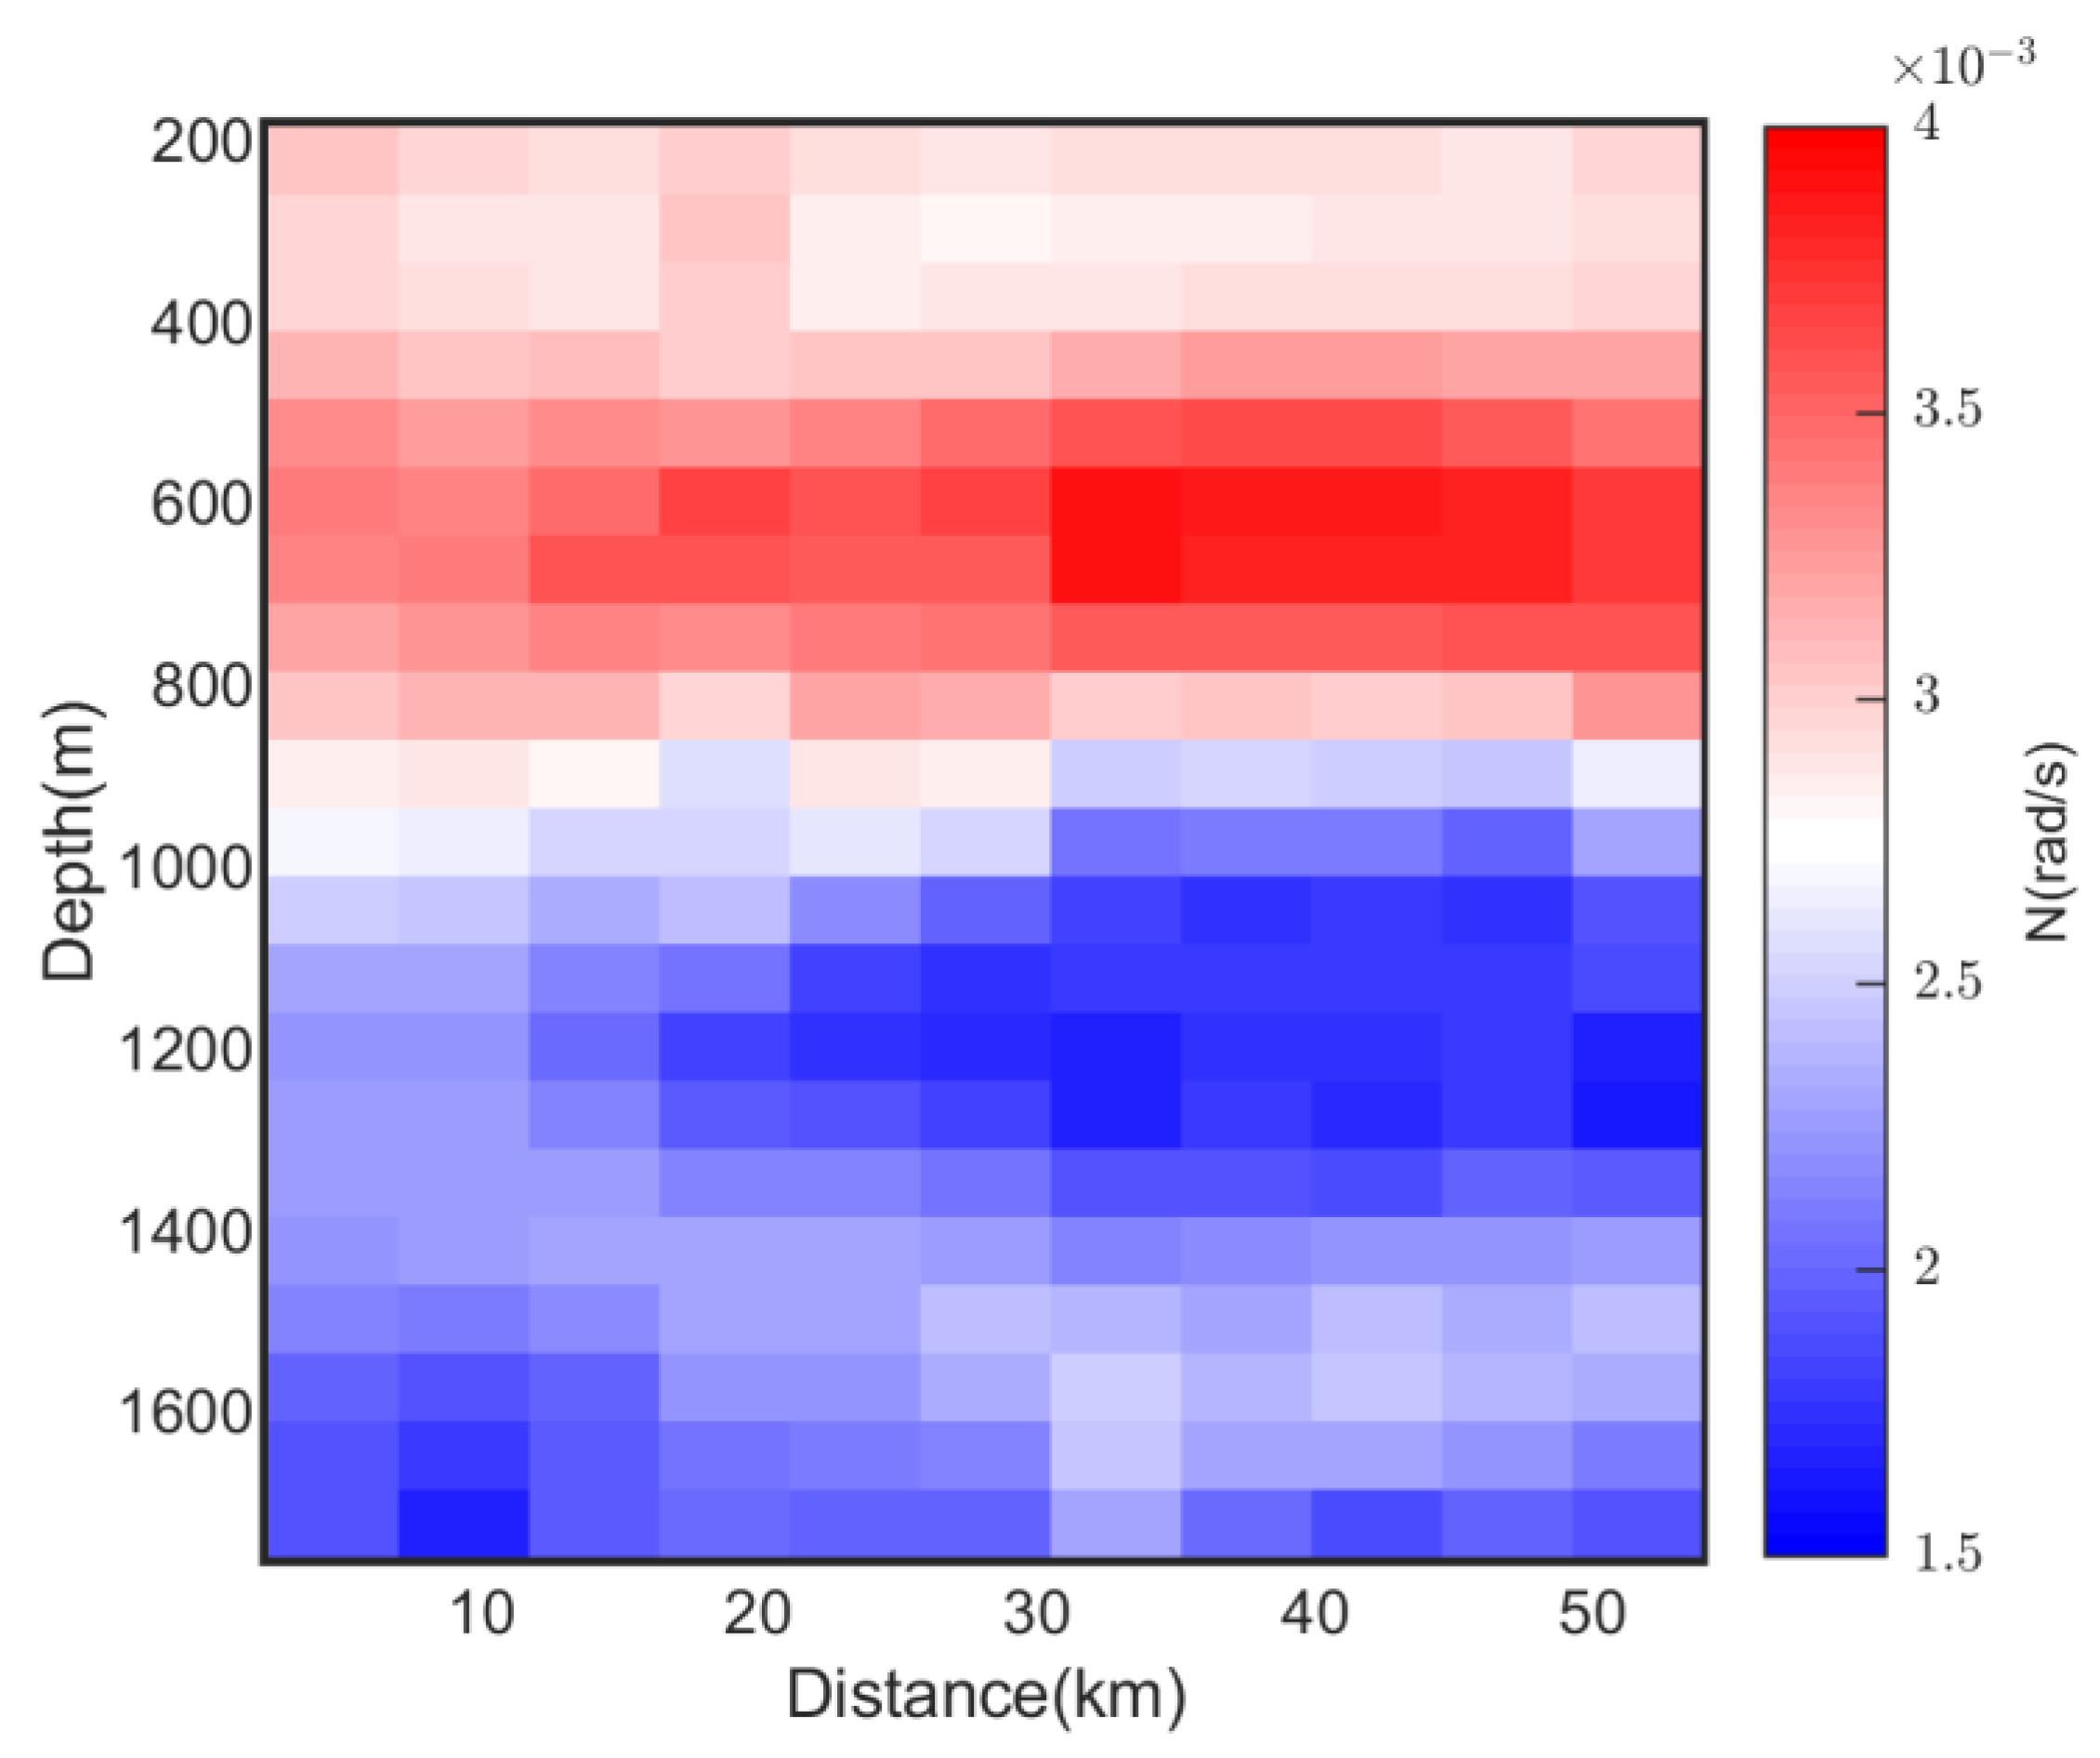
Figure A2. The smoothed buoyancy frequency section estimated from the high-resolution inverted temperature and salinity sections.
Jmse 10 00720 g0a2

Appendix B. Uncertainty Analysis of Seismic and Hydrographic Derived Dissipation Rates

Following Equation (8), the uncertainties (i.e., standard deviation) of the buoyancy frequency, shear-to-strain ratio and variance ratio are denoted as σ E a , σ R ω and σ N , respectively. The partial differential is given by Equations (A1)–(A3):
g N = log 10 ( e ) ( 1 f cosh 1 ( N / f ) ( N / f ) 2 1 + 2 N )
g R ω = log 10 ( e ) ( 1 R ω + 1 R ω + 1 1 2 ( R ω 1 ) )
g E a = 2 log 10 ( e ) 1 E a
Then, we estimated uncertainties of dissipation rates from seismic and hydrographic data.

Appendix B.1. Unceratinties in Turbulent Disspation Rates frm Seismic Data
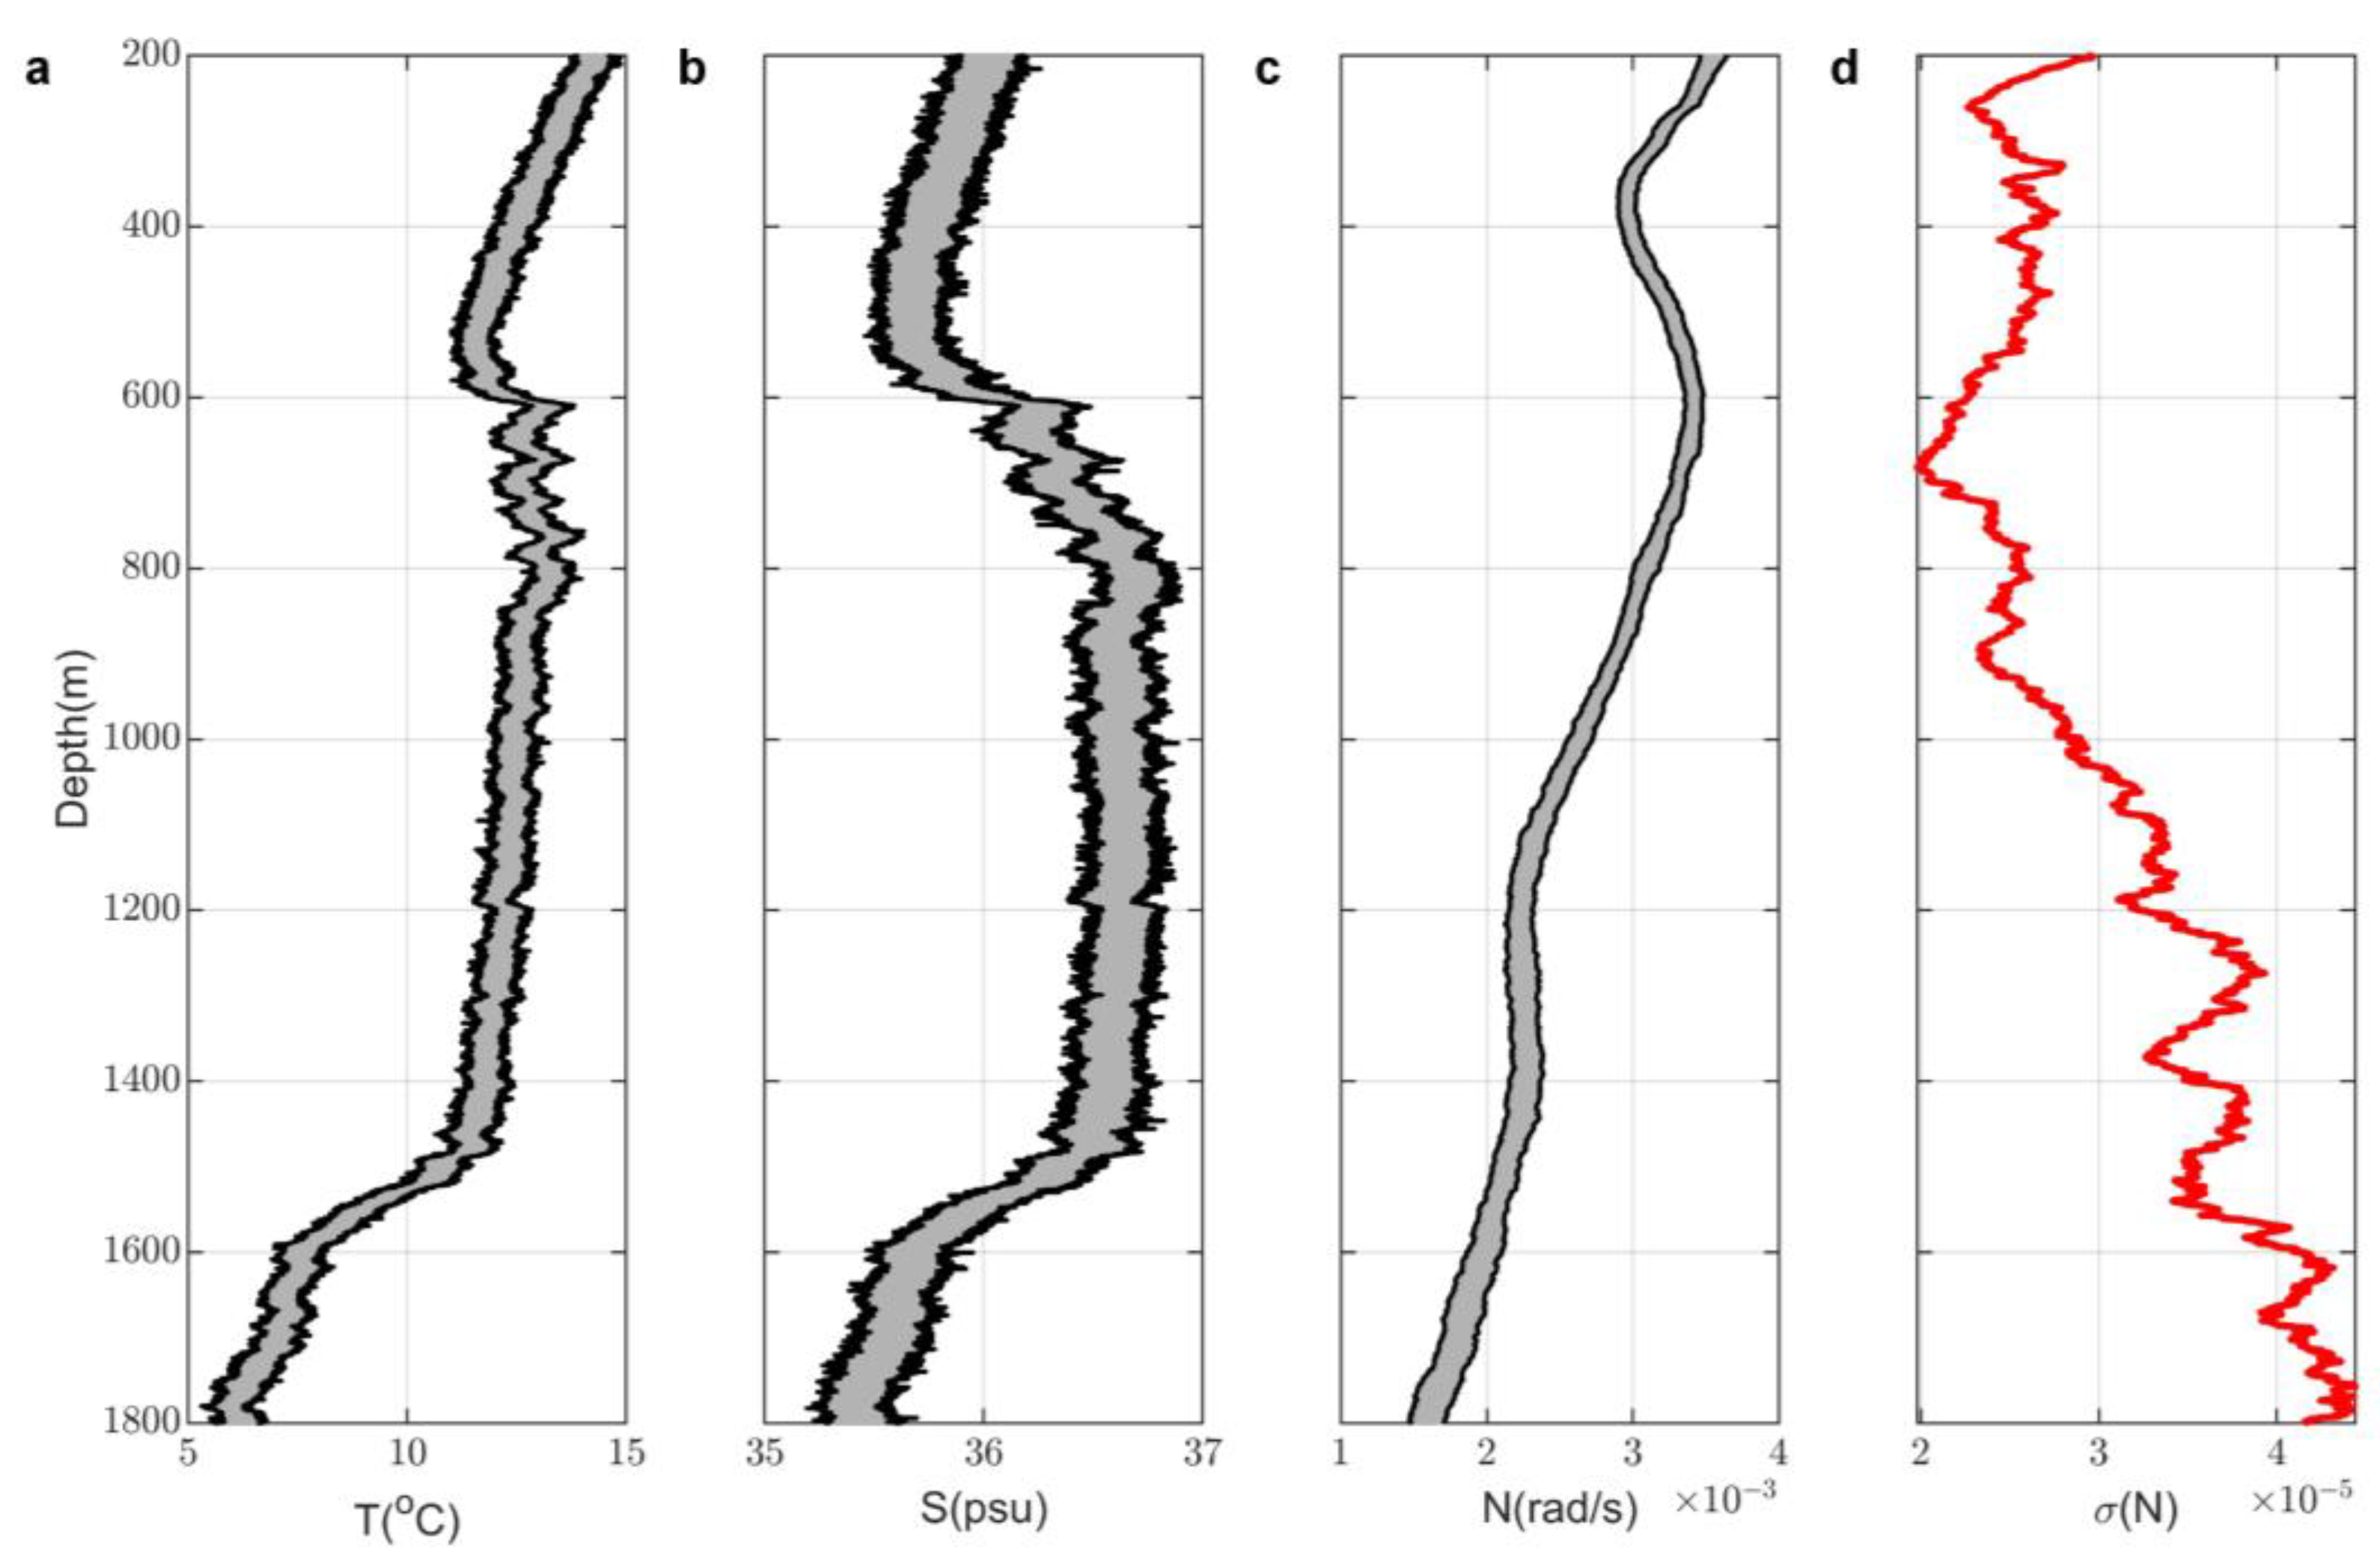
In order to quantify the contribution of buoyancy frequency to the log 10 ( ε ) uncertainty, the first step is to estimate the standard deviation of σ N . Buoyancy frequency uncertainty origins from the uncertainty of inverted temperature and salinity, which is estimated in [37]. At each CMP location, 200 temperature and salinity profiles were randomly drawn from a normal distribution, with a mean of best-inverted TS and standard deviation of final uncertainty. Each buoyancy frequency profile was derived from one pair of T and S profiles and then smoothed using a 400 dB filter [59], shown in Figure A3. The distribution of N obeys the normal distribution (Figure A4), and the standard deviations are plotted with depth (Figure A3d).
Figure A3. The T, S, N and σ N profiles with depth at CMP 1763. (a) Two hundred randomly drawn temperature profiles with depth. (b) Two hundred salinity profiles. (c) The smooth N profiles derived from T and S. (d) The standard deviation of N.
Jmse 10 00720 g0a3
Figure A4. The histogram of buoyancy frequency at 600 m depth. The red line represents the PDF of fitted normal distribution.
Jmse 10 00720 g0a4
The distribution of N is found to obey the normal distribution using the Kolmogorov–Smirnov test. From Figure A3d, we know that σ ( N ) < 4.63 × 10 5 along with the whole depth. In the whole area, ( f N ) max = 661 when N = 1.50 × 10 3   r a d / s .
Thus ( f N ) 2 σ 2 ( N ) max = 6.99 × 10 4 , while ( f E a ) 2 σ 2 ( E a ) m e a n = 0.25 .
Since ( f N ) 2 σ 2 ( N ) max < < ( f E a ) 2 σ 2 ( E a ) m e a n , the uncertainty of buoyancy frequency due to inversion can be neglected.
For E a , the uncertainty in the energy level ratio of each spectrum is estimated as the standard deviation of the ratio
ϕ ξ x ϕ ξ x G M
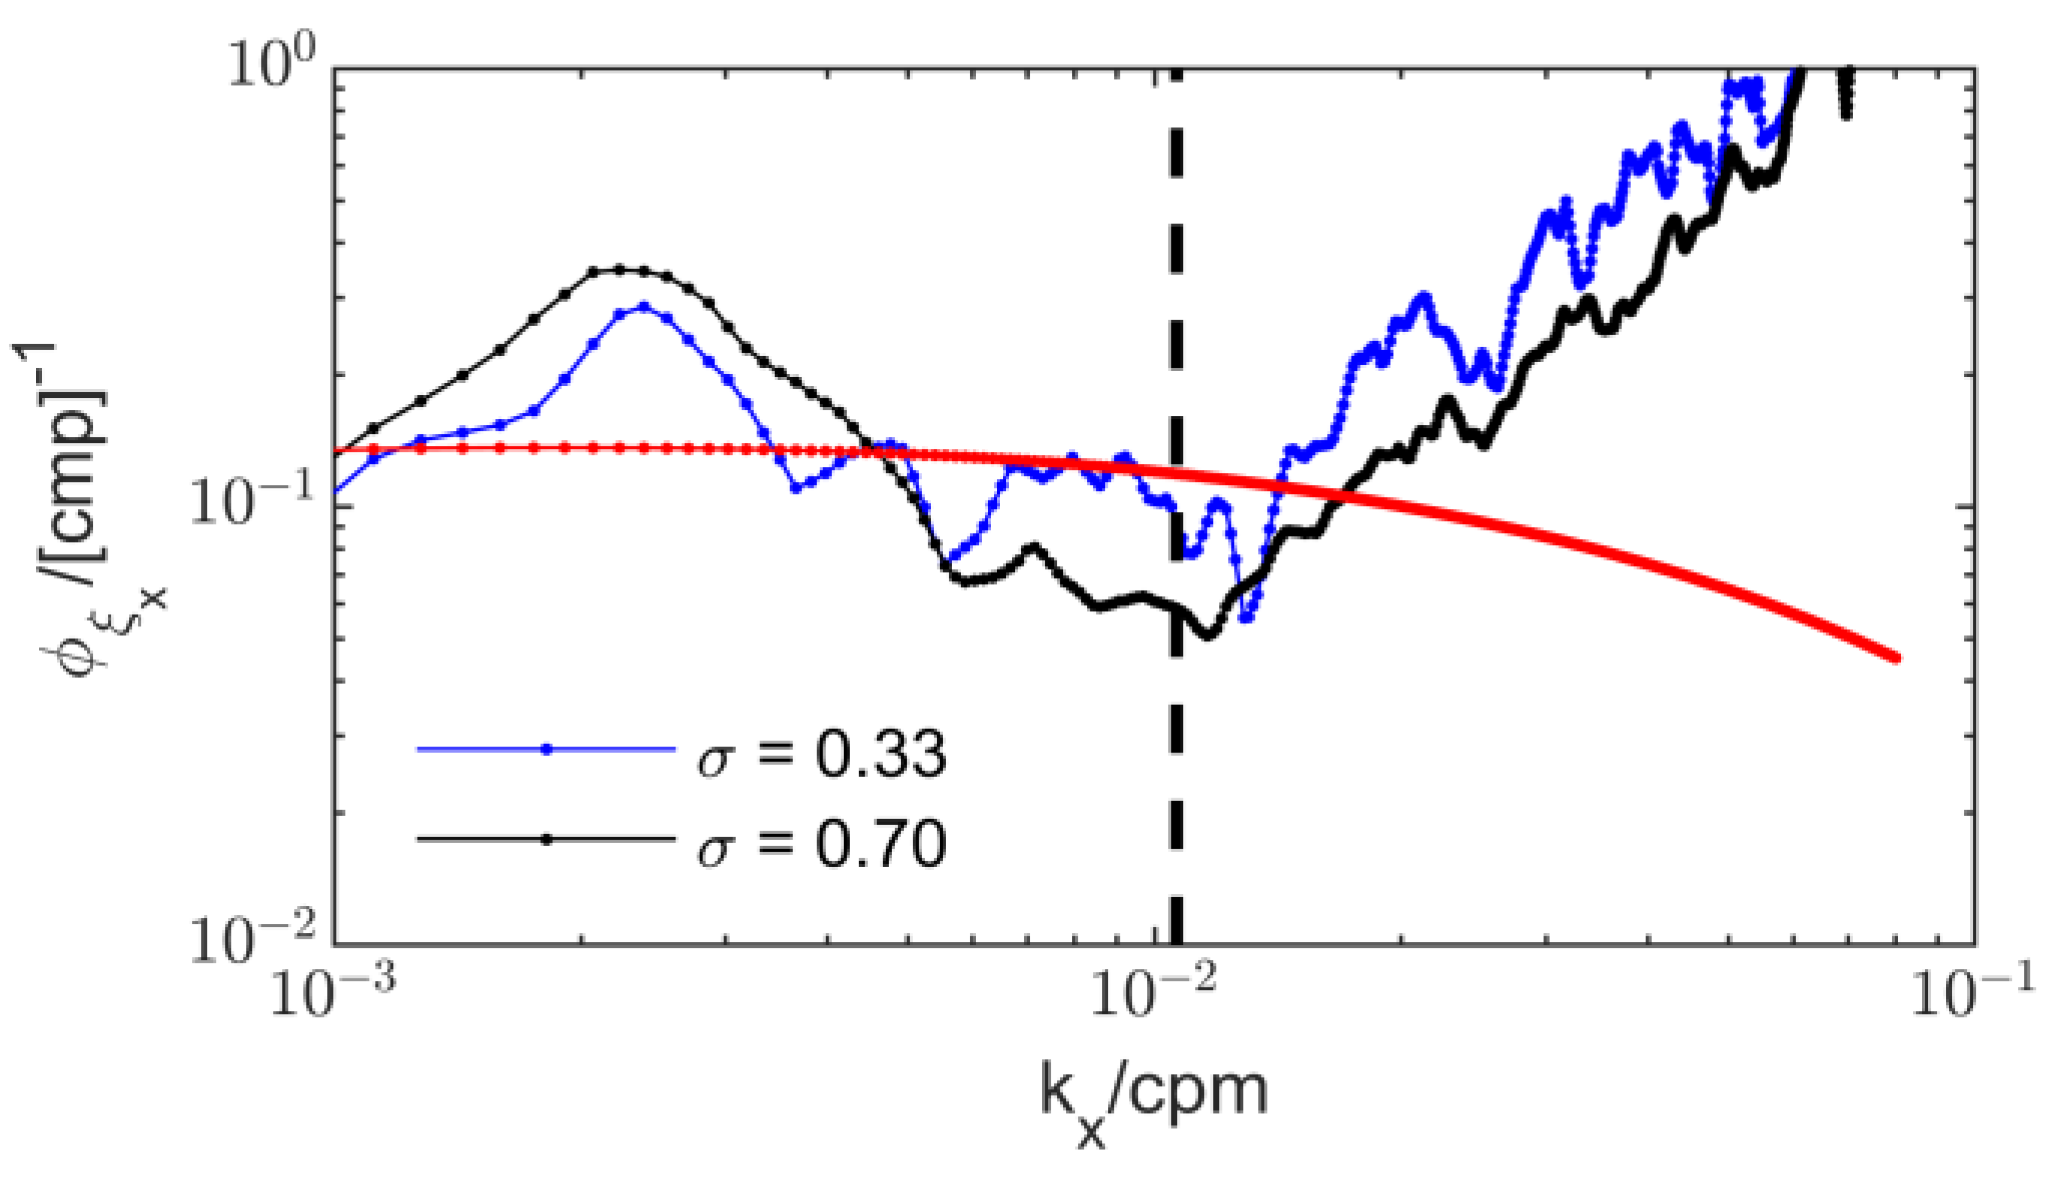
over the range of integration for k x [30], shown in Figure A5. The uncertainty in the energy level ratio increases when the horizontal slope spectra fluctuate with a higher amplitude. If the horizontal slope spectra have the same shape as the GM spectra, then the ratio in Equation (A4) is constant at each k x point, indicating the error in GM spectra is zero. This proves a reasonable estimate of uncertainty in the energy level ratio using this method. Most of the σ E a is between 0 and 2.
Figure A5. Estimation of uncertainty in E a from horizontal slope spectra. The blue and black solid lines represent two horizontal spectra estimated from seismic reflections, while the red line is the GM76 reference horizontal spectra. The dots are the discrete ϕ ξ x at each wavenumber. The dashed black vertical line represents the interface between the internal wave subrange and noise subrange. The blue spectrum (uncertainty 0.33) fluctuates in a smaller range than the black spectrum (uncertainty 0.70).
Jmse 10 00720 g0a5
The field shear-to-strain ratio, along with its uncertainty, was computed using hydrographic data from three in-situ CTD/LADCP in the following content. Finally, within each box, the uncertainty of the turbulent dissipation rate was estimated from the energy ratio and shear-to-strain ratio uncertainties, while the contribution from buoyancy frequency was subtle and thus neglected. The average final uncertainty in seismically derived log 10 ( ε ) is 0.61 ± 0.11 logarithmic units (Table A1).

Appendix B.2. Unceratinties in Turbulent Disspation Rates from Hydrographic Data (CTD/LADCP)
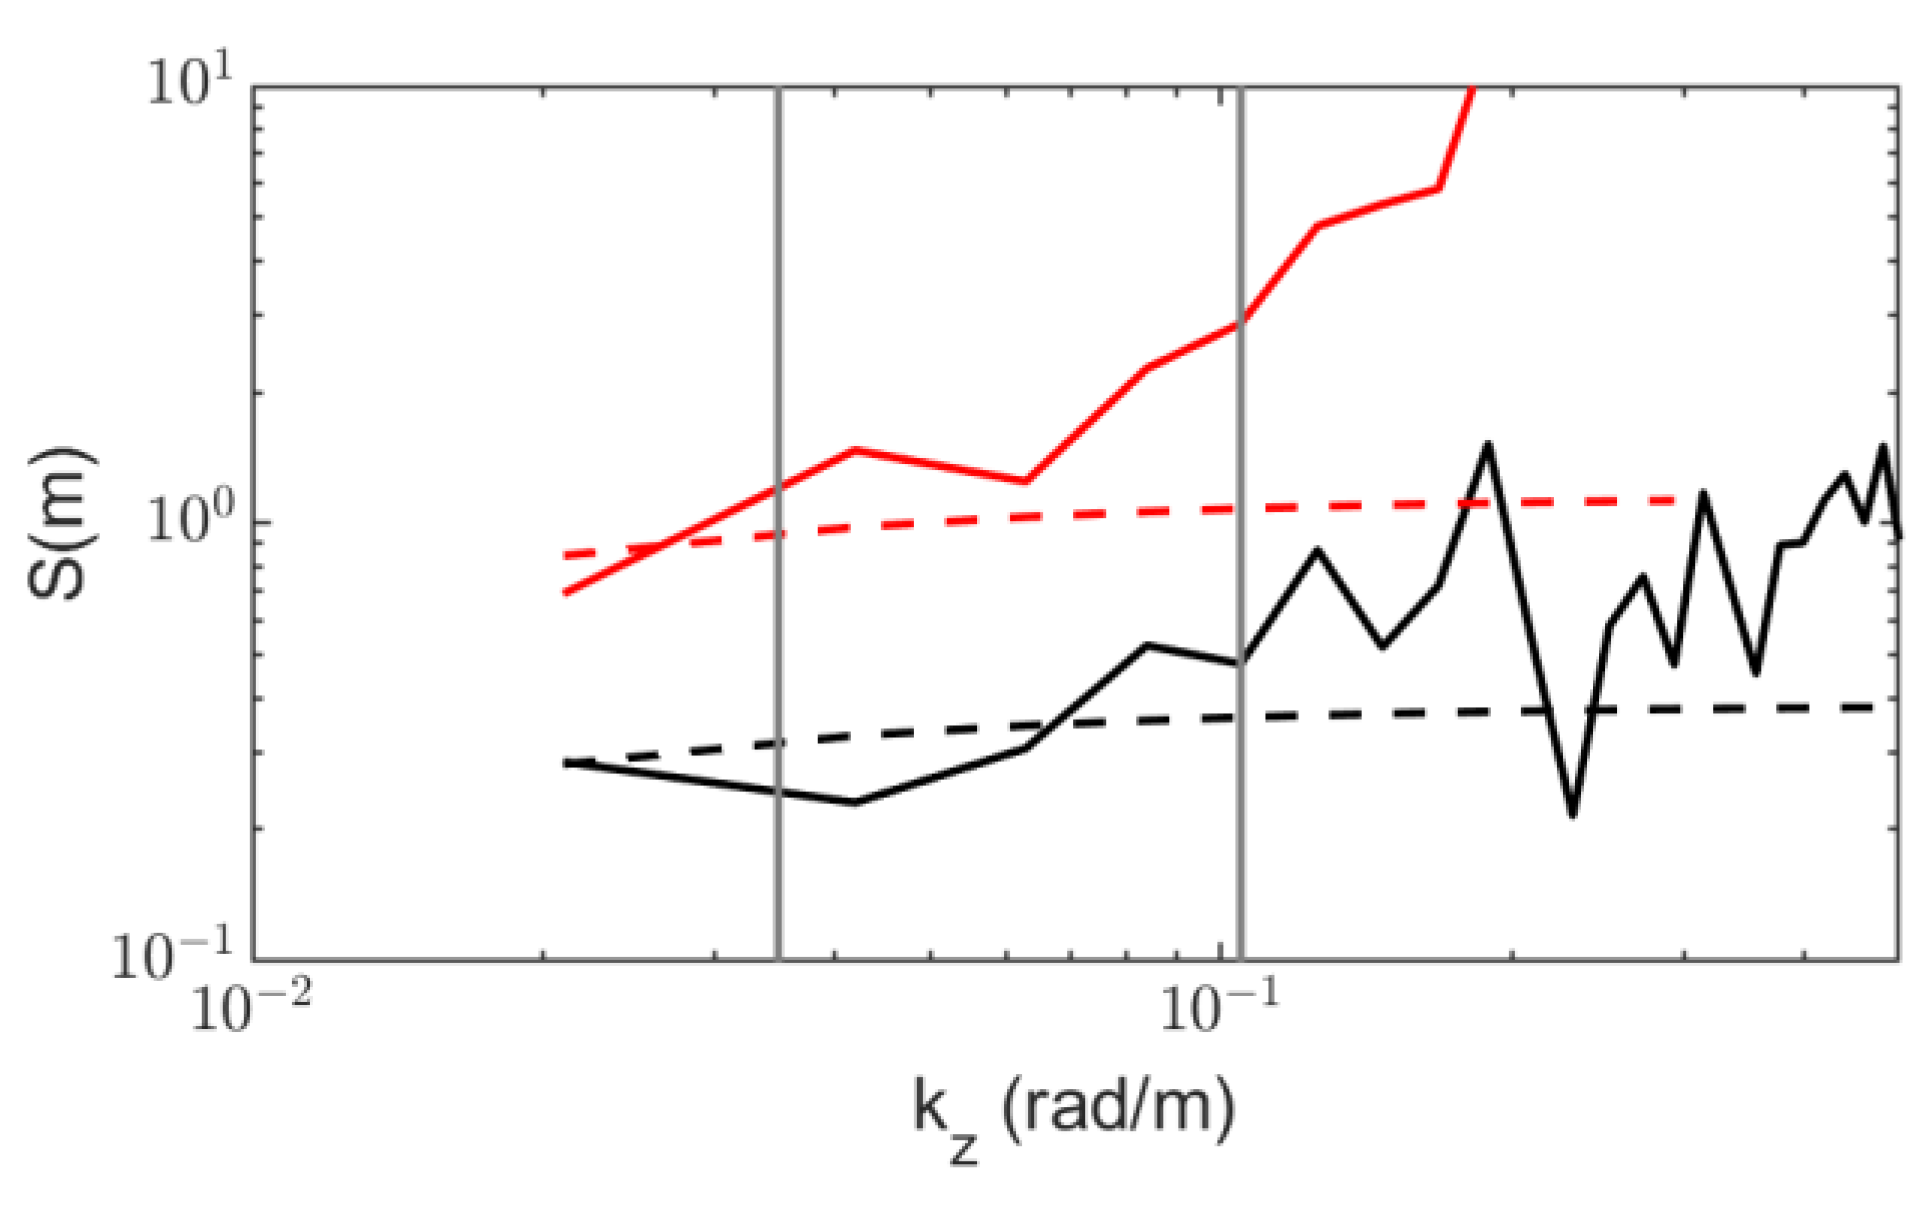
Since the buoyancy frequency N is calculated using the temperature and salinity directly measured by CTD casts, we assume the uncertainty of N is negligible compared to other error sources. The uncertainty of the energy ratio is calculated using a similar method to that described in Appendix B.1. However, by comparing the measured strain/shear spectra with their GM counterparts, the uncertainty in R ω of each cast is estimated as the standard deviation of the ratio
S [ V z / N ] S [ ξ z ]
at each vertical wavenumber k z inside the integration range from the averaged strain/shear spectra.
From Figure A6, the uncertainty in R ω at cast 35 is 1.18. More similar to the trend of strain and shear spectra, the ratio in Equation (A5) becomes more stable, leading to reduced uncertainty in R ω . In the GM reference spectra, the ratio is 3 at every wavenumber point; thus, the uncertainty of R ω is zero. The mean final uncertainty of CTD/LADCP ε using measured R ω is 0.62 ± 0.17 logarithmic units.
Figure A6. Estimation of the uncertainty in R ω . The red lines represent shear spectra while black lines represent strain spectra. Solid lines stand for measured spectra from CTD/LADCP cast 35 and dashed lines stand for spectra from the GM model.
Jmse 10 00720 g0a6
Table A1. Mean uncertainties (and their standard deviations) of N, Rw, Ea and log 10 ( ε ) .
N R ω   ( No   Unit ) Ea (No Unit) Final Uncertainty (Logarithmic Units)
Seismic dataNeglectable1.43 0.75 ± 0.36 0.61 ± 0.11
Hydrographic dataNeglectable1.43 1.48 ± 1.31 0.62 ± 0.17
There are only three R ω uncertainties corresponding to three CTD/LACP casts, which therefore prevents us from computing the standard deviation of R ω . Notice the uncertainty in Ea from seismic data is relatively stable with a standard deviation of 0.36, while that from hydrographic data varies in a larger range with a standard deviation of 1.31. We found that there are several strain spectra from hydrographic data showing low signal-to-noise ratios, leading to extremely high values of Ea uncertainty samples.

References

  1. McWilliams, J.C. Submesoscale Currents in the Ocean. Proc. R. Soc. A Math. Phys. Eng. Sci. 2016, 472, 20160117. [Google Scholar] [CrossRef] [PubMed]
  2. D’Asaro, E.A. Generation of Submesoscale Vortices: A New Mechanism. J. Geophys. Res. 1988, 93, 6685. [Google Scholar] [CrossRef]
  3. Molemaker, M.J.; McWilliams, J.C.; Dewar, W.K. Submesoscale Instability and Generation of Mesoscale Anticyclones near a Separation of the California Undercurrent. J. Phys. Oceanogr. 2015, 45, 613–629. [Google Scholar] [CrossRef]
  4. Thomsen, S.; Kanzow, T.; Krahmann, G.; Greatbatch, R.J.; Dengler, M.; Lavik, G. The Formation of a Subsurface Anticyclonic Eddy in the Peru-Chile Undercurrent and Its Impact on the near-Coastal Salinity, Oxygen, and Nutrient Distributions. J. Geophys. Res. Ocean. 2016, 121, 476–501. [Google Scholar] [CrossRef] [Green Version]
  5. McCoy, D.; Bianchi, D.; Stewart, A.L. Global Observations of Submesoscale Coherent Vortices in the Ocean. Prog. Oceanogr. 2020, 189, 102452. [Google Scholar] [CrossRef]
  6. Frenger, I.; Bianchi, D.; Stührenberg, C.; Oschlies, A.; Dunne, J.; Deutsch, C.; Galbraith, E.; Schütte, F. Biogeochemical Role of Subsurface Coherent Eddies in the Ocean: Tracer Cannonballs, Hypoxic Storms, and Microbial Stewpots? Glob. Biogeochem. Cycles 2018, 32, 226–249. [Google Scholar] [CrossRef] [Green Version]
  7. Sheen, K.L.; Brearley, J.A.; Naveira Garabato, A.C.; Smeed, D.A.; Laurent, L.S.; Meredith, M.P.; Thurnherr, A.M.; Waterman, S.N. Modification of Turbulent Dissipation Rates by a Deep Southern Ocean Eddy. Geophys. Res. Lett. 2015, 42, 3450–3457. [Google Scholar] [CrossRef] [Green Version]
  8. Fine, E.C.; MacKinnon, J.A.; Alford, M.H.; Mickett, J.B. Microstructure Observations of Turbulent Heat Fluxes in a Warm-Core Canada Basin Eddy. J. Phys. Oceanogr. 2018, 48, 2397–2418. [Google Scholar] [CrossRef]
  9. Bower, A.S.; Armi, L.; Ambar, I. Lagrangian Observations of Meddy Formation during a Mediterranean Undercurrent Seeding Experiment. J. Phys. Oceanogr. 1997, 27, 2545–2575. [Google Scholar] [CrossRef]
  10. Richardson, P.L.; Bower, A.S.; Zenk, W. A Census of Meddies Tracked by Floats. Prog. Oceanogr. 2000, 45, 209–250. [Google Scholar] [CrossRef]
  11. Candela, J. Chapter 5.7 Mediterranean Water and Global Circulation. In International Geophysics; Elsevier: Amsterdam, The Netherlands, 2001; p. 419-XLVIII. [Google Scholar]
  12. Reid, J.L. On the Total Geostrophic Circulation of the North Atlantic Ocean: Flow Patterns, Tracers, and Transports. Prog. Oceanogr. 1994, 33, 1–92. [Google Scholar] [CrossRef]
  13. Armi, L.; Hebert, D.; Oakey, N.; Price, J.F.; Richardson, P.L.; Rossby, H.T.; Ruddick, B. Two Years in the Life of a Mediterranean Salt Lens. J. Phys. Oceanogr. 1989, 19, 354–370. [Google Scholar] [CrossRef]
  14. Ruddick, B. Intrusive Mixing in a Mediterranean Salt Lens—Intrusion Slopes and Dynamical Mechanisms. J. Phys. Oceanogr. 1992, 22, 1274–1285. [Google Scholar] [CrossRef]
  15. Ruddick, B.; Hebert, D. The Mixing of Meddy “Sharon”; Elsevier: Amsterdam, The Netherlands, 1988; pp. 249–261. [Google Scholar]
  16. Hebert, D. Estimates of Salt-Finger Fluxes. Deep Sea Res. Part A Oceanogr. Res. Pap. 1988, 35, 1887–1901. [Google Scholar] [CrossRef]
  17. Hebert, D.; Oakey, N.; Ruddick, B. Evolution of a Mediterranean Salt Lens: Scalar Properties. J. Phys. Oceanogr. 1990, 20, 1468–1483. [Google Scholar] [CrossRef] [Green Version]
  18. Ruddick, B.R.; Oakey, N.S.; Hebert, D. Measuring Lateral Heat Flux across a Thermohaline Front: A Model and Observational Test. J. Mar. Res. 2010, 68, 523–539. [Google Scholar] [CrossRef]
  19. Stern, M.E. Lateral Mixing of Water Masses. Deep Sea Res. Oceanogr. Abstr. 1967, 14, 747–753. [Google Scholar] [CrossRef]
  20. Ruddick, B.R.; Turner, J.S. The Vertical Length Scale of Double-Diffusive Intrusions. Deep Sea Res. Part A Oceanogr. Res. Pap. 1979, 26, 903–913. [Google Scholar] [CrossRef]
  21. Ruddick, B.; Richards, K. Oceanic Thermohaline Intrusions: Observations. Prog. Oceanogr. 2003, 56, 499–527. [Google Scholar] [CrossRef]
  22. Holbrook, W.S.; Páramo, P.; Pearse, S.; Schmitt, R.W. Thermohaline Fine Structure in an Oceanographic Front from Seismic Reflection Profiling. Science 2003, 301, 821–824. [Google Scholar] [CrossRef]
  23. Ruddick, B.; Song, H.; Dong, C.; Pinheiro, L. Water Column Seismic Images as Maps of Temperature Gradient. Oceanography 2009, 22, 192–205. [Google Scholar] [CrossRef] [Green Version]
  24. Sallarès, V.; Biescas, B.; Buffett, G.; Carbonell, R.; Dañobeitia, J.J.; Pelegrí, J.L. Relative Contribution of Temperature and Salinity to Ocean Acoustic Reflectivity. Geophys. Res. Lett. 2009, 36, L00D06. [Google Scholar] [CrossRef] [Green Version]
  25. Biescas, B.; Sallarès, V.; Pelegrí, J.L.; Machín, F.; Carbonell, R.; Buffett, G.; Dañobeitia, J.J.; Calahorrano, A. Imaging Meddy Finestructure Using Multichannel Seismic Reflection Data. Geophys. Res. Lett. 2008, 35, 1–5. [Google Scholar] [CrossRef] [Green Version]
  26. Pinheiro, L.M.; Song, H.; Ruddick, B.; Dubert, J.; Ambar, I.; Mustafa, K.; Bezerra, R. Detailed 2-D Imaging of the Mediterranean Outflow and Meddies off W Iberia from Multichannel Seismic Data. J. Mar. Syst. 2010, 79, 89–100. [Google Scholar] [CrossRef]
  27. Ménesguen, C.; Hua, B.L.; Carton, X.; Klingelhoefer, F.; Schnürle, P.; Reichert, C. Arms Winding around a Meddy Seen in Seismic Reflection Data Close to the Morocco Coastline. Geophys. Res. Lett. 2012, 39, 1–6. [Google Scholar] [CrossRef] [Green Version]
  28. Gunn, K.L.; Dickinson, A.; White, N.J.; Caulfield, C.; Cille, P. Vertical Mixing and Heat Fluxes Conditioned by a Seismically Imaged Oceanic Front. Front. Mar. Sci. 2021, 8, 1–17. [Google Scholar] [CrossRef]
  29. Sheen, K.L.; White, N.J.; Hobbs, R.W. Estimating Mixing Rates from Seismic Images of Oceanic Structure. Geophys. Res. Lett. 2009, 36, L00D04. [Google Scholar] [CrossRef] [Green Version]
  30. Dickinson, A.; White, N.J.; Caulfield, C.P. Spatial Variation of Diapycnal Diffusivity Estimated From Seismic Imaging of Internal Wave Field, Gulf of Mexico. J. Geophys. Res. Ocean. 2017, 122, 9827–9854. [Google Scholar] [CrossRef] [Green Version]
  31. Falder, M.; White, N.J.; Caulfield, C.P. Seismic Imaging of Rapid Onset of Stratified Turbulence in the South Atlantic Ocean. J. Phys. Oceanogr. 2016, 46, 1023–1044. [Google Scholar] [CrossRef] [Green Version]
  32. Tang, Q.; Jing, Z.; Lin, J.; Sun, J. Diapycnal Mixing in the Subthermocline of the Mariana Ridge from High-Resolution Seismic Images. J. Phys. Oceanogr. 2021, 51, 1283–1300. [Google Scholar] [CrossRef]
  33. Holbrook, W.S.; Fer, I.; Schmitt, R.W.; Lizarralde, D.; Klymak, J.M.; Helfrich, L.C.; Kubichek, R. Estimating Oceanic Turbulence Dissipation from Seismic Images. J. Atmos. Ocean. Technol. 2013, 30, 1767–1788. [Google Scholar] [CrossRef] [Green Version]
  34. Holbrook, W.S.; Fer, I. Ocean Internal Wave Spectra Inferred from Seismic Reflection Transects. Geophys. Res. Lett. 2005, 32, 2–5. [Google Scholar] [CrossRef] [Green Version]
  35. Papenberg, C.; Klaeschen, D.; Krahmann, G.; Hobbs, R.W. Ocean Temperature and Salinity Inverted from Combined Hydrographic and Seismic Data. Geophys. Res. Lett. 2010, 37, 6–11. [Google Scholar] [CrossRef] [Green Version]
  36. Biescas, B.; Ruddick, B.R.; Nedimovic, M.R.; Sallarès, V.; Bornstein, G.; Mojica, J.F. Recovery of Temperature, Salinity, and Potential Density from Ocean Reflectivity. J. Geophys. Res. Ocean. 2014, 119, 3171–3184. [Google Scholar] [CrossRef] [Green Version]
  37. Xiao, W.; Sheen, K.L.; Tang, Q.; Shutler, J.; Hobbs, R.; Ehmen, T. Temperature and Salinity Inverted for a Mediterranean Eddy Captured With Seismic Data, Using a Spatially Iterative Markov Chain Monte Carlo Approach. Front. Mar. Sci. 2021, 8, 734125. [Google Scholar] [CrossRef]
  38. Song, H.; Pinheiro, L.M.; Ruddick, B.; Teixeira, F.C. Meddy, Spiral Arms, and Mixing Mechanisms Viewed by Seismic Imaging in the Tagus Abyssal Plain (SW Iberia). J. Mar. Res. 2011, 2, 827–842. [Google Scholar] [CrossRef]
  39. Biescas, B.; Armi, L.; Sallarès, V.; Gràcia, E. Seismic Imaging of Staircase Layers below the Mediterranean Undercurrent. Deep Res. Part I Oceanogr. Res. Pap. 2010, 57, 1345–1353. [Google Scholar] [CrossRef]
  40. Bai, Y.; Song, H.B.; Dong, C.Z.; Liu, B.R.; Chen, J.X.; Geng, M.H. Extraction of Mixing Parameters by Seismic Oceanography and Applications: Case Study of the Internal Waves in South China Sea and Mediterranean Eddy. Acta Geophys. Sin. 2015, 58, 2473–2485. [Google Scholar] [CrossRef]
  41. McPhee, M.G.; Kottmeier, C.; Morison, J.H. Ocean Heat Flux in the Central Weddell Sea during Winter. J. Phys. Oceanogr. 1999, 29, 1166–1179. [Google Scholar] [CrossRef]
  42. Padman, L.; Dillon, T.M. Vertical Heat Fluxes through the Beaufort Sea Thermohaline Staircase. J. Geophys. Res. 1987, 92, 10799. [Google Scholar] [CrossRef]
  43. Meyer, A.; Fer, I.; Sundfjord, A.; Peterson, A.K. Mixing Rates and Vertical Heat Fluxes North of Svalbard from Arctic Winter to Spring. J. Geophys. Res. Ocean. 2017, 122, 4569–4586. [Google Scholar] [CrossRef] [Green Version]
  44. Hobbs, R.W. RRS Discovery D318a & D318b Cruise Report. Available online: https://www.bodc.ac.uk/resources/inventories/cruise_inventory/reports/d318.pdf (accessed on 22 May 2022).
  45. Tang, Q.; Hobbs, R.; Zheng, C.; Biescas, B.; Caiado, C. Markov Chain Monte Carlo Inversion of Temperature and Salinity Structure of an Internal Solitary Wave Packet from Marine Seismic Data. J. Geophys. Res. Ocean. 2016, 121, 3692–3709. [Google Scholar] [CrossRef] [Green Version]
  46. Ballabrera-Poy, J.; Mourre, B.; Garcia-Ladona, E.; Turiel, A.; Font, J. Linear and Non-Linear T–S Models for the Eastern North Atlantic from Argo Data: Role of Surface Salinity Observations. Deep Sea Res. Part I Oceanogr. Res. Pap. 2009, 56, 1605–1614. [Google Scholar] [CrossRef]
  47. Krahmann, G.; Papenberg, C.; Brandt, P.; Vogt, M. Evaluation of Seismic Reflector Slopes with a Yoyo-CTD. Geophys. Res. Lett. 2009, 36, 1–5. [Google Scholar] [CrossRef] [Green Version]
  48. Sheen, K.L.; White, N.; Caulfield, C.P.; Hobbs, R.W. Estimating Geostrophic Shear from Seismic Images of Oceanic Structure. J. Atmos. Ocean. Technol. 2011, 28, 1149–1154. [Google Scholar] [CrossRef] [Green Version]
  49. Barnes, A.E. A Tutorial on Complex Seismic Trace Analysis. Geophysics 2007, 72, W33–W43. [Google Scholar] [CrossRef]
  50. Thomson, D.J. Spectrum Estimation and Harmonic Analysis. Proc. IEEE 1982, 70, 1055–1096. [Google Scholar] [CrossRef] [Green Version]
  51. Garrett, C.; Munk, W. Space-Time Scales of Internal Waves: A Progress Report. J. Geophys. Res. 1975, 80, 291–297. [Google Scholar] [CrossRef]
  52. Cairns, J.L.; Williams, G.O. Internal Wave Observations from a Midwater Float, 2. J. Geophys. Res. 1976, 81, 1943–1950. [Google Scholar] [CrossRef]
  53. Gargett, A.E.; Hendricks, P.J.; Sanford, T.B.; Osborn, T.R.; Williams, A.J. A Composite Spectrum of Vertical Shear in the Upper Ocean. J. Phys. Oceanogr. 1981, 11, 1258–1271. [Google Scholar] [CrossRef] [Green Version]
  54. Batchelor, G.K.; Howells, I.D.; Townsend, A.A. Small-Scale Variation of Convected Quantities like Temperature in Turbulent Fluid Part 2. The Case of Large Conductivity. J. Fluid Mech. 1959, 5, 134. [Google Scholar] [CrossRef]
  55. Jun, H.; Jou, H.; Kim, C.; Lee, S.H.; Kim, H. Random Noise Attenuation of Sparker Seismic Oceanography Data with Machine Learning. Ocean. Sci. 2020, 16, 1367–1383. [Google Scholar] [CrossRef]
  56. Polzin, K.L.; Toole, J.M.; Schmitt, R.W. Finescale Parameterizations of Turbulent Dissipation. J. Phys. Oceanogr. 1995, 25, 306–328. [Google Scholar] [CrossRef] [Green Version]
  57. Gregg, M.C.; Sanford, T.B.; Winkel, D.P. Reduced Mixing from the Breaking of Internal Waves in Equatorial Waters. Nature 2003, 422, 513. [Google Scholar] [CrossRef]
  58. Waterman, S.; Naveira Garabato, A.C.; Polzin, K.L. Internal Waves and Turbulence in the Antarctic Circumpolar Current. J. Phys. Oceanogr. 2013, 43, 259–282. [Google Scholar] [CrossRef] [Green Version]
  59. Bray, N.A.; Fofonoff, N.P. Available Potential Energy for MODE Eddies. J. Phys. Oceanogr. 1981, 11, 30–47. [Google Scholar] [CrossRef]
  60. Kunze, E.; Firing, E.; Hummon, J.M.; Chereskin, T.K.; Thurnherr, A.M. Global Abyssal Mixing Inferred from Lowered ADCP Shear and CTD Strain Profiles. J. Phys. Oceanogr. 2006, 36, 1553–1576. [Google Scholar] [CrossRef] [Green Version]
  61. Sheen, K.L.; Brearley, J.A.; Garabato, A.C.N.; Smeed, D.A.; Waterman, S.; Ledwell, J.R.; Meredith, M.P.; Laurent, L.S.; Thurnherr, A.M.; Toole, J.M.; et al. Rates and Mechanisms of Turbulent Dissipation and Mixing in the Southern Ocean: Results from the Diapycnal and Isopycnal Mixing Experiment in the Southern Ocean (DIMES). J. Geophys. Res. Ocean. 2013, 118, 2774–2792. [Google Scholar] [CrossRef] [Green Version]
  62. Chinn, B.S.; Girton, J.B.; Alford, M.H. The Impact of Observed Variations in the Shear-to-Strain Ratio of Internal Waves on Inferred Turbulent Diffusivities. J. Phys. Oceanogr. 2016, 46, 3299–3320. [Google Scholar] [CrossRef]
  63. Gregg, M.C.; Winkel, D.P.; Sanford, T.B. Varieties of Fully Resolved Spectra of Vertical Shear. J. Phys. Oceanogr. 1993, 23, 124–141. [Google Scholar] [CrossRef] [Green Version]
  64. Ku, H.H. Notes on the Use of Propagation of Error Formulas. J. Res. Natl. Bur. Stand. Sect. C Eng. Instrum. 1966, 70C, 263. [Google Scholar] [CrossRef]
  65. Ruddick, B. A Practical Indicator of the Stability of the Water Column to Double-Diffusive Activity. Deep Sea Res. Part A Oceanogr. Res. Pap. 1983, 30, 1105–1107. [Google Scholar] [CrossRef]
  66. You, Y. A Global Ocean Climatological Atlas of the Turner Angle: Implications for Double-Diffusion and Water-Mass Structure. Deep. Res. Part I Oceanogr. Res. Pap. 2002, 49, 2075–2093. [Google Scholar] [CrossRef]
  67. Fick, A. Ueber Diffusion. Ann. Phys. Chem. 1855, 170, 59–86. [Google Scholar] [CrossRef]
  68. Osborn, T.R. Estimates of the Local Rate of Vertical Diffusion from Dissipation Measurements. J. Phys. Oceanogr. 1980, 10, 83–89. [Google Scholar] [CrossRef] [Green Version]
  69. McDougall, T.J. Some Implications of Ocean Mixing for Ocean Modelling.; Elsevier: Amsterdam, Netherlands, 1988; pp. 21–35. [Google Scholar]
  70. Hamilton, J.M.; Lewis, M.R.; Ruddick, B.R. Vertical Fluxes of Nitrate Associated with Salt Fingers in the World’s Oceans. J. Geophys. Res. 1989, 94, 2137. [Google Scholar] [CrossRef]
  71. Schmitt, R.W. Observational and Laboratory Insights into Salt Finger Convection. Prog. Oceanogr. 2003, 56, 419–433. [Google Scholar] [CrossRef]
  72. Joyce, T.M. A Note on the Lateral Mixing of Water Masses. J. Phys. Oceanogr. 1977, 7, 626–629. [Google Scholar] [CrossRef] [Green Version]
  73. Forryan, A.; Allen, J.T.; Edhouse, E.; Silburn, B.; Reeve, K.; Tesi, E. Turbulent Mixing in the Eddy Transport of Western Mediterranean Intermediate Water to the Alboran Sea. J. Geophys. Res. Ocean. 2012, 117, 1–9. [Google Scholar] [CrossRef]
  74. Fer, I.; Bosse, A.; Ferron, B.; Bouruet-Aubertot, P. The Dissipation of Kinetic Energy in the Lofoten Basin Eddy. J. Phys. Oceanogr. 2018, 48, 1299–1316. [Google Scholar] [CrossRef]
  75. Fernández-Castro, B.; Evans, D.G.; Frajka-Williams, E.; Vic, C.; Naveira-Garabato, A.C. Breaking of Internal Waves and Turbulent Dissipation in an Anticyclonic Mode Water Eddy. J. Phys. Oceanogr. 2020, 50, 1893–1914. [Google Scholar] [CrossRef] [Green Version]
  76. Williams, A.J. Salt Fingers Observed in the Mediterranean Outflow. Science 1974, 185, 941–943. [Google Scholar] [CrossRef]
  77. Schmitt, R.W. Form of the Temperature-Salinity Relationship in the Central Water: Evidence for Double-Diffusive Mixing. J. Phys. Oceanogr. 1981, 11, 1015–1026. [Google Scholar] [CrossRef] [Green Version]
  78. Peters, H.; Gregg, M.C.; Toole, J.M. On the Parameterization of Equatorial Turbulence. J. Geophys. Res. 1988, 93, 1199. [Google Scholar] [CrossRef]
  79. Radko, T.; Sisti, C. Life and Demise of Intrathermocline Mesoscale Vortices. J. Phys. Oceanogr. 2017, 47, 3087–3103. [Google Scholar] [CrossRef]
  80. Zhao, M.; Timmermans, M.-L.; Cole, S.; Krishfield, R.; Proshutinsky, A.; Toole, J. Characterizing the Eddy Field in the Arctic Ocean Halocline. J. Geophys. Res. Ocean. 2014, 119, 8800–8817. [Google Scholar] [CrossRef] [Green Version]
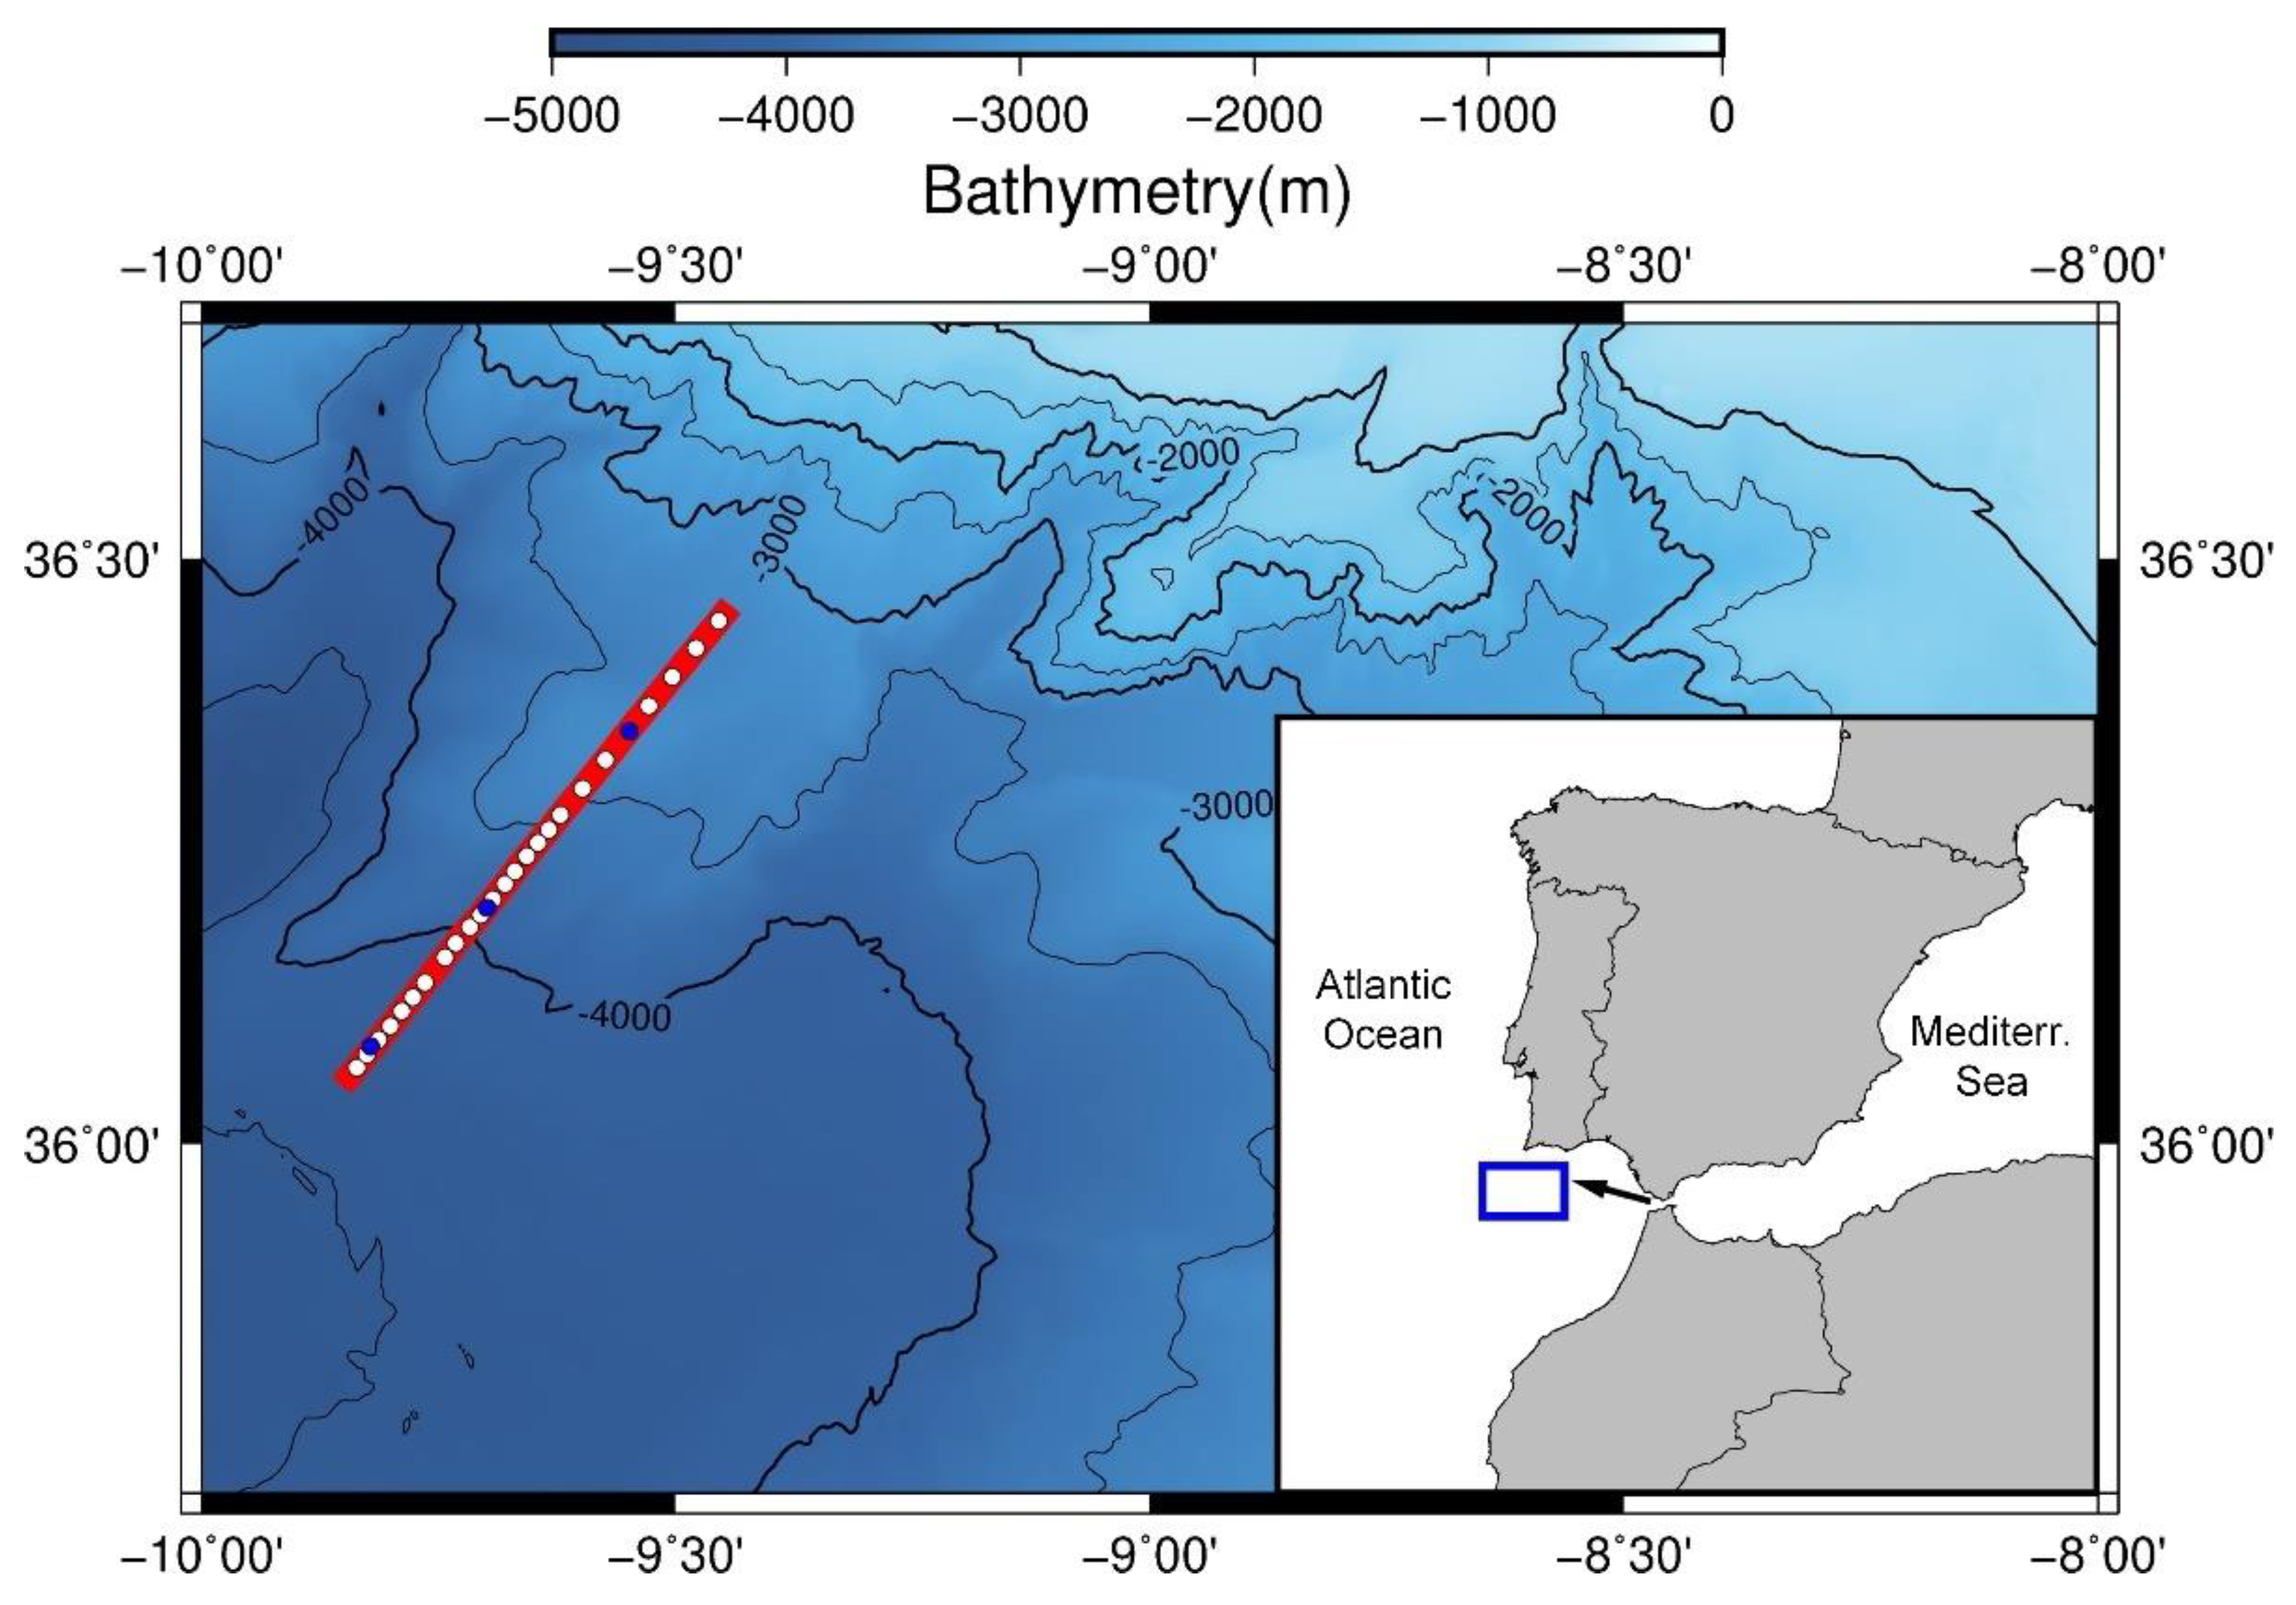
Figure 1. Bathymetry of data collection region. Red line = seismic transect GOLR12; white dots = 24 XBT casts deployed coincident with seismic acquisition; blue dots = 3 CTD casts deployed before and after the seismic survey; Inset shows location of the research area, and schematic of Mediterranean outflow pathway. Bathymetry was produced from the GEBCO 2020 dataset.
Jmse 10 00720 g001
Figure 2. The seismic stack section and the tracked reflectors of seismic line GOLR12. (a) Seismic stack section, where red/blue ribbons represent seismic reflections of negative/positive amplitudes, respectively. Red (bot) dots represent the locations of 24 XBTs (3 CTDs). (b) The tracked reflectors that are greater than 1 km—box 1 marked by a red rectangle—will be spectrally analyzed further.
Jmse 10 00720 g002
Figure 3. Spectral analysis and theoretical model fitting. (a) The zoomed-in seismic section labelled 1 in Figure 2b. (b) Corresponding tracked reflectors of (a). (c) The averaged spectrum. The red line represents the averaged spectrum, and grey lines represent all spectra inside the box. (d) The spectrum in (c) fitted by the theoretical model. The solid color lines represent the best fit theoretical model. The red line represents the internal wave regime, with a slope of p ranging from −1 to 0. The blue line represents the turbulence regime with a slope of 1/3, and the green line shows the noise regime with a slope of 2. The red and blue dash lines represent the wavelengths of the internal wave–turbulence break point and turbulence–noise break point, respectively.
Jmse 10 00720 g003
Figure 4. (a) The strain and (b) shear spectra of CTD/LADCP cast 1. The grey lines are spectra at each segment of different depths, the red line represents the average spectra along the vertical wavenumber, and the dash line represents the integration limitation.
Jmse 10 00720 g004
Figure 5. The seismically derived turbulent dissipation section. (a) The original ε distribution over-laying the seismic section; the grey area has no turbulent dissipation values due to the lack of seismic reflectors inside. (b) Similar to (a), but the ε is interpolated across the whole section. Blue dots rep-resent three CTD casts.
Jmse 10 00720 g005
Figure 6. Turbulent dissipation rates estimated from CTD/LADCP and seismic data using meas-ured Rω. The blue and red lines represent the seismic data and CTD/LADCP measurements, respec-tively. Hollow dots represent ε from interpolation (seismic boxes without reflector inside), while solid dots represent the normal ε estimated from seismic reflectors. The grey background repre-sents the top and bottom edges of the meddy. The shallow yellow represents the core of the meddy. The horizontal bars represent the 95% CI uncertainty levels. (a) At cast 35. (b) At cast 36. (c) At cast 37. The location of CTD can be found in Figure 7a.
Jmse 10 00720 g006
Figure 7. (a) The inverted temperature section. The red, blue and black rectangles represent the left, top and bottom edge areas of this meddy, which are found to be subject to lateral thermohaline intrusions, diffusive fluxes and salt fingering mixing, respectively. White dots represent the XBT locations along the cruise, while black dots represent XBTs near the frontal area. Blue dots represent three CTD casts deployed before and after the seismic cruise. (b) The Turner angle section estimated from the inverted temperature-salinity sections. GI = gravitational instabilities. SF = salt fingering, DC = diffusive convection. Stable stands for the stable stratification.
Jmse 10 00720 g007
Figure 8. Staircase phenomenon caused by double-diffusive convection observed from profiles of CTD 37. (a) Temperature and (b) salinity profiles at the top edge of the meddy between 750 m and 850 m. Solid back lines mark the signs of staircases caused by diffusive convection. (c) Temperature and (d) salinity profiles at the bottom edge of the meddy between 1450 m and 1550 m. The solid black lines mark vertical steps of thermohaline staircases because of salt fingers. Three steps from above to below have heights of 14 m, 7 m and 10 m, respectively.
Jmse 10 00720 g008
Figure 9. (a) Temperature and (b) salinity profiles at the top edge of the meddy from inverted sections. (c,d) as for panels (a,b) but at the bottom edge of the meddy. The temperature/salinity is horizontally averaged every ~120 m (20 CMPs), so that random wiggles introduced by the seismic source signature are smoothed out. Potential signs of staircases are circled by black rectangles. The blue dots represent the location of CTD cast 37. The temperature/salinity ranges from the CTD 37 cast are within the 95% CI of those from the seismic inversion.
Jmse 10 00720 g009
Figure 10. The temperature versus depth of XBT (a) 6, (b) 7, (c) 8 and (d) 9. Their locations on the meddy can be found in Figure 7. The depth range is 600 m to 1400 m, which is consistent with the meddy depth range.
Jmse 10 00720 g010
Figure 11. (a) Inverted temperature and (b) salinity profiles at the left edge of the meddy. Signs of thermohaline intrusions are circled by black rectangles. The inverted temperature and salinity sections have been laterally smoothed using a 500 m window in order to suppress the noisy and random subtle picks due to the ringyness of seismic data. (c) A pair of temperature and salinity profiles at the same location in this region show that warm (cold) intrusions are also salty (fresh).
Jmse 10 00720 g011
Figure 12. Inside the lateral intrusive region, profiles of (a) diapycnal diffusivity with depth (b) vertical temperature gradient Tz with step of 1 m. Grey area represents the raw Tz calculated from inverted temperature profiles at the left edge of the meddy, while black lines are the range of Tz and the red line is the average. (c) The vertically averaged temperature profile versus distance. The grey area indicates the lateral intrusion area, and the red line represents the best fit line Tx.
Jmse 10 00720 g012
Figure 13. The meddy model with temperature anomaly shown by red circle at the core.
Jmse 10 00720 g013
Table 1. The effect of frontal area definition on T x .
Frontal Range (km)10.0 to 15.5 (5.5)12.0 to 14.0 (2)11.0 to 15.0 (4)
T x × 10 5   ° C m 1 8.86.58.2
Table 2. The lateral diffusivities using different T x and dz.
T x × 10 5   ° C m 1 K T l s i d e s ( m 2 s 1 )
dz = 0.5 mdz = 1 mdz = 2 m
8.80.970.960.95
8.21.121.121.10
6.51.791.781.75
Table 3. Heat flux, transport and lifetimes for each edge of the meddy core.
Region Flux   ( W m 2 ) Area   ( m 2 ) Transport (GW)Lifetime (Year)
Eddy flanks (lateral intrusions)468.82 7.8 × 10 7 36.822
Above the eddy core (diffusive layers)0.20 1.96 × 10 9 0.40186
Below the eddy core (salt fingering)0.89 1.96 × 10 9 1.7542
Publisher’s Note: MDPI stays neutral with regard to jurisdictional claims in published maps and institutional affiliations.