Article

Evaluating the Shark Deterrent Effects of the Novel Exclusion Barrier in Comparison to the Rigorously Tested Sharksafe Barrier Technology

1
School for Marine Science and Technology, University of Massachusetts Dartmouth, 706 South Rodney French Boulevard, New Bedford, MA 02744, USA
2
O’Seas Conservation Foundation, Montauk, NY 11954, USA
3
Department of Marine Science, Coastal Carolina University, Conway, SC 29526, USA
4
Neal Watsons Bimini Scuba Center, Bimini 32110, Bahamas
*
Author to whom correspondence should be addressed.
J. Mar. Sci. Eng. 2022, 10(5), 634; https://doi.org/10.3390/jmse10050634
Submission received: 20 February 2022 / Revised: 3 April 2022 / Accepted: 26 April 2022 / Published: 6 May 2022
(This article belongs to the Section Marine Biology)

Abstract

:
Although exceedingly rare, shark attacks have a disproportionately large impact on human behavior, often resulting in shark culls. Due to the invasive nature of shark culls, innovating and testing non-invasive deterrent technologies that may minimize the potential for a rare negative shark encounter has become a conservation priority. One such mitigation approach is barriers, such as exclusion nets and the Sharksafe barrier. With both technologies exhibiting limitations and/or ineffectiveness (e.g., Sharksafe barrier), the development of a more effective technology was warranted. Therefore, this study had two key objectives: (1) to determine if DC 12 Volts 180 Newtons electromagnets can produce deterrent responses in the bull shark (Carcharhinus leucas) and (2) to determine if a newly designed and eco-friendly Exclusion barrier exhibits enhanced C. leucas deterrent capabilities when directly compared to the Sharksafe barrier. Based on 100 baited apparatus trials, electromagnetically treated baits resulted in significantly greater avoidance and reduced feeding frequencies. Furthermore, Poisson generalized linear mixed effect model analyses based on 27, 1-h trials illustrated that the Exclusion barrier region resulted in the greatest avoidance and lowest entrance and exit frequencies when compared to the control and Sharksafe barrier regions. Although the Exclusion barrier did not exclude all interacting sharks, the technology provided superior deterrent efficacy in relation to the Sharksafe barrier. Therefore, with many shark populations exhibiting precipitous declines, continued research on this novel technology on potentially dangerous shark species (e.g., white sharks—Carcharodon carcharias) and in varying ecological conditions (e.g., a high energy coastline) is warranted.

1. Introduction

With the human population exhibiting exponential trends in growth, development in coastal communities and the recreational use of marine resources are increasing [1,2]. Due to the spatial overlap between humans and various large and potentially dangerous shark species (e.g., white sharks—Carcharodon carcharias; bull sharks—Carcharinus leucas; and tiger sharks—Galeocerdo cuvier), there exists a risk of a negative shark encounter [3]. Even though these encounters are exceedingly rare, there is often an immediate response to prevent future incidents [4,5,6]. Where some localities implement a Science-based and “eco-friendly” approach (e.g., Exclusion nets in Cape Town, South Africa), other localities have implemented indiscriminate shark culls through the use of drumlines and/or shark nets [7]. Although there is insufficient evidence that demonstrates the effectiveness of some of these invasive and lethal shark control programs [8], there is evidence that demonstrates that the existence of these culling programs is detrimental to both the local environment and marine life [9,10]. Furthermore, losing the top predators that many of these programs target (e.g., C. carcharias and C. leucas) may compromise marine ecosystem functioning [11,12,13].
Due to the potential negative consequences associated with both short-term and long-term culling programs, scientists have been trialing ecologically responsible techniques that address multiple conservation priorities, including minimizing human impacts on natural resources and maximizing human and marine organismal safety along the shoreline [14,15]. While a variety of alternative and non-lethal approaches to shark-human mitigation have been tested (e.g., Shark Spotters—[14]; electrical devices—[16]; SMART Drumlines—[17]), one strategy involves the use of barrier-like devices. Two key types of barrier-like devices currently exist, exclusion nets [18] and the Sharksafe Barrier [19]. Exclusion nets are small-meshed nets that provide a physical barrier to marine organisms, whereas the Sharksafe barrier is a technology that incorporates visual (i.e., rigid piping) and magnetic (i.e., grade C8 barium-ferrite (BaFe12O19) stimuli to selectively deter large and potentially dangerous shark species [15]. Both technologies have been tested on larger scales [15,20] which permitted the evaluation of technological advantages and limitations.
Most recently, the first large-scale shoreline deployment of the Sharksafe Barrier on C. leucas demonstrated that the system did exhibit shark exclusion properties; however, sharks consistently penetrated the barrier (i.e., 63% of the interacting sharks entered through the system at least once). After 59 h of observation, researchers noticed that 89.7% of the entrances occurred at the surface, where the inter-barrier element spacing often fluctuated due to wave activity and produced large openings that the sharks could penetrate [15]. Based on these technological shortcomings and the need for an eco-friendly alternative to shark culling, a novel technology was created, known as the Exclusion barrier. The Exclusion barrier is an inexpensive technology that is composed of the following: (1) interconnected vertical barrier elements (i.e., the visual stimulus) that form a semi-rigid structure that addresses the piping separation issue with the Sharksafe barrier, (2) paired DC 12V 180N electromagnets powered by 12V internal hydroelectric power generators and strategically spaced N52 Neodymium (Nd2Fe14B) permanent magnets that create a continues magnetic field throughout the entirety of the barrier, and (3) a telescoping piping component at the surface of the barrier to facilitate a continuous seafloor to sea surface visual barrier with variation in tidal height and wave activity.
To determine if this new technology may provide added shark exclusion properties, this study used a comparative experimental design where the shark exclusion efficacy of the Sharksafe barrier was directly compared to that of the Exclusion barrier. However, it is unknown if electromagnets have shark deterrent capabilities since previously conducted studies used permanent magnetic materials [21,22,23]. Therefore, using C. leucas as the model species, the objectives of this study were: (1) to determine if DC 12V 180N electromagnets exhibit shark deterrent capabilities, (2) to determine if the Exclusion barrier exhibits enhanced shark exclusion properties in comparison to the Sharksafe barrier, (3) to determine if exclusion efficacy would be influenced by the number of sharks in the area (conspecific density) and water visibility, and (4) to determine if this technology is a viable and an eco-friendly alternative to current shark mitigation (e.g., shark nets and drumlines) strategies. First, since previous studies demonstrate that a variety of electro-sensory materials can produce shark deterrent responses [16,21,24], it is hypothesized that C. leucas behavior will be modified by the DC 12V 180N electromagnets when compared to controls. Furthermore, and based on previous studies [15], it was hypothesized that the novel Exclusion barrier system will exhibit enhanced exclusion capabilities (e.g., a decrease in entrance and exit behaviors) in comparison to the Sharksafe barrier. It was further hypothesized that increased intra-specific competition due to higher conspecific density [22,25] may result in differences in C. leucas behavior towards both barrier systems. Furthermore, since context-specific variations in sensory modalities may be directly linked to water visibility, thus altering behavior [25], it was hypothesized that variations in water visibility would alter the barrier’s exclusion capabilities.

2. Materials and Methods

The study was conducted in Bimini, Bahamas in December 2020 and January 2021. The designated study site was adjacent to a food provisioning site for C. leucas and consisted of a sandy substrate that ranged from 1–3 m in depth. Throughout experimentation, researchers noted unique characteristics that were often specific to individual sharks, such as size, sex, presence/absence of a tag, color, presence/absence of fin damage, and presence/absence of scars as a way to quantify individual sharks. This research was conducted under conditions of the assigned Bahamas Department of Marine Resources permit (MAF/FIS/17; MAMR/FIS/17B).

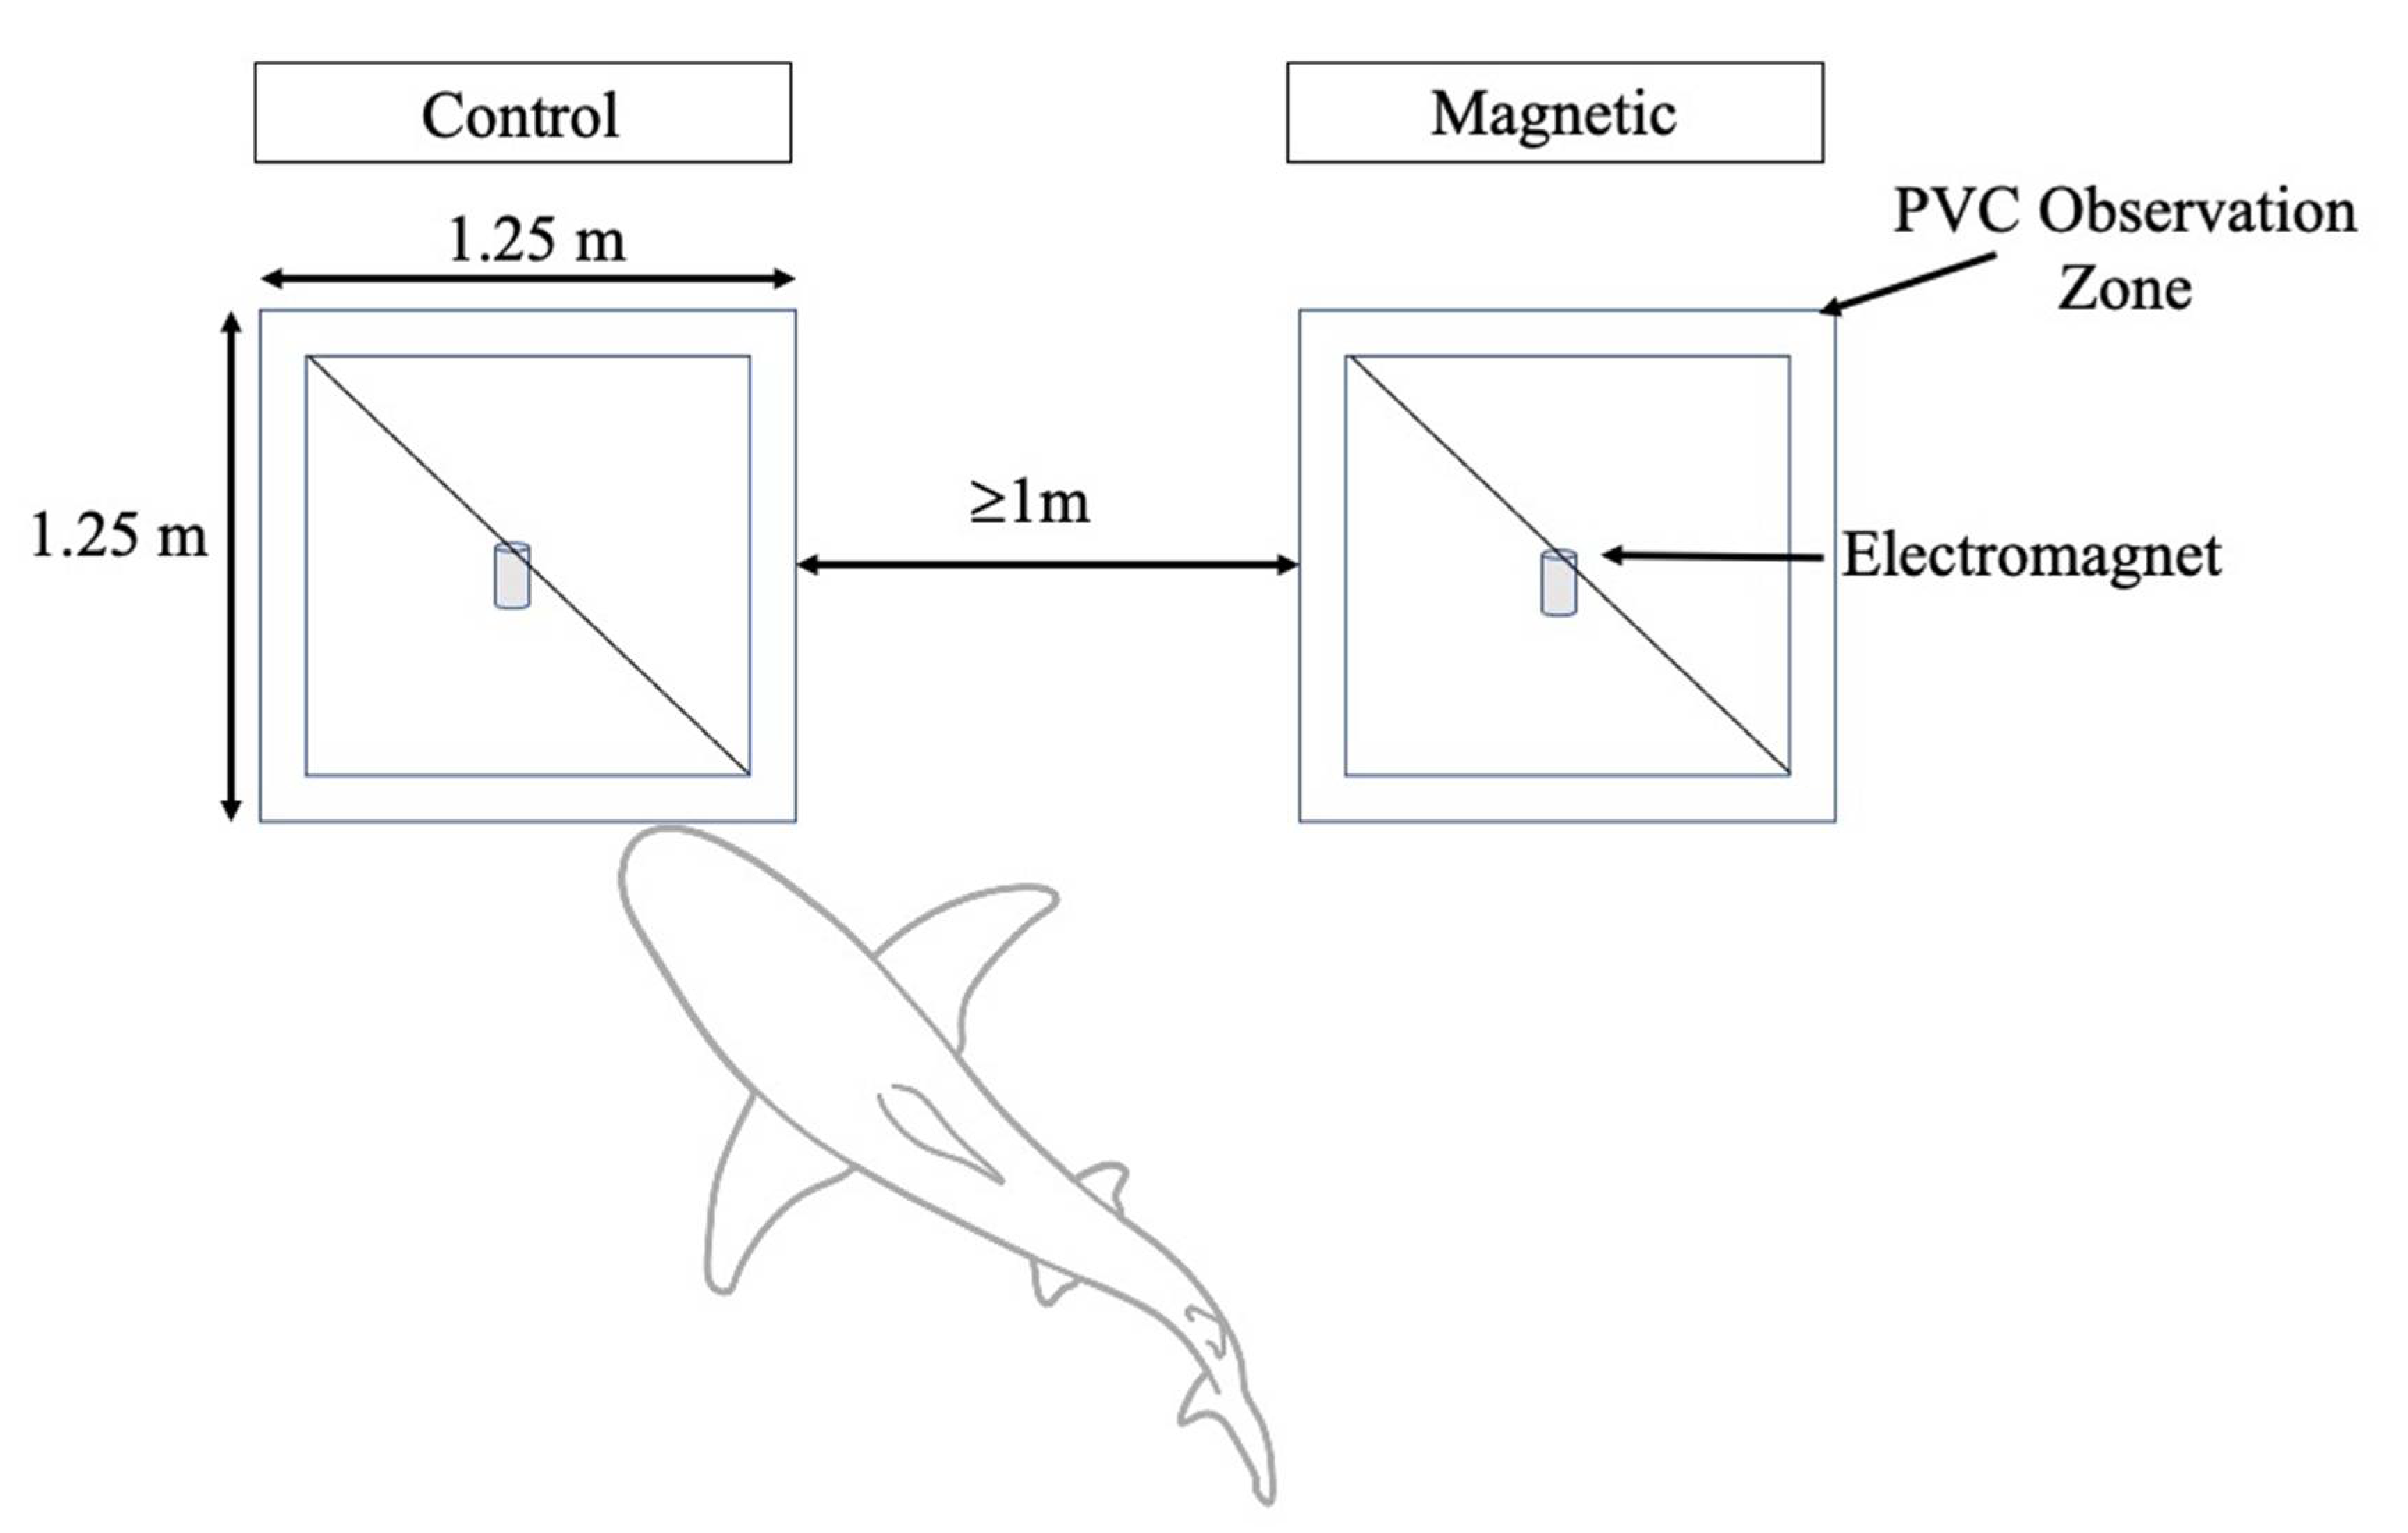
2.1. Bait Experiment

At the study location, two different apparatus were deployed, (1) the control and (2) the magnetic. The control apparatus consisted of a 1.5 m2 observation zone constructed out of polyvinyl chloride (PVC) and a non-activated DC 12V 180N electromagnet placed in the center of the observation zone. The observation zone was used to standardize the location of recordable behaviors [26]. The magnetic apparatus consisted of a 1.5 m2 PVC observation zone in combination with an activated DC 12V 180N electromagnet, powered by a 12V shoreline power source. Identically to the control, the electromagnet was placed in the center of the observation zone. In the center of each observation zone and in combination with the electromagnetic treatments, a clip was used to facilitate the attachment of 0.11 kg of bonito (Sarda sarda), which was used to provide olfactory and gustatory cues to attract C. leucas. Once each apparatus was baited, the treatment arrangement was randomized to eliminate the possibility of side preference-based behavior and both apparatuses were simultaneously deployed. Upon deployment, the apparatus was spaced by a minimum distance of 1 m to ensure the strong magnetic fields (exceeding the ambient magnetic field, 0.25–0.65 G) associated with the magnetic apparatus did not overlap with the control apparatus (Figure 1). Once in position, the following behaviors were recorded: visit, avoidance and feeding (Table 1). If any one of the baits was removed during a trial, the trial was immediately terminated. Each apparatus was then rebaited and a new trial was conducted.

Statistical Analysis

Data were first transformed into behavioral ratios in association with both trial and treatment type (i.e., avoidance frequency = total avoidances per total visits). Since data were not normally distributed, a Wilcoxon signed-rank test was used to determine if any variation in behavioral ratios (i.e., avoidance ratio and feeding ratio) existed with treatment type.

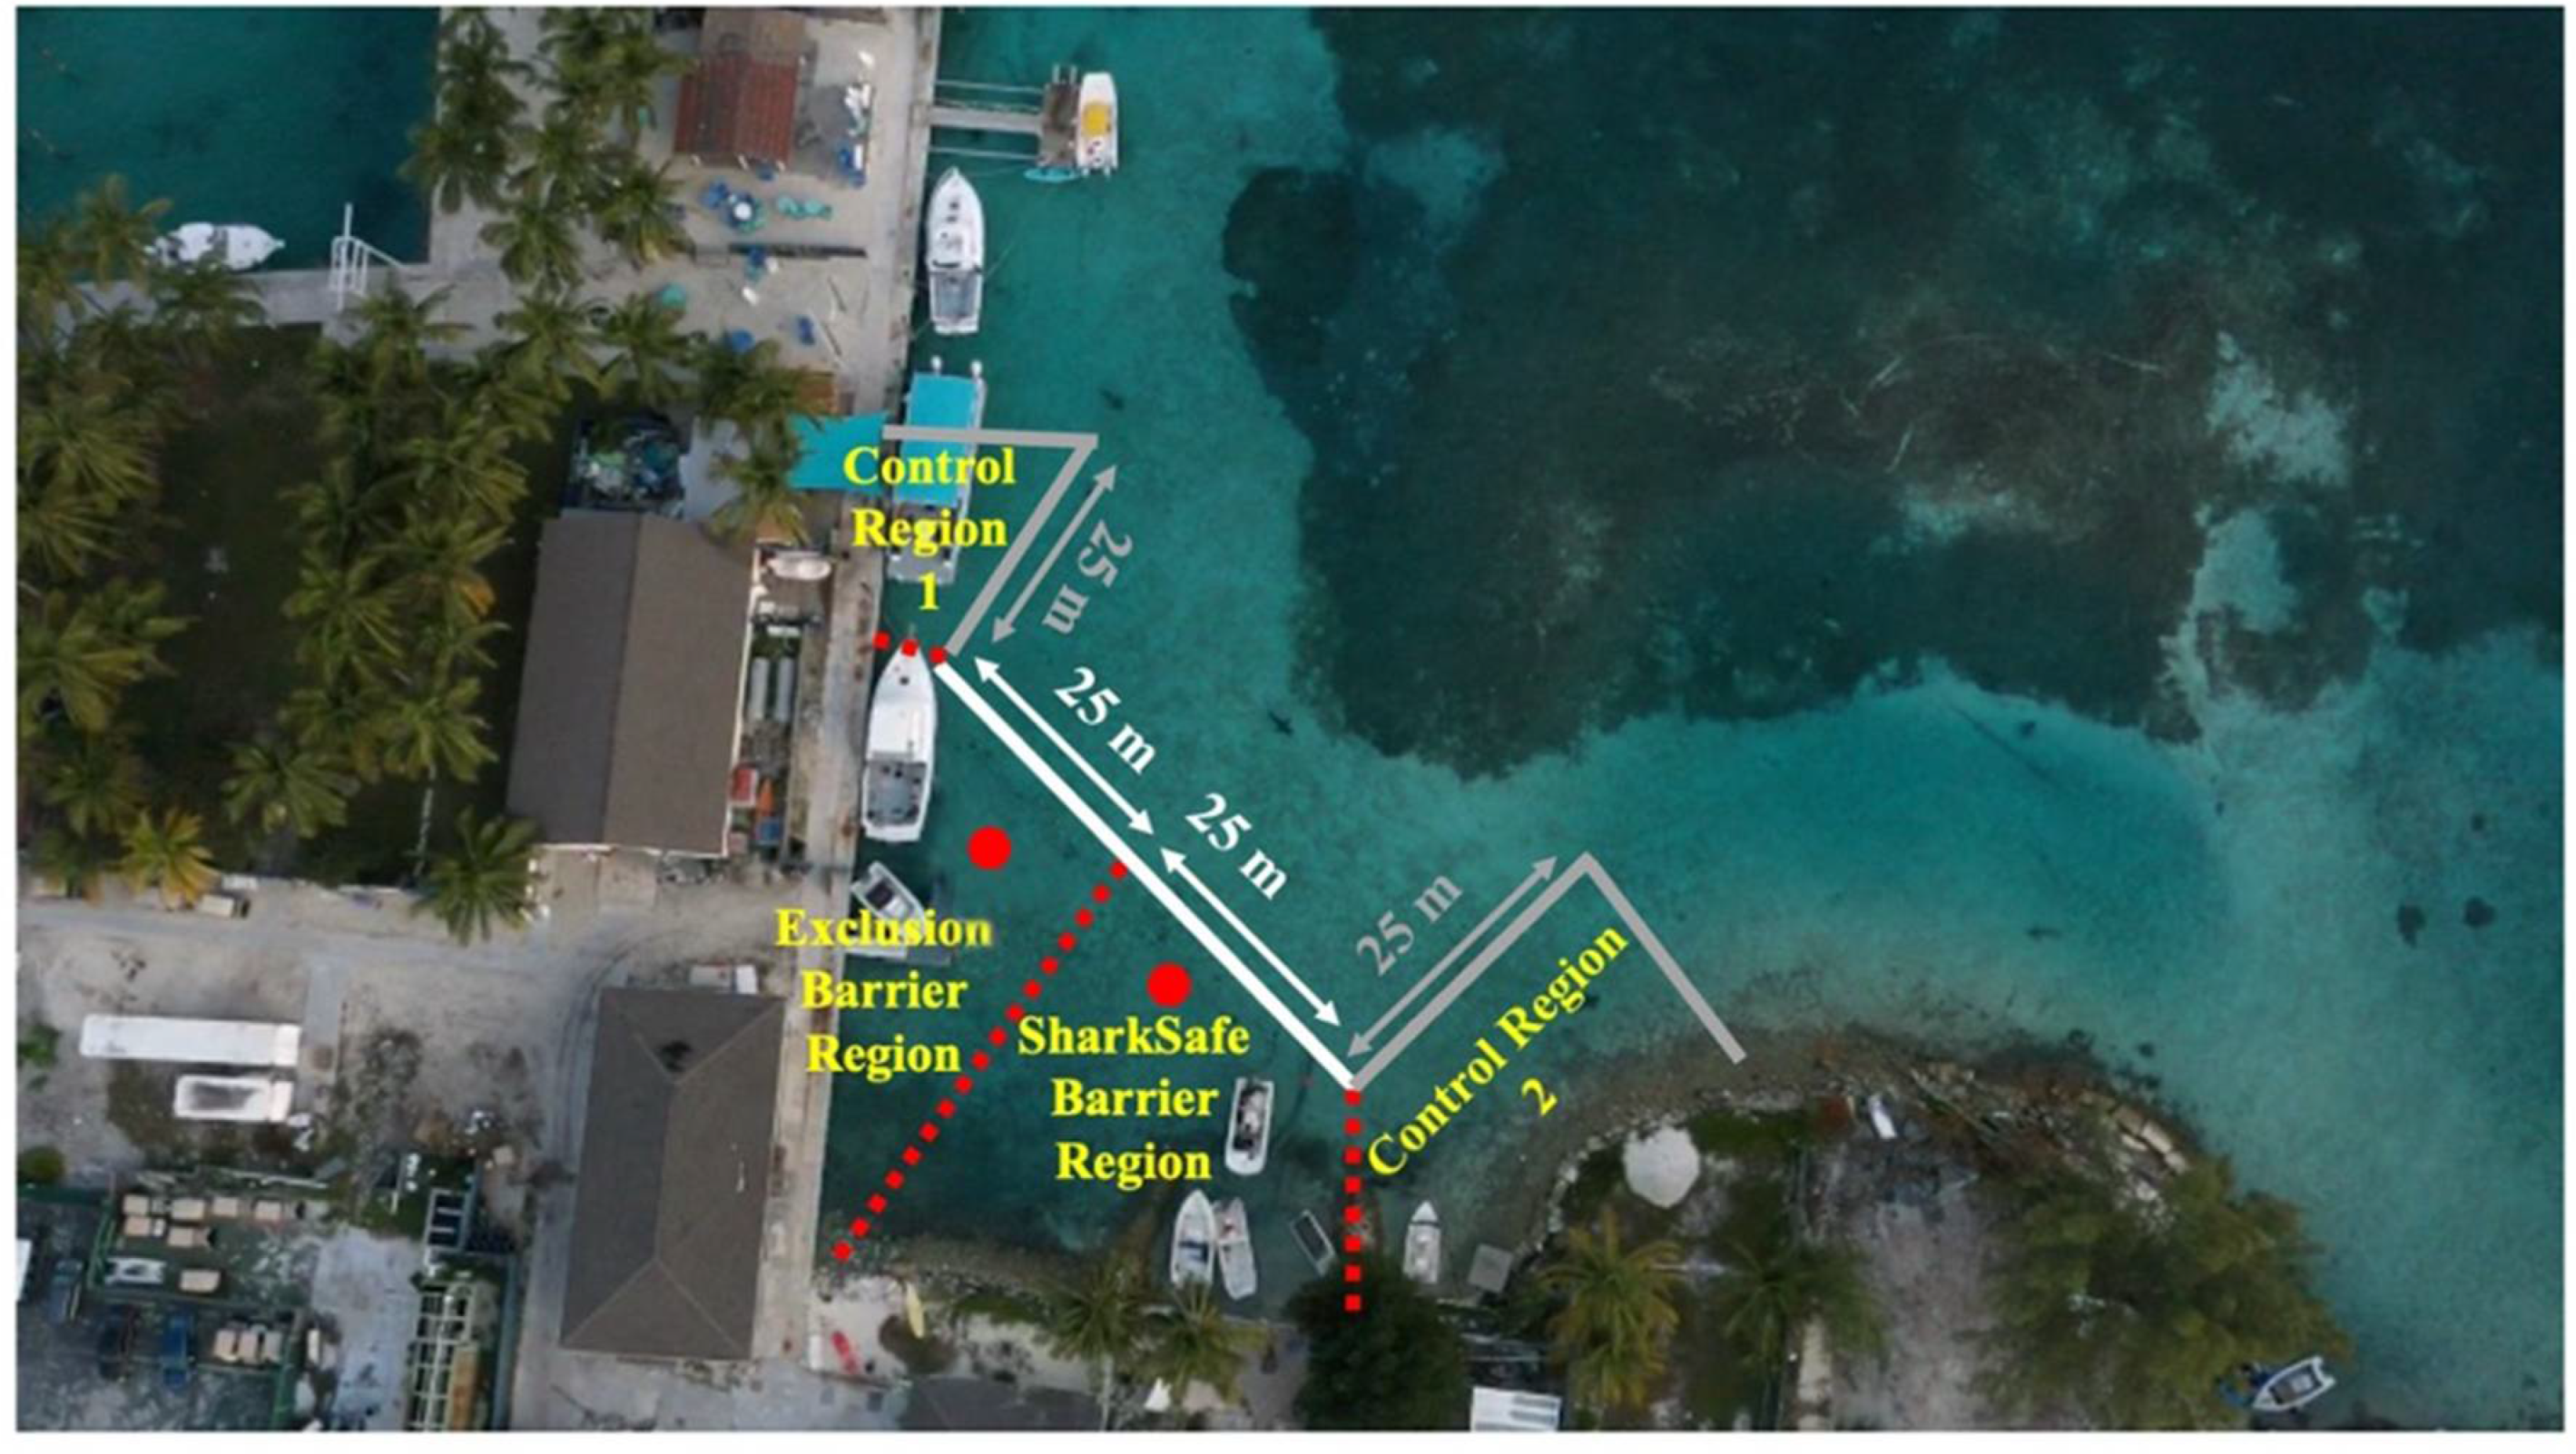
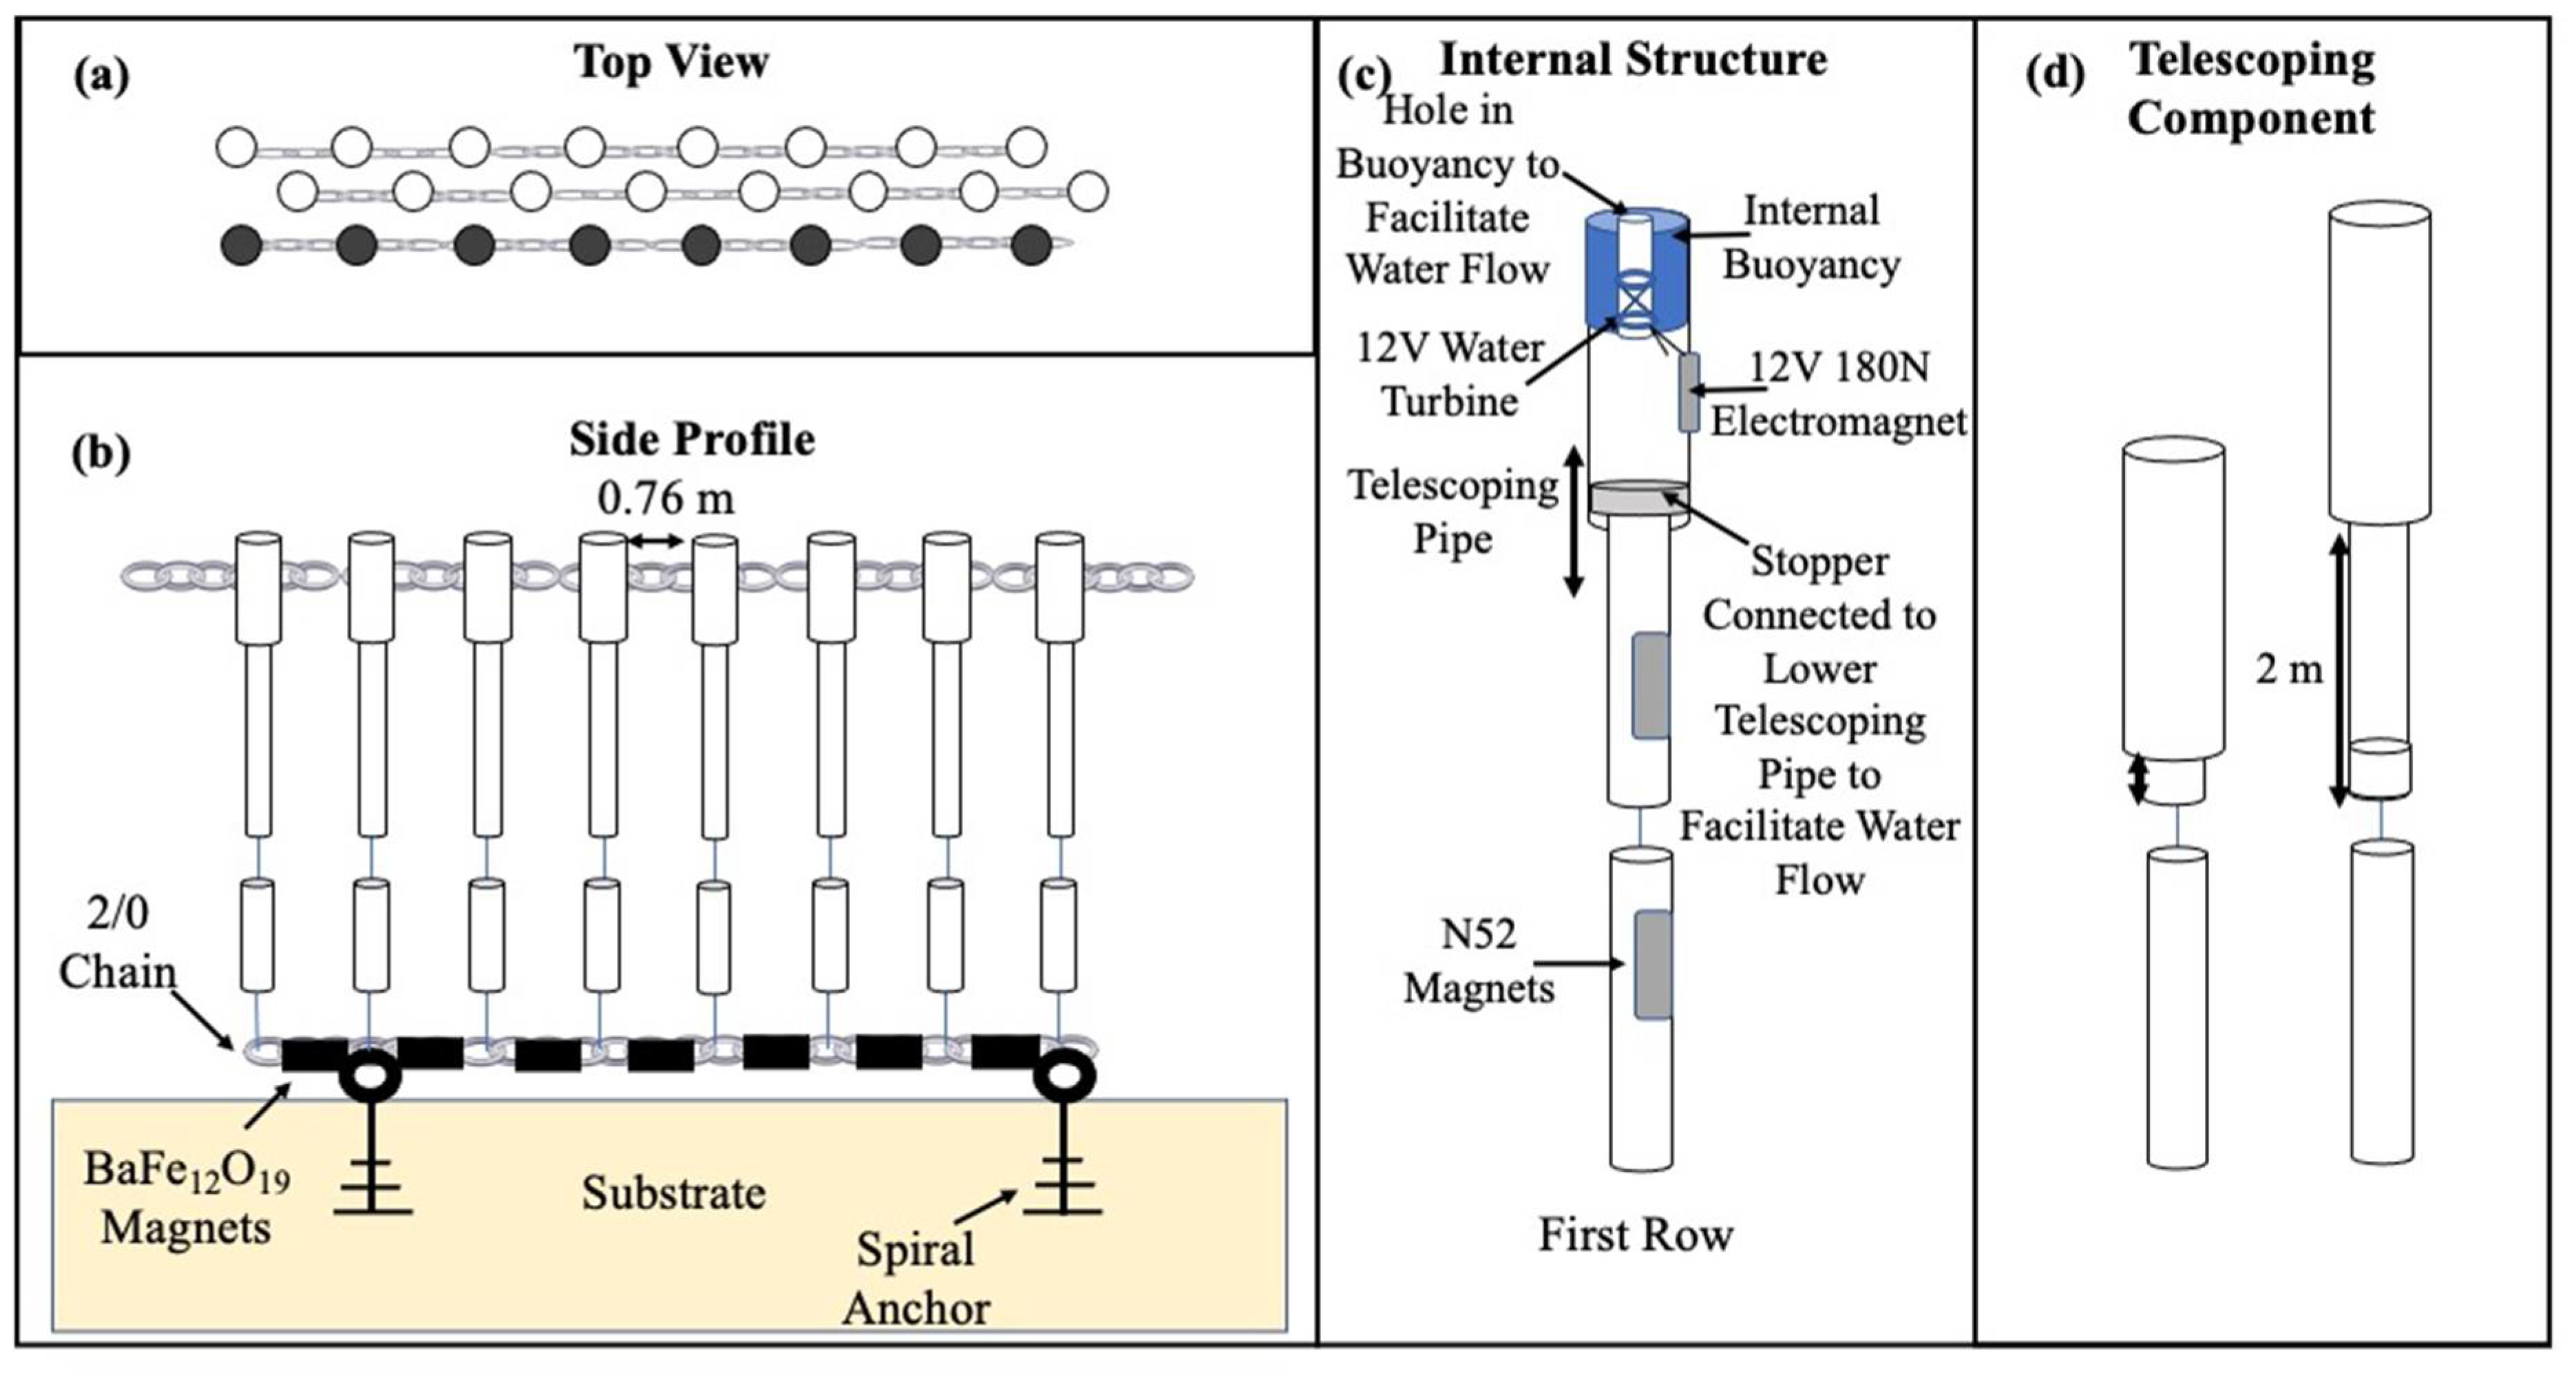
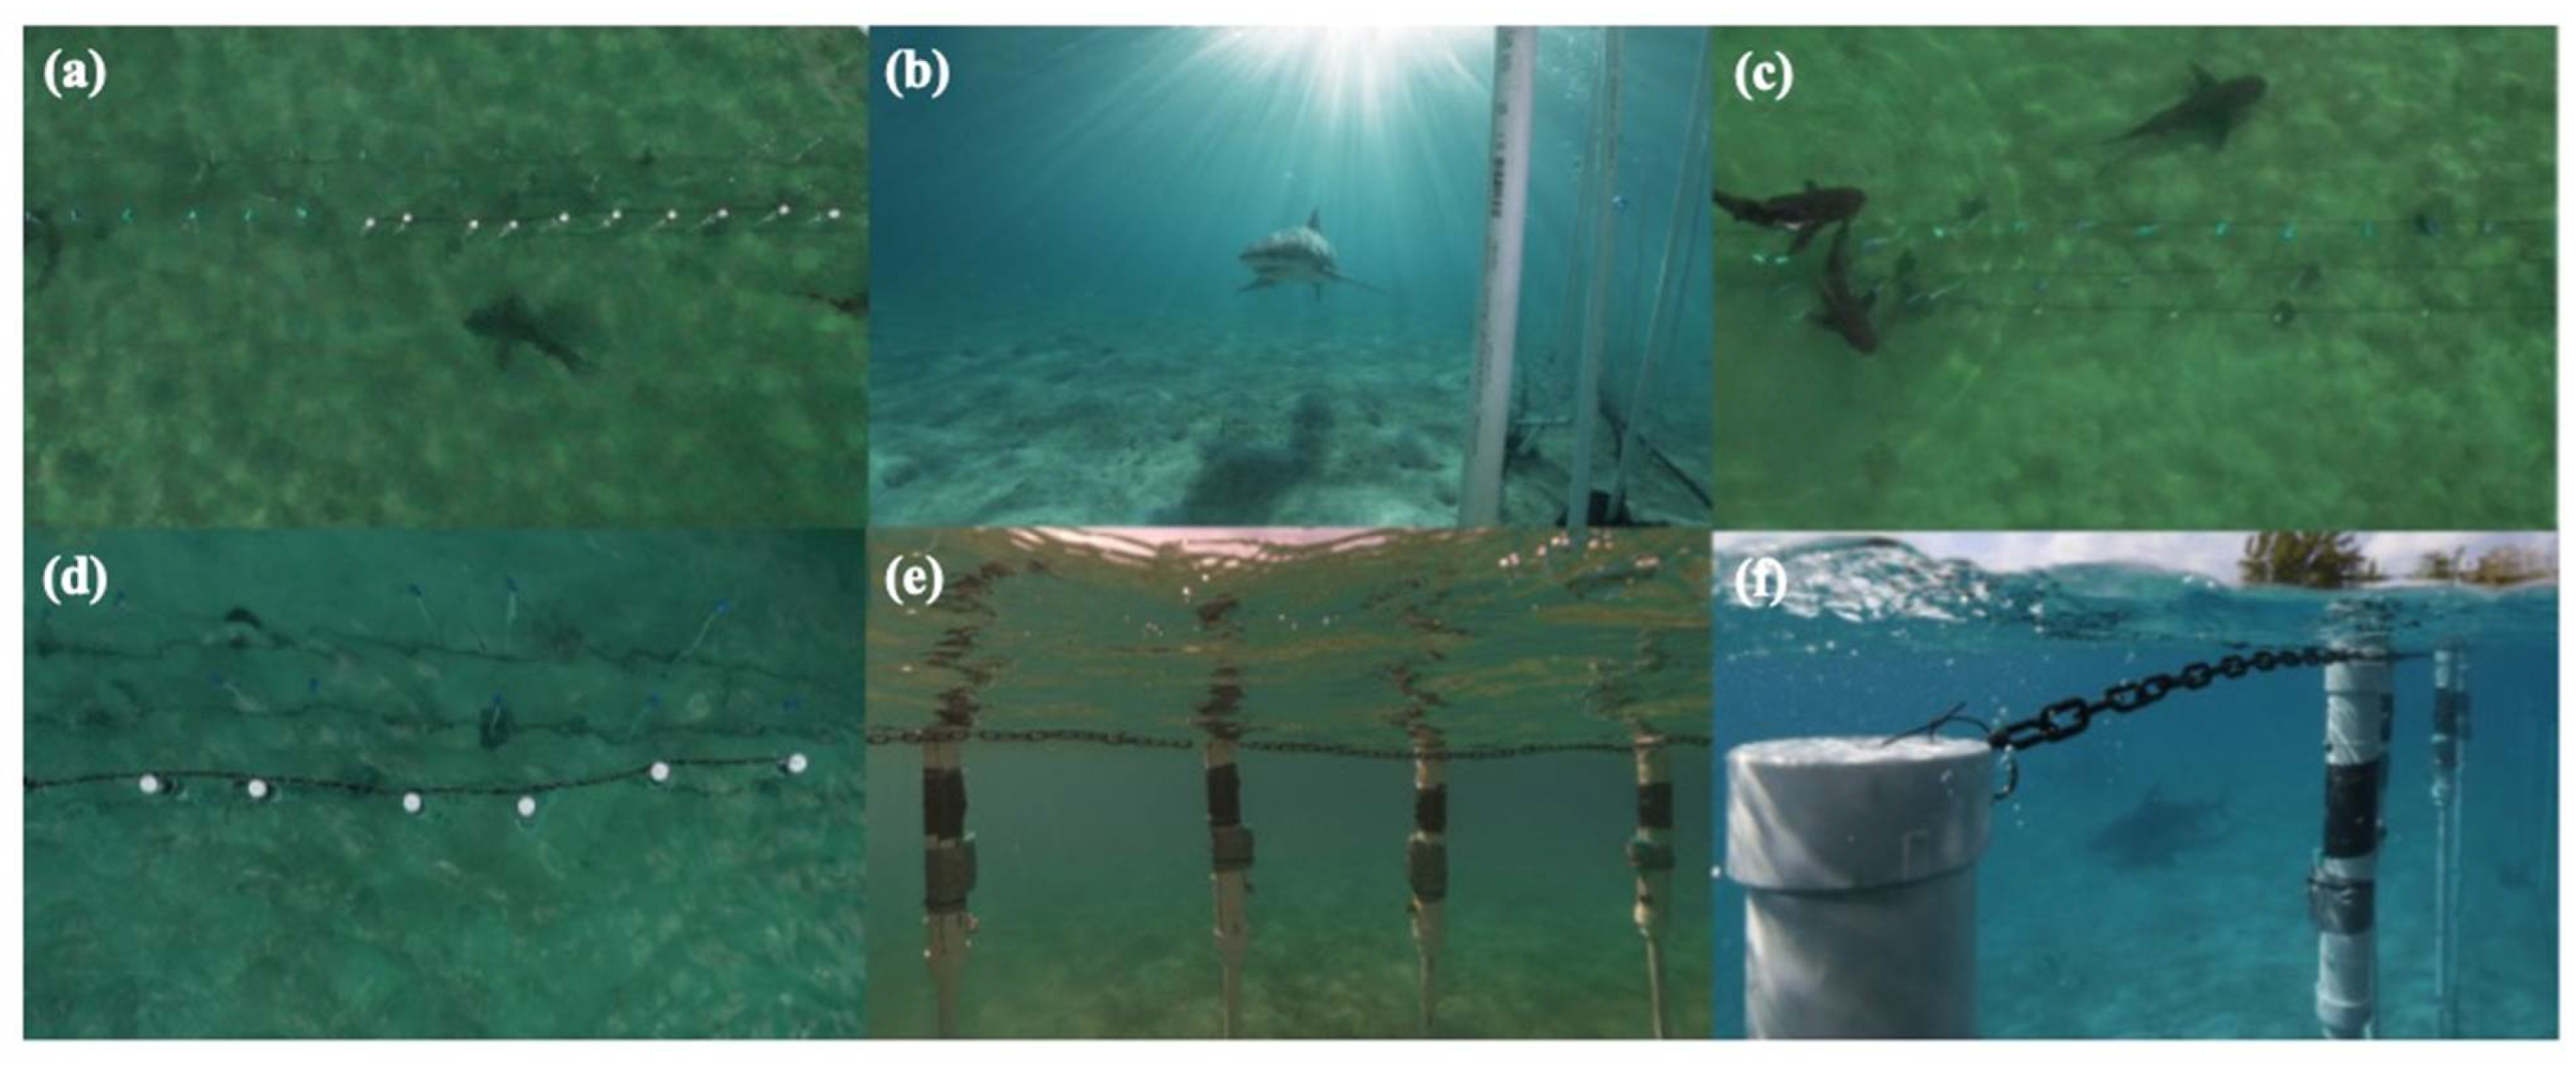
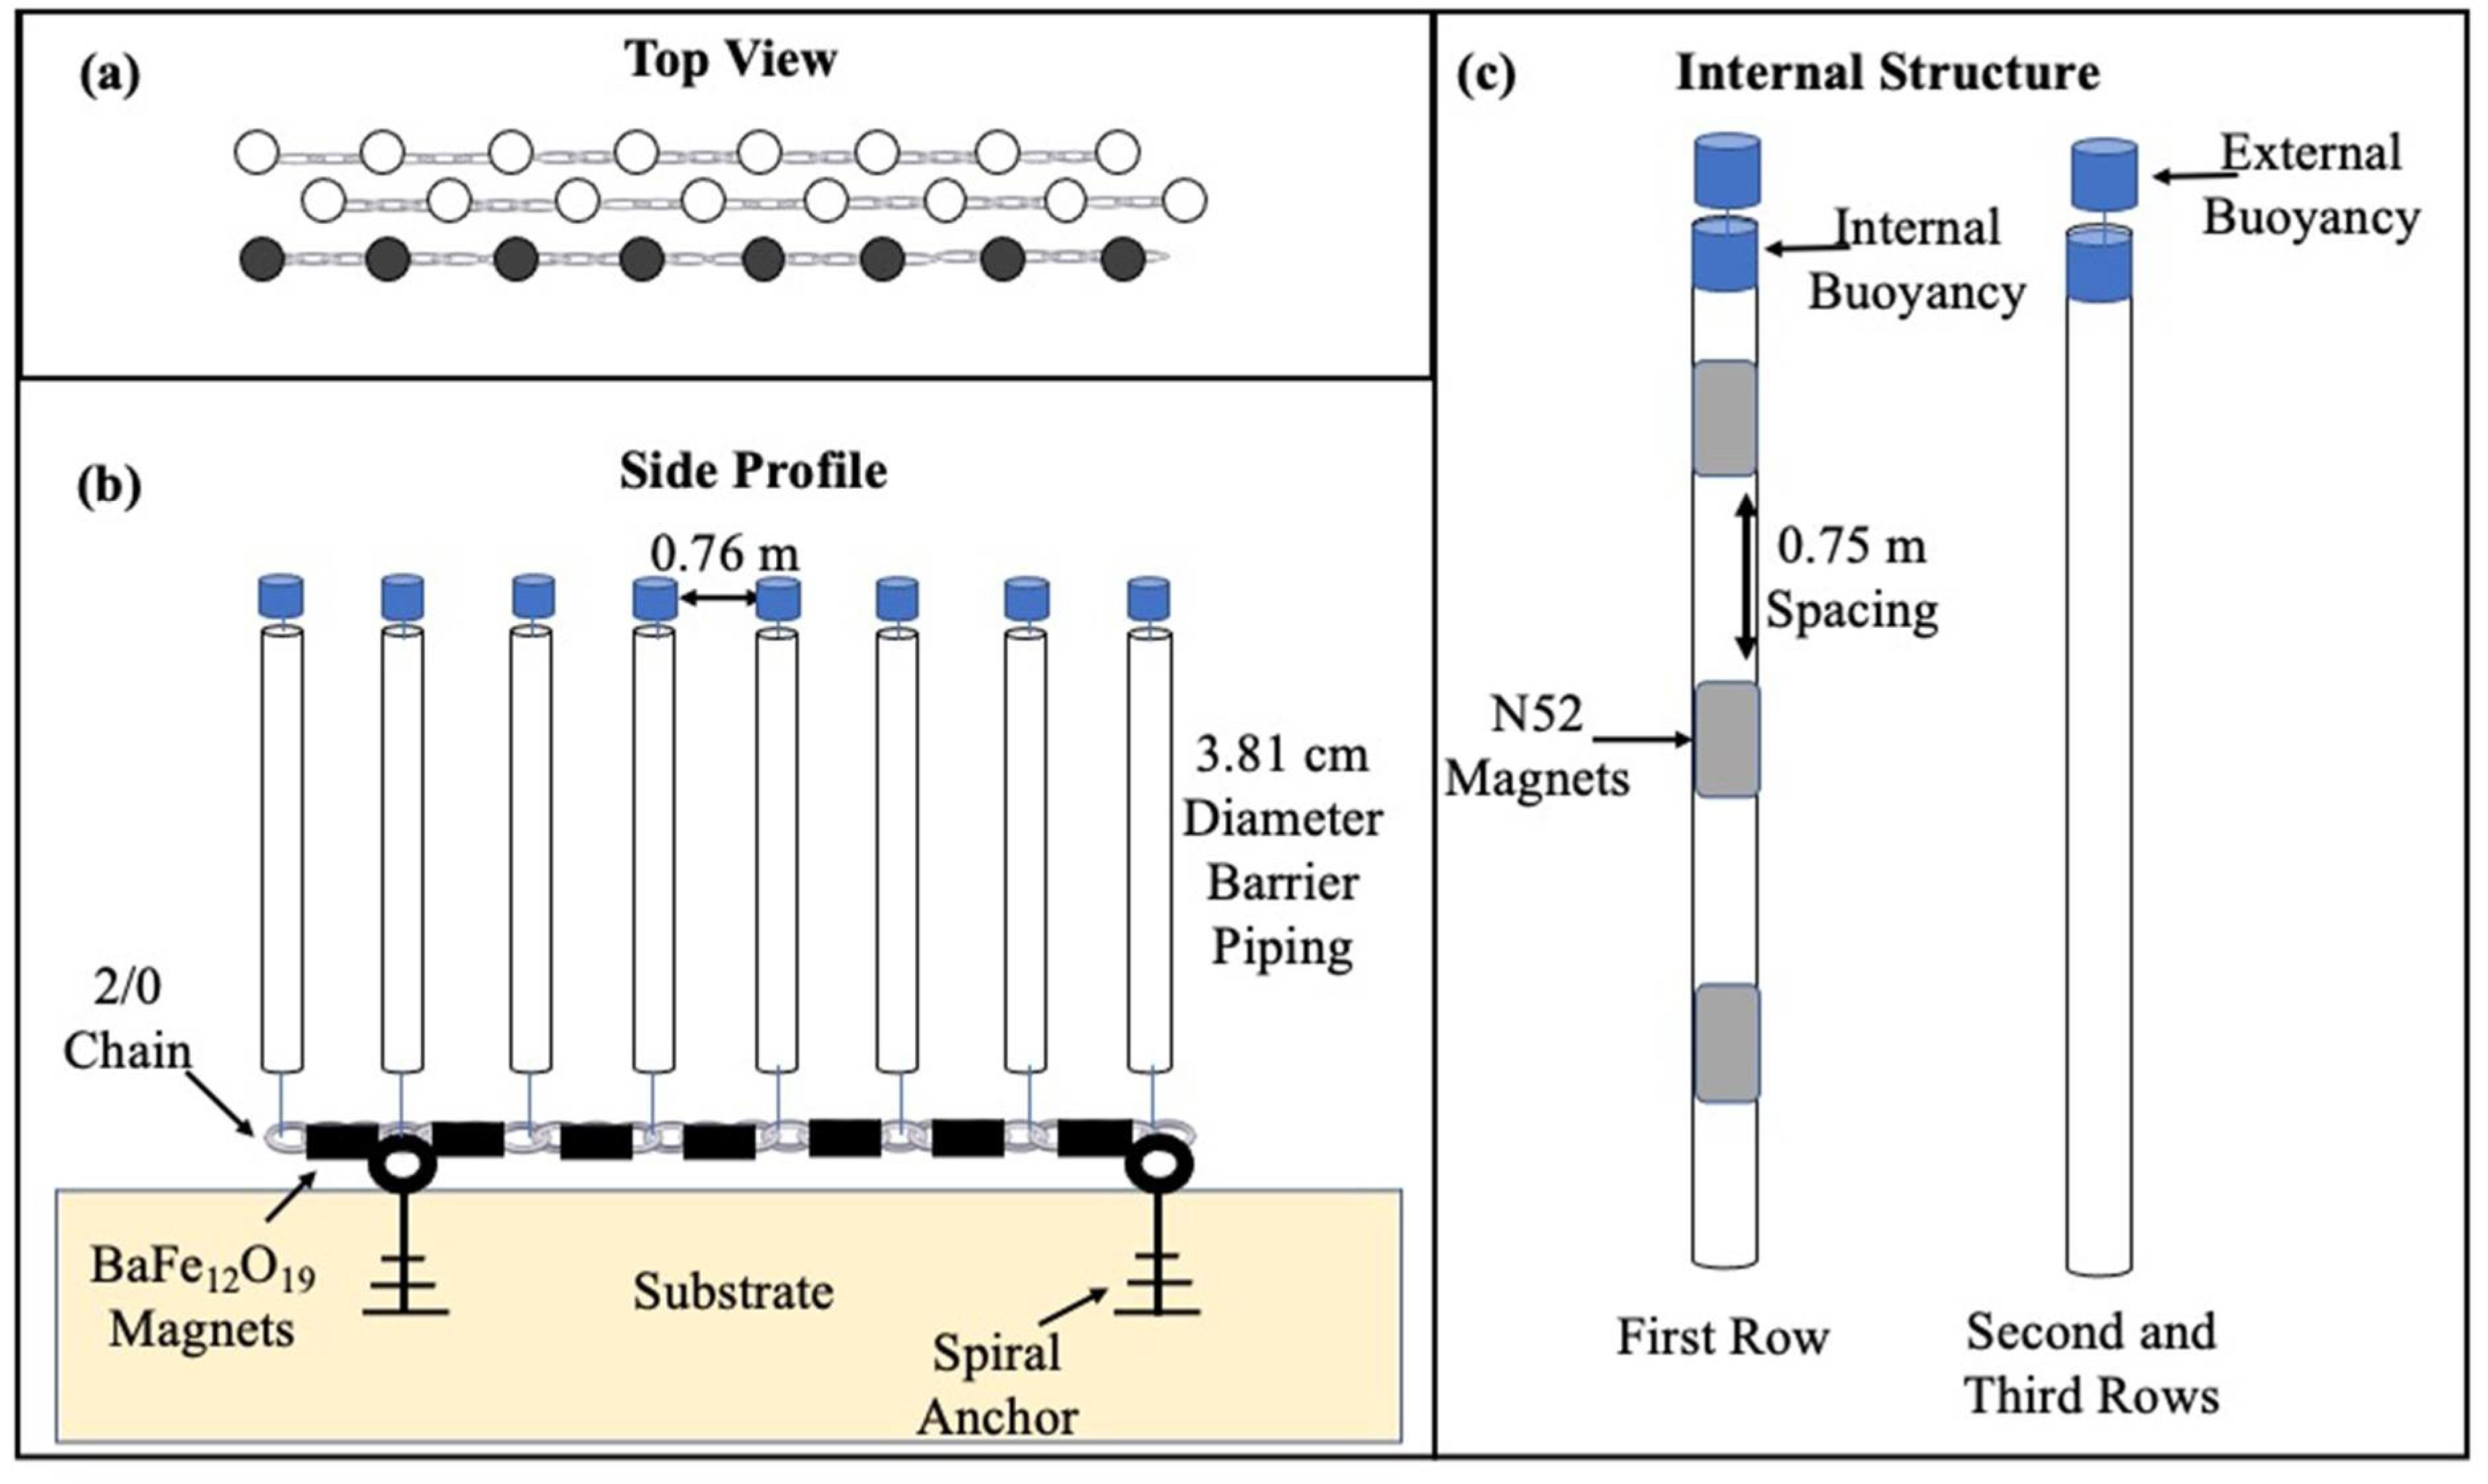
2.2. Barrier Experiment

To deploy the barrier, three, 50-m rows of 2/0 heavy duty link chain were stretched between the adjacent dock and shoreline, which had an approximate protection area of 1116 m2. Each row of chain was separated by approximately 0.3 m. To secure the chain in place, Sealux stainless steel spiral anchors (i.e., 343 mm in length) were positioned every 7 m and connected to the chain using stainless d-shackles. At 0.76 m intervals on each row of chain, one of two types of treatment columns were placed: Sharksafe barrier (e.g., Figure 2 and Figure 3) treatment columns or Exclusion barrier treatment columns (e.g., Figure 2 and Figure 4). More specifically, two equal-sized 25 m long regions were constructed using the first row of heavy duty chains to create two different experimental regions. The Sharksafe barrier region consisted of 32, 1 m–3 m (length) × 3.81 cm diameter PVC piping with internal foam buoyancy to ensure that each pipe was suspended vertically from the seafloor to the sea surface in the water column (Figure 3). These columns, or PVC pipes, contained two-four (quantity based on pipe length) equally-spaced (0.75 m), 3.2 cm × 2.54 cm N52 Neodymium (Nd2Fe14B) disc magnets. Between each pipe within the magnetic region and attached to the link chain, a grade C8 BaFe12O19 permanent magnet (152 mm × 102 mm × 51 mm) was placed. For the Exclusion barrier treatment columns, the design differed. The initial lower section of the column consisted of 32, 0.5 m × 3.81 cm diameter PVC piping and this region was connected to an additional PVC telescoping pipe that telescoped to a maximum of 2 m to ensure the pipes were maintained constant contact with the sea surface. In addition to the telescoping component of the pipe, a strategically placed internal water turbine 12V hydroelectric power generator was connected to a DC 12V 180N electromagnet. With increases in wave energy (e.g., produced by wind or boat wakes), the design of the telescoping component of the barrier funneled water through the water turbine and through the top of a pipe to provide intermittent power to the electromagnet (Figure 4). Furthermore, as a way to both funnel water through the turbine and maximize pipe buoyancy to ensure the telescoping nature of the pipe, high density foam was pre-shaped and fitted throughout the upper region of the pipe. Lastly, to ensure uniformity in pipe separation distance, especially in association with wave activity or when sharks make contact, the upper regions of the telescoping pipes were all interconnected by a 1/0 heavy duty chain. To separate both treatment regions to aid in the categorization of behavioral observations, one pipe with a distinctly colored green float was deployed. In addition to the first row of piping for each experimental region, two subsequent rows were deployed (i.e., Rows 2 and 3) and contained unmanipulated pipes that served as additional visual stimuli to approaching animals. The spacing of these pipes was 0.76 m (Figure 2); however, they were positioned so that the piping alternated with the piping in the first row to maximize the barrier’s visual stimulus. Lastly, to complete the experimental design, two equal-sized control regions (25 m in length) were established on either side of the main barrier. These control regions were unmanipulated areas that were used to make behavioral comparisons. A single pipe was placed at the terminal points of the control regions to aid in the identification of behaviors that could be quantified and used for analysis. It is important to note that while these control regions were found on either side of the experimental barrier treatments (i.e., the Exclusion or Sharksafe Barrier treatments) thus introducing a potential for behavioral bias, previous anecdotal observations and behavioral observations associated with previous studies at this study site [15,26,27] illustrate that sharks are equally as likely to initially approach the experimental barrier treatment regions in comparison to the control regions.
To start experimentation and for each 1-h trial, only one control region was randomly selected for behavioral observations. Once selected, one chum bag was placed in identical locations within the designated experimental regions. These chum bags were filled with approximately 2.27 kg of bait, which consisted of bonito (Sarda sarda) or wahoo (Acanthocybium solandri). Each bag contained equal quantities of each bait type to alleviate the possibility of preference-based behaviors. Additionally, at the start of each trial, 0.91 kg of bait was thrown into each experimental region to maximize olfactory cues. In addition to these olfactory cues, one Mako Magnet (S2 Instruments, North Andover, MA, USA) was introduced to the center of each experimental region to create a low frequency intermittent pulse that served as an additional auditory stimulus to attract sharks. Throughout each 1-h trial, C. leucas behavioral interactions were recorded by one researcher who stood on the adjacent concrete dock and a GoPro Hero 4 1080p camera equipped with a PolarPro polarizing filter that was directed towards the control region to permit simultaneous observations of each experimental region. The behaviors recorded were visits, avoidances, entrances, exits, and pass arounds (see Table 1). Each behavior was aggregated for each trial. Additionally, maximum shark quantity within a given trial (conspecifics) was recorded as either zero sharks (i.e., recorded as ‘1’), one to three sharks (i.e., recorded as ‘2’) and four to ten sharks (i.e., recorded as ‘3’) using topside observation techniques. In addition, horizonal water visibility was measured twice within each given trial with the use of a pole-mounted GoPro Hero 4 1080p camera. Mean water visibility was categorized as either low (i.e., visibility extends up to 7 pipes; ~5.3 m) or high (i.e., visibility extends beyond 7 pipes; >5.3 m).

Statistical Analysis

Data collected throughout the experiment were in the form of frequencies (i.e., counts) for C. leucas. However, these data were multi-dimensional, where the main effects of several variables and interaction terms between these variables were of interest. Therefore, the traditional Chi-square analysis was inefficient in testing hypotheses that involve the multidimensions, and instead, we applied a Poisson generalized linear mixed effect model to data in each category: avoidance, entrance and pass around, respectively. Furthermore, treatment positioning was not randomized on a per-trial basis, and thus C. leucas behaviors were not considered independent since multiple interactions from one individual shark may have occurred within a trial. This may violate the assumption in generalized linear models that data are independent. Thus, we treated the trial as a random effect, because the data were not independent whereas we treated the other variables as fixed effects.
The mathematical form of our generalized linear mixed effect model is:
Y = Xβ + R + ε
Y represents the column vector of the response variable (counts of shark responses), X is the design matrix of explanatory variables, including all possible interaction terms, β is the column vector of coefficients that correspond to explanatory variables, R is the vector of individual trials, which is a random effect, and ε represents the vector of errors, which are assumed to follow a normal (Gaussian) distribution whose mean is zero and whose variance is constant. The fixed effects (i.e., X) were treatment type (discrete), conspecific density (discrete), and water visibility (discrete). The mixed effect model (Equation (1)) was implemented using the ‘lme4′ package of R [28,29]; R 4.0.3 Statistical Program). Forward selection was used to determine the best fit model for the data, starting with a null model, of which subsequent models were created by adding one or several explanatory variables to determine their effect on the response variables (i.e., avoidance frequency, entrance frequency, and pass around frequency). We tested the contribution of an explanatory variable, examining the difference in the log-likelihood [29,30]:
2 · Δ χ 2 Δ par
Δℓ is the difference in the log-likelihood between nested and non-nested models in the forward selection process, and Δpar is the difference in the number of free parameters between two models. Model selection criteria included: Akaike Information Criteria (AIC), and behavior of model residuals using a quantile–quantile (Q–Q) plot, and associated p-values.

3. Results

3.1. Bait Experiment

In January 2020 and January 2021, a total of 100 baited apparatus trials were conducted. Trials lasted a duration of 5–300 s (98.52 ± 76.78 s). These trials were conducted irrespective of the tide, only during good water visibility conditions (e.g., ability to accurately observe sharks) and during periods of daylight (i.e., 9h00–18h00). During these experimental periods, a minimum of seven different C. leucas were identified using short-term identification characteristics and using the 1.5 m2 observation zone as a reference, sharks were estimated to be between 2.3–2.8 m in total length (TL).

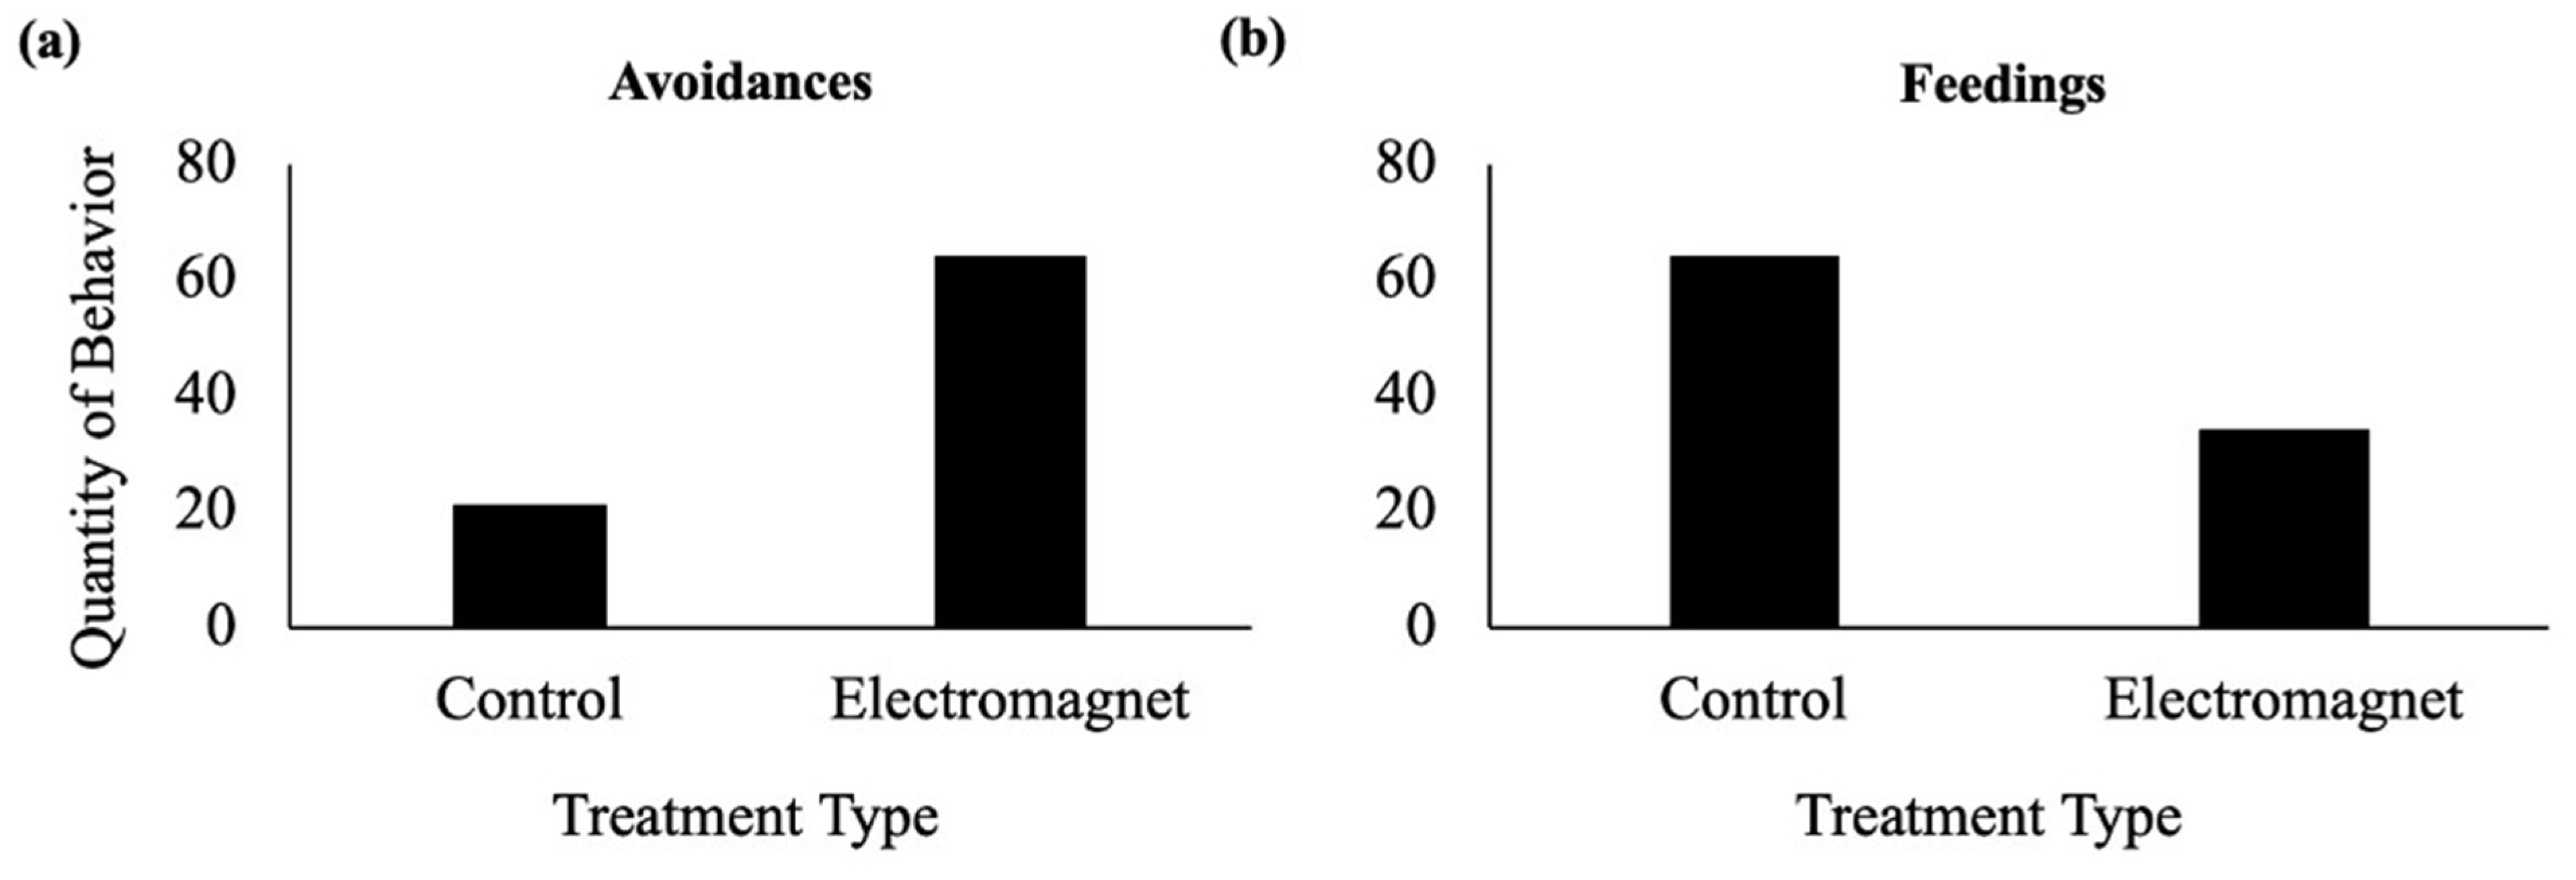
3.1.1. Avoidance Frequency

Avoidance quantity differed between treatment types: Control = 21 and Electromagnet = 64. More specifically, avoidance frequencies (i.e., total avoidances per total visits) were found to be significantly different between control and magnetically-treated baits (Z = −5.86, p < 0.001; Figure 5).

3.1.2. Feeding Frequency

Feeding quantity differed between treatment type: Control = 64 and Electromagnet = 34. Feeding frequencies (i.e., total feedings per total visits) were found to be significantly different between control and magnetically treated baits (Z = −3.04, p = 0.002; Figure 5).

3.2. Barrier Experiment

In January 2021, 27, 1-h barrier comparison trials were conducted. Similar to the bait experiment, these trials were conducted irrespective of the tide, only during good water visibility conditions (e.g., ability to accurately observe sharks) and during periods of daylight (i.e., 9h00–18h00). During this experimental period, eleven different C. leucas were identified using short-term identification characteristics. Using the spacing between barrier piping, sharks were estimated to be between 2.4–2.8 m in total length (TL).

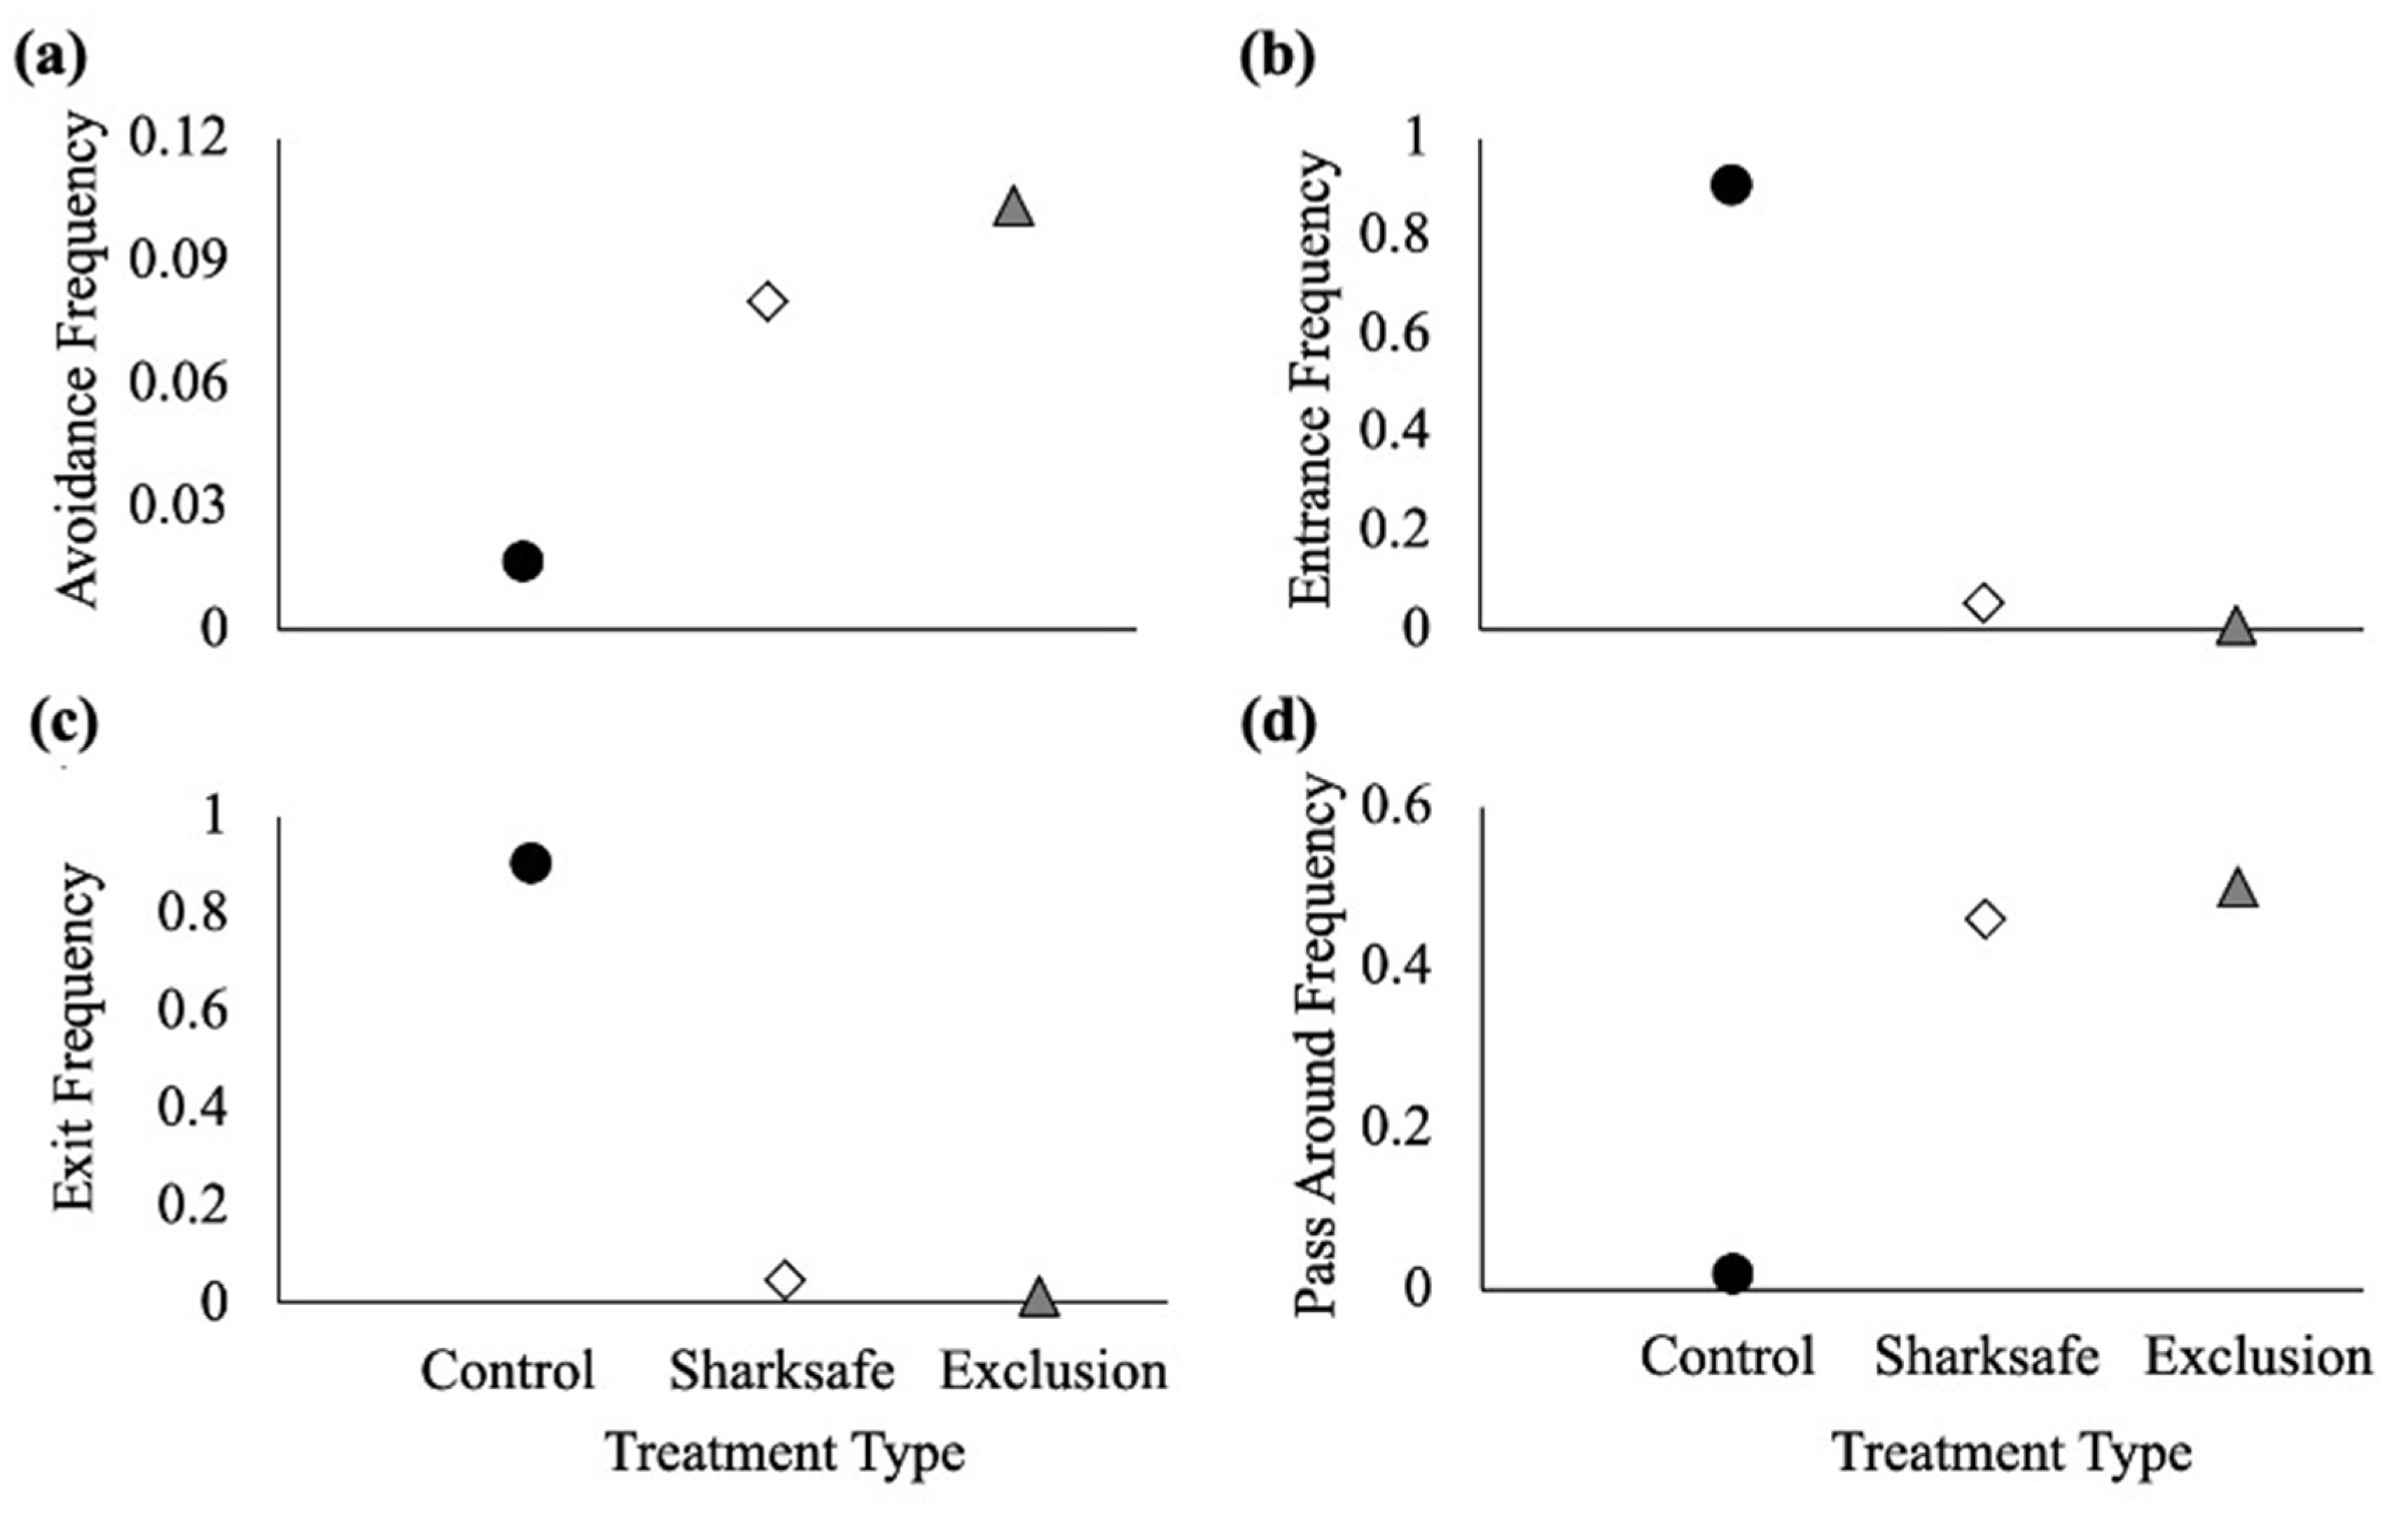
3.2.1. Avoidance Frequency

Avoidance quantity differed between experimental regions (Control = 19; Exclusion barrier = 117; Sharksafe barrier = 96). For avoidance frequency, the best fit model (A2) included the main effect of treatment type (T). This model outperformed all other models and contained a p-value of <0.001 and an AIC of 319.68 (Table 2). The coefficient and associated p-value with the selected model demonstrate that the influence of the exclusion barrier region (p < 0.001) and the Sharksafe barrier regions (p < 0.001) had a significantly positive relationship with C. leucas avoidance frequency in comparison to the control region (Table 3). Based on model coefficients, the exclusion barrier region resulted in a greatest frequency of avoidances, when compared to both the control and Sharksafe barrier regions (Table 3, Figure 6).

3.2.2. Entrance Frequency

Entrance quantity differed between experimental regions (Control = 1053; Exclusion barrier = 7; and Sharksafe barrier = 62). The best fit model (B2) included the main effects of treatment type. Model B2 collectively outperformed all other models and had a p-value of less than 0.001 and an AIC of 281.63 (Table 2). The coefficient and associated p-value with the selected model demonstrate that the influence of the exclusion barrier region (p < 0.001) and the Sharksafe barrier regions (p < 0.001) had a significantly negative relationship with C. leucas entrance frequency in comparison to the control region (Table 3). Based on model coefficients, the Sharksafe barrier region resulted in a greater frequency of entrances, when compared to the Exclusion barrier region (Table 3; Figure 6).

3.2.3. Exit Frequency

Exit quantity differed between experimental regions (Control = 1053; Exclusion barrier = 14; and Sharksafe barrier = 55). The best fit model (C2) included the main effects of the treatment type. Model C2 collectively outperformed all other models and had a p-value of less than 0.001 and an AIC of 294.90 (Table 2). Consistent with the entrance frequency data, the coefficient and associated p-value with the selected model demonstrate that the influence of the exclusion barrier region (p < 0.001) and the Sharksafe barrier regions (p < 0.001) had a significantly negative relationship with C. leucas exit frequency in comparison to the control region (Table 3). Based on model coefficients, the Sharksafe barrier region resulted in a greater frequency of exits, when compared to the Exclusion barrier region (Table 3; Figure 6).

3.2.4. Pass around Frequency

Pass around quantity different between treatment types (Control = 21; Exclusion barrier = 564; and Sharksafe barrier = 552). For pass around frequency, the best fit model (D2) included the main effects of treatment type (T). Model D2 outperformed all other models and contained a p-value of <0.001 and an AIC of 396.76 (Table 2), with both the Exclusion barrier and the Sharksafe barrier regions yielding a significant increase (p < 0.001) in pass around frequency (Table 3; Figure 6). Based on model coefficients, both the Sharksafe barrier and Exclusion barrier regions resulted in a similar pass around frequency.

3.2.5. Descriptive Behaviors

On many occasions, sharks made contact with the first row of piping associated with both barriers and exhibited a 90°–180° turn away (i.e., avoidance behavior). Six of the eleven sharks entered through the Sharksafe barrier at least once (e.g., Figure 7), whereas two of the eleven sharks entered through the Exclusion barrier. Once passing through either barrier region, the sharks exhibited accelerated swim patterns and the barrier section associated with the exit was not always consistent with the entrance section. For example, on thirteen occasions, sharks were observed to enter through the Sharksafe barrier region and were subsequently observed to exit through the Exclusion barrier. Furthermore, on six occasions, sharks were observed to enter through the Exclusion barrier region and subsequently exited through the Sharksafe barrier. Unlike the exit behaviors observed towards the Sharksafe barrier region (i.e., consistent, non-accelerated swim pattern through the associated piping), there were six occasions where sharks swam through the second and third rows of piping of the Exclusion barrier; however, then exhibited a rapid 90°–180° turn away and remained inside the barrier. The duration each shark spent within the barrier regions ranged from 62 s–531 s. Of the entrances, of particular interest was that 50 of the 62 entrances (80.6%) occurred at the surface of the Sharksafe barrier region, whereas sharks penetrated the Exclusion barrier in the middle of the water column (e.g., Figure 7). When swimming through the Exclusion barrier, the pectoral fins of the shark were pulled closer to the body to more efficiently allow the shark to pass through while minimizing contact with the pipes.

4. Discussion

This study aimed to determine if DC 12V 180N electromagnets could produce deterrent responses in C. leucas and whether the newly designed Exclusion barrier could produce enhanced shark exclusion efficacy (i.e., producing increased avoidance behaviors and reduced entrance and exit behaviors). During the bait experiment, trials (n = 100) demonstrated that electromagnets produced deterrent responses in the form of significant and increased avoidance frequencies and decreased feeding frequencies. During the barrier experiment, C. leucas exhibited an increased avoidance frequency and reduced entrance and exit frequencies in relation to the Exclusion barrier; however, pass around frequency was similar between both barrier technologies.

4.1. Basic Behavioural Interactions

4.1.1. Bait Experiment

This study demonstrated that DC 180N 12V electromagnets could produce deterrent responses in C. leucas. These results are consistent with previous studies that demonstrated that various types of permanent and rare-earth magnets can serve as potential shark bycatch reduction devices [21,22,23]. The deterrent responses observed in the present study were consistent with previously observed behavioral responses in that abrupt 90°–180° turns away and fewer feeding behaviors occurred towards the electromagnetically-treated baits. As postulated in previous studies, sharks can detect geomagnetic fields [31,32] and it is hypothesized that this detection occurs through the use of their electrosensory system known as the ampullae of Lorenzini [33,34,35,36]. While the exact mechanism governing magnetic field detection in elasmobranchs is unknown, it is hypothesized that detection occurs through indirect-based magnetoreception through electromagnetic induction. More specifically, electric fields are indirectly generated as an object moves through a magnetic field and thus, these electric fields are detected by the ampullae of Lorenzini [26]. However, it also remains uncertain why permanent magnets and electromagnets are capable of producing deterrent responses in elasmobranchs. The most current explanation is that the geomagnetic field on the Earth’s surface ranges from 0.25 to 0.65 Gauss (G). In comparison, the magnetic flux associated with various types of magnets can exceed 1000 G. It is hypothesized that a much stronger electromotive field will be induced by a permanent magnet and therefore will overstimulate the ampullae of Lorenzini of an approaching elasmobranch, thus producing a repellent response [26].
Deterrence was observed throughout experimentation; however, sharks did feed on electromagnetically-treated baits in 34% of the trials. As demonstrated in previous studies, conspecific density could influence deterrent effectiveness [22,24]. While conspecific density was not included in the statistical analysis for the bait experiment, up to seven different C. leucas were simultaneously interacting with the baits during a given trial. Therefore, while there may be additional variables that may contribute to reduced deterrent effectiveness (e.g., level of satiation—[37], variations in water visibility—[25]), it is plausible to conclude that increasing levels of conspecific density may have led to increasing intraspecific competition and consequently reduced deterrent effectiveness.
Regardless of their effectiveness, it is important to note that the DC 180N 12V electromagnets used in the present study exhibited signs of degradation (e.g., rust) with time submerged. Therefore, should these magnets be used in future studies, they must be waterproofed since routinely replacing them throughout deployment or experimentation would be prohibitively expensive due to their inherent cost.

4.1.2. Barrier Experiment

This comparative experiment demonstrated that the Exclusion barrier exhibited an increased ability to exclude C. leucas from bait when directly compared to control and Sharksafe barrier regions. These findings are promising and it is possible that the interconnectedness of the apex of the Exclusion barrier, in combination with the hydro-powered electromagnets, produced enhanced deterrent capabilities. More specifically, the chain which linked the top of the barrier elements maintained a continuous inter-barrier element spacing during high wave activity or when contact was made by an approaching shark. Due to shark width, connecting the tops of the barrier elements helped create more of a physical barrier to approaching sharks, while still maintaining high flexibility to ensure the barrier could withstand high wave energy. Beyond creating a more continuous visual structure, adding the additional horizontal element (e.g., a chain) increased the probability that sharks could make direct contact with the structure. Considering sharks have been found to have enhanced mechanoreception capabilities [38,39,40,41] and previous studies demonstrate that tactile stimulation may contribute to barrier effectiveness [26], it is possible that this added horizontal component may have increased the probability of shark-barrier contact, thus increasing the likelihood of an avoidance response and consequently, a decreased entrance frequency. However, one concern that may arise from this added feature is animal entanglement. The chain remains highly flexible, and therefore, future iterations of this technology may want to utilize more rigid structures that surround the chain (e.g., rigid high density polyethylene (HDPE) piping) to minimize any potential entanglement with marine life.
In addition, research demonstrates that repeated exposure to an unchanging stimulus could lead to rapid habituation that may inevitably make deterrents less effective [23]; however, variations in pulse and/or frequency can prolong this habituation [42,43]. The Exclusion barrier featured a combination of permanent magnets (i.e., barium ferrite permanent magnets—BaFe12O19) and hydro-powered electromagnets. Although the permanent magnets were affixed to the base of the structure or within the barrier elements, these structures were in constant flux due to varying environmental conditions (e.g., waves and currents). These conditions resulted in the barrier elements and attached permanent magnets constantly changing orientation, which may cause approaching animals to be exposed to varying electromagnetic fields. In addition, the electromagnets were activated in a pulsed manner, rather than a continuous and unchanging stimulus, since the intermittent wave activity stimulated the internal water turbine, which then activated the electromagnet. Therefore, the combination of permanent magnets that constantly changed orientation with pulsing electromagnets may have provided superiority in deterrent capabilities when sharks approached the barrier. However, this does raise concern as a calm day that is void of any surface movement (e.g., waves) or heavy biofouling attributed to continuous deployment and zero maintenance would reduce hydroelectric power and minimize electromagnet efficacy. Although permanents magnets were placed throughout the structure to minimize this issue, the upper component of the barrier elements did not have any permanent magnets and therefore it is possible that this may be a major limitation in this structure. With that in mind, additional devices can be added to or used in replacement of the water turbines to power the electromagnets (e.g., shore-based solar panels paired with capacitors), but the limitations of the structures are unknown until deployed and tested. In addition, while research has been conducted assessing the potential influence of permanent magnetic fields on teleosts [27], little evidence has been presented on how or if strong electromagnetic fields may influence the behavior of other marine organisms (e.g., chelonians and marine mammals). Therefore, studies must be conducted on these species for such a technology to be adopted in replacement to current shark culling methodologies.
Furthermore, in contrast to the Sharksafe barrier, the Exclusion barrier had the added feature of telescoping barrier elements. While not directly measured, this telescoping component may have resulted in increased hydrodynamic flux. In combination with their acute electrosensory system, sharks also have a highly acute mechanosensory lateral line system [44,45]. This system has been demonstrated to aid in navigation, orientation to currents, obstacle avoidance and prey capture [45], with variations in hydrodynamics contributing to the success of this sensory system. Therefore, with the potential elongation of the upper region of the barrier elements, the increased hydrodynamic disturbance may have resulted in increased mechanosensory stimulation and consequently increased deterrent responses.
Lastly, in contrast to previous barrier experiments [19], C. leucas exit frequency was also assessed. More specifically, some sharks were observed to enter through the Sharksafe barrier region and exit through the Exclusion barrier and vice versa. However, of particular interest were the sharks that exhibited the former. While the inner two rows (i.e., Row 2 and Row 3) of both barrier structures are similar in design, the key differences exist in the first row. Therefore, due to the distance between the first and third rows of the barrier (e.g., 0.6 m), the magnetic flux capable of producing deterrent responses (e.g., >100 G) exists between the second and first row of the barrier system. It is possible that sharks that passed through the third and second rows of the system may have committed to passing through the entire structure, resulting in a brief acceleration and a completed exit behavior. However, numerous sharks did make it through rows three and two and then exhibited substantial deterrent behavior (e.g., violent 180° turns) when encountering the first row of the Exclusion barrier. This is suggestive that the deterrent capabilities of this system are not strictly mechanosensory and that the electrosensory stimuli are highly warranted to ensure enhanced deterrent capabilities. Furthermore, while exit behavior may not be directly correlated with assessing deterrent effectiveness, studying this behavior did offer further insight into the differences between each barrier design and what may contribute to overall deterrent effectiveness should future modifications be made.

5. Conclusions

The study demonstrates that the Exclusion barrier exhibits promise as a shark deterrent technology and that the use of ocean energy (e.g., hydropower) to activate DC 12V 180N electromagnets is a plausible approach. With cost-effective modifications (e.g., chain links that interconnected the apex of the barrier), the Exclusion barrier provided superior deterrent efficacy in relation to the Sharksafe barrier. Although deterrent efficacy was not 100%, there is an inherent need for an eco-friendly cost-effective approach to shark-human shoreline coexistence since shark culling/mitigation measures in areas, such as South Africa [46], Australia [47], and Réunion Island [17] persist. Continued research efforts demonstrate the importance of sharks in relation to their respective ecosystems [48,49], and therefore, continued larger-scale research on this novel technology on various potentially dangerous shark species (e.g., white sharks—Carcharodon carcharias; tiger sharks—Galeocerdo cuvier) in varying ecological conditions (e.g., high wave activity and strong currents) is warranted. Lastly, insufficient evidence has been presented on the behavioral effects of permanent and electromagnet shark deterrent technologies on teleost, mammalian, or chelonian species. Therefore, beyond studying the potential influence of the Exclusion Barrier on potentially dangerous shark species, future studies should assess the influence of these deterrents on non-target species (e.g., chelonians and marine mammals) prior to any potential large-scale deployments.

Author Contributions

Conceptualization, C.P.O.; Methodology, C.P.O. and A.K.; Formal Analysis, C.P.O.; Investigation, C.P.O. and A.K.; Data Curation, C.P.O.; Writing—Original Draft Preparation, C.P.O., J.C. and J.G.; Writing—Review & Editing, C.P.O., J.C. and J.G.; Funding Acquisition, C.P.O. All authors have read and agreed to the published version of the manuscript.

Funding

This research received no external funding.

Institutional Review Board Statement

Not applicable.

Data Availability Statement

The data presented in this study are available on request from the corresponding author. The data are not publicly available as they will be used for future analyses.

Acknowledgments

We would like to thank Bimini Big Game Resort and Neal Watson’s Bimini Scuba Center for all of their support for permitting us to use their facilities and/or resources to make this project possible. We would like to thank O’Seas Conservation Foundation, Inc. for allocating funding to ensure the completion of this study. We would like to thank the Bimini Biological Field Station and the late Samuel Gruber for their continued support of this important project. We would like to thank the Bahamas Department of Marine Resources for granting us permission to conduct this research.

Conflicts of Interest

The authors declare no conflict of interest.

References

  1. Forstall, R.L. California: Population of Counties by Decennial Census: 1900 to 1990. United States Bureau. 1995. Available online: http://www.census.gov/population/cencounts/ca190090.txt (accessed on 1 March 2021).
  2. Center for International Earth Science Information Network—CIESIN—Columbia University; United Nations Food and Agriculture Programme—FAO and Centro Internacional de Agricultura Tropical—CIAT; NASA Socioeconomic Data and Applications Center. Coastal Zone Population Method: Percentage of total Population Living in Coastal Areas. 2007. Available online: http://sedac.ciesin.columbia.edu/es/papers/Coastal_Zone_Pop_Method.pdf (accessed on 1 March 2021).
  3. Midway, S.R.; Wagner, T.; Burgess, G.H. Trends in global shark attacks. PLoS ONE 2019, 14, e0211049. [Google Scholar] [CrossRef] [PubMed]
  4. Government of Western Australia. New Measures to Combat WA Shark Risks. 2014. Available online: http://www.fish.wa.gov.au/Pages/news_archive/New-measures-to-combat-WA-shark-risks.aspx (accessed on 1 March 2021).
  5. Neff, C. Australian Beach Safety and the Politics of Shark Attacks. Coast. Manag. 2012, 40, 88–106. [Google Scholar] [CrossRef]
  6. NSW Department of Primary Industries. SMART Drumlines. 2017. Available online: http://www.dpi.nsw.gov.au/fishing/sharks/shark-management/smart-drumlines (accessed on 1 March 2021).
  7. Dudley, S.F. A comparison of the shark control programs of New South Wales and Queensland (Australia) and KwaZulu-Natal (South Africa). Ocean Coast. Manag. 1997, 34, 1–27. [Google Scholar] [CrossRef]
  8. Wetherbee, B.M.; Lowe, C.G.; Crow, G.L. A review of shark control in Hawaii with recommendations for future research. Pac. Sci. 1994, 48, 95–115. [Google Scholar]
  9. Dudley, S.F.J.; Cliff, G. Some effects of shark nets in the Natal nearshore environment. Environ. Biol. Fish 1993, 36, 243–255. [Google Scholar] [CrossRef]
  10. Atkins, S.; Cliff, G.; Pillay, N. Humpback dolphin bycatch in the shark nets in KwaZulu-Natal, South Africa. Biol. Conserv. 2013, 159, 442–449. [Google Scholar] [CrossRef]
  11. Burkholder, D.A.; Heithaus, M.R.; Fourqurean, J.W.; Wirsing, A.; Dill, L.M. Patterns of top-down control in a seagrass ecosystem: Could a roving apex predator induce a behaviour-mediated trophic cascade? J. Anim. Ecol. 2013, 82, 1192–1202. [Google Scholar] [CrossRef]
  12. Ferretti, F.; Worm, B.; Britten, G.L.; Heithaus, M.R.; Lotze, H.K. Patterns and ecosystem consequences of shark declines in the ocean. Ecol. Lett. 2010, 13, 1055–1071. [Google Scholar] [CrossRef]
  13. Ruppert, J.L.W.; Travers, M.J.; Smith, L.L.; Fortin, M.-J.; Meekan, M. Caught in the middle: Combines impacts of shark removal and coral loss on the fish communities of coral reefs. PLoS ONE 2013, 8, e74648. [Google Scholar] [CrossRef]
  14. Kock, A.; Titley, S.; Petersen, W.; Sikweyiya, M.; Tsotsobe, S.; Colenbrander, D.; Gold, H.; Oelofse, G. A Pioneering Shark Safety Program in Cape Town, South Africa. In Global Perspectives on the Biology and Life History of the White Shark; CRC Press: Boca Raton, FL, USA, 2012; pp. 447–465. [Google Scholar]
  15. O’Connell, C.P.; Gressle, J.; Crews, J.; King, A.A.; He, P. Evaluating the effects of a SharkSafe Barrier TM shoreline deployment on bull shark (Carcharhinus leucas) behaviour. Aquat. Conserv. 2022, 32, 55–65. [Google Scholar] [CrossRef]
  16. Huveneers, C.; Rogers, P.J.; Semmens, J.; Beckmann, C.; Kock, A.A.; Page, B.; Goldsworthy, S.D. Effects of the Shark ShieldTM electric deterrent on the behaviour of white sharks (Carcharodon carcharias). In Final Report to SafeWork South Australia, Version 2; SARDI Publication No. F2012/000123-1. SARDI Research Report Series No. 632; South Australian Research and Development Institute (Aquatic Sciences): Adelaide, Australia, 2012; p. 66. [Google Scholar]
  17. Guyomard, D.; Perry, C.; Tournoux, P.U.; Cliff, G.; Peddemors, V.; Jaquemet, S. An innovative fishing gear to enhance the release of non-target species in coastal shark-control programs: The SMART (shark management alert in real-time) drumline. Fish. Res. 2019, 216, 6–17. [Google Scholar] [CrossRef]
  18. McPhee, D.P. Likely Effectiveness of Netting or Other Capture Programs as a Shark Hazard Mitigation Strategy under Western Australian Conditions; Department of Fisheries: Perth, WA, Australia, 2012.
  19. O’Connell, C.P.; Andreotti, S.; Rutzen, M.; Matthee, C.A.; Meyer, M.; He, P. Effects of the Sharksafe barrier on white shark (Carcharodon carcharias) behavior and its implications for future conservation technologies. J. Exp. Mar. Biol. Ecol. 2014, 460, 37–46. [Google Scholar] [CrossRef]
  20. Davison, A.; Kock, A. Fish Hoek exclusion net evaluation report. Shark Spotter Rep. 2014. Available online: https://sharkspotters.org.za/wp-content/uploads/2016/10/FINAL-Exclusion-net-report-24-06-14.pdf (accessed on 1 March 2021).
  21. Rigg, D.P.; Peverell, S.C.; Hearndon, M.; Seymour, J.E. Do elasmobranch reactions to magnetic fields in water show promise for bycatch mitigation? Mar. Freshw. Res. 2009, 60, 942–948. [Google Scholar] [CrossRef]
  22. Robbins, W.D.; Peddemors, V.M.; Kennelly, S.J. Assessment of permanent magnets and electropositive metals to reduce the line-based capture of Galapagos sharks, Carcharhinus galapagensis. Fish. Res. 2011, 109, 100–106. [Google Scholar] [CrossRef]
  23. O’Connell, C.P.; Gruber, S.H.; Abel, D.C.; Stroud, E.M.; Rice, P.H. The responses of juvenile lemon sharks, Negaprion brevirostris, to a magnetic barrier. Ocean Coast. Manag. 2011, 54, 225–230. [Google Scholar] [CrossRef]
  24. Brill, R.; Bushnell, P.; Smith, L.; Speaks, C.; Sundaram, R.; Stroud, E.; Wang, J. The repulsive and feeding deterrent effects of electropositive metals on juvenile sandbar sharks (Cacharhiuns plumbeus). Fish. Bull. 2009, 107, 298–307. [Google Scholar]
  25. O’Connell, C.P.; Guttridge, T.L.; Finger, J.S.; Gruber, S.H.; He, P. Behavioral modification of visually deprived lemon sharks (Negaprion brevirostris) toward magnetic fields. J. Exp. Mar. Biol. Ecol. 2013, 453, 131–137. [Google Scholar] [CrossRef]
  26. O’Connell, C.P.; Hyun, S.-Y.; Rillahan, C.B.; He, P. Bull shark (Carcharhinus leucas) exclusion properties of the Sharksafe barrier and behavioral validation using the ARIS sonar technology. Globl. Ecol. Conserv. 2014, 2, 300–314. [Google Scholar] [CrossRef] [Green Version]
  27. O’Connell, C.P.; He, P. A large-scale field analysis examining the effect of magnetically treated baits and barriers on teleost and elasmobranch behavior. Ocean Coast. Manag. 2014, 96, 130–137. [Google Scholar] [CrossRef]
  28. Bates, D.; Maechler, M.; Bolker, B. Lme4: Linear Mixed-Effects Models Using S4 Classes; R Package, 2012. Available online: http://lme4.r-forge.r-project.org (accessed on 1 March 2021).
  29. Hyun, S.-Y.; Cadrin, S.X.; Roman, S. Fixed and mixed effect models for fishery data on depth distribution of Georges Bank yellowtail flounder. Fish. Res. 2014, 157, 180–186. [Google Scholar] [CrossRef]
  30. Faraway, J.J. Extending the Linear Model with R: Generalized Linear, Mixed Effects and Nonparametric Regression Models; Chapman & Hall/CRC: Boca Raton, FL, USA, 2006.
  31. Keller, B.A.; Putman, N.F.; Grubbs, R.D.; Portnoy, D.S.; Murphy, T.P. Map-like use of Earth’s magnetic field in sharks. Curr. Biol. 2021, 31, 2881–2886. [Google Scholar] [CrossRef]
  32. Meyer, C.G.; Holland, K.N.; Papastamatiou, Y.P. Sharks can detect changes in the geomagnetic field. J. R. Soc. Interface 2004, 2, 129–130. [Google Scholar] [CrossRef] [Green Version]
  33. Kalmijn, A.J. Biophysics of geomagnetic field detection. IEEE Trans. Magn. 1981, 17, 1113–1124. [Google Scholar] [CrossRef]
  34. Kalmijn, A.J. Electric and magnetic field detection in elasmobranch fishes. Science 1982, 218, 916–918. [Google Scholar] [CrossRef]
  35. Kalmijn, A.J. Theory of electromagnetic orientation: A further analysis. In Comparative Physiology of Sensory Systems; Cambridge Univesity Press: Cambridge, UK, 1984; pp. 25–560. [Google Scholar]
  36. Klimley, A.P. Highly directional swimming by scalloped hammerhead sharks, Sphyrna lewini, and subsurface irradiance, temperature, bathymetry, and geomagnetic field. Mar. Biol. 1993, 117, 1–22. [Google Scholar] [CrossRef]
  37. Tallack, S.M.; Mandelman, J.W. Do rare-earth metals deter spiny dogfish? A feasibility study on the use of electropositive “mischmetal” to reduce the bycatch of Squalus acanthias by hook gear in the Gulf of Maine. ICES J. Mar. Sci. 2011, 66, 315–322. [Google Scholar] [CrossRef] [Green Version]
  38. Boord, R.L.; Campbell, C.B.G. Structural and Functional Organization of the lateral line system of sharks. Am. Zool. 1977, 17, 442–449. [Google Scholar] [CrossRef]
  39. Roberts, B.L. Mechanoreceptors and the behavior of elasmobranch fishes with special reference to the acoustic-lateralis system. In Sensory Biology of Sharks, Skates, and Rays; Office of Naval Research: Arlington, VA, USA, 1978; pp. 331–390. [Google Scholar]
  40. Kasumyan, A.O. The lateral line in fish: Stricture, function and role in behaviour. J. Ichthyol. 2003, 43, S175–S203. [Google Scholar]
  41. Maruska, K.; Tricas, T. Test of the mechanotactile hypothesis: Neuromast morphology and response dynamics of mechanosensory lateral line primary afferents in the stingray. J. Exp. Biol. 2004, 207, 3463–3476. [Google Scholar] [CrossRef] [PubMed] [Green Version]
  42. Myrberg, A.A.; Banner, A.; Richard, J.D. Shark attraction using a video-acoustic system. Mar. Biol. 1969, 2, 264–276. [Google Scholar] [CrossRef]
  43. Myrberg, A.A.; Gordan, C.R.; Klimley, A.P. Rapid withdrawal from a sound source by open-ocean sharks. J. Acoust. Soc. 1978, 64, 1289–1297. [Google Scholar] [CrossRef]
  44. Maruska, K.P. Morphology of the Mechansensory Lateral Line System in Elasmobranch Fishes: Ecological and Behavioral Considerations. Environ. Biol. Fishes 2001, 60, 47–75. [Google Scholar] [CrossRef]
  45. Gardiner, J.M.; Atema, J. Flow Sensing in Sharks: Lateral Line Contributions to Navigation and Prey Capture. In Flow Sensing in Air and Water: Behavioral, Neural, and Engineering Princples of Operation; Springer: New York, NY, USA, 2014; pp. 127–146. [Google Scholar]
  46. Brazier, W.; Nel, R.; Cliff, G.; Dudley, S. Impact of protective shark nets on sea turtles in KwaZulu-Natal, South Africa, 1981–2008. Afri. J. Mar. Sci. 2012, 34, 49–257. [Google Scholar] [CrossRef]
  47. Reid, D.D.; Robbins, W.D.; Peddemors, V.M. Decadal trends in shark catches and effort from the New South Wales, Australia, Shark Meshing Program 1950–2010. Mar. Freshw. Res. 2011, 62, 676–693. [Google Scholar] [CrossRef]
  48. Bornatowski, H.; Navia, A.F.; Braga, R.R.; Abilhoa, V.; Corrêa, M.F.M. Ecological importance of sharks and rays in a structural foodweb analysis in southern Brazil. ICES J. Mar. Sci. 2014, 71, 1586–1592. [Google Scholar] [CrossRef] [Green Version]
  49. Roff, G.; Doropoulos, C.; Rogers, A.; Bozec, Y.-M.; Krueck, N.C.; Aurellado, E.; Priest, M.; Birrell, C.; Mumby, P.J. The ecological role of sharks on coral reefs. Trends Ecol. Evol. 2016, 31, 395–407. [Google Scholar] [CrossRef] [PubMed]
Figure 1. Aerial drawing of the experimental setup for the bait experiment. This experiment consisted of two, 1.5 m2 observation zones, one associated with each treatment: the control and the magnetic. The control consisted of a non-activated DC 12V 180N electromagnet placed in the center of the observation zone. The magnetic contained an activated DC 12V 180N electromagnet, powered by a 12V shoreline power source. In the center of each observation zone and in combination with the electromagnetic treatments, a clip was used to facilitate the attachment of 0.11 kg of bonito (Sarda sarda; not included in the figure).
Jmse 10 00634 g001
Figure 2. Aerial view of the barrier experimental setup in Bimini, Bahamas. This experiment consisted of four experimental regions: two control regions, one Sharksafe barrier region, and one Exclusion barrier region. Each region was 25 m in length. During experimentation, the bull shark (Carcharhinus leucas) behaviors were compared between the Exclusion barrier, the Sharksafe barrier and only one of the control regions. The control region used for each one-hour trial was randomly selected. The red circles represent approximate bait (bonito [Sarda sarda] or wahoo [Acanthocybium solandri]) deployment locations.
Jmse 10 00634 g002
Figure 3. Sharksafe barrier experimental setup. (a) Top view. The barrier was composed of three, 25 m long alternating rows of barrier piping. The outer row consisted of piping equipped with equally spaced 3.2 cm × 2.54 cm N52 Neodymium (Nd2Fe14B) disc magnets (i.e., black circles), whereas the two inner rows of piping contained unmanipulated piping (i.e., white circles). (b) Side profile of the outer row of piping. Pipes were 1 to 3 m long and 3.81 cm in diameter and were separated by 0.76 m. Pipes were connected to the seafloor using a flexible heavy duty 2/0 chain. Located between adjacent pipes and along the chain was a 15.2 cm × 10.2 cm × 5.1 cm grade C8 BaFe12O19 permanent magnet. The chain was secured to the seafloor by Sealux stainless steel spiral anchors. (c) The internal structure of the first (outer) row and remaining rows of the barrier structure. Inside the polyvinyl chloride (PVC) piping of the outer row were N52 Neodymium magnets that were spaced at 0.75 m intervals. A section of foam was placed at the apex of the pipe (internally and externally) to provide floatation. The second and third rows of PVC piping were unmanipulated and only contained the high-density foam to maximize pipe buoyancy.
Jmse 10 00634 g003
Figure 4. Exclusion barrier experimental setup. (a) Top view. The barrier was composed of three, 25 m long alternating rows of barrier piping. The outer row consisted of piping equipped with equally spaced 3.2 cm × 2.54 cm N52 Neodymium (Nd2Fe14B) disc magnets (i.e., black circles), whereas the two inner rows of piping contained unmanipulated piping (i.e., white circles). (b) Side profile of the outer row of piping. Pipes were 2 m long when contracted and an inner telescoping unit allowed for the pipes to be a maximum of 3 m long. Pipes were separated by 0.76 m and were connected to the seafloor using a flexible heavy duty 2/0 chain. To facilitate the technology’s semi-net-like appearance, flexible heavy duty 1/0 chain was attached to the apex of each barrier unit. Located between adjacent pipes and along the chain was a 15.2 cm × 10.2 cm × 5.1 cm grade C8 BaFe12O19 permanent magnet. The chain was secured to the seafloor by Sealux stainless steel spiral anchors. (c) Internal structure of the first (outer) row and remaining rows of the barrier structure. Inside the polyvinyl chloride (PVC) piping of the outer row was one DC 12V 180N electromagnet that was directly connected to one 12V hydroelectric power generator. A stopper was attached to the apex of the lower unit of the telescoping pipe to force water flow through the top of the barrier unit. With the hydroelectric power generator positioned within the high-density buoyancy foam at the top of the barrier element, this maximized water flow through the device and maximized the voltage produced during heavy sea conditions (e.g., waves that exceed 0.25 m). The second and third rows of PVC piping were unmanipulated and only contained the high-density foam to maximize pipe buoyancy. (d) View of the telescoping component associated with each barrier unit. This component of the barrier allowed for an additional 2 m extension of each barrier unit to aid with tidal fluctuations.
Jmse 10 00634 g004
Figure 5. The total quantity of bull shark (Carcharhinus leucas) behaviors towards the inactivated electromagnet (i.e., control) and the activated electromagnet during the bait experiment. (a) Avoidance behaviors and (b) feeding behaviors.
Jmse 10 00634 g005
Figure 6. Results from the best fit models for bull shark (Carcharhinus leucas) behavior (total quantity of behavior per total visits). (a) Avoidance frequency in relation to treatment type. (b) Entrance frequency in relation to treatment type. (c) Exit frequency in relation to treatment type. (d) Pass around frequency in relation to treatment type.
Jmse 10 00634 g006
Figure 7. Photographs of the comparative barrier experiment. (a) An aerial view where a bull shark (Carcharhinus leucas) approaches the Exclusion barrier (i.e., white pipes) and another swims through the Sharksafe barrier (i.e., pipes with green/blue floats on surface). (b) A bull shark passes by the Sharksafe barrier. (c) Multiple bull sharks approach the Sharksafe barrier, with one entering through at the surface. (d) An aerial view of a section of the Exclusion barrier, with the first row being characterized by the large white pipes, whereas the subsequent rows (i.e., Row 2 and 3) are characterized by the smaller pipes. (e) A side profile of four pipes associated with the Exclusion barrier. (f) A bull shark passing by the Exclusion barrier.
Jmse 10 00634 g007
Table 1. Behavioral ethogram. This table describes the bull shark (Carcharhinus leucas)-associated behaviors for both bait and barrier experiments.
BehaviorDefinition of Behavior
Bait Experiment Behaviors
VisitShark swam within one body length of an observation zone
AvoidancesShark abruptly changed direction, such as a sudden turn and/or acceleration away, after visiting the observation zone
FeedingShark was observed to bite or remove bait from apparatus
Barrier Experiment Behaviors
VisitShark swam within one body length of an observation zone
AvoidancesShark abruptly changed direction, such as a 45°, 90°, or 180° turn and/or acceleration away, after visiting an observation zone
EntrancesShark visited an observation zone and swam through the PVC pipes
ExitsShark entered an observation zone and swam back out through the PVC pipes
Pass AroundsA visit followed by a shark swimming adjacent to an entire experimental region, but not avoiding or entering through the treatment region
Table 2. Statistical results from the mixed effect models on bull shark (Carcharchinus leucas) behavior. Trial (R) is treated as a random effect. Others are treated as fixed effects: Treat (treatment), Con (conspecific density), and Vis (water visibility). Selected models for avoidance, entrance, exit, and pass around frequencies were A2, B2, C2, and D2, respectively, based on a combination of Akaike Information Criteria (AIC), and behavior of the residuals of a model using a quantile–quantile (Q–Q) plot, and associated P-values. Significant models for main effects (p ≤ 0.05) and interaction terms (p ≤ 0.1) are in bold. Abbreviations: 1 = y-axis intercept, Δl = change in log likelihood value between former model and model being considered, ΔPAR = change in degrees of freedom between former model and model being considered, P-value = the level of significance of the explanatory variable added, AIC = Akaike Information Criterion (2 x (log likelihood) + 2 x number of parameters), a model selection criterion.
ModelLog Likelihood−2(Δl) DevianceΔPARp-ValueAIC
Avoidance Frequency
A1Null−198.91---401.82
A21+Treat−155.84553.662<0.001319.68
A31+Con−197.28595.1020.19402.56
A41+Vis−198.11595.9310.21402.22
A51+Treat+Con−154.44466.1220.25320.88
A61+Treat+Vis−155.07466.7510.22320.15
A71+Treat+Con+Treat x Con−150.41459.2940.10320.83
A81+Treat+Vis+Treat x Vis−154.62464.7620.63323.23
Entrance Frequency
B1Null−1086.78 2177.57
B21+Treat−136.822310.382<0.001281.63
B31+Con−1086.003259.6120.482180.10
B41+Vis−1086.603260.1710.552179.20
B51+Treat+Con−136.40410.0420.66284.81
B61+Treat+Vis−136.75410.3810.72283.50
B71+Treat+Con+Treat x Con−132.77405.5840.12285.54
B81+Treat+Vis+Treat x Vis−136.31409.8120.64286.61
Exit Frequency
C1Null−1081.69 2167.40
C21+Treat−143.452306.832<0.001294.90
C31+Con−1081.003244.3320.482169.90
C41+Vis−1081.503244.8910.552169.00
C51+Treat+Con−143.03429.9320.66298.06
C61+Treat+Vis−143.38430.2810.71296.76
C71+Treat+Con+Treat x Con−139.09425.1440.10298.18
C81+Treat+Vis+Treat x Vis−142.42429.1920.38298.84
Pass Around Frequency
D1Null−567.04 1138.08
D21+Treat−194.381328.462<0.001396.76
D31+Con−567.041701.1220.9941142.10
D41+Vis−565.881699.9610.131137.80
D51+Treat+Con−194.31583.0620.93400.61
D61+Treat+Vis−193.46582.2110.17396.91
D71+Treat+Con+Treat x Con−193.30581.9140.73406.60
D81+Treat+Vis+Treat x Vis−193.05579.9720.67400.11
Table 3. Coefficients, standard errors, t statistic and p-values of explanatory variables for best models A2, B2, C2, and D2 for avoidance, entrance, exit and pass around frequencies, respectively, for the bull shark (Carcharhinus leucas) in relation to the barrier regions.
Explanatory VariableCoefficientStandard Errortp-Value
Avoidance Frequency
Intercept−4.180.25−16.99<0.001
Exclusion Barrier1.850.247.53<0.001
SharkSafe Barrier1.590.256.40<0.001
Entrance Frequency
Intercept−0.100.03−3.280.001
Exclusion Barrier−4.290.27−15.95<0.001
Sharksafe Barrier−2.980.14−21.57<0.001
Exit Frequency
Intercept−0.100.03−3.280.001
Exclusion Barrier−4.980.38−13.14<0.001
Sharksafe Barrier−2.860.13−21.91<0.001
Pass Around Frequency
Intercept−4.030.22−18.24<0.001
Exclusion Barrier3.330.2214.99<0.001
Sharksafe Barrier3.240.2214.60<0.001
Publisher’s Note: MDPI stays neutral with regard to jurisdictional claims in published maps and institutional affiliations.

