Article

Human Intervention–Induced Changes in the Characteristics of the Turbidity Maximum Zone and Associated Mouth Bars in the Yangtze Estuary

1
State Key Laboratory of Estuarine and Coastal Research, East China Normal University, Shanghai 200241, China
2
School of Hydraulic Science and Engineering, Yangzhou University, Yangzhou 225000, China
3
Key Laboratory of Engineering Sediment of Ministry of Transport, Tianjin Research Institute for Water Transport Engineering, Tianjin 300456, China
*
Authors to whom correspondence should be addressed.
J. Mar. Sci. Eng. 2022, 10(5), 584; https://doi.org/10.3390/jmse10050584
Submission received: 9 April 2022 / Revised: 21 April 2022 / Accepted: 22 April 2022 / Published: 26 April 2022
(This article belongs to the Special Issue Dynamics in Coastal Areas)

Abstract

:
In the past two decades, the dynamic sedimentation process of the Yangtze Estuary has been seriously disturbed by coupled human interventions from the river basin to the estuary, especially the impoundment of the Three Gorges Dam in 2003 and the large-scale Deep-water Navigational Channel (DNC) regulation project in 1998–2010. This study investigated the changes in sedimentary dynamic and geomorphological processes in the turbidity maximum zone (TMZ) by analyzing the historical and present data for current, salinity, suspended sediment, and bathymetry. The results show that the decreased riverine sediment input caused a lagging decrease in suspended sediment concentration in the TMZ during the flood seasons. The DNC caused changes in the flow structure, sediment transport, and geometry of the TMZ in the North Passage (NP) and the South Passage (SP). In the NP, decreased ebb transport in the upper reaches led to landward migration of the TMZ during low discharges, while increased ebb transport in the middle and lower reaches caused the seaward migration of the TMZ during high discharges. As the associated topography of the TMZ, the mouth bar in the NP was mostly removed by channel dredging. However, rapid deposition at the location of the previous mouth bar indicates the formation of an incipient bar. In the SP, increased ebb transport after the DNC-induced disappearance of the TMZ and the mouth bar in the upper reaches and the seaward migration of the TMZ in the middle and lower reaches. Therefore, we found that the construction of dams and large-scale estuarine projects changed the sediment dynamics and geomorphological processes of the TMZ and even affected the long-term evolution of the estuary. Construction regulation projects in the TMZ, intended to narrow the cross-section and enhance seaward sediment transport, may produce the opposite effect. Before and after engineering projects, their impacts on estuarine processes need to be carefully estimated.

1. Introduction

The phenomenon of suspended sediment concentration (SSC) in the middle area of muddy, tidal estuaries being consistently higher than that in the adjacent water upstream or downstream is called the turbidity maximum zone [1]. Such high concentrations of suspended sediment often correspond to locations of enhanced deposition that can promote the formation of river mouth bars [2,3,4,5]. Since Glangeaud first discovered and defined the turbidity maximum zone (TMZ) in the La Gironde Estuary in 1938 [6,7], the TMZ has been studied extensively, revealing the importance of the TMZ in estuarine sediment dynamics [1,2,6,8,9,10,11,12,13,14].
Human activities in drainage basins and estuaries, including dam construction, reclamation, and hydraulic/navigation channel regulation projects, can affect estuarine environments. For example, basin damming can cause a sharp decrease in riverine sediment load [15] and the erosion of estuarine shoals and subaqueous deltas [16,17]. The reclamation of shoals can also accelerate estuarine shoal accretion and concentrate water from shoals into channels [18]. Estuarine hydraulic or navigation channel regulation projects, including dredging and engineering construction projects, also significantly impact estuarine hydrodynamics and morpho-dynamics [19].
The linkage between estuarine sedimentation processes in the TMZ and human interventions exhibits a complex coupling mechanism. Examples of this mechanism include the construction of the Zeebrugge Port (Belgium), which caused a large-scale erosion of the muddy seabed and introduced the development of the Zeebrugge coastal TMZ [20]; the dam construction in the upper reaches that caused the Keum River Estuary (Korea) to be veneered by muddy sediments such that the sediments delivered by the Keum River are entirely confined to the estuary, incapable of escaping to the sea [21]; the construction of dikes along the main channel in the Seine Estuary (France) caused upstream migration of the seaward limit of the TMZ [22]; in the Delaware Estuary (USA), deepened channel-enhanced sediment transport is the result of tidal pumping in the TMZ [23]; and the reclamation of shoals shortened the longitudinal range of the TMZ in the North Channel in the Yangtze Estuary (China) [24]. However, the influence of human interventions on the changes in the characteristics of the TMZ and its associated mouth bars has hardly been studied [24], especially in a scenario coupled with local and remote anthropogenic measures from river basin to estuary.
The Yangtze Estuary is of high interest as a representative tidal estuarine network, which has been subject to multiple anthropogenic changes to its geometry in the past decades [25]. With the implementation of artificial projects in the Yangtze River Basin and Yangtze Estuary, water and sediment inputs into the estuary and estuarine flow structure and their bathymetry have changed significantly [26,27]. This makes the Yangtze Estuary a suitable area to study the TMZ and its associated mouth bars in response to the coupled human activities from the river basin to the estuary. However, limited by the availability of long-term hydrodynamic, sedimentation, and bathymetric data, little work has been conducted on this topic. The current study, therefore, aims to gain insights into the response of the dynamic sedimentation process of the TMZ and its associated mouth bars to the coupled human interventions from the river basin to the estuary, with a focus on the variations in suspended sediment concentration and location of the TMZ, as well as the morphological changes in the mouth bars.
The Yangtze Estuary is formed at the mouth of the Yangtze River, the largest river in China. The Yangtze River is a sandy river with abundant water. The average annual runoff at the Datong station, the upstream tidal limit, is 8.91 × 10 11   m 3 (1953–2019), and the average annual sediment load is 3.51 × 10 8   t (1953–2019). The runoff and sediment load during the flood season account for 72% and 87.2% of annual amounts, respectively. The Yangtze Estuary is a mesotidal estuary, and the average tidal range at the Zhongjun station is 2.67 m.
The Yangtze Estuary presents a triple-bifurcation system from the upstream limit of saltwater intrusion at Xuliujing (Figure 1), with four outlets entering the sea. The upper reach of the estuary is divided into the North Branch (NB) and the South Branch (SB); the middle reach of the SB is divided into the North Channel (NC) and the South Channel (SC). The SC is divided into the North Passage (NP) and the South Passage (SP). In the transverse direction, the estuary shows the typical characteristics of braided estuaries with alternating shoals and troughs (Figure 1). The channel width at Xuliujing is only 5.3 km, while 160 km downstream it is 90 km. The widening rate of the estuary gradually increases from upstream to downstream (Figure 1). In the longitudinal direction, a locally convex riverbed, called the mouth bar, appears in the downstream channel and is associated with the TMZ [28].
The evolution process of the Yangtze Estuary was substantially affected by human interventions in the river basin, which directly influenced the input of water discharge and sediment load into the estuary [29]. In the past decades, the annual runoff of the Yangtze River showed insignificant change. In contrast, the annual sediment load fluctuated greatly due to the cultivation of wasteland, the return of farmland to forest, and the construction of dams, especially the operation of the Three Gorges Dam (TGD) since 2003 [30,31].
Many large-scale projects have been implemented in the Yangtze Estuary in recent decades (Figure 1b), such as the Deep-water Navigation Channel (DNC) regulation project, the reclamation projects of the Nanhui Shoal, East Chongming Shoal, East Hengsha Shoal, the construction of the Qingcaosha Reservoir, and the shoal protection projects of the Baimaosha, Liuhesha, and Jiuduansha. The DNC regulation project was implemented in the NP from 1998 to 2009, which included the construction of diversion dikes at the distributary inlet, 97 km long double-training walls, 19 groins on both sides, and dredging the channel from ~6.0 m to 12.5 m.
Human activities in the Yangtze River Basin and Estuary have led to changes in the flow, sediment transport, and morphology of the Yangtze Estuary [27,32,33,34,35], which inevitably impacted the dynamic sedimentation processes of the TMZ.

2. Material and Methods

The changes in the dynamic sedimentation process of the TMZ, including variations in the SSC and location of the TMZ, and bathymetric changes in the associated mouth bars, were investigated by analyzing historical and present field data for current, suspended sediment, and bathymetry.

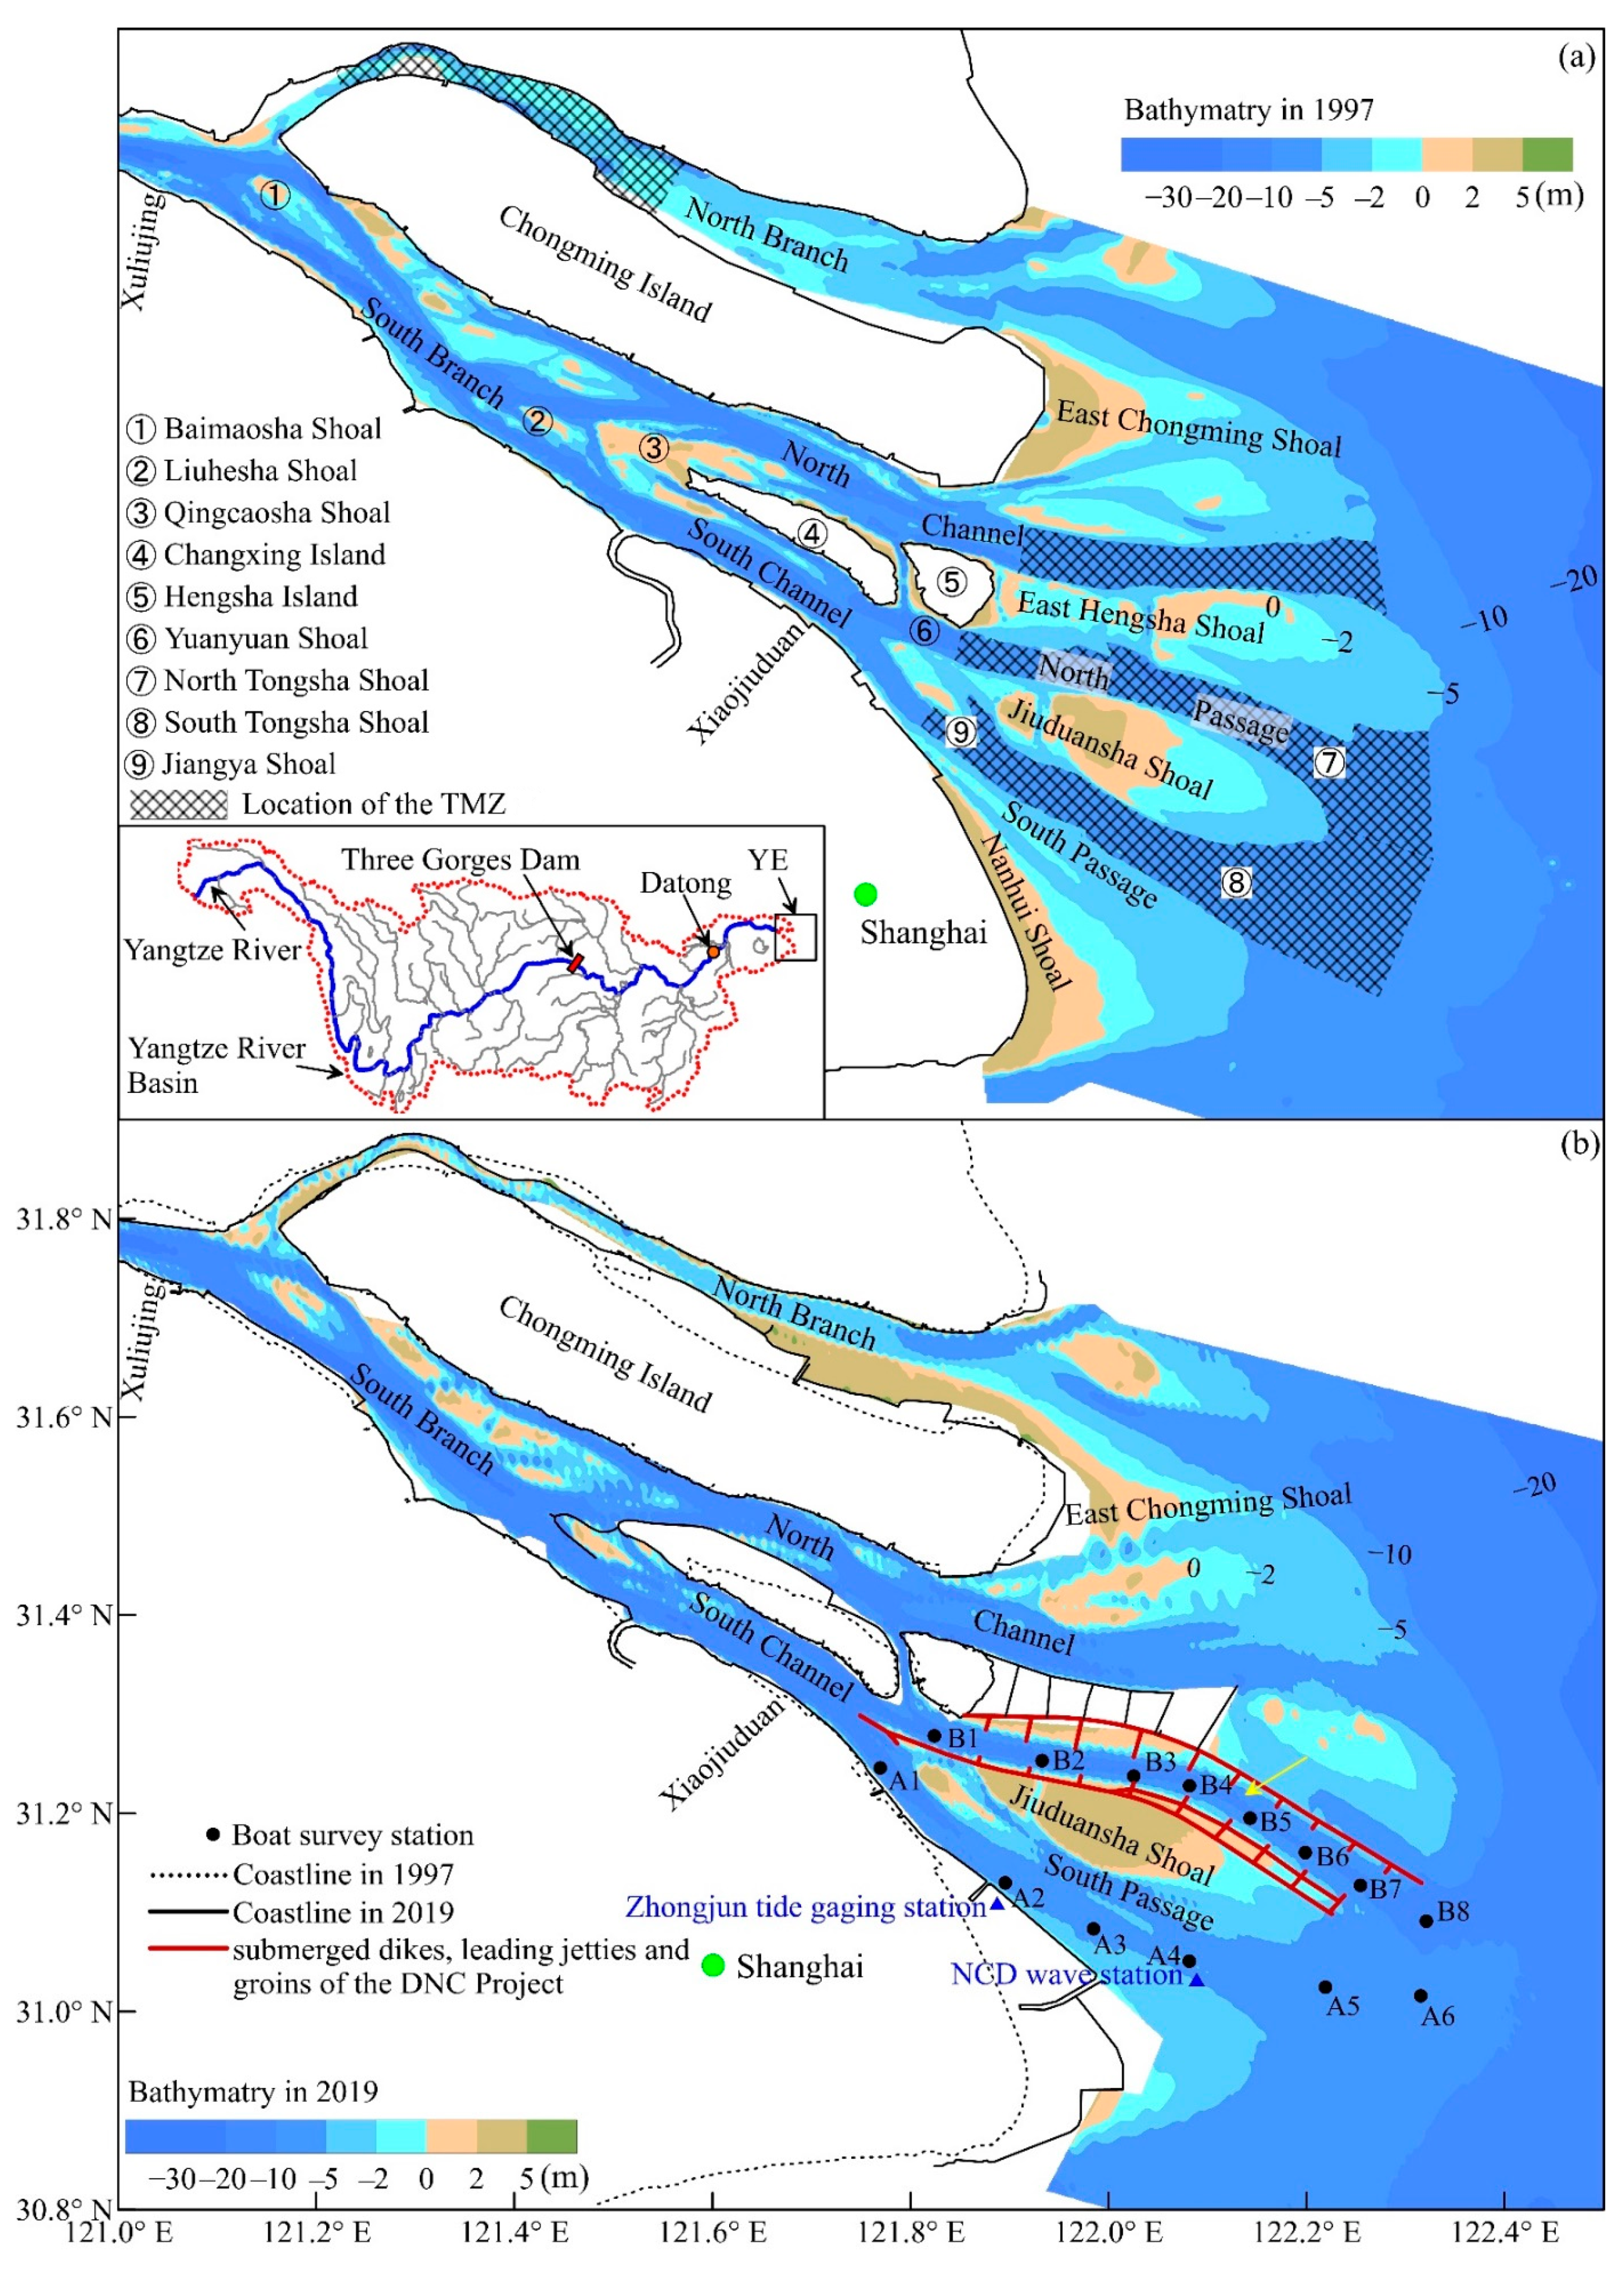
2.1. Data Collection

Multi-site synchronous hydrodynamic data from 1999 to 2016 were collected to capture the post and present characteristics of the TMZ and to compute the location of water and sediment null points in the NP and the SP. Detailed information on survey measurements is shown in Table 1, and the locations of the observation stations are marked in Figure 1. During the survey, currents, salinity, and SSC were measured hourly at six water depths with relative depths of 0 (0.5 m below the water surface), 0.2, 0.4, 0.6, 0.8, and 1.0 (0.5 m above the bed) at each station. The current velocity was measured using an RDI WorkHorse ADCP instrument, while salinity and SSC were obtained by analyzing water samples taken during a survey. Those measurements were mainly completed by the Yangtze Estuary Waterway Administration Bureau of the Ministry of Transport of the People’s Republic of China (PRC), and we participated in part of the measurement work.
To assess the impacts of storm surges on SSC in the TMZ, the surface wave was measured at the Nancaodong (NCD) station (Figure 1) from 29 February to 13 March and 15 July to 29 July 2016. The wave data (hourly wave height and wave period) were measured using an ultrasonic wave meter. The wave surface measurement frequency was 2 Hz, with a sampling period of 1024 s.
To analyze the spatiotemporal changes in the TMZ after the DNC project, SSC data during the spring tide of the flood seasons in 2003, 2005, 2011, and 2016 were collected at several stations in the SC, NC, NP, SP, and adjacent sea.
The longitudinal distribution of the annual deposition rate in the DNC of the NP in 2019 was collected from the Yangtze Estuary Waterway Administration Bureau of the Ministry of Transport of the People’s Republic of China (PRC). The annual deposition rate ( D R y r ) is defined as:
D R y r =   V d e p o s i t i o n +   V d r e d g i n g S
where V d e p o s i t i o n is the net deposition volume (bathymetric change) between two temporally adjacent bathymetry surveys, V d r e d g i n g is the yearly dredging volume, and S is the area of the channel section.
Digital survey charts between 1997 and 2019 were collected to capture the bathymetric changes in the TMZ, especially at the mouth bars. These bathymetric surveys were conducted by the Shanghai Waterway Engineering Design and Consulting Co. Ltd. (SWEDC, Shanghai, China).
Water and sediment input from the Yangtze River and divided flow-diversion ratios between the NP and SP were collected to assess the effects of human interventions on the dynamic sedimentation process. Annual and monthly mean water and suspended sediment discharge between 1952 and 2019 at the Datong station were obtained from the Yangtze Water Conservancy Committee of the Ministry of Water Conservancy of the PRC. The ebb flow-diversion ratios for the NP and SP for 1998 to 2016 were obtained from the Yangtze Estuary Waterway Administration Bureau of the Ministry of Transport of the PRC. The ebb flow diversion ratio of the NP is defined as the ratio of the ebb tidal volume through the selected section to the sum of the ebb tidal volumes through the selected sections in the NP and SP, which were observed simultaneously [36].

2.2. Methods

To assess the dominance of ebb and flood dynamics, the coefficient of flow/sediment dominance [37] was calculated as follows:
R C = Q e Q e + Q f × 100 %
R S = G e G e + G f × 100 %
Q f ( e ) = i = 1 n f ( e ) u i × cos θ i × t
G f ( e ) = i = 1 n f ( e ) u i × cos θ i × c i × t .  
where RC is the coefficient of flow dominance, Qf(e) is the local water transport during flood/ebb current period, nf(e) is the duration of the flood/ebb current, u is the velocity, θ is the angle between the measured flow direction and the long axis of the tidal ellipse, t is the sampling intervals (seconds), RS is the coefficient of sediment dominance, Gf(e) is the local sediment transport during flood/ebb current period, and c i is the SSC. If RC > 50%, the flow is ebb-dominated; otherwise, it is flood-dominated. If RS > 50%, the net sediment transport is seaward; otherwise, it is landward. The points of RC = 50% and RS = 50% indicate the places of no motion for water and sediment, respectively. Where the contour lines of RC = 50% and RS = 50% reach the estuary bed are the water null point and the sediment null point.
TMZs are the result of complex estuarine dynamics leading to the convergent transport of suspended particulate matter [38], and the TMZ of the YE belongs to a dominant type of TMZs created by longitudinal convergence [36]. The previously defined sediment null point is the longitudinal convergence point of suspended sediment transport, where the residual sediment flux at the estuary bed is zero. Thus, the sediment null point is used to indicate the location of the TMZ.
To quantify the morphological changes in the mouth bars, digital survey charts between 1997 and 2019 were analyzed by establishing a digital elevation model. The charts were firstly transformed into depth points relative to the coordinate of ‘Beijing_1954_GK_Zone_21N’. Elevations and depths in meters are calibrated to the theoretical lowest-tide level (TLTL). Using the Kriging interpolation technique, each data set was interpolated to a grid with 100 m × 100 m cells [39]. Bathymetric changes in the mouth bars were obtained by subtracting the depth in 1997 from that in 2019. Changes in the water volume of the NP and SP were investigated using the spatial analysis tools in ArcGIS, and the water volume was calculated below or between given reference planes.

3. Results

3.1. Characteristics of the Dynamic Process of the TMZ

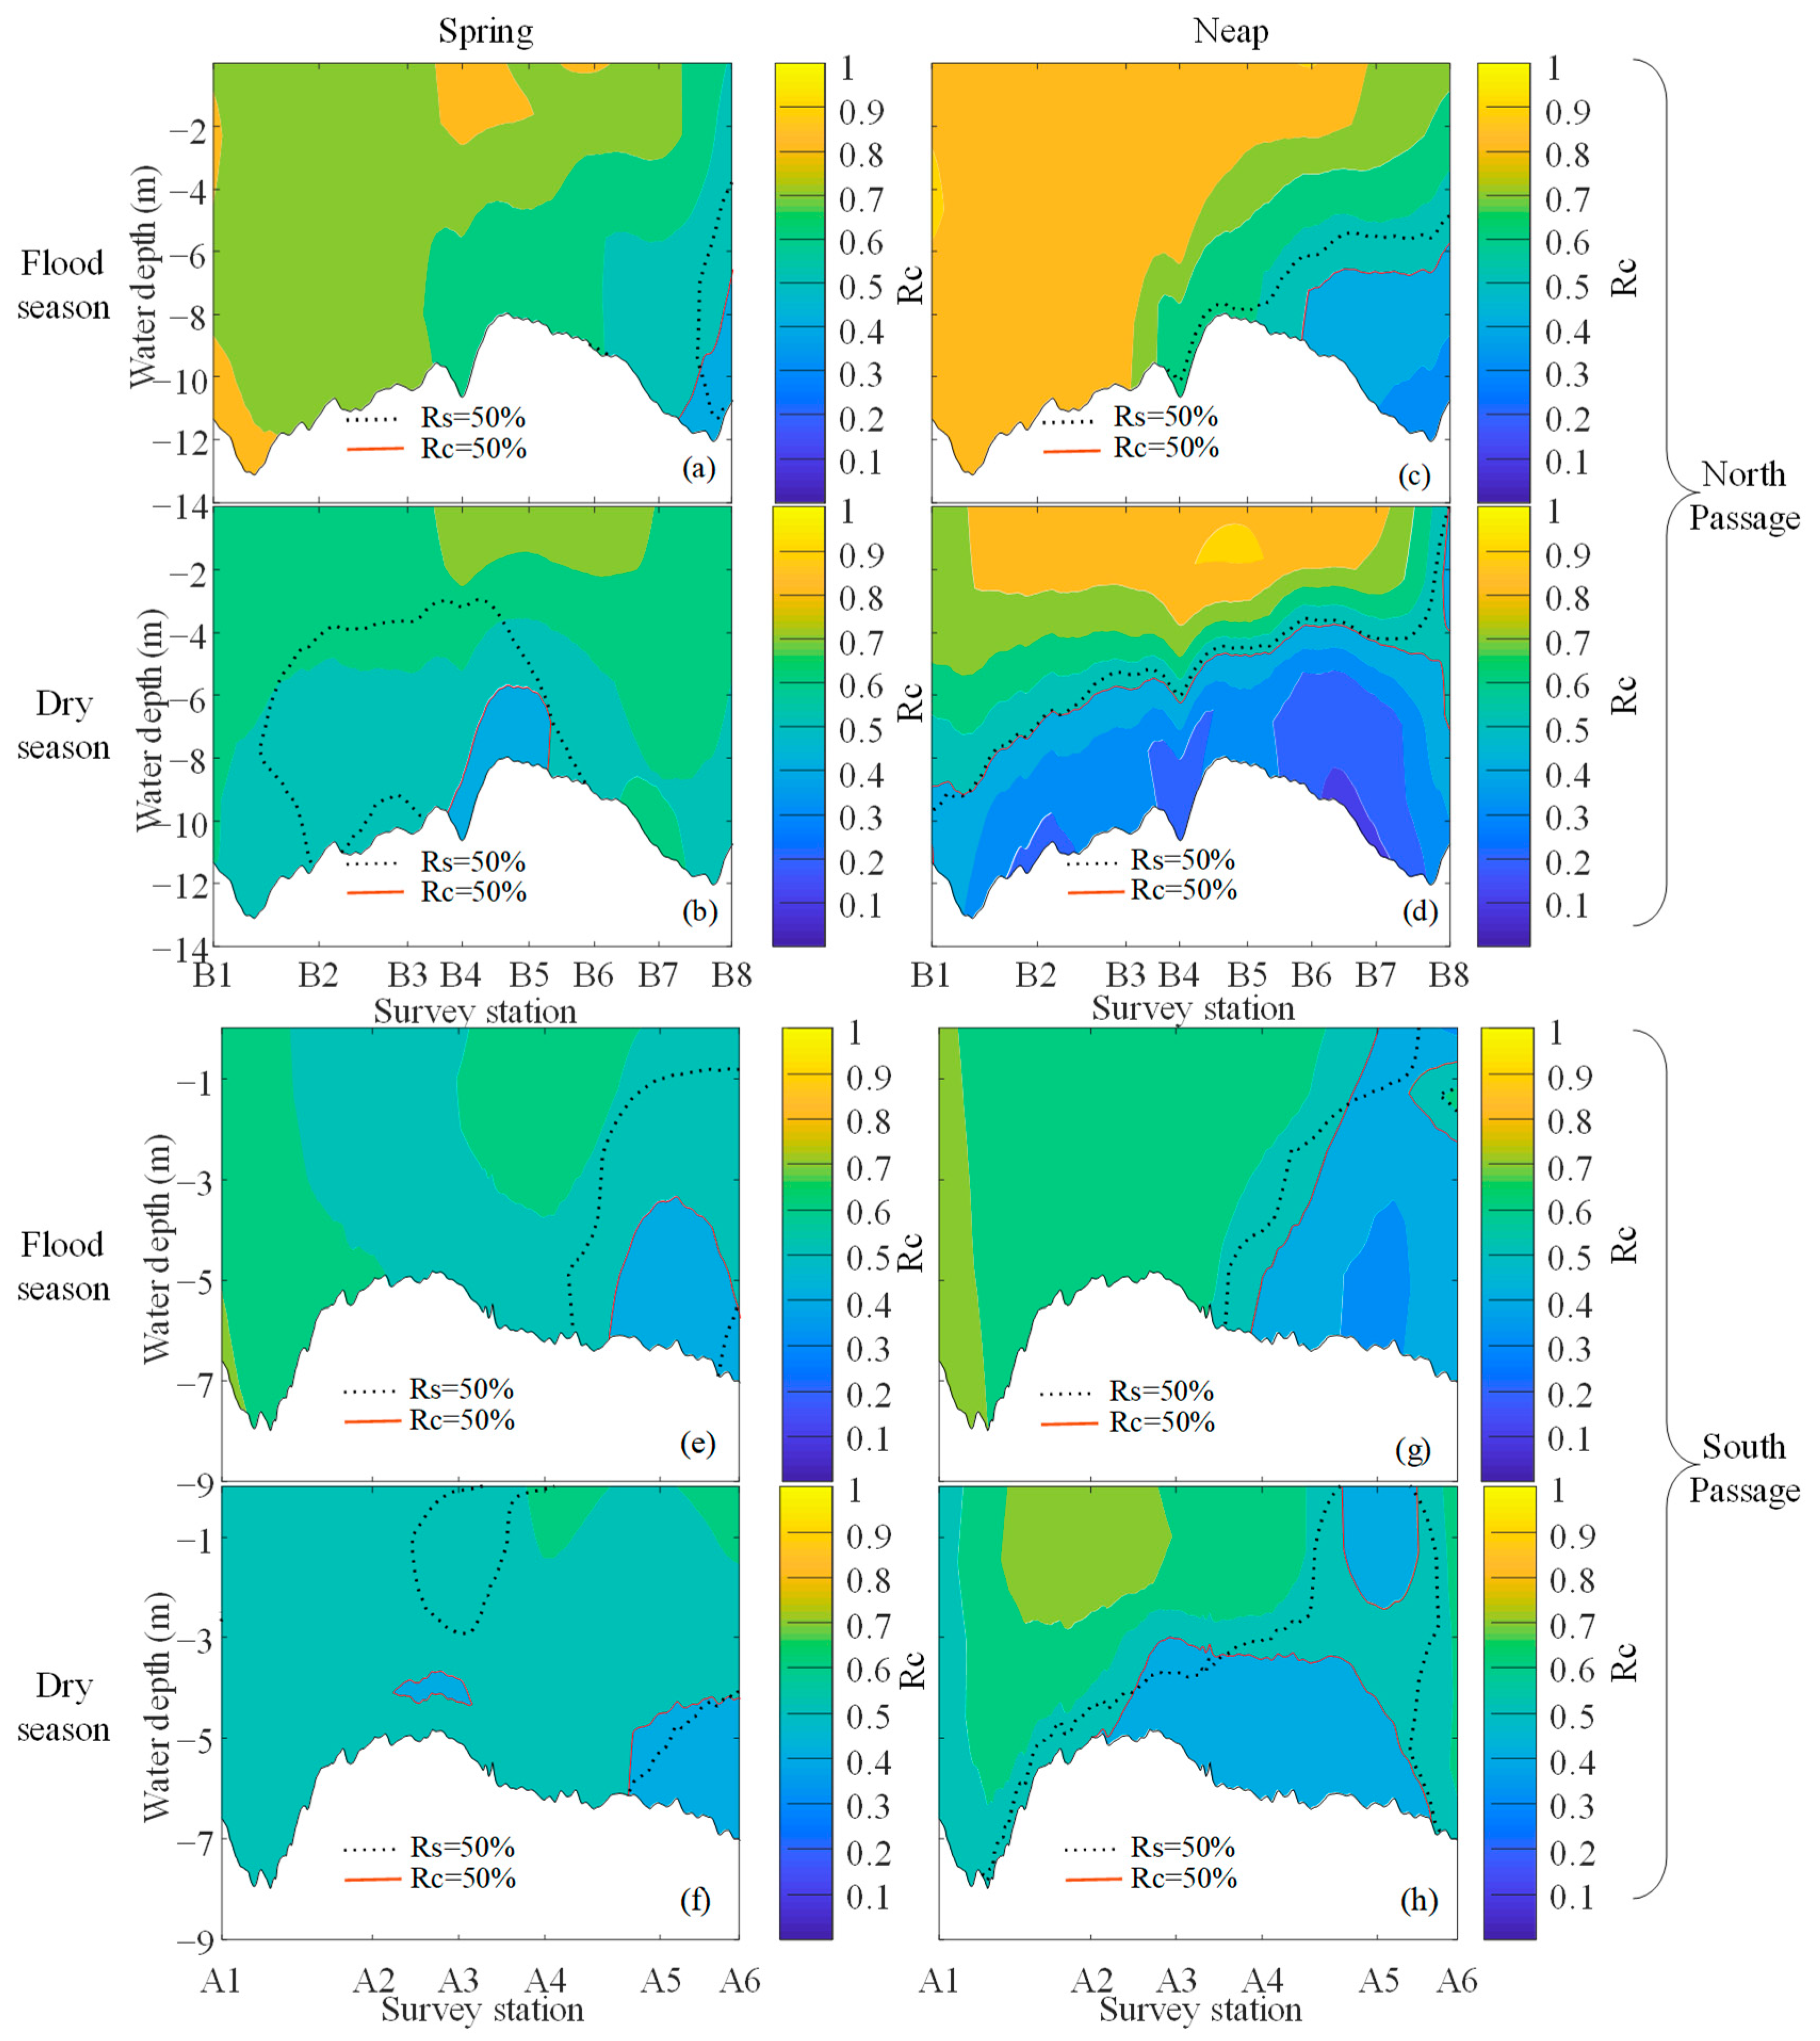
3.1.1. Salt Intrusion and Its Seasonal Variation in the TMZ

The vertical profile of tidal-averaged salinity and SSC measured at several stations in the NP and SP in 2016 shows longitudinal salinity gradients and vertical stratification in the channel (Figure 2). During the spring tide of the flood season, a salt wedge appeared around the isohaline of 7 practical salinity units (PSU), and the core area of high SSC was formed in the salt wedge front, with SSC higher than 2 kg/m3 (Figure 2a,e). During the neap tide of the flood season, the SSC in the pre-wedge area around the isohaline of 7 PSU was higher than 0.60 kg/ m3 (Figure 2c,g). The increased SSC at the salt wedge front indicated the importance of salt intrusion in sediment trapping in the TMZ.
The salt wedge migrated back and forth along the channel during the flood and dry seasons (Figure 2). In the flood season, the salt wedge in the NP moved downward to the North Tongsha Shoal (Figure 2a,c), and that in the SP moved down to the South Tongsha Shoal (Figure 2e,g). In the dry season, the salt wedge in the NP moved upward to the Yuanyuan Shoal (Figure 2b,d), and that in the SP moved upward to the Jiangya Shoal (Figure 2f,h). Meanwhile, the TMZ migrated with the salt wedge front. As shown in Figure 2, seasonal runoff variation shows a much more significant influence on the salt wedge migration than the fortnightly tidal cycles because the runoff in the flood season accounts for 66% (averaged from 2004 to 2020) of the annual runoff.

3.1.2. Null Points and Their Seasonal Migration in the TMZ

The longitudinal coefficient of flow/sediment dominance (RC/RS) was calculated from the measured tidal velocity and sediment concentration at several stations in the NP and SP in 2016 (Figure 3). The water and sediment null points moved seaward during the flood season (Figure 3).
According to the longitudinal–vertical distribution of RC, the residual flows in both the NP and the SP were characterized by clockwise estuarine circulation, with landward flow at the layer below the 50% contour lines of the RC and seaward flow at the layer above the 50% contour lines of the RC. According to the longitudinal–vertical distribution of the RS, sediment transport in the NP and SP both displayed a convergent pattern, with net landward sediment transport at the layer below the 50% contour lines of the RS and net seaward flow at the layer above the 50% contour lines of the RS. The longitudinal estuarine circulation and convergent patterns of sediment transport were conducive to the accumulation of sediment near the sediment null point.

3.1.3. Seasonal Variation in Riverine Dynamics and Its Impact on the TMZ

In the previous sections, we reported significant along-channel movement of the TMZ with the salt wedge and sediment null point due to the seasonal variation in water discharge. During the flood season, the fluvial sediment input was abundant, which accounted for 87.2% of the annual sediment load in 2016. However, the magnitude of SSC in the TMZ did not match the previously reported seasonal characterization that the SSC during the flood season was significantly higher than during the dry season [40,41]. As shown in Figure 4c,d, the spring-tide measurement in flood season and both neap-tide measurements in 2016 were not affected by a storm event. The measured neap-tide maximum tidal-mean SSC of the TMZ in the NP was 0.329 kg/m3 during the flood season and 0.126 kg/m3 during the dry season (Figure 4a), and in the SP it was 0.309 kg/m3 during the flood season and 0.180 kg/m3 during the dry season (Figure 4b). However, the spring-tide measurements in the dry season in 2016 were affected by a cold front–induced storm event (Figure 4c), with the SSC in the TMZ in the NP and SP both 2–2.3 times higher than that in a flood season which was not affected by a storm event.
In summary, SSC in the TMZ is primarily related to the seasonal variation in riverine sediment input. However, the resuspension process caused by the storm surge should not be neglected in the TMZ’s sediment replenishment.

3.2. Recent Changes in the Dynamic Process of the TMZ under Human Interventions

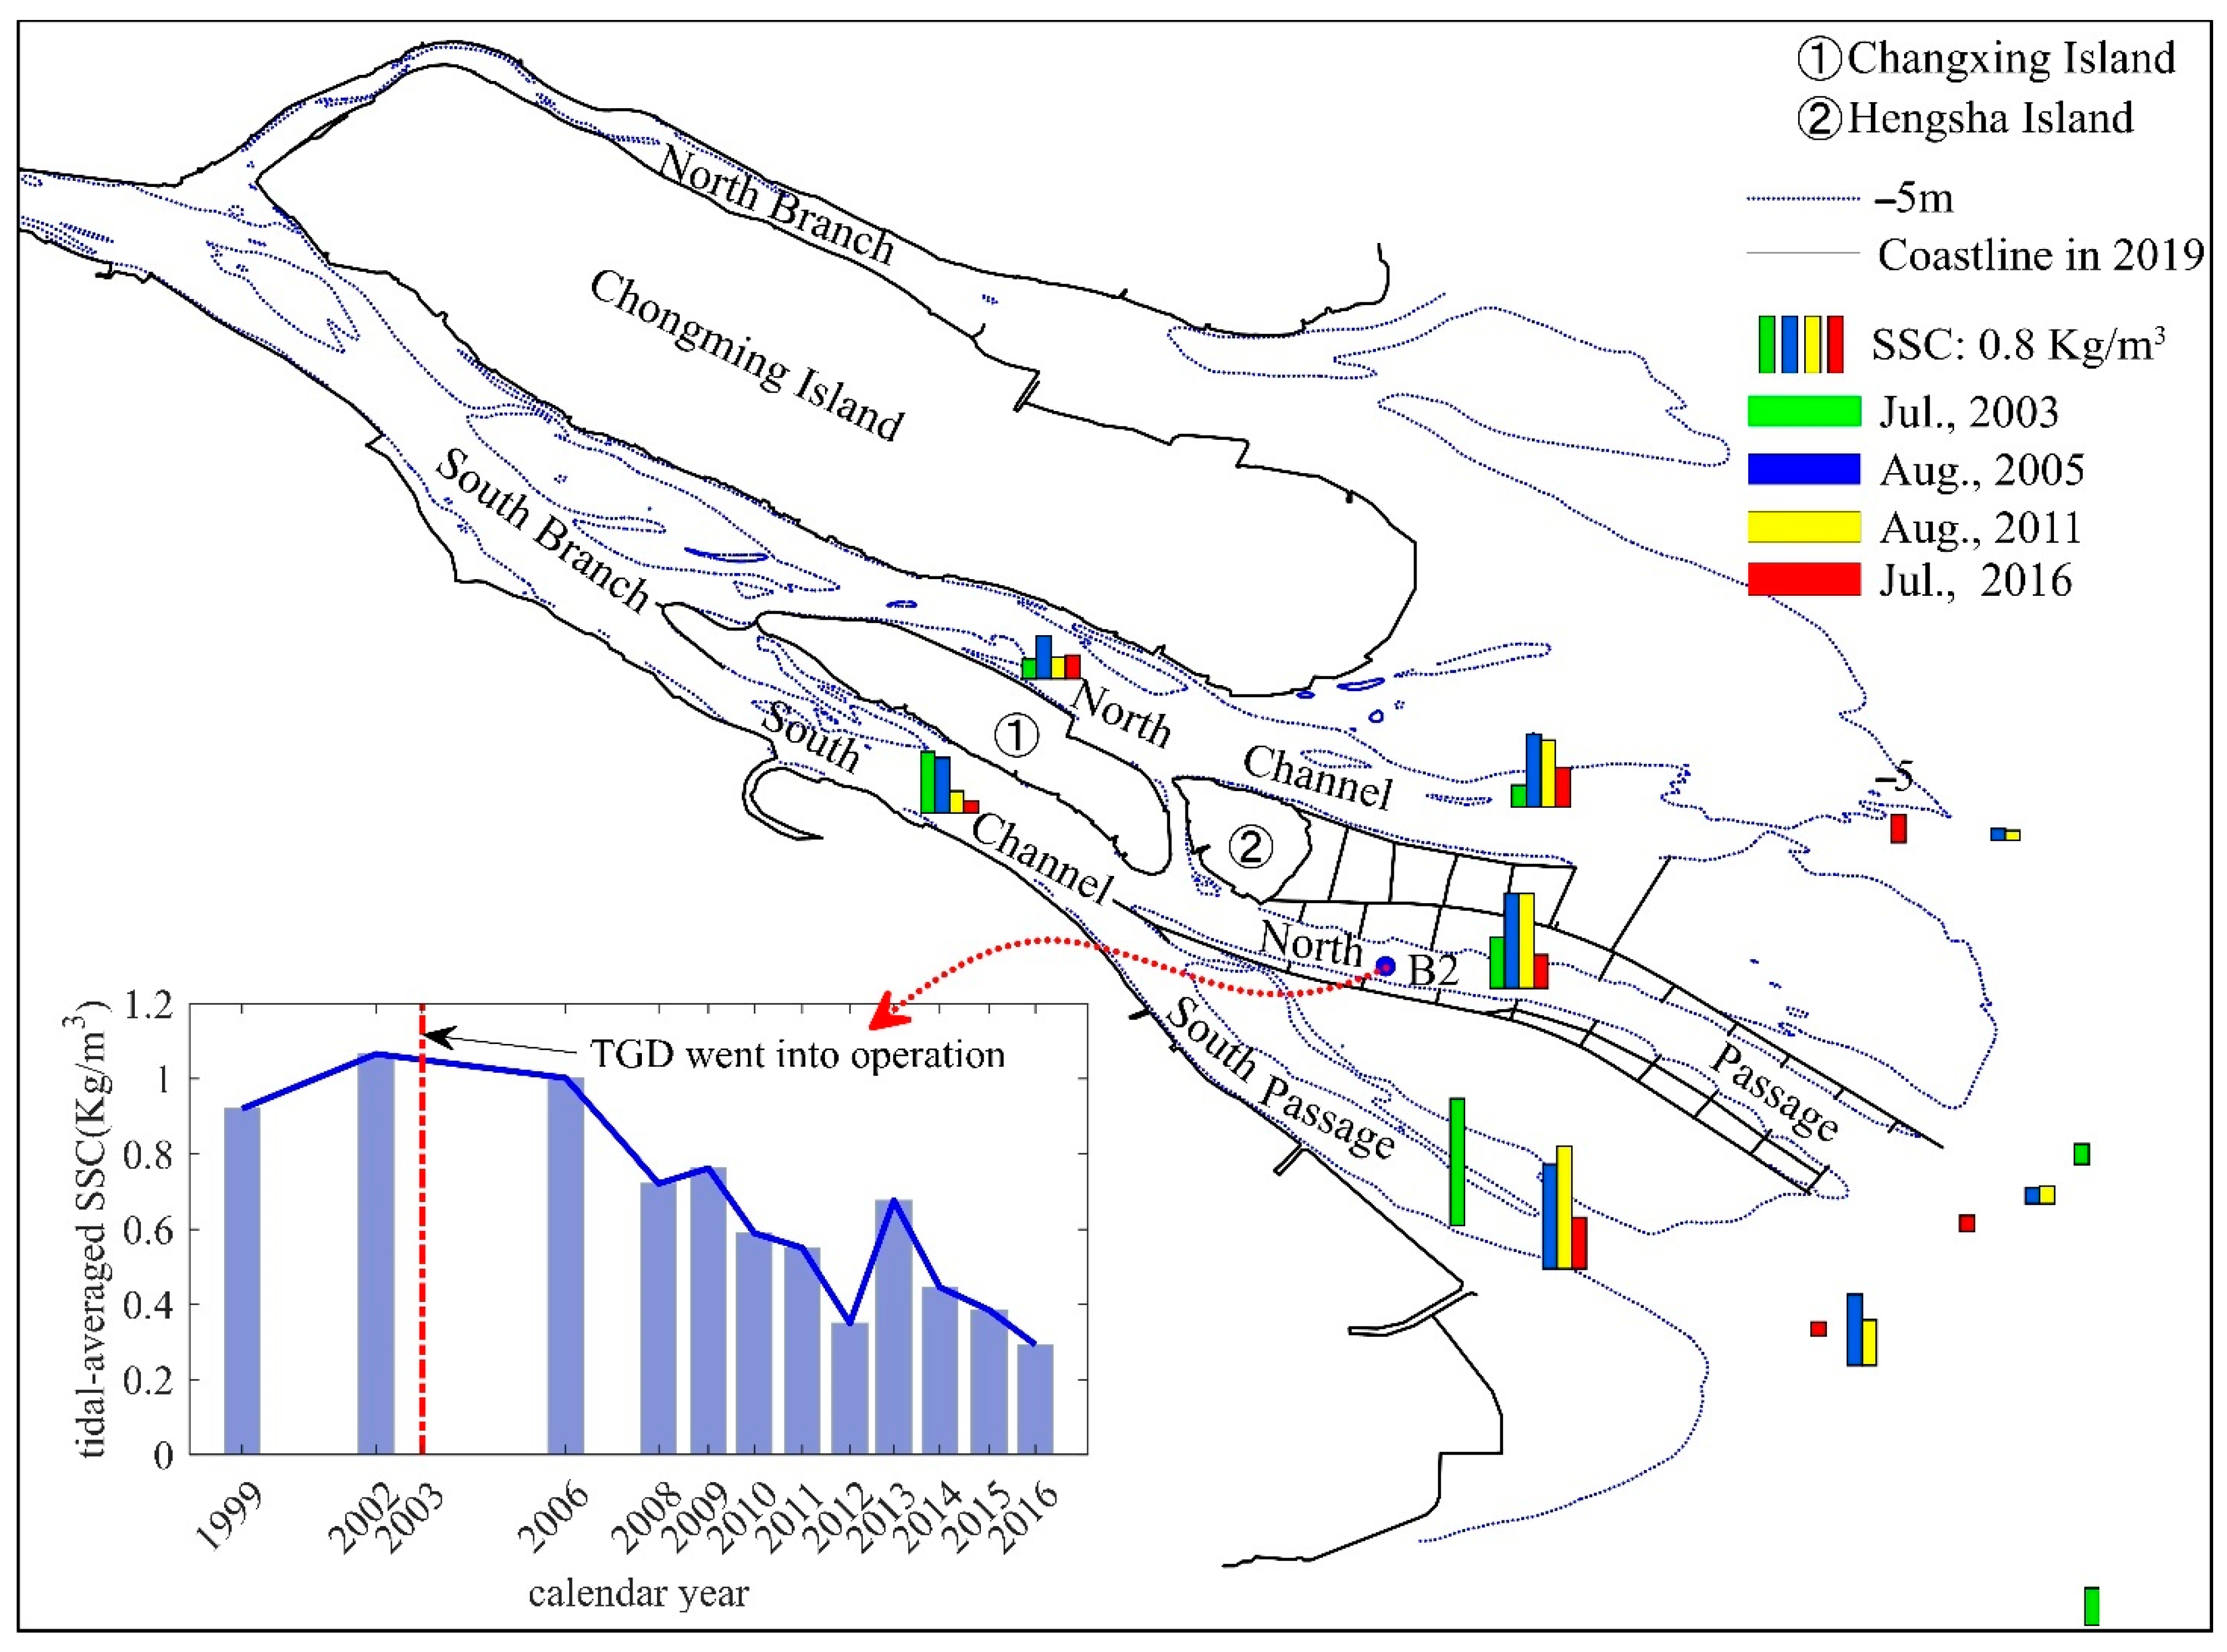
3.2.1. Changes in the SSC in the TMZ

According to the measurements of spring-tide SSC during flood season from 2003 to 2016, the SSC in the Yangtze Estuary is generally high, with a tidal mean SSC of 0.164–1.669 kg/m3 at the survey stations (Figure 5). The mean tidal SSC in the NP and SP were the highest, followed by the SC and middle section of the NC. In most periods, the mean SSC in the adjacent sea area was 0.411 kg/m3 (Figure 5).
The SSC in the lower NC, NP, and SP were higher than in the upstream and downstream regions during each measurement, indicating the existence of the TMZ in the NC, NP, and SP. However, the SSC in the whole estuarine area decreased in the last two decades. The SSC outside the TMZ showed a significant downward trend after the closure of the TGD in 2003 even at the B2 station located in the edge of the TMZ, while SSC in the TMZ showed no obvious change until 2011. Thus, the decrease in regional SSC in the TMZ lagged behind the decrease in SSC outside the TMZ (Figure 5).

3.2.2. Changes in the Location of the TMZ

The correlation analysis between the distance (Dis) of the sediment null point to the reference point (Hengsha in the NP, Xiaojiuduan in the SP) and the discharge (Q) at the Datong station over tidal range (H) at the Zhongjun station showed that the location of the sediment null point was closely related to the discharge at the Datong station and the tidal range at the Zhongjun station. The sediment null point moved seaward when river inflow increased or tidal dynamics weakened (Figure 6), indicating seaward migration of the TMZ following increasing river flow or decreasing tidal range. However, significant changes occurred in the relationship between the location of the sediment null point and the river discharge over the tidal range after completing the main works of the training walls and groins in the DNC in 2005 (Figure 6).
In the NP, sediment null points were in the middle and lower reaches before the DNC project. After the project, the sediment null point moved landward to the upper reaches in low discharge. However, it moved seaward to further downstream of the lower reaches in the high discharge scenario (Figure 6a), indicating a landward shift of the TMZ during the dry season and seaward shift of the TMZ during flood season.
In the SP, the sediment null point under the same discharge and tidal range conditions moved approximately 10–15 km downward after the DNC project, indicating an approximately 10–15 km downward shift of the TMZ (Figure 6b). Sediment null points no longer appeared in the upper reaches in the low discharge scenario. Therefore, the TMZ migrated to the middle and lower reaches.

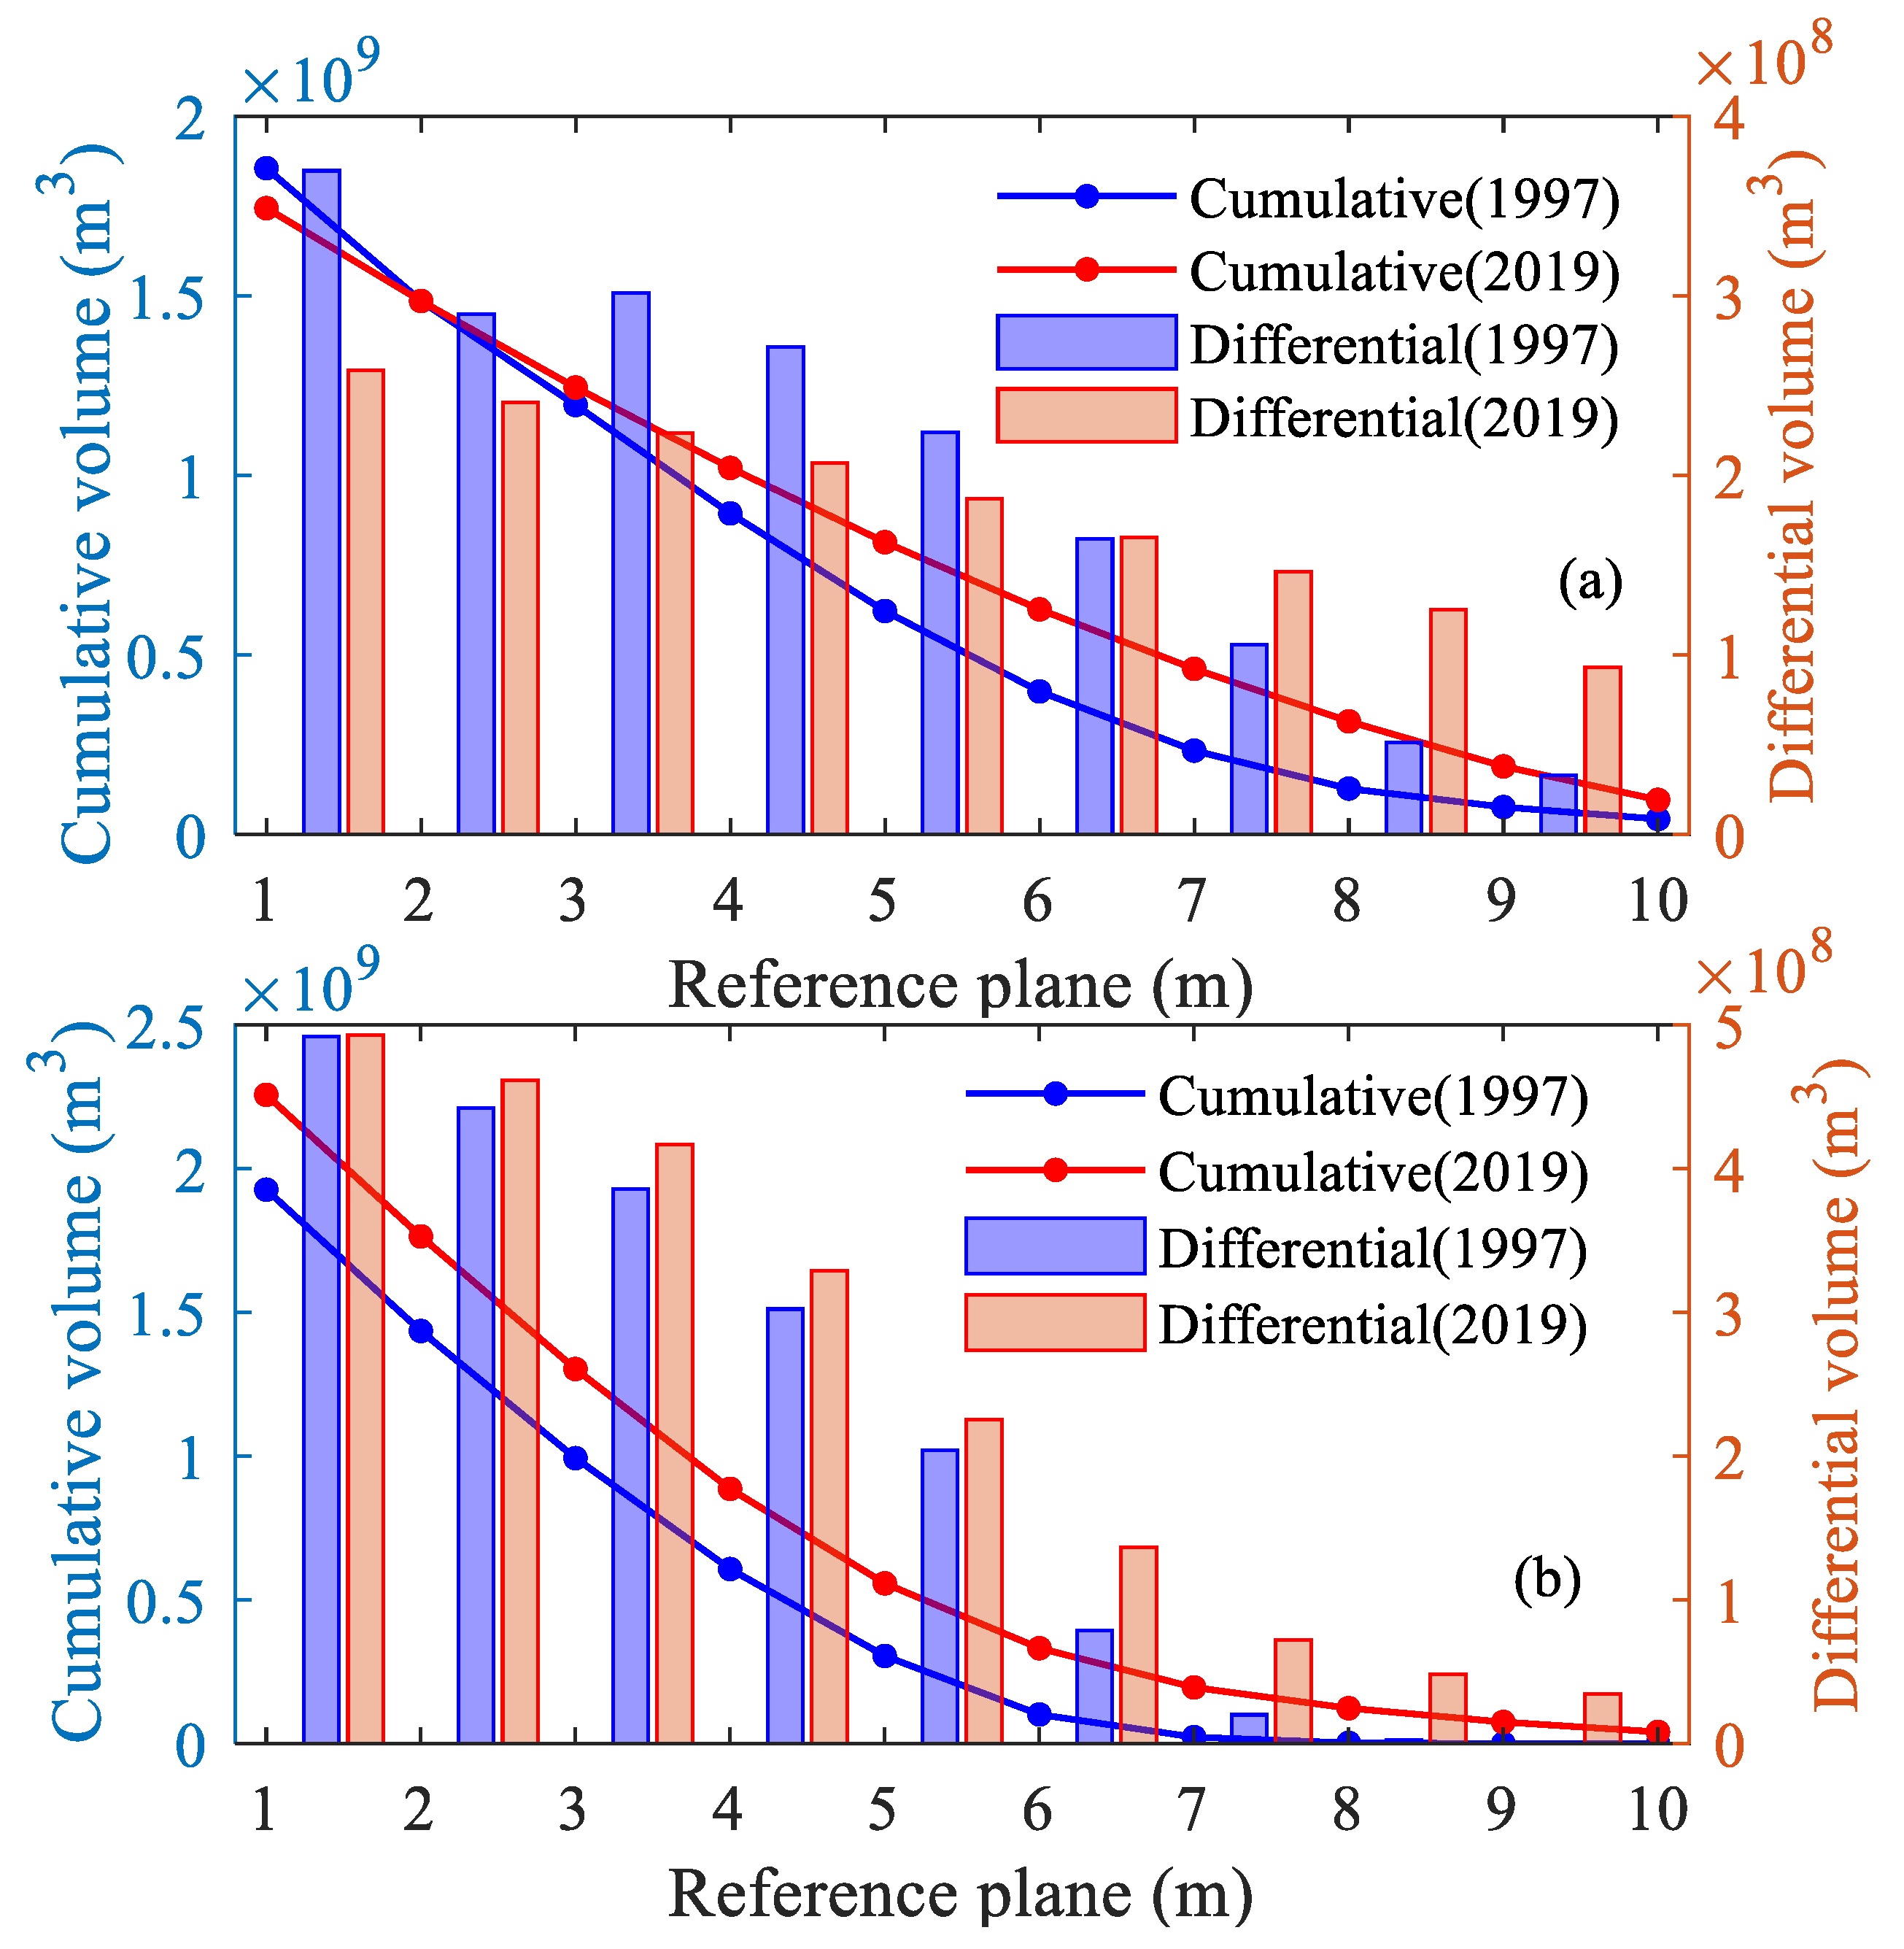
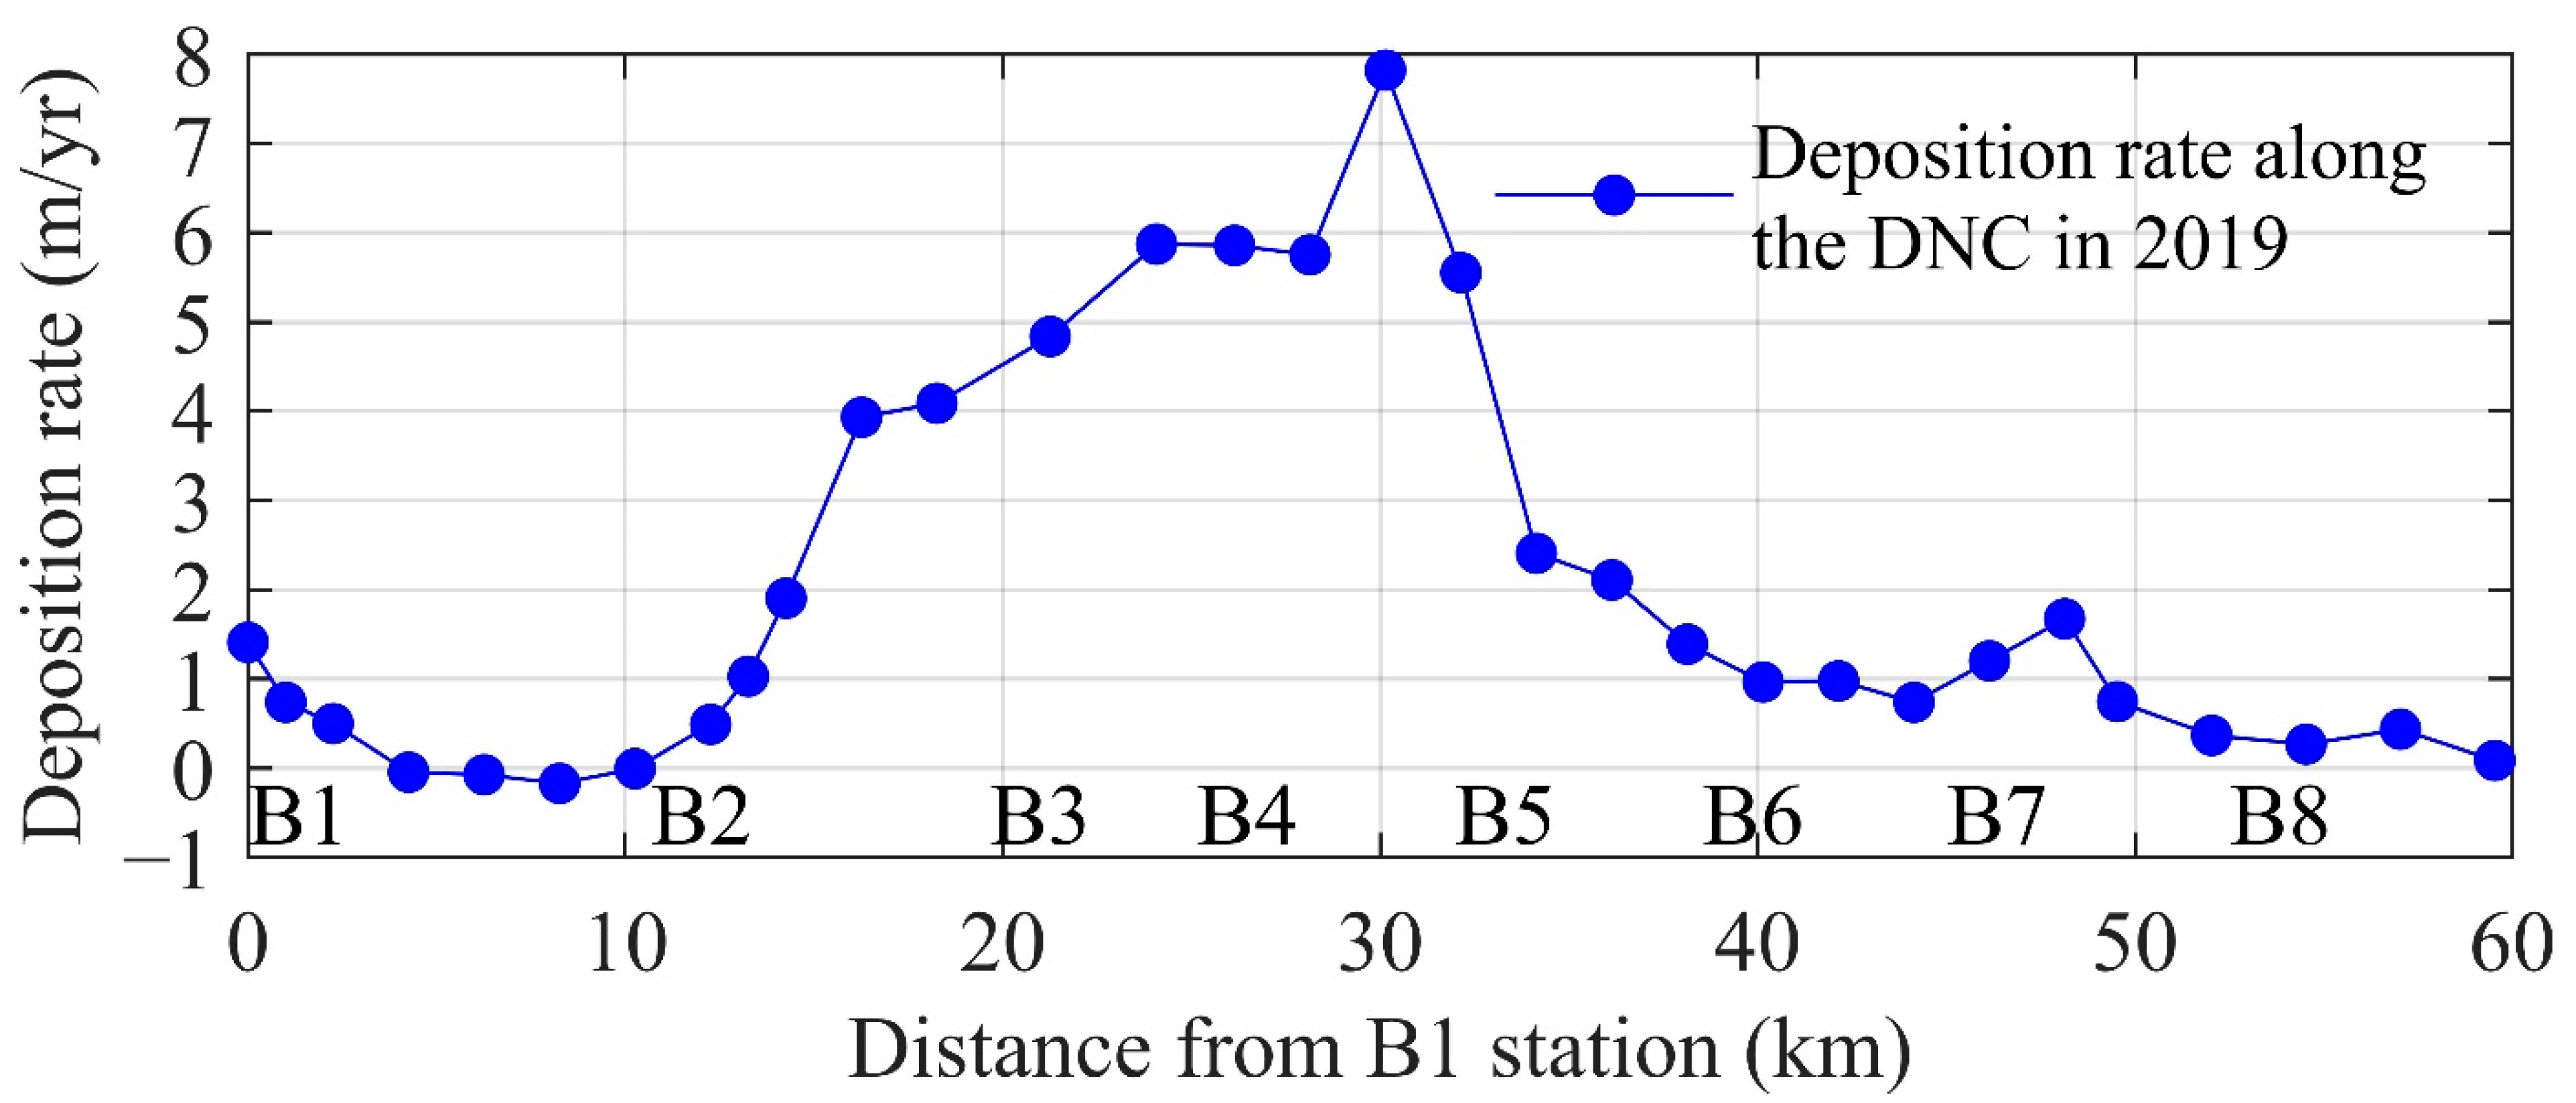
3.2.3. Changes in the Bathymetry of Mouth Bars in the TMZ

In the NP, intense siltation occurred in the side shoals of the upper reaches and groin areas, while the main channel of the NP mainly experienced erosion (Figure 7). The waterway depth in previously shallow areas increased to 12.5 m by the end of 2010. The water volume of the NP between water depths of 1 m and 6 m decreased by 23%, while those below 7 m doubled compared to the volume in 1997 (Figure 8a). Although the TMZ still existed in the NP in 2019, the mouth bars were removed by dredging and local scour caused by the DNC project (Figure 9a). However, according to the longitudinal distribution of the annual deposition rate in the DNC in 2019 (Figure 10), under continuous channel dredging, the deposition rate in the TMZ of the NP reached 7.9 m/year, 10 times larger than in the other areas of the NP. Thus, continuous channel dredging strangled the formation of mouth bars at the TMZ of the NP. Consequently, the bathymetric changes in the NP in the last two decades were characterized by intense siltation in the side shoals of the upper reaches and groin areas, deepening of the main channel, and disappearance of mouth bars.
In the SP, over the last two decades, intensive local scour and dredging occurred in the upper reaches, with water depth increasing from approximately 7 m to 12 to 15 m (Figure 7b). As a result, the 10 m isobath extended downstream to the middle reaches (Figure 1b). Correspondingly, the upstream mouth bar was removed, and the water depth increased by more than 6 m (Figure 7 and Figure 9b). In the middle reaches, considerable erosion was detected. The bathymetry was relatively stable in the lower reaches, with weak silting and scouring occurring alternately. The water volume of SP under 2 m water depth increased to varying degrees under different water depth intervals, among which the volume below 6 m suggested the most significant increase, at 2.3 times (Figure 8b). Hence, bathymetric change in the SP was characterized by an overall deepening of the main channel, especially in the upper reaches where the mouth bar disappeared.

4. Discussion

The dynamic sedimentation processes in the TMZ of the Yangtze Estuary changed significantly under the influence of human activities in recent decades, characterized by a decrease in SSC in the TMZ, seaward shift of the TMZ in the SP, landward shift of the TMZ in low discharge and seaward shift of the TMZ in high discharge in the NP, the disappearance of the TMZ and mouth bars in the upper reaches of the SP, and the disappearance of the mouth bar in the main channel of the NP.
Various factors might have contributed to the observed changes in the dynamic sedimentation processes in the TMZ, including variations in tidal and wave forcing at the seaward boundary, variations in river flow and sediment inputs, and or local anthropogenic measures. According to previous studies, no significant changes occurred in the tidal forces from the sea and river flow in the Yangtze Estuary [36]. Hence, we further assessed the consequences of variations in riverine sediment input and local anthropogenic measures.

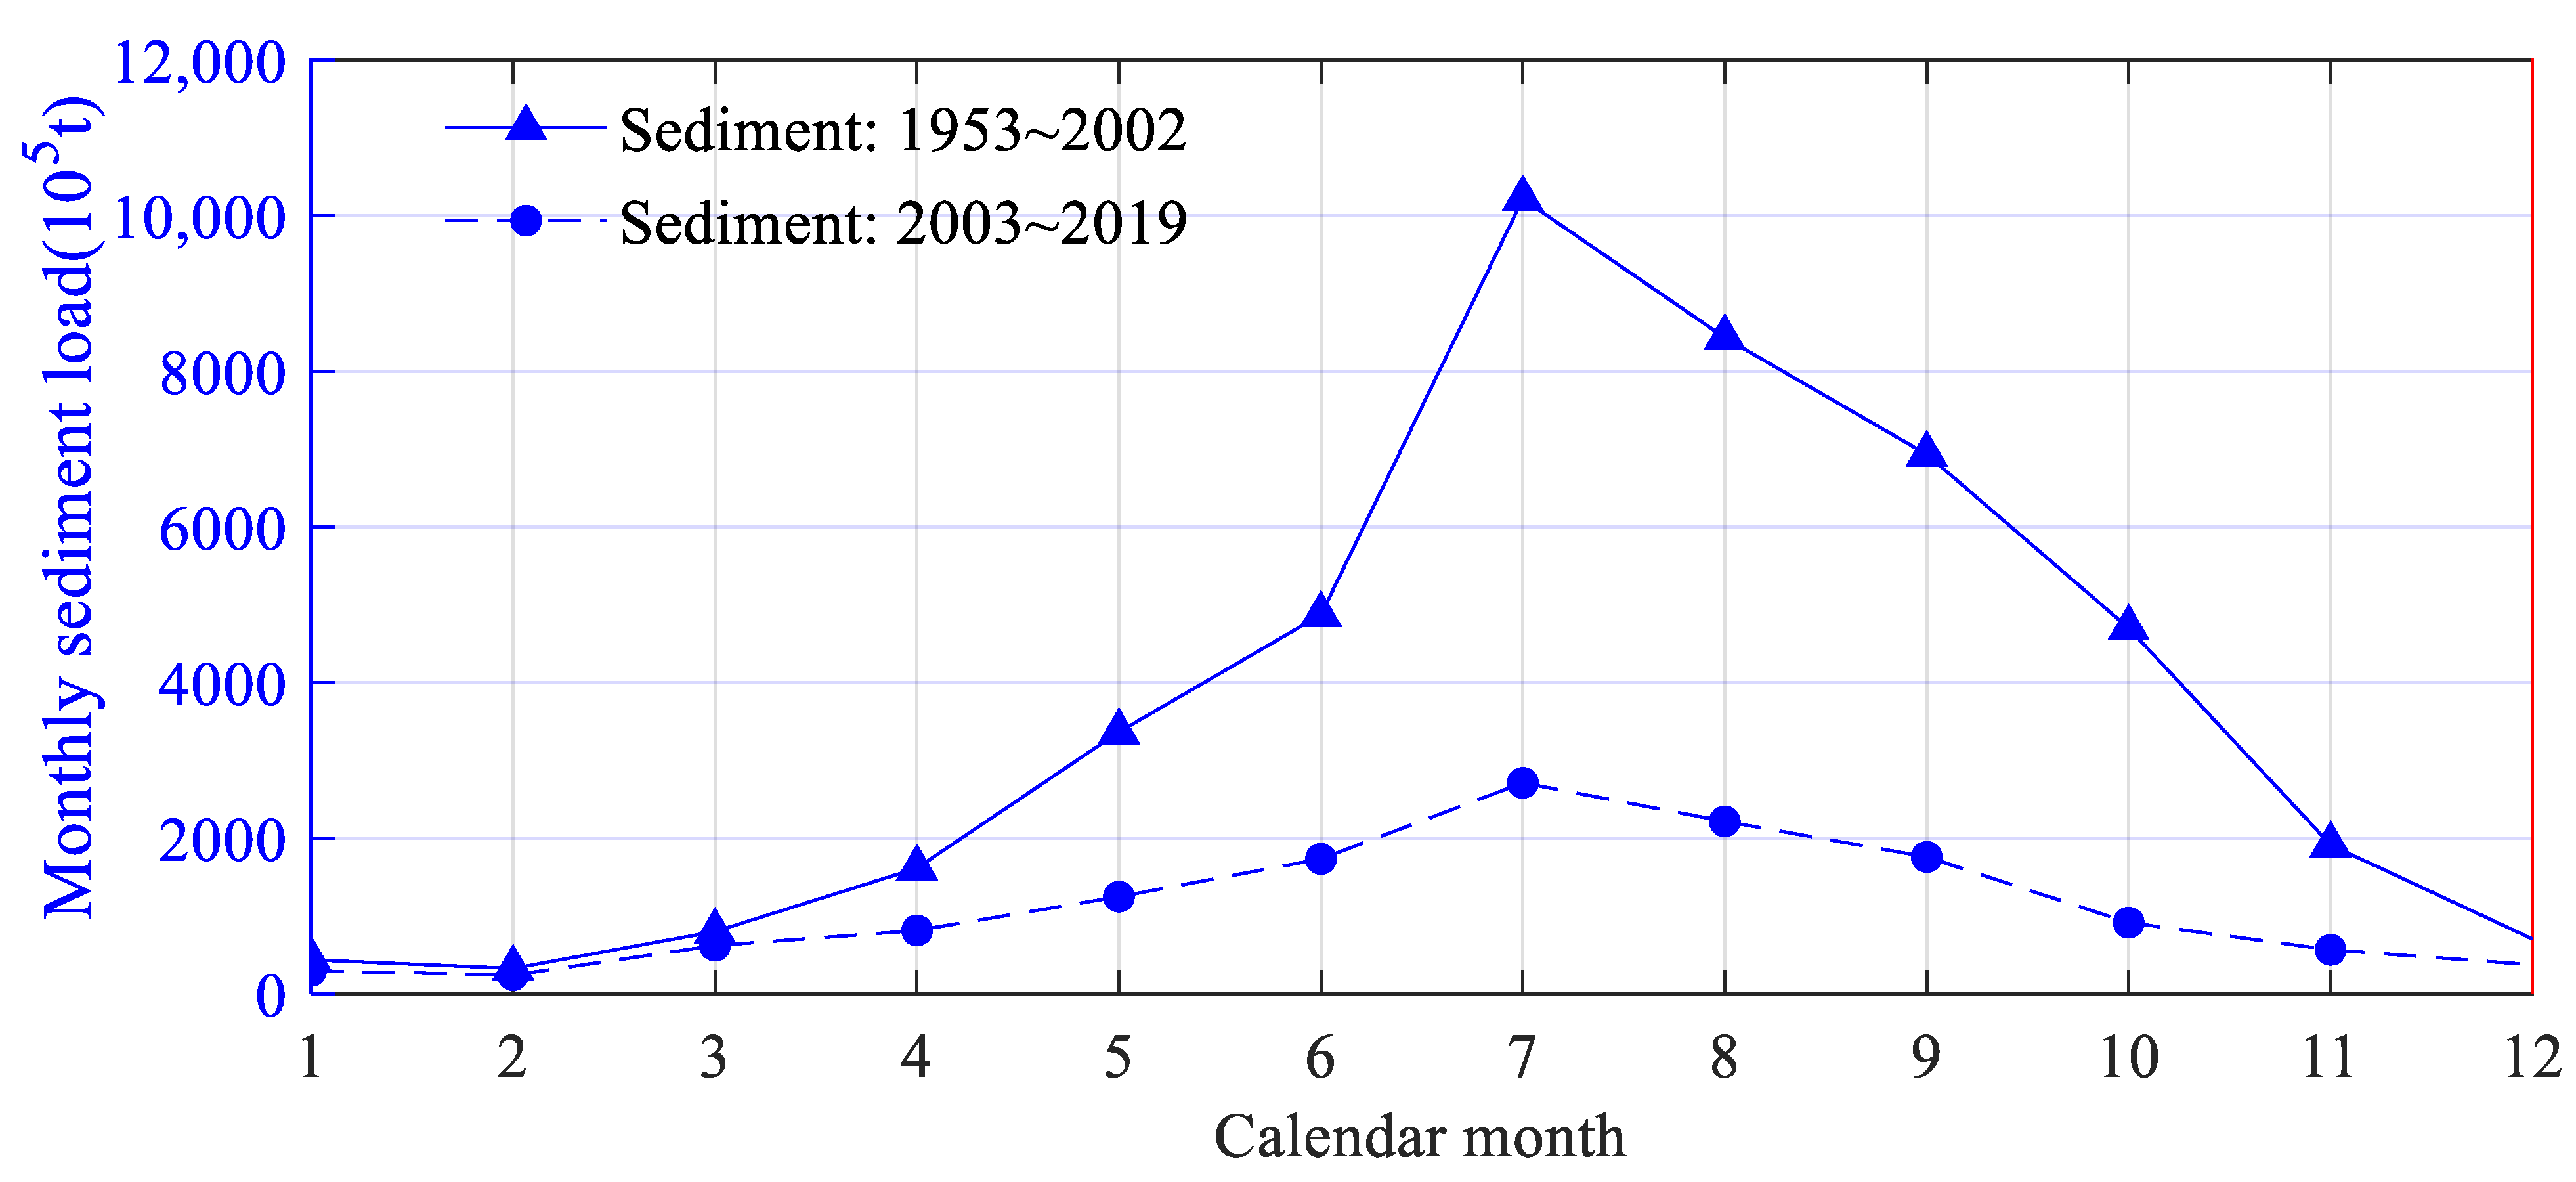
4.1. Contribution of Declined Riverine Sediment Input to Variations in SSC in the TMZ

Due to the impoundment and sediment retention of the TGD in 2003, riverine sediment has decreased to 38.3% and 52.9% of the average sediment load in 1951–1985 and 1986–2002 [43], respectively, especially during flood seasons (Figure 11). The SSC value in flood seasons outside the TMZ reflects a significant downward trend after the closure of the TGD in 2003. However, the decrease in regional SSC in the TMZ lagged the decrease in SSC outside the TMZ, and considerable erosion occurred in the adjacent coastal areas (Figure 7), indicating increased sediment input from other sediment sources, local resuspension, and coastal erosion.
Although the decrease in SSC of the Yangtze Estuary due to the decreased fluvial sediment supply was already reported by previous researchers [44,45], in this study, we clearly demonstrated a decrease in regional SSC in the TMZ and a lag between the decrease of SSC inside and outside the TMZ. We also revealed the exact role of storm-induced sediment resuspension processes for the TMZ’s sediment supply. The results also confirmed that local resuspension of shoals in the estuarine channels and landward transport of sediment eroded from the subaqueous delta have become the primary sediment sources for the TMZ of the Yangtze Estuary [32].

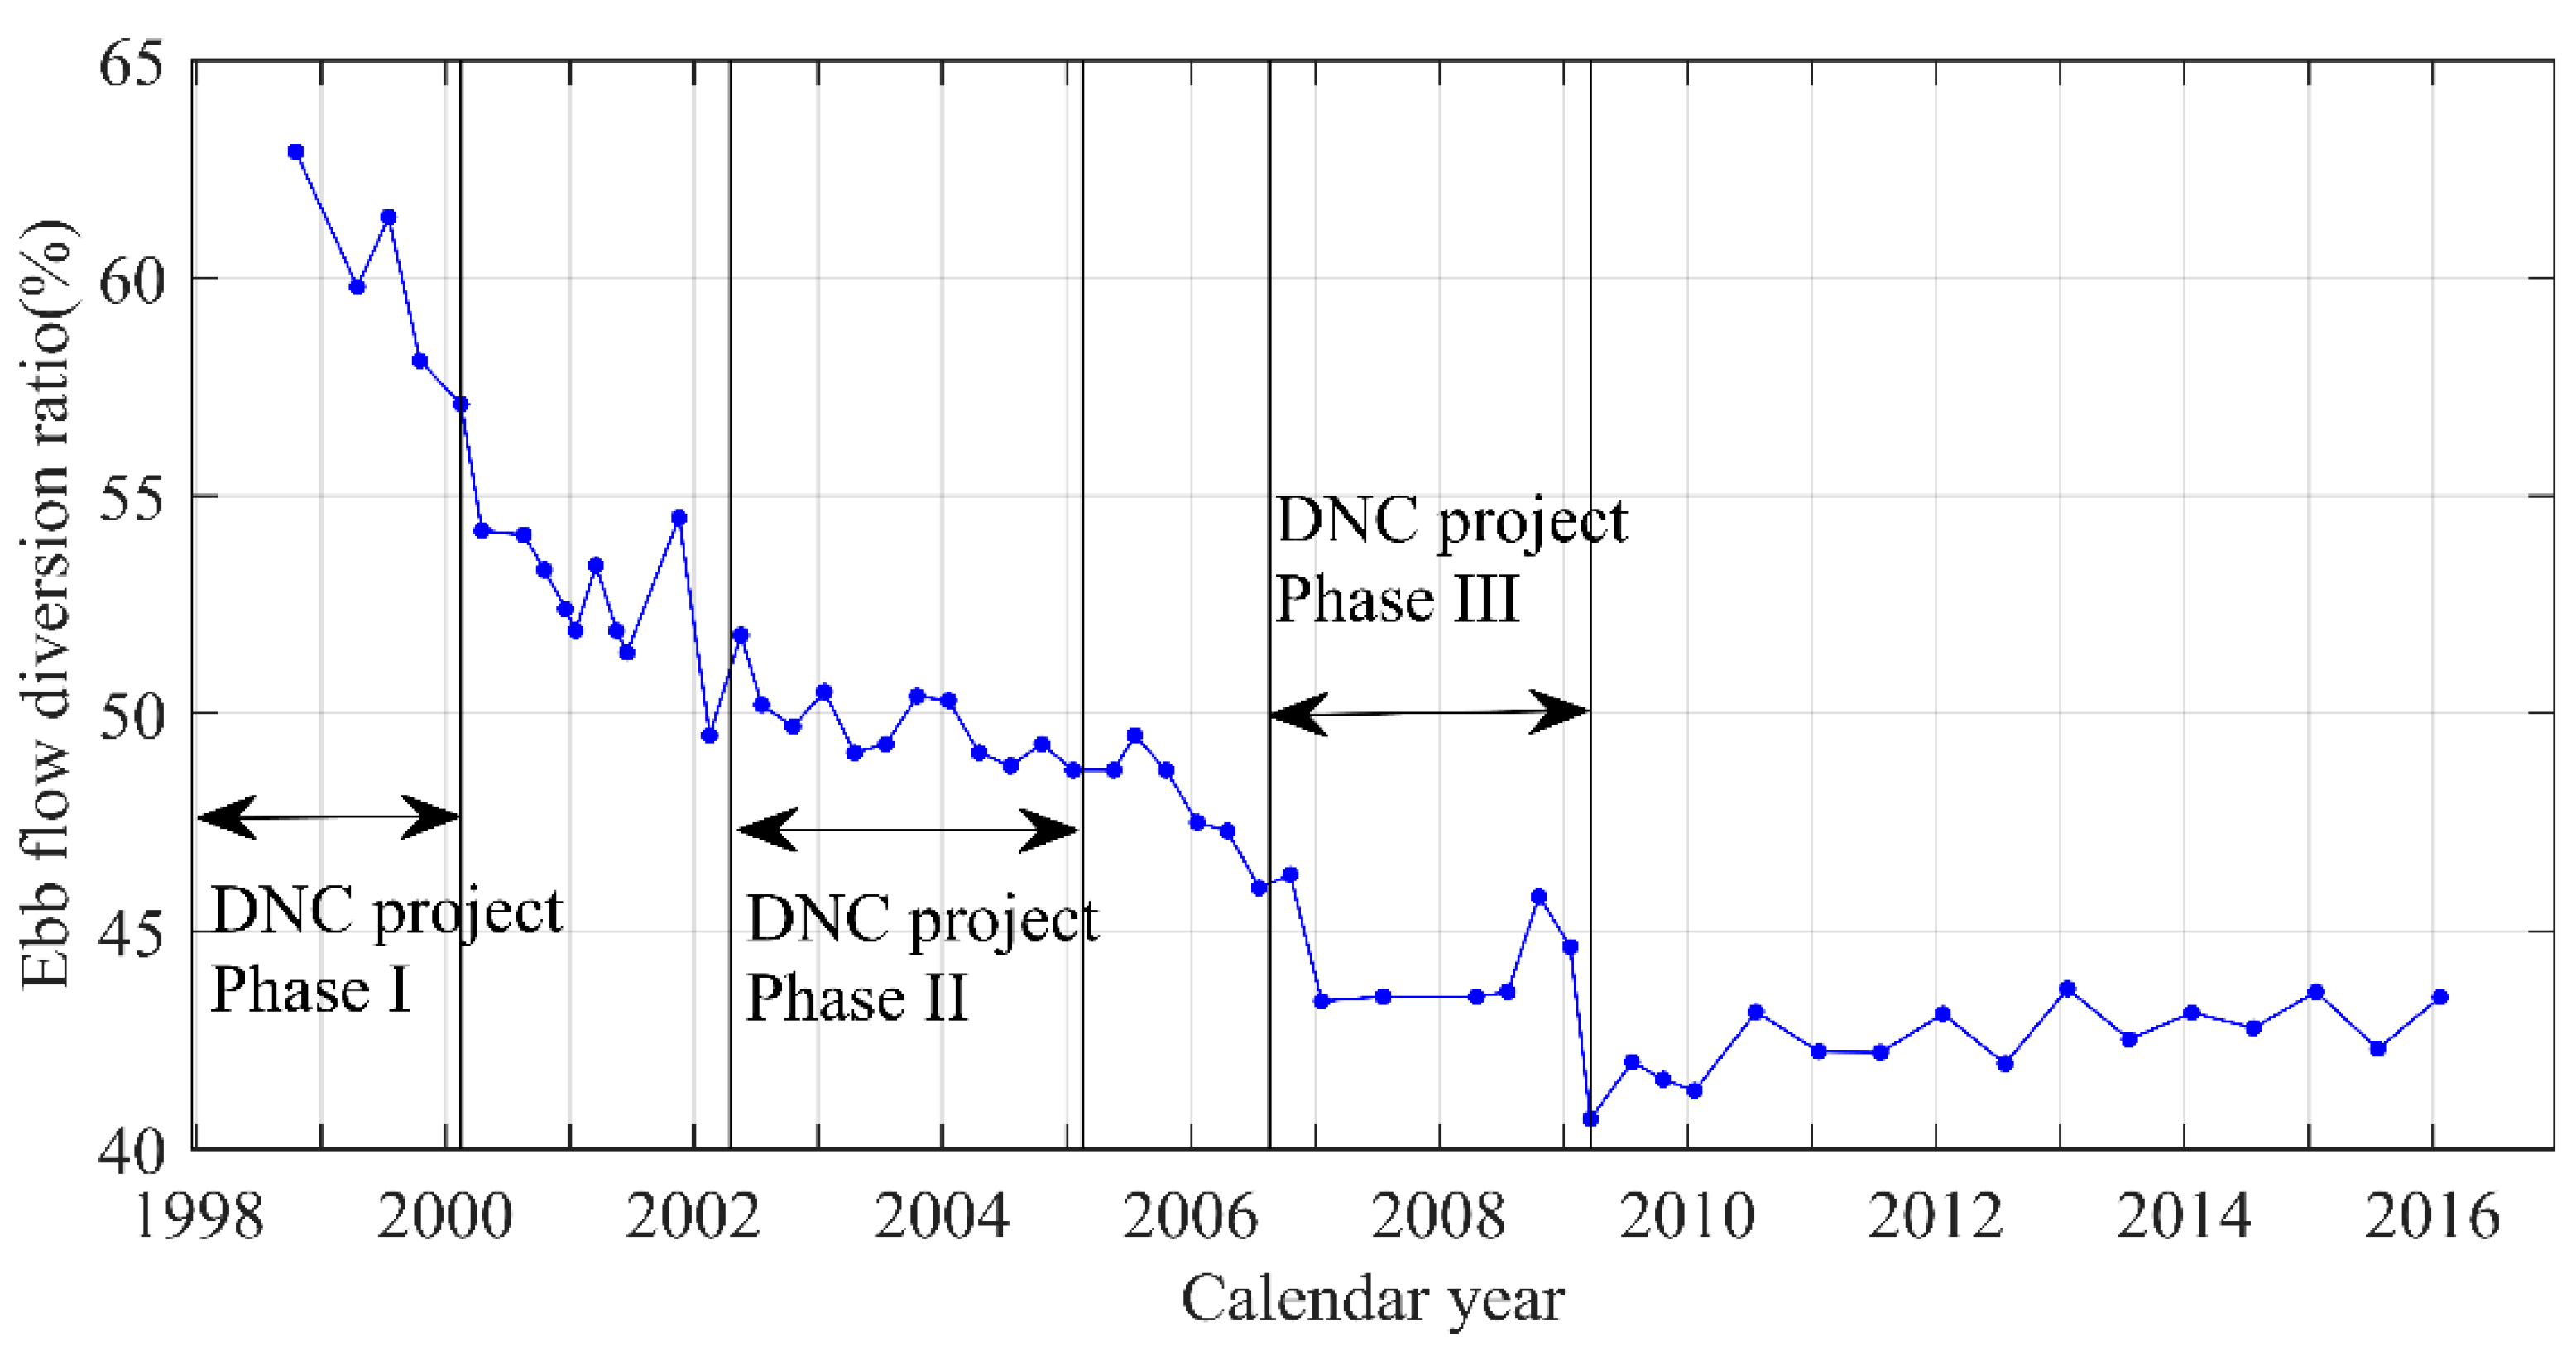
4.2. Effects of Local Human Interventions on the TMZ

The local anthropogenic measures assessed here are the dredging and engineering works from 1998 to 2010 in the DNC regulation project. Since 1998, when the submerged dikes of the diversion project (Figure 1b) were implemented at the bifurcation node of the NP and SP, and submerged dikes, leading jetties, and groins were implemented in the NP, the ebb flow-diversion ratio of the NP decreased from approximately 60% before the project to approximately 42% after the project (Figure 12). On the contrary, the ebb flow-diversion ratio of the south channel increased significantly. The significant changes that occurred in the ebb flow diversion between the NP and SP were mainly caused by the enhanced baroclinic pressure gradient and the excellent form resistance introduced by the engineering works in the NP [46].
In the NP, a decrease in the ebb flow diversion caused decreased ebb flow in the upper reaches, which might contribute to the landward shift of the sediment null point during the low discharge period and to the intensive siltation in the upper reaches. Moreover, the frictional effects of the groins on the flow produced geometrically controlled eddies, which caused intense accretion in the groin areas [47]. The seaward shift of the sediment null point during high discharge periods and the deepening of the main channel in the middle and lower reaches were mainly related to the increase in the ebb flow of the main channel following the construction of training walls and groins that concentrated ebb flow in the main channel.
In the SP, a significant decrease in the ebb flow diversion in the NP caused an enhancement of ebb flow. The RC in the upper reaches of the SP in 2019 was more than 55%, indicating ebb dominance (Figure 2). Hence, the sediment null point and TMZ could no longer exist in the upper reaches. The significant increase in ebb flow is considered the main reason for the seaward migration of the TMZ, and the strong local scour and disappearance of the mouth bars in the upper reaches. Basically, the cause of the flow dominance variation in the SP was the construction of the DNC regulation project in the NP.
Furthermore, the ebb-tidal velocity increased sharply in the NC through the narrowing of the cross-section, which is considered to enhance the capacity of seaward sediment transport and is one of the primary purposes of the DNC regulation project [48]. However, we found that the DNC regulation project did not change the existence of the TMZ but resulted in the landward migration of the TMZ in a low or middle discharge scenario, which means the opposite direction of the desired purpose of enhancing the seaward sediment transport.

4.3. Linkage between Local Human Interventions, TMZ Migration, and Mouth Bar Evolution

The significant migration of the TMZ was related to the DNC project, which has significantly changed the water and sediment dynamics and morphology of the NP and SP. The migration patterns of the core area obtained from correlation analysis between the location of the sediment null point and the relative dynamics of river discharge and tide are significantly different from previous results [49]. By comparing single observations before and during the DNC project in the NP, Jiang et al. (2013) observed a landward shift of the core area during the flood season. Because the location of the TMZ is sensitive to variations in river discharge and tidal range, the previous results, based on the comparison of several observations, have significant limitations.
The morphological changes in the mouth bars were also mainly due to the engineering works of the DNC project, which have been reported in previous studies [36,50,51]. In the SP, it has been reported that an increasing upstream ebb force after 1998 resulted in erosion in the upper part of the mouth bar, the downstream shift of the crest, and a decrease in the slope at the riverside [52]. In the NP, the disappearance of the mouth bar due to dredging was illustrated in several studies [36,50]. However, in this study, we observed that the mouth bar in the NP completely disappeared but that rapid sedimentation continued to form an incipient bar at the location where the mouth bar used to be. In addition, we found that the morphological change in the mouth bars corresponded well with the migration of and changes in the TMZ.
The results obtained in this study are highly relevant to other estuaries or deltas that are subjected to intensive human activities, such as the Mississippi River Delta [17], the Ems Estuary [52,53], the Mersey Estuary [54], and the Pearl River Delta [55]. In all cases, anthropogenic interventions caused significant changes in the hydro-, sediment-, and morpho-dynamics of the estuaries, especially in the Ems Estuary, which turned into a hyper-turbid estuary in response to channel deepening. Fortunately, in the Yangtze Estuary, although intensive human interventions caused a decrease in SSC and the spatial shift of the TMZ, no indications of turning into a hyper-turbid estuary have been documented so far.
The significant changes in the dynamic sedimentation processes of the TMZ in the Yangtze Estuary suggest that human interventions in both river basin and estuary have disturbed the long-term dynamic equilibrium of the sedimentation processes. Due to the complexity of the dynamic sedimentation processes and the limitations of the methodology, this study qualitatively addressed the possible causes of the observed changes. Further work is required to investigate the changes in the transport of suspended sediment and bedload to systematically assess the impacts of human interventions on the dynamic sedimentation processes of the TMZ. The impacts of the engineering projects on the TMZ also need to be fully studied before and after the implementation of artificial projects in the river and the estuary.

5. Conclusions

In the past two decades, the riverine sediment of the Yangtze Estuary has decreased sharply, and during that time many large-scale projects have been built in the estuary. Through the coupled human interventions from the river basin to the estuary, the dynamic sedimentation process of the TMZ in the Yangtze Estuary changed, especially in the NP and SP, following the construction of the large-scale DNC project.
The decreased riverine sediment input caused a decrease in the maximal SSC in the TMZ during the flood seasons, but the decrease in SSC in the TMZ lagged the decrease in SSC outside the TMZ. The DNC project caused changes in the characteristics of the TMZ and associated mouth bars in the NP and SP. Before the DNC project, two TMZs existed both upstream (dry season) and downstream (flood season) in both the NP and SP, respectively, accompanied by mouth bars. After the DNC project, the ebb flow-diversion ratio of the NP decreased by 16%, with a corresponding increase in the SP. In the NP, decreased ebb transport in the upper reaches led to landward migration of the sediment null point and TMZ in low discharge scenarios. In contrast, increased ebb transport in the middle and lower reaches caused seaward migration of the sediment null point and the TMZ in high discharge scenarios. Although the mouth bar was removed by channel dredging, rapid sedimentation continued to form an incipient bar at the location where the mouth bar used to be. In the SP, increased ebb transport after the project induced the seaward migration of the sediment null point, the disappearance of the TMZ and mouth bars in the upper reaches, a 10–15 km seaward migration of the TMZ in the middle and lower reaches, and an overall deepening of the main channel, especially in the upper reaches.
Construction regulation projects in the TMZ, intending to narrow the cross-section and to enhance seaward sediment transport, may result in the opposite effect. Before and after engineering projects, the impacts of such projects on estuarine processes need to be carefully estimated.

Author Contributions

Conceptualization, J.L., W.L. and C.J.; data curation, W.L. and S.Z.; formal analysis and writing, C.J. and W.L. All authors have read and agreed to the published version of the manuscript.

Funding

This research was funded by the National Natural Science Foundation of China (No. 51761135023, No. 41806104, No. U2040202) and the Fundamental Research Funds for the Central Universities of China (No. 40500-20105-222050).

Institutional Review Board Statement

Not applicable.

Informed Consent Statement

Not applicable.

Data Availability Statement

The data that support the findings of this study are openly available in “figshare” at https://doi.org/10.6084/m9.figshare.14151623.v1, accessd on 8 April 2022.

Conflicts of Interest

The authors declare no conflict of interest.

References

  1. Mitchell, S. Turbidity maxima in four macrotidal estuaries. Ocean Coast. Manag. 2013, 79, 62–69. [Google Scholar] [CrossRef]
  2. Li, J.; Zhang, C. Sediment resuspension and implications for turbidity maximum in the Changjiang Estuary. Mar. Geol. 1998, 148, 117–124. [Google Scholar] [CrossRef]
  3. Billy, J.; Chaumillon, E.; Féniès, H.; Poirier, C. Tidal and fluvial controls on the morphological evolution of a lobate estuarine tidal bar: The Plassac Tidal Bar in the Gironde Estuary (France). Geomorphology 2012, 169–170, 86–97. [Google Scholar] [CrossRef]
  4. Fan, H.; Huang, H.; Zeng, T.Q.; Wang, K. River mouth bar formation, riverbed aggradation and channel migration in the modern Huanghe (Yellow) River delta, China. Geomorphology 2006, 74, 124–136. [Google Scholar] [CrossRef]
  5. Chaumillon, E.; Féniès, H.; Billy, J.; Breilh, J.-F.; Richetti, H. Tidal and fluvial controls on the internal architecture and sedimentary facies of a lobate estuarine tidal bar (The Plassac Tidal Bar in the Gironde Estuary, France). Mar. Geol. 2013, 346, 58–72. [Google Scholar] [CrossRef]
  6. Allen, G.P.; Sauzay, G.; Castaing, P. Transport and deposition of suspended sediment in the Gironde Estuary, France. In Estuarine Processes; Wiley, M., Ed.; Academic Press: Cambridge, MA, USA, 1977; pp. 63–81. [Google Scholar]
  7. Defontaine, S.; Sous, D.; Morichon, D.; Verney, R.; Monperrus, M. Hydrodynamics and SPM transport in an engineered tidal estuary: The Adour river (France). Estuar. Coast. Shelf Sci. 2019, 231, 106445. [Google Scholar] [CrossRef] [Green Version]
  8. Wu, J.; Liu, J.T.; Wang, X. Sediment trapping of turbidity maxima in the Changjiang Estuary. Mar. Geol. 2012, 303–306, 14–25. [Google Scholar] [CrossRef]
  9. Asp, N.; Gomes, V.; Schettini, C.; Souza-Filho, P.; Siegle, E.; Ogston, A.; Nittrouer, C.; Silva, J.; Nascimento, W.; Souza, S.; et al. Sediment dynamics of a tropical tide-dominated estuary: Turbidity maximum, mangroves and the role of the Amazon River sediment load. Estuar. Coast. Shelf Sci. 2018, 214, 10–24. [Google Scholar] [CrossRef]
  10. Deloffre, J.; Lafite, R.; Lesueur, P.; Verney, R.; Lesourd, S.; Cuvilliez, A.; Taylor, J. Controlling factors of rhythmic sedimentation processes on an intertidal estuarine mudflat—Role of the turbidity maximum in the macrotidal Seine estuary, France. Mar. Geol. 2006, 235, 151–164. [Google Scholar] [CrossRef]
  11. Talke, S.; de Swart, H.; Schuttelaars, H. Feedback between residual circulations and sediment distribution in highly turbid estuaries: An analytical model. Cont. Shelf Res. 2009, 29, 119–135. [Google Scholar] [CrossRef] [Green Version]
  12. Toublanc, F.; Brenon, I.; Coulombier, T. Formation and structure of the turbidity maximum in the macrotidal Charente estuary (France): Influence of fluvial and tidal forcing. Estuar. Coast. Shelf Sci. 2016, 169, 1–14. [Google Scholar] [CrossRef]
  13. Uncles, R.; Stephens, J.; Harris, C. Runoff and tidal influences on the estuarine turbidity maximum of a highly turbid system: The upper Humber and Ouse Estuary, UK. Mar. Geol. 2006, 235, 213–228. [Google Scholar] [CrossRef]
  14. Wolanski, E.; King, B.; Galloway, D. Dynamics of the turbidity maximum in the Fly River estuary, Papua New Guinea. Estuar. Coast. Shelf Sci. 1995, 40, 321–337. [Google Scholar] [CrossRef]
  15. Anthony, E.J.; Brunier, G.; Besset, M.; Goichot, M.; Dussouillez, P.; Nguyen, V.L. Linking rapid erosion of the Mekong River delta to human activities. Sci. Rep. 2015, 5, 14745. [Google Scholar] [CrossRef] [PubMed] [Green Version]
  16. Yang, S.L.; Xu, K.; Milliman, J.D.; Yang, H.F.; Wu, C.S. Decline of Yangtze River water and sediment discharge: Impact from natural and anthropogenic changes. Sci. Rep. 2015, 5, 12581. [Google Scholar] [CrossRef]
  17. Blum, M.D.; Roberts, H.H. Drowning of the Mississippi Delta due to insufficient sediment supply and global sea-level rise. Nat. Geosci. 2009, 2, 488–491. [Google Scholar] [CrossRef]
  18. Hodoki, Y.; Murakami, T. Effects of tidal flat reclamation on sediment quality and hypoxia in Isahaya Bay. Aquat. Conserv. Mar. Freshw. Ecosyst. 2006, 16, 555–567. [Google Scholar] [CrossRef]
  19. van der Wal, D.; Pye, K.; Neal, A. Long-term morphological change in the Ribble Estuary, northwest England. Mar. Geol. 2002, 189, 249–266. [Google Scholar] [CrossRef]
  20. van Maren, D.; Vroom, J.; Fettweis, M.; Vanlede, J. Formation of the Zeebrugge coastal turbidity maximum: The role of uncertainty in near-bed exchange processes. Mar. Geol. 2020, 425, 106186. [Google Scholar] [CrossRef]
  21. Kim, T.; Choi, B.; Lee, S. Hydrodynamics and sedimentation induced by large-scale coastal developments in the Keum River Estuary, Korea. Estuar. Coast. Shelf Sci. 2006, 68, 515–528. [Google Scholar] [CrossRef]
  22. Schulz, E.; Grasso, F.; Le Hir, P.; Verney, R.; Thouvenin, B. Suspended Sediment Dynamics in the Macrotidal Seine Estuary (France): 2. Numerical Modeling of Sediment Fluxes and Budgets Under Typical Hydrological and Meteorological Conditions. J. Geophys. Res. Ocean. 2018, 123, 578–600. [Google Scholar] [CrossRef] [Green Version]
  23. McSweeney, J.M.; Chant, R.J.; Sommerfield, C.K. Lateral variability of sediment transport in the Delaware Estuary. J. Geophys. Res. Ocean. 2016, 121, 725–744. [Google Scholar] [CrossRef] [Green Version]
  24. Teng, L.; Cheng, H.; de Swart, H.; Dong, P.; Li, Z.; Li, J.; Wang, Y. On the mechanism behind the shift of the turbidity maximum zone in response to reclamations in the Yangtze (Changjiang) Estuary, China. Mar. Geol. 2021, 440, 106569. [Google Scholar] [CrossRef]
  25. Alebregtse, N.; De Swart, H. Effect of river discharge and geometry on tides and net water transport in an estuarine network, an idealized model applied to the Yangtze Estuary. Cont. Shelf Res. 2016, 123, 29–49. [Google Scholar] [CrossRef]
  26. Dai, Z.; Chu, A.; Li, W.; Li, J.; Wu, H. Has suspended sediment concentration near the mouth bar of the Yangtze (Changjiang) Estuary been declining in recent years? J. Coast. Res. 2013, 29, 809–818. [Google Scholar] [CrossRef]
  27. Wei, W.; Dai, Z.; Mei, X.; Liu, P.; Gao, S.; Li, S. Shoal morphodynamics of the Changjiang (Yangtze) estuary: Influences from river damming, estuarine hydraulic engineering and reclamation projects. Mar. Geol. 2017, 386, 32–43. [Google Scholar] [CrossRef]
  28. Li, J.; He, Q.; Zhang, C. A study on sediment deposition and resuspension in the mouth bar area of the Changjiang River Estuary. Oceanol. Limnol. Sin. 2000, 31, 101–109. [Google Scholar]
  29. Chen, J. Sediment dynamics and evolution of the mouthbar and subaqueous delta in the Yangtze Estuary. Resour. Environ. Yangtze Val. 1995, 4, 348–355, (In Chinese with English Abstract). [Google Scholar]
  30. Dai, Z.; Chu, A.; Stive, M.; Du, J.; Li, J. Is the Three Gorges Dam the cause behind the extremely low suspended sediment discharge into the Yangtze (Changjiang) Estuary of 2006? Hydrol. Sci. J. 2011, 56, 1280–1288. [Google Scholar] [CrossRef]
  31. Zhang, Q.; Xu, C.-Y.; Singh, V.; Yang, T. Multiscale variability of sediment load and streamflow of the lower Yangtze River basin: Possible causes and implications. J. Hydrol. 2009, 368, 96–104. [Google Scholar] [CrossRef]
  32. Dai, Z.; Mei, X.; Darby, S.; Lou, Y.; Li, W. Fluvial sediment transfer in the Changjiang (Yangtze) river-estuary depositional system. J. Hydrol. 2018, 566, 719–734. [Google Scholar] [CrossRef] [Green Version]
  33. Ma, G.; Shi, F.; Liu, S.; Qi, D. Migration of sediment deposition due to the construction of large-scale structures in Changjiang Estuary. Appl. Ocean Res. 2013, 43, 148–156. [Google Scholar] [CrossRef]
  34. Yang, Y.; Li, Y.; Fan, Y.; Zhang, J. Impact of water and sediment discharges on subaqueous delta evolution in Yangtze Estuary from 1950 to 2010. Water Sci. Eng. 2014, 7, 331–343. [Google Scholar]
  35. Li, J.; Jiang, C.; Liu, Q.; Zhao, J. Water and Sediment Transportation and Fluvial Processes in the Yangtze Estuary; Science Press: Beijing, China, 2019; (In Chinese with English Abstract). [Google Scholar]
  36. Jiang, C.; Li, J.; de Swart, H.E. Effects of navigational works on morphological changes in the bar area of the Yangtze Estuary. Geomorphology 2012, 139–140, 205–219. [Google Scholar] [CrossRef]
  37. Simmons, H.B. Some effects of upload discharge on estuarine hydraulics. Proc. Am. Soc. Civ. Eng. 1995, 81, 1–20. [Google Scholar]
  38. Burchard, H.; Schuttelaars, H.M.; Ralston, D.K. Sediment Trapping in Estuaries. Annu. Rev. Mar. Sci. 2018, 10, 371–395. [Google Scholar] [CrossRef]
  39. Oliver, M.A.; Webster, R. Kriging: A method of interpolation for geographical information systems. Geogr. Inf. Syst. 1990, 4, 313–332. [Google Scholar] [CrossRef]
  40. Chen, S.; Zhang, G.; Yang, S. Temporal and spatial changes of suspended sediment concentration and resuspension in the Yangtze River Estuary. J. Geogr. Sci. 2003, 13, 498–506. [Google Scholar]
  41. Yang, H.; Li, B.; Zhang, C.; Qiao, H.; Liu, Y.; Bi, J.; Zhang, Z.; Zhou, F. Recent Spatio-Temporal Variations of Suspended Sediment Concentrations in the Yangtze Estuary. Water 2020, 12, 818. [Google Scholar] [CrossRef] [Green Version]
  42. Li, J.; Shi, W.; Shen, H. Sediment properties and transprotation in the turbidity maximum in Changjiang Estuary. Geogr. Res. 1994, 13, 51–59, (In Chinese with English Abstract). [Google Scholar] [CrossRef]
  43. Zheng, S.; Cheng, H.; Lv, J.; Li, Z.; Zhou, L. Morphological evolution of estuarine channels influenced by multiple anthropogenic stresses: A case study of the North Channel, Yangtze estuary, China. Estuar. Coast. Shelf Sci. 2021, 249, 107075. [Google Scholar] [CrossRef]
  44. Yang, H.; Yang, S.; Xu, K.; Milliman, J.; Wang, H.; Yang, Z.; Chen, Z.; Zhang, C. Human impacts on sediment in the Yangtze River: A review and new perspectives. Glob. Planet. Chang. 2018, 162, 8–17. [Google Scholar] [CrossRef]
  45. Yang, Y.-P.; Zhang, M.-J.; Li, Y.-T.; Zhang, W. The variations of suspended sediment concentration in Yangtze River Estuary. J. Hydrodyn. 2015, 27, 845–856. [Google Scholar] [CrossRef]
  46. Li, L.; Zhu, J.; Wu, H.; Wang, B. A numerical study on water diversion ratio of the Changjiang (Yangtze) estuary in dry season. Chin. J. Oceanol. Limnol. 2010, 28, 700–712. [Google Scholar] [CrossRef]
  47. Hu, K.; Ding, P. The effect of deep waterway constructions on hydrodynamics and salinities in Yangtze Estuary, China. J. Coast. Res. 2009, SI56, 961–965. [Google Scholar]
  48. Wan, Y.; Gu, F.; Wu, H.; Roelvink, D. Hydrodynamic evolutions at the Yangtze Estuary from 1998 to 2009. Appl. Ocean Res. 2014, 47, 291–302. [Google Scholar] [CrossRef]
  49. Jiang, C.; de Swart, H.E.; Li, J.; Liu, G. Mechanisms of along-channel sediment transport in the North Passage of the Yangtze Estuary and their response to large-scale interventions. Ocean Dyn. 2013, 63, 283–305. [Google Scholar] [CrossRef]
  50. Luan, H.; Ding, P.X.; Wang, Z.B.; Yang, S.L.; Lu, J.Y. Morphodynamic impacts of large-scale engineering projects in the Yangtze River delta. Coast. Eng. 2018, 141, 1–11. [Google Scholar] [CrossRef]
  51. Zhou, X.; Dai, Z.; Mei, X. The multi-decadal morphodynamic changes of the mouth bar in a mixed fluvial-tidal estuarine channel. Mar. Geol. 2020, 429, 106311. [Google Scholar] [CrossRef]
  52. de Jonge, V.N.; Schuttelaars, H.M.; van Beusekom, J.E.E.; Talke, S.A.; de Swart, H.E. The Influence of channel deepening on estuarine turbidity levels and dynamics, as exemplified by the Ems Estuary. Estuar. Coast. Shelf Sci. 2014, 139, 46–59. [Google Scholar] [CrossRef]
  53. Blott, S.J.; Pye, K.; van der Wal, D.; Neal, A. Long-term morphological change and its causes in the Mersey Estuary, NW England. Geomorphology 2006, 81, 185–206. [Google Scholar] [CrossRef]
  54. Dijkstra, Y.M.; Schuttelaars, H.M.; Schramkowski, G.P.; Brouwer, R. Modeling the Transition to High Sediment Concentrations as a Response to Channel Deepening in the Ems River Estuary. J. Geophys. Res. Ocean. 2019, 124, 1578–1594. [Google Scholar] [CrossRef] [Green Version]
  55. Liu, F.; Xie, R.; Luo, X.; Yang, L.; Cai, H.; Yang, Q. Stepwise adjustment of deltaic channels in response to human interventions and its hydrological implications for sustainable water managements in the Pearl River Delta, China. J. Hydrol. 2019, 573, 194–206. [Google Scholar] [CrossRef]
Figure 1. Location of the TMZ in the Yangtze Estuary in the 1990s (reproduced from [2], with permission from Elsevier, 2022) (a). Bathymetry of the Yangtze Estuary in 1997 and 2019, including current, tide elevation, and wave survey stations (b).
Jmse 10 00584 g001
Figure 2. Longitudinal–vertical profile of the tidal mean SSC and salinity in spring and neap tides in the NP (ad) and SP (eh) during flood and dry seasons in 2016; the survey stations are marked in Figure 1b.
Jmse 10 00584 g002
Figure 3. Longitudinal–vertical distribution of the RC and water/sediment null points in the NP (ad) and SP (eh) during flood and dry seasons in 2016; the survey stations are marked in Figure 1b.
Jmse 10 00584 g003
Figure 4. Longitudinal distribution of the tidal averaged SSC in NP (a) and SP (b) during the spring tide and neap tide in dry and flood seasons in 2016, and simultaneous significant wave height and wave period at NCD station (the position of NCD station is shown in Figure 1b) during dry (c) and flood (d) seasons in 2016.
Jmse 10 00584 g004
Figure 5. Tidal mean SSC in the spring tide of the flood season from 1999 to 2016.
Jmse 10 00584 g005
Figure 6. Relationship between the distance (L) of the sediment null point to Hengsha (NP) (a)–Xiaojiuduan (SP) (b) section and the ratio of discharge (Q) at the Datong station and tidal range (H) at the Zhongjun station (the dataset of 1978–1994 in SP has been published in [42]).
Jmse 10 00584 g006
Figure 7. Bathymetric changes in the Yangtze Estuary from 1997 to 2019 (a), cross-sectional bathymetric change at bifurcation node of the NP and SP ((b), section P1 in Figure 7a), middle of the NB and SB ((c), section P2 in Figure 7a), and middle of the NC and SC ((d), section P3 in Figure 7a).
Jmse 10 00584 g007
Figure 8. Changes in water volume below given reference elevation (solid lines) or between given reference planes (bars) in the NP (a) and SP (b). The statistical areas of the NP and SP are marked in Figure 1b.
Jmse 10 00584 g008
Figure 9. Longitudinal bathymetric profile along the navigation channel in the NP (a) and SP (b) in 1997 and 2019; the profile routes are shown in Figure 1b.
Jmse 10 00584 g009
Figure 10. Annual deposition rate distribution in the DNC of the NP in 2019.
Jmse 10 00584 g010
Figure 11. Monthly sediment load at the Datong station in different periods. These data were published by the Yangtze Water Conservancy Committee of the Ministry of Water Conservancy of the PRC.
Jmse 10 00584 g011
Figure 12. Ebb flow diversion-ratio of the NP (compared to the SP) from 1998 to 2016.
Jmse 10 00584 g012
Table 1. Detailed information on survey measurements.
SeasonTideObservation PeriodDischarge * (m3/s)Observation Stations
floodneap21 June 1999 to 22 June 199940,280B1, B2, B5, B7
floodspring9 October 1999 to 10 October 199945,100B1, B2, B5, B7
dryspring21 February 2000 to 22 February 200011,400B1, B2, B5, B7
floodspring10 August 2002 to 11 August 200248,150B1, B2, B4, B5, B7, B8
dryspring14 February 2006 to 15 February 200618,214A1, A2
floodspring13 August 2006 to 14 August 200635,578B1, B2, B5, B7
dryspring4 February 2007 to 5 February 200712,099A1, A2
dryspring21 May 2008 to 22 May 200826,100A1, A2
floodspring1 August 2008 to 2 August 200838,963B1–B8
dryspring9 February 2009 to 10 February 200911,067A1, A2
floodspring20 August 2009 to 21 August 200940,991B1–B8
floodspring5 September 2009 to 6 September 200939,407A2, A3, A4
floodspring10 August 2010 to 11 August 201061,000B1-B8
floodspring14 August 2011 to 15 August 201130,175A4, A5, B1–B8
dryspring23 February 2012 to 24 February 201215,903B1–B8
floodspring18 August 2012 to 19 August 201252,804A2–A5, B1–B8
floodspring23 July 2013 to 24 July 201339,146B1–B8
floodspring19 September 2013 to 20 September 201327,111A2, A3, A4
dryspring28 February 2014 to 29 February 201415,346B1-B5
floodspring13 July 2014 to 14 July 201443,703A2, A3, A4
floodneap20 July 2014 to 21 July 201444,286A2, A3, A4
dryneap12 February 2015 to 13 February 201512,100A2, A3, A4, B1–B8
floodspring30 July 2015 to 1 August 201541,909B1–B8
dryspring11 March 2016 to 12 March 201618,700A1–A6, B1–B8
dryneap3 March 2016 to 4 March 201618,812A1–A6, B1–B8
floodspring21 July 2016 to 22 July 201663,891A1–A6, B1–B8
floodneap27 July 2016 to 28 July 201662,020A1–A6, B1–B8
* 5-day-lagging daily mean discharge at the Datong station.
Publisher’s Note: MDPI stays neutral with regard to jurisdictional claims in published maps and institutional affiliations.

