Abstract
With the aim of solving the problems of ship trajectory classification and channel identification, a ship trajectory classification method based on deep a convolutional neural network is proposed. First, the ship trajectory data are preprocessed using the improved QuickBundle clustering algorithm. Then, data are converted into ship trajectory image data, a dataset is established, a deep convolutional neural network-based ship trajectory classification model is constructed, and the manually annotated dataset is used for training. The fully connected neural network model and SVM model with latitude and longitude data as input are selected for comparative analysis. The results show that the ship trajectory classification model based on a deep convolutional neural network can effectively distinguish ship trajectories in different waterways, and the proposed method is an effective ship trajectory classification method.
1. Introduction
A ship automatic identification system (AIS) is an open data transmission system widely used in the fields of ship traffic information collection and analysis, ship navigation monitoring, and water traffic planning. The ship trajectory data collected by AIS has the advantages of massiveness and large geographical scope, but the data time interval is too large, and the quality is not high, which introduces challenges to the classification of ship trajectory.
At present, the specific application scenarios of ship trajectory classification methods at home and abroad mainly include the identification of ship types and the classification of ship motion patterns. The realization process is divided into three parts: feature extraction, transformation of ship trajectory data, and modeling of classification models. Chen et al. [1] realized the classification of AIS ship trajectory based on the sparse representation classification algorithm and conducted experiments in the waters of the Yangtze River. The cubic spline method is used to approximate the trajectory of a ship, which may destroy the characteristics of the trajectory of the ship. Kraus et al. [2] used the random forest algorithm to classify ship type by extracting geographic features (navigation route, stay area, etc.) and behavior features (heading, speed, etc.) of the ship’s trajectory and achieved 97.51% recognition accuracy. Based on the AIS ship trajectory, Sánchez et al. [3,4,5,6,7] used SVM and a decision tree to achieve binary classification of fishing boats and preprocessed the trajectory by data cleaning, data filtering, trajectory segmentation, feature extraction and other methods to improve the accuracy of classification. Liu et al. [8] used a semi-supervised deep learning model (SCEDN) for classification in the case of ship encounters, which used an encoder–decoder convolutional structure with four channels (distance, speed to approach point) for each segment time (TCPA) and distance to approach point (DCPA)). Sheng et al. [9,10,11,12,13,14,15] divided the ship’s trajectory into three motion modes: anchoring, going straight, and turning. According to factors such as speed and heading, the behavior characteristics of the three modes were extracted, and the ship trajectory feature classification model was established by logistic regression. Cui Tong et al. [16,17,18,19,20,21,22] combined LSTM and CNN to establish a hybrid classification model, which is characterized by speed, acceleration, heading and curvature, with feature vectors as inputs and ship shape as output. In this method, CNN is used to extract the spatial features of the trajectory data, and LSTM is used to extract the temporal features of the trajectory data. Because ship trajectory data belong to spatial data, in this paper, we refer to some methods for trajectory image classification.
However, with respect to the relevant research results at home and abroad, the following research trends and directions are observed. Research on ship trajectory clustering is gradually developing towards efficient execution and extraction of diversified trajectory data features, and research on trajectory classification is gradually developing towards accurate feature extraction and the establishment of mathematical models based on deep learning. Combined with the main research objects of this paper, the current research has the following shortcomings:
- Most of the current ship trajectory clustering methods are based on the density clustering algorithm of DBSCAN. Although the algorithm complexity is high, there is room for improvement in execution efficiency, and it is difficult to select the dual parameters of DBSCAN.
- When domestic and foreign scholars use supervised algorithms for ship trajectory classification, there is still room for improvement in the use of ship trajectory spatial feature information and the process of extracting features, such as ship trajectory heading and speed.
The main work of this paper:
In this paper, we take ship trajectory data as the research object and investigate a fast, efficient and accurate ship trajectory clustering method for waters with dense and complex traffic flow that obtains the ship trajectory data of various clusters in the water area. In this paper, we use the clustered ship trajectory data as the basis to study ship trajectory anomaly detection a channel classification so as to provide decision support for intelligent risk management and control of ship traffic control departments. Specifically, the main research work of this paper is as follows:
The main task of ship trajectory preprocessing is to eliminate interference trajectories by eliminating ship trajectories that are concentrated in a small area of water with little movement or ship trajectories with a sampling interval that is too long to characterize continuous motion characteristics, eliminating the interference of ship anchor points in trajectory analysis of moving ships, and reducing the complexity of ship trajectories. Under the premise of ship trajectory preprocessing, in this paper, we use the QuickBundles algorithm as a basic method to carry out ship trajectory clustering research. First, we analyze the performance of three trajectory similarity measurement methods, MDF [23], DTW [24], and Hausdorff [25]. Then, aiming at the problem of insufficient sampling of local features of ship trajectory by the QuickBundles algorithm, a sampling method based on heading is used to improve it, and an improved QuickBundles ship trajectory clustering algorithm is proposed. We use the improved QuickBundles algorithm [26] to establish a clustering model of ship trajectories, determine appropriate thresholds according to a variety of evaluation indicators, complete the task of ship trajectory clustering, and conduct comparative experiments with the improved QuickBundles algorithm and the traditional DBSCAN [27] algorithm.
In view of the problem of ship trajectory classification based on latitude and longitude data, the spatial characteristics of the data are not obvious, and the classification effect is not ideal. In this paper, we propose a ship trajectory classification method based on a deep convolutional neural network to classify the channel to which a ship trajectory belongs, achieving the recognition of ship trajectories and waterways. Based on the clustering results, the latitude and longitude coordinates are mapped to the image pixel coordinates according to the scale, the spatial characteristics of the ship trajectory data are extracted, and the ship trajectory image dataset is established. The ship trajectory classification model based on a deep convolutional neural network is established according to on the ResNet50 [28] model, using the training set to train the model. On the test set, the fully connected neural network and multi-class SVM classifier [29] with latitude and longitude data as input are used for comparison with the deep convolution model with trajectory image data as input.
The main contributions include:
- An improved QuickBundles ship trajectory clustering algorithm is proposed.
- A method of ship trajectory classification based on a deep convolutional neural network is proposed that realizes the classification and identification of the waterway to which a ship trajectory belongs.
2. Methods
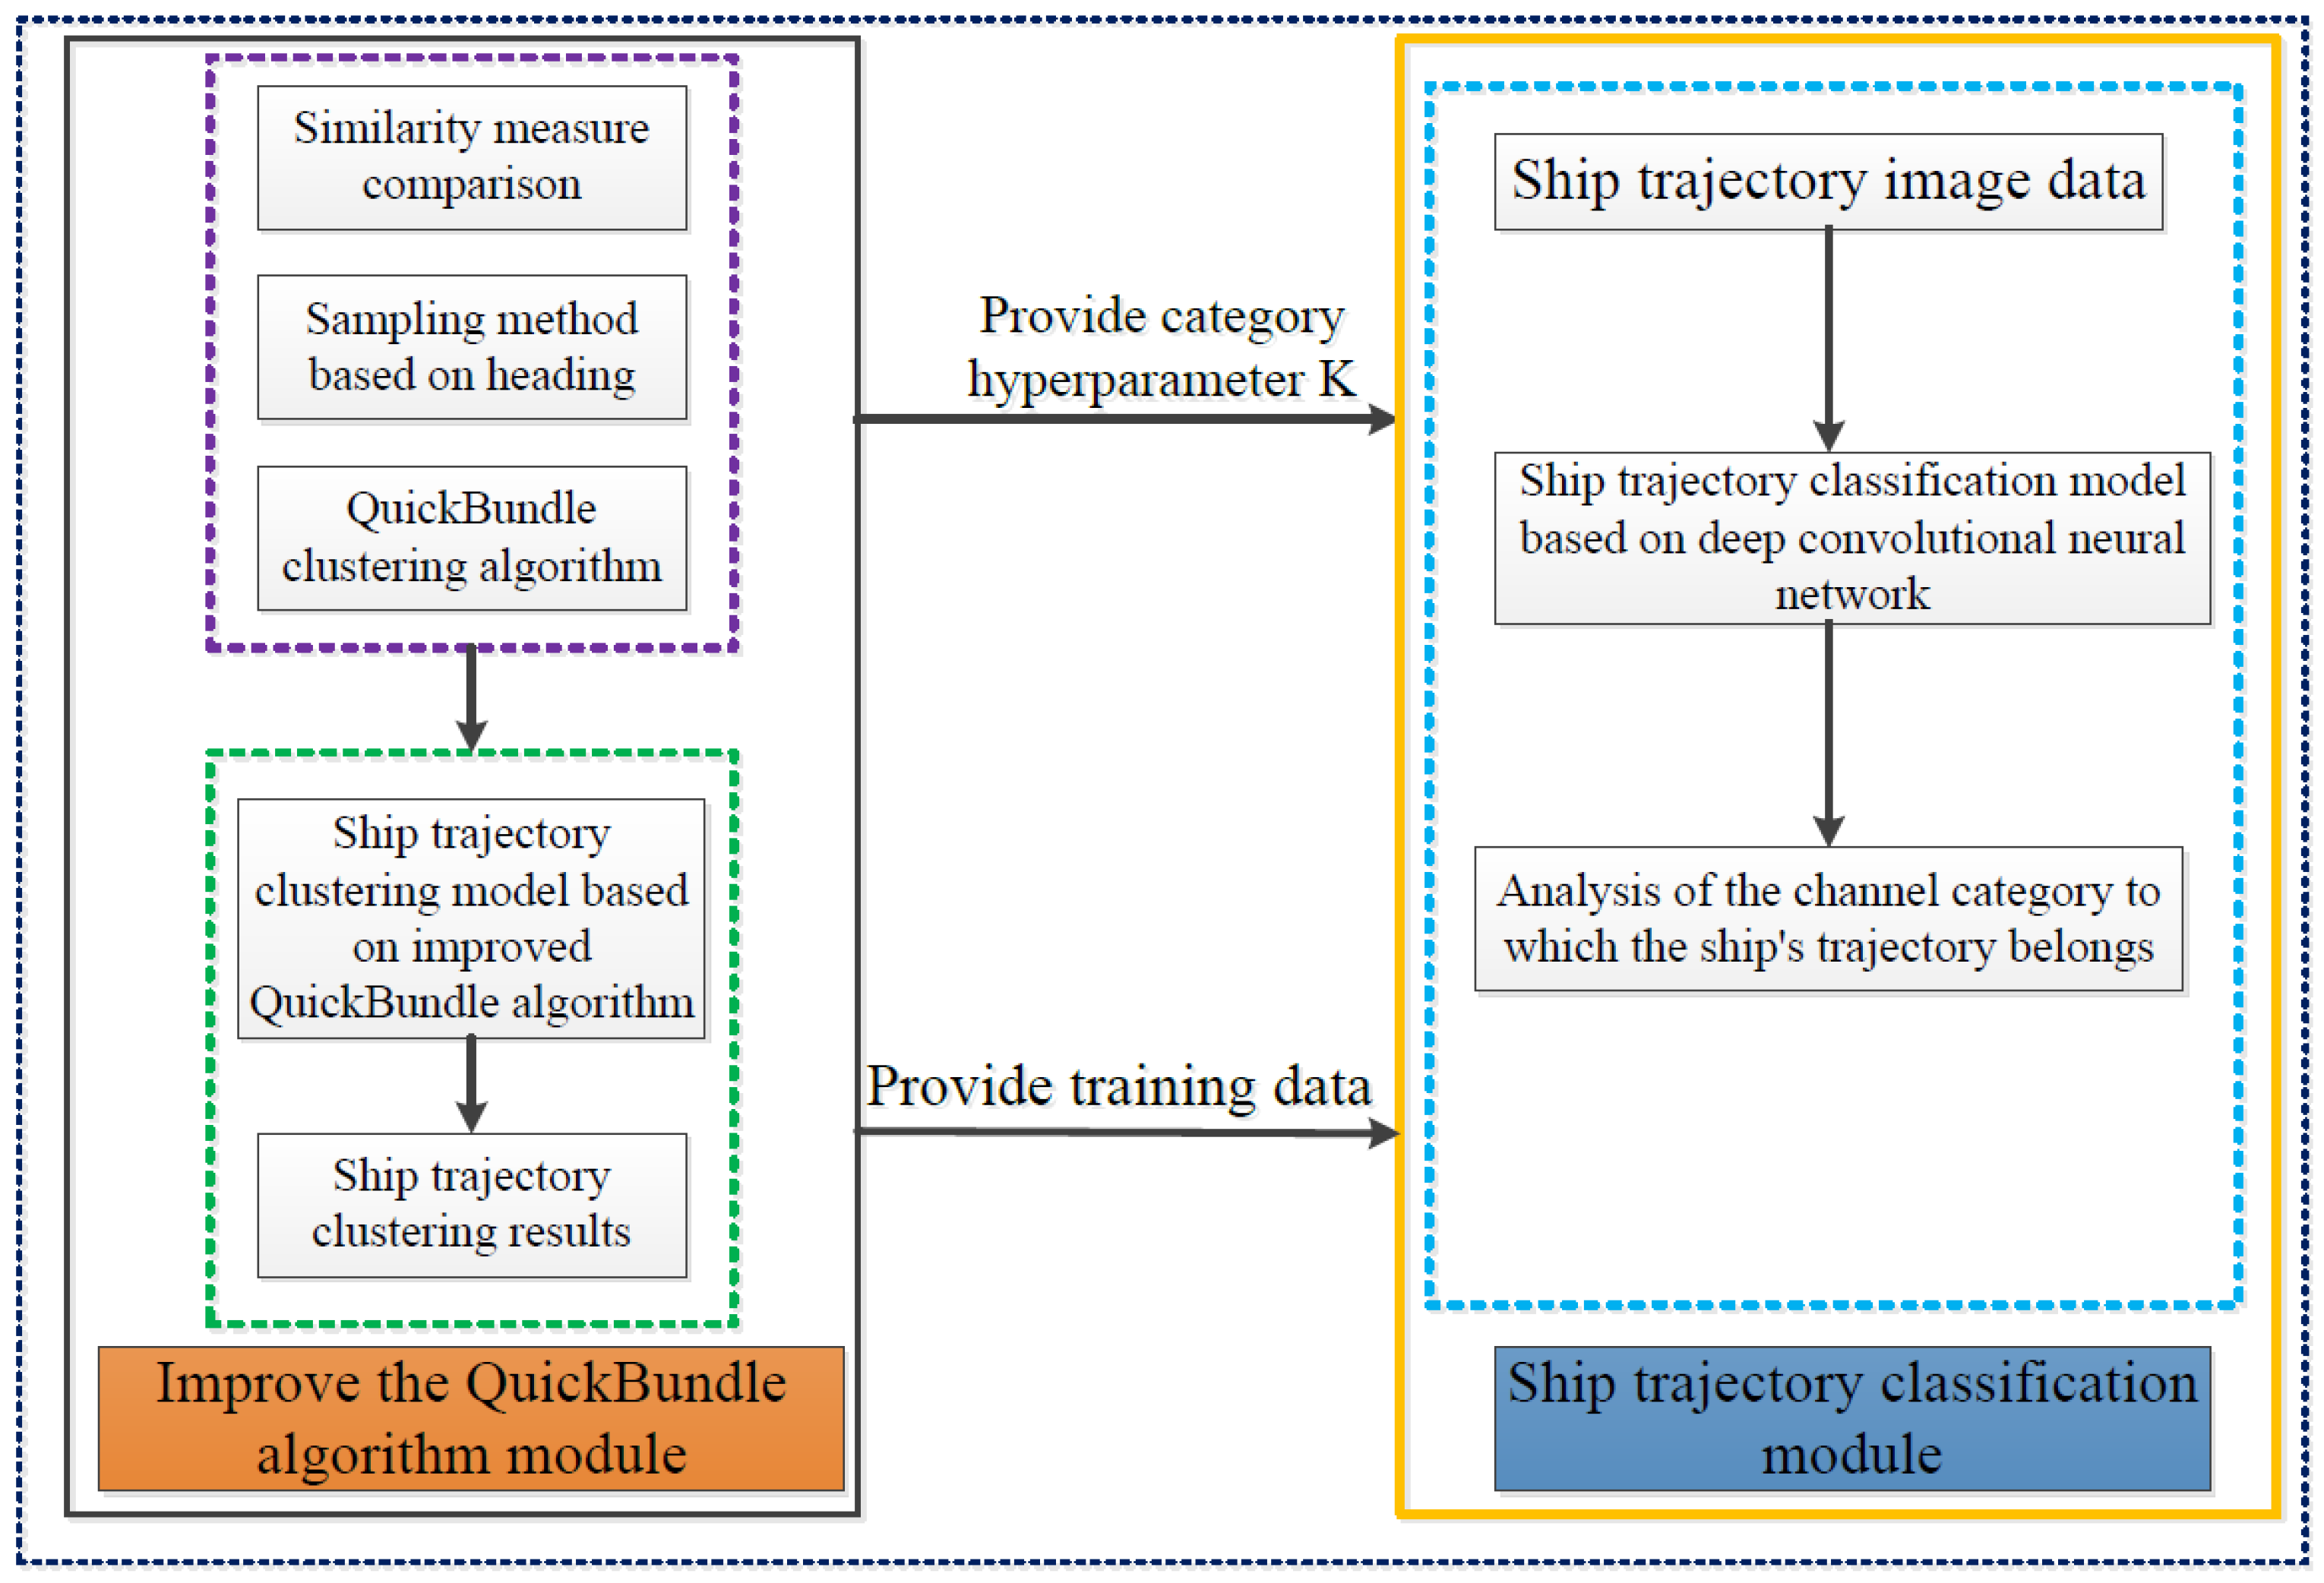
The working process of the proposed methodology is shown in Figure 1. This method takes specific ship trajectory AIS data as the research object and focuses on ship trajectory clustering, ship trajectory anomaly detection, and channel identification of ship trajectories in dense-traffic waters. Through the identification of abnormal trajectories and the classification of the channel to which a trajectory belongs, the ship supervision department provides technical support for targeted ship trajectory data analysis. Ship trajectory clustering research is carried out based on the QuickBundles clustering algorithm. The sampling method of QuickBundles is improved according to the local heading changes of the ship trajectory, and a fast, accurate, and efficient ship trajectory clustering method is proposed. Ship trajectory clustering research also provides cluster quantity parameters for anomaly detection models and data support for ship trajectory classification.
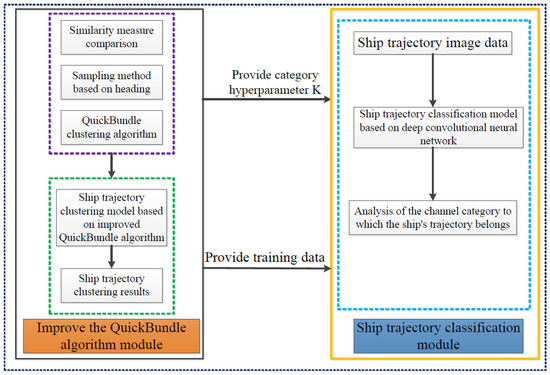
Figure 1.
The working process of the proposed methodology.
2.1. The Improved QuickBundles Algorithm Module
The trajectory of a ship can be of any length. Before the task of clustering the trajectory of the ship, data need to be divided and filtered so that the subtrajectory segments with similar motion characteristics can be retained and some important information can be obtained; therefore, it is very important to properly divide the original trajectory. Commonly used methods of ship trajectory division are based on time interval and speed changes.
The data used in this paper come from the US Coastal AIS Vessel Traffic Data (https://marinecadastre.gov/ais/, accessed on 1 March 2022), which are collected by the US Coast Guard through on-board navigation and positioning equipment to monitor the location of large ships in the United States, as well as characteristics of coastal waters. In this section, we take the AIS dataset from January to March 2019 as the experimental object and use two methods to process ship trajectory data. The specific parameter settings are shown in Table 1, and the processing results are shown in Table 2.

Table 1.
Division and filtering threshold settings.

Table 2.
Division and filtering results.
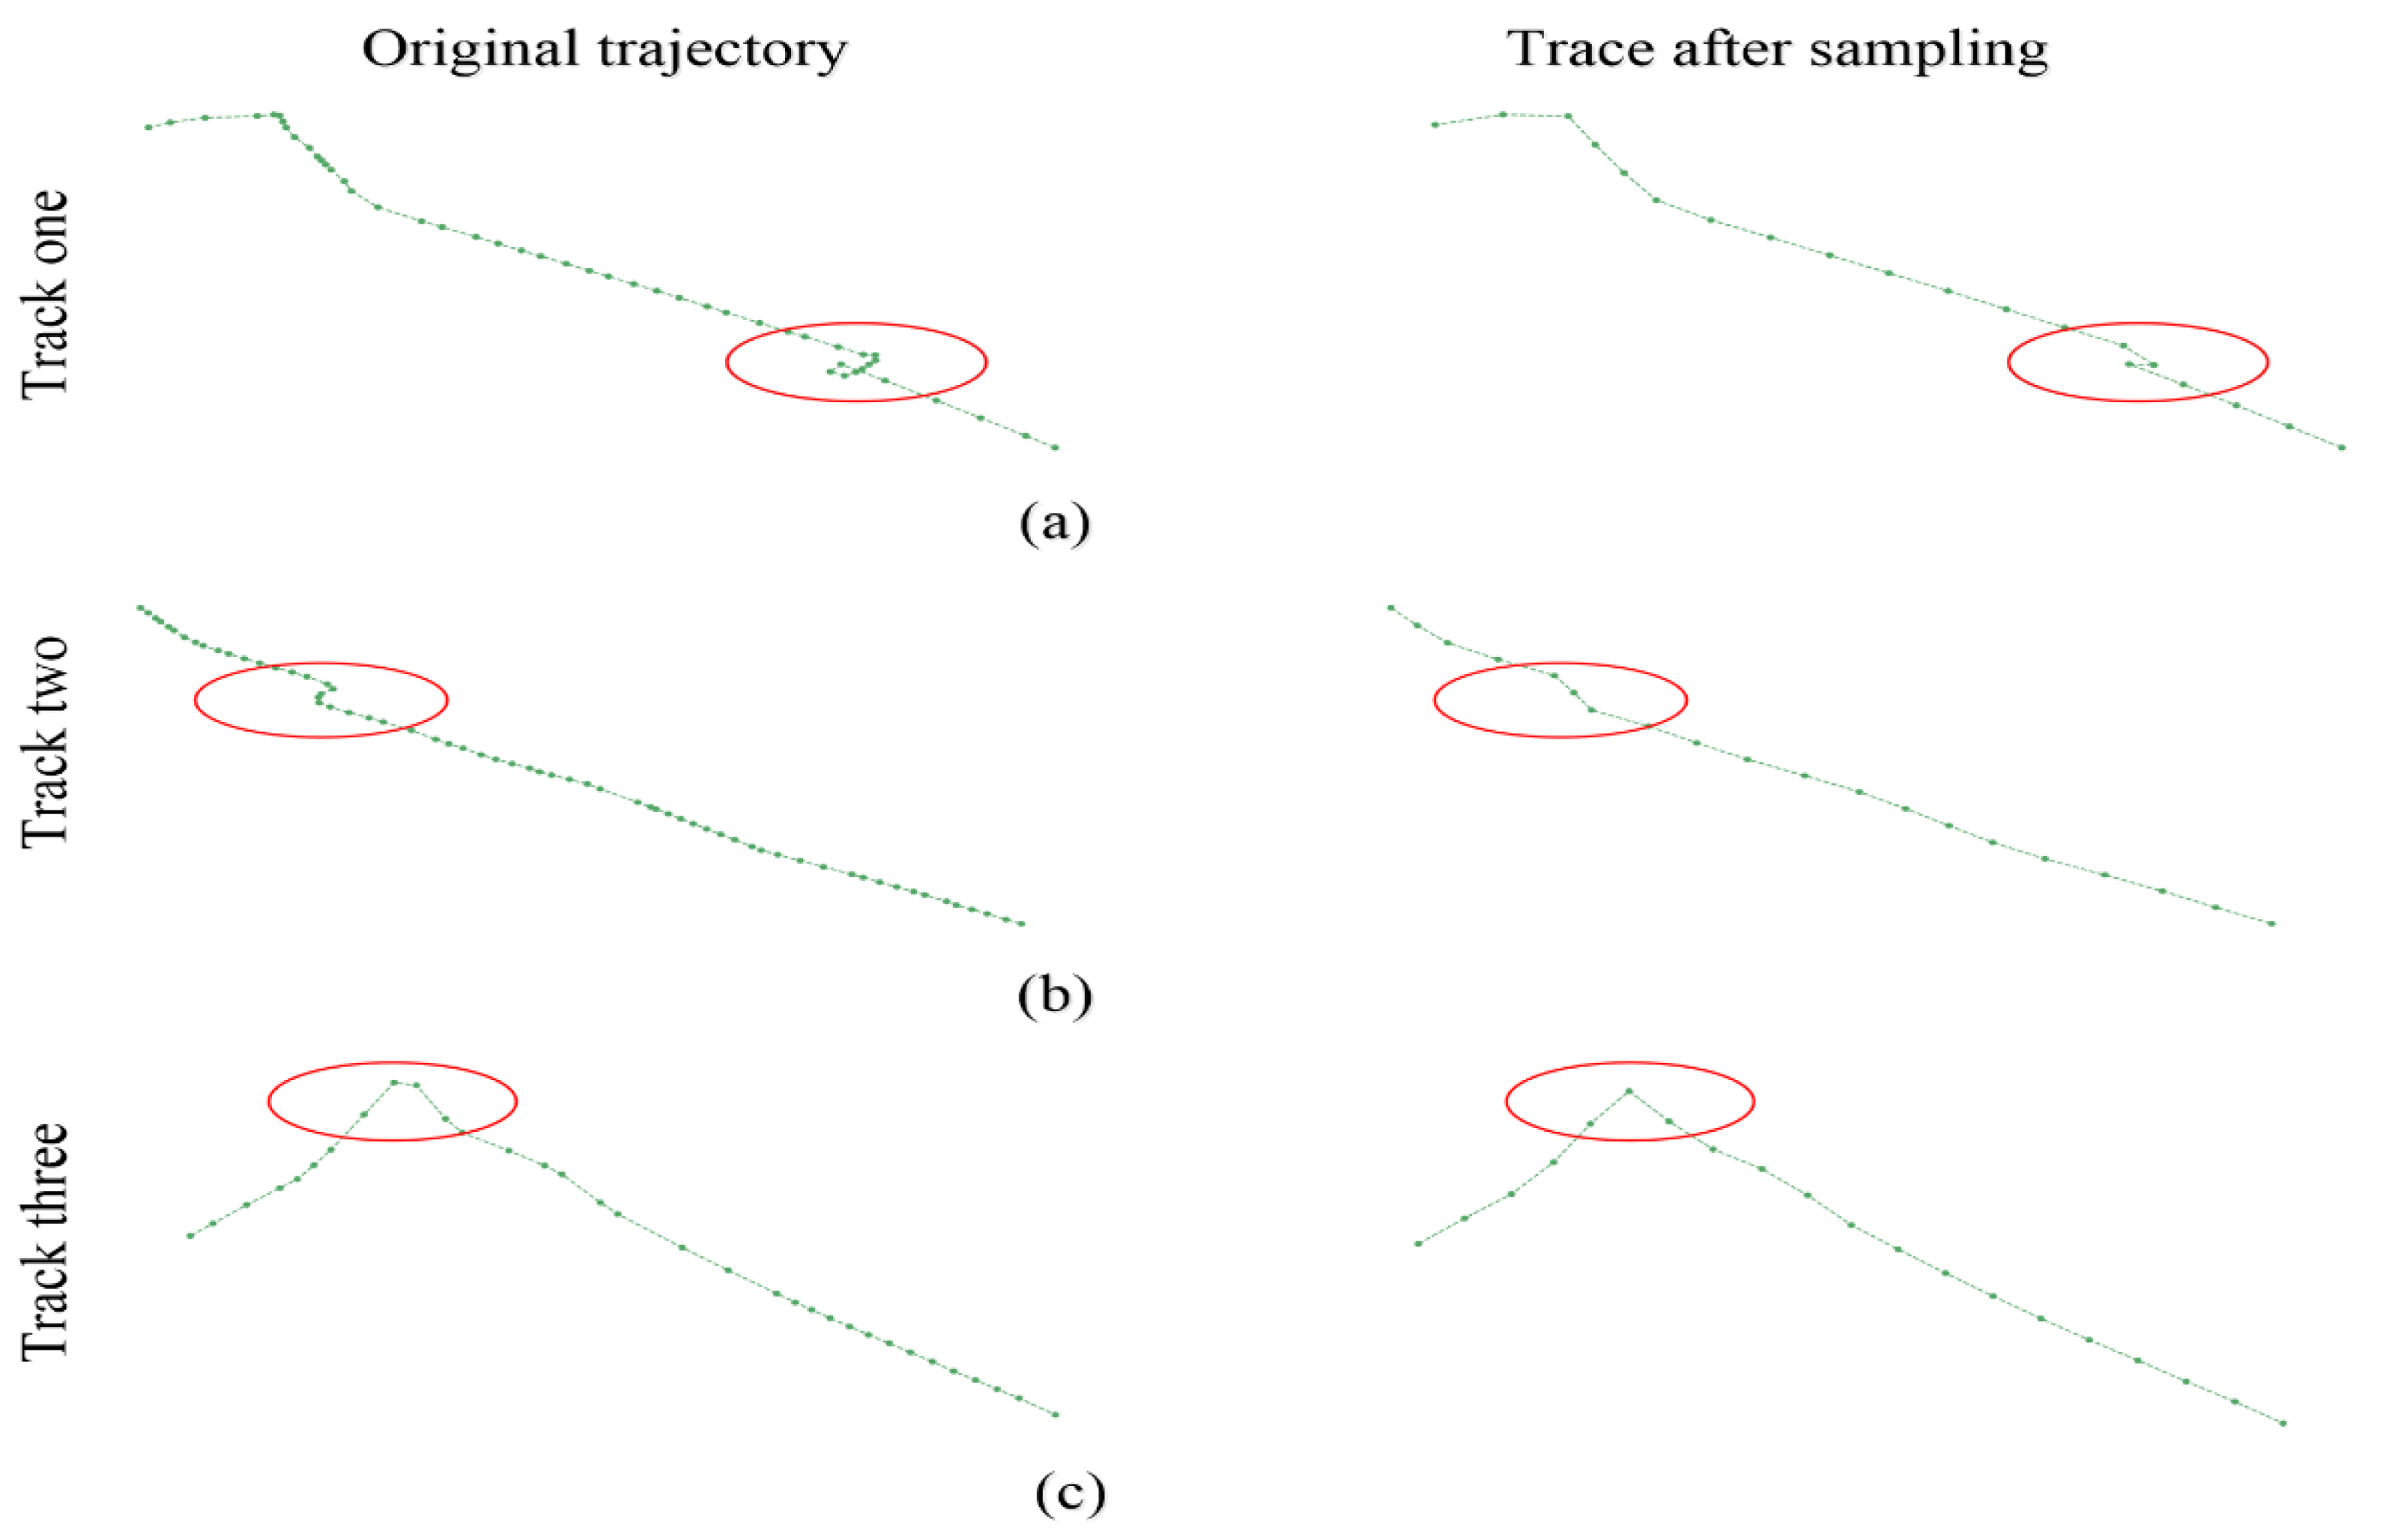
The QuickBundles algorithm was originally designed for use with nerve bundles in the medical field. The local changes of nerve bundles are not complicated. Therefore, the QuickBundles algorithm uses only simple linear interpolation as the sampling method. However, if the clustering object is a ship trajectory with moving characteristics and the local heading changes are more complicated, then the characteristic changes of these local headings cannot be ignored, e.g., the 20 ship trajectory points shown in Figure 2a,b. In the original trajectory, the ship’s course changes considerably due to reasons such as avoidance, and the changed trajectory is curved and smooth. After sampling by the QuickBundles algorithm, the local features of this heading change are replaced by simple polylines; the ship in the original trajectory in Figure 2c has a short, straight line at the turn. After being sampled by the QuickBundles algorithm, this short straight line is ignored.
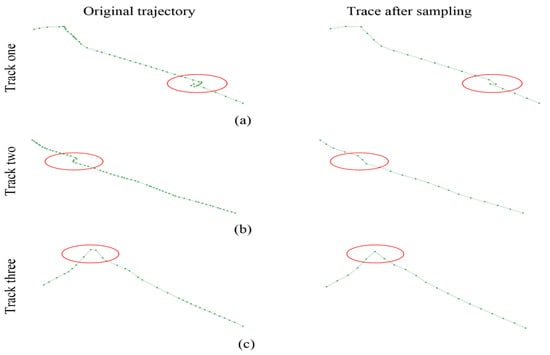
Figure 2.
Three different types of original and sampled trajectories. (a,b) the 20 ship trajectory points; (c) the ship in the original trajectory.
In order to overcome the above shortcomings, we improve the sampling method of the QuickBundles algorithm. First, the ship’s trajectory is compressed, with the heading as a factor, and the key position points of the ship’s trajectory are extracted. Then, the ship trajectory is interpolated based on the distance between the trajectory points.
- Ship trajectory compression considering heading
There are two purposes for ship trajectory compression in this paper: one is to reduce the number of trajectory points of all ship trajectories so as to more conveniently achieve the unification of the number of trajectory points in the future; the other is to reduce the number of trajectory points to improve the similarity between trajectories and calculate efficiency.
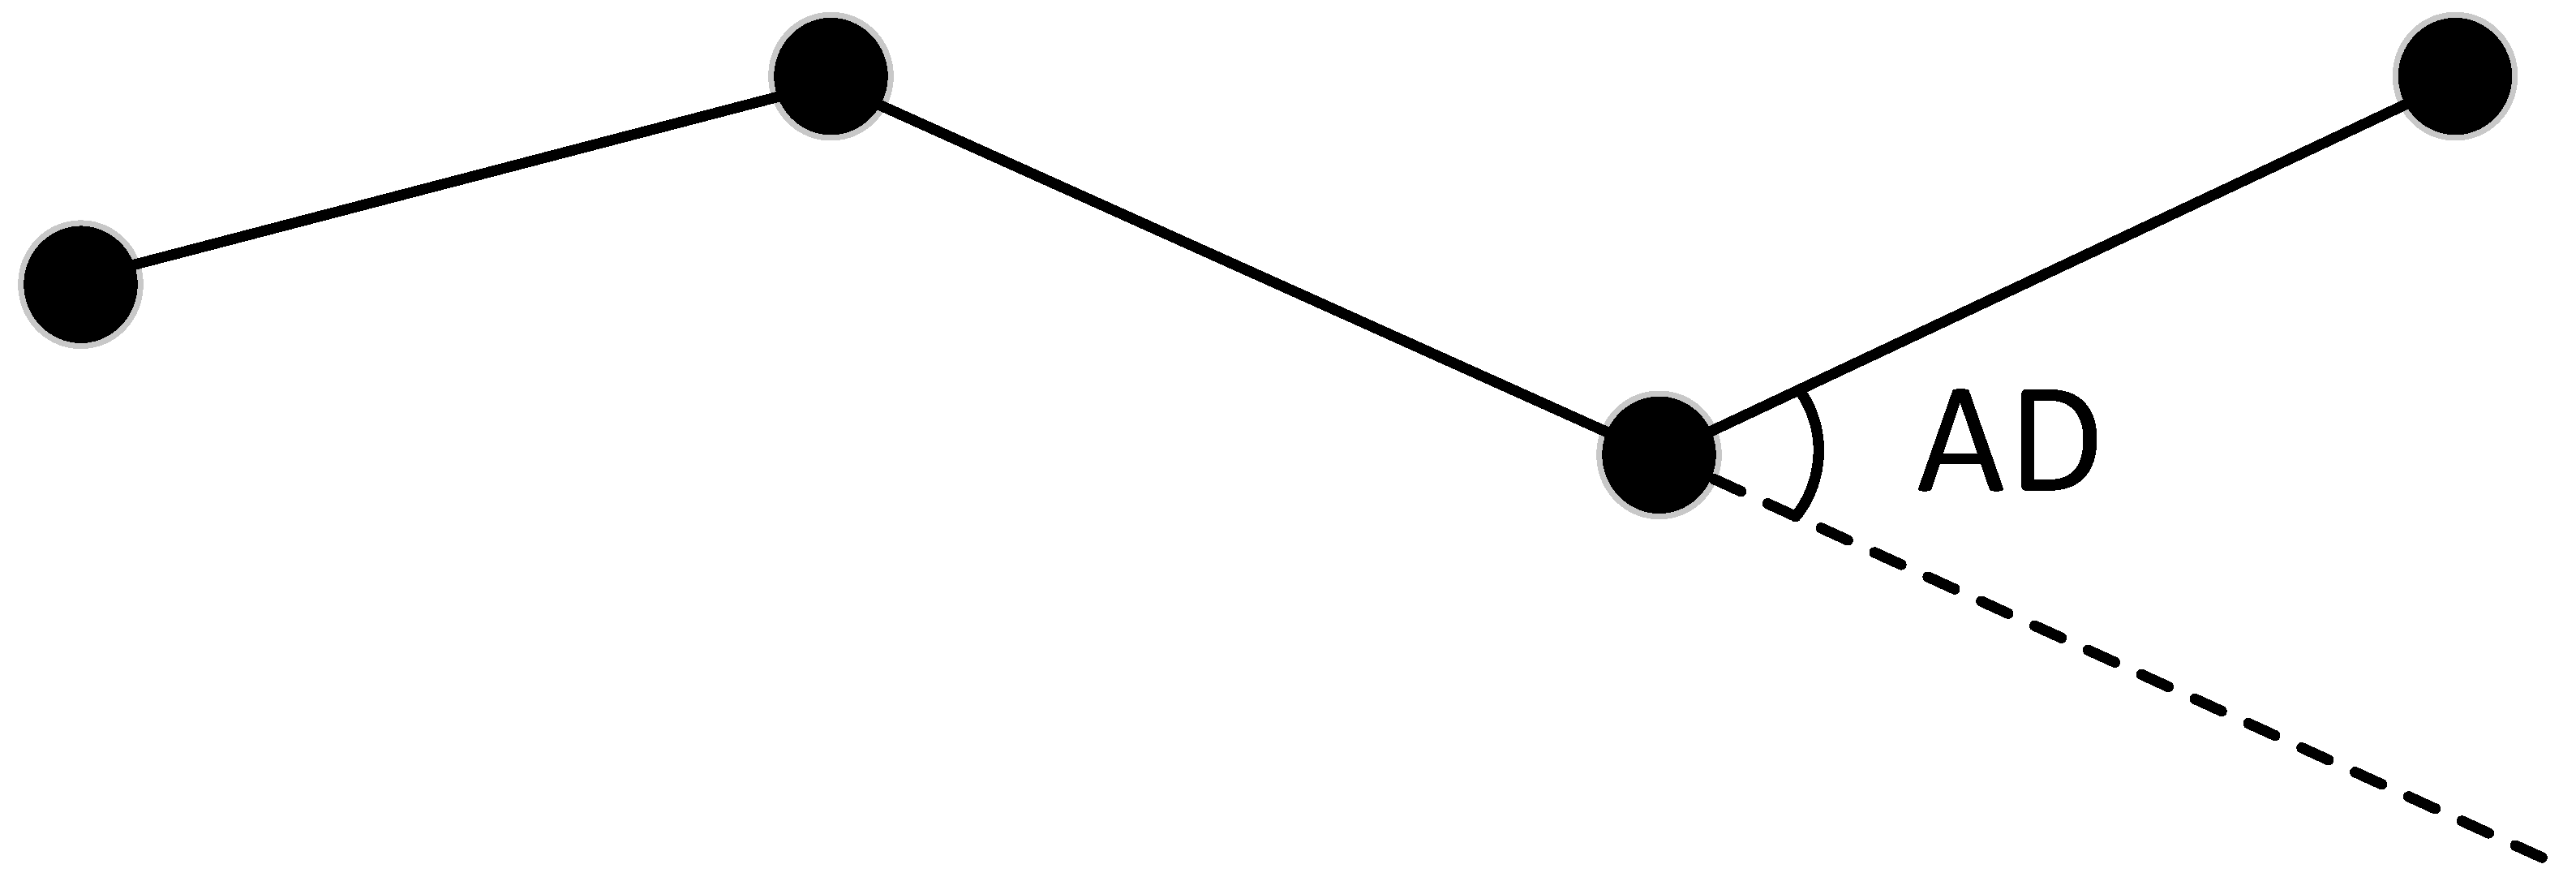
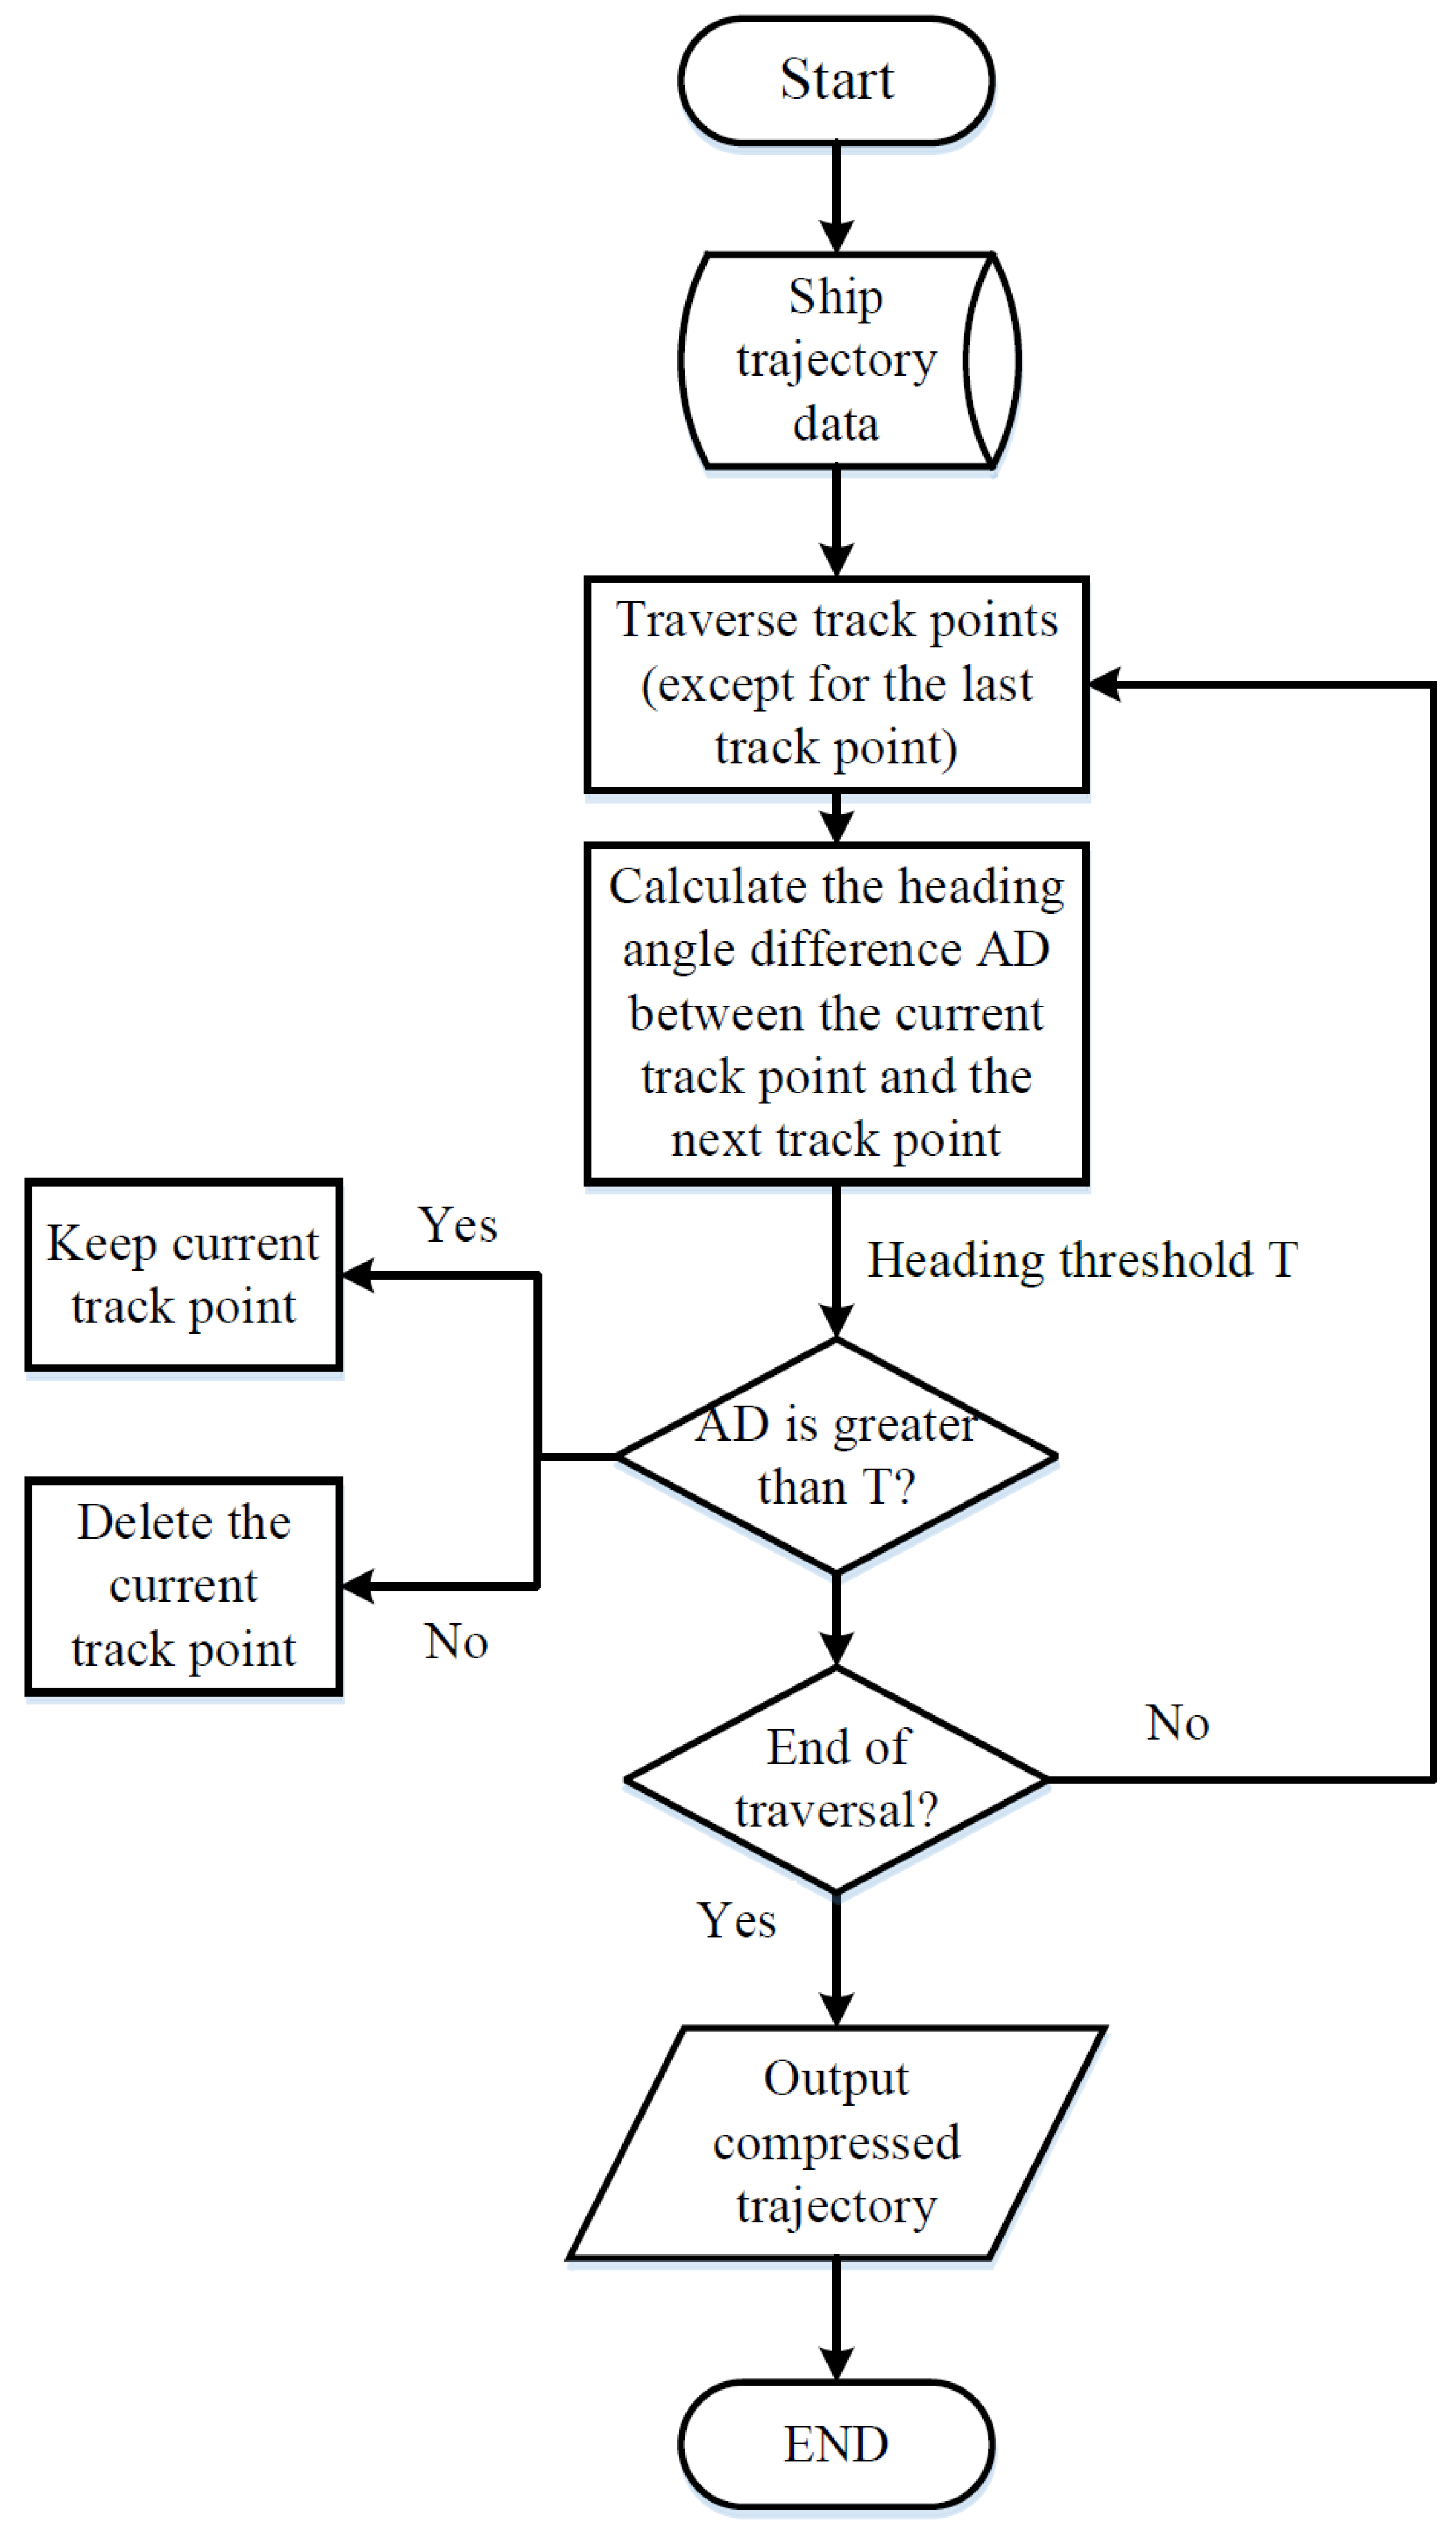
The course can indicate the direction of a ship’s trajectory and the trend of a ship’s movement. Figure 3 shows the difference in heading angle. The heading angle difference (AD) represents the difference in the direction angle of the adjacent ship trajectory segment, which can more clearly illustrate the change in the current trajectory segment compared to the previous trajectory segment. Through the calculation of the heading angle difference, the key position points in the trajectory of a ship can be accurately obtained, and the compression of the trajectory of the ship can be determined. The detailed calculation process is shown in Figure 4. The input is the angle threshold and the ship trajectory. The heading angle difference between the current trajectory point and the previous trajectory point is calculated. If the heading angle difference is greater than the threshold, the current trajectory point is retained; otherwise, the current trajectory point is deleted.
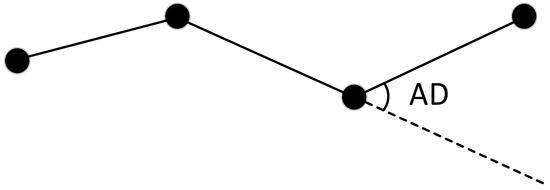
Figure 3.
Heading angle difference.
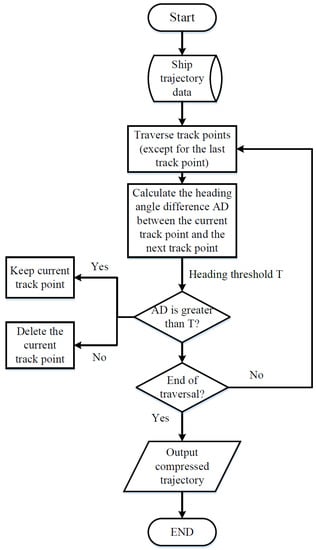
Figure 4.
Ship trajectory compression.
- Subsection interpolation based on the distance between track points
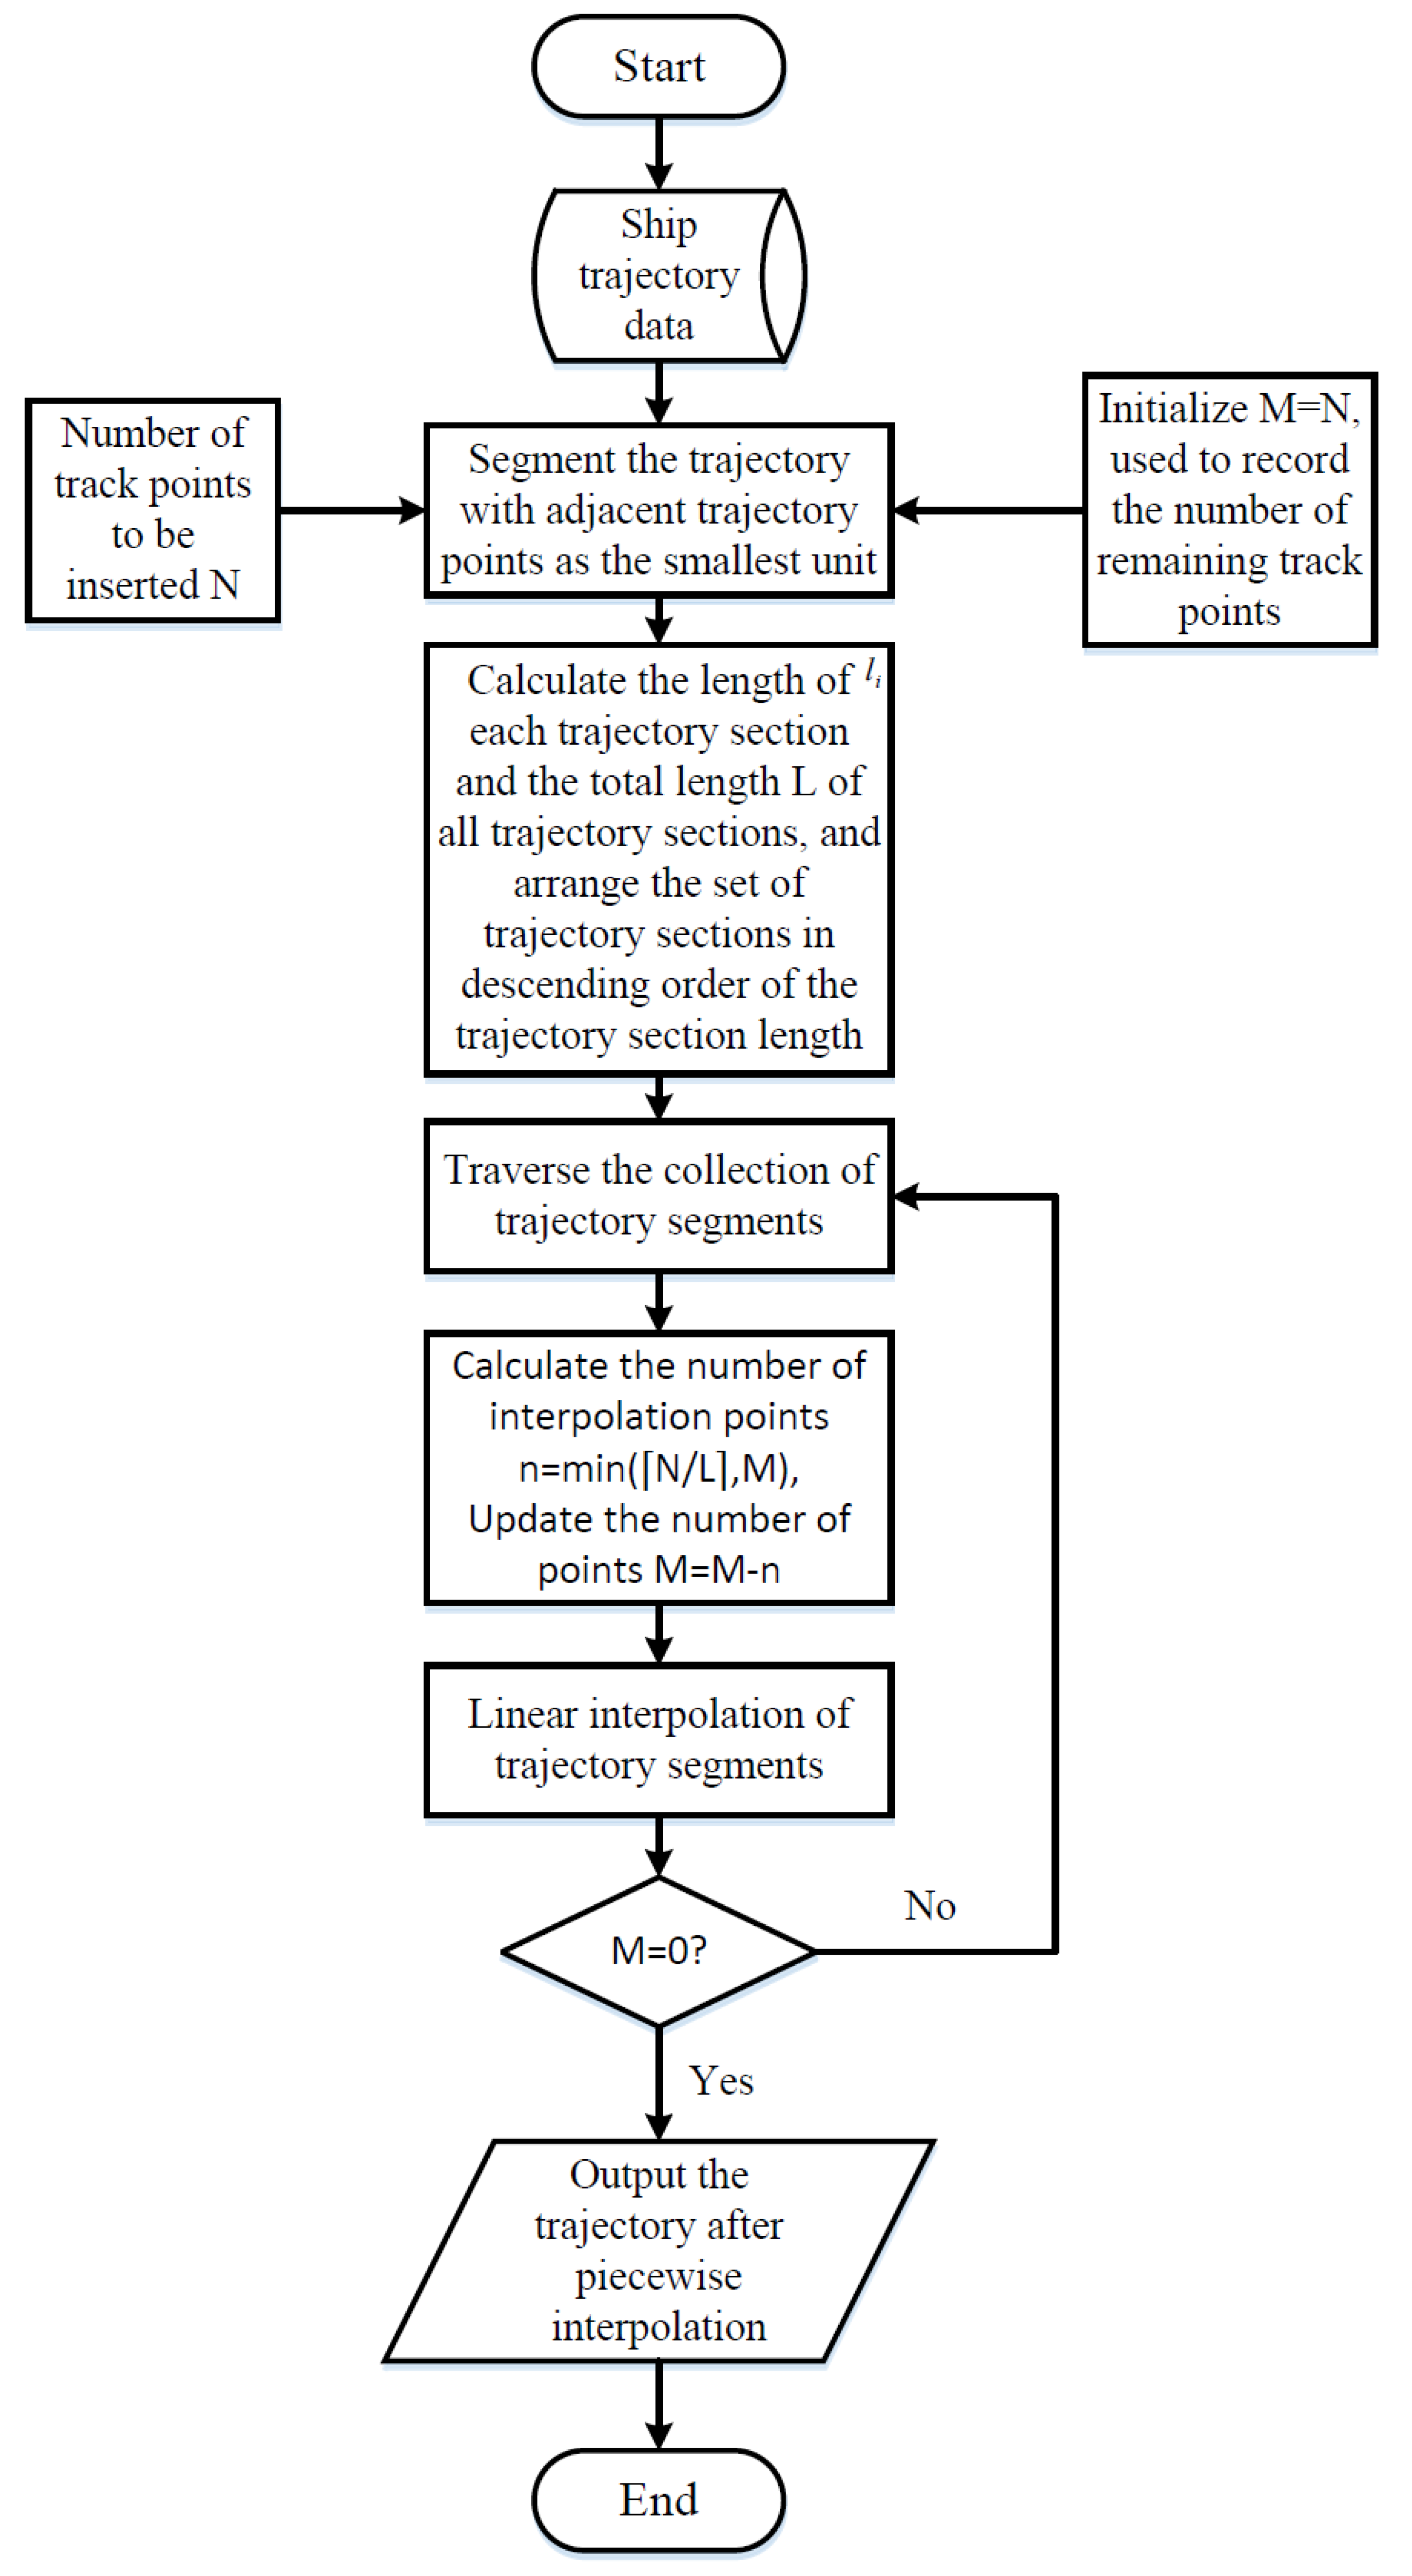
The QuickBundles clustering algorithm requires that the trajectories to be clustered have the same number of trajectory points. After compressing the ship’s trajectory, in order to meet this requirement, in this section, we adopt the segmented interpolation method based on the distance between the trajectory points to unify the number of ship trajectory points. The specific process is shown in Figure 5. First, the number of track points to be inserted is obtained, and then the distance between each adjacent track point is calculated. According to the ratio between the distances, the number of inserted track points to the track to be inserted in each segment is allocated a corresponding number of points.
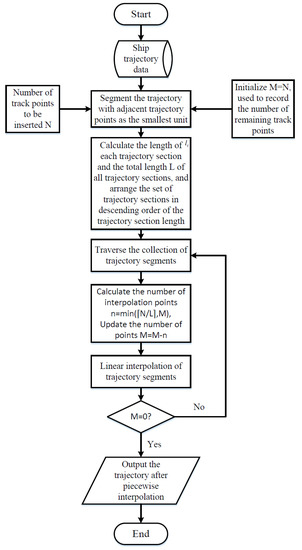
Figure 5.
Low chart of segmented interpolation.
2.2. Ship Trajectory Classification Module
In the key monitoring areas of ports, seaports, and other regulatory agencies, as the flow of ships increases, an efficient ship trajectory classification algorithm is needed to classify ships in the jurisdiction, improve the level of intelligent management and supervision efficiency, and reduce busy waters. There is a risk of major and catastrophic traffic accidents. In this section, we use the trajectory clustering results as the training dataset to investigate the classification of ship trajectories and propose a ship trajectory classification method based on deep convolutional neural networks.
2.2.1. Longitude and Latitude Mapping and Coordinate Conversion
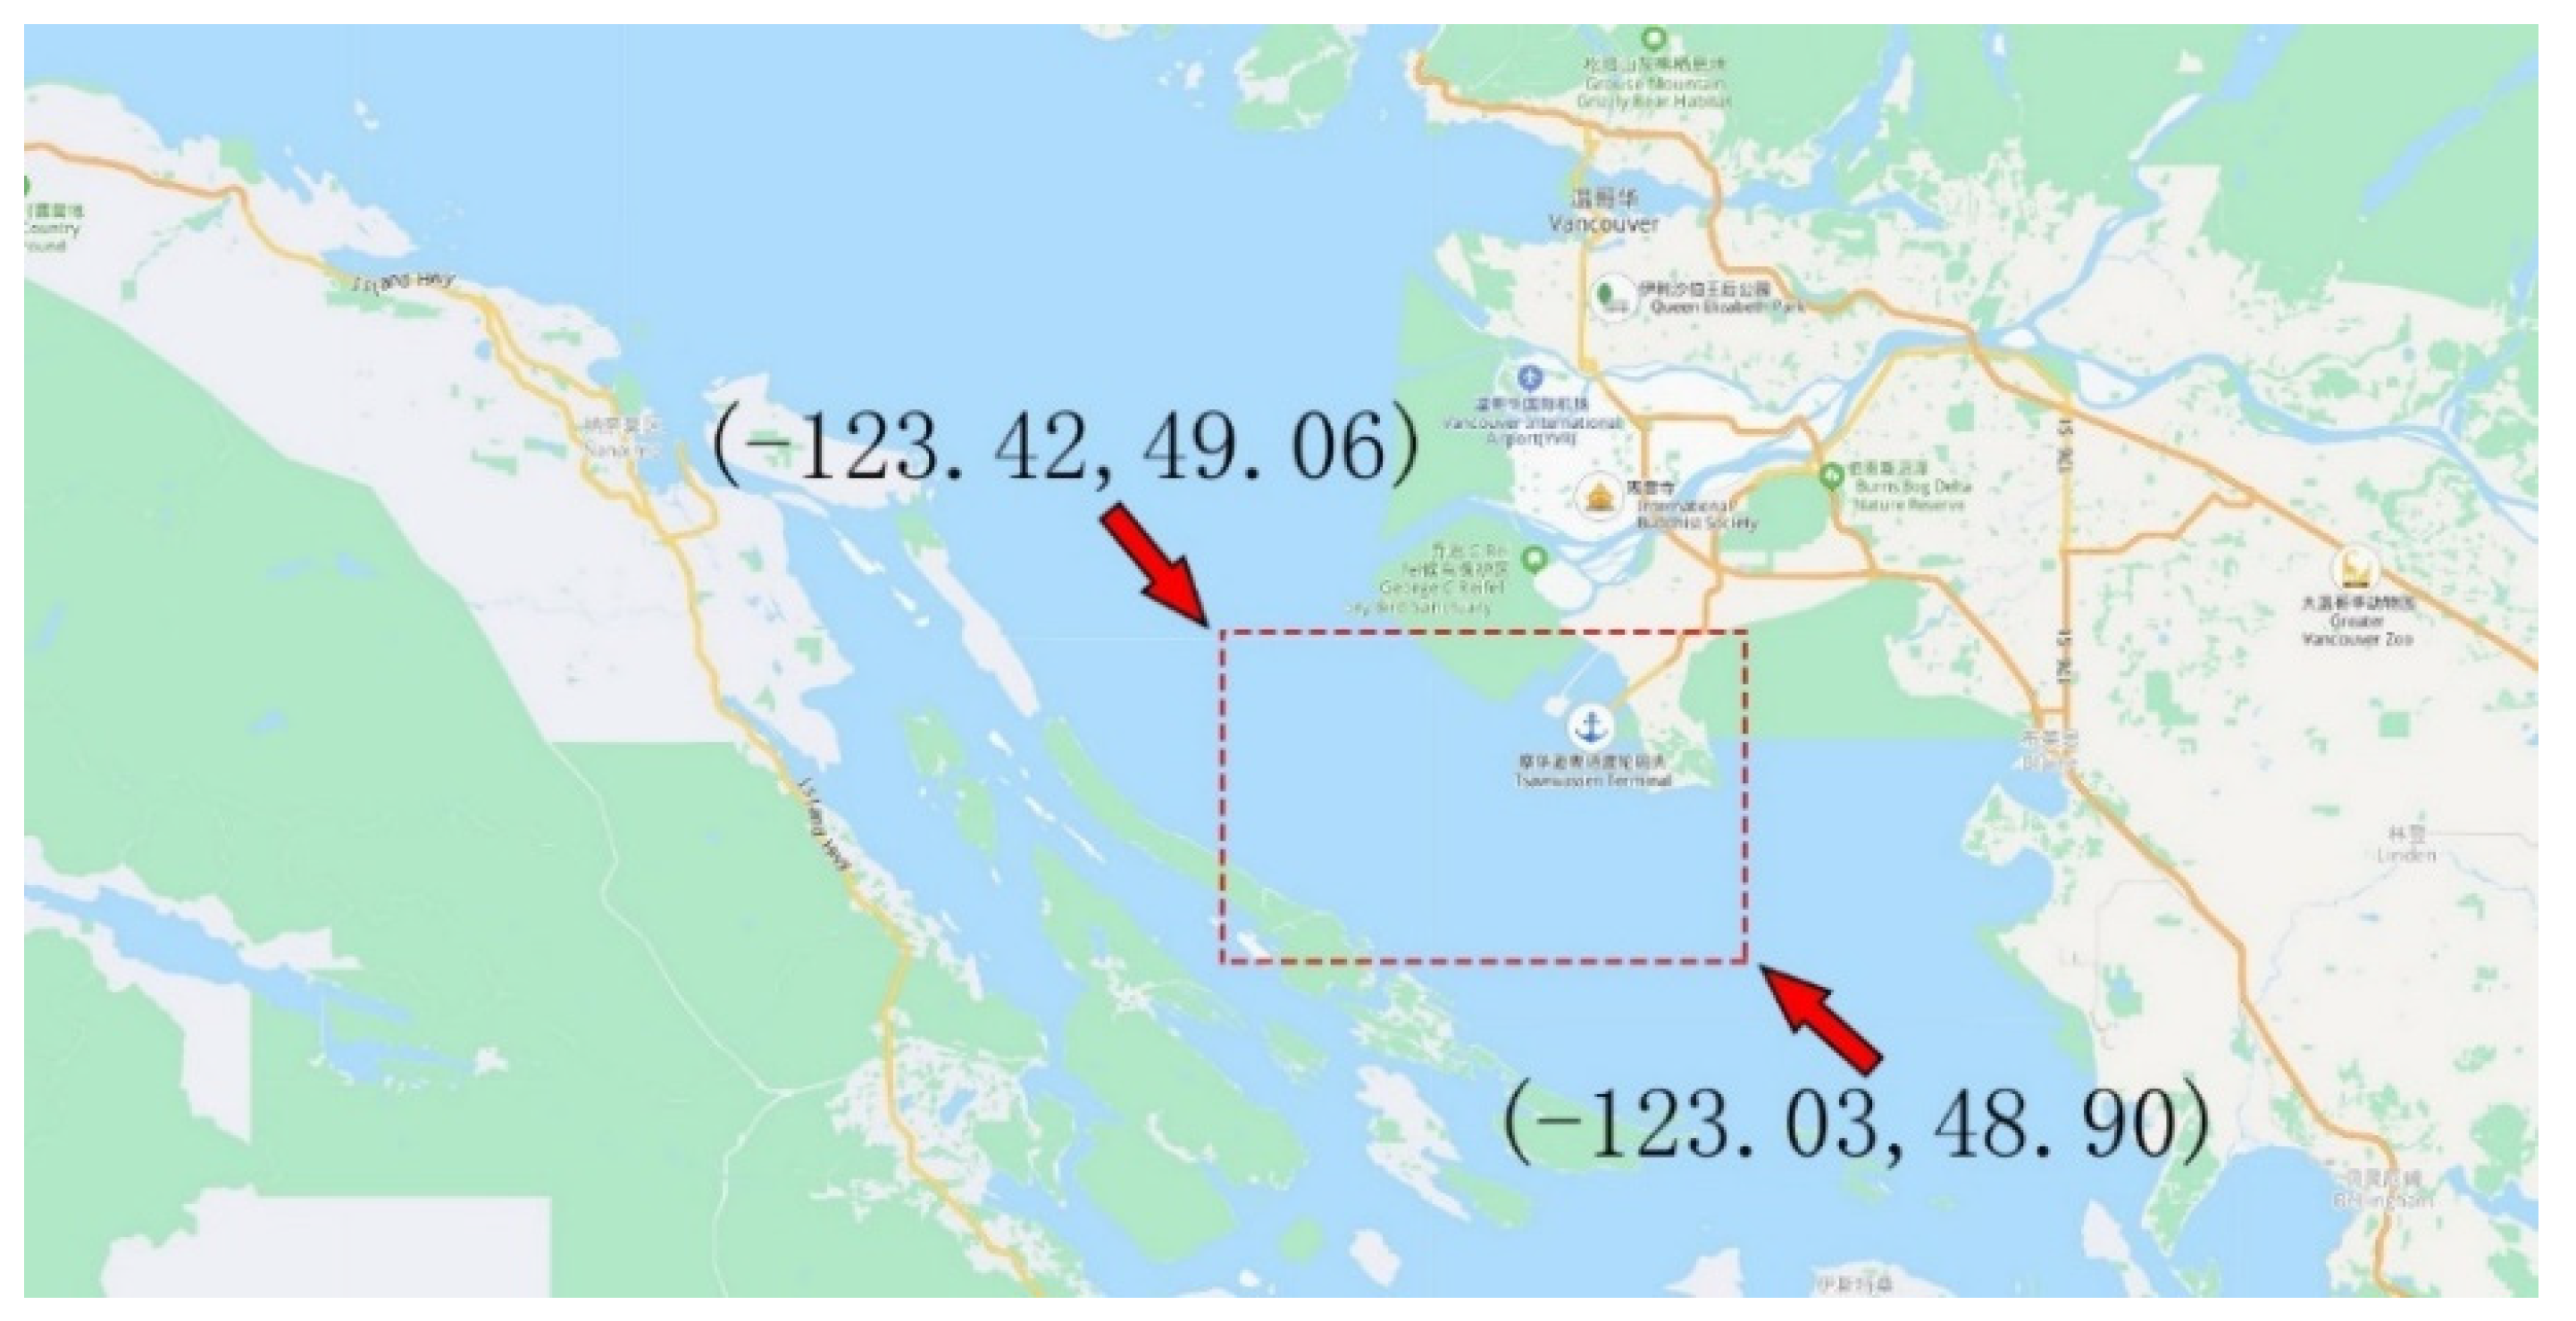
The latitude range of the water area where the experimental data in this article are located is 48 degrees 9 min 7.28 s north latitude to 49 degrees 6 min 44.28 s north latitude, and the longitude range is 123 degrees 3 min 43.33 s west longitude to 123 degrees 42 min 2.71 s west longitude, as shown in Figure 6. In this section, we assume that the area is the key monitoring area of the ship supervision department, model the area and convert the latitude and longitude data into image data according to the length and width ratio of the water area where the experimental data are located.
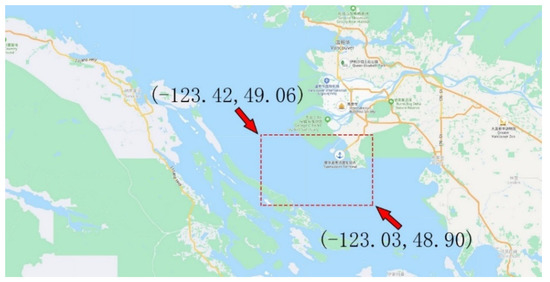
Figure 6.
Longitude and latitude information of the water area where the experimental data are located.
2.2.2. Calculation of the Aspect Ratio of the Water Area
The water area where the experimental data are located is a rectangular area, and the aspect ratio is obtained by calculating the distance between the two sides of the rectangular area to determine the image resolution using the Haversine formula [30] to calculate the distance between two longitude and latitude coordinate points. Formula (1) introduces the method for calculating the distance between two longitude and latitude coordinate points when two longitude and latitude coordinate points are known. R is the radius of the earth, and the average value is 6371 km. and represent the latitude of the two points, and represents the difference between the longitudes of the two points. According to this calculation, the length of the experimental area is 28.41 km, the width is 17.82 km, and the approximate ratio is 14:9.
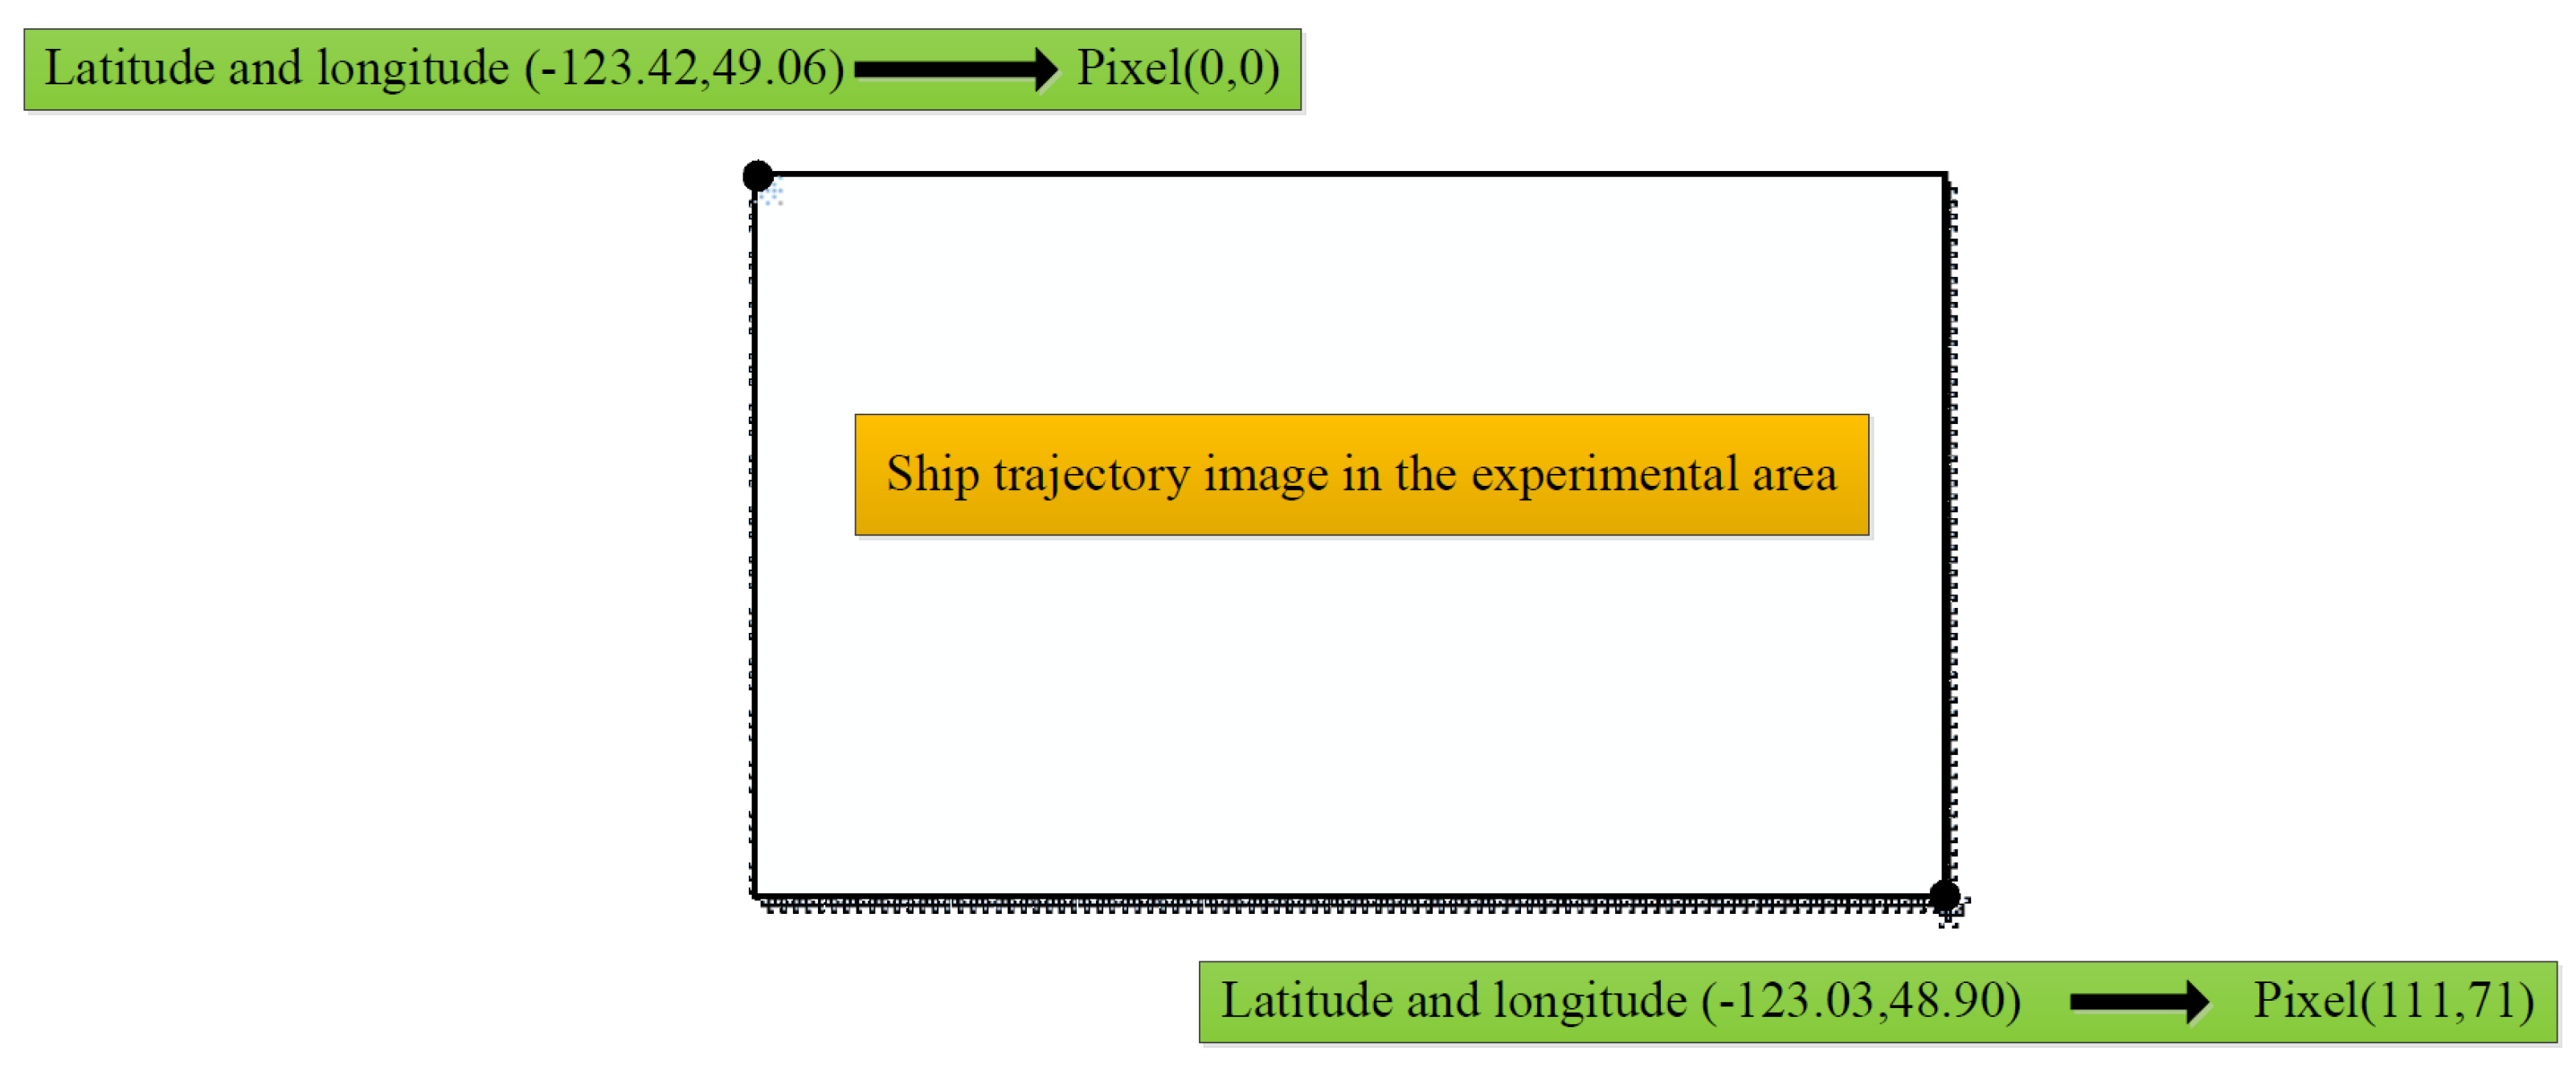
The higher the image resolution, the higher the computational cost and the lower the computational efficiency of the deep convolutional neural network. Considering the above problems, in this paper, we set the resolution to , keeping the ratio of the image unchanged at 14:9 so that the latitude value of (49.06, 48.90) is mapped to the range of the pixel point (0, 71) inside, the longitude value of (−123.42, −123.03) is mapped to the pixel point (0, 111) range, as shown in Figure 7.
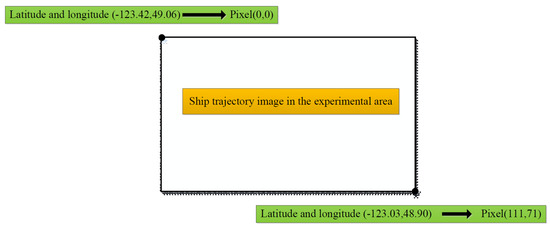
Figure 7.
Schematic diagram of image pixels of latitude and longitude mapping.
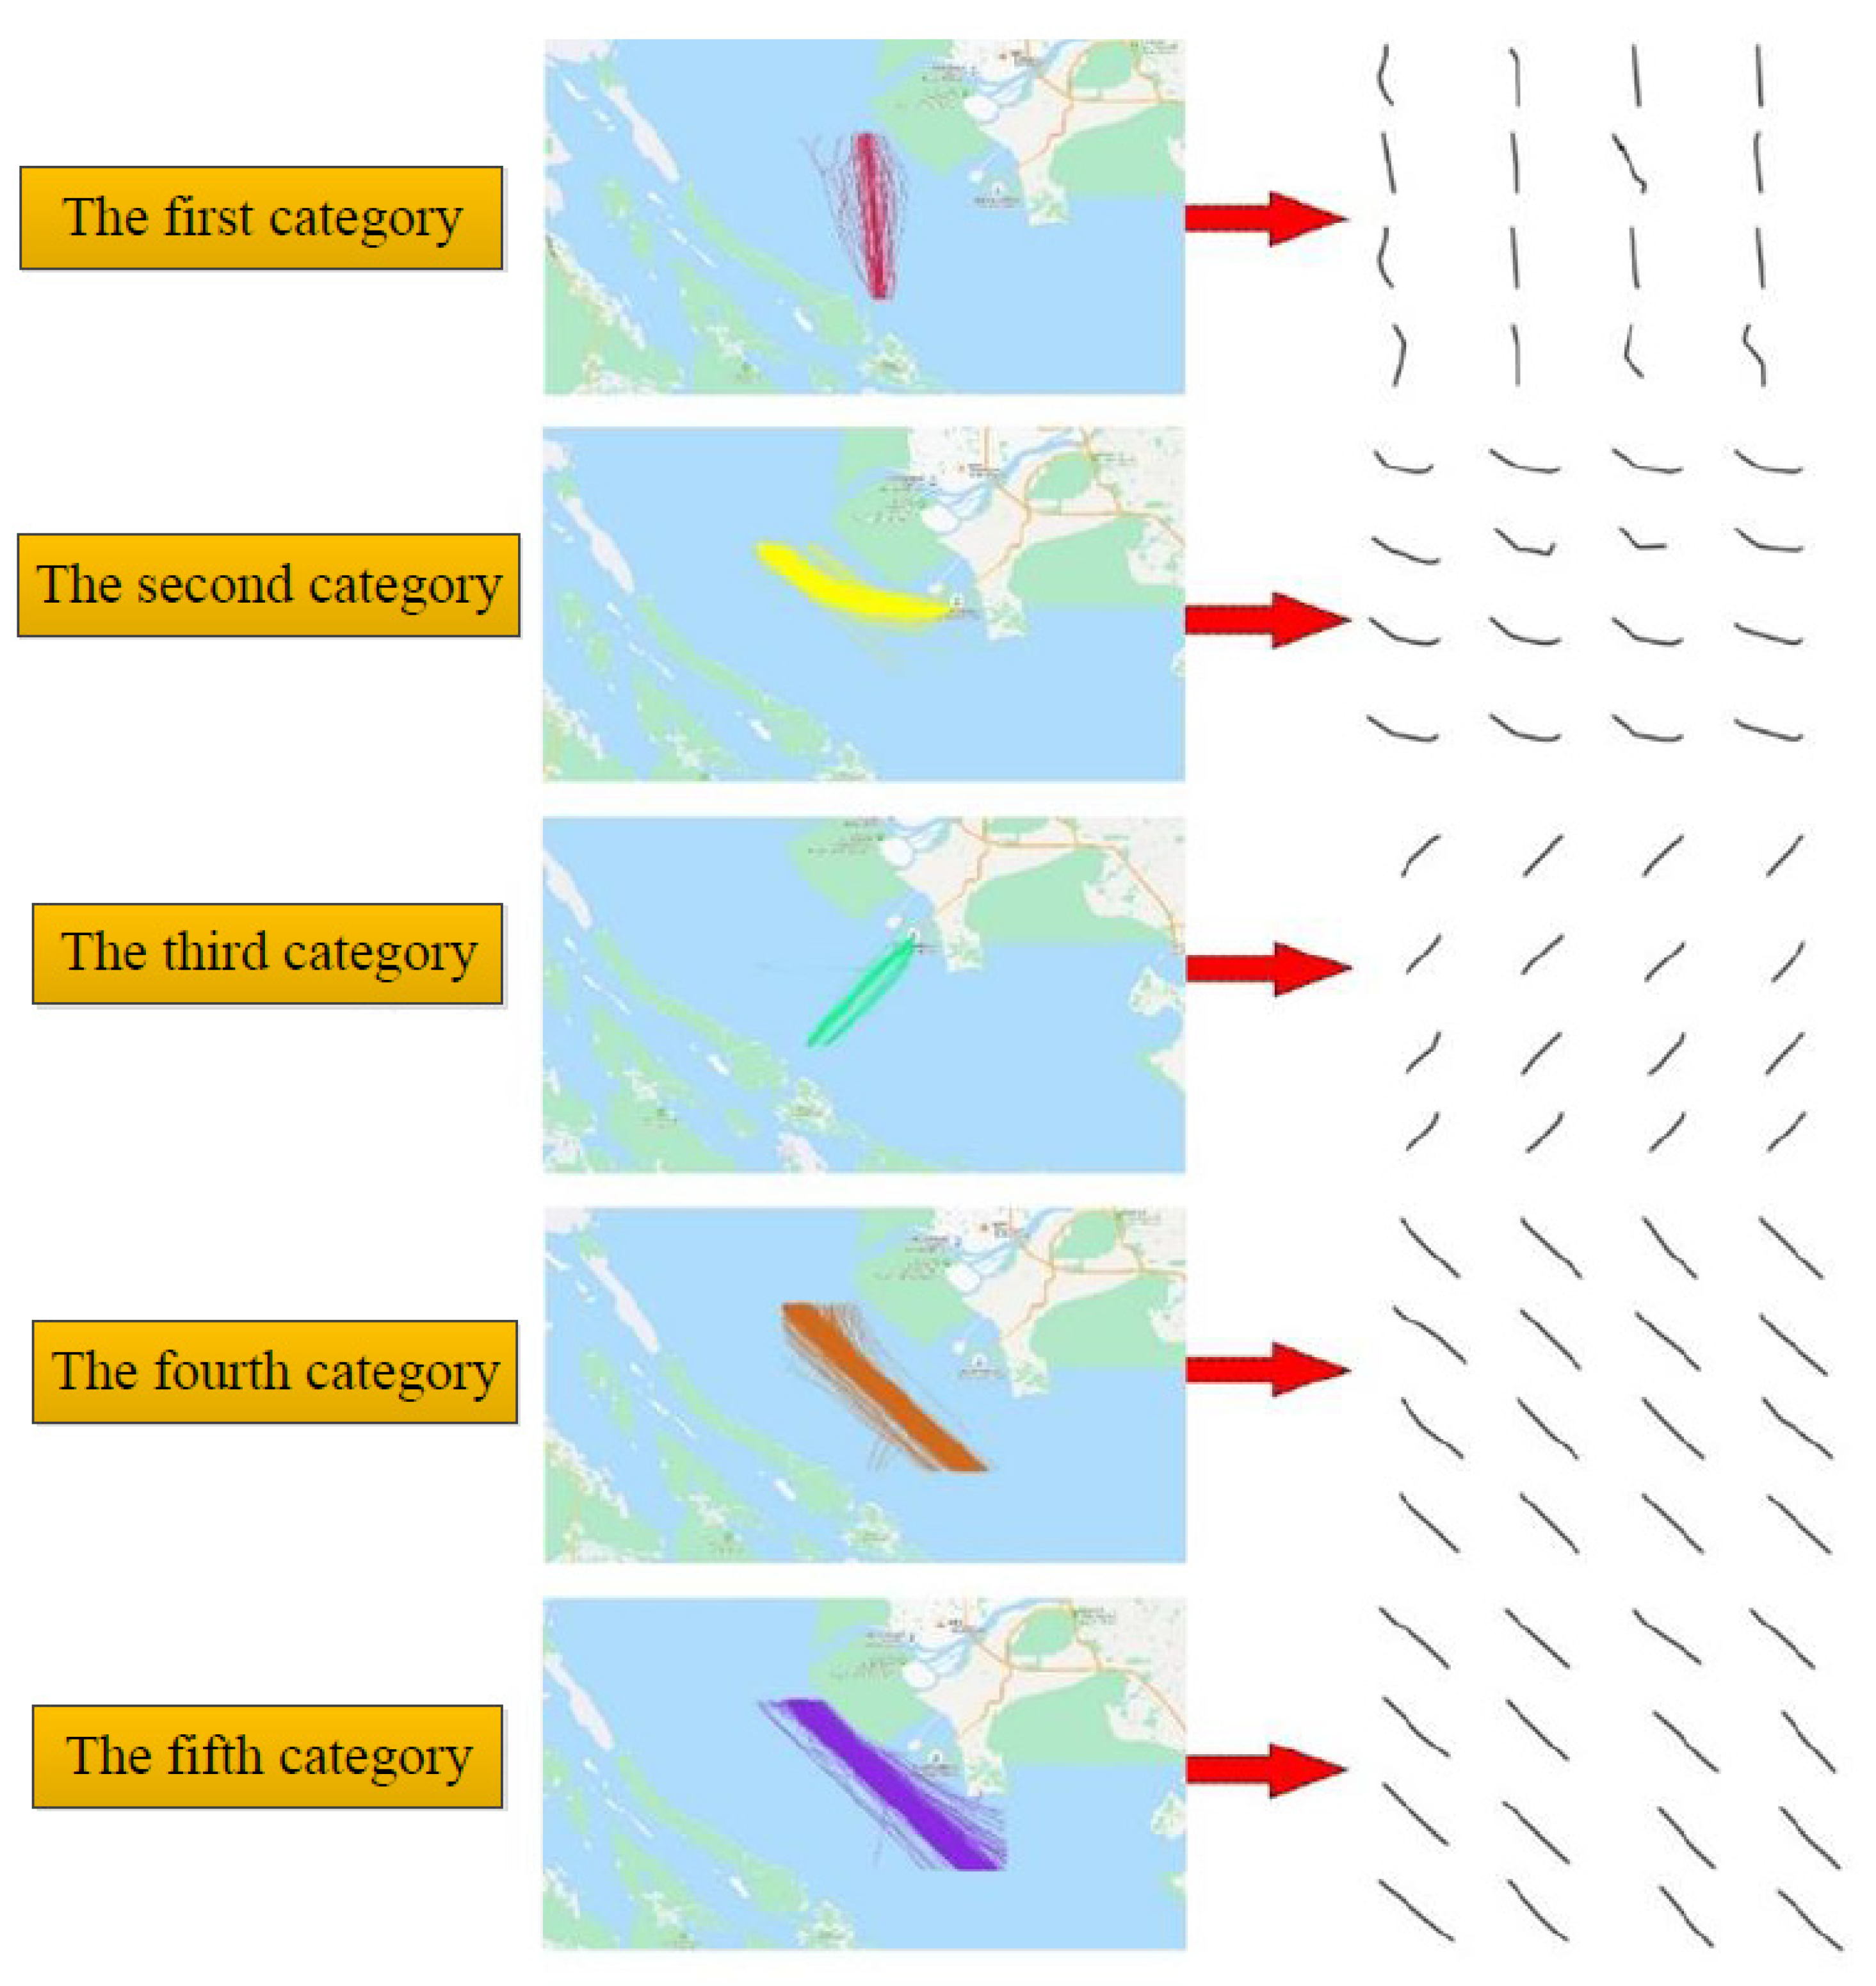
Figure 8 shows the ship trajectory image data after the latitude and longitude data of the ship trajectory are converted. According to the clustering results in Section 3, there are five types of ship trajectories in the waters where the experimental data are located based on the channel category division, so the label of the dataset is set to 0, 1, 2, 3, 4. The resolution of each ship trajectory image is , which corresponds to the latitude and longitude range of the water area. The specific dataset details, as well as the division of training set and test set are shown in Table 3.
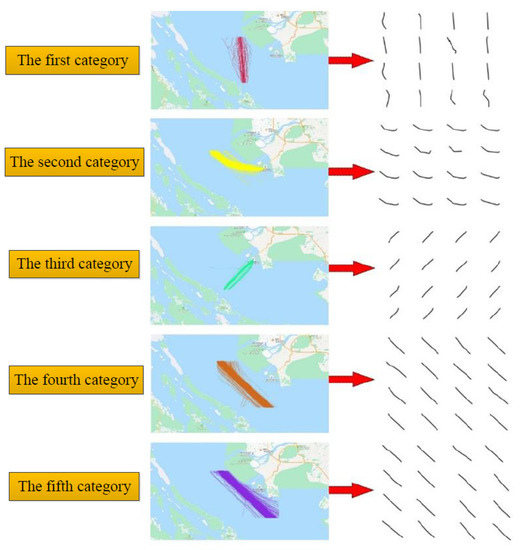
Figure 8.
Trajectory image data display diagram.

Table 3.
Dataset details.
2.2.3. Deep Convolutional Network Model Construction
ResNet (residual network) residual network [31] is widely used in target classification and other fields. It is a part of the classic backbone neural network for computer vision tasks. Typical networks include ResNet50, ResNet101, etc. The ResNet network proves that convolutional neural networks can develop more deeply (including more hidden layers) and verifies that deep convolutional neural networks have better performance.
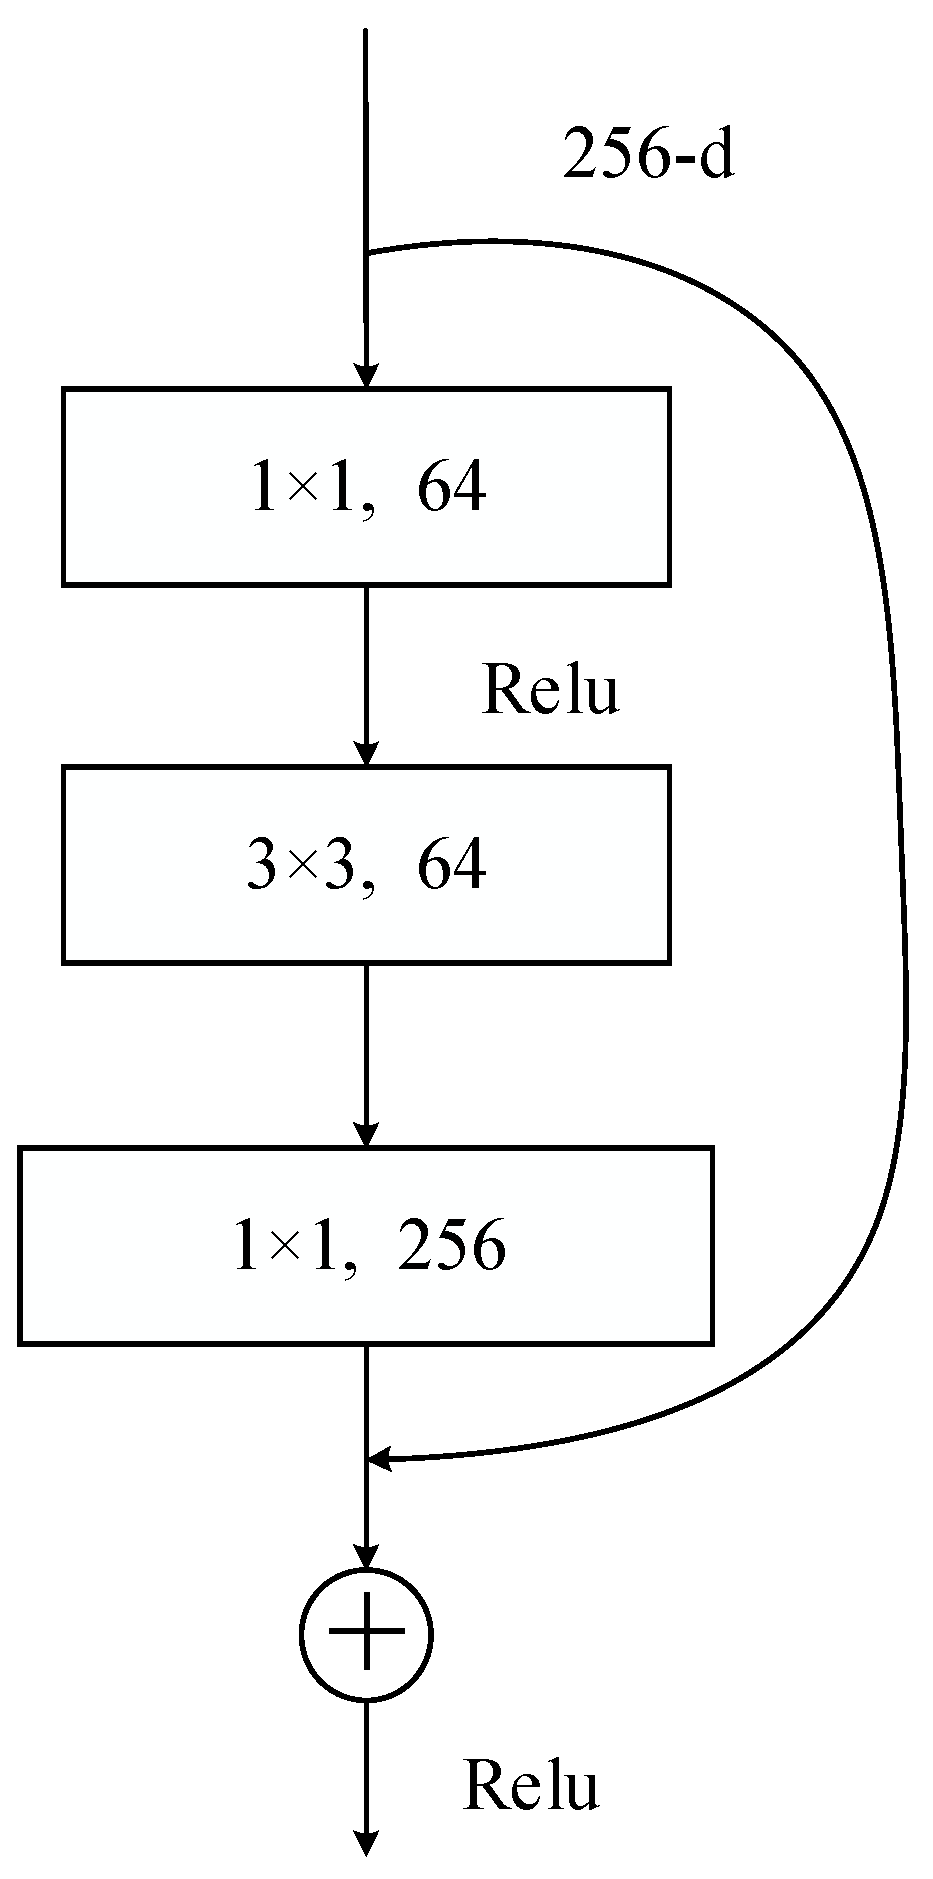
ResNet50 has a unique residual structure, as shown in Figure 9. One of the core technologies of the residual structure is the use of a shortcut connection. There are two main reasons for the disappearance of the gradient. When the number of network layers is very deep and the layer where the current parameter is located is close to the input of the network, the derivation chain is very long; if some of the intermediate results have a low value, after chain accumulation, the final gradient value will be close to zero, resulting in the parameters not being updated. The input is directly added to the output obtained through the convolution operation, which can avoid the problem of the disappearance of the gradient and can capture small perturbations. In addition, the first and last ends of the residual structure use convolution to reduce and restore data dimensions. The time complexity of the two structures is similar, but it deepens the number of network layers and structures and resolves network degradation and training process performance. As shown in Figure 10 and Figure 11, in the actual processing step, jump connections are divided into two types according to the size of the input and output of the residual block. One is the identity block (ID BLOCK) when the input and output are consistent, and the other is the convolutional block (CONV BLOCK) when the input and output are inconsistent. The jump connection is processed by convolution calculation to achieve unity of input and output dimensions. ResNet50 adopts small-size convolution kernels and uses batch normalization [32] technology. In this paper, we build a ship trajectory and channel classification model based on ResNet50 as a deep convolutional neural network framework.
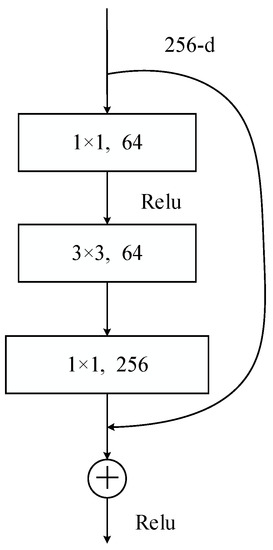
Figure 9.
Residual network structure.

Figure 10.
ID BLOCK structure.

Figure 11.
CONV BLOCK structure.
2.2.4. Model Building
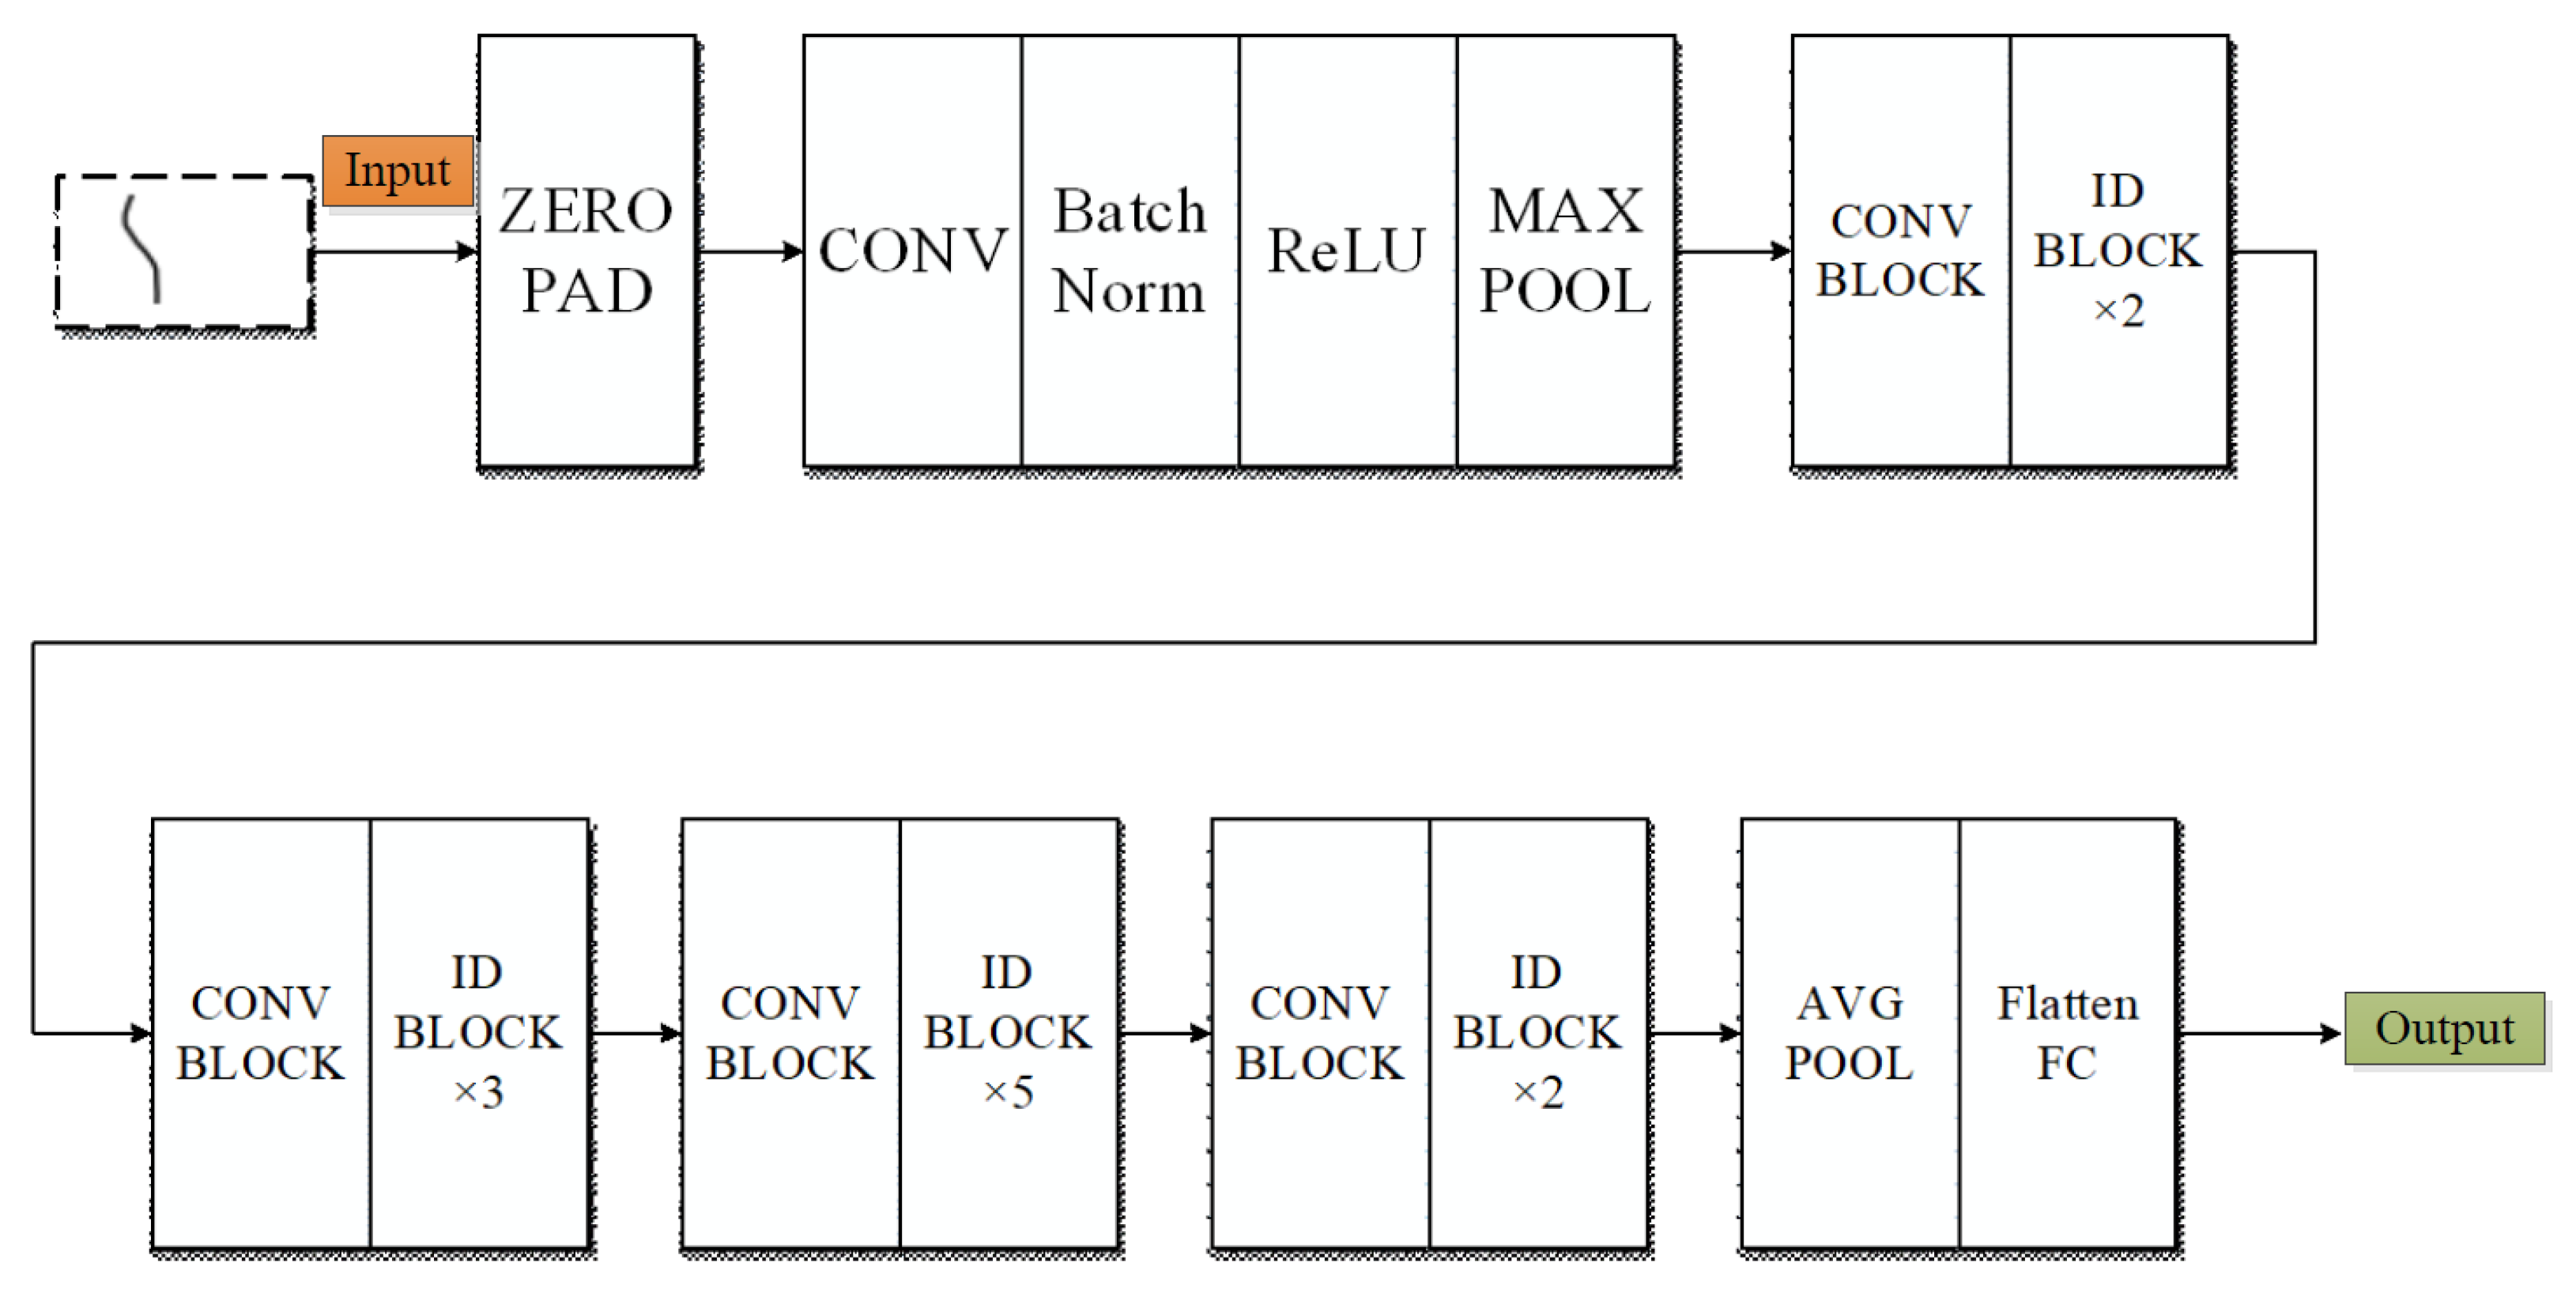
The ship trajectory classification network structure proposed in this paper is shown in Figure 12 and Table 4. The structure is composed of five convolution blocks stacked in sequence. Each convolution block contains the residual network substructure shown in Figure 11. The residual network substructure in different convolution blocks has different numbers of convolution kernels. The input layer dimension parameter of the network model is set to , the mini batch size is set to 64, and the output layer category is set to 5.
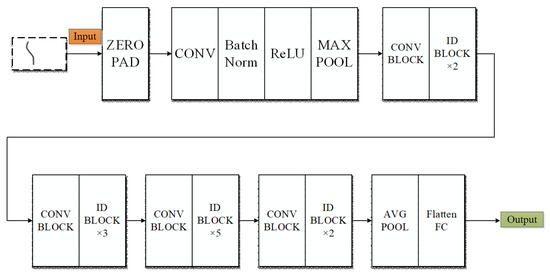
Figure 12.
Ship trajectory classification network architecture.

Table 4.
Ship trajectory classification network structure.
3. Results
3.1. Model Training
Assuming that the ship trajectory image data point is , because the pixel values of the image data are in the range of (0, 255), each data point is normalized before model training, as shown in formula (2), and the data format is converted to the float32 data type in the tensorflow framework.
3.1.1. Experimental Environment and Hyperparameters
This experiment runs on the tensorflow deep learning framework and uses a GTX1060 graphics card for training. The hyperparameter settings are shown in Table 5.

Table 5.
Hyperparameters.
3.1.2. Optimizer and Loss Function
In this paper, we use Radam as the optimizer. Radam is a deep learning optimizer proposed by Chinese doctoral student Liu Yiyuan in 2019. It is designed to solve the problem that SGD has good convergence effect but slow speed, whereas Adam converges quickly, it is not easy to converge to the local optimal solution. Based on variance dispersion, Radam dynamically turns on and off the adaptive learning rate and realizes a method that does not need to warm up the learning rate in the adjustable parameters.
It has the advantages of both Adam and SGD, which can ensure fast convergence speed and does easily fall into the local optimal solution. In the case of a high learning rate, the accuracy of Radam is better than that of SGD. In addition, for the multi-classification problem, the cross-entropy loss function and the Softmax activation function are used.
3.1.3. Training Effect Analysis
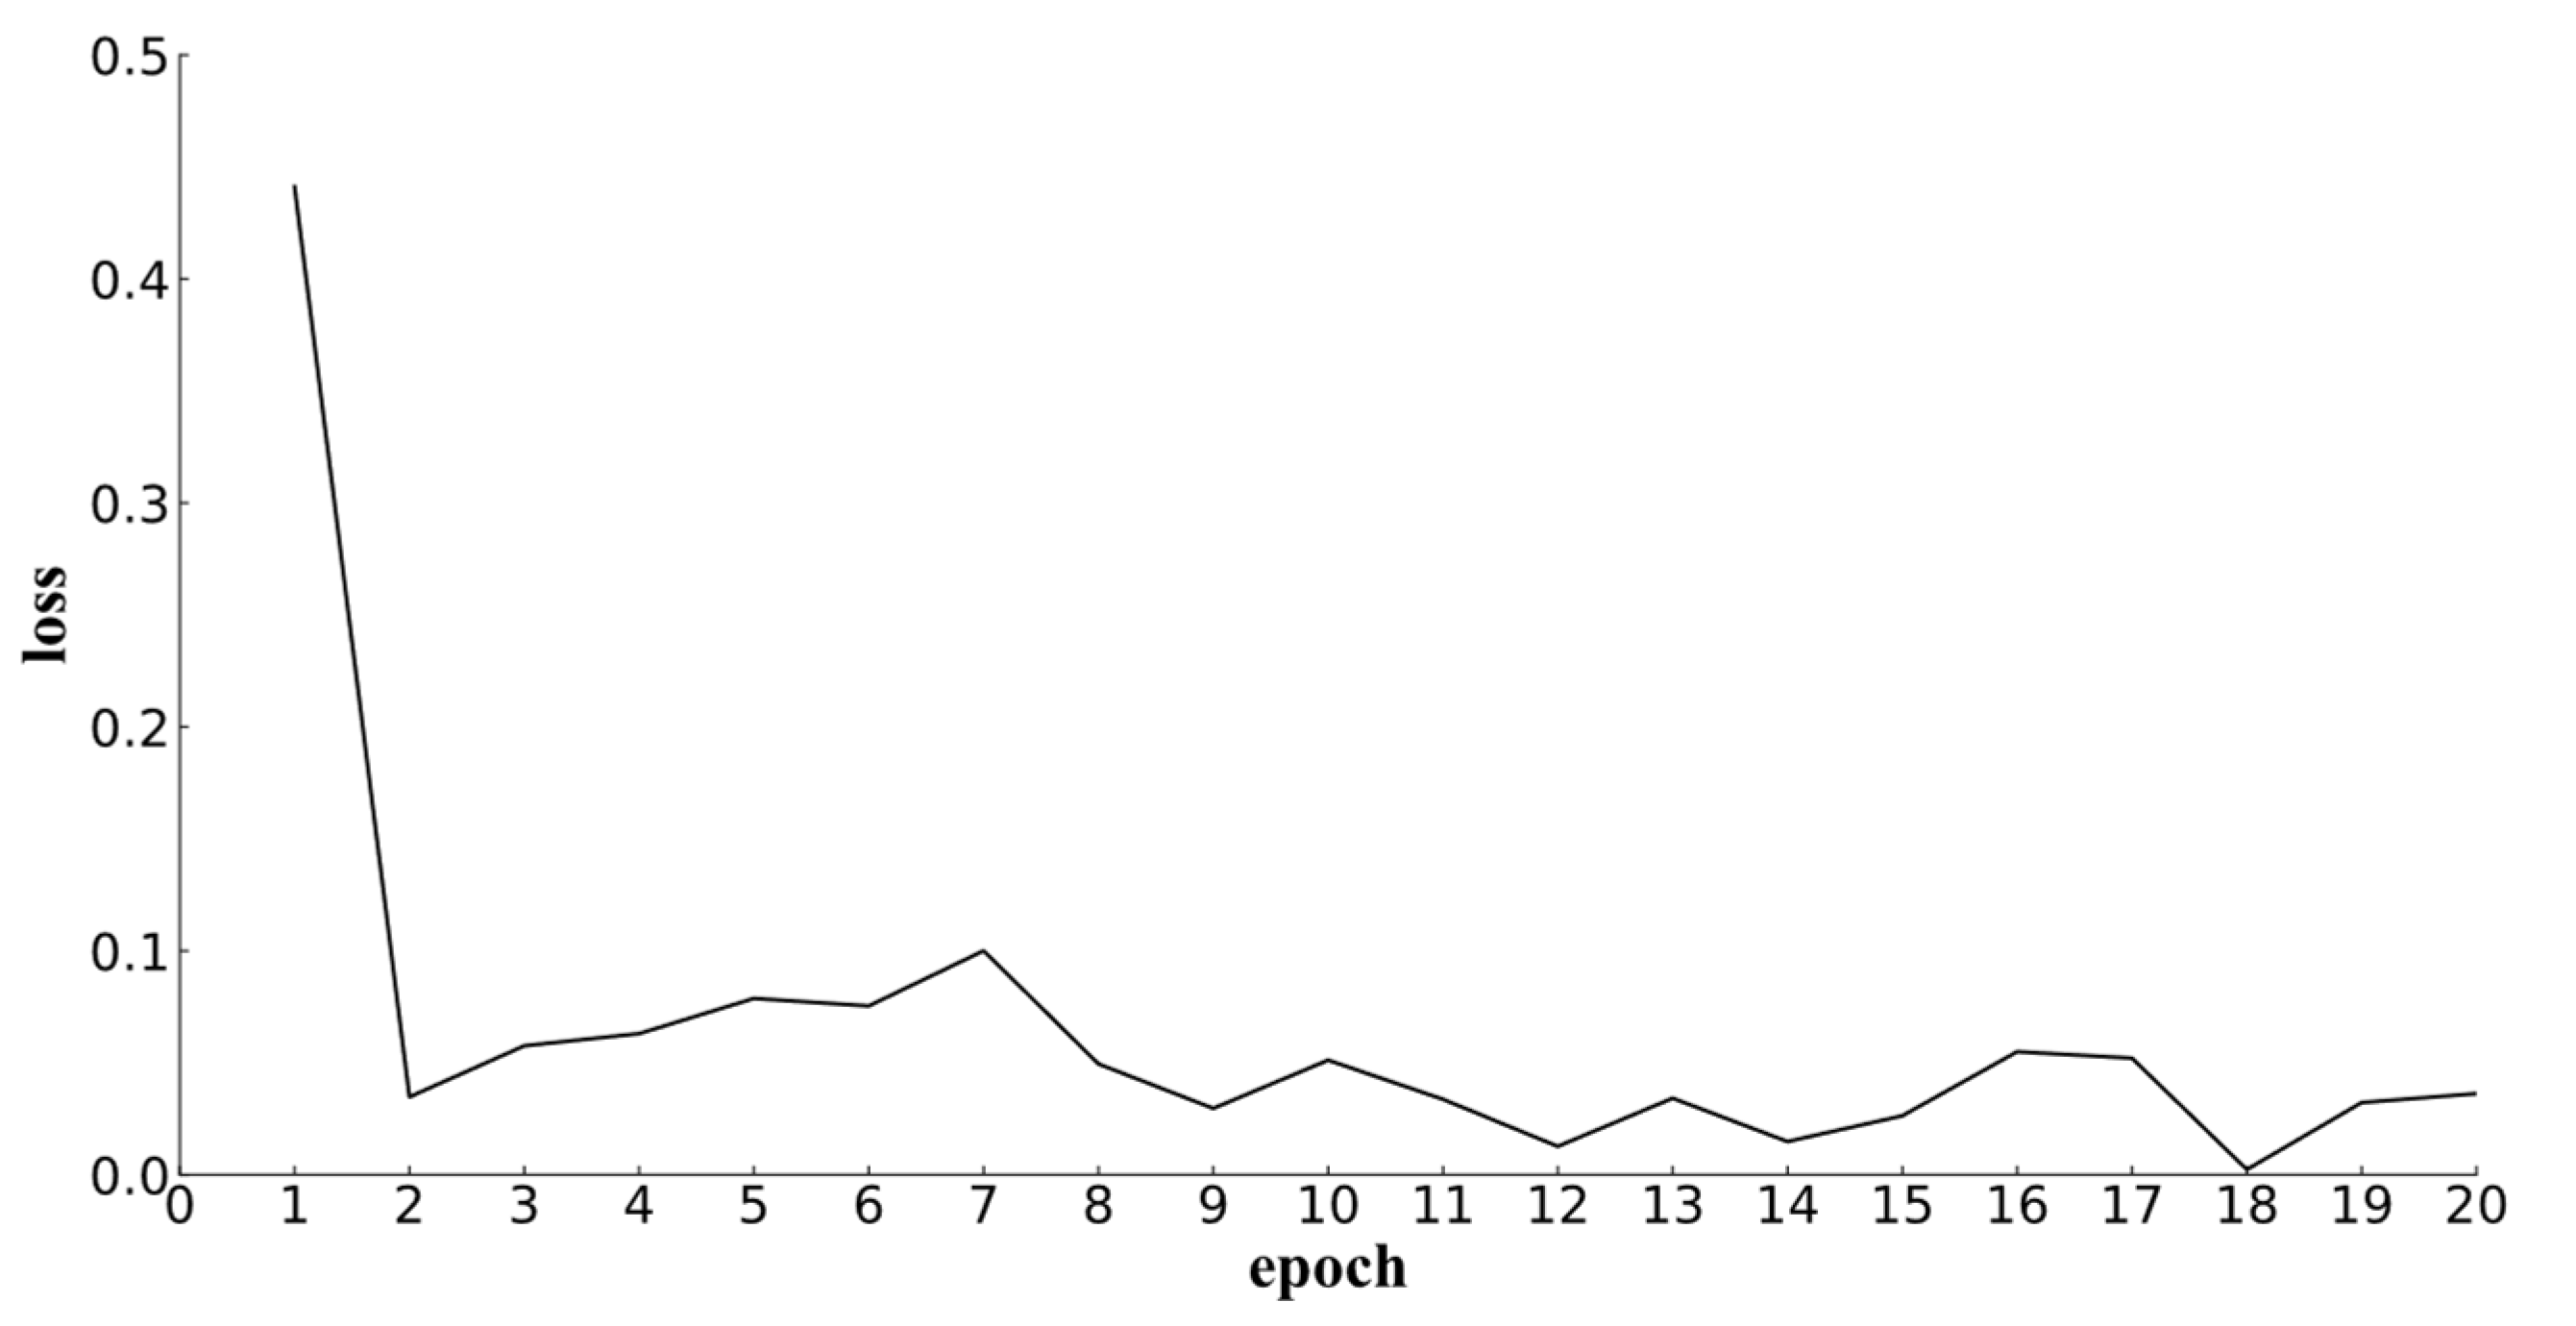
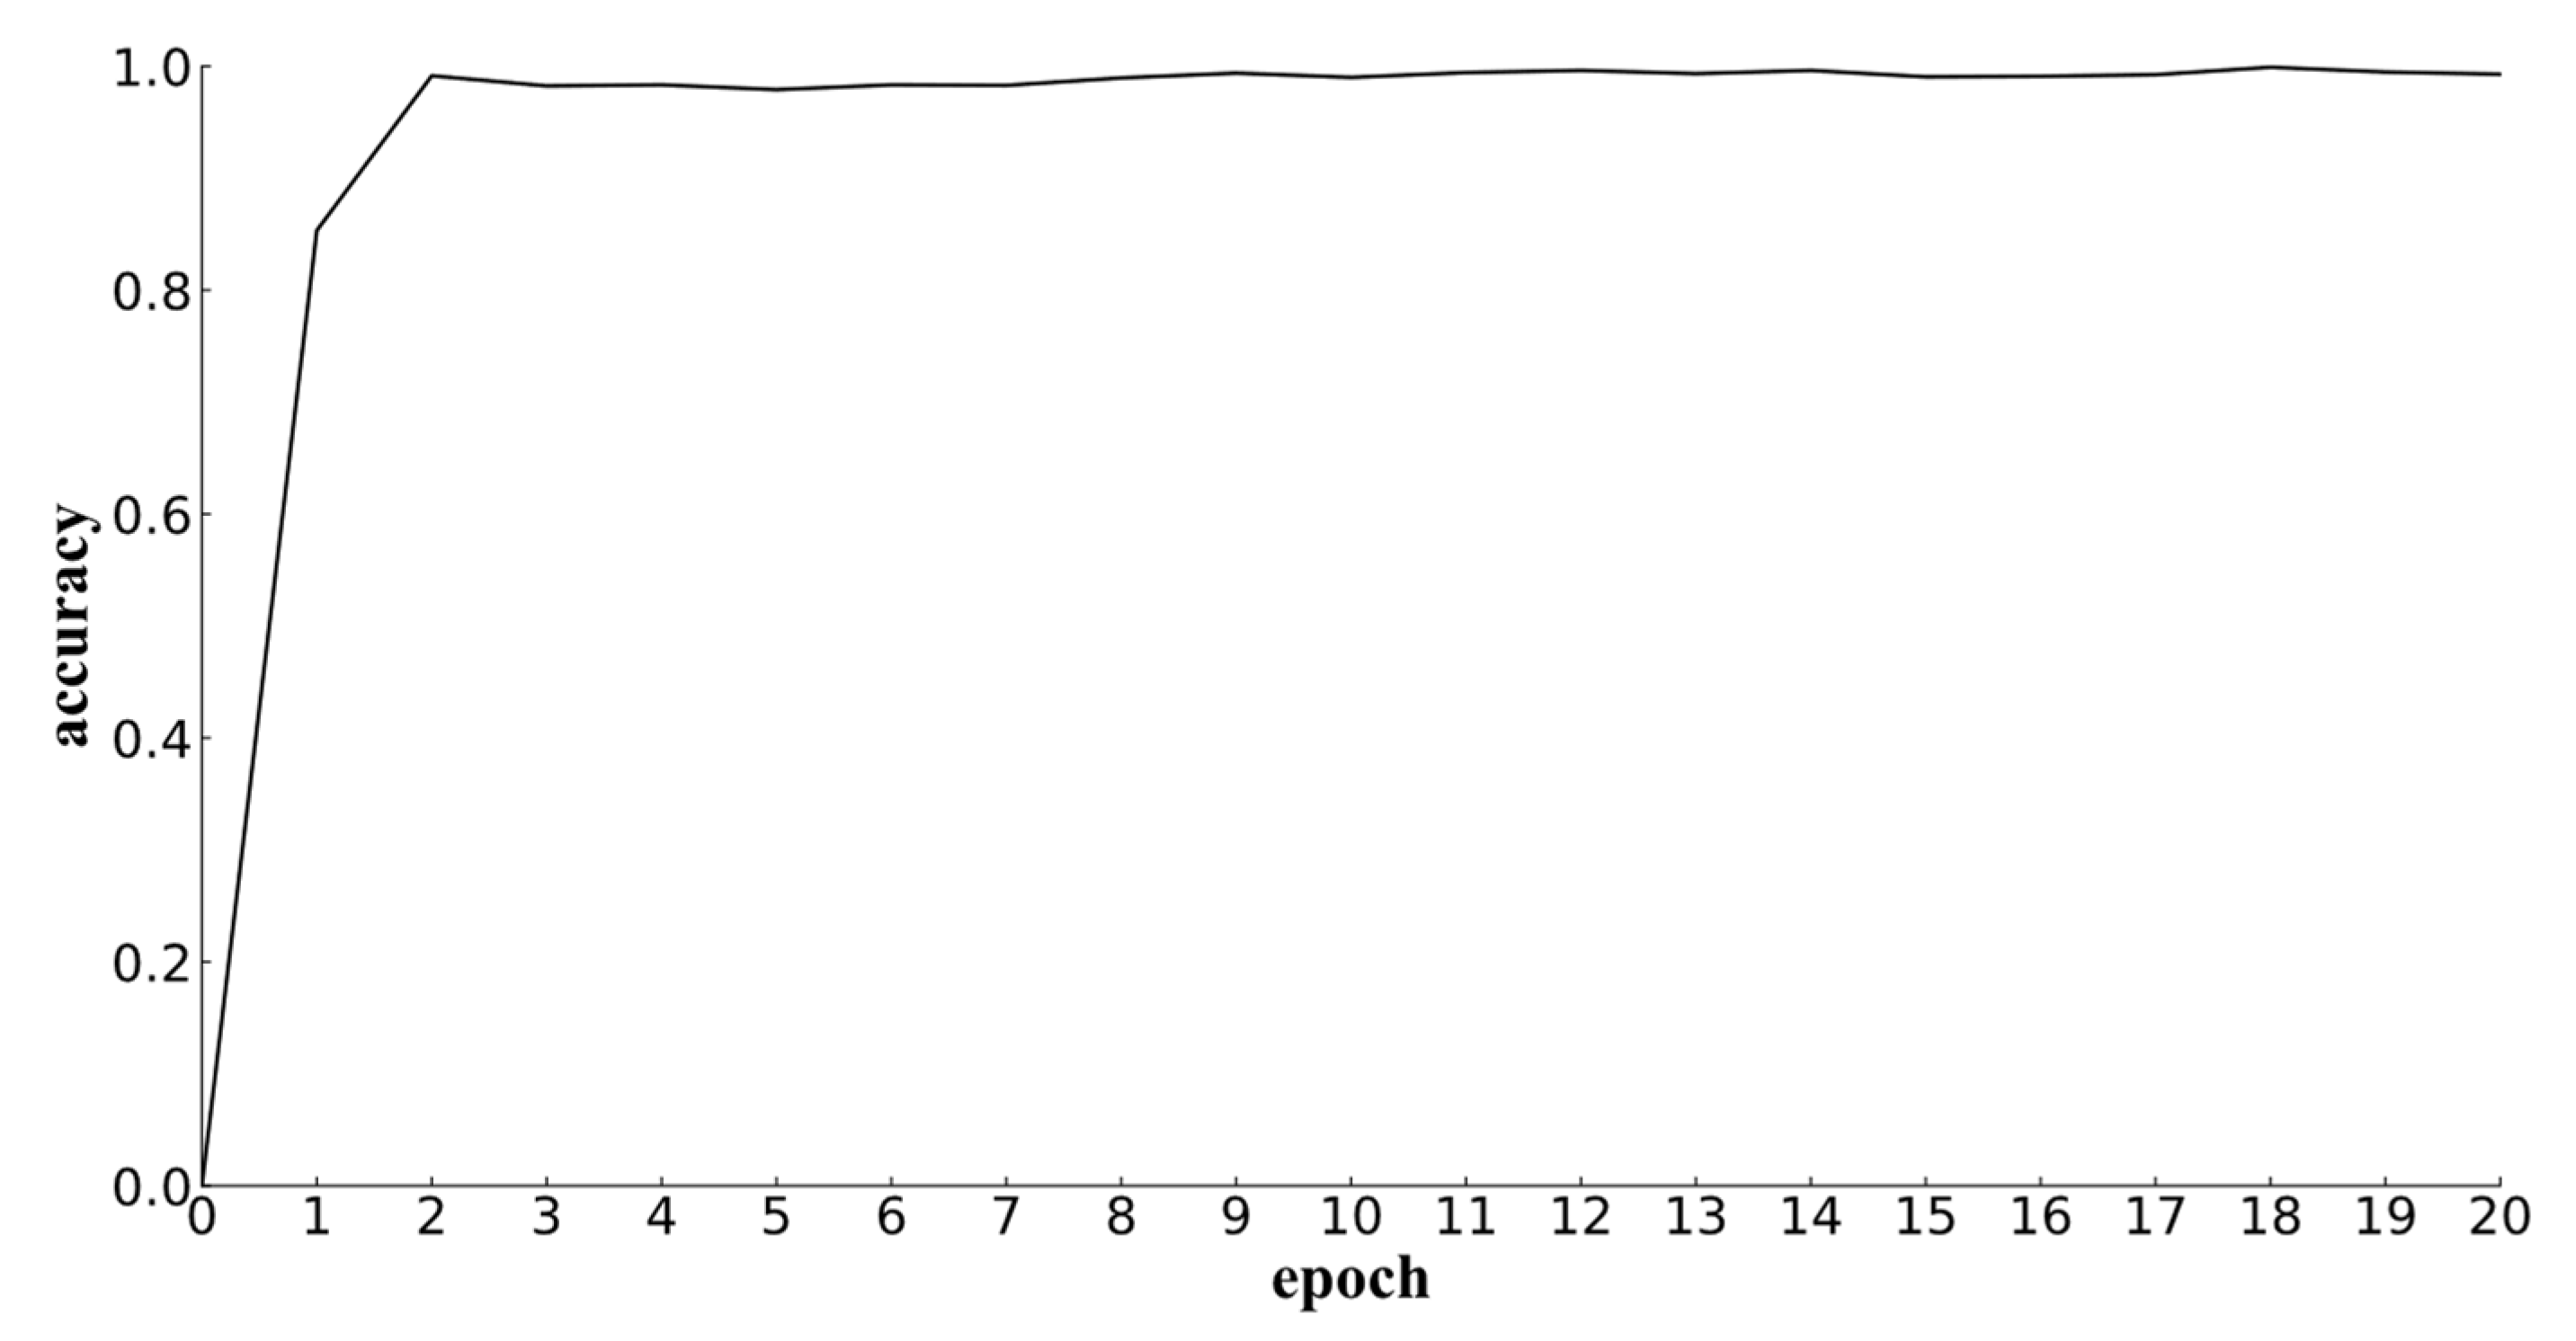
In this paper, we use the Tensorboard data analysis visualization tool in Tensorflow to analyze the model training effect. Figure 13 shows the change in loss value during the training process, with the number of iterations set to 20. With the increase in the number of iterations, the loss curve of the ship trajectory classification model shows a convergence trend as a whole, with a small fluctuation between the fourth and eighth iterations but finally converging around 0.04. The training results show that the model has learned the data features of the ship trajectory images and the model training has achieved the expected effect. Figure 14 is a graph of the accuracy rate of the validation set during the model training process. With the increase in training time, the accuracy rate of the model on the validation set classification increases rapidly. After the number of iterations reaches 10, the accuracy rate remains around 98.90%. This also shows that the model already has excellent classification ability for the training set.
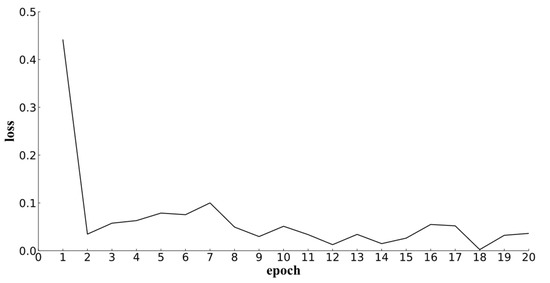
Figure 13.
Loss curve.
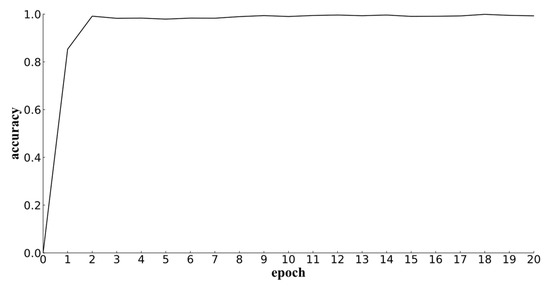
Figure 14.
Accuracy graph.
3.2. Results of the Improved QuickBundles Clustering Algorithm
In order to further verify the clustering ability of the improved QuickBundles clustering algorithm for ship trajectory, in this paper, we compare and analyze the clustering effect and execution efficiency of the improved QuickBundles clustering algorithm, the QuickBundles clustering algorithm, and the DBSCAN algorithm. In the experiment, the thresholds of the three clustering algorithms are the best clustering thresholds obtained in Section 3.1.
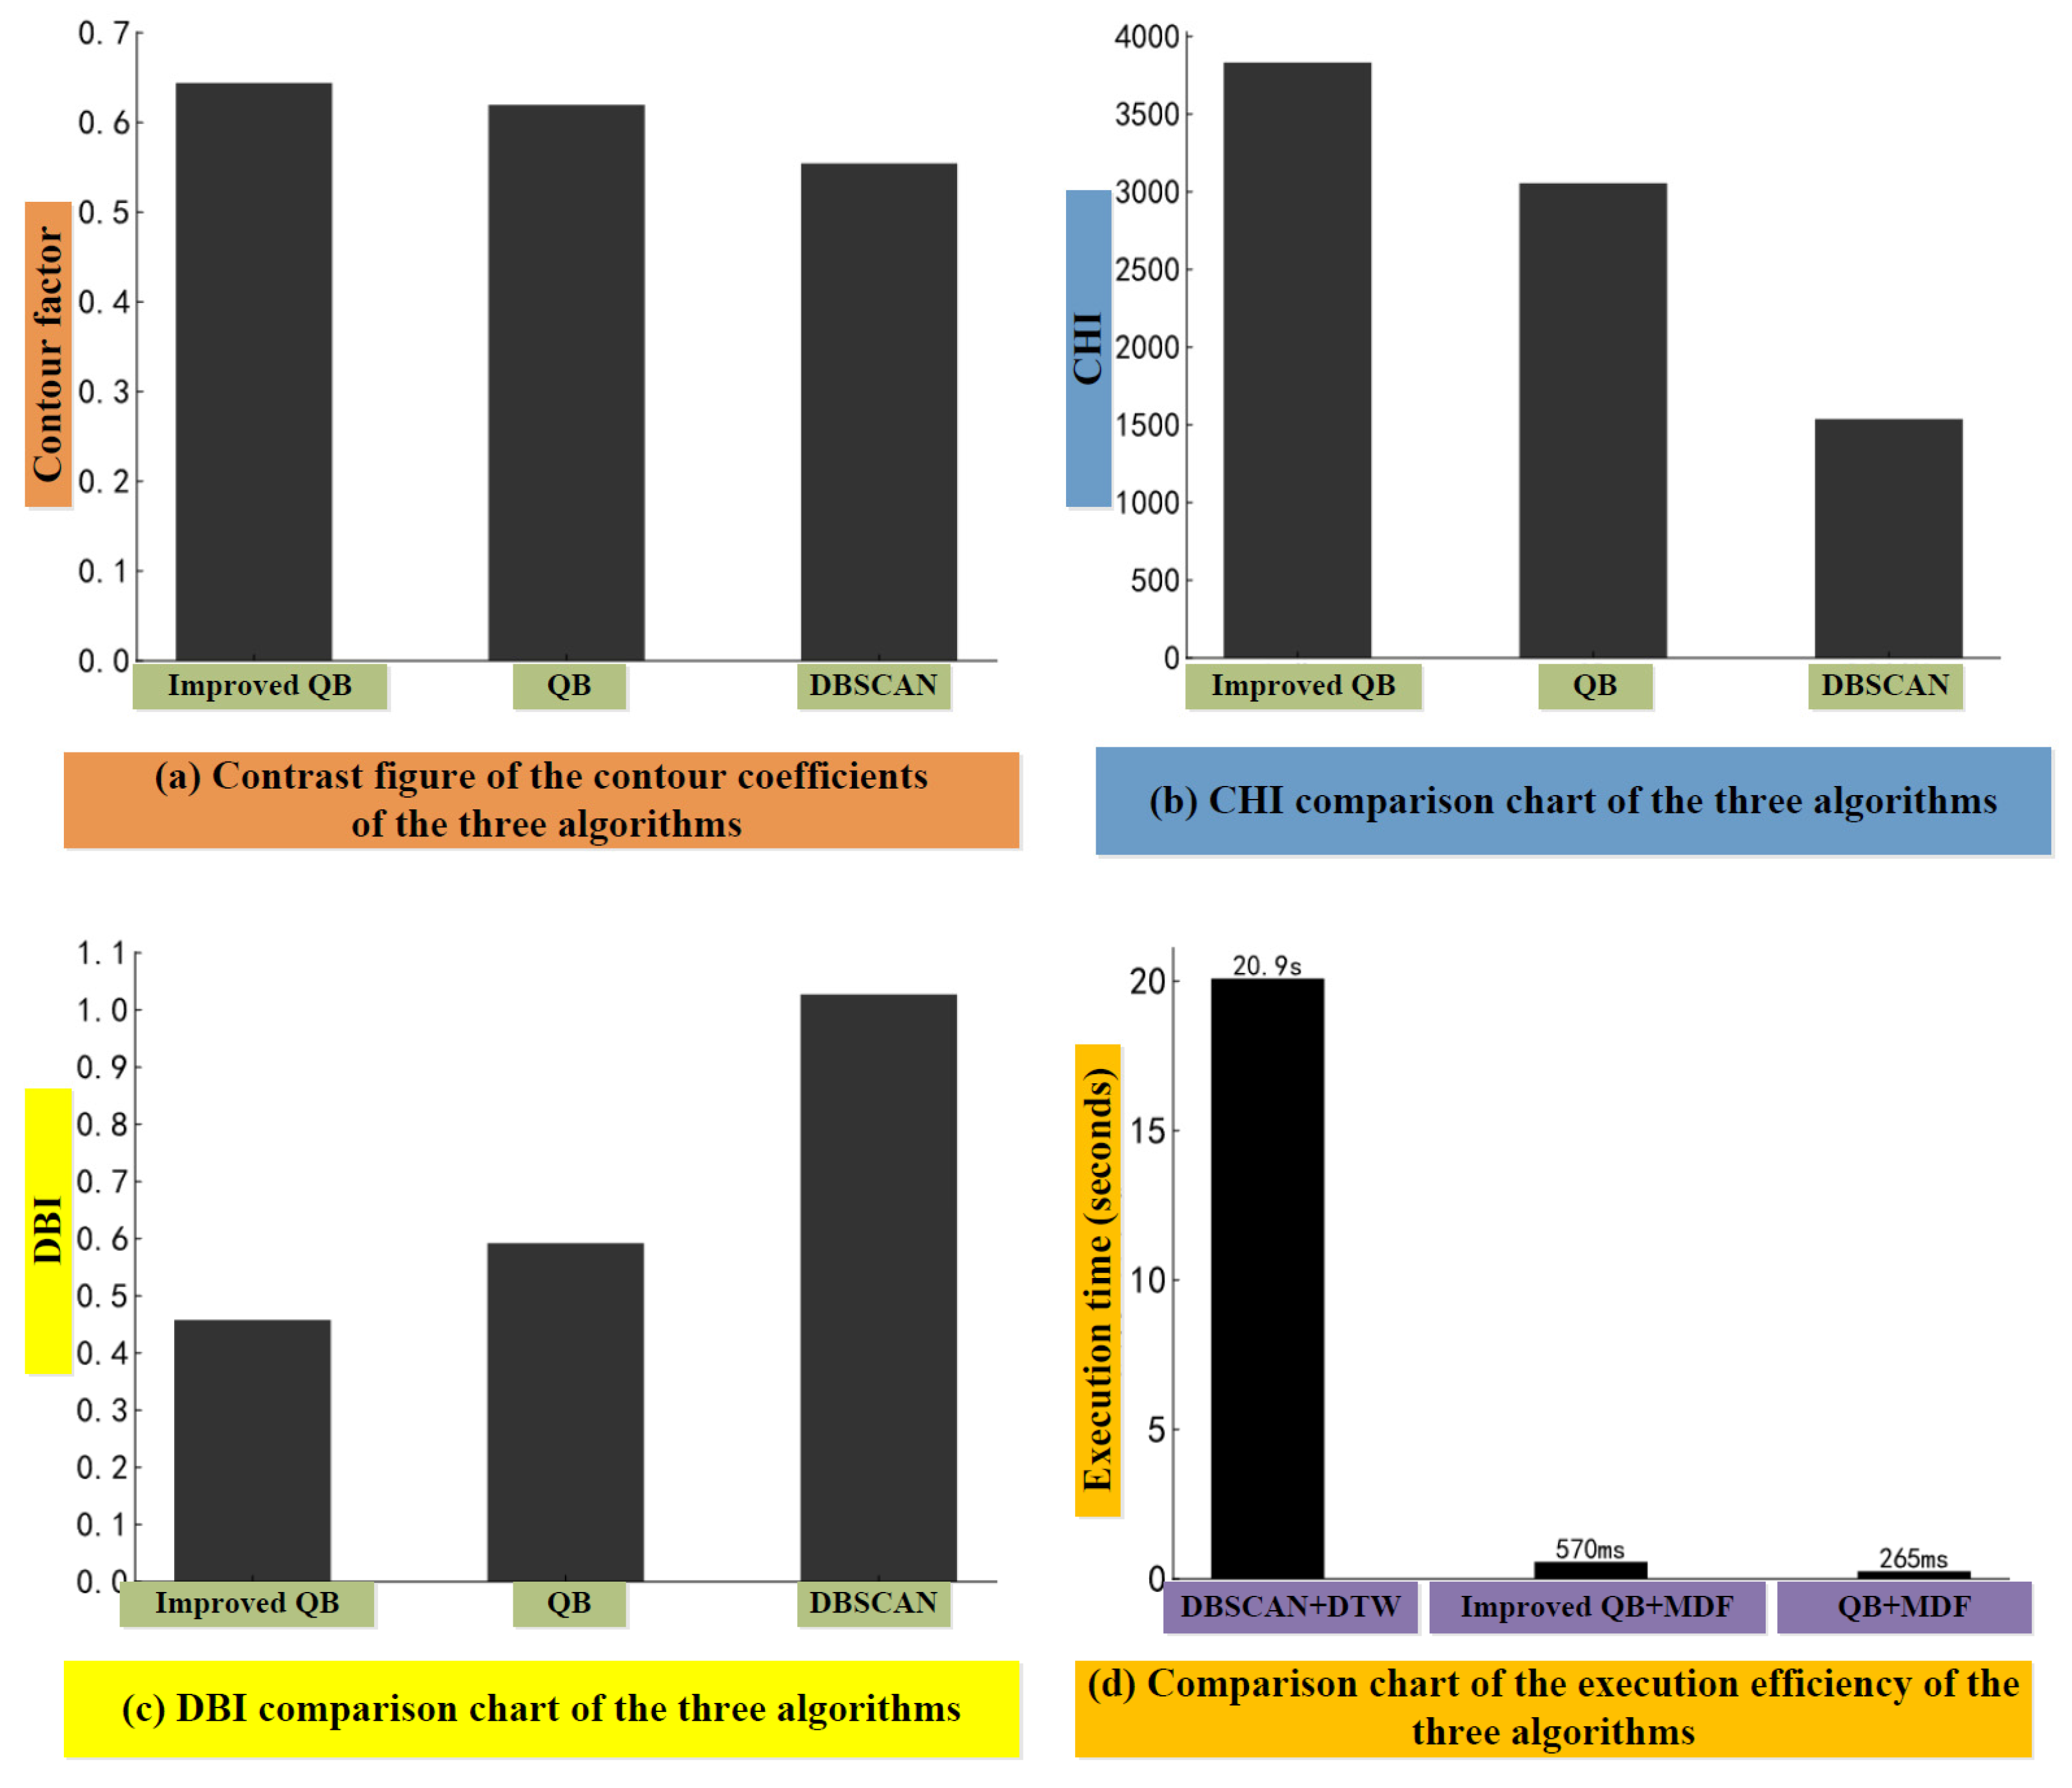
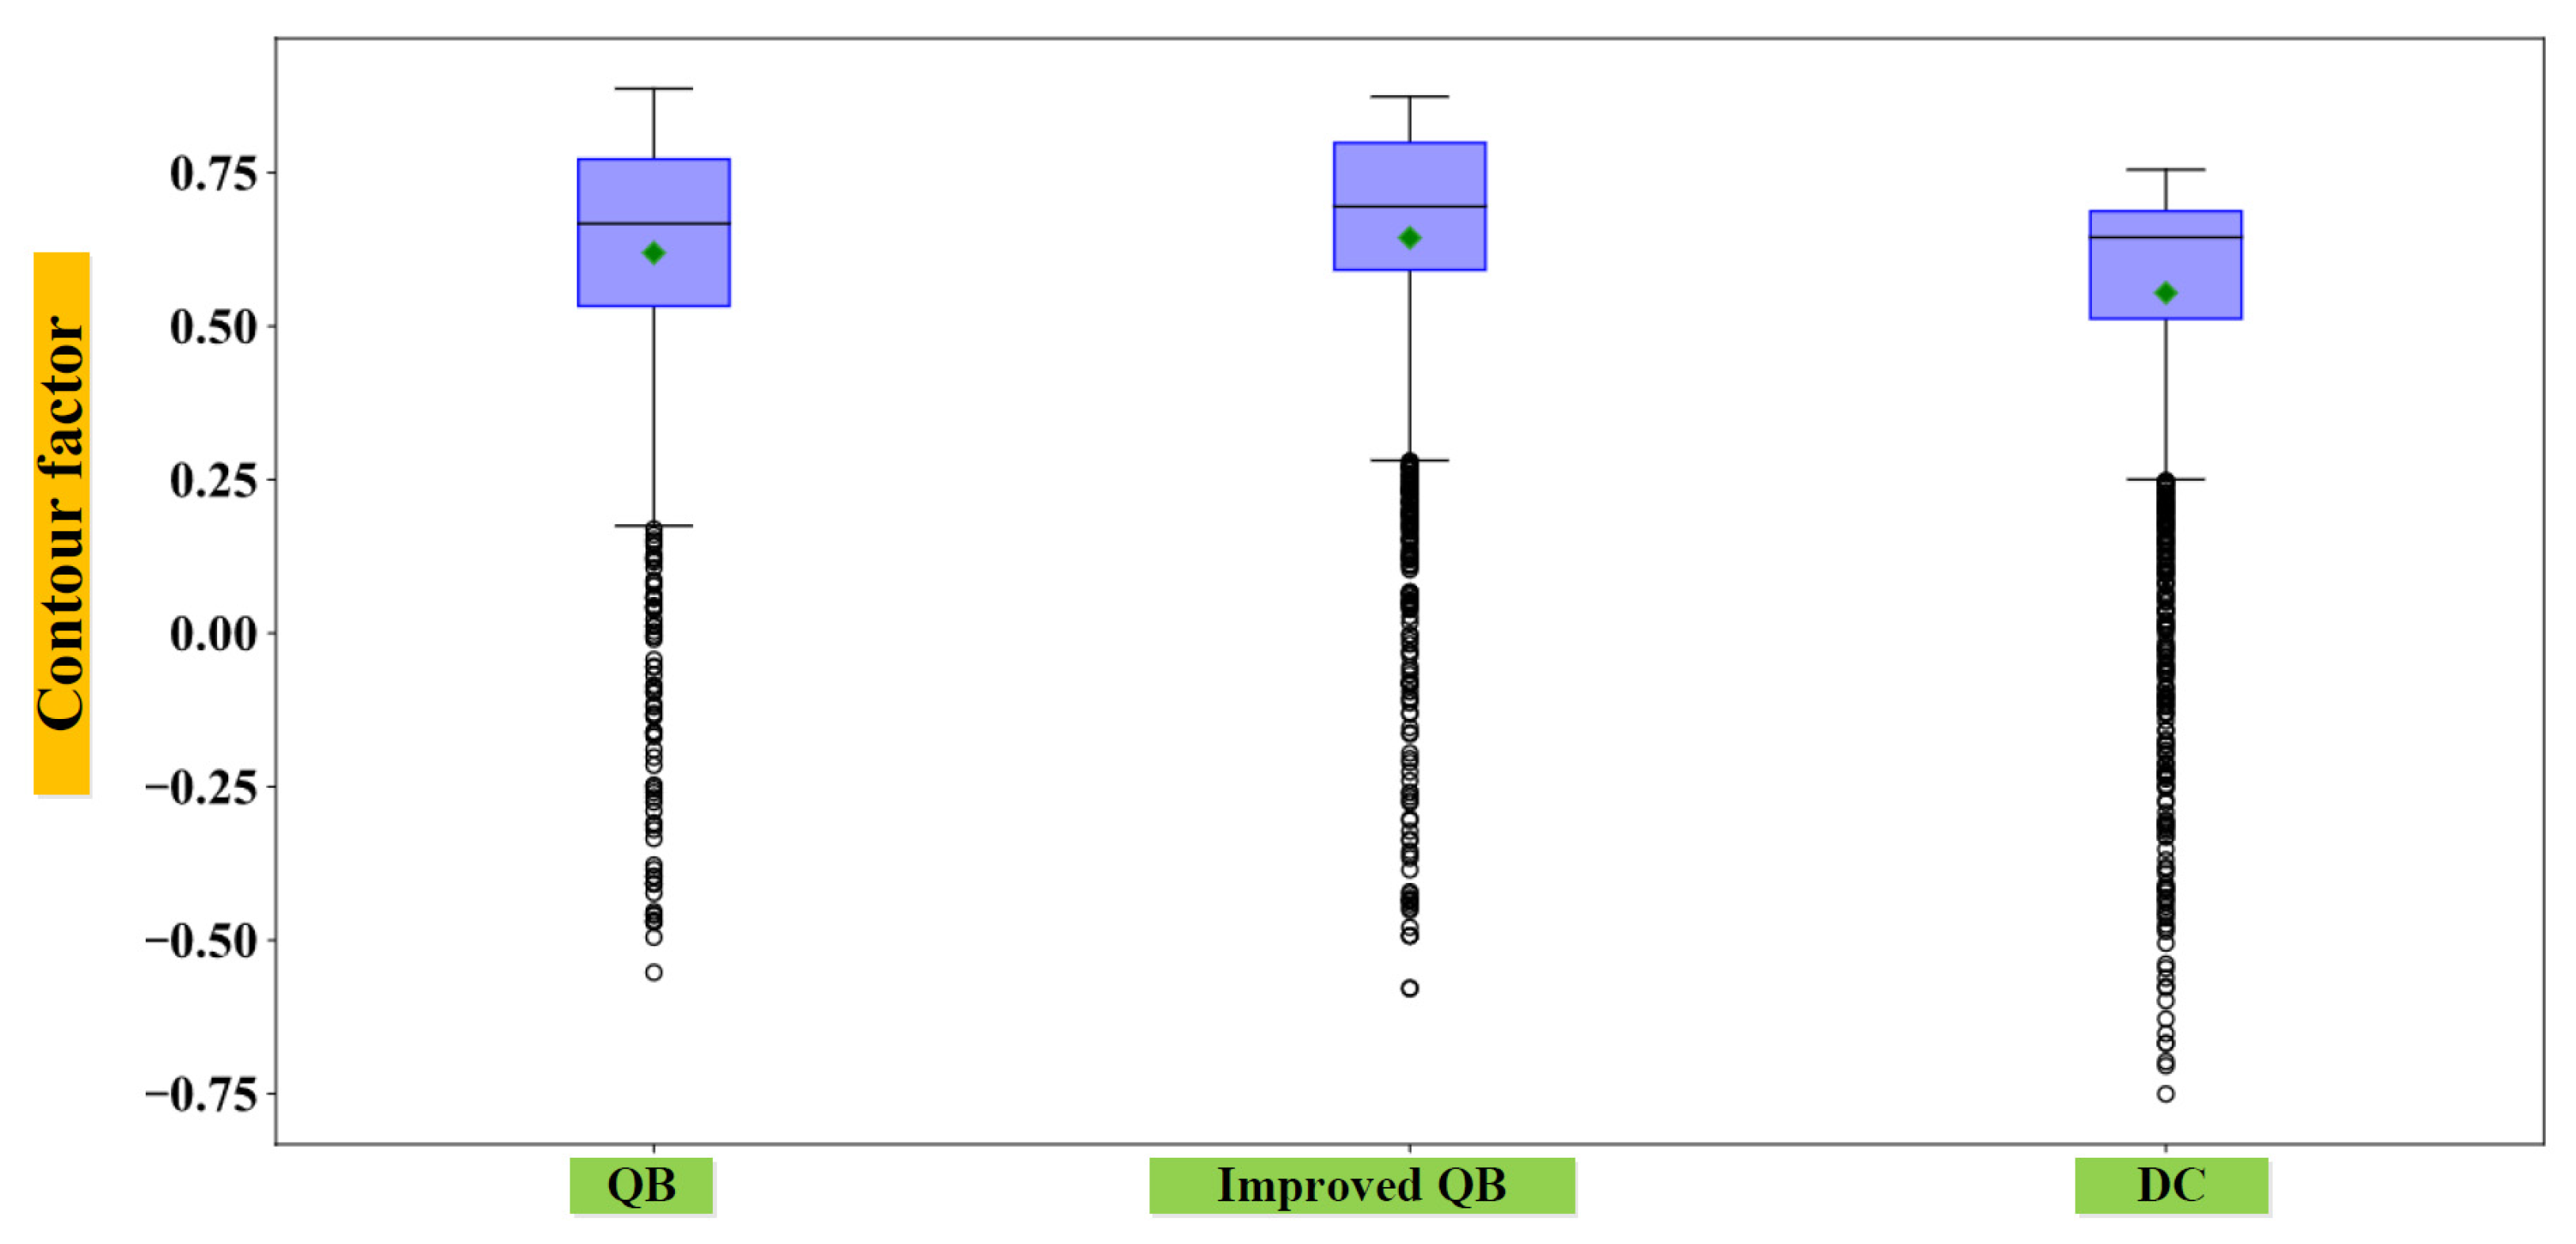
The comparison results of the contour coefficients of the three clustering algorithms are shown in Figure 15a. The contour coefficient of DBSCAN is 0.5568, the contour coefficient of the QuickBundles clustering algorithm is 0.6173, and the contour coefficient of the improved QuickBundles clustering algorithm is 0.6380. The QuickBundle clustering algorithm surpasses the other two algorithms according to various metrics. Figure 16 shows the statistics of the three clustering algorithms. The distribution of contour coefficients of all trajectory data, the mean, upper quartile, median, and lower quartile of the improved QuickBundles clustering algorithm in the figure are higher than those of the QuickBundles clustering algorithm and the DBSCAN algorithm. The CHI comparison results of the three algorithms are shown in Figure 15b. The CHI of the improved QuickBundles clustering algorithm is 3769.2168, which is significantly higher than the other two comparison algorithms. Figure 15c shows the DBI comparison results of the three algorithms. For the ship trajectory data, the improved QuickBundles clustering algorithm is better than the other two algorithms. In terms of algorithm execution efficiency, as shown in Figure 15d, the improved QuickBundles clustering algorithm is only 305 milliseconds slower than the QuickBundles clustering algorithm, and the execution time of DBSCAN is less than 20.9 s.
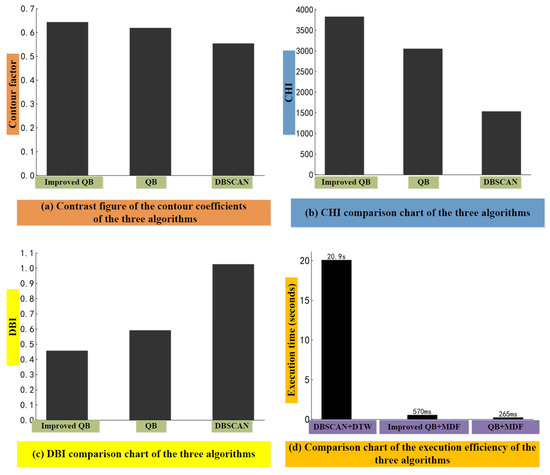
Figure 15.
Comparison of the clustering evaluation indicators of the three algorithms.
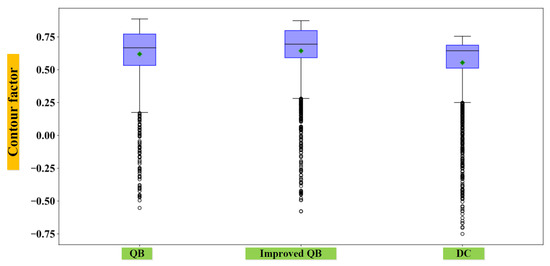
Figure 16.
Box diagram of ship trajectory profile coefficients in the three algorithms.
The comparison results show that the QuickBundles clustering algorithm has improved the clustering effect of the DBSCAN ship trajectory clustering algorithm on the ship trajectory dataset. In terms of various indicators, the improved QuickBundles clustering algorithm has improved performance compared with the pre-improved QuickBundles algorithm and is more suitable for the clustering of ship trajectory data. In terms of algorithm execution efficiency, the improved sampling method does not significantly affect the algorithm. The improved QuickBundles algorithm is only 305 milliseconds slower than the QuickBundles algorithm, which is slower than DBSCAN’s 20.9 s.
In this section, we take the complete ship trajectories in complex waters as the research object, focusing on the characteristics of ship trajectories and headings in order to achieve fast and accurate clustering based on MDF distance and the QuickBundles clustering algorithm. A ship trajectory clustering method based on the improved QuickBundles algorithm is presented. In this section, first we compare the MDF distance with two classical trajectory metrics and analyze their advantages and disadvantages. We propose a sampling method based on the difference of the heading angle of the ship trajectory, improving the sampling method of the QuickBundles algorithm. Finally, a ship trajectory clustering experiment based on the improved QuickBundles algorithm is carried out, and the rationality and reliability of the research method presented in this section are analyzed by comparison with the DBSCAN algorithm on the public American coastal AIS ship trajectory dataset.
The experimental results show that the method proposed in this section can reasonably cluster the ship trajectories of various waterways and that the improved QuickBundles clustering algorithm has better clustering performance. In addition, using the dataset and without considering the trajectory noise, the improved QuickBundles clustering algorithm is slightly better than the traditional DBSCAN trajectory clustering algorithm in terms of accuracy and algorithm execution efficiency. The ship trajectory clustering results in this section will be used as the basis for subsequent ship trajectory anomaly detection research and ship trajectory classification research.
3.3. Ship Trajectory Classification Network Model Test Set Analysis
After the training of the ship trajectory classification network model, we use the test set to verify the model’s channel trajectory classification effect. Table 6 is the confusion matrix of the classification results of the test set. Among them, the classification accuracy of the first, second, and third categories is 100%. Among the 334 samples of the fourth and fifth categories, there are six misidentified samples. Figure 17 is a comparison chart of the trajectories of the fourth and fifth types of ships in the water area where the experimental data are located. It can be seen that in the fourth and fifth types of ship trajectories, a very small part of the ships did not travel in the corresponding channel but sailed in the separation zone between the two channels, which violated the “General Provisions for Ship Routing System” and also led to misclassification of ship trajectories. In spite of this, the ship trajectory classification model presented in this paper still achieves an accuracy of 98.85% on the test set, achieving accurate classification of ship trajectory categories in the analyzed waters.

Table 6.
Confusion matrix of ship trajectory image test set.

Figure 17.
The fourth- and fifth-type channel information map of the water area where the experimental data are located.
3.4. Cross-Validation Comparative Analysis
In order to further verify the classification ability of the ship trajectory classification network model, we select the fully connected neural network model and the multi-category SVM model [33] with the longitude and latitude data format as input as a comparison to carry out comparative analysis. The parameter information of the fully connected neural network comparison model selected in this paper is shown in Table 7. Among them, the fully connected neural network requires a unified data input format, so in this paper, we draw on the method of Chen [34] and others; using cubic spline interpolation, each ship trajectory data are sampled as 50 points.

Table 7.
Fully connected neural network model parameters.
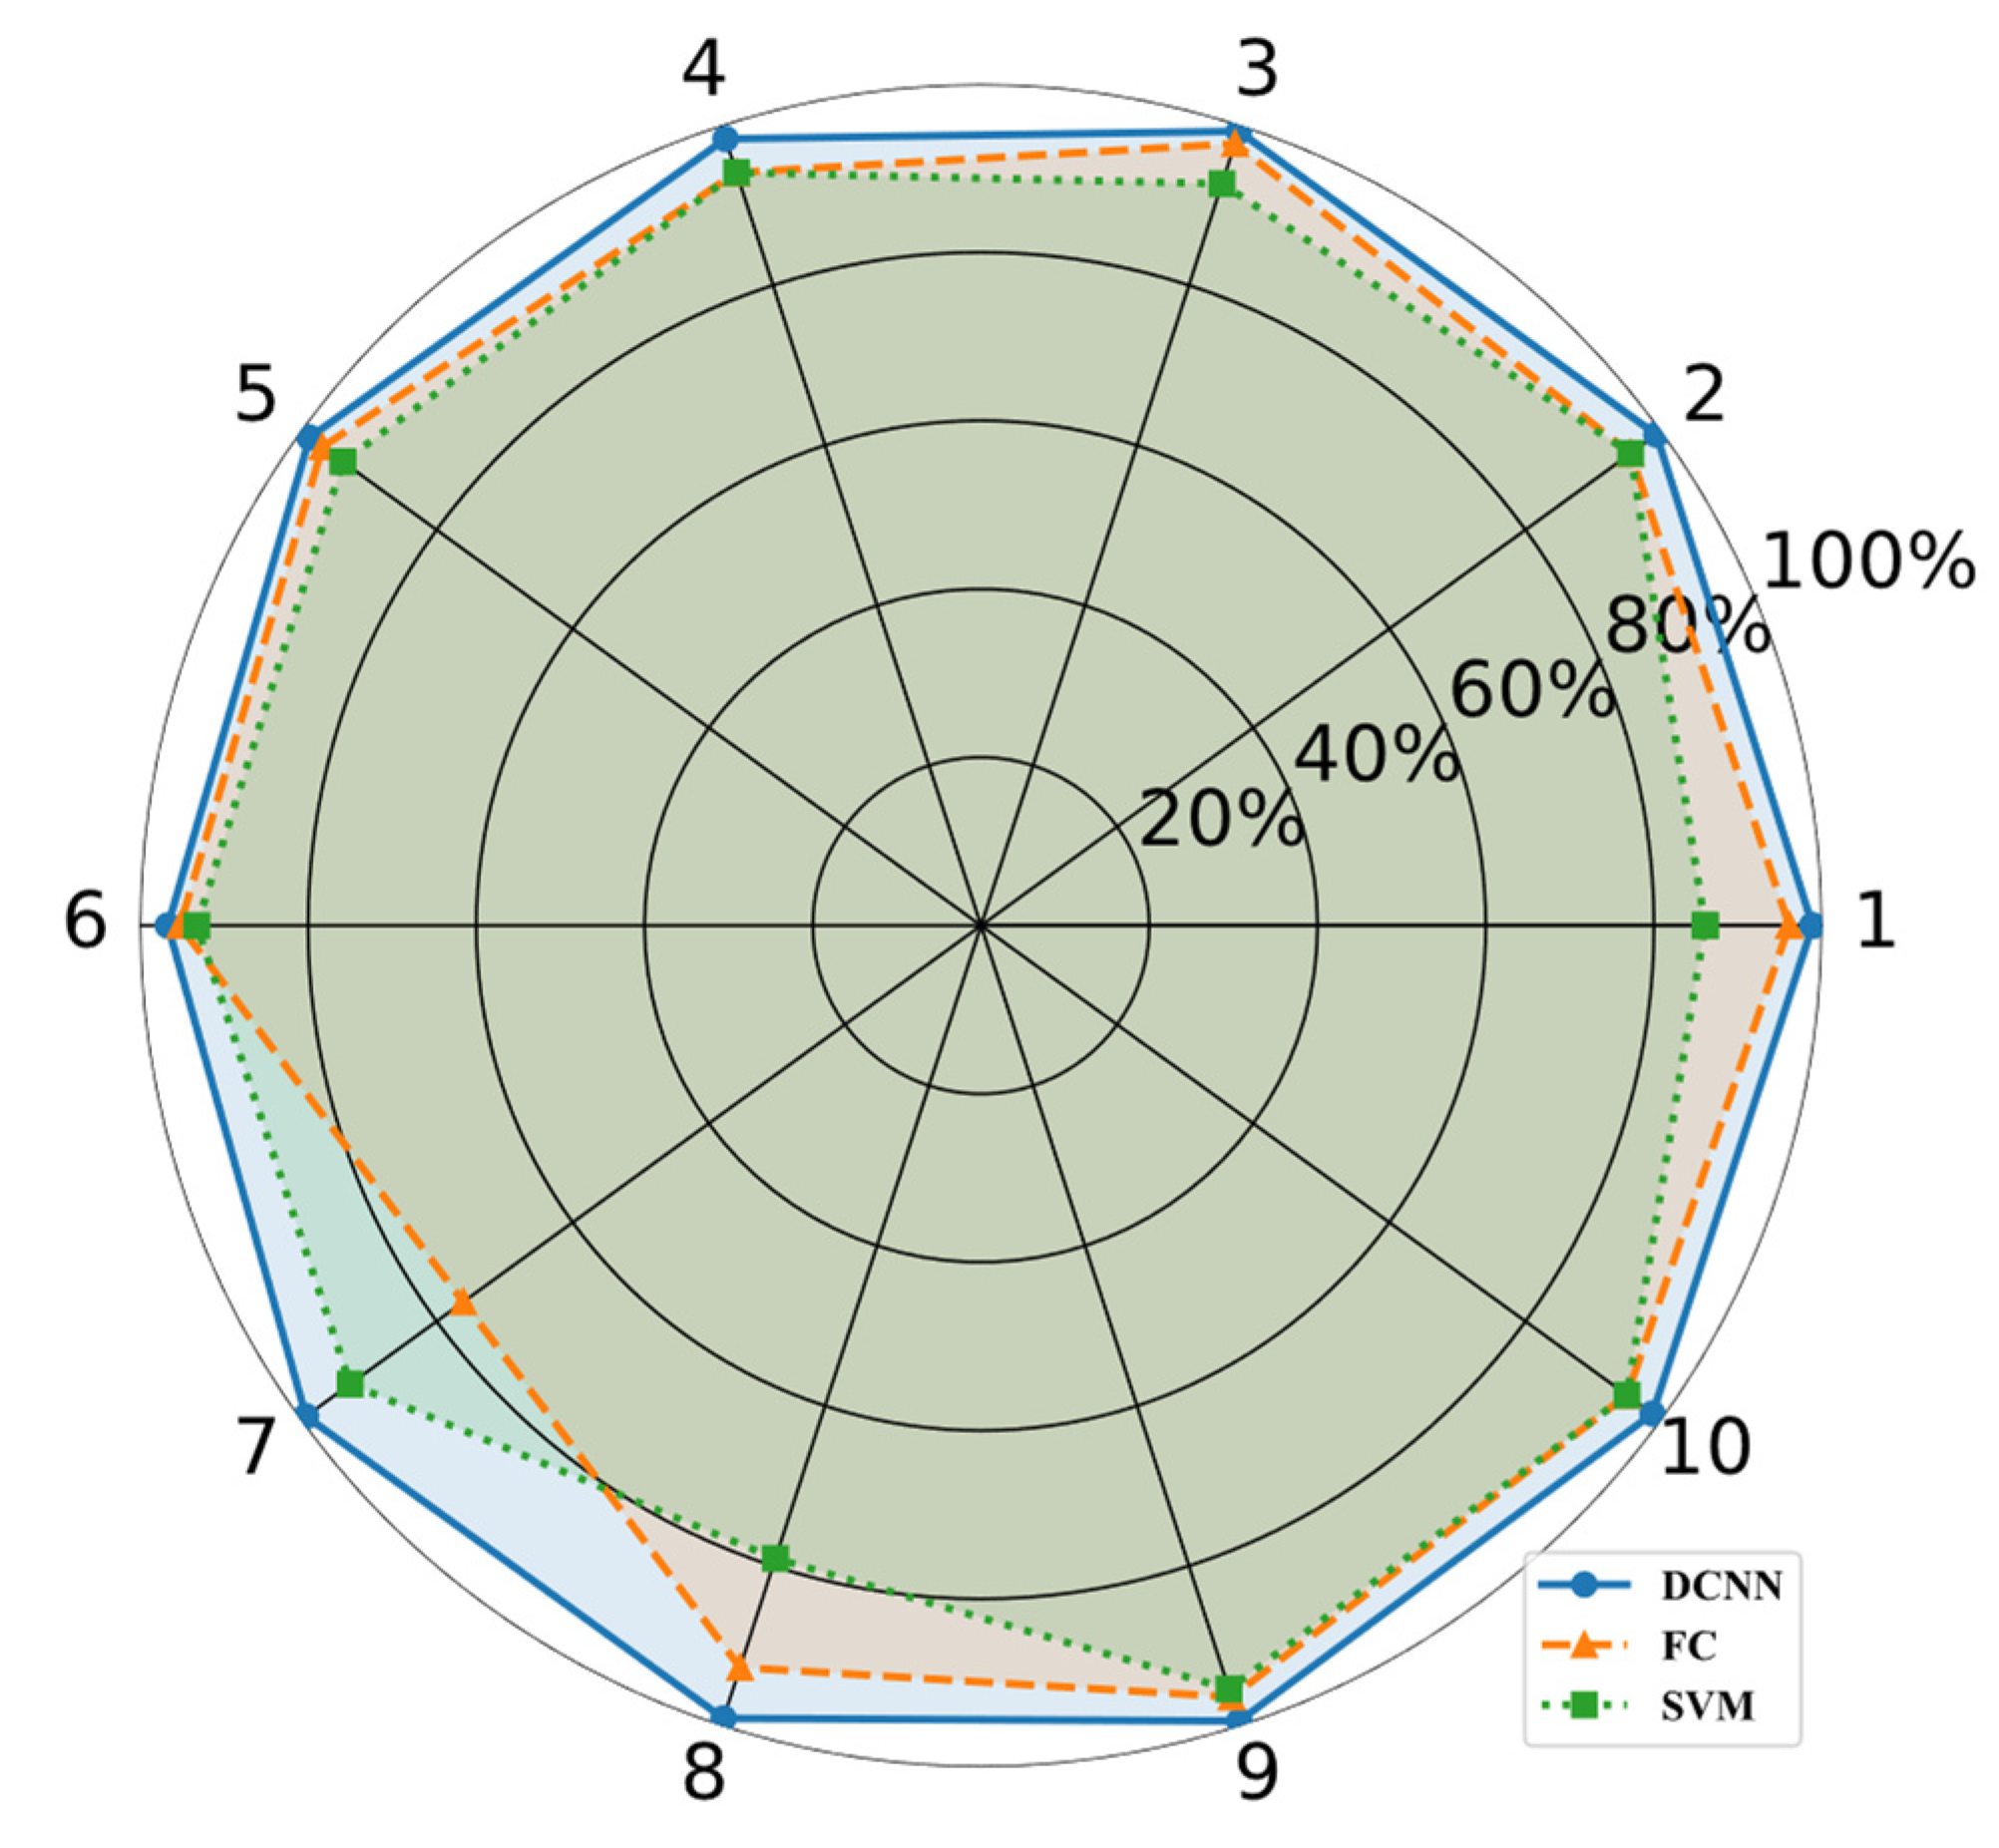
The input data format of the fully connected neural network participating in the comparison is an array of , where 2 is the longitude and latitude of the ship’s trajectory data, and 50 is the trajectory data length after sampling for each trajectory. The input data format of the SVM model participating in the comparison is an array of ; 100 is the result of flattening the above data, and the kernel function is RBF. All models have undergone 10-fold cross-validation. Figure 18 shows the results of the ten-fold cross-validation of the three models, and Table 8 shows the average accuracy of the three models’ 10-fold cross-validation. It can be seen from the experimental comparison results that for the dataset used in this paper, the proposed ship trajectory classification network model achieves 98.72% accuracy, which is higher than the 93.53% accuracy of the fully connected neural network model and the 91.73% accuracy of the SVM model. The superiority of the ship trajectory and waterway classification model in the performance of ship trajectory classification is verified.
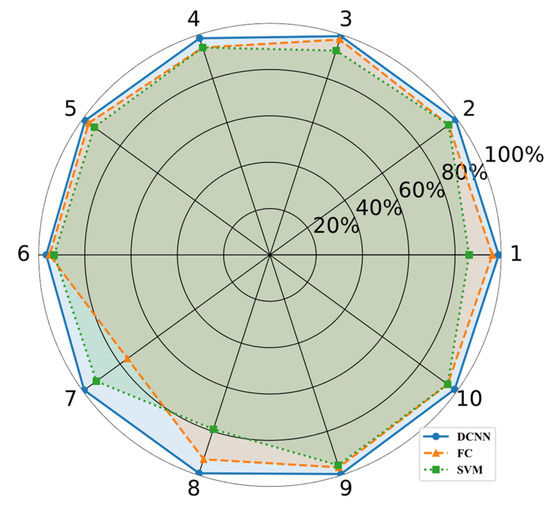
Figure 18.
Ten-fold cross-validation results of the three models.

Table 8.
The age accuracy of the three models’ ten-fold cross-validation.
In this section, the ship trajectory classification research fails to use the ship trajectory spatial feature information, and the process of extracting features such as ship trajectory heading and speed is too cumbersome. We propose a ship trajectory classification method based on a deep convolutional neural network. First, based on the clustering results in Section 3, the trajectory longitude and latitude data are converted into high-dimensional trajectory image data, and the spatial characteristics of the ship trajectory are extracted. Then, the ship trajectory classification model is constructed based on the principle of a residual network [35], and ship trajectory classification is realized. Finally, using the latitude and longitude data of the ship trajectory as input, a fully connected neural network model and SVM model are constructed as comparison models, and a comparison experiment with the model proposed in this section is carried out. The experimental results show that for the dataset used in this article, the accuracy of this model on the test set is 98.85%, and the accuracy of the ten-fold cross-validation is 98.72%, which is higher than the 93.53% of the fully connected neural network and the 91.73% of the SVM.
According to the above comparison results, the ship trajectory is converted into image data while retaining its ability to express spatial features, simplifying the data feature extraction work and improving the efficiency of data processing. The deep convolutional neural network used to complete the trajectory classification task can make full use of the spatial characteristics of the trajectory data. Compared with the fully connected neural network model and the SVM model, the method proposed in this section has higher classification accuracy of the ship trajectory and provides support for the identification of the channel category. The research results of this section can provide auxiliary support for the intelligent decision making of the ship supervision department. The results of this study can provide support for the intelligent decision making for the ship navigation safety monitoring [36,37] department.
4. Conclusions
The main research work of this paper can be summarized by the following two points:
- Aiming at the problem of invalid trajectories in the original ship trajectory data, a set of ship trajectory preprocessing methods based on time interval and speed changes are summarized. In order to improve the accuracy and execution efficiency of ship trajectory clustering, research on ship trajectory clustering based on MDF distance and QuickBundles clustering algorithm is carried out. Aiming at the problem that the sampling method of the QuickBundles algorithm does not consider the of local characteristics of ship trajectory, a new method is proposed. Considering the sampling method of heading, the QuickBundles clustering algorithm is improved, and the purpose is to analyze the characteristics of water traffic and ship motion in the water area.
- In order to extract the spatial characteristics of the ship trajectory, complete the research of ship trajectory classification, convert the ship trajectory longitude and latitude data into ship trajectory image data, build a deep convolutional neural network ship trajectory classification model, and propose a deep convolution based on ship trajectory classification model, the neural network-based ship trajectory classification method analyzes the accuracy and reliability of the proposed method through real ship trajectory data and aims to solve the problem of classification of the waterway to which a ship’s trajectory belongs.
Future research will be carried out considering the following directions:
- In ship trajectory clustering research, the problem of ship trajectory clusters that contain a large amount of noise data has not been considered. In the future, it is necessary to conduct research on the noise characteristics of ship trajectory data to extract valuable ship trajectory information from it.
- In this paper, we use deep convolutional neural networks to classify ship trajectories. With the rapid development of graph neural networks, the next step can be to consider using graph neural networks to complete ship trajectory classification tasks and compare different algorithms.
Author Contributions
Conceptualization, T.G.; methodology, T.G.; validation, T.G.; resources, L.X.; writing—original draft preparation, T.G.; writing—review and editing, T.G. and L.X.; funding acquisition, L.X. All authors have read and agreed to the published version of the manuscript.
Funding
National Key Research & Development Program of China (no. 2019YFB1600600, 2019YFB1600604); Natural Science Foundation of Hubei Province (2019CFA039, 2020CFB691).
Institutional Review Board Statement
Not applicable.
Informed Consent Statement
Not applicable.
Data Availability Statement
Not applicable.
Acknowledgments
This research is supported by the National Key Research & Development Program of China (no. 2019YFB1600600, 2019YFB1600604), and the Natural Science Foundation of Hubei Province (2019CFA039, 2020CFB691).
Conflicts of Interest
The authors declare no conflict of interest.
References
- Xin, W.; Liu, Z.; Yao, C. Classification of Vessel Motion Pattern in Inland Waterways Based on Automatic Identification System. Ocean Eng. 2017, 146, 486–497. [Google Scholar]
- Xu, H.; Oliveira, P.; Guedes Soares, C. L1 adaptive backstepping control for path-following of underactuated marine surface ships. Eur. J. Control 2020, 58, 357–372. [Google Scholar] [CrossRef]
- Zhou, Q.; Thai, V.V. Fuzzy and grey theories in failure mode and effect analysis for tanker equipment failure prediction. Saf. Sci. 2016, 83, 74–79. [Google Scholar] [CrossRef]
- Zhao, L.; Shi, G. A method for simplifying ship trajectory based on improved Douglas–Peucker algorithm. Ocean Eng. 2018, 166, 37–46. [Google Scholar] [CrossRef]
- Wei, Z.; Xie, X.; Zhang, X. AIS trajectory simplification algorithm considering ship behaviours. Ocean Eng. 2020, 216, 108086. [Google Scholar] [CrossRef]
- Zhao, L.; Shi, G. A trajectory clustering method based on Douglas-Peucker compression and density for marine traffic pattern recognition. Ocean Eng. 2019, 172, 456–467. [Google Scholar] [CrossRef]
- Zhang, R.; Xie, P.; Wang, C. Classifying transportation mode and speed from trajectory data via deep multi-scale learning. Comput. Netw. 2019, 162, 106861. [Google Scholar] [CrossRef]
- Chen, X.; Liu, Y.; Achuthan, K. A ship movement classification based on Automatic Identification System (AIS) data using Convolutional Neural Network. Ocean Eng. 2020, 218, 108182. [Google Scholar] [CrossRef]
- Guo, S.; Mou, J.; Chen, L.; Chen, P. An Anomaly Detection Method for AIS Trajectory Based on Kinematic Interpolation. J. Mar. Sci. Eng. 2021, 9, 609. [Google Scholar] [CrossRef]
- Liang, M.; Zhan, Y.; Liu, R.W. MVFFNet: Multi-View Feature Fusion Network for Imbalanced Ship Classification. Pattern Recognit. Lett. 2021, 151, 26–32. [Google Scholar] [CrossRef]
- Xiao, Z.; Fu, X.; Zhang, L. Traffic Pattern Mining and Forecasting Technologies in Maritime Traffic Service Networks: A Comprehensive Survey. IEEE Trans. Intell. Transp. Syst. 2020, 21, 1796–1825. [Google Scholar] [CrossRef]
- Huang, L.; Wen, Y.; Guo, W. Mobility pattern analysis of ship trajectories based on semantic transformation and topic model. Ocean Eng. 2020, 201, 107092. [Google Scholar] [CrossRef]
- He, K.; Zhang, X.; Ren, S.; Sun, J. Deep Residual Learning for Image Recognition. In Proceedings of the IEEE Conference on Computer Vision and Pattern Recognition, Las Vegas, NV, USA, 27–30 June 2016; pp. 770–778. [Google Scholar]
- Choi, S.H.; Jung, S.H. Stable Acquisition of Fine-Grained Segments Using Batch Normalization and Focal Loss with L1 Regularization in U-Net Structure. Int. J. Fuzzy Log. Intell. Syst. 2020, 20, 59–68. [Google Scholar] [CrossRef]
- Nieto, M.; Garau, B.; Balle, S.; Simarro, G.; Zarruk, G.; Ortiz, A.; Tintoré, J.; Álvarez, E.; Gómez-Pujol, L.; Orfila, A. An opensource, low cost video-based coastal monitoring system. Earth Surf. Process. Landf. 2010, 35, 1712–1719. [Google Scholar] [CrossRef]
- Casella, E.; Rovere, A.; Pedroncini, A.; Stark, C.; Casella, M.; Ferrari, M.; Firpo, M. Drones as tools for monitoring beach topography changes in the Ligurian Sea (NW Mediterranean). Geo-Mar. Lett. 2016, 36, 151–163. [Google Scholar] [CrossRef]
- Luijendijk, A.; Hagenaars, G.; Ranasinghe, R.; Baart, F.; Donchyts, G.; Aarninkhof, S. The State of the World’s Beaches. Sci. Rep. 2018, 8, 6641. [Google Scholar] [CrossRef] [PubMed]
- Vos, K.; Splinter, K.; Harley, M.; Simmons, J.; Turner, I. CoastSat: A Google Earth Engine-enabled Python toolkit to extract horelines from publicly available satellite imagery. Environ. Model. Softw. 2019, 122, 104528. [Google Scholar] [CrossRef]
- Rutten, J.; Ruessink, B.G.; Price, T.D. Observations on sandbar behaviour along a man-made curved coast. Earth Surf. Process. Landf. 2018, 43, 134–149. [Google Scholar] [CrossRef] [Green Version]
- De Swart, R.; Ribas, F.; Simarro, G.; Guillen, J.; Calvete, D. The role of bathymetry and directional wave conditions on observed crescentic bar dynamics. In Earth Surface Processes and Landforms; Wiley Online Library: Hoboken, NJ, USA, 2021. [Google Scholar]
- Blossier, B.; Bryan, K.R.; Daly, C.J.; Winter, C. Nearshore sandbar rotation at single-barred embayed beaches. J. Geophys. Res. Ocean. 2016, 121, 2286–2313. [Google Scholar] [CrossRef] [Green Version]
- Anderson, D.; Bak, A.S.; Brodie, K.L.; Cohn, N.; Holman, R.A.; Stanley, J. Quantifying Optically Derived Two-Dimensional Wave-Averaged Currents in the Surf Zone. Remote Sens. 2021, 13, 690. [Google Scholar] [CrossRef]
- Bouvier, C.; Balouin, Y.; Castelle, B.; Holman, R. Modelling camera viewing angle deviation to improve nearshore video monitoring. Coast. Eng. 2019, 147, 99–106. [Google Scholar] [CrossRef]
- Rodriguez-Padilla, I.; Castelle, B.; Marieu, V.; Morichon, D. A Simple and Efficient Image Stabilization Method for Coastal Monitoring Video Systems. Remote Sens. 2019, 12, 70. [Google Scholar] [CrossRef] [Green Version]
- Simarro, G.; Calvete, D.; Souto, P. UCalib: Cameras Autocalibration on Coastal Video Monitoring Systems. Remote Sens. 2021, 13, 2795. [Google Scholar] [CrossRef]
- Medellín, G.; Torres-Freyermuth, A. Morphodynamics along a micro-tidal sea breeze dominated beach in the vicinity of coastal structures. Mar. Geol. 2019, 417, 106013. [Google Scholar] [CrossRef]
- Franklin, G.; Medellín, G.; Appendini, C.; Gómez, J.; Torres-Freyermuth, A.; López-González, J.; Ruíz-Salcines, P. Impact of port development on the northern Yucatan Peninsula coastline. Reg. Stud. Mar. Sci. 2021, 45, 101835. [Google Scholar] [CrossRef]
- Kurczyn, J.; Appendini, C.; Beier, E.; Sosa-López, A.; López-González, J.; Posada-Venegas, G. Oceanic and atmospheric impact of Central American Cold Surges (Nortes) in the Gulf of Mexico. Int. J. Climatol. 2020, 41, 1450–1468. [Google Scholar] [CrossRef]
- Briggs, T.; Figlus, J.; Torres-Freyermuth, A.; Puleo, J.; Warren, W.; Alrushaid, T. Variability in onshore sediment transport on a natural beach during a central American cold surge event. J. Coast. Res. 2020, 36, 487–497. [Google Scholar] [CrossRef]
- Toscano, D.; Murena, F. Atmospheric ship emissions in ports: A review. Correlation with data of ship traffic. Atmos. Environ. X 2019, 4, 100050. [Google Scholar] [CrossRef]
- Iris, Ç.; Lam, J.S.L. A review of energy efficiency in ports: Operational strategies, technologies and energy management systems. Renew. Sustain. Energy Rev. 2019, 112, 170–182. [Google Scholar] [CrossRef]
- Nunes, R.A.O.; Alvim-Ferraz, M.C.M.; Martins, F.G.; Sousa, S.I.V. The activity-based methodology to assess ship emissions—A review. Environ. Pollut. 2017, 231, 87–103. [Google Scholar] [CrossRef]
- Manisalidis, I.; Stavropoulou, E.; Stavropoulos, A.; Bezirtzoglou, E. Environmental and health impacts of air pollution: A Review. Front. Public Health 2020, 8, 14. [Google Scholar] [CrossRef] [PubMed] [Green Version]
- Venturini, G.; Iris, Ç.; Kontovas, C.A.; Larsen, A. The multi-port berth allocation problem with speed optimization and emission considerations. Transp. Res. Part D Transp. Environ. 2017, 54, 142–159. [Google Scholar] [CrossRef] [Green Version]
- Lee, H.; Park, D.; Choo, S.; Pham, H.T. Estimation of the Non-Greenhouse Gas Emissions Inventory from Ships in the Port of Incheon. Sustainability 2020, 12, 8231. [Google Scholar] [CrossRef]
- Zhang, J.; Wan, C.; He, A.; Zhang, D.; Soares, C.G. A two-stage black-spot identification model for inland waterway transportation. Reliab. Eng. Syst. Saf. 2021, 213, 107677. [Google Scholar] [CrossRef]
- Wan, C.; Yan, X.; Zhang, D.; Qu, Z.; Yang, Z. An advanced fuzzy Bayesian-based FMEA approach for assessing maritime supply chain risks. Transp. Res. Part E Logist. Transp. Rev. 2019, 125, 222–240. [Google Scholar] [CrossRef]
Publisher’s Note: MDPI stays neutral with regard to jurisdictional claims in published maps and institutional affiliations. |
© 2022 by the authors. Licensee MDPI, Basel, Switzerland. This article is an open access article distributed under the terms and conditions of the Creative Commons Attribution (CC BY) license (https://creativecommons.org/licenses/by/4.0/).

