
Integrated Dynamics Response Analysis for IEA 10-MW Spar Floating Offshore Wind Turbine


 and
and
Abstract
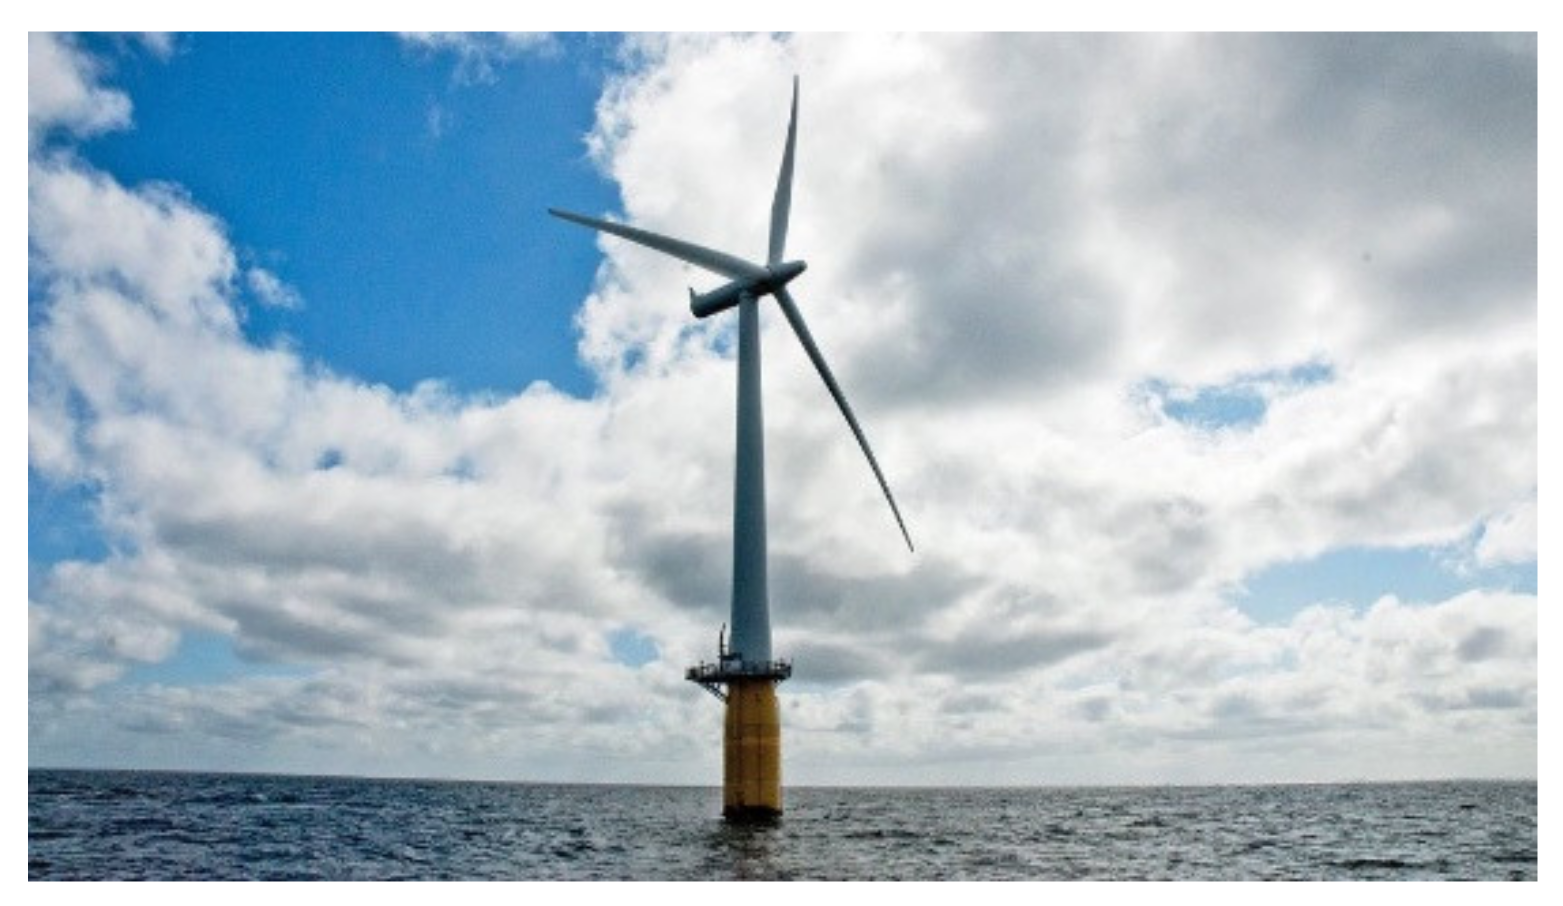
:1. Introduction
2. Specification of IEA 10-MW and Spar Platform
2.1. Design Parameters of the IEA 10-MW
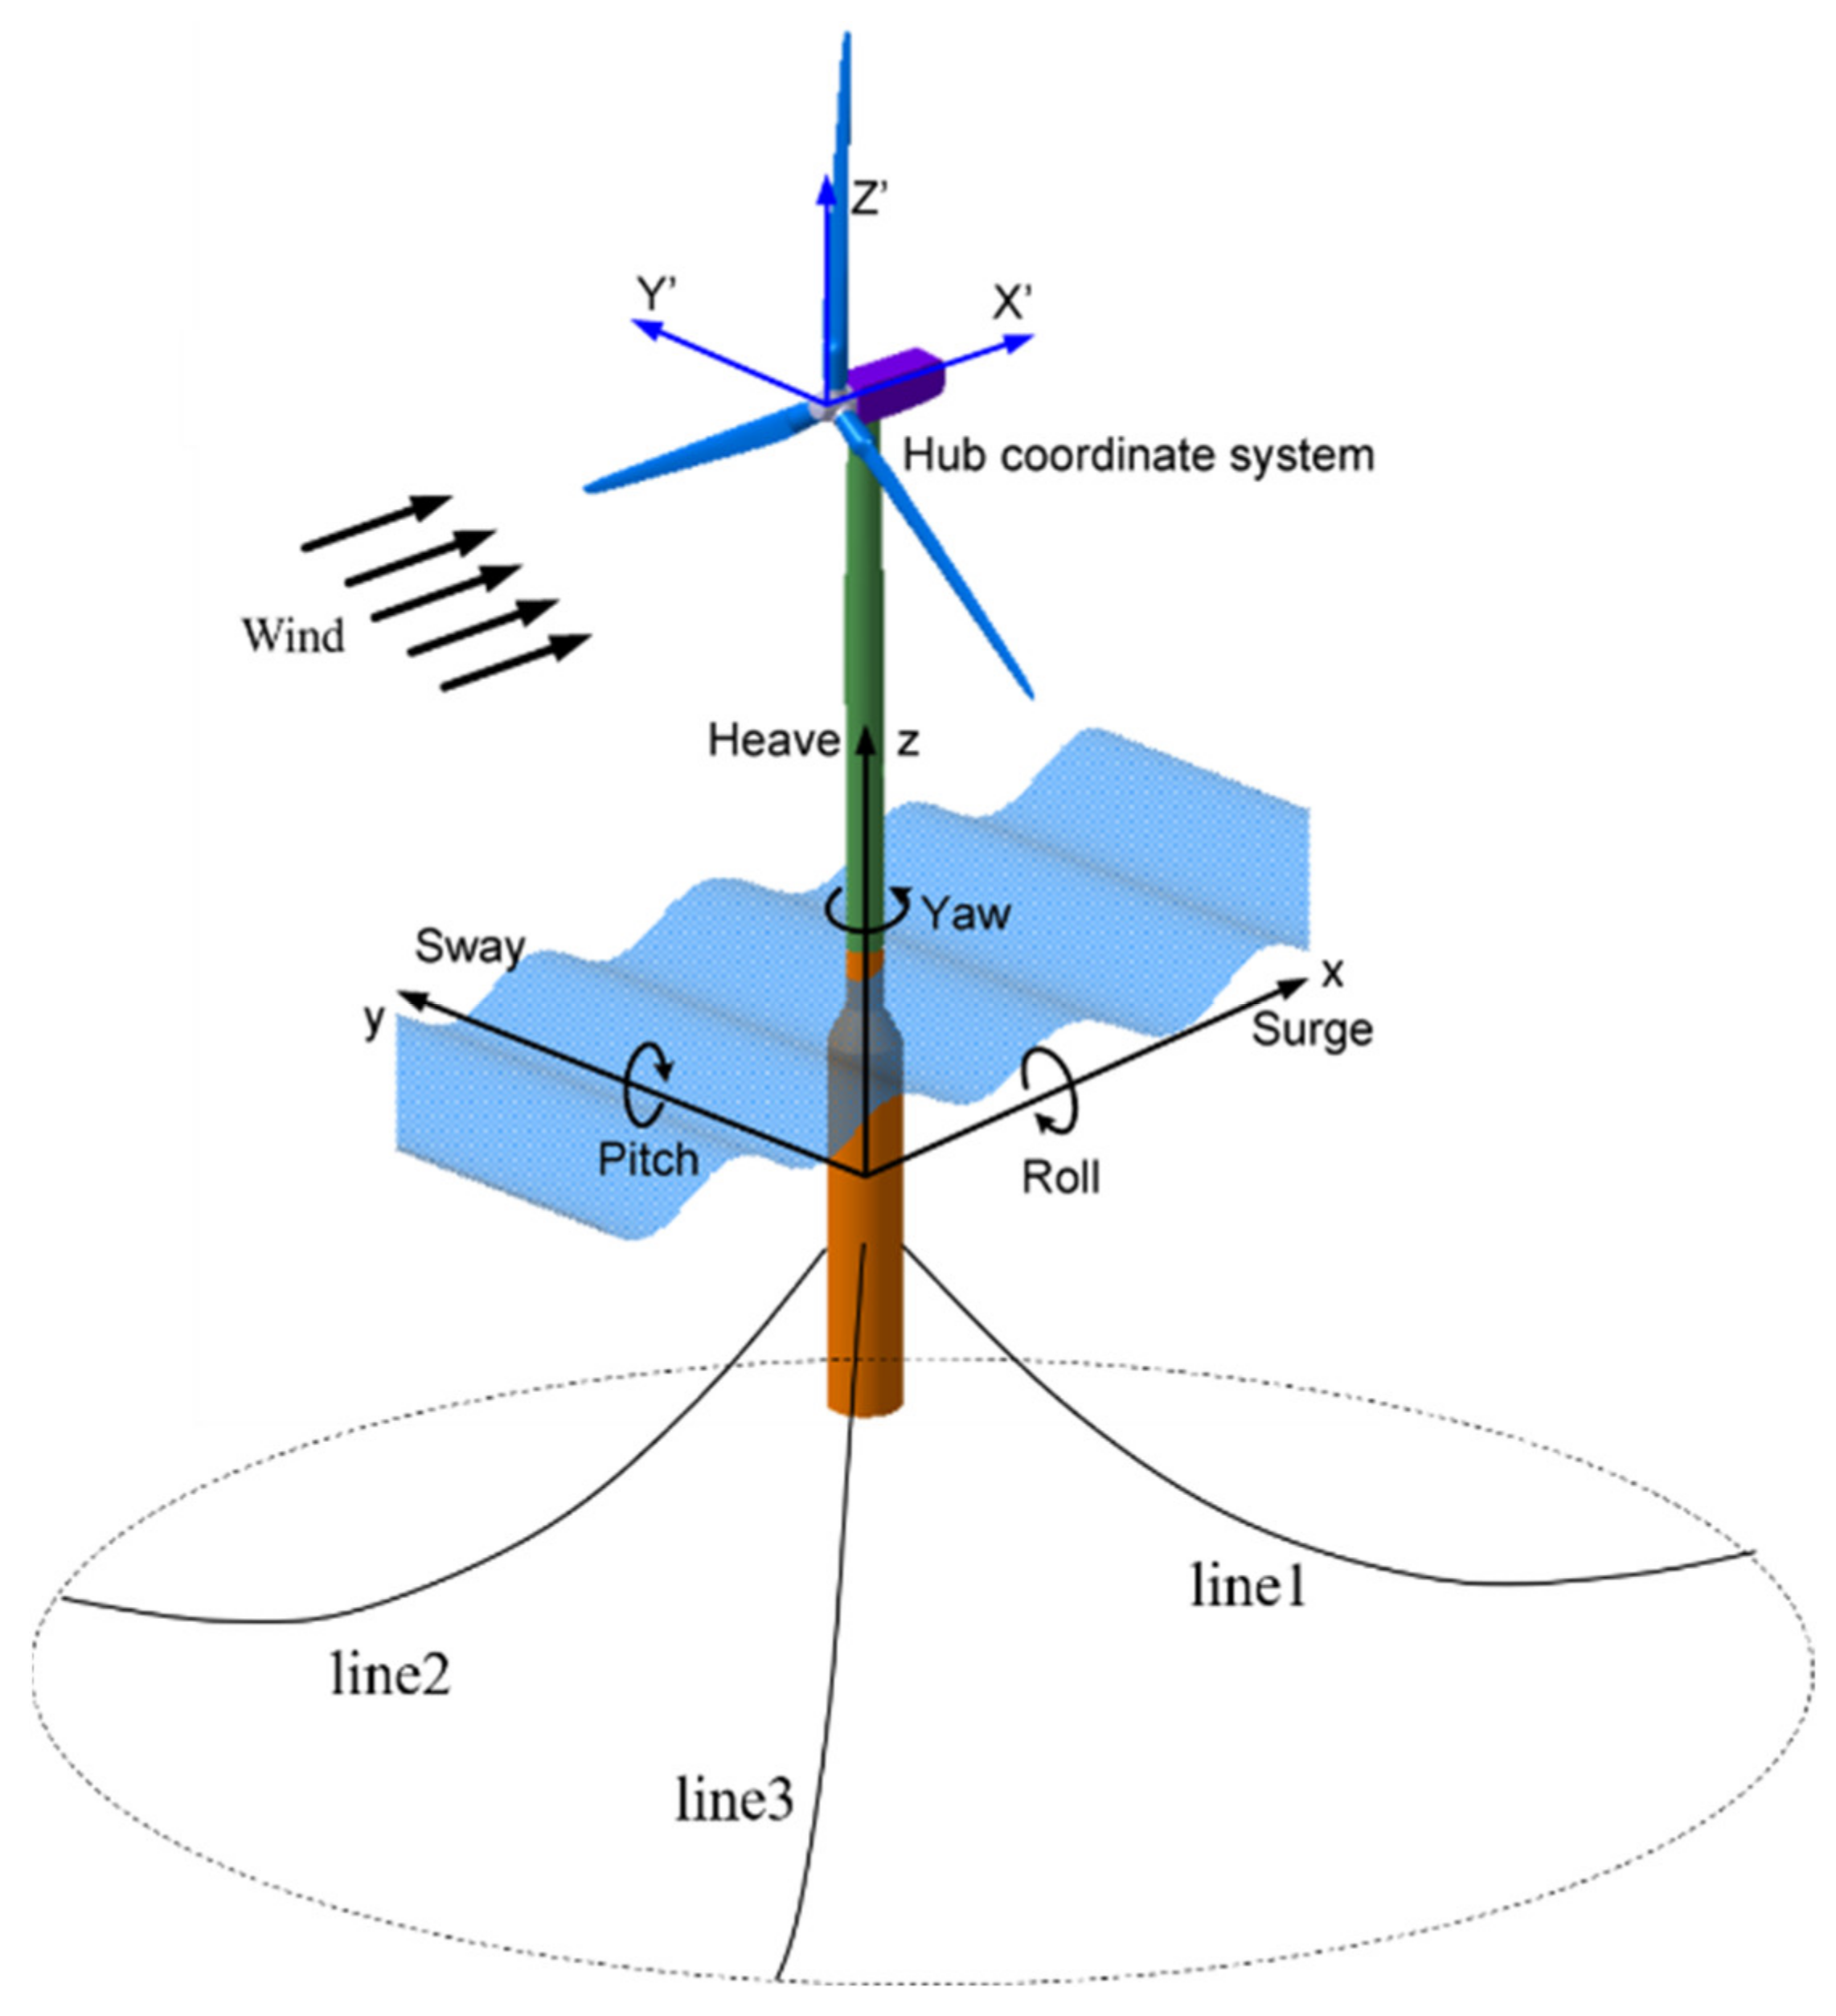
2.2. Parameters of the Spar Platform and Mooring System
3. Model Validation
3.1. Modeling in FAST
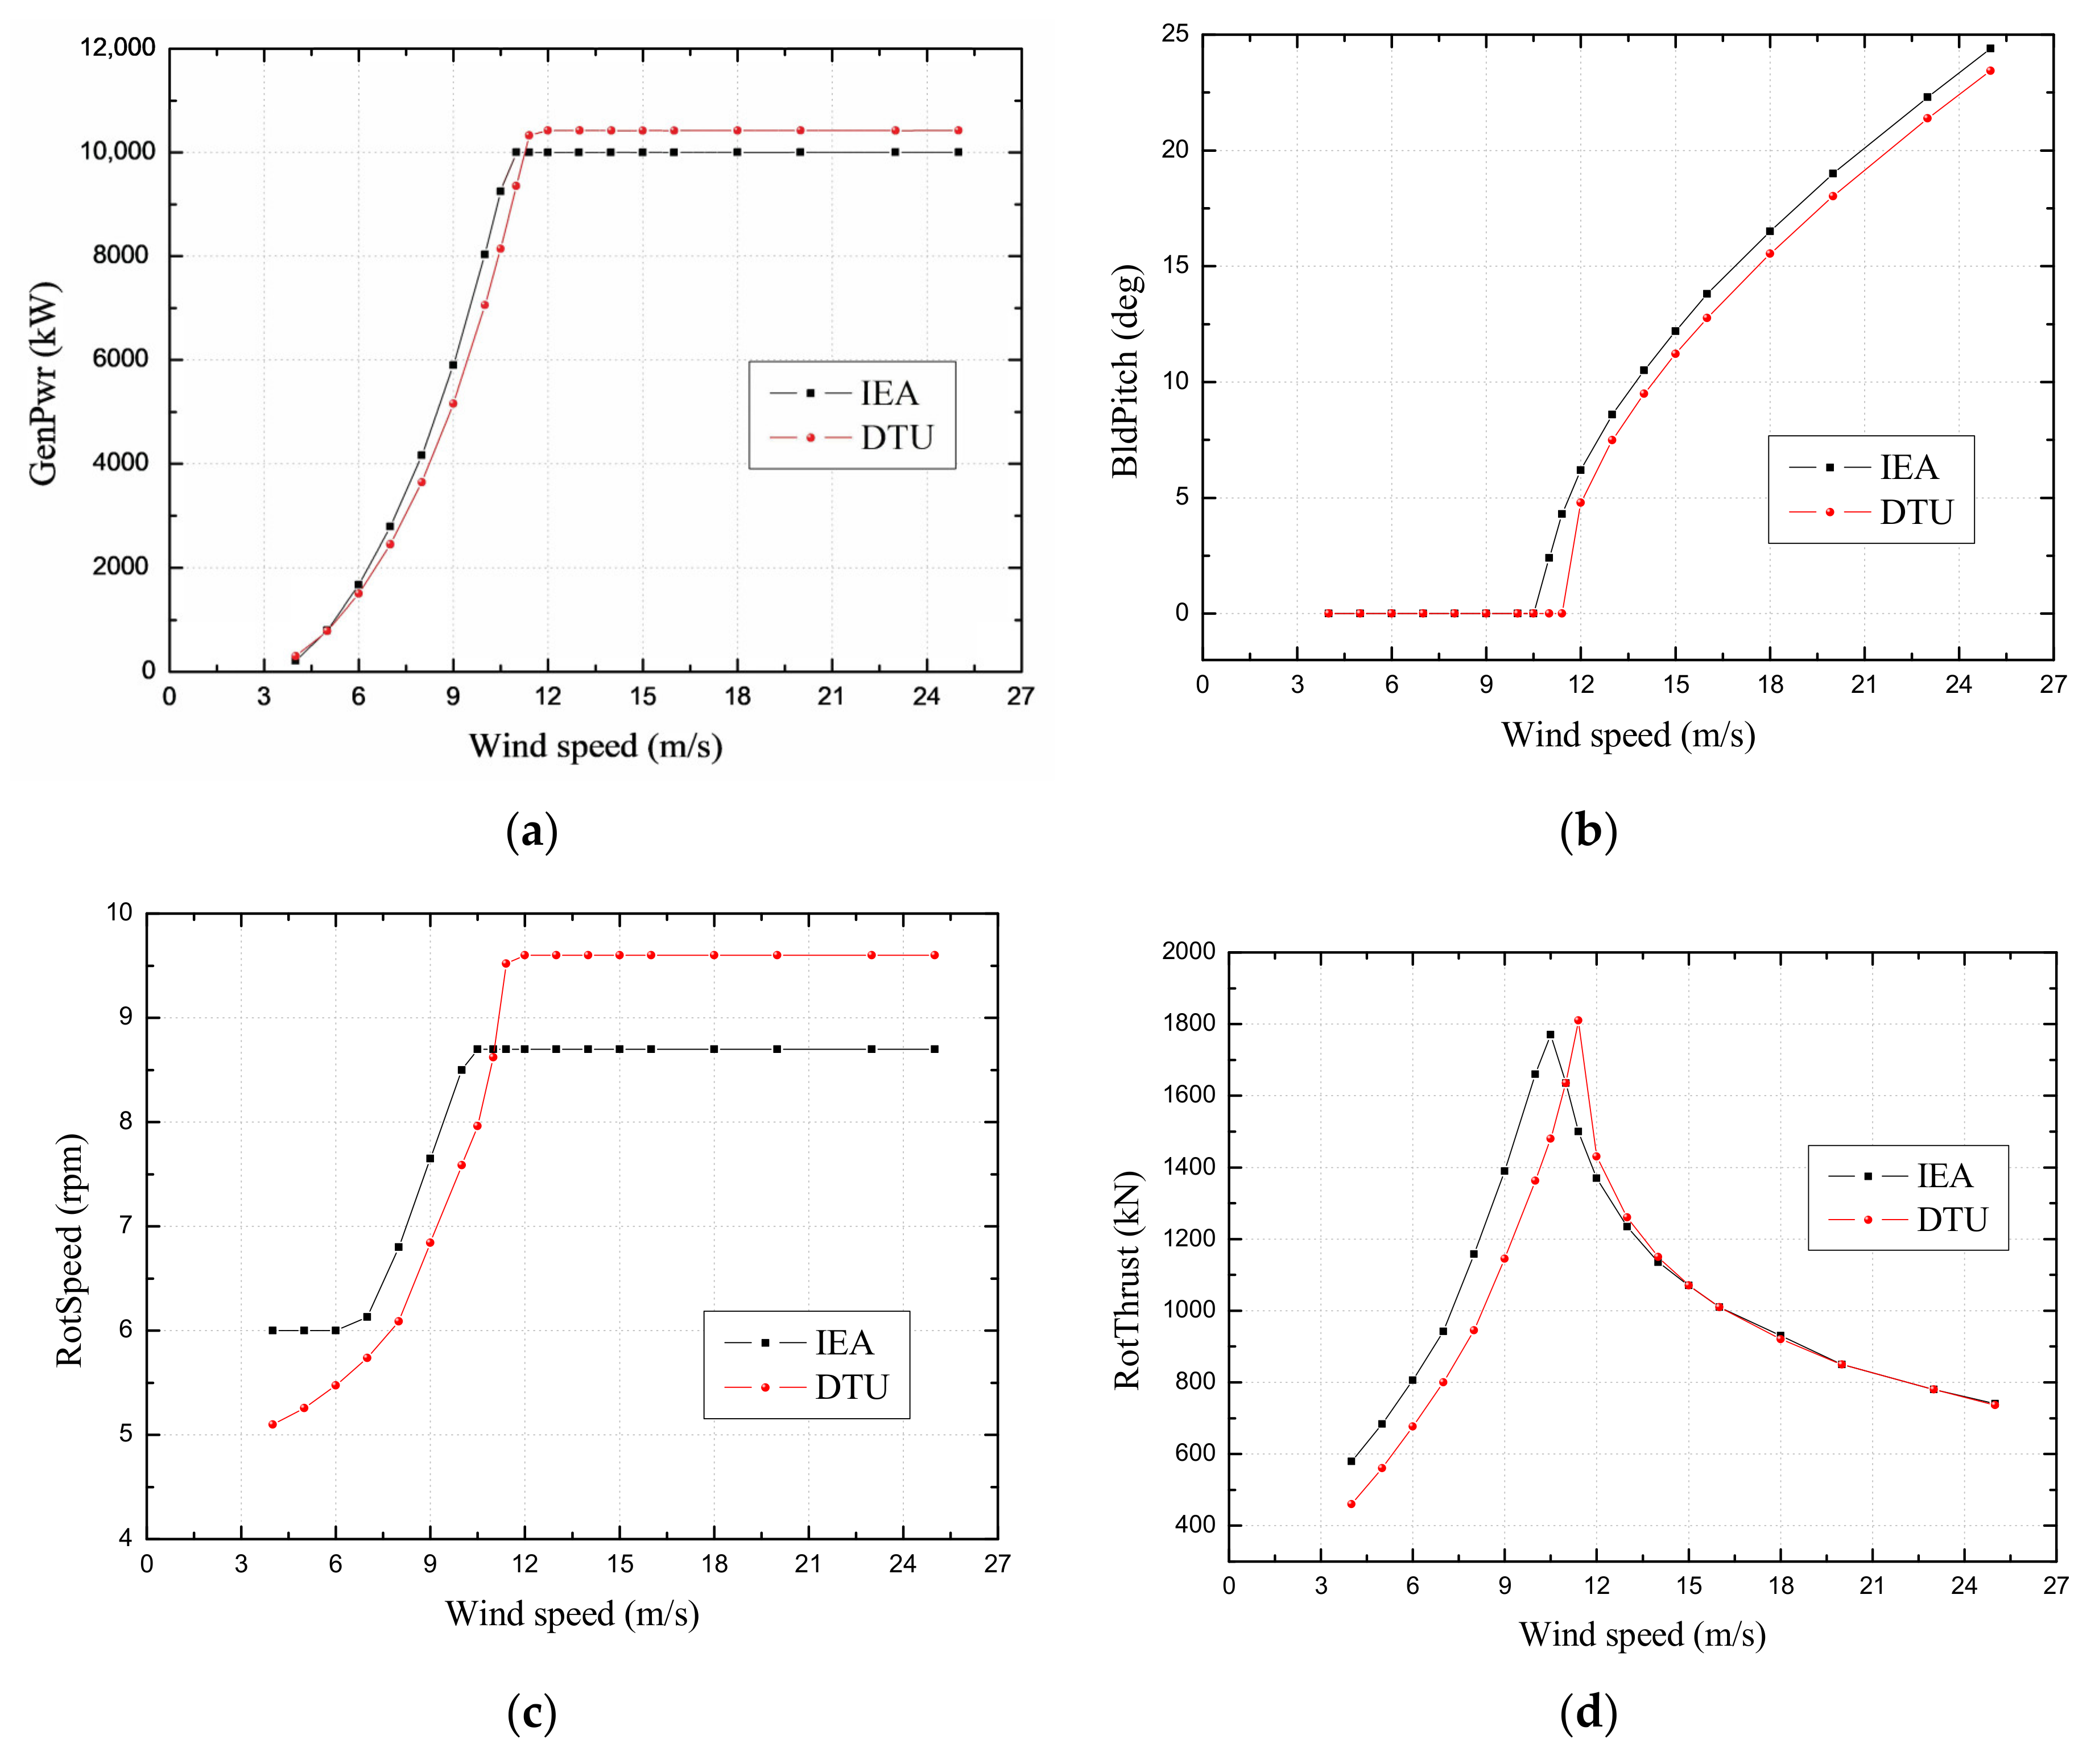
3.2. The Operational Indicators of Turbine
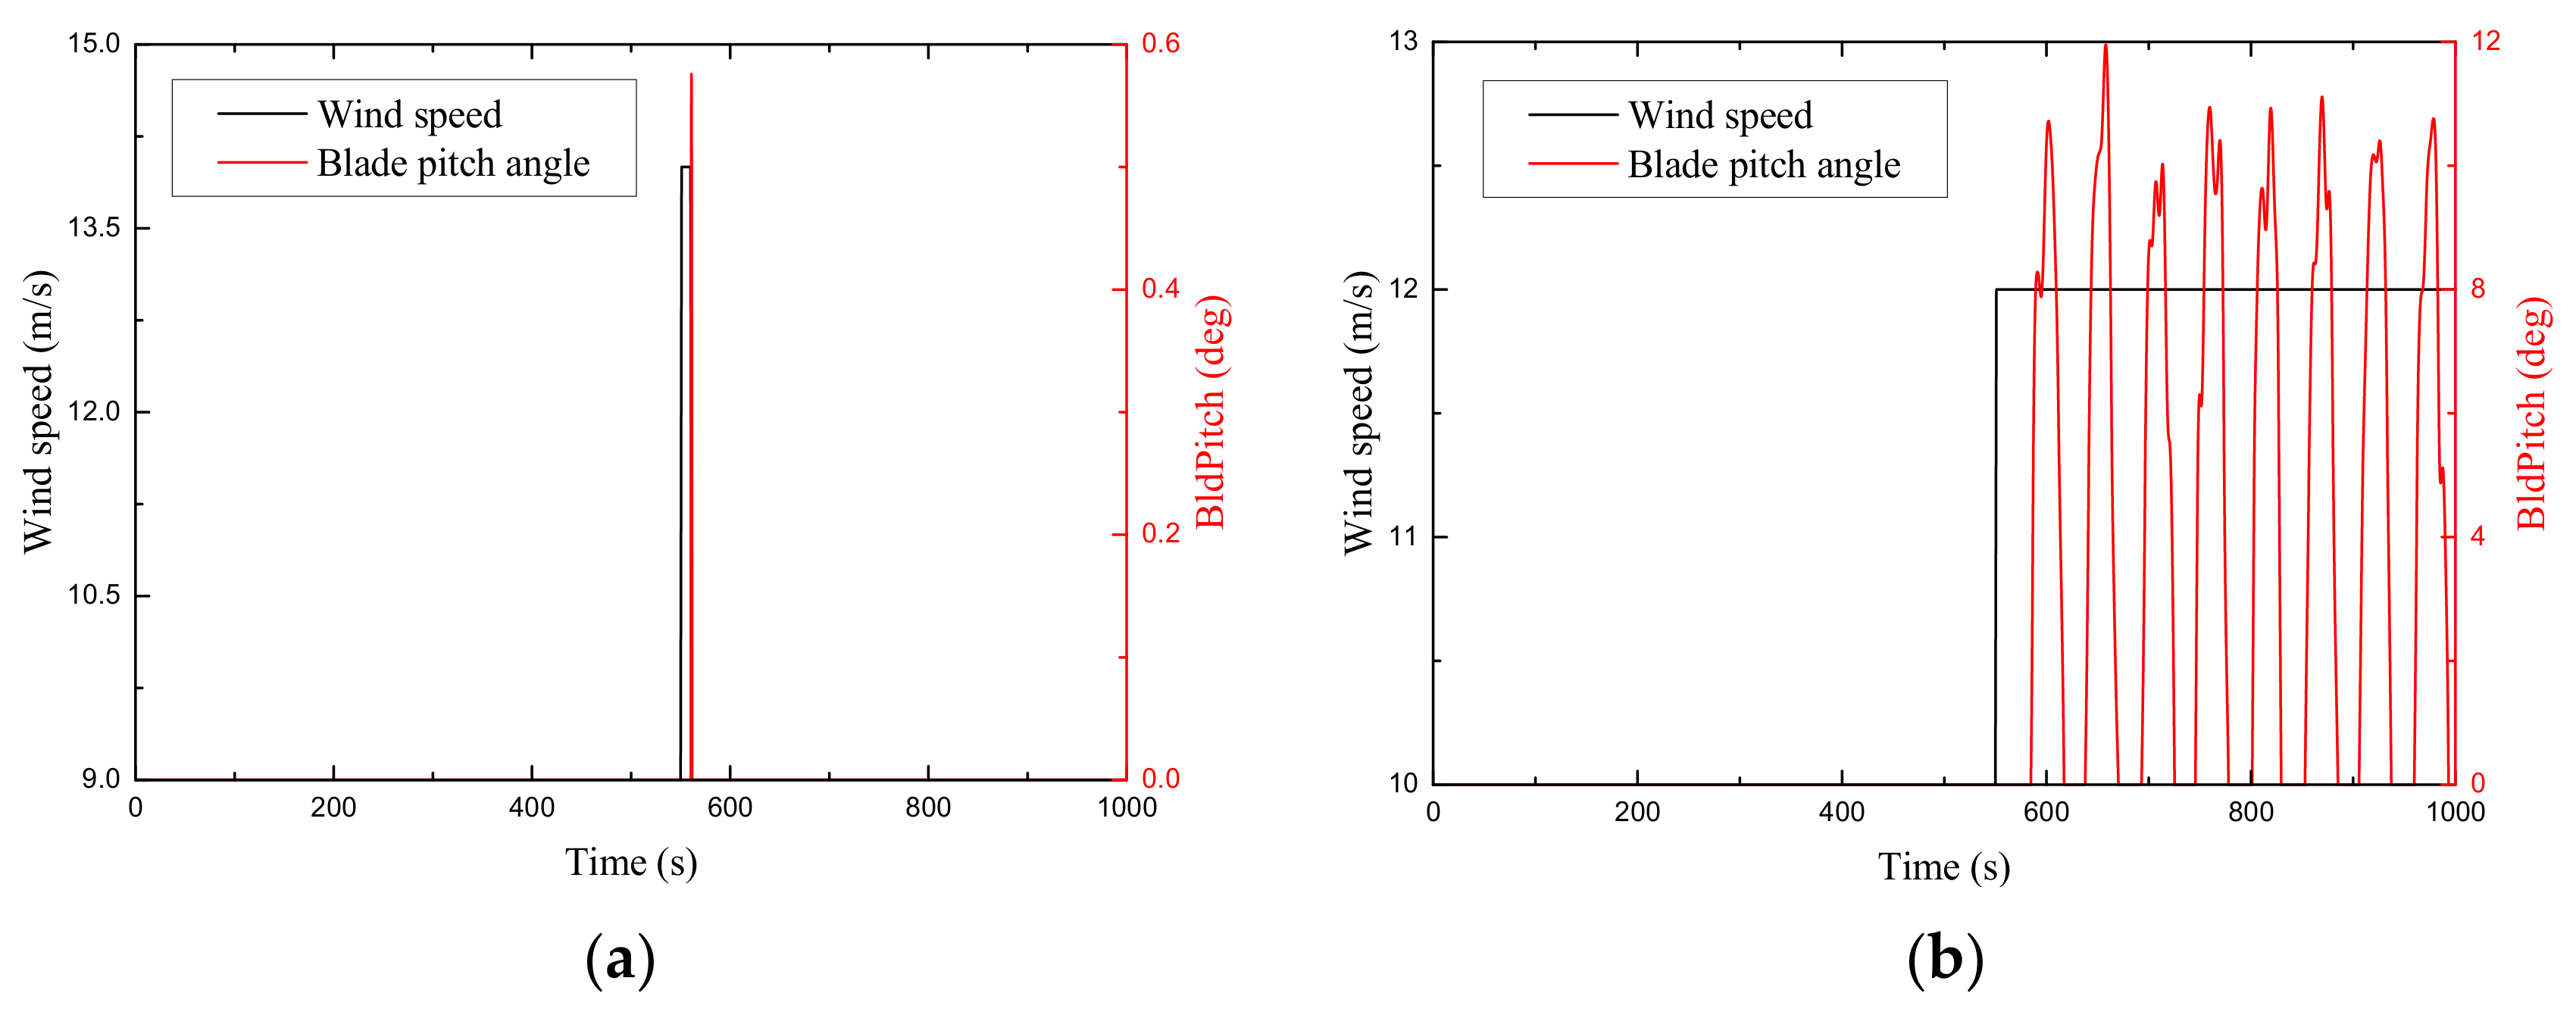
3.3. Controller Sensitivity
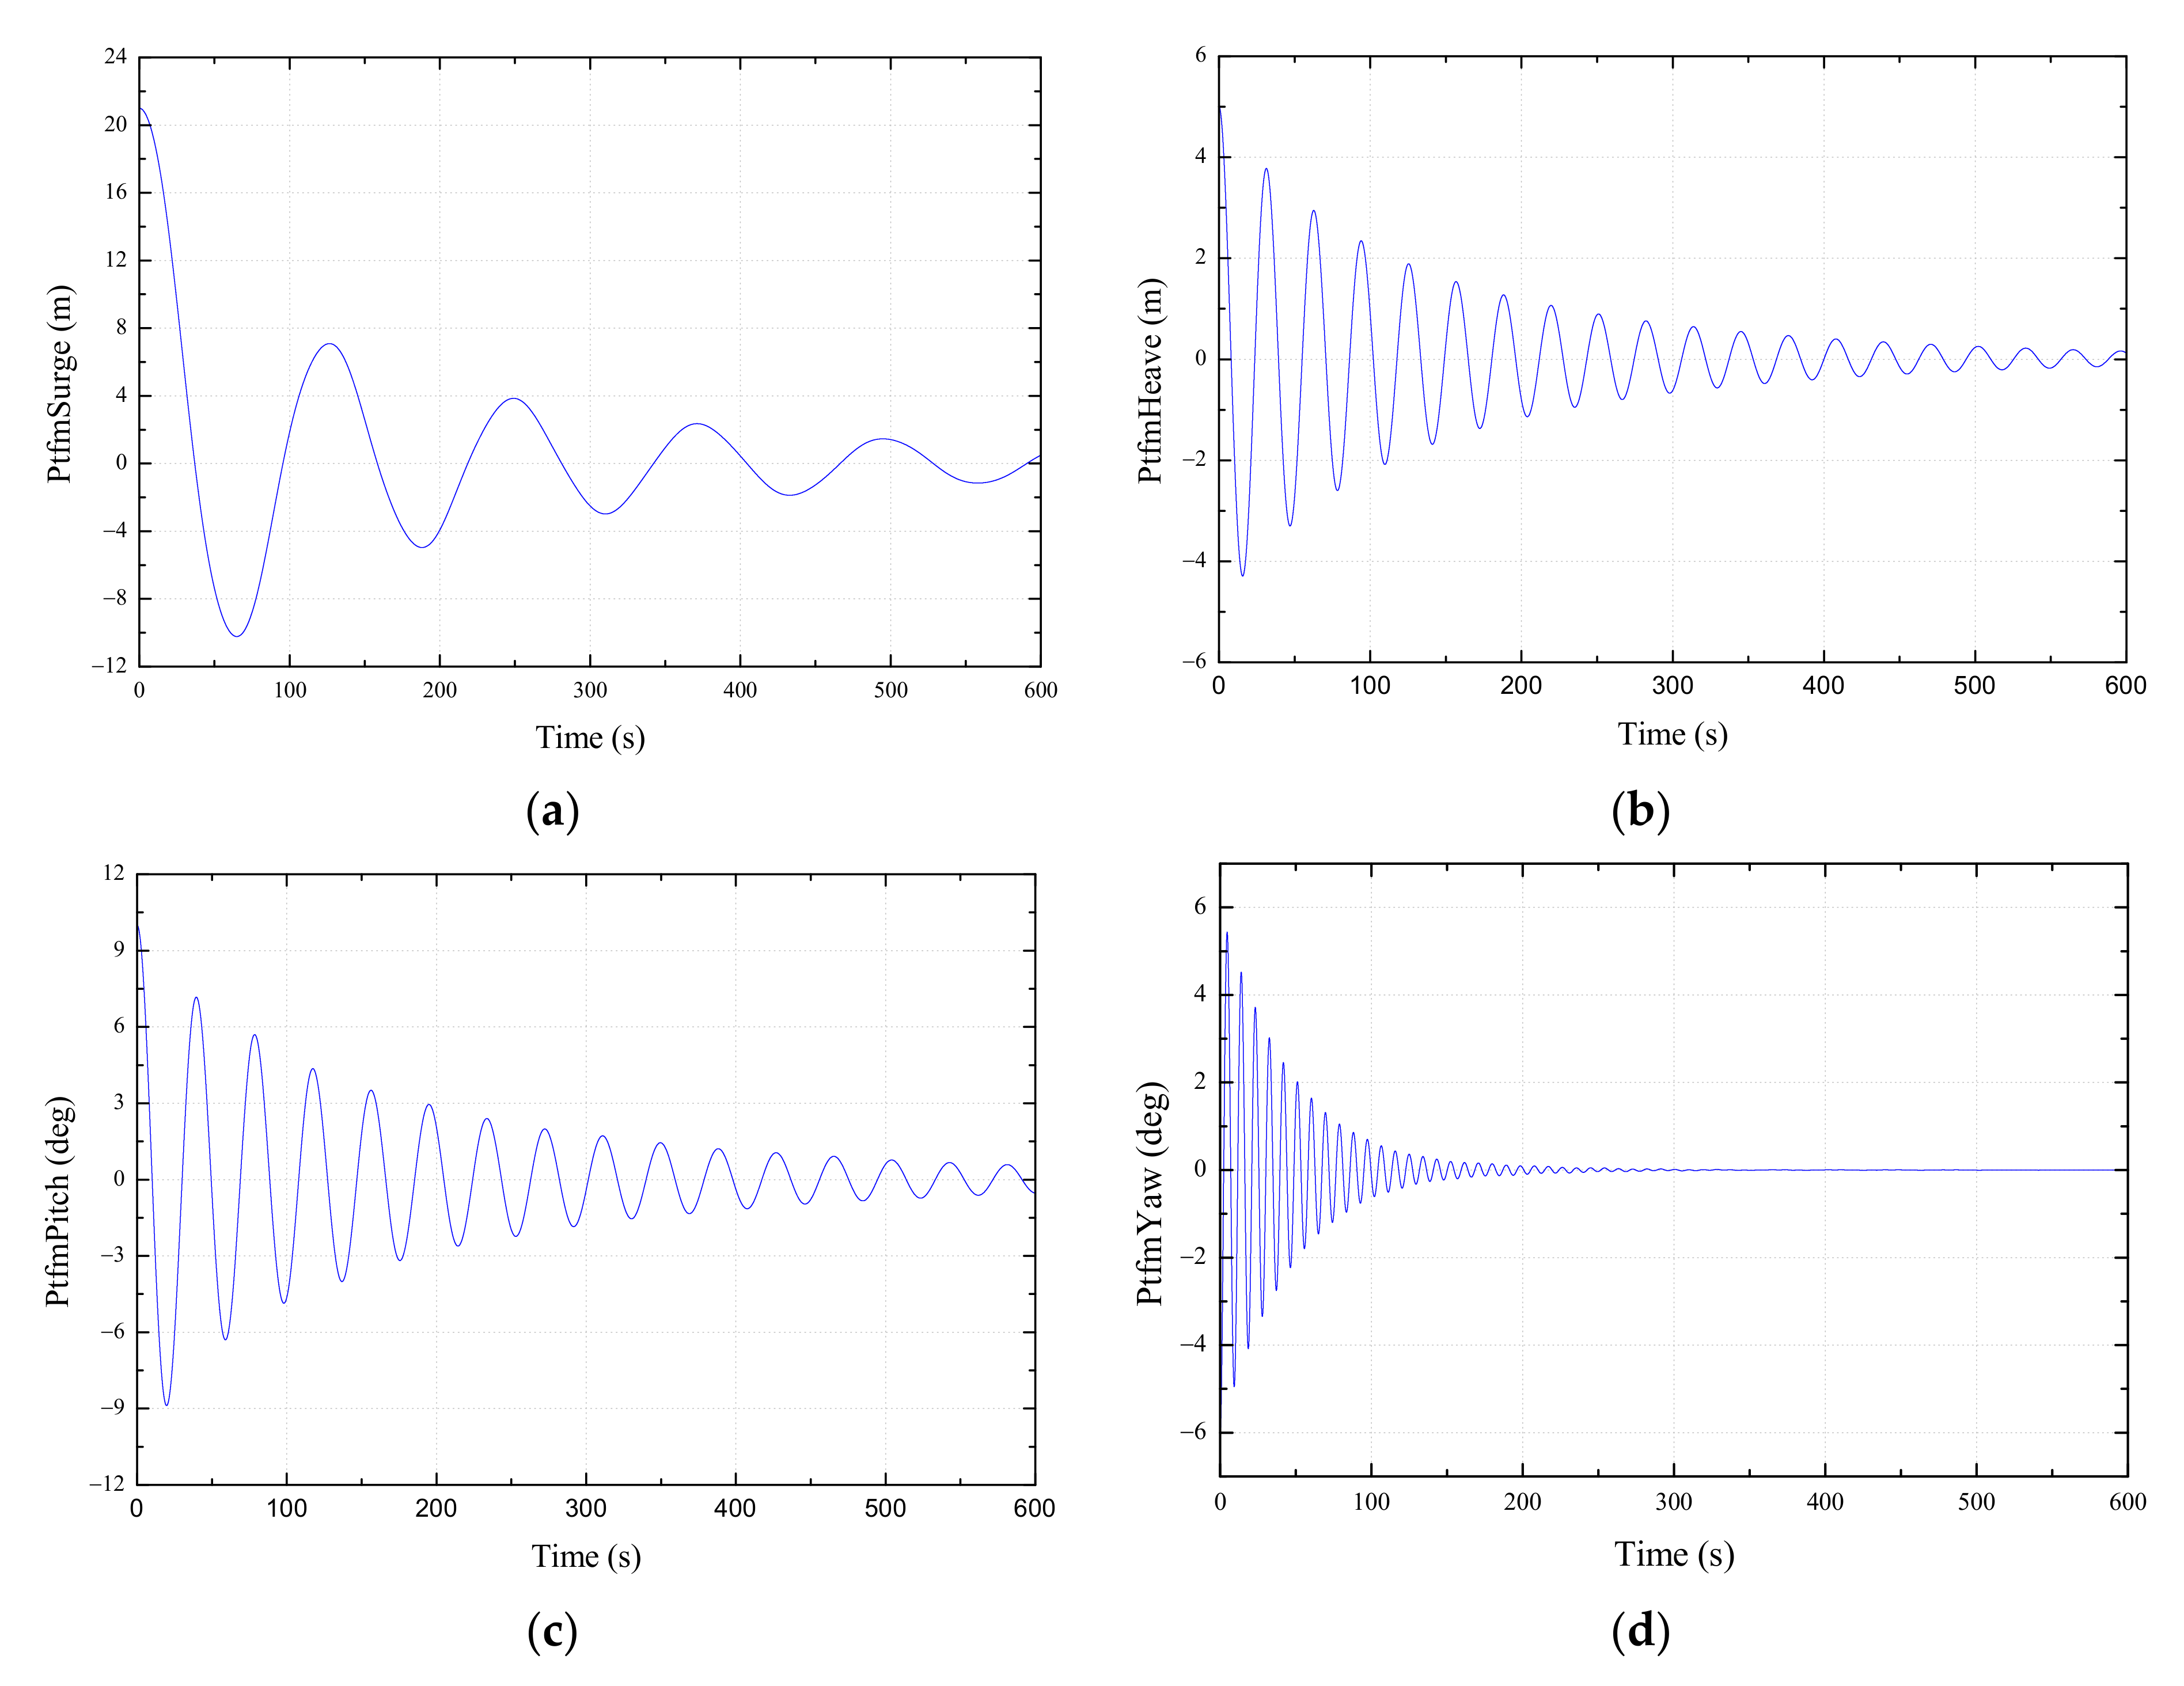
3.4. Natural Periods
4. Results and Discussions
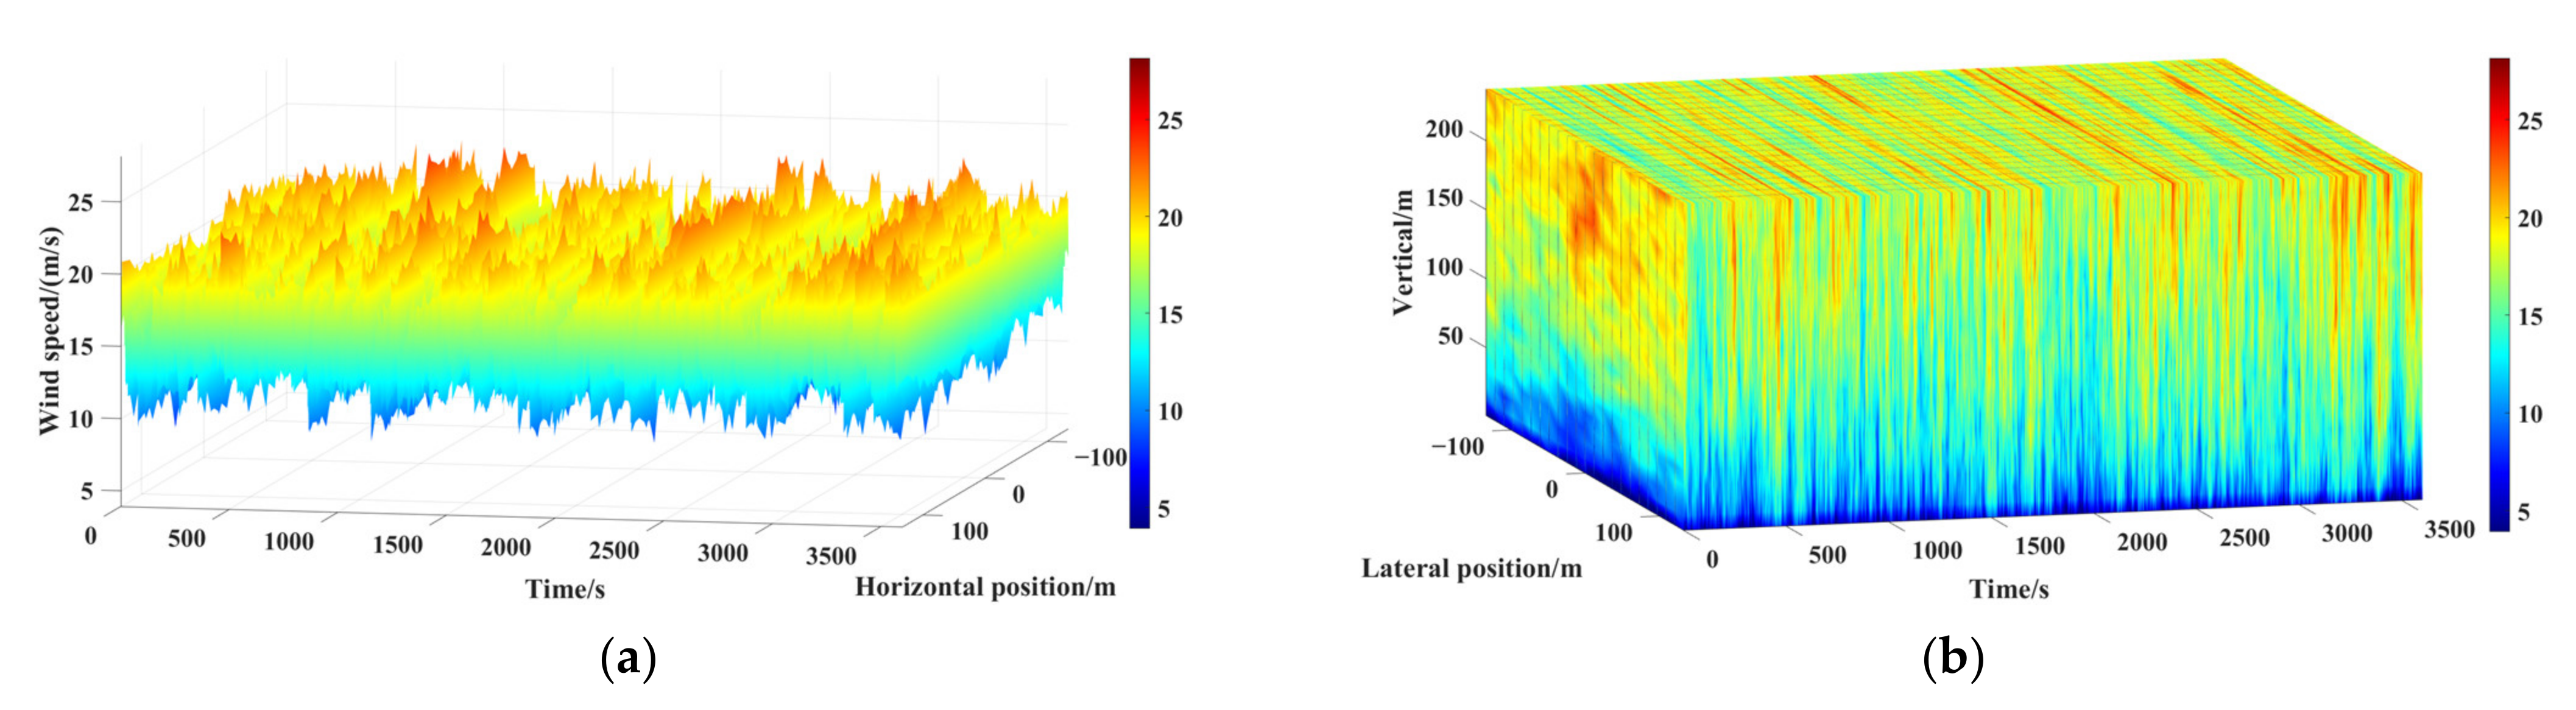
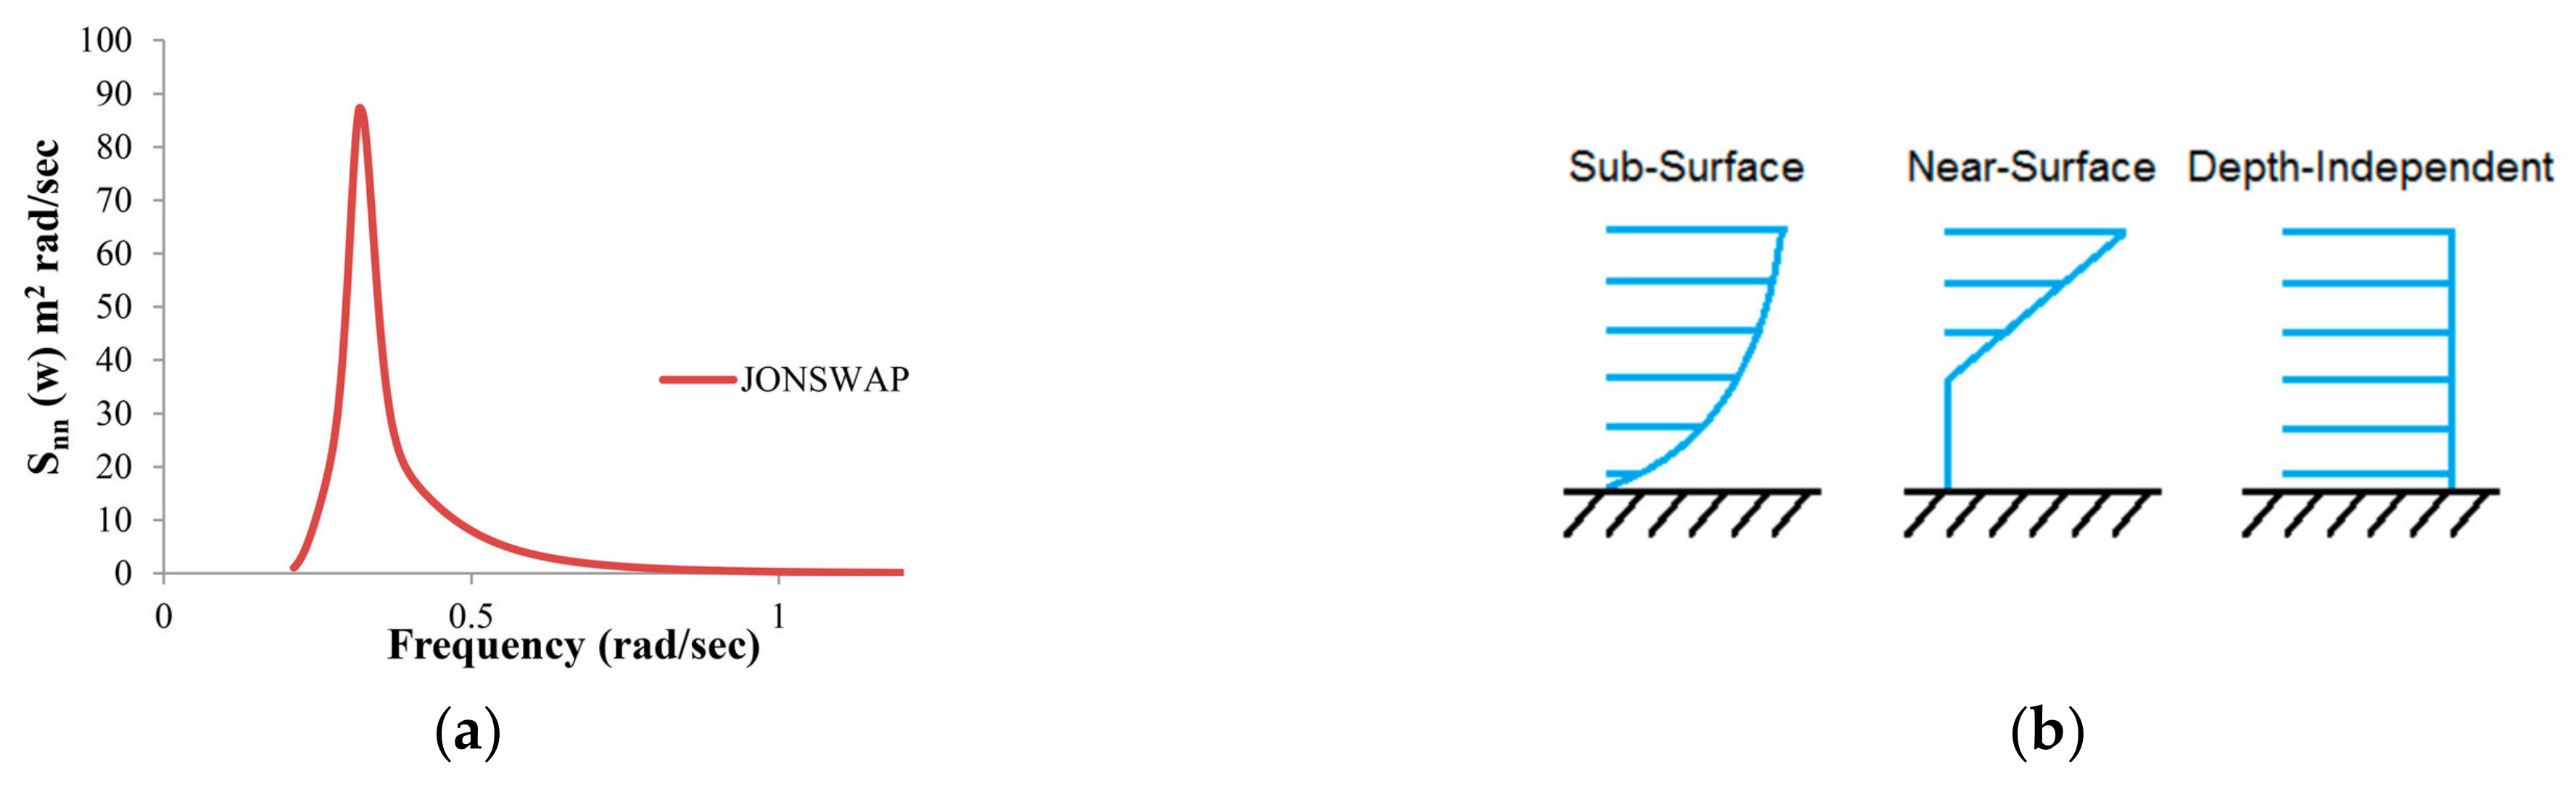
4.1. Environmental Parameters
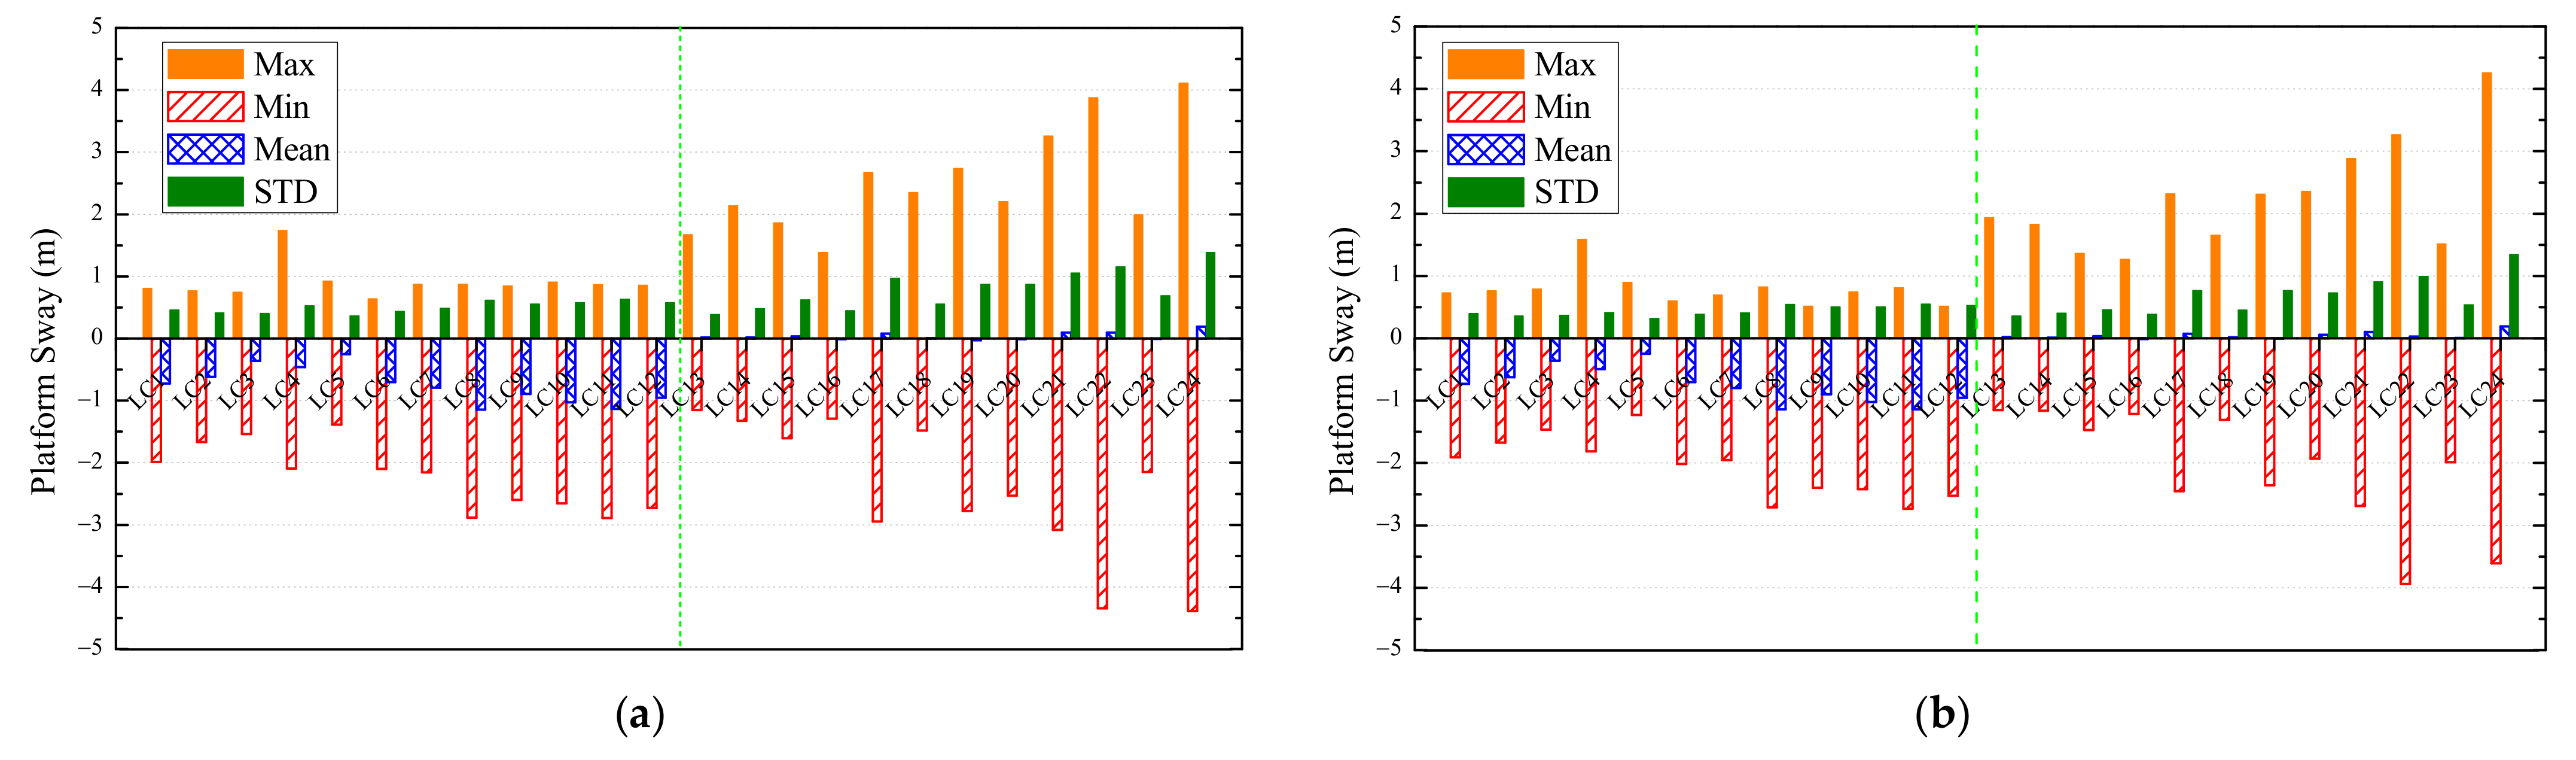
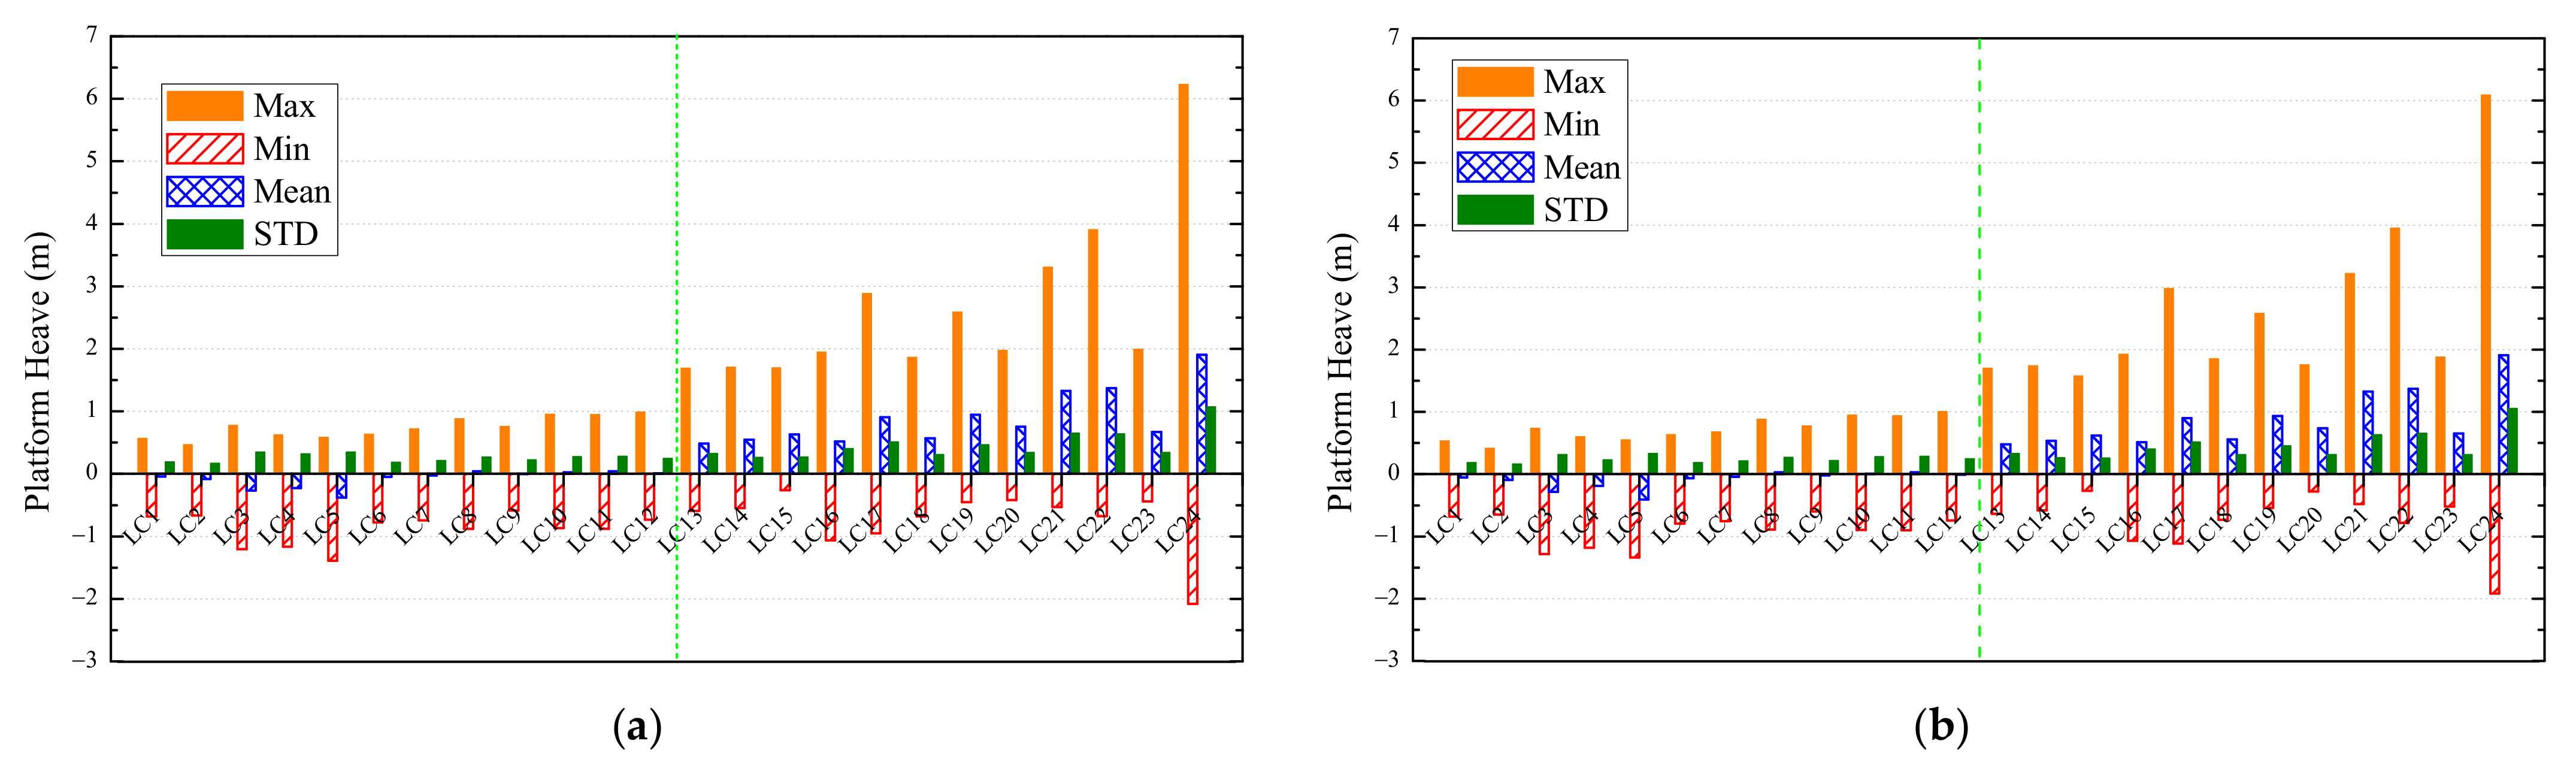
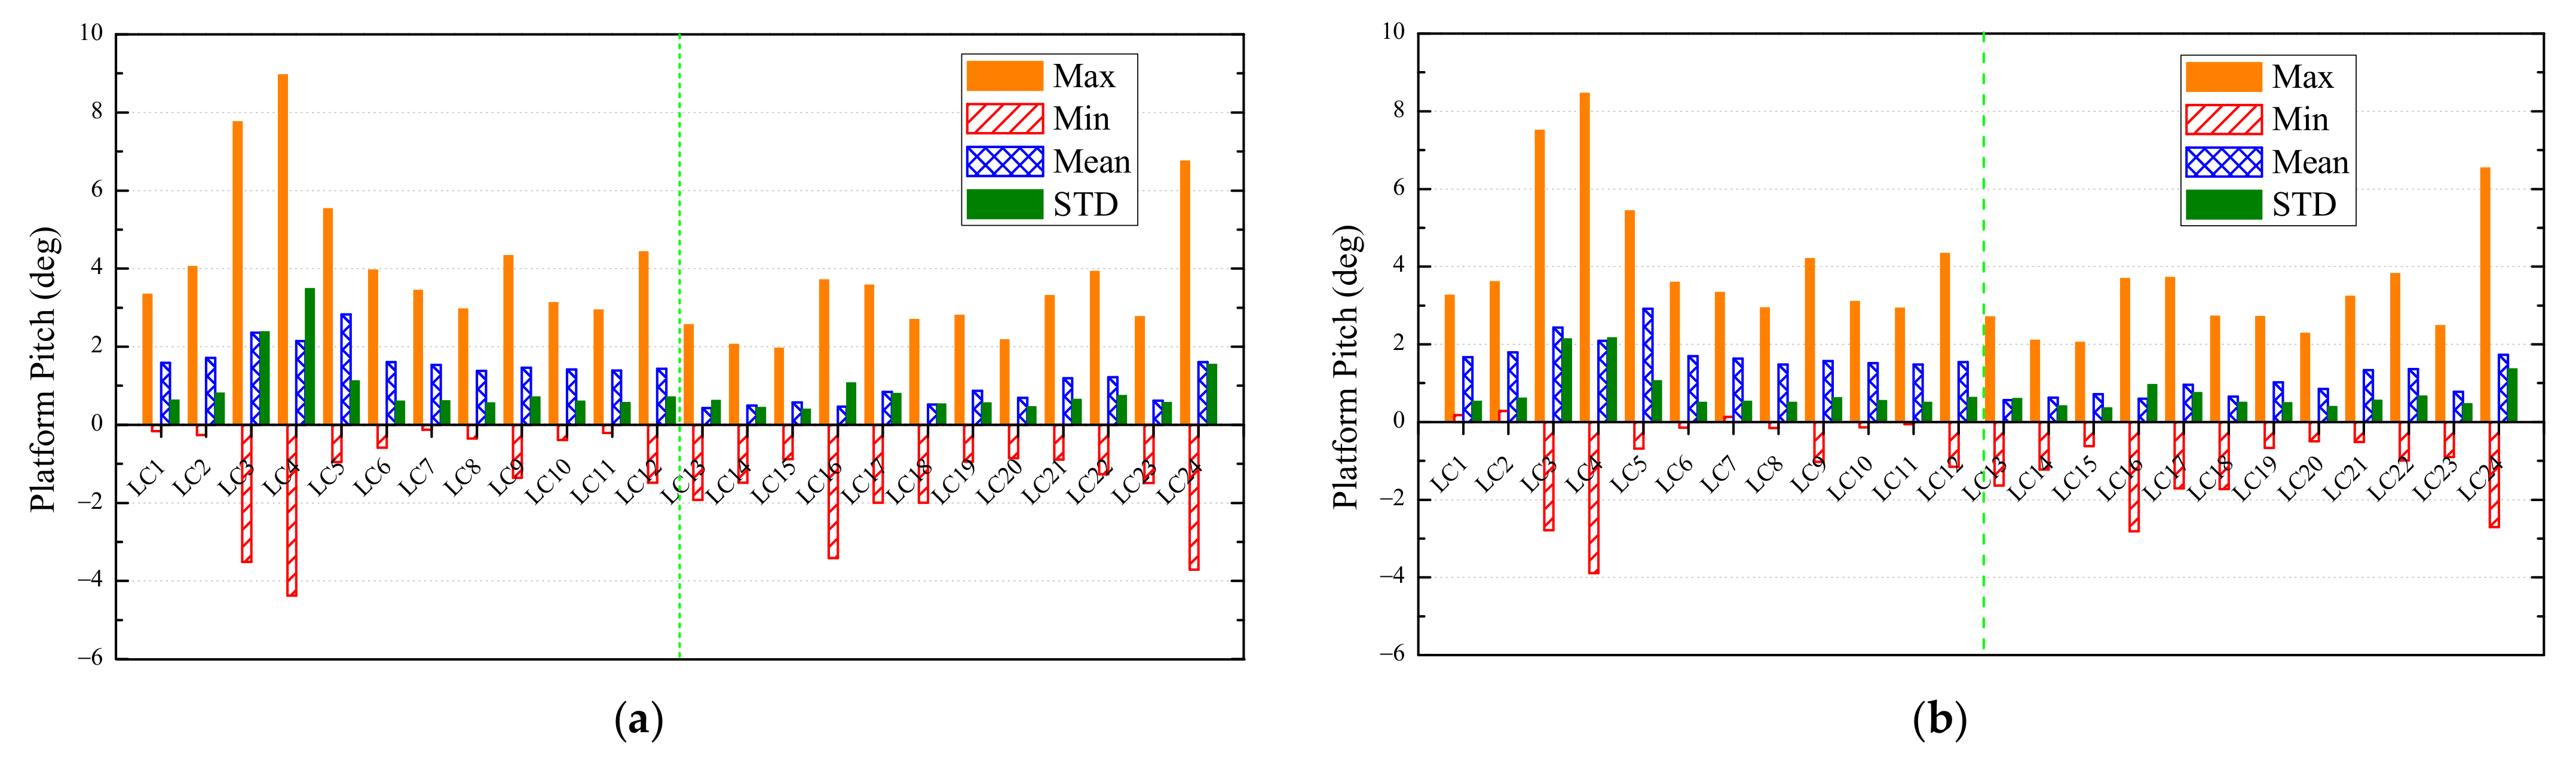
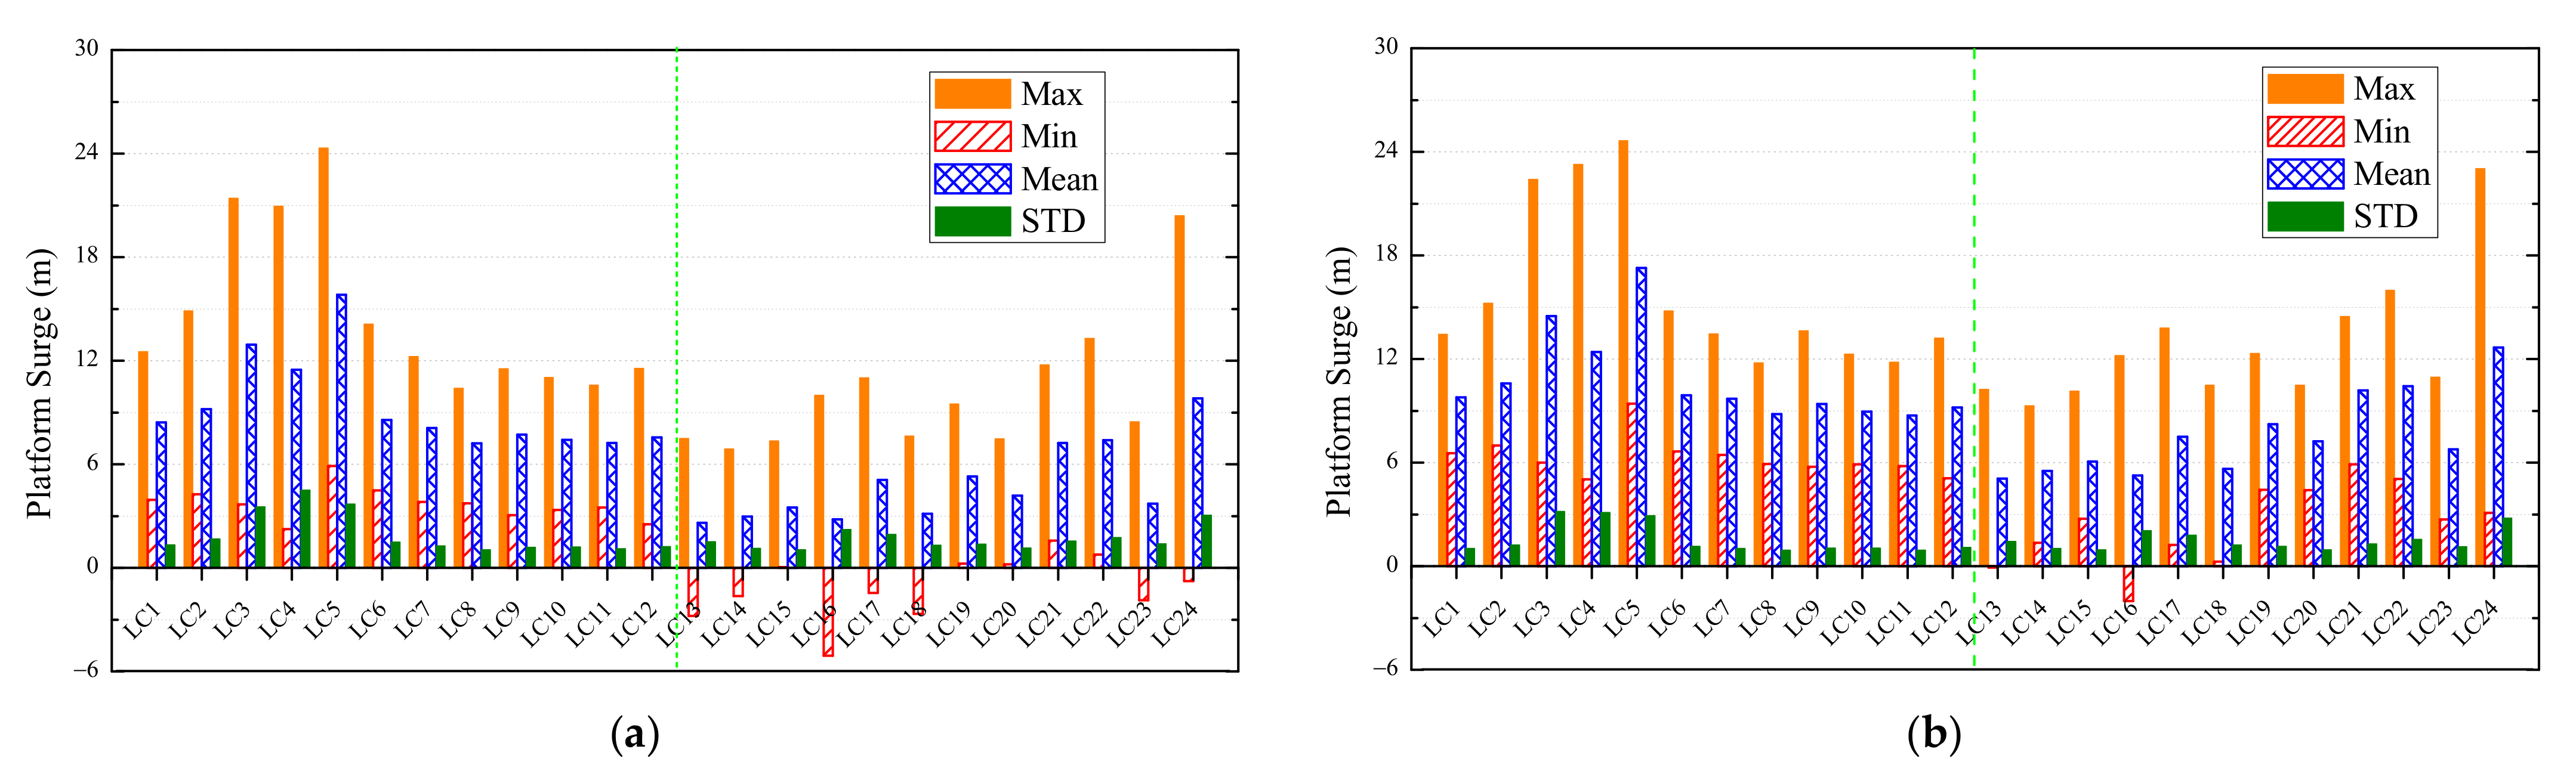
4.2. Platform Motions Response
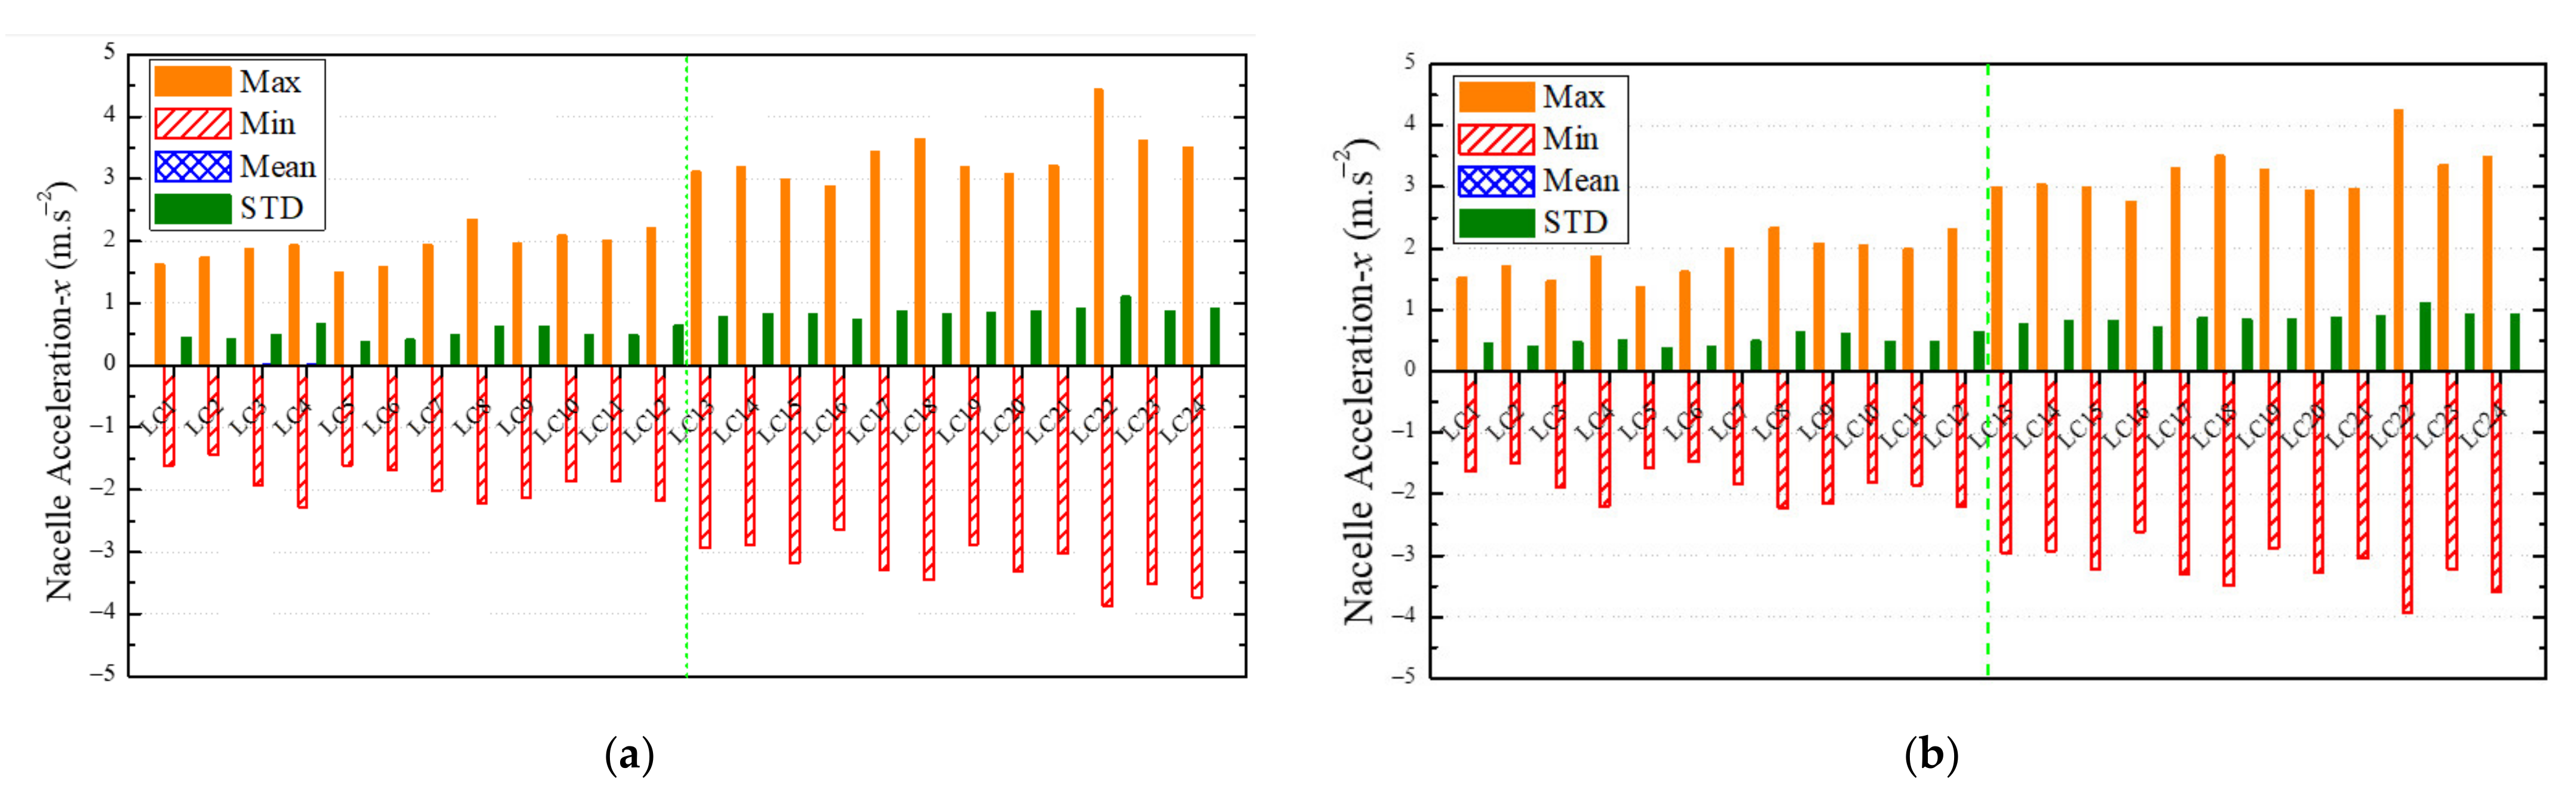
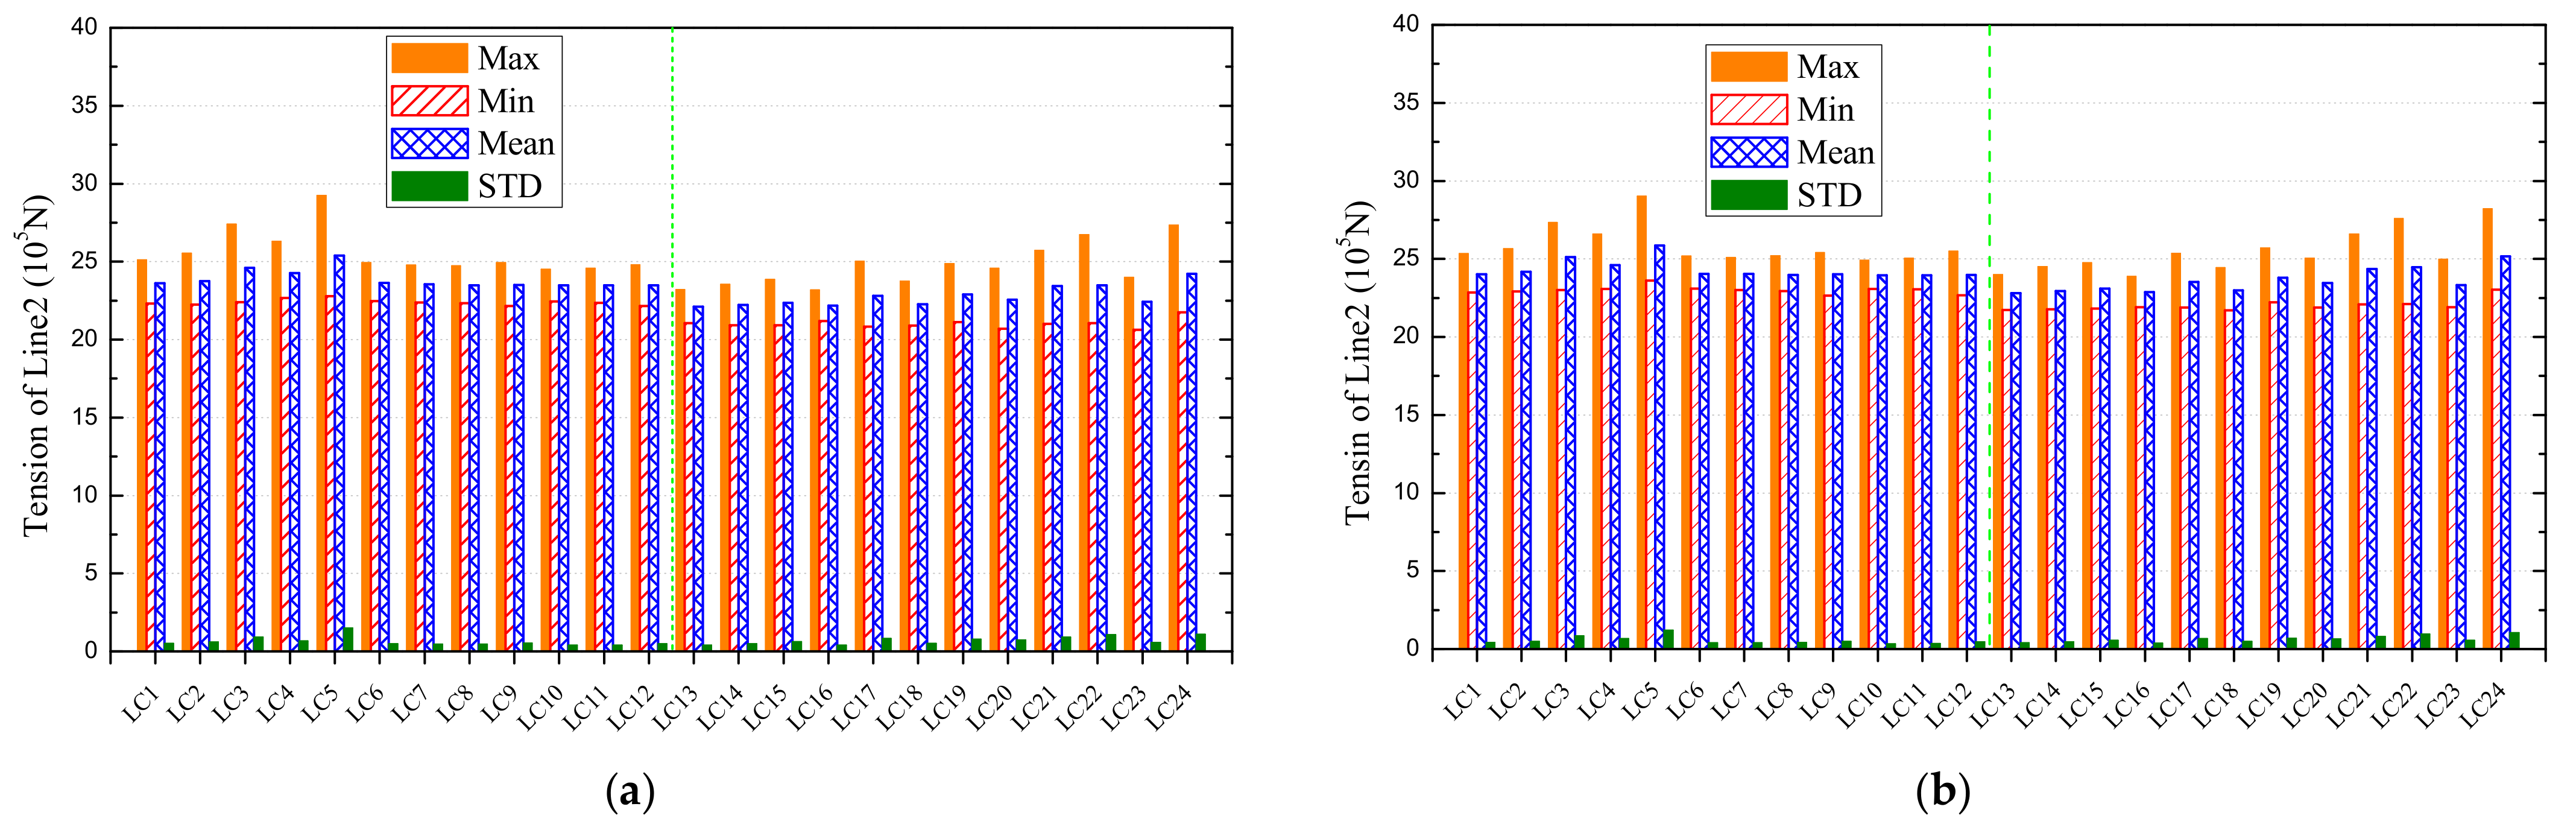
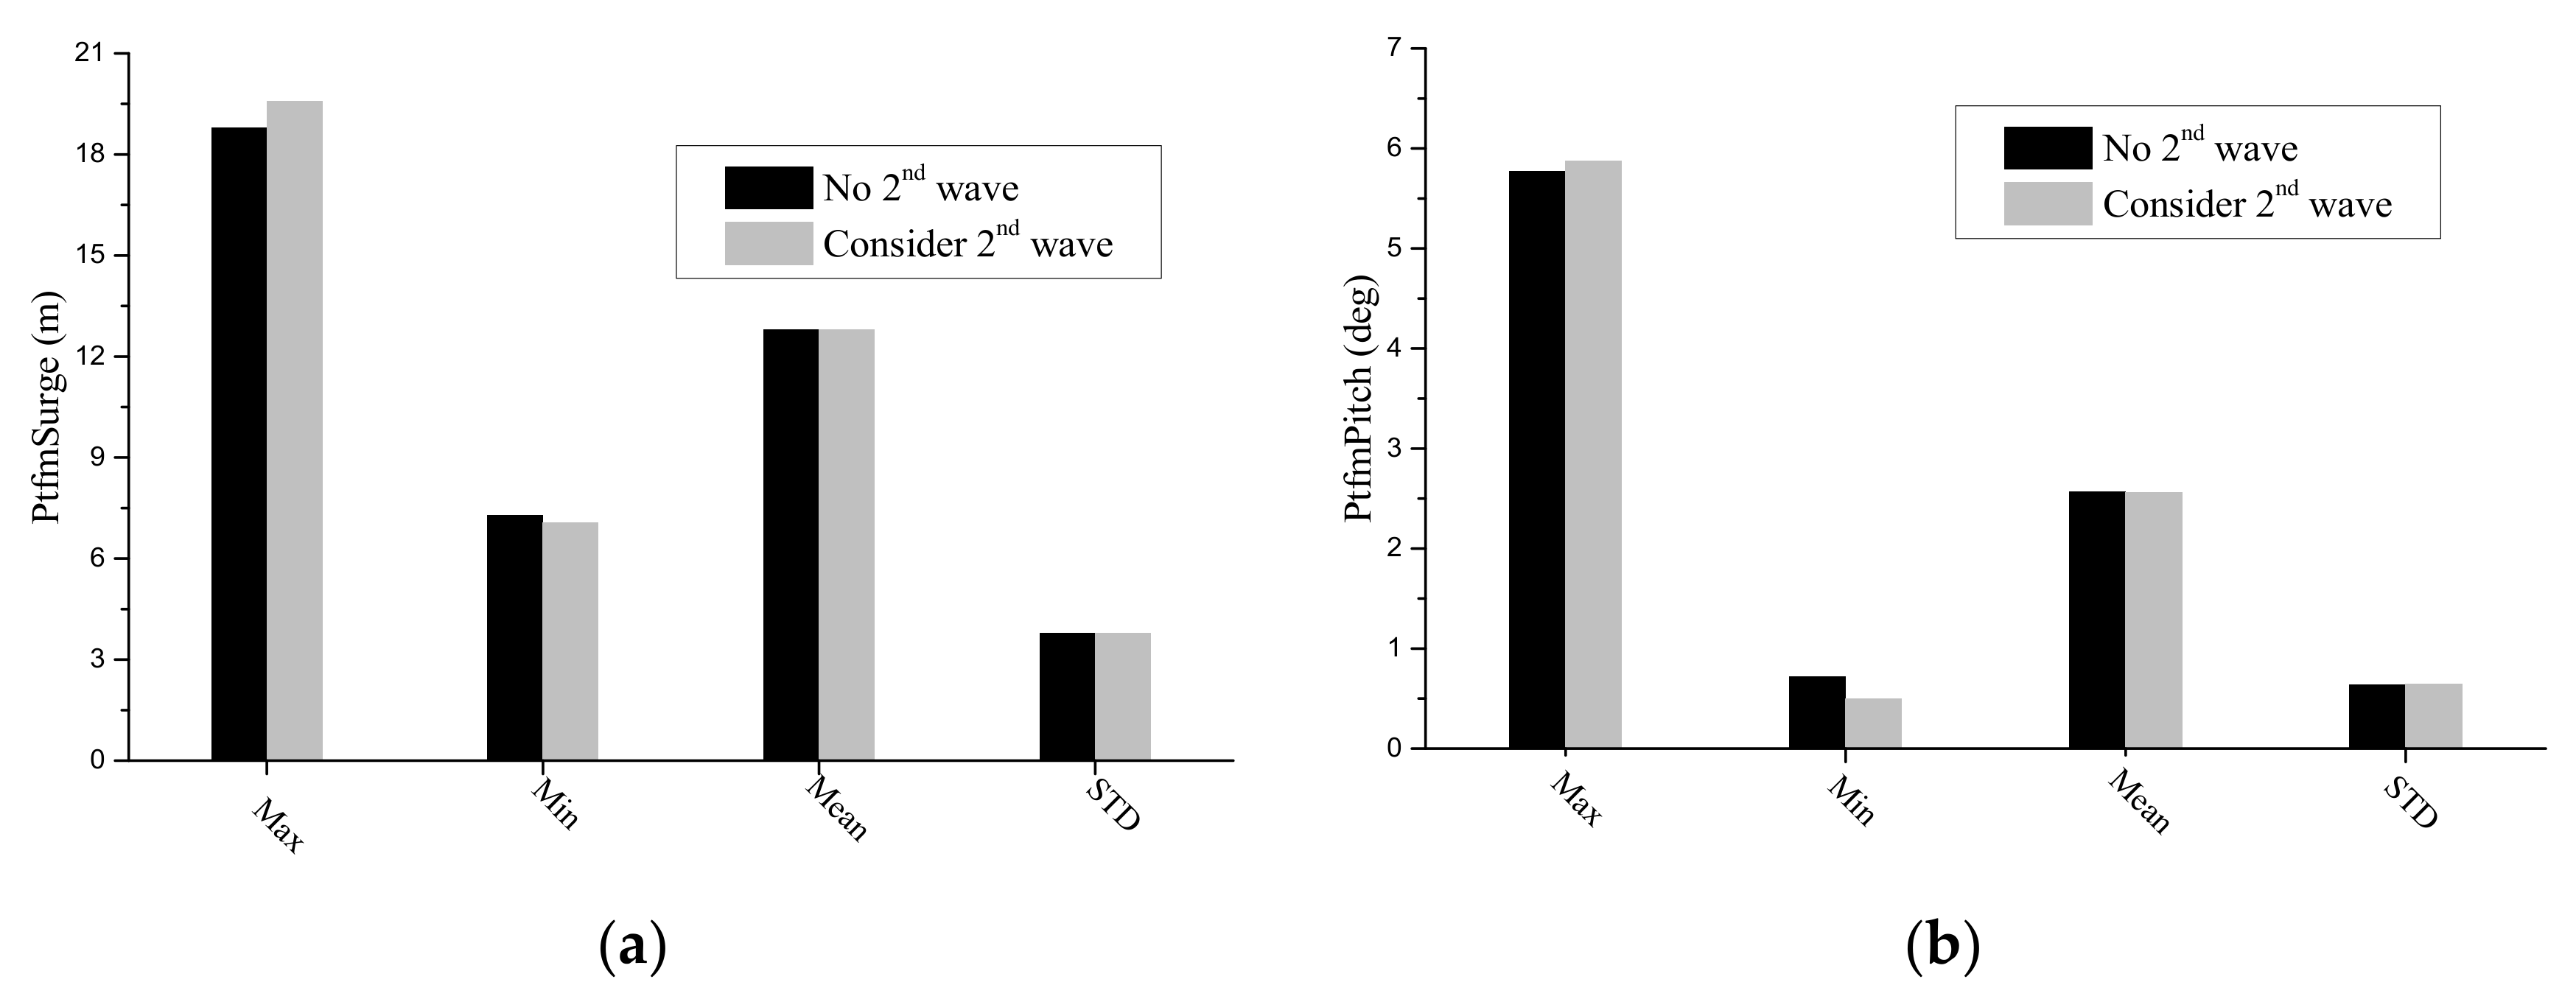
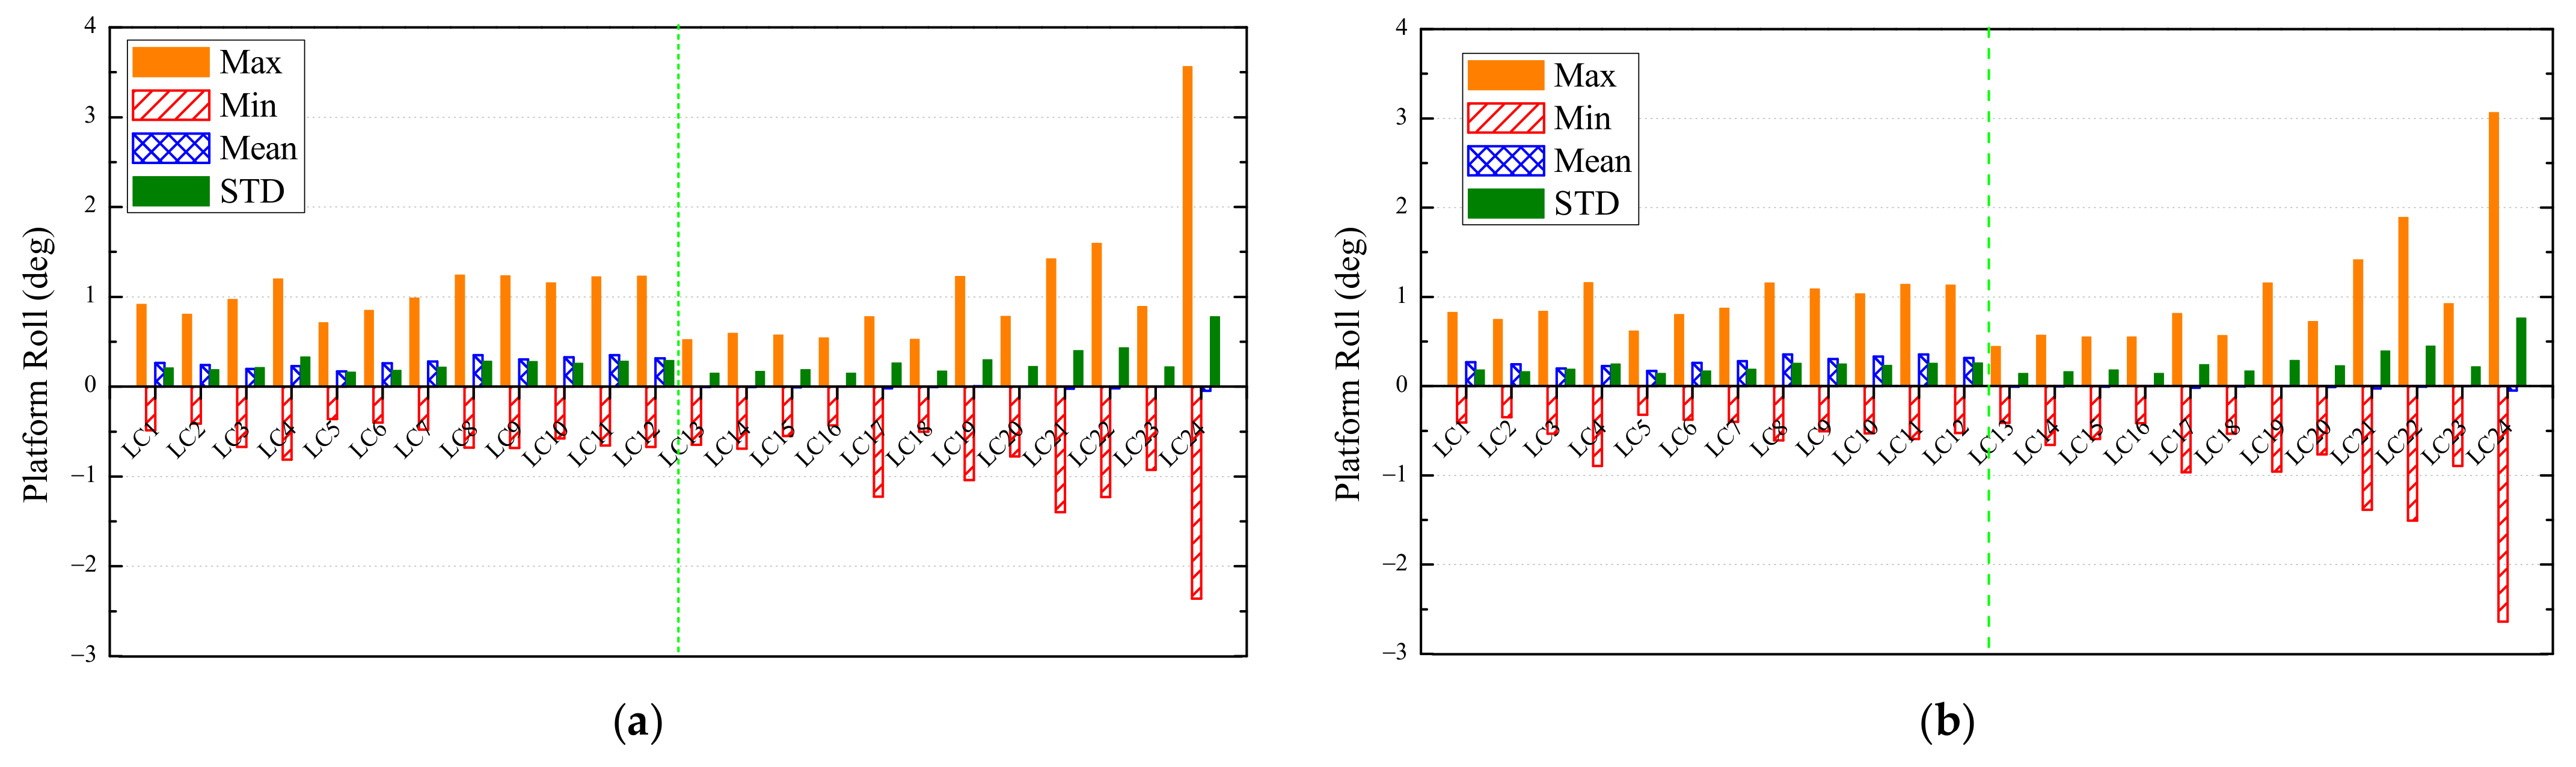
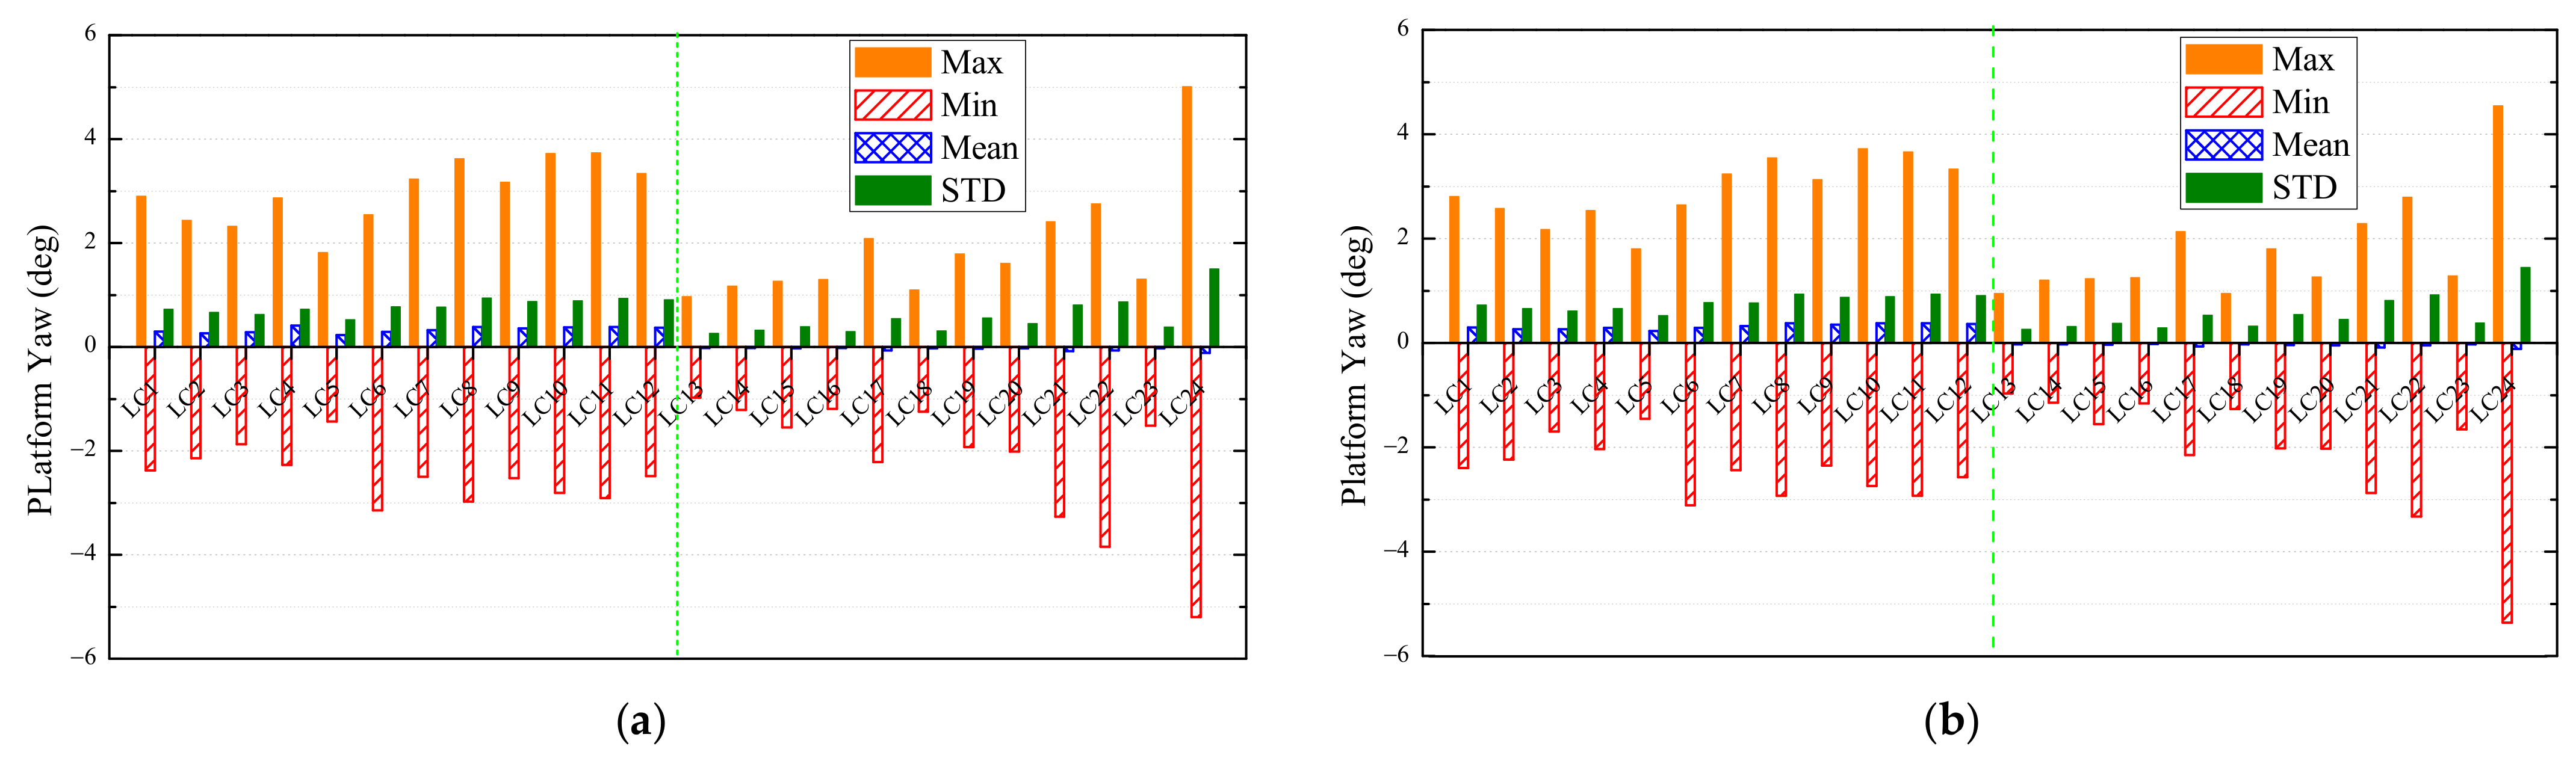
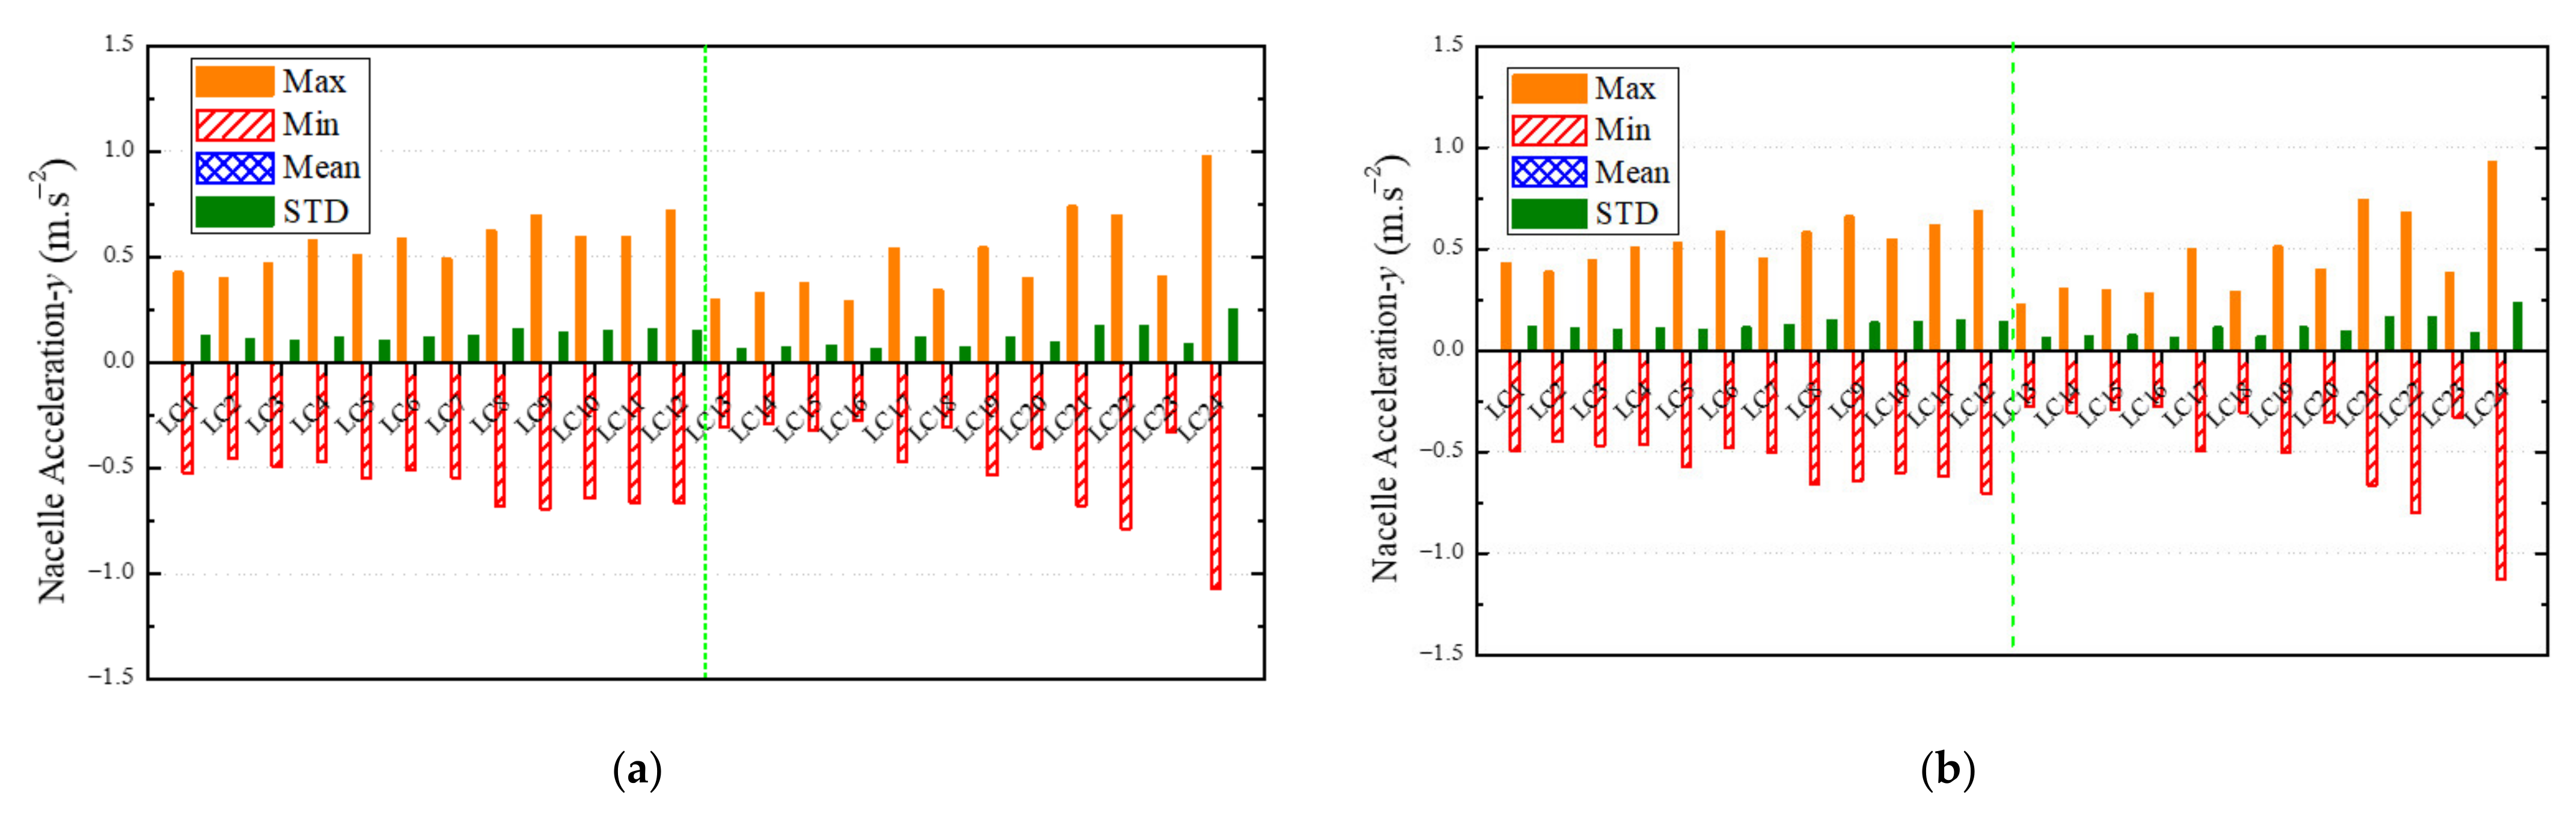
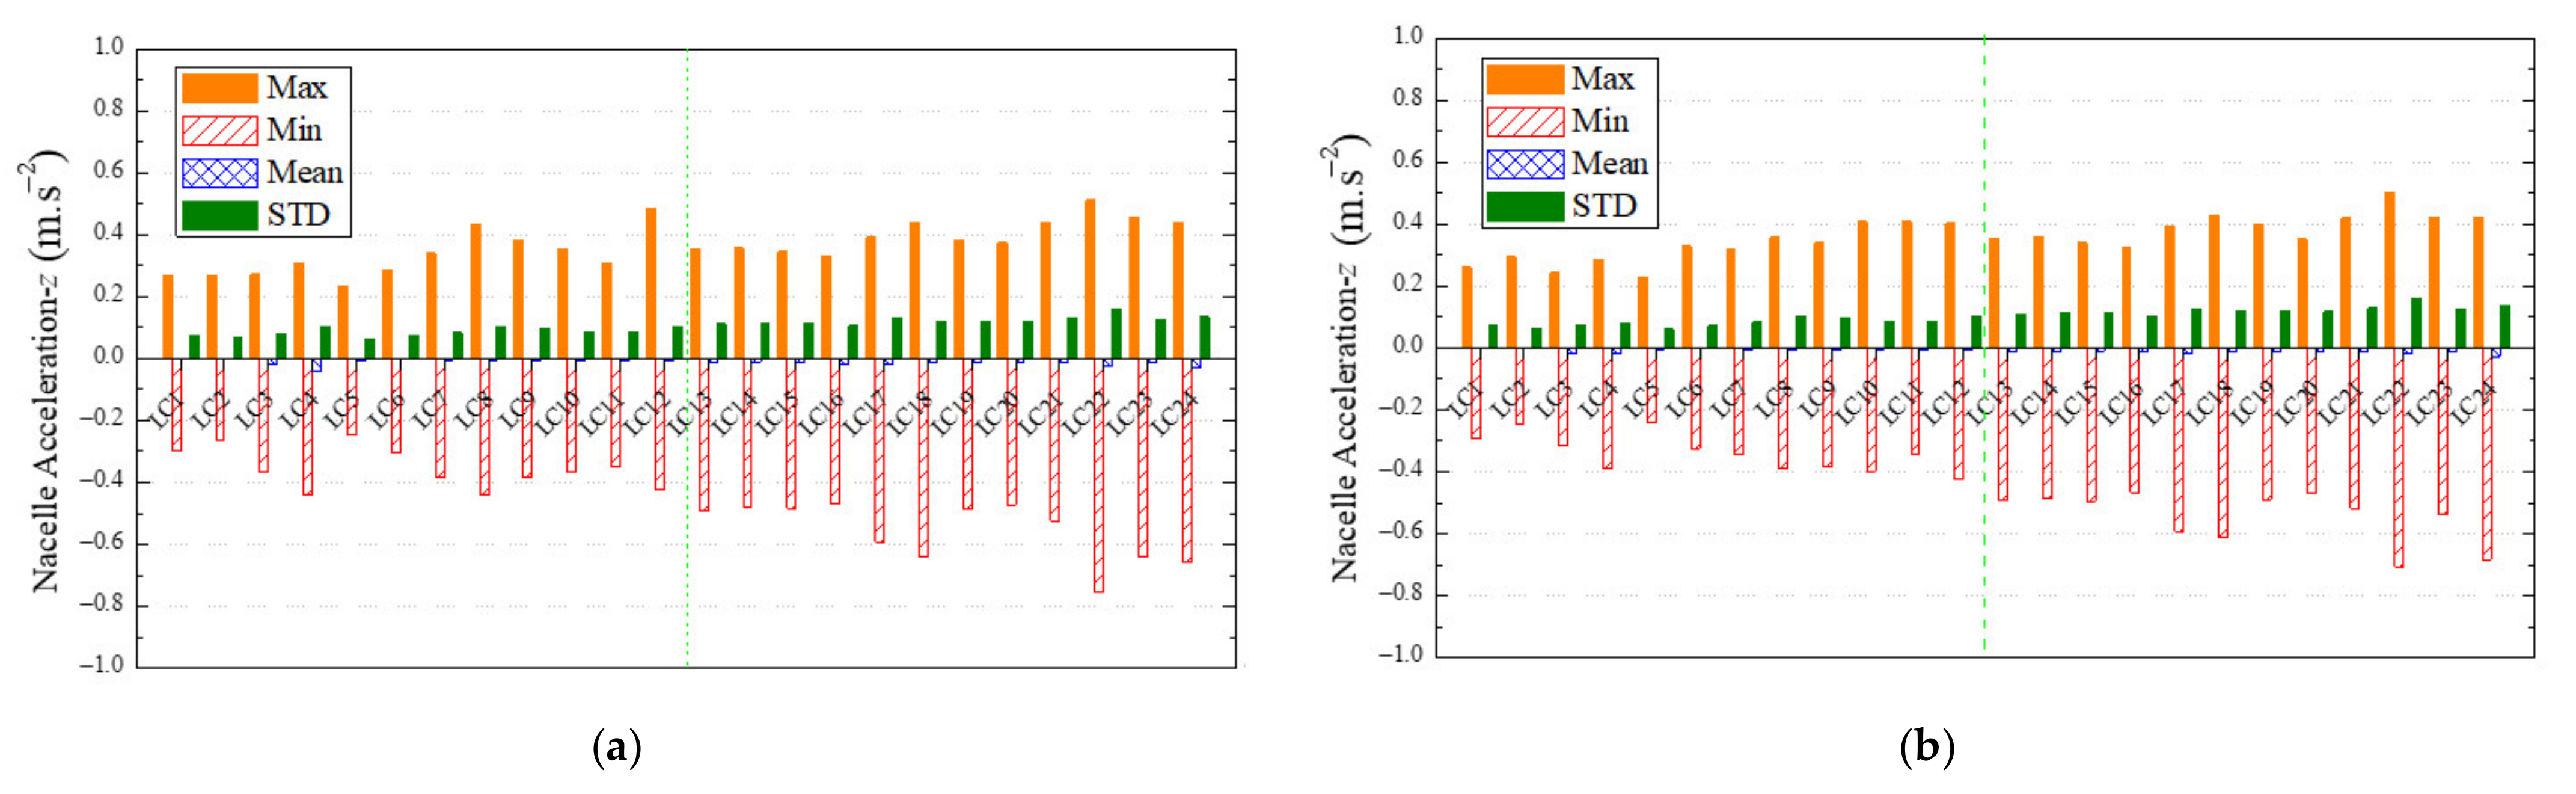
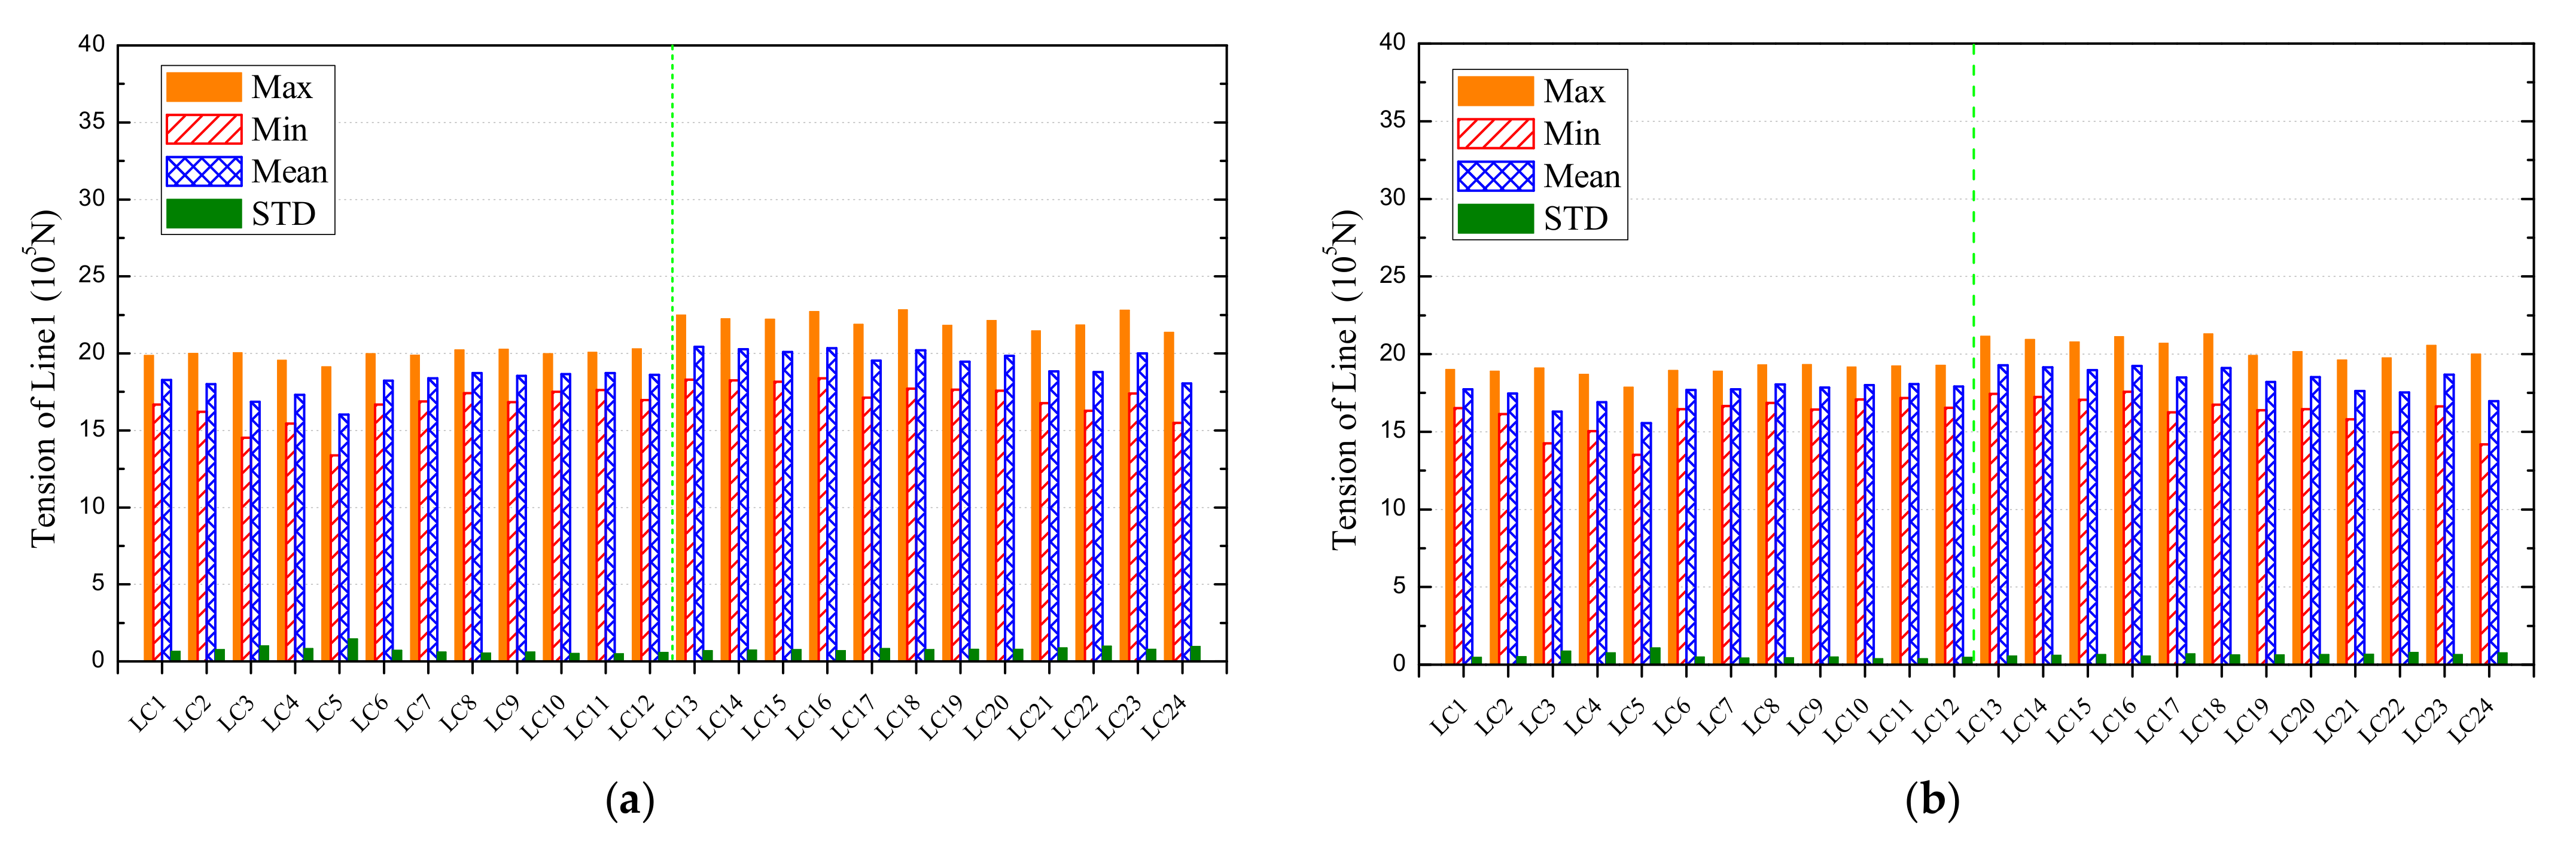
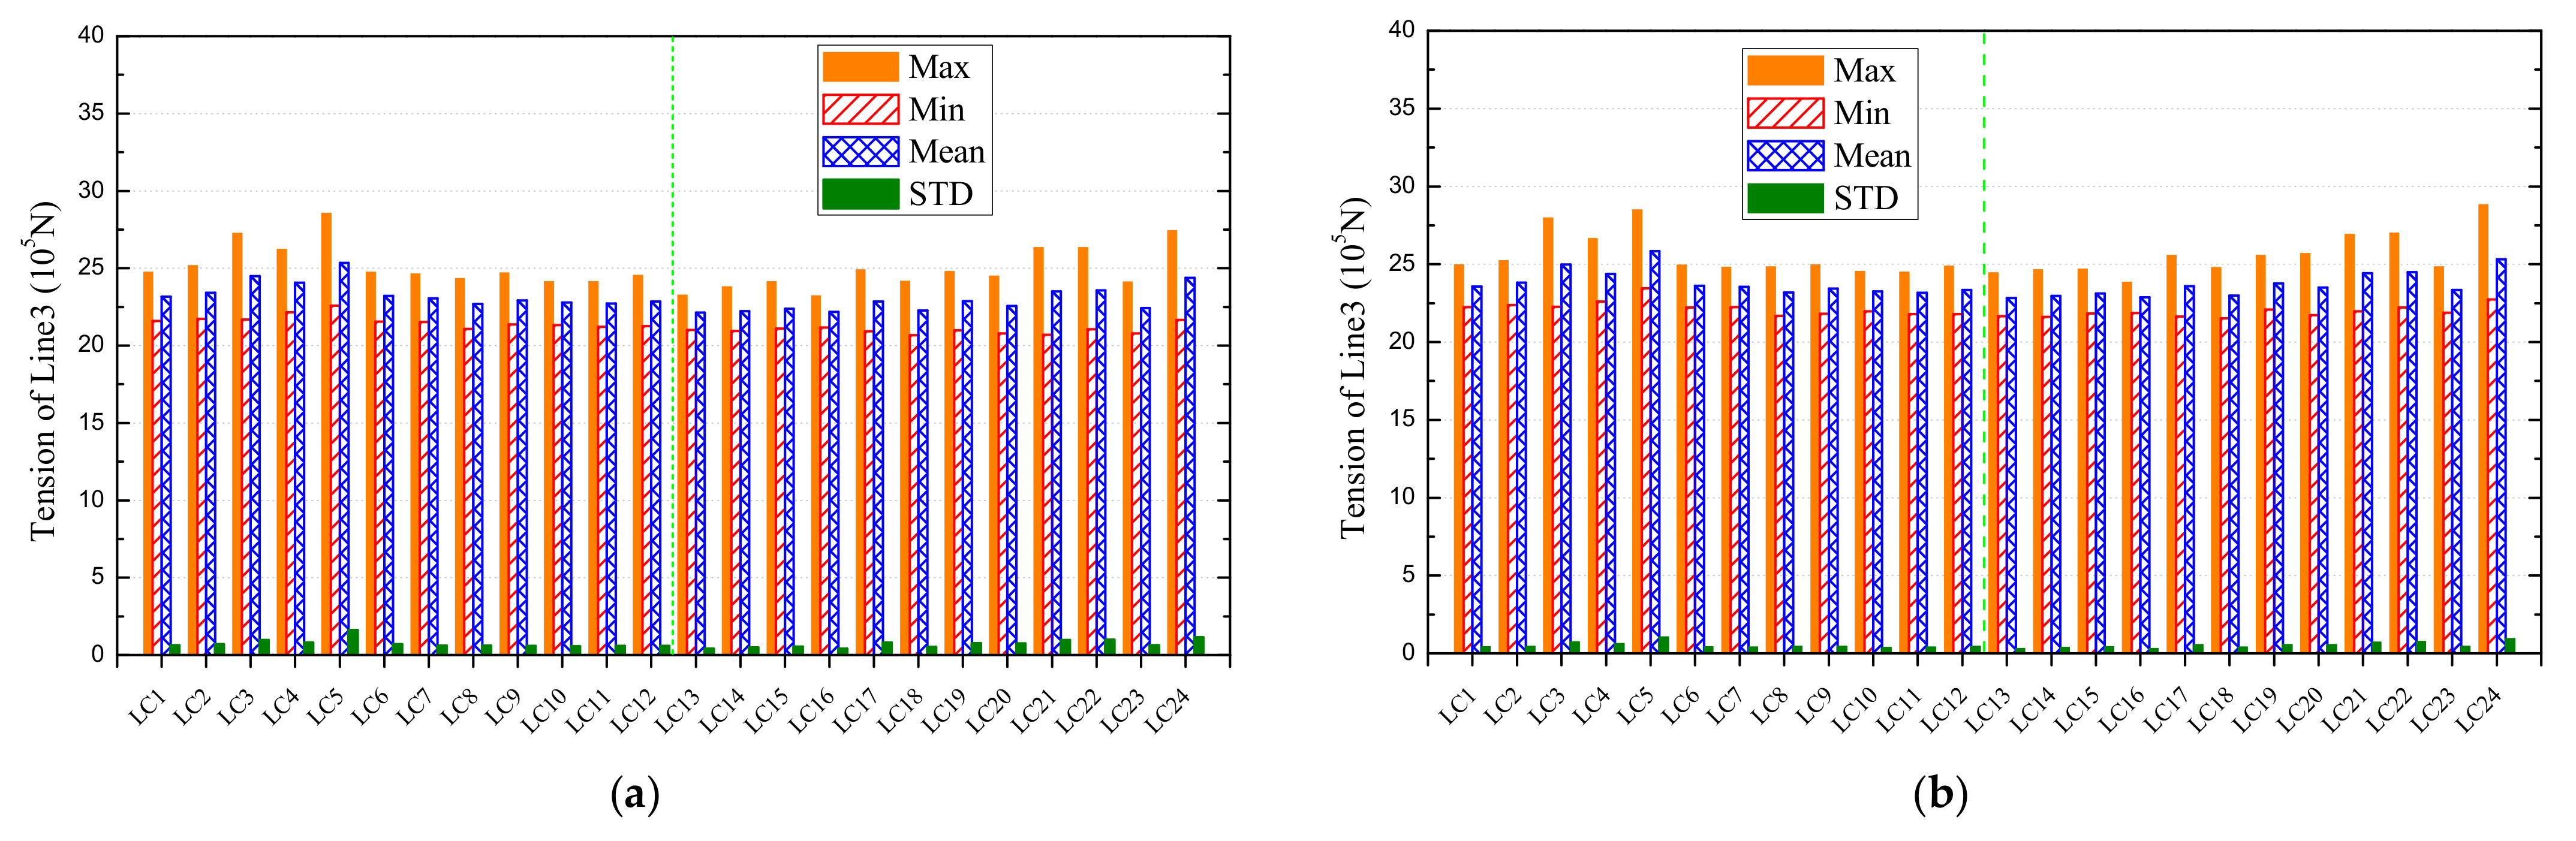
4.3. Nacelle Acceleration and Mooring Tension
5. Conclusions
Author Contributions
Funding
Institutional Review Board Statement
Informed Consent Statement
Data Availability Statement
Conflicts of Interest
References
- Barthelmie, R.J.; Pryor, S.C. Climate Change Mitigation Potential of Wind Energy. Climate 2021, 9, 136. [Google Scholar] [CrossRef]
- Zhang, X.; Ma, C.; Song, X.; Zhou, Y.; Chen, W. The impacts of wind technology advancement on future global energy. Appl. Energy 2016, 184, 1033–1037. [Google Scholar] [CrossRef]
- Pham, T.D.; Dinh, M.C.; Kim, H.M.; Nguyen, T.T. Simplified floating wind turbine for real-time simulation of large-scale floating offshore wind farms. Energies 2021, 14, 4571. [Google Scholar] [CrossRef]
- Wang, Y.; Shi, W.; Michailides, C.; Wan, L.; Kim, H.; Li, X. WEC shape effect on the motion response and power performance of a combined wind-wave energy converter. Ocean Eng. 2022, 250, 111038. [Google Scholar] [CrossRef]
- Ren, Z.; Verma, A.S.; Li, Y.; Teuwen, J.J.; Jiang, Z. Offshore wind turbine operations and maintenance: A state-of-the-art review. Renew. Sustain. Energy Rev. 2021, 144, 110886. [Google Scholar] [CrossRef]
- Possner, A.; Caldeira, K. Geophysical potential for wind energy over the open oceans. Proc. Natl. Acad. Sci. USA 2017, 114, 11338–11343. [Google Scholar] [CrossRef] [Green Version]
- Chen, C.; Ma, Y.; Fan, T. Review of model experimental methods focusing on aerodynamic simulation of floating offshore wind turbines. Renew. Sustain. Energy Rev. 2022, 157, 112036. [Google Scholar] [CrossRef]
- Le, C.; Zhang, J.; Ding, H.; Zhang, P.; Wang, G. Preliminary design of a submerged support structure for floating wind turbines. J. Ocean Univ. China 2020, 19, 49–66. [Google Scholar] [CrossRef]
- Peng, L.; Zhao, H.; Li, X. New ductile fracture model for fracture prediction ranging from negative to high stress triaxiality. Int. J. Plast. 2021, 145, 103057. [Google Scholar] [CrossRef]
- Borgen, E. Floating Wind Power in Deep Water-Competitive with shallow-water Wind Farms. Mod. Energy Rev. 2010, 2, 49–53. [Google Scholar]
- Ren, Y.; Vengatesan, V.; Shi, W. Dynamic Analysis of a Multi-column TLP Floating Offshore Wind Turbine with Tendon Failure Scenarios. Ocean Eng. 2022, 245, 110472. [Google Scholar] [CrossRef]
- Jonkman, J. Dynamics of offshore floating wind turbines-model development and verification. Wind Energy 2019, 12, 459–492. [Google Scholar] [CrossRef]
- Hywind Demo. Available online: https://www.equinor.com/en/what-we-do/floating-wind/hywind-demo.html (accessed on 1 December 2021).
- Equinor and ORE Catapult Collaborating to Share Hywind Scotland Operational Data. Available online: https://www.equinor.com/en/news/2019-11-28-hywind-scotland-data.html (accessed on 1 December 2021).
- Roddier, D.; Cermelli, C.; Aubault, A.; Peiffer, A. Summary and con-clusions of the full life-cycle of the WindFloat FOWT prototype project. In Proceedings of the ASME 2017 36th International Conference on Ocean, Offshore and Arctic Engineering, Hamburg, Germany, 5–10 June 2017. [Google Scholar]
- Ramirez, L.; Fraile, D.; Brindley, G. Offshore Wind in Europe: Key Trends and Statistics 2020; WindEurope Intelligence Platform: Brussels, Belgium, 2021. [Google Scholar]
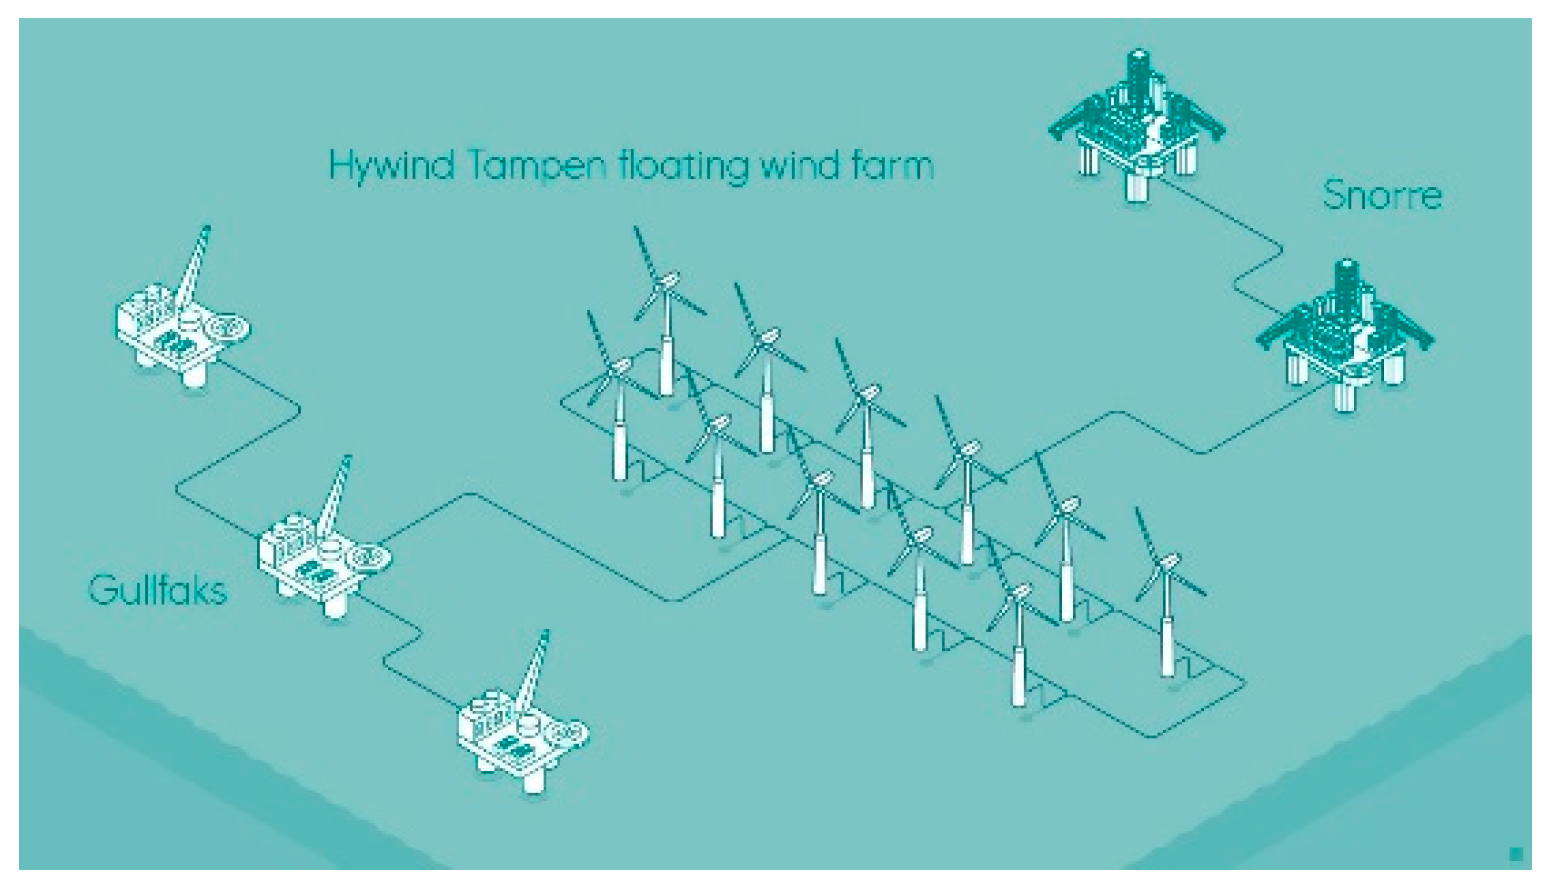
- Hywind Tampen: The World’s First Renewable Power for Offshore Oil and Gas. Available online: https://www.equinor.com/en/what-we-do/hywind-tampen.html (accessed on 1 December 2021).
- Hofmann, M.; Sperstad, I.B. Will 10 mw wind turbines bring down the operation and maintenance cost of offshore wind farms. Energy Procedia 2014, 53, 231–238. [Google Scholar] [CrossRef] [Green Version]
- Bak, C.; Zahle, F.; Bitsche, R.; Kim, T.; Yde, A.; Henriksen, L.C.; Natarajan, A.; Hansen, M. DTU 10-MW Reference Wind Turbine; DTU Wind Energy Report-I-0092; DTU: Kongens Lyngby, Denmark, 2013. [Google Scholar]
- Wang, Q. Design and Dynamic Analysis of a Steel Pontoon-Type Semi-Submersible Floater Supporting the DTU 10-MW Reference Turbine. Master’s Thesis, Delft University of Technology, Delft, The Netherlands, 2014. [Google Scholar]
- Castro, I.R. Design of a 10-MW Wind Turbine Rotor Blade for Testing of a Scaled-Down Floating Offshore Support Structure. Master’s Thesis, Delft University of Technology, Delft, The Netherlands, 2017. [Google Scholar]
- Tian, X. Design, Numerical Modelling and Analysis of TLP Floater Supporting the DTU 10MW Wind Turbine. Master’s Thesis, Norwegian University of Science and Technology, Trondheim, Norway, 2016. [Google Scholar]
- Crozier, A. Design and Dynamic Modeling of the Support Structure for a 10-MW Offshore Wind Turbine. Master’s Thesis, Norwegian University of Science and Technology, Trondheim, Norway, 2011. [Google Scholar]
- Jmh, A.; Eeb, A.; Jrram, B. Integrated design optimization of spar floating wind turbines. Mar. Struct. 2020, 72, 102771. [Google Scholar]
- Wang, S.; Nejad, A.R.; Bachynski, E.E.; Moan, T. Effects of bedplate flexibility on drivetrain dynamics: Case study of a 10-MW spar type floating wind turbine. Renew. Energy 2020, 161, 808–824. [Google Scholar] [CrossRef]
- Hegseth, J.M.; Bachynski, E. A semi-analytical frequency domain model for efficient design evaluation of spar floating wind turbines. Mar. Struct. 2019, 64, 186–210. [Google Scholar] [CrossRef]
- Son, D.; Pinguet, R.; Roddier, D. Global Sizing of the WindFloat for a 10 MW Generic Wind Turbine. In Proceedings of the ASME 2018 1st International Offshore Wind Technical Conference, San Francisco, CA, USA, 4–7 November 2018. [Google Scholar]
- Ahn, H.; Shin, H. Experimental and numerical analysis of a 10-MW floating offshore wind turbine in regular waves. Energies 2020, 13, 2608. [Google Scholar] [CrossRef]
- Yu, Y.; Pham, T.D.; Shin, H.; Ha, K. Study on the motion characteristics of 10-MW superconducting floating offshore wind turbine considering 2nd order wave effect. Energies 2021, 14, 6070. [Google Scholar] [CrossRef]
- Leble, V.; Barakos, G. 10-MW wind turbine performance under pitching and yawing motion. J. Sol. Energy Eng. 2017, 139, 041003. [Google Scholar] [CrossRef]
- Jeong, J.H.; Kim, S.H. CFD investigation on the flatback airfoil effect of 10 MW wind turbine blade. J. Mech. Sci. Technol. 2018, 32, 2089–2097. [Google Scholar] [CrossRef]
- Oh, S.; Inoue, H.; Takahashi, Y. Structural design of a prestressed-concrete spar-type floater for 10mw wind turbines. J. Phys. Conf. Ser. 2020, 1669, 012012. [Google Scholar] [CrossRef]
- Serafeim, G.P.; Manolas, D.I.; Riziotis, V.A.; Chaviaropoulos, P.K. Lightweight optimal rotor design of a 10-MW scale wind turbine using passive load control methods. J. Phys. Conf. Ser. 2020, 1618, 022061. [Google Scholar] [CrossRef]
- Bredmose, H.; Lemmer, F.; Borg, M.; Pegalajar-Jurado, A.; Mikkelsen, R.F.; Larsen, T.S. The triple spar campaign: Model tests of a 10mw floating wind turbine with waves, wind and pitch control. Energy Procedia 2017, 137, 58–76. [Google Scholar] [CrossRef] [Green Version]
- Jonkman, J. Definition of the Floating System for Phase IV of OC3; Technical Report; National Renewable Energy Laboratory (NREL): Golden, CO, USA, 2010.
- Jonkman, J.M.; Buhl, M.L., Jr. FAST User’s Guide; Technical Report No. NREL/EL-500-38230; National Renewable Energy Laboratory (NREL): Golden, CO, USA, 2005.
- Bortolotti, P.; Tarres, H.C.; Dykes, K.L.; Merz, K.; Sethuraman, L.; Varelst, D.; Zahle, F. IEA Wind Task 37 on Systems Engineering in Wind Energy WP2.1 Reference Wind Turbines; U.S. Department of Energy Office of Scientific and Technical Information: Oak Ridge, TN, USA, 2019.
- Xue, W. Design, Numerical Modelling and Analysis of a Spar Floater Supporting the DTU 10MW Wind Turbine. Master’s Thesis, Norwegian University of Science and Technology, Trondheim, Norway, 2016. [Google Scholar]
- DNVGL. DNVGL-ST-0437: Loads and Site Conditions for Wind Turbines; DNV GL AS: Bærum, Norway, 2016. [Google Scholar]
- ANSYS Inc. ANSYS AQWA, Librium. NAUT and Tether Manuals; ANSYS Inc.: Canonsburg, PA, USA, 2017. [Google Scholar]
- ROSCO 2.5.0 Documentation. Available online: https://rosco.readthedocs.io/en/develop/source/install.html (accessed on 10 February 2022).
- DNVGL. DNVGL-RP-0286: Coupled Analysis of Floating Wind Turbines; DNVGL-RP-0286; DNV GL AS: Bærum, Norway, 2019. [Google Scholar]
- Jonkman, B.J. TurbSim User’s Guide: Version 2.00.00 [R]; National Renewable Energy Laboratory (NREL): Golden, CO, USA, 2016.
- IEC. 61400-1. Wind Turbines-Part 1: Design Requirements for Offshore Wind Turbines; International Electrotechnical Commission: Geneva, Switzerland, 2005. [Google Scholar]
- Zhang, W.; Zhou, Z.; Pradhan, D.; Wang, P.; Jin, H. Design considerations of drag anchors in cohesive soil for floating facilities in the South China sea. Mar. Struct. 2022, 81, 103101. [Google Scholar] [CrossRef]


| Parameter | Value | Comment |
|---|---|---|
| Wind Regime | IEC class 1A | Same as DTU 10-MW RWT |
| Rotor Orientation | Clockwise rotation—Upwind | Same as DTU 10-MW RWT |
| Control | Variable Speed Collective Pitch | Same as DTU 10-MW RWT |
| Cut-in wind speed | 4 m/s | Same as DTU 10-MW RWT |
| Cut-out wind speed | 25 m/s | Same as DTU 10-MW RWT |
| Rated wind speed | 11 m/s | Optimized |
| Rated electrical power | 10 MW | Same as DTU 10-MW RWT |
| Number of blades | 3 | Same as DTU 10-MW RWT |
| Rotor Diameter | 198.0 | Optimized |
| Airfoil series | FFA-W3 | Same as DTU 10-MW RWT |
| Hub Diameter | 4.6 m | Reduced from 5.4 m |
| Hub Height | 119.0 m | Same as DTU 10-MW RWT |
| Drivetrain | Direct-drive | Changed from Medium Speed, Multiple-Stage Gearbox |
| Minimum Rotor Speed | 6.0 rpm | Same as DTU 10-MW RWT |
| Maximum Rotor Speed | 8.68 rpm | Constrained by max tip speed |
| Gearbox Ratio | N/A | Direct-drive |
| Maximum Tip Speed | 90.0 m/s | Same as DTU 10-MW RWT |
| Hub Overhang | 7.1 m | Same as DTU 10-MW RWT |
| Shaft Tilt Angle | 6.0 deg. | Increased from 5 deg |
| Rotor Precone Angle | −4 deg. | Increased from −2.5 deg |
| Blade Prebend | 6.2 m | Increased from 3.2 m |
| Blade Mass | 47,700 kg | 12% increase from DTU 10-MW RWT |
| Nacelle Mass | 542,600 kg | - |
| Tower Mass | 628,442 kg | Provisional, same as DTU 10-MW RWT |
| Parameter | Value | Parameter | Value |
|---|---|---|---|
| Maximum CP (–) | 0.49 | Min Rotor Speed (rpm) | 6.0 |
| Design tip speed ratio (TSR) (–) | 10.58 | Design Pitch (deg) | 0 |
| Rated Mechanical Power (MW) | 10.6383 | Omega Rated (rpm) | 8.68 |
| Rated Torque (MNm) | 11.704 | Max Tip Speed (m/s) | 90.0 |
| Cut-in Wind Speed (m/s) | 4.0 | Cut-out Wind Speed (m/s) | 25.0 |
| Wind Speed Region II1/2 (m/s) | 8.5 | Rated Wind Speed (m/s) | 10.75 |
| Parameter | Value |
|---|---|
| Water depth (m) | 320 |
| Draft (m) | 120 |
| Elevation to tower base above SWL (m) | 10 |
| Depth to top of taper below SWL (m) | 4 |
| Depth to bottom of taper below SWL (m) | 12 |
| Diameter above taper (m) | 8.5 |
| Diameter below taper (m) | 13 |
| Mass including ballast (kg) | 1.381 × 10⁷ |
| Displacement (m3) | 1.53 × 10⁴ |
| Roll moment of inertia about CoG (kg·m2) | 9.6899 × 10⁹ |
| Pitch moment of inertia about CoG (kg·m2) | 9.6899 × 10⁹ |
| Yaw moment of inertia about CoG (kg·m2) | 3.3589 × 10⁸ |
| Vertical CoG below SWL (m) | 95.5 |
| Vertical CoB below SWL (m) | 62.3 |
| Parameter | Value |
|---|---|
| Radius to anchors (m) | 855.2 |
| Unstretched mooring line length (m) | 902.2 |
| Radius to fairleads from spar centerline (m) | 6.5 |
| Mooring line diameter (m) | 0.09 |
| Equivalent mooring line mass density (kg/m) | 245.4 |
| Equivalent mooring line axial stiffness (N) | 3.84 × 10⁸ |
| Fairlead depth below SWL (m) | 70.0 |
| Yaw spring stiffness (Nm/rad) | 1.48 × 10⁸ |
| DOFs | Surge | Heave | Pitch | Yaw | |
|---|---|---|---|---|---|
| Natural period (s) | IEA 10-MW | 103.8 | 33.4 | 26.3 | 8.1 |
| DTU 10-MW | 103.3 | 31.3 | 35.5 | 7.6 | |
| DNVGL [42] | ~100 (catenary) | 25–40 | 25–40 | 5–20 |
| Return Period (Year) | Load Case No. | Significant Wave Height (m) | Wave Peak Period (s) | Current Speed (m/s) | Mean Wind Speed (m/s) | Turbine Status |
|---|---|---|---|---|---|---|
| 2 | LC1 | 4.22 | 8.70 | 1.38 | 19.17 | operating |
| LC2 | 3.68 | 7.10 | 17.40 | |||
| LC3 | 3.43 | 9.83 | 13.60 | |||
| LC4 | 3.81 | 10.4 | 15.64 | |||
| LC5 | 3.16 | 8.77 | 11.00 | |||
| LC6 | 4.34 | 12.2 | 18.76 | |||
| 5 | LC7 | 5.10 | 11.1 | 1.51 | 20.00 | operating |
| LC8 | 6.21 | 9.80 | 24.92 | |||
| LC9 | 5.94 | 8.20 | 21.67 | |||
| LC10 | 5.47 | 13.6 | 23.37 | |||
| LC11 | 4.99 | 12.2 | 25.15 | |||
| LC12 | 6.42 | 10.0 | 22.45 | |||
| 50 | LC13 | 8.96 | 13.5 | 2.00 | 34.16 | parked |
| LC14 | 8.45 | 10.4 | 36.78 | |||
| LC15 | 8.13 | 9.30 | 40.05 | |||
| LC16 | 8.69 | 16.4 | 35.55 | |||
| LC17 | 10.16 | 13.8 | 49.01 | |||
| LC18 | 9.07 | 11.5 | 37.79 | |||
| 100 | LC19 | 8.61 | 10.3 | 2.20 | 51.80 | parked |
| LC20 | 8.45 | 9.30 | 44.18 | |||
| LC21 | 8.83 | 9.90 | 59.29 | |||
| LC22 | 11.38 | 10.6 | 60.02 | |||
| LC23 | 9.38 | 11.4 | 41.45 | |||
| LC24 | 10.76 | 16.3 | 70.00 |
Publisher’s Note: MDPI stays neutral with regard to jurisdictional claims in published maps and institutional affiliations. |
© 2022 by the authors. Licensee MDPI, Basel, Switzerland. This article is an open access article distributed under the terms and conditions of the Creative Commons Attribution (CC BY) license (https://creativecommons.org/licenses/by/4.0/).
Share and Cite
Guo, X.; Zhang, Y.; Yan, J.; Zhou, Y.; Yan, S.; Shi, W.; Li, X. Integrated Dynamics Response Analysis for IEA 10-MW Spar Floating Offshore Wind Turbine. J. Mar. Sci. Eng. 2022, 10, 542. https://doi.org/10.3390/jmse10040542
Guo X, Zhang Y, Yan J, Zhou Y, Yan S, Shi W, Li X. Integrated Dynamics Response Analysis for IEA 10-MW Spar Floating Offshore Wind Turbine. Journal of Marine Science and Engineering. 2022; 10(4):542. https://doi.org/10.3390/jmse10040542
Chicago/Turabian StyleGuo, Xiaojiang, Yu Zhang, Jiatao Yan, Yiming Zhou, Shu Yan, Wei Shi, and Xin Li. 2022. "Integrated Dynamics Response Analysis for IEA 10-MW Spar Floating Offshore Wind Turbine" Journal of Marine Science and Engineering 10, no. 4: 542. https://doi.org/10.3390/jmse10040542
APA StyleGuo, X., Zhang, Y., Yan, J., Zhou, Y., Yan, S., Shi, W., & Li, X. (2022). Integrated Dynamics Response Analysis for IEA 10-MW Spar Floating Offshore Wind Turbine. Journal of Marine Science and Engineering, 10(4), 542. https://doi.org/10.3390/jmse10040542