Abstract
Hydrogen is widely regarded as a key element of prospective energy solutions for alleviating environmental emission problems. However, hydrogen is classified as a high-risk gas because of its wide explosive range, high overpressure, low ignition energy, and fast flame propagation speed compared with those of hydrocarbon-based gases. In addition, deflagration can develop into detonation in ventilation or explosion guide tunnels if explosion overpressure occurs, leading to the explosion of all combustible gases. However, quantitative evidence of an increase in the explosion overpressure of ventilation tunnels is unavailable because the explosive characteristics of hydrogen gas are insufficiently understood. Therefore, this study investigated an explosion chamber with the shape of a ventilation pipe in a ship compartment. The effect of tunnel length on explosion overpressure was examined experimentally. For quantitative verification, the size of the hydrogen gas explosion overpressure was analyzed and compared with experimental values of hydrocarbon-based combustible gases (butane and LPG (propane 98%)). The experimental database can be used for explosion risk analyses of ships when designing ventilation holes and piping systems and developing new safety guidelines for hydrogen carriers and hydrogen-fueled ships.
1. Introduction
Serious global challenges, such as global warming and air pollution, result from the use of fossil fuels, which account for more than 85% of energy sources. Currently, hydrogen is widely regarded as a key element in prospective energy solutions for alleviating environmental emission problems. Hydrogen is receiving increasing attention as a clean energy source to replace fossil fuels. Water is the only byproduct of hydrogen combustion; not even air pollutants are produced. Hydrogen also has a high heat of combustion; thus, it is an efficient energy source with a heating value approximately three times higher than that of petroleum. Therefore, hydrogen is the most attractive future energy source for storing and propulsion energy in the shipping industry. Notably, hydrogen is the lightest among existing gases. Moreover, it is colorless, odorless, tasteless, and nontoxic, it is flammable at room temperature, and it has a wide explosive range (4–75%). For explosion and fire risk, hydrogen has an approximately 15 times lower minimum ignition energy (0.011 mJ) than that of other combustible gases (propane: 0.25 mJ, butane: 0.25 mJ, methane: 0.28 mJ).
The low ignition energy and lighter nature of hydrogen make the gas difficult to ignite when diffused into the atmosphere unless it is in an enclosed space. However, when hydrogen gas leakage occurs in a confined, limited space, an ignition source will cause the gas to burn easily regardless of its low ignition energy, which can lead to fire and explosion. Hydrogen explosion is more dangerous than that of other hydrocarbon gases.
In ships and offshore installations, owing to the complex arrangement, ventilation holes and fans must be installed in places where hydrogen and combustible gases are handled to ensure safety against various gas leaks. In such places, an air conditioning system is installed to periodically circulate internal/external air, and ventilation holes are generally manufactured and installed in cylindrical and rectangular shapes. In handling hydrogen and combustible gases, structural safety must be ensured in each vent to avoid fire and explosion accidents caused by ignition sources.
Hydrogen and hydrocarbon-based combustible gases differ in their explosion propagation processes and explosion characteristics. Several studies have been conducted on the ignition energy, explosion limit, and explosion overpressure of these gases, using experimental methods such as ventilation tunnels, as summarized below.
Wähner et al. [1] statistically analyzed the minimum ignition energies (MIEs) of hydrogen, ethene, and propane through logistic regression based on existing MIE test results and new measurements. The authors also discussed the conditions required for the approach. The behavior of hydrogen at a high pressure and temperature has also been intensively investigated experimentally [2,3,4,5,6,7]. Li et al. [8] conducted an experiment in a semi-sealed pipe to investigate the effect of obstacle location and gasoline vapor concentration on gasoline–air fuel explosion. Internal overpressure, external overpressure, flame propagation, and changes in the flame–overpressure coupling relationship were analyzed. Bauwens et al. [9] compared the results of explosion experiments for hydrogen mixtures and propane and methane mixtures in an enclosed room (4.6 × 4.6 × 3.0 m/64 m3). The hydrogen mixture concentration was 18% vol., and the propane and methane air mixture was tested at stoichiometric concentrations. Mukhim et al. [10] developed a method to predict the overpressure of an outdoor hydrogen explosion caused by a vapor cloud explosion, and Qi et al. [11] tested an emission explosion of 29 batches in a 12 m3 concrete chamber filled with a methane–air mixture. The effect of methane concentration and discharge pressure on the occurrence of overpressure inside the chamber was investigated.
Li et al. [12] analyzed changes in overpressure due to the explosion of a methane–air mixture in urban manhole structures. The authors found that the closer the methane concentration was to the stoichiometric ratio, the farther the ignition location was from the manhole head; additionally, the greater the weight of the manhole cover, the greater the maximum overpressure of the blast wave caused by the explosion. Based on the experimental results, recommendations were made for manhole explosion risk management.
Cao et al. [13] reported an exhaust explosion experiment involving a hydrogen–air mixture in a 2 m long cylindrical tube under the influence of hydrogen concentration and exhaust burst pressure. An analysis of the relationship between flame propagation and external overpressure showed that the internal maximum overpressure first increased and then decreased with increasing hydrogen concentration. The external maximum overpressure showed an inverse correlation with the internal maximum overpressure. Zhu et al. [14] investigated the blast overpressure for methane-air mixtures in a straight large-scale tunnel using the CFD code (FLACS), and verified the effect of volume concentration with an experimental study. Liu et al. [15] established a generation model for the overpressure peak value through numerical analysis and experiments; the authors also used radio waves to evaluate the distribution of overpressure inside and outside the building. Meng et al. [16] performed an experiment to investigate the response of structural members to the explosion load of a tunnel through leakage inside a natural gas pipe in a metropolitan area. Li et al. [17] conducted an explosion test on a premixed methane–air mixture for a large tube with dimensions 0.8 m × 0.8 m × 30 m. Wang et al. [18] conducted experiments on the duct exhaust deflagration of a hydrogen–methane–air mixture in a cylindrical vessel with relief ducts. The equivalence ratios (ϕ) ranged from 0.6 to 1.8; the flame was extinguished through interior and exterior ventilation configurations, and the pressure increased. In particular, various experiments have been conducted on flame speed and propagation characteristics by mixing various contents of gases related to dimethyl ether (DME) [19,20] and by varying the equivalence ratio [21,22]. The studies have used closed spaces and chambers as well as pipe shapes in relation to combustion characteristics. Wang et al. [23] mainly focused on the effect of hydrogen concentration and film thickness on detonation emission in small obstructed rectangular vessels. The authors found through the pressure history that the maximum overpressure increased as the hydrogen concentration was raised from 11.8% to 23.7%.
Sato et al. [24] tested hydrogen deflagration of homogeneous hydrogen concentration carried out in three types of a scale model. They found that the deflagrations of hydrogen inside a tube generated a much higher pressure than in a free field. This suggests that the hazard of released hydrogen could be reduced through ventilation.
Although many such studies have been conducted, comparative studies on hydrogen and hydrocarbon-based combustible gases have mainly focused on hydrogen and methane–air mixtures. These studies have helped develop the experimental methodologies for identifying the ignition energy, explosion limit, and explosion overpressure of gases, which are the principal parameters of LNG and LPG risks in chemical industries and households.
According to previous literature review of ventilation, tunnel studies indicate a dominance of experimental methods. Studies have been conducted on explosion safety related to transportation in gas and oil pipelines [25], which are more economical to operate than hydrogen pipelines. In addition, some companies are investigating the safe transport of hythane, a hydrogen–methane mixture, through natural gas pipelines.
However, the purpose of the current study was to analyze experimental results and accordingly establish an experimental database for the development of safety standards for hydrogen-fuel-powered ships and high-purity hydrogen carriers. In particular, establishing safety standards regarding hydrogen leakage is vital. In previous studies, the LNG and hydrogen characteristics have been compared according to the existing International Maritime Organization’s (IMO) International Code of Safety for Ship Using Gases or Other Low-flashpoint Fuels (IGF), and International Code of the Construction and Equipment of Ships Carrying Liquefied Gases in Bulk, LNG codes (IGC), and safety standards reflecting the hydrogen characteristics have been developed. When ship compartments for hydrogen supply and storage leak, fire and explosion can be prevented through forced and natural exhaust using the existing rectangular and cylindrical exhaust ports. The retention of gaseous hydrogen leaked from exhaust ports can cause an internal explosion. Therefore, this study was conducted to confirm the internal explosion characteristics of exhaust ports. In particular, as the IMO’s current IGF was developed for LNG-powered ships and transport ships, the internal and external overpressure characteristics of hydrogen were compared with those of hydrocarbons in terms of their direct explosion characteristics.
Additionally, it is necessary to identify the effect of explosion load characteristics in varying ventilation tunnel geometrics for designing the systems for hydrogen ship compartments. Thus, this study considered the cylindrical shapes of possible ventilation openings for ships and offshore plants. To investigate the effect of the tunnel length through which the explosion wave is transmitted during an explosion, experiments were conducted to determine the explosion characteristics and maximum pressure. The results of this study provide a quantities load profile database for risk-based design and guidelines for hydrogen treatments.
2. Hydrogen Explosion Test in Tunnels
2.1. General Gas Explosion Load Characteristics
The explosive properties of combustible materials vary depending on the phase, heat capacity, vapor pressure, and physical and chemical properties of the material (such as heat of combustion). A chemical explosion is a combustion reaction that occurs when flammable materials or combustibles undergo oxidation and decomposition reactions induced by explosives. Explosions can be divided into deflagration, in which the propagation speed of the flame is slower than the speed of sound, and detonation, in which the propagation speed of the flame is faster than the speed of sound.
Eckhoff [26] reported a detonation with a generated pressure more than 10 times that of deflagration. Therefore, general risk-based designs should be prioritized to avoid detonation accidents in target structures.
Explosion can be defined chemically as a rapid increase in the reaction rate of a system, and physically as a rapid expansion of energy or matter under certain conditions. In general, an explosion in an enclosed or partially enclosed space, such as that inside a ship, occurs when combustible gas leaks and encounters an ignition source at a certain concentration, causing structural damage.
Figure 1 illustrates the idealized pressure–time relationship when an explosion occurs from combustible gas. After the explosion of a general combustible gas, the pressure momentarily reaches the maximum overpressure at a point a certain distance away from the ignition source. As the overpressure is attenuated over time, it first reaches the region of negative pressure and then returns to the atmospheric pressure state. In the case of detonation, the impulse in the overpressure region is much larger than that in the negative pressure region, which distinguishes it from deflagration where the impulse generated in the overpressure region is similar to that generated in the negative pressure region [27].
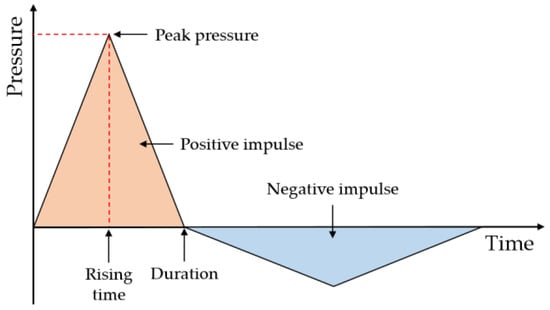
Figure 1.
An idealized pressure model of gas explosion.
2.2. Method of Explosion Test and Apparatus
2.2.1. Target Explosion Chamber and Tunnel
For the target structure in this study, experiments were conducted on cylinder- and square-type, which are representative shapes of internal ventilation holes of components that handle various gases in ships and offshore plants. For the experiments, cylinder (ϕ = 0.594 m, L = 0.538 m, V = 0.149 m3) and square (L = 0.538 m, W = 0.526 m, H = 0.526 m, V = 0.149 m3)-type explosion chambers of the same volume were manufactured for investigation of effect of shape of explosion chamber and tunnel, as shown in Figure 2. Both explosion chambers were made of SS275 steel 10 and 4 mm thick, respectively, to prevent deformation on the side. SS275 (yield strength 275 MPa, tensile strength ranging 410–550 MPa) widely used steel for buildings, bridges, ships, and vehicles structures.
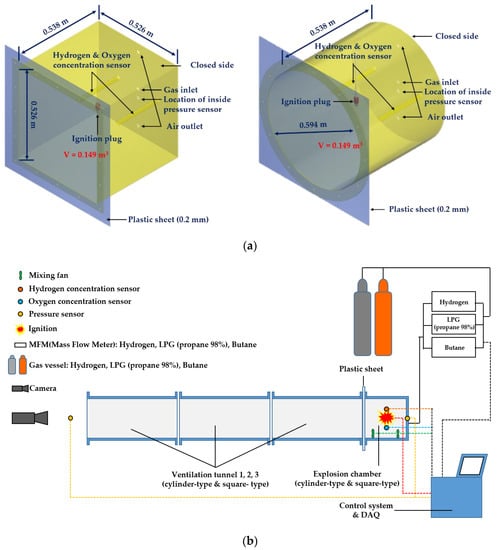
Figure 2.
Schematic representation of the test facility; (a) explosion chamber (left: square-type, right: cylinder-type), (b) Test facility.
The explosion chambers were installed as shown in Figure 2a,b. To observe the effect of tunnel length on explosion characteristics, the experimental setups consisted of a short explosion chamber with a length of approximately 0.5 m (L0), which was connected to a series of 1–3 ventilation tunnels with a length of approximately 1.0 m (L) each.
Figure 3a,b shows the cylinder- and square-type ventilation tunnel components, respectively, of which the ventilation tunnels were constructed. The square-type explosion chamber was manufactured with the same volume (0.149 m3) as that of the cylindrical explosion chamber, and a 10 mm polyacrylic window was installed to make the flame propagation visible from the side (Figure 3b).
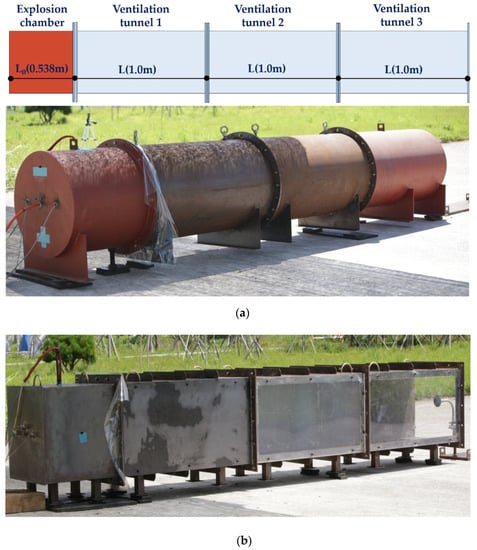
Figure 3.
Photographs of a chamber and tunnel connected in cylinder- (a) and square- (b) types tunnel installation.
As the explosion load profile is a key parameter for expressing explosion characteristics, precise measurements are required during tests. In this study, a pressure sensor (113B27, 100 psi, PCB PIEZOTRONICS [28]) for measuring fast-rising pressure was used.
The detailed specifications of the pressure sensor are shown in Table 1. Owing to the difference in the specific densities of hydrogen and hydrocarbon-based gases, gas may be concentrated in the upper or lower parts of the explosion chamber. The chamber was installed as shown in Figure 4b to create a uniform-concentration explosive atmosphere inside it. When the gas was injected into the explosion chamber, a mass flow meter (MFM; TSM-D230/30 lpm, MFC Korea) was used to continuously supply the desired flow rate. The ignition source used more than 100 J of energy at the maximum voltage of 15 kV.

Table 1.
Specifications of the pressure sensor.
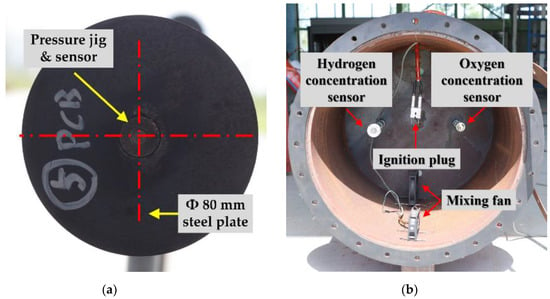
Figure 4.
Outside pressure sensor jig, ignition plug, concentration sensors, and a mixing fan; (a) Outside pressure sensor installation jig, (b) Installation equipment inside the chamber.
Pressure sensors were installed inside and outside the explosion chamber to measure the explosion pressure, as shown in Figure 5. The inside pressure sensor was located at the center of the opposite side of the explosion chamber opening surface, and the outside pressure sensor was located at the same height as the inside pressure sensor. The outside pressure sensor aimed to measure the external discharge reflected pressure, which was located in the center of a steel plate with a diameter of 80 mm, as shown in Figure 4a. The experiment was to confirm the characteristics of the internal and external pressure during the explosion of the interior of the exhaust port. This can be used for structural design reflecting the explosion characteristics of the exhaust port. In addition, it is to secure an experimental DB that is helpful in estimating the length of an appropriate exhaust port by analyzing the external pressure characteristics of the end of the exhaust port according to the length effect. Therefore, analysis was performed by measuring the sensor inside and outside the explosion.
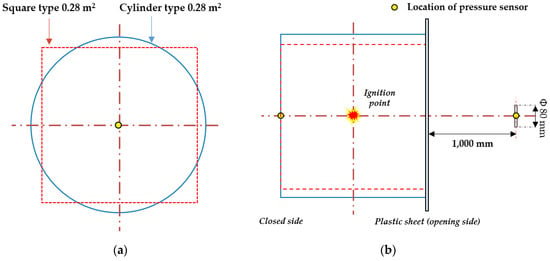
Figure 5.
Location of sensors; (a) section view, (b) plane view.
2.2.2. Explosion Test
To distinguish and compare the hydrogen explosion characteristics from those of hydrocarbon-based gases (butane and LPG (propane 98%)), we investigated and analyzed the effects of the length and shape of the ventilation tunnel. Each gas was tested based on the concentration that formed the maximum explosive overpressure. Gas concentrations for the test condition were controlled at 4.5–5.0% of butane, 4.2–4.5% of LPG (propane 98%), and 45–50% of hydrogen, based on a preliminary test, as shown in Figure 6.
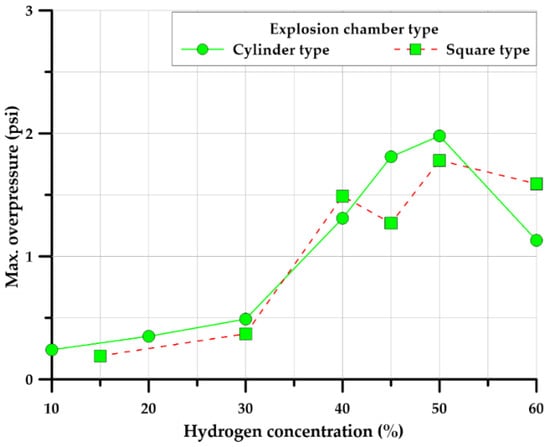
Figure 6.
Maximum overpressure concentration by hydrogen (cylinder-, square-type).
The experimental scenarios selected are described in Table 2. Additionally, the experimental test procedure was developed for safety and to obtain a valuable database, as illustrated in Figure 7. Step 1 was the preparatory work before the explosion experiment. The explosion chamber, densitometer, spark plug, and pressure sensor were installed inside the chamber, and power was applied to check the signal of each device. Step 2 was the process of preparing the explosion environment inside the explosion chamber. To form a gas cloud, a plastic sheet was wrapped around the explosion chamber, and gas was injected to confirm the explosion target concentration. In Step 3, safety was verified in the environment around the explosion, and data logs and images were obtained. All preparations were verified, and the spark plug was ignited. Step 4 was the post-explosion process to check the pressure data storage status, check the safety of the explosion chamber and equipment, turn off the power, and end the explosion test. Step 5 was the case in which no explosion occurred: the power of all devices was cut off, the exhaust port was opened, and the trapped gas was discharged to the atmosphere.

Table 2.
Explosion experiment scenarios.
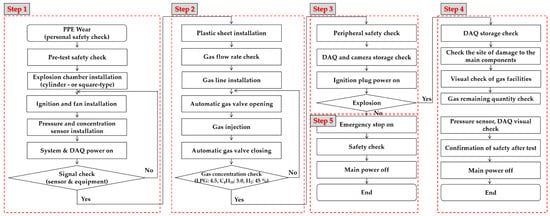
Figure 7.
Flow chart of explosion test.
3. Results and Discussion
3.1. Explosion Test of Cylinder-Type Chamber
The explosion test of the cylinder-type chamber was performed at least three times for each scenario. More than 36 explosion experiments were performed. Figure 8 summarizes the data on internal pressure in each scenario.
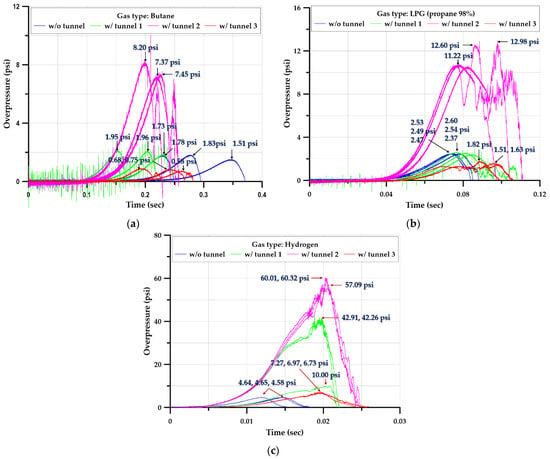
Figure 8.
Time–pressure profiles inside the chamber (cylinder-type) with and without tunnels; (a) Butane, (b) LPG (propane 98%), (c) Hydrogen.
Figure 8 illustrates the time–pressure relationship measured inside the explosion chamber, as an average of three tests performed under the same conditions, for butane, LPG (propane 98%), and hydrogen. In the Figure 9, L/L0 represents the ratio of the length of the ventilation tunnel (L = 1.0, 2.0, 3.0 m) to the length of the explosion chamber (L0 = 0.5 m). For each gas, the average value of the maximum overpressure inside the chamber for the explosion chamber and tunnel combination was obtained. For the hydrocarbon-based gases (LPG (propane 98%) and butane), the pressure values at length ratios of 0 and 2.0 of the explosion chamber and tunnel (L/L0) were similar. When the length ratio was 4.0, the pressure rose to its highest value; when the length ratio was 6.0, the pressure was smaller than that of the length ratio of 0. Similarly, in the case of hydrogen, the pressure rose as the length ratio increased to 4.0, then decreased until a length ratio of 6.0. Quantitatively, the maximum overpressure of hydrogen gas was more strongly influenced by the length ratio of the ventilation tunnel than were those of hydrocarbon-based gases.
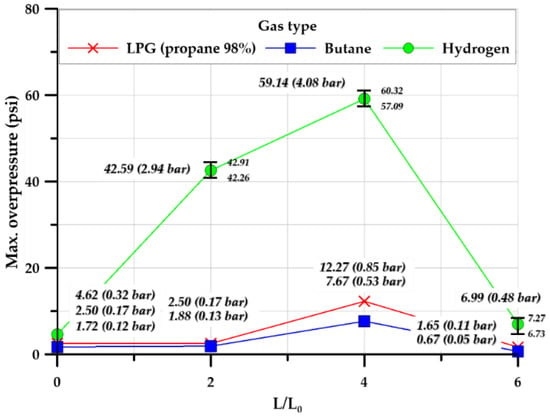
Figure 9.
Maximum overpressure inside the cylinder-type chamber.
Figure 10 illustrates the ratio of the maximum external explosion overpressure to the maximum overpressure (P/P0, %) for each combination of the explosion chamber and tunnel for each gas. For all gases, the internal maximum overpressure was higher than the external maximum overpressure. For the hydrocarbon-based gases, the pressure ratios were all similar irrespective of the explosion chamber–tunnel length ratio; however, for hydrogen gas, the pressure ratio increased considerably when the ventilation tunnel was installed (i.e., it was much greater for length ratios L/L0 = 2, 4, 6 than for L/L0 = 0).
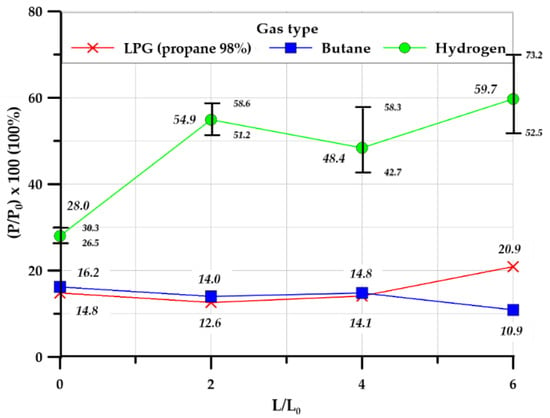
Figure 10.
Pressure ratio (P/P0, %) in the cylinder-type chamber.
Figure 11 shows the shape of the plastic sheet after all explosion tests, as captured by a high-speed camera. When ignition occurred after gas injection, the plastic sheet expanded because of the increase in gas pressure inside the explosion chamber, and the explosion pressure was transmitted to the atmosphere because of the plastic sheet rupture. In this process, the hydrocarbon-based and hydrogen gases exhibited different plastic sheet rupture shapes; thus, the difference in pressure measured from the outside was confirmed.
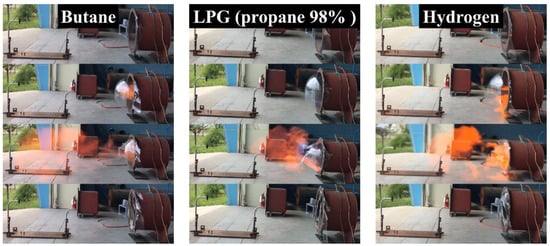
Figure 11.
Explosion process in the cylinder-type chamber.
As shown in Figure 12, when the hydrocarbon gases expanded and ruptured the plastic sheet, the explosion pressure was transmitted to the outside through the center of the plastic sheet. However, when the hydrogen gas expanded and ruptured the plastic sheet, the explosive pressure was transmitted to the outside through the front surface of the plastic sheet. Without a ventilation tunnel, the pressure was spread throughout the area at the same time as the ruptured plastic sheet expanded because of the explosion overpressure of hydrogen and the high heating value (temperature). In contrast, with a ventilation tunnel, the explosive overpressure that dispersed into the atmosphere was transmitted along the tunnel, which was a result of the high pressure as measured by the external pressure sensor. However, for the hydrocarbon-based gases, the ruptured plastic sheet expanded during explosion, and the explosion overpressure was intensively discharged through the central portion of the ruptured plastic sheet.
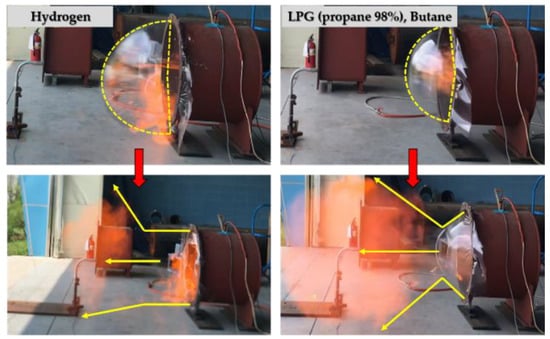
Figure 12.
Explosive shape of plastic sheet (hydrocarbon versus hydrogen).
Figure 13a displays the plastic sheet rupture shape and area in the case without a tunnel. After the explosion test in the case with a tunnel, the plastic sheet ruptured because it was melted by the heat inside the chamber. As shown in Figure 13b, hydrocarbon-based combustible gases (LPG (propane 98%) and butane) exhibited an average rupture area of 607 and 234 cm2, respectively, and hydrogen exhibited an average rupture area of 1073 cm2.
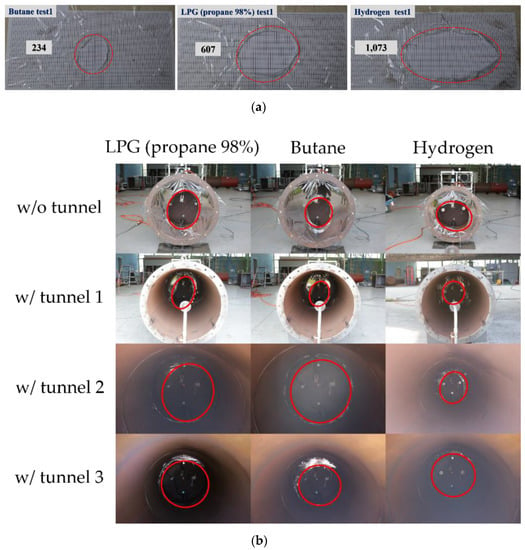
Figure 13.
Plastic sheet rupture shapes during the explosion test with and without tunnels; (a) Plastic sheet rupture shapes without tunnels, (b) Plastic sheet rupture shape with tunnels.
Therefore, higher internal and external pressures were obtained for hydrogen than for the hydrocarbon-based combustible gases through the rupture area. A similar level of explosion overpressure was measured without a tunnel because of the explosion process and rupture shape of the plastic sheet. The thickness of the plastic sheet was also a major factor in the explosion test.
Table 3 presents the width of the rupture shape for each gas in the absence of a tunnel. On average, the rupture was two to four times wider for hydrogen than for the hydrocarbon gases.

Table 3.
Plastic sheet rupture shape areas for the cylinder-type chamber without tunnels.
Figure 14a,b illustrates the rising time and duration against maximum overpressure, which are important characteristics indicating the behavior of the explosion load profile for each gas. The rising time is the time from the occurrence of overpressure until the maximum overpressure is reached. As the rising time is related to the load speed, it affects the strain rate of the structure subjected to the explosive load. The duration is a variable that affects the extent of impact generated by the explosive load. To ensure test usability and repeatability, the tests were performed three times for each case, and the average values of the rising time and duration were obtained. The rising time and duration increased in the order: hydrogen < LPG (propane 98%) < butane regardless of whether or not a ventilation tunnel was in place. For LPG (propane 98%) and hydrogen the rising time and duration were not strongly influenced by the length ratio of the explosion chamber and tunnel, whereas for butane these values increased as the length ratio of the explosion chamber and tunnel increased.
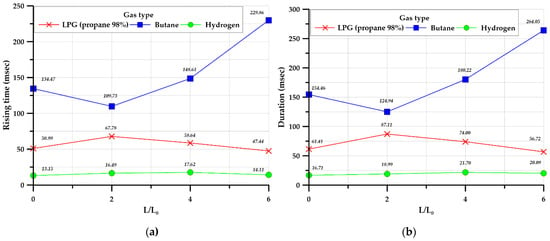
Figure 14.
Average of rising time (a) and duration (b) in the cylinder-type chamber.
Impulse is defined as the energy generated by an explosion, unlike the overpressure, which is defined in terms of load. Impulse is an important design parameter for structures under impact loads. From the time–pressure relationship graph, impulse can be calculated by integrating pressure with respect to time. Czujko [29] expressed this calculation in the following formula:
where I is the impulse, P(t) is the pressure as a function of time; the impulse increases as P(t) increases with duration and time.
Figure 15 illustrates the average value of the impulse for three identical experiments. Hydrogen tended to a higher value than those of the hydrocarbon-based gases. Depending on the length ratio of the explosion chamber and tunnel, both groups of gases exhibited a high amount of impulse at a length ratio of 4.0, and the highest explosive overpressure was measured for all gases at this length ratio. The hydrocarbon-based gases had a longer duration than that of hydrogen gas. The reduction in the impulse of all gases at a length ratio of 6.0 was due to the reduction in the maximum explosion overpressure.
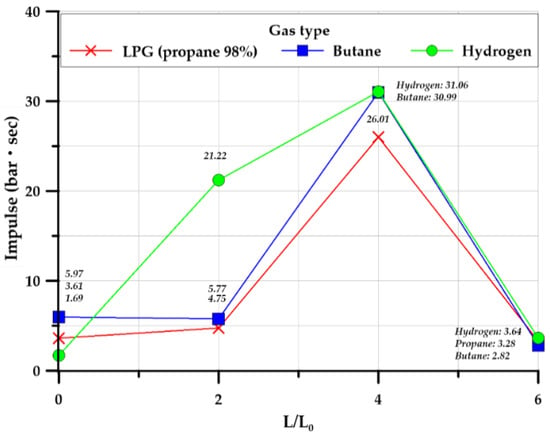
Figure 15.
Average of impulse in the cylinder-type.
These results demonstrated that hydrogen had shorter rising time and duration than those of hydrocarbon-based gases, and it exhibited a higher impulse because the maximum overpressure was higher than that of hydrocarbon-based gases. Therefore, an important aspect of hydrogen gas in designing structures is that it has a short rising time and duration but exerts an instantaneous impact on the structure because of a high explosive overpressure. Conversely, hydrocarbon-based combustible gases have long rising time and duration but sustained impact due to the relatively low explosion overpressure.
3.2. Explosion Test of Square-Type Chamber
The explosion experiment in the square-type chamber was performed at least three times for all but one scenario. In the case of a length ratio of 6, the experiment was performed only once because of the breakage of the external observation window and the deformation of the additional iron plate. Overall, 36 experiments were performed. Figure 16 summarizes the data on the internal pressure–time relationship in each scenario.
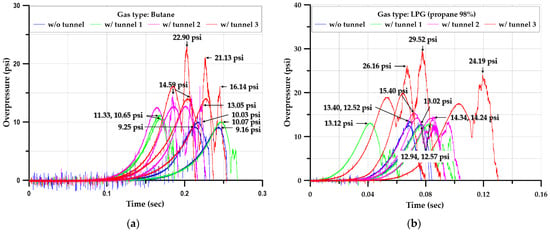
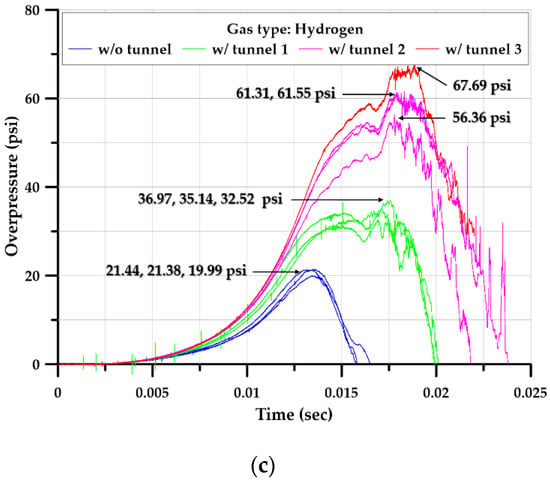
Figure 16.
Time–pressure profiles inside the square-type chamber with and without tunnels; (a)Butane, (b) LPG (propane 98%), (c) Hydrogen.
Figure 17 illustrates the maximum explosion overpressure inside the square-type explosion chamber. Expectedly, the maximum overpressure of all gases increased as the length ratio of the explosion chamber and tunnel increased. However, the increase in hydrogen overpressure was larger than that of the hydrocarbon-based gases. The square-type chamber transmitted the pressure from the inside of the explosion chamber to the area and corners, and the reflected pressures were weighted together and discharged into the atmosphere through the chamber and tunnel. This is in contrast to the cylindrical chamber, in which the pressure was transmitted along the curved surface of the wall. Therefore, the reflected pressure was greater in the square-type chamber.
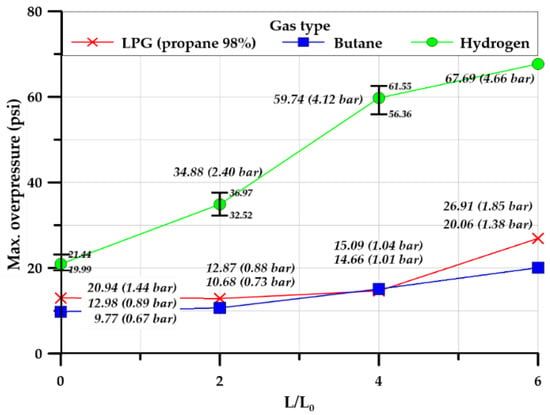
Figure 17.
Maximum overpressure in the square-type chamber.
Figure 18 illustrates the pressure ratio between the external maximum and internal maximum overpressures. The hydrocarbon-based gases differed only slightly in the pressure ratio depending on the length ratio of the explosion chamber and the tunnel, and the external maximum overpressure was lower than the internal maximum overpressure. However, in the case of hydrogen, when the length ratio of the explosion chamber and the tunnel was 2, the pressure ratio increased considerably to over 70%, before decreasing when the length ratio was increased further.
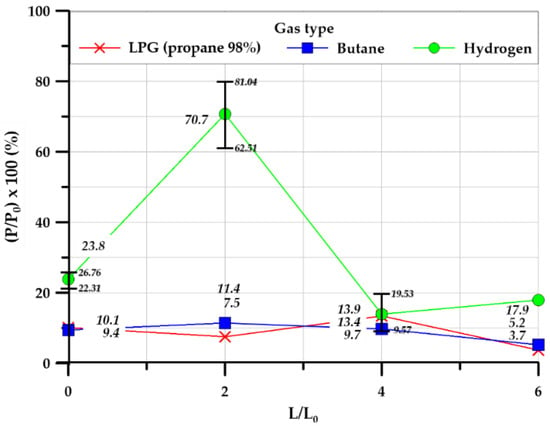
Figure 18.
Pressure ratio in the square-type chamber.
Figure 19 illustrates the shape of the plastic sheet after the explosion test for all explosion tests, as captured by a high-speed camera. A similar explosion process to that of the cylinder-type chamber was observed.
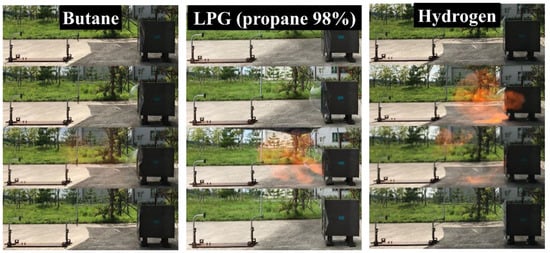
Figure 19.
Explosion process in the square-type chamber.
The rupture shape of the plastic sheet was observed after the explosion test in the square-type chamber. As shown in Figure 20a, rupture areas of 531, 458, and 896 cm2 for butane, LPG (propane 98%), and hydrogen, respectively, were observed. This observation was judged to result from the same cause as that of the cylinder-type explosion test. Figure 20b illustrates the rupture shape of the plastic sheet after the tunnel test, which was similar to that of the cylindrical explosion test. Figure 20c shows that the observation window installed on the side was broken to check the explosion progress.
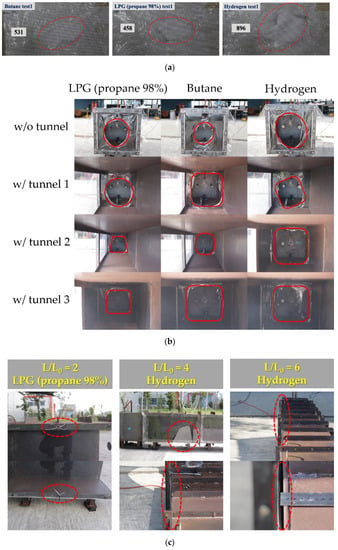
Figure 20.
Plastic sheet rupture shapes during the explosion test with and without tunnels and broken observation window; (a) Plastic sheet rupture shape after explosion test without tunnel, (b) Plastic sheet rupture shape after explosion test without tunnel, and (c) Breakage of observation window after test.
To visualize the explosion progress, the 10 mm thick polycarbonate window installed along the tunnels was damaged as it could not withstand the explosion pressure. When the experiment was conducted using a steel plate of the same thickness, the steel plate was also deformed. In the case of the square-type, the explosion pressure was transmitted from the explosion chamber along each side of the tunnel, and the pressure waves on each side were reflected to form an increased total pressure, as shown in Figure 20c.
Table 4 presents the width of the rupture shape for each gas in the absence of a tunnel. On average, the rupture was 1.5 to 2 times larger for hydrogen than for the hydrocarbon gases.

Table 4.
Plastic sheet rupture shape areas for the square-type chamber without tunnels.
Figure 21a,b illustrates the average values of the rising time and duration time for three identical explosion experiments.
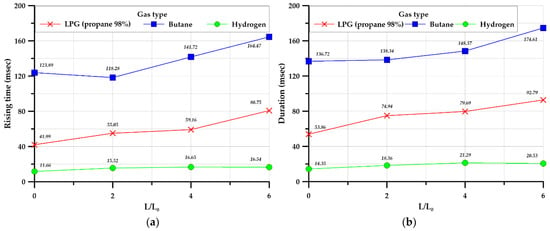
Figure 21.
Average rising time (a) and duration (b) in the square-type chamber.
Butane had the longest rising time and duration, followed by LPG (propane 98%), and hydrogen, in decreasing order. A structure that can act as a tunnel in the process of explosion and flame propagation induces turbulence and accelerates the flame propagation speed. Therefore, the flame propagation speed increased as the tunnel length increased, and the maximum overpressure increased as well.
Figure 22 illustrates the average value of the impulse for three identical experiments. For all gases, as the length ratio of the explosion chamber and tunnel increased, the impulse also increased. The impulse was closely related to the duration and maximum overpressure. Butane, which had a relatively long rising time and duration, exhibited a larger impact than that of hydrogen, which had a significantly higher maximum overpressure.
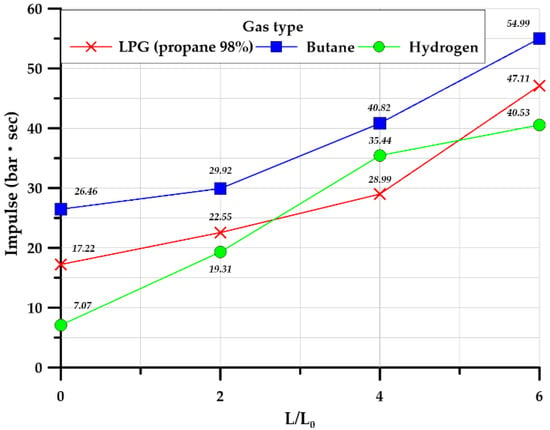
Figure 22.
Average impulse in the square-type chamber.
Table 5 summarizes the average values of the maximum overpressure, rising time, duration, and impulse for all experiments performed in this study.

Table 5.
Summary of explosion characteristics obtained experimentally (LPG (propane 98%); C4H10: butane; H2: hydrogen).
3.3. Discussion
3.3.1. Overpressure
In the case of cylinder type, the internal overpressure was observed for both hydrocarbon and hydrogen gases increases up to 4.0 of the length ratio, and in the case of 6.0 of length ratio, the internal overpressure tends to decrease in all gases (Figure 9).
The internal overpressure is a sensitive characteristic for hydrogen gas. In the case of up to length ratio 4.0, the overpressures were increased about 8 times and more than 12 times compared to length ratio 0.0, depending on the tunnel length ratio. It can be explained by observing the rise time of hydrogen gas explosion load profiles. As shown in Figure 14a, hydrogen gas has a considerably faster reaction rate by explosion than hydrocarbon-based gas, and the rise time is longer than 3 or 4 m sec, resulting in an increase in internal explosion overpressure. Furthermore, it is possible to explain that the specific tunnel length affects the pressure rise in the explosion chamber due to the kinematic shape up to 4.0 of the tunnel length ratio. In addition, it is estimated that the low internal explosion overpressure for all gases at tunnel length ratio 6.0 has similar characteristics to the transmission of the explosion overpressure to the atmosphere as if there is no tunnel at length ratio 6.0 or more.
In the case of square shape, it can be confirmed that the internal explosion overpressure continues to rise with respect to the tunnel length ratio. As the tunnel length ratio increases, it is analogized that the maximum overpressure is increased by increasing the flame propagation speed due to the turbulence generated inside the tunnel. The different tendency overpressure compared to the cylindrical shape was observed in the test results due to the geometrical shape of the explosion chamber and the tunnel. The internal explosion overpressures measured larger than for the cylinder tunnel, which can be explained by the internal pressure causing transfer to the side of the rectangular shape tunnel (Figure 20c).
3.3.2. Explosion Chamber Type
The explosion chamber geometry (cylindrical and square) was analyzed. As butane and LPG (propane 98%) showed similar trends, the LPG (propane 98%) case was analyzed. The cylindrical and square explosion chambers showed distinct characteristics.
As shown in Figure 23a, the average overpressure of the square explosion chamber was 12.98 psi, which was more than five times that of the cylindrical explosion chamber (2.49 psi). The formation of different explosion overpressures in explosion chambers with different shapes but the same volume (V = 0.149 m3) and cross-sectional area (A = 0.28 m2) can be attributed to chamber shape, because the flows inside the cylindrical and square explosion chambers had the same geometrical cross-sectional area. The cylindrical explosion chamber was ignited at the center and explosion overpressure occurred in all internal areas.
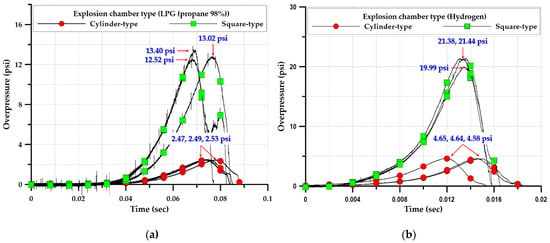
Figure 23.
Comparison of explosion overpressure for explosion chamber geometry; (a) LPG (propane 98%), (b) Hydrogen.
During the discharge process, the explosion overpressure proceeded smoothly along the inner side of the curved surface of the cylindrical chamber, whereas in the square explosion chamber, the explosion overpressure proceeded along the inner side of corners and flat surfaces. The explosion overpressure in the square chamber was greater than that in the cylindrical chamber, because the overpressure was reflected and superimposed on the inner surface of the square chamber, promoting turbulence formation. In addition, as shown in Figure 23a,b, the two types of explosion chambers had the same cross-sectional area (As_c and Ac_c = 0.006 m2) and volume (Vs_c and Vc_t = 0.003 m3) but dissimilar lengths. The square chamber had lengths of 263 and 372 mm from the center to the edge and corner, respectively, whereas the cylindrical chamber had a uniform radius of 297 mm. Thus, the explosion pressure increased owing to the flame propagation speed and turbulence caused by the difference in lengths from the center to the inner surface and corners.
Hydrogen also exhibited explosion characteristics. It formed a higher explosive overpressure than hydrocarbon gases. Figure 24b shows the explosion overpressure for hydrogen. The average explosion overpressure of the square explosion chamber was 20.9 psi, which was 4.5 times that of the cylindrical explosion chamber (4.6 psi). In addition, during the experiment, the observation window on the side of the square chamber was damaged owing to the geometry-induced increase in the explosion overpressure, as the surface of the square explosion chamber was at right angles to the internal environment.
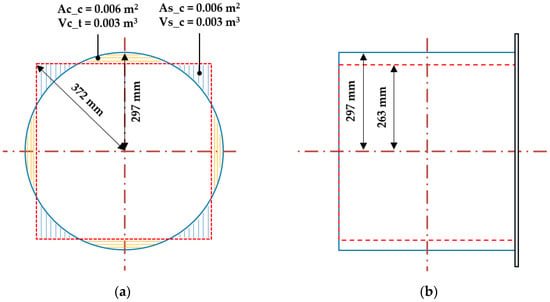
Figure 24.
Differences in geometrical cross-sectional area region and plane section length between the cylindrical and square chambers; (a) Cross-section area comparison, (b) Plane-section length comparison.
Furthermore, although reproducibility was assured by conducting three repeated experiments for each scenario, deviation is likely to have occurred due to uncertainty about environmental variables (temperature, humidity, etc.).
3.3.3. Effect of Tunnel Length
The effect of tunnel length for cylinder-type tunnel and hydrocarbon-based gases produced similar overpressures values (Figure 10) at the internal and external measurement points. However, it was confirmed that for hydrogen gas the external explosion overpressure was high similar to the way the internal pressure increased. When ignition and explosion occurred, the explosion overpressure discharged to the outside was also large due to a faster reaction than hydrocarbon-based gas.
The square shape showed a different trend from the cylindrical shape. It was observed that the hydrocarbon-based gas showed a similar value for various tunnel length ratios, while hydrogen showed a maximum value at a tunnel length ratio of 2.0 and decreased for greater length ratios (Figure 18). This is analogized to be the main result of the square geometric shape. At length ratio 2.0, the explosion overpressure inside the explosion chamber and tunnel is concentrated to one point outside, but as the length of the tunnel increased, the explosion overpressure discharged to the outside was dispersed into the atmosphere. Furthermore, it can be explained that the reason for decreasing internal overpressure was due to breakage and deformation of the side observation window and the steel plate, which occurred during the experiment. This also reduced the external explosion overpressure (Figure 20c).
3.3.4. Rising and Duration Times
Overall, hydrocarbon-based gas has longer rise and duration times than hydrogen gas. Hydrogen has a relatively shorter rise and duration time than hydrocarbon-based gases, but can cause instantaneous deformation of structures due to large explosive overpressure. This is one of the critical parameters for the structural design point of view.
In addition, rise and duration times are the unique characteristics of each gas, so it is judged that special attention is required when handling hydrogen gas.
3.3.5. Impulse
The damage potential of an explosion wave depends on both the overpressure and impulse. The impulse characteristic is an important parameter of hydrogen gas explosion for structural safety design, which is defined as the area under the positive phase of the pressure versus time curve (Figure 1).
The impulse of all gases was measured to be largest at a length ratio of 4.0 for the cylinder type. Hydrocarbon-based gases are observed a similar impulse values except at a tunnel length ratio of 4.0. However, the impulse of hydrogen gas was increased to 4.0 of the length ratio and decreased at 6.0. It can be explained that internal overpressure was measured at a high value for a length ratio up 4.0; therefore, this overpressure closely affects the increasing impulse value. Additionally, this is judged to be the characteristic of the hydrogen gas and the effect of cylindrical shape due to blast wave velocity.
In the case of the square shape, different impulse values were observed when compared with the cylinder shape. It can be seen that the amount of impulse continues to increase as the tunnel length ratio increases, as shown in Figure 22. This is judged to be caused by a characteristic of the square-shaped explosion tunnel. This can be explained by observing that all gases are delivered to the high-pressure side and edge on the wall of the square tunnel, owing to the unequal rectangular section shape and the induced stagnation area when compared with a cylinder shape. Therefore, the occurrence of highly internal overpressure led to damage along the edge of tunnel structures, as shown in Figure 20c.
According to the experimental results of the square type, the current maximum length ratio was observed up to 6.0 for the continuous increase in terms of impulse and overpressure. It seems to be a limited length ratio of the present test tunnels.
If the tunnel length is 6 or more, it would be expected to increase and then decrease similar to the cylindrical shape. Therefore, further experimental and numerical study is necessary for the future and should be carried out.
The impulse for hydrocarbon-based gas is observed to be higher than for hydrogen gas. Although the internal overpressure is higher than hydrogen, the duration time is relatively long, thus a higher impulse load was calculated. This phenomenon should be considered when determining the design explosion load, such as for altered and/or refurbished facilities, when converting from hydrocarbon gas to hydrogen gas, or vice versa.
4. Conclusions and Remarks
To investigate the explosion characteristics of hydrogen, which has attracted attention as a clean energy in the shipbuilding field, two types of explosion chambers (cylinder- and square-type) and ventilation tunnels were manufactured to conduct experiments. The following conclusions were drawn by comparing the experimental results for hydrogen, butane, and LPG (propane 98%):
- (1)
- The rupture shape varied depending on the type of combustible gas. This yielded different results from general experimental techniques because of the variable area on which the pressure was applied.
- (2)
- Hydrogen produced a shorter rising time and duration than the hydrocarbon-based gases considered; however, the explosive overpressure was higher than that of the hydrocarbon-based gases.
- (3)
- According to the conventional view, in a tunnel in which the explosion overpressure can move following an explosion in the explosion chamber, the explosion overpressure tends to increase as the tunnel length–explosion chamber length ratio increases. However, in the case of the cylindrical shape in this study, the pressure inside the explosion chamber was highest at a 4.0 length ratio, but the lowest explosion overpressure was observed at a length ratio of 6.0. For the square-type explosion chamber, as the length ratio increased, the internal explosion overpressure tended to increase. Butane, which had a relatively long duration, showed the highest impact. For a tunnel structure in which shock waves and flames can propagate after an explosion-induced structural rupture, the maximum overpressure and impact of the explosion increase, and the rising time and duration tend to be maintained or decreased as a function of explosion safety based on the design parameters of tunnel geometry.
- (4)
- To utilize hydrogen as a fuel for ships, it is necessary to consider a safety design based on hydrogen explosion load profiles to prevent structural damage, loss of property, and threat to human life. These experimental results are especially useful for developing new hydrogen fuel ship codes and design guidance against the existing IGF and IGC.
- (5)
- This study aimed to confirm the characteristics of internal and external pressures during explosions in cylindrical and square exhaust vents. The results can serve as a reference for structural designs of validation tunnels and surrounding ship structures considering the explosion characteristics of exhaust ports. The study also aimed to establish an experimental database to guide the estimation of the length of validation tunnels through analysis of the effects of tunnel length on the pressure characteristics at the end of the tunnels. Using CFD and experimental investigations, future research should investigate the explosion-proof characteristics of the fire-extinguishing area to develop measures to reduce explosion-induced damage.
Author Contributions
Conceptualization, J.K.S. and J.H.K.; methodology, S.W.P., J.H.K. and J.K.S.; formal analysis, S.W.P.; investigation, S.W.P. and J.K.S.; resources, S.W.P.; data curation, S.W.P.; writing—original draft preparation, S.W.P.; writing—review and editing, J.K.S.; visualization, S.W.P.; supervision, J.K.S.; project administration, J.K.S.; funding acquisition, J.H.K. All authors have read and agreed to the published version of the manuscript.
Funding
This study was a part of the project entitled ‘Development of guidance for prevent of leak and mitigation of consequence in hydrogen ships’, funded by the Ministry of Oceans and Fisheries, Korea.
Institutional Review Board Statement
Not applicable.
Informed Consent Statement
Not applicable.
Data Availability Statement
The data presented in this study are available on request from the corresponding author.
Conflicts of Interest
The authors declare no conflict of interest.
References
- Wähner, A.; Gramse, G.; Langer, T.; Beyer, B. Determination of the minimum ignition energy on the basis of a statistical approach. J. Loss Prev. Process Ind. 2013, 26, 1655–1660. [Google Scholar] [CrossRef]
- Le, H.; Liu, Y.; Mannan, M.S. Lower flammability limits of hydrogen and light hydrocarbons at sub-atmospheric pressures. Ind. Eng. Chem. Res. 2013, 52, 1372–1378. [Google Scholar] [CrossRef]
- Kuznetsov, M.; Kobelt, S.; Grune, J.; Jordan, T. Flammability limits and laminar flame speed of hydrogen-air mixtures at subatmospheric pressures. Int. J. Hydrogen Energy 2012, 37, 17580–17588. [Google Scholar] [CrossRef]
- Piqueras, C.M.; García-Serna, J.; Cocero, M.J. Estimation of lower flammability limits in high-pressure systems. Application to the direct synthesis of hydrogen peroxide using supercritical and near-critical CO2 and air as diluents. J. Supercrit. Fluids 2011, 56, 33–40. [Google Scholar] [CrossRef]
- Zlochower, I.A.; Green, G.M. The limiting oxygen concentration and flammability limits of gases and gas mixtures. J. Loss Prev. Process Ind. 2009, 22, 499–505. [Google Scholar] [CrossRef]
- Wierzba, I.; Kilchyk, V. Flammability limits of hydrogen carbon monoxide mixtures at moderately elevated temperatures. Int. J. Hydrogen Energy 2001, 26, 639–643. [Google Scholar] [CrossRef]
- Shrestha, S.O.B.; Wierzba, I.; Karim, G.A. Prediction of the extent of diluents concentrations in flammability limited gaseous fuel-diluent mixtures in air. Appl. Therm. Eng. 2009, 29, 2574–2578. [Google Scholar] [CrossRef]
- Li, G.; Wu, J.; Wang, S.; Bai, J.; Wu, D.; Qi, S. Effects of gas concentration and obstacle location on overpressure and flame propagation characteristics of hydrocarbon fuel-air explosion in a semi-confined pipe. Fuel 2021, 285, 119268. [Google Scholar] [CrossRef]
- Bauwens, C.R.; Chaffee, J.; Dorofeev, S.B. Vented explosion overpressures from combustion of hydrogen and hydrocarbon mixtures. Int. J. Hydrogen Energy 2011, 36, 2329–2336. [Google Scholar] [CrossRef]
- Mukhim, E.D.; Abbasi, T.; Tauseef, S.M.; Abbasi, S.A. A method for the estimation of overpressure generated by open air hydrogen explosions. J. Loss Prev. Process Ind. 2018, 52, 99–107. [Google Scholar] [CrossRef]
- Bao, Q.; Fang, Q.; Zhang, Y.; Chen, L.; Yang, S.; Li, Z. Effects of gas concentration and venting pressure on overpressure transients during vented explosion of methane–air mixtures. Fuel 2016, 175, 40–48. [Google Scholar] [CrossRef]
- Li, P.; Huang, P.; Liu, Z.; Du, B.; Li, M. Experimental study on vented explosion overpressure of methane/air mixtures in manhole. J. Hazard. Mater. 2019, 374, 349–355. [Google Scholar] [CrossRef] [PubMed]
- Cao, Y.; Wang, Y.; Song, X.; Xing, H.; Li, B.; Xie, L. External overpressure of vented hydrogen-air explosion in the tube. Int. J. Hydrogen Energy 2019, 44, 2343–32350. [Google Scholar] [CrossRef]
- Zhu, Y.; Wang, D.; Shao, Z.; Zhu, X.; Xu, C.; Zhang, Y. Investigation on the overpressure of methane-air mixture gas explosions in straight large-scale tunnels. Process Saf. Environ. Prot. 2020, 135, 101–112. [Google Scholar] [CrossRef]
- Liu, C.; Liao, Y.; Yang, W.; Yin, Y.; Wang, Y.; Cui, G.; Li, Y. Estimation of explosion overpressure associated with background leakage in natural gas pipelines. J. Nat. Gas Sci. Eng. 2021, 89, 103883. [Google Scholar] [CrossRef]
- Meng, Q.; Wu, C.; Li, J.; Wu, P.; Xu, S.; Wang, Z. A study of pressure characteristics of methane explosion in a 20 m buried tunnel and influence on structural behaviour of concrete elements. Eng. Fail. Anal. 2021, 122, 105273. [Google Scholar] [CrossRef]
- Li, Z.; Chen, L.; Yan, H.; Fang, Q.; Zhang, Y.; Xiang, H.; Liu, Y.; Wang, S. Gas explosions of methane-air mixtures in a large-scale tube. Fuel 2021, 285, 119239. [Google Scholar] [CrossRef]
- Wang, C.; Guo, J.; Zhang, K.; Du, S.; Chen, H.; Yang, F. Experiments on duct-vented explosion of hydrogen–methane–air mixtures: Effects of equivalence ratio. Fuel 2022, 308, 122060. [Google Scholar] [CrossRef]
- Chen, Y.; Zhang, Q.; Li, M.; Yuan, M.; Wu, D.; Qian, X. Experimental study on explosion characteristics of DME-blended LPG mixtures in a closed vessel. Fuel 2019, 248, 232–240. [Google Scholar] [CrossRef]
- Lee, T.S.; Sung, J.Y.; Park, D.J. Experimental investigations on the deflagration explosion characteristics of different DME–LPG mixtures. Fire Saf. J. 2012, 49, 62–66. [Google Scholar] [CrossRef]
- Zhang, Q.; Li, D. Comparison of the explosion characteristics of hydrogen, propane, and methane clouds at the stoichiometric concentrations. Int. J. Hydrogen Energy 2017, 42, 14794–14808. [Google Scholar] [CrossRef]
- Li, D.; Zhang, Q.; Ma, Q.; Shen, S. Comparison of explosion characteristics between hydrogen/air and methane/air at the stoichiometric concentrations. Int. J. Hydrogen Energy 2015, 40, 8761–8768. [Google Scholar] [CrossRef]
- Wang, X.; Wang, C.; Fan, X.; Guo, F.; Zhang, Z. Effects of hydrogen concentration and film thickness on the vented explosion in a small obstructed rectangular container. Int. J. Hydrogen Energy 2019, 44, 22752–22759. [Google Scholar] [CrossRef]
- Sato, Y.; Iwabuchi, H.; Groethe, M.; Merilo, E.; Chiba, S. Experiments on hydrogen deflagration. J. Power Sources 2006, 159, 144–148. [Google Scholar] [CrossRef]
- Witkowski, A.; Rusin, A.; Majkut, M.; Stolecka, K. Analysis of compression and transport of the methane/hydrogen mixture in existing natural gas pipelines. Int. J. Press. Vessels Piping 2018, 166, 24–34. [Google Scholar] [CrossRef]
- Eckhoff, R.K. Explosion Hazard in the Process Industries, 1st ed.; Gulf Publishing Company: Houston, TX, USA, 2005; p. 27. [Google Scholar]
- Sochet, I. Blast effects of external explosions. In Eighth International Symposium on Hazards, Prevention, and Mitigation of Industrial Explosions; HAL Open Science: Yokohama, Japan, 2010; p. hal-00629253. [Google Scholar]
- PCB PIEZOTRONICS. Available online: https://www.pcb.com/ (accessed on 3 February 2022).
- Czujko, J. Design of Offshore Facilities to Resist Gas Explosion Hazard, 1st ed.; CorrOcean ASA: Sandvika, Norway, 2001. [Google Scholar]
Publisher’s Note: MDPI stays neutral with regard to jurisdictional claims in published maps and institutional affiliations. |
© 2022 by the authors. Licensee MDPI, Basel, Switzerland. This article is an open access article distributed under the terms and conditions of the Creative Commons Attribution (CC BY) license (https://creativecommons.org/licenses/by/4.0/).