1. Introduction
During its useful life, the breakwater is visited by hundreds of storms (sequences of sea states defined by the statistical descriptors of water depth, h, significant wave height, HsI, peak wave period, Tp, wave direction and persistence). The function and behavior of these maritime structures against random sequences of storms determines their deterioration and ageing and, eventually, their destruction. This knowledge is essential to estimate the total lifetime costs of the structure, including the costs of maintenance, when, how much and how, the occasional costs of repair or reconstruction. In the 21st century this way of working is applied in most branches of engineering including civil engineering. Exceptions to this working trend are few; one of them is in the design of slope breakwaters to protect harbor and coastal areas.
The Rock Manual [
1] focuses on the analysis of the ultimate limit state failure modes, which produce the collapse of the structure. The classical approach to study them usually involves the use of extreme value theory and fits an extreme probabilistic model to the annual maximum significant wave height or to the peaks over a given threshold (POT). Recently, National Academies of Sciences, Engineering, and Medicine (NAE) of the USA summarized this new conceptual frame in [
2], and recommends developing infrastructure strategy that includes:
Asset management, make risk-informed decisions about investments based upon understanding the conditions and consequences of failure of assets;
Life cycle portfolio management, look at servicing the portfolio in terms of systems and the interrelationships and interoperability across those systems;
Alternative financing, focus on investments that will achieve an outcome over time.
In Spain that functional scheme is collected in the Recommendations for Maritime Structures (ROM) ROM 1.1 [
3], which was developed from ROM 0.0 [
4], PIANC [
5], and the research of Melby and Kobayashi [
6,
7], Solari and Losada [
8], Solari and Van Gelder [
9], Castillo et al. [
10,
11], Mínguez et al. [
12], Lira-Loarca et al. [
13], Cobos et al. [
14], among others.
The design of a breakwater must meet the project requirements and predict the consequences of non-compliance considering the total costs of the infrastructure. To achieve this objective, calculation tools, experiments and models are needed to represent the breakwater performance over its useful life; in particular, to calculate the value of the significant wave height threshold, which is related to the minimum admissible damage of a sea state, and to simulate the temporal evolution of storms to account for the damage progression [
3].
In practical coastal engineering, the stability of rock armored mound structures (revetments, dikes, and breakwaters), is verified by applying semi-empirical formulas. The formal structure of most of them is based on the Van der Meer formula [
15]. The formulas obtained are derived from experiments tested with very specific test conditions, experimental device, and methods. Losada [
16] reanalyzed the experimental data of Van der Meer [
15] following the classical dimensional analysis method. In this work, Losada addressed some open questions on the uncertainty and the total cost investment of coastal structures design with the Van der Meer laboratory-based formula. Specifically, he questioned (1) the role of the relative water depth
h/
L on the damage evolution,
Sd, under a sea state; (2) the interplay of
h/
L, and wave steepness
HsI/
L determined at the toe of the structure, on damage evolution; and (3) the dependence of damage evolution,
Sd, including the initiation of damage and destruction on the experimental design and technique. On the other hand, experimental data show that the slope angle is differentially involved in the damage evolution. Finally, Losada [
16] showed that the Van der Meer formula does not adequately replicate the experimental damage level, especially when it grows, i.e., when it is necessary to decide whether to repair or not the structure.
In a recent work, Van der Meer [
17] revisited his formula and confirmed his original structure based on the same experimental data obtained to propose his formula in 1987 [
15]. He maintained the two expressions (Equations (1) and (2) of [
17]) depending on whether the waves break in surging or plunging, and the Iribarren number, or surf similarity or breaker parameter,
ξμ, is the main independent parameter, defining the wave steepness as the quotient between the significant wave height at the toe of the breakwater and the wavelength at deep water,
L0. Lastly, he proposed a global stability parameter to facilitate the graphic application of this global parameter and the breaker parameter (
ξm). Van der Meer [
17] called for caution not to apply the formula outside its area of validity. Despite these precisions and the desire to maintain a single formula (with two expressions), the elaboration of the formula relies on some hypotheses and assumptions that are not met by the original experimental data itself.
A similar methodology was followed in the study of the stability and design of berm breakwaters (Burcharth [
18], Ehsani et al. [
19] and Mostaghiman and Moghim [
20], among others), with the proposal of a non-dimensional stability parameter applied to statically stable or hardly/partly reshaping berm breakwaters. The fact that this type of breakwater allows damage progression, coupled with the extensive amount of material required for its construction, claims to apply optimization techniques for their design following present research.
Hence, the aim of this work is to analyse the epistemic uncertainty of the Van der Meer formula predicting the progression of damage and to discuss its repercussion on the investment cost of the coastal structure in its useful life.
This study is organized as follows.
Section 2 gathers the revision of the Van der Meer formula [
15,
17] for damage progression, which includes the selection of the main non-dimensional variables and parameters of its formula, the experimental design, data and method, and the limitations that he introduced in his revisited paper [
17].
Section 3 reanalyzes the formula of Van der Meer according to the dimensional analysis and the interplay of the relative water depth
h/
L and the wave steepness
HsI/
L (both at the toe of the structure) in the progression of damage. The conclusions of this work are set out in
Section 4.
2. Background, Proposal, and Validation of Van der Meer Stability Formula (1988, 2021)
The foundations of the stability formula for slope breakwaters can be found in the works of Iribarren and Nogales [
21], Hudson [
22], Ahrens and McCartney [
23], Bruun and Günbak [
24], Losada and Giménez-Curto [
25,
26] and, mainly, in Battjes [
27].
Battjes [
27] concluded that “variations in the flow regime on a slope are brought about mainly by variations of
α and
HsI/L0, for the Reynolds number is usually larger than some minimum value above which variations in its actual value do not significantly affect the resultant motion, while for waves breaking on the slope, the value of the relative depth in front of the slope is not important either”. Then, Van der Meer [
15], and many others as well, assumed that only the combination
is the sole parameter to describe the interaction and evolution of the wave train with the structure; being tan(
α)
the slope of the structure,
HsI/L0 the wave steepness and
L0 the wavelength in deep water, and
HsI the significant wave height of the incident wave train at the toe of the slope. Since Battjes [
27] this quotient is known as Iribarren parameter (
Ir), or surf similarity parameter
ξm.
2.1. Selection of Main Governing and Non-Dimensional Variables
To develop a formula for the rock armor slope stability under wave attack, Van der Meer [
15] chose the main governing variables, (
HsI,
Tm,
Nw,
h, Dn50, Δ
s, α), and neglected some of variables that “had no or minor influence in the considered process”. In this selection,
HsI,
Tm, and
Nw are the significant wave height, the mean wave period, and the number of waves, respectively, in the experimental Test Series (TS);
Dn50 and Δ
s are the nominal diameter and the relative mass density of the armor rock, respectively;
α is the slope angle, and
h is the water depth at the toe of the slope.
Next, he based the selection of non-dimensional variables on empirical grounds and other formulas rather than on the dimensional analysis method. The Van der Meer stability formula is a functional relationship among the following non-dimensional variables.
where, the first quantity is the stability number,
Ns; the second one couples the damage level,
Sd, and the number of waves of TS. The damage level,
Sd, is determined by the quotient of the cross-sectional eroded area,
Ae, and the square of
Dn50. Equation (1) also includes the so-called notional permeability factor,
P, that is established for each typology structure. Depending on whether the value
ξm is less than and equal to, or greater than, a certain critical value
ξmc, the formula has two slightly different expressions, where
ξmc = f(tan(
α),
P). It is considered that in the domain
ξm ≤
ξmc the waves break in plunging (Equation (24) in [
15] or Equation (1) in [
17]) and, otherwise, the waves break in surging (Equation (25) in [
15] or Equation (2) in [
17]).
2.2. Design, Experimental Technique and Analysed Data
Van der Meer [
28] carried out the experiments (experimental technique) in Test Series (TS). A TS consisted of five complete tests (CTs) with the same average wave period (constant
h/L) and increasing the incident significant wave height,
HsI. The output of a Test Series (TS) generally consisted of two sets of data (
Nw = 1000 and 3000) of five pairs of values of damage level,
Sd, corresponding to a given
h/L and five increasing values of
HsI/
L. Hence, for each complete test, increasing the wave height is the same as to increase
ξm, (breaker parameter), and
Ns.
This research analyses the damage observed in different wave flume experiments on the rock layer over a sloping impermeable structure, cot(
α) = 3, tested by Van der Meer [
28]. The wave conditions were irregular waves with Pierson Moskowitz (PM), narrow (NA) and wide (WI) spectra, with 42, 19, and 20 CTs, respectively. The water depth was constant
h = 0.80 m. The armor rock was composed by a nominal diameter
Dn50 = 0.0360 m, relative mass densities Δ
s = 1.615, 1.630, and grading,
D85/D15 = 1.25 and 2.25. Furthermore, five large scale (LS) runs were carried on in the Delta flume, scaled up according to Froude’s law by a linear factor 6.25. The nominal diameter of the stones was
Dn50,LS = 0.214 m and the grading (
D85/D15)
LS = 1.38. The average wave period in the large scale runs was constant,
Tm,LS = 4.4 s corresponding to
Tm = 1.77 s, and
h/L ≈ 0.18.
2.3. The Revisited Formula by Van der Meer (2021)
In a recent paper, Van der Meer [
17] revisited the constant physical relationships between the non-dimensional parameters included in Equation (1). Based on these relationships, Van der Meer grouped the non-dimensional parameters
, and
Ns, to define the so-called parameter group for stability or relative stability number,
. Next, it is assumed that it should depend on
ξm, once the slope angle α, and the notional permeability parameter,
P, of the structure are chosen; that is:
Van der Meer presents Figures 1–7 in [
17] as a proof of validity of his formula and proposes this type of graph for application in the design of rock slope breakwaters. Those figures show the relative stability number (
y-axis) as a function of the similarity parameter or breaker parameter,
ξm, (
x-axis). The Figures 1–3 of [
17], show the experimental values obtained in an impermeable slope breakwater (
P = 0.1), slope 1:3 and includes two spectral widths and three characteristic periods: mean,
Tm; peak,
Tp; and spectral,
Tm-1.0. Figures 4–6 of [
17] show the graphs for impermeable core, permeable core, and homogeneous breakwater typology.
2.4. Aplication and Reliability of the Van der Meer Formula
Van der Meer [
17] limits the application of his formula to start of damage
Sd,in = 2 or 3, and the highest damage levels
Sd,max = 8, 12, or 17, depending, in both cases, on the slope angle. Although, based on the experimentation of Thompson and Schulter [
29] the validity of the function
can be extended to the interval 1000 ≤
Nw ≈ 7000, the tests carried out by Van der Meer were performed with
Nw = 1000 and 3000 waves. Based on these data, the parameter
varies in the range (see
Table A1—
Appendix A): 0.5 <
< 0.6; 0.64 <
< 0.70; 0.74 <
< 0.89 for the onset damage levels 1 <
Sd < 4; 6 <
Sd < 9; and 12 <
Sd < 30, respectively.
Figure 1 is a graph that relates breaker parameter with relative stability number
, and includes the Van der Meer formula (yellow curve) and all the experimental data obtained by Van der Meer [
28] for an impermeable core structure and slope 1:3. It is shown that in the interval
ξm < 1.5 the experimental values of the relative stability number follow the proposed function for plunging breakers; for 1.5 <
ξm <
ξmc, its dispersion grows depending on
h/L0 and the type of spectrum; and for
ξmc <
ξm, the dispersion of the experimental data grows significantly as the breaker parameter increases and
h/L0 decreases. That is, the uncertainty of the formula grows in the critical design zone and keep growing with
ξm.
Figure 1 also includes three worked examples (blue and red stars, named points 1, 2, and 3), two for plunging (Equation (1) in [
17], points 1 and 2) and one for surging (Equation (2) in [
17], point 3) breakers. The mean period
Tm is used to calculate the breaker parameter,
ξm, and its critical value,
ξmc. According to Van der Meer [
15], the values of the wave steepness,
, and the relative water depth are calculated with
L0, the wave length in deep water conditions. These points correspond to a sea state with
HsI and
Tm, and constant
Nw = 3000 (see
Table 1). The star-points 1 and 3 have a
h/L0 ≈ 0.05 and star-point 5,
h/L0 ≈ 0.15. In all cases, the water depth at the toe of the breakwater is constant
h = 6 m.
Van der Meer proposed his formula considering that the uncertainty about the stability of the rock armour slopes was mainly related with the selection of the design sea state parameters, namely
HsI,
Tm, and
Nw; that is, with the intrinsic uncertainty. In other words, it is assumed that the probability of failure of the structure is mainly associated with the selection of the principal sea state parameters:
HsI,
Tm and
Nw. Once the slope, typology and damage level are chosen, and the relative mass density of the rock (Δ
s) is known, the nominal design diameter
Dn50 is inversely proportional to the relative stability number,
. The experimental data with approximately the same values of
ξm as those of the worked example, scatter from proposed curve (
Figure 1), depending on the value of the breaker parameter. The interval grows as
ξm increases for, point (3), 2.6 ≤
; point (1), 2.2 ≤
; and point (2), 1.70 ≤
. Then, for a constant value of
, the experimental scatter determines (linear impact) an interval of the design value of
Dn50, obtained with the formula, impinging (nonlinear impact) to the investment or total costs of the maritime infrastructure.
On the other hand, the application of the relative stability number in a design graph, and the functional relationship chosen for proposing the formula, provokes intrigue and curiosity. Notice that, given a nominal diameter (
Dn50) and relative density (Δ
s) slope angle, damage level, (
Sd) and number of waves (
Nw), the design graph proposed by Van der Meer (its Figures 1–7 in [
17]) simply represents the relationship,
HsI versus
each of them affected by different constants: c = 1/2 for plunging breakers and c =
P for surging breakers;
P = 0.1 for impermeable core. The relative water depth,
h/L0 calculated with the depth at the toe of the structure does not intervene in the design value of
Dn50. Indeed, if the water depth of the worked example is increased or decreased, say
h = 8 m or
h = 4 m, and all other design parameters are not changed, the formula returns the same nominal diameter as for
h = 6 m in
Table 1. In the next section, following Losada [
16] these strange results are further analyzed.
3. Reanalysis of the Applicability of the Formula and Sources of Uncertainties
Van der Meer [
15] founded his formula and the selection of dimensionless variables on empirical evidence following previous research, Battjes [
27] and Ahrens and McCartney [
23]. Losada [
16] revealed that the interplay of the sea state input, the characteristics of the structure and the progression of the rock layer damage is a complex process. In this section the original and the revisited the Van der Meer formula [
17] are analyzed, following the assessment method given in Losada [
16].
3.1. Experimental Space, Design and Limits of Wave Validity
Figure 2 shows the experimental space of all the experimental data included in
Figure 1 for the structure with a rock armor over an impermeable core and slope 1:3. The
x-axis represents the logarithmic transform of the incident wave steepness, and the
y-axis represents the logarithmic transform of the relative water depth, both determined at the toe of the slope. This graphic representation facilitates the identification of two relevant processes in the interaction of the wave train with the slope breakwater: the type and the spatial-temporal evolution of the wave breakers. They can be described by the alternate similarity parameter
[
30], and the relative wave height,
.
The isolines of χ constant determine the prevalence zone of the six wave breaker types on the slope [
31]. It is remarkable that the isolines of breaker types, in addition to
h/L and
HsI/L, depend on the slope angle. The isoline of γ constant is the geometric locus of the points that reach the toe of the slope with the same relative wave height. The parameter γ does not include explicitly the wavelength. However, each point of the isoline γ has a wavelength, that is determined, unambiguously, considering the depth,
h, and the wave height,
HsI, at the toe of the slope. Therefore, the maximum possible value of γ in a wave flume is imposed by the wave generation system (
HsI/L) and depends on the relative water depth,
h/L. Indeed, for both regular and irregular waves, the maximum value of γ in a wave flume is significantly lower than the maximum values observed in nature and is considered as a nonlinear parameter.
Furthermore, the values of γ and χ, at the toe of the slope, are related with the following expression:
Thus, in the Stokes wave regime, γ and χ carry the same, but non-aggregated, information embodied in Ursell number,
Ur. Notice the correspondence between
Figure 2 and the one proposed by Le Méhauté [
32], which shows the wave theory that best describes the profile of the wave at the toe of the slope and its limits of validity [
30].
On the other hand, the dispersion equation of Stokes linear waves shows that the ratio, , is a nonlinear function. Thus, the type of wave breakers and wave evolution over the slope are modified depending on the local values of γ and χ. The values of wave steepness, HsI/L0, and the relative water depth, h/L0, are not interchangeable with the values of HsI/L and h/L at the toe of the structure.
Furthermore, for non-breaking wind waves, if the reflected flux of wave energy on mild sloping foreshores (in front of the structure) is negligible, the wave design input of the structure should be, HsI/L and h/L at the toe of the structure. Such condition is reasonably satisfied when and , being the angle of the foreshore.
It can be concluded that γ and χ, calculated at the toe of the slope, are both necessary to determine and to predict the hydrodynamic performance of the wave train over the slope. Notice that the experimental technique of Van der Meer to measure the damage was organized in TS consisted in five CTs with constant
h/L, and runs of 1000 and 3000 waves with constant
HsI (that is constant
HsI/L or
Ns). The shallower data are slightly above
1/12, and the maximum relative wave height at the toe of the slope is
, but most of the tests were carried out with
. Furthermore, based on [
31], the types of wave breaker are strong plunging, strong bore, weak bore, and surging, with
, respectively.
3.2. Progression of Damage under Nw Equal to 1000 and 3000 Waves
For a given mean wave period (or relative water depth), the progression of damage
Sd against an increasing significant wave height (or stability number, or wave steepness) under
Nw = 1000 and 3000 waves is shown in
Figure 3a,b, respectively.
The damage progression has different paths for different relative water depths at the toe of the structure and become more and more apparent as the damage level increases. For the initial of damage Sd ≤ 2 or 3, and Nw = 1000 the curves converge, although the random performance of the rock layer at these initial stages, possibly, is affecting the experimental data. Under the incidence of Nw = 3000 waves, the dependence of damage progression on h/L, in the interval 3 ≤ Sd ≤ 15 is notorious. For the same level of damage, for example Sd ≈ 17, the stability number varies in the interval 1.5 < Ns < 3.0 and the relative water depth increases in the interval 0.10 < h/L < 0.30. In summary, Sd = f(Ns; h/L) or f(HsI; h/L).
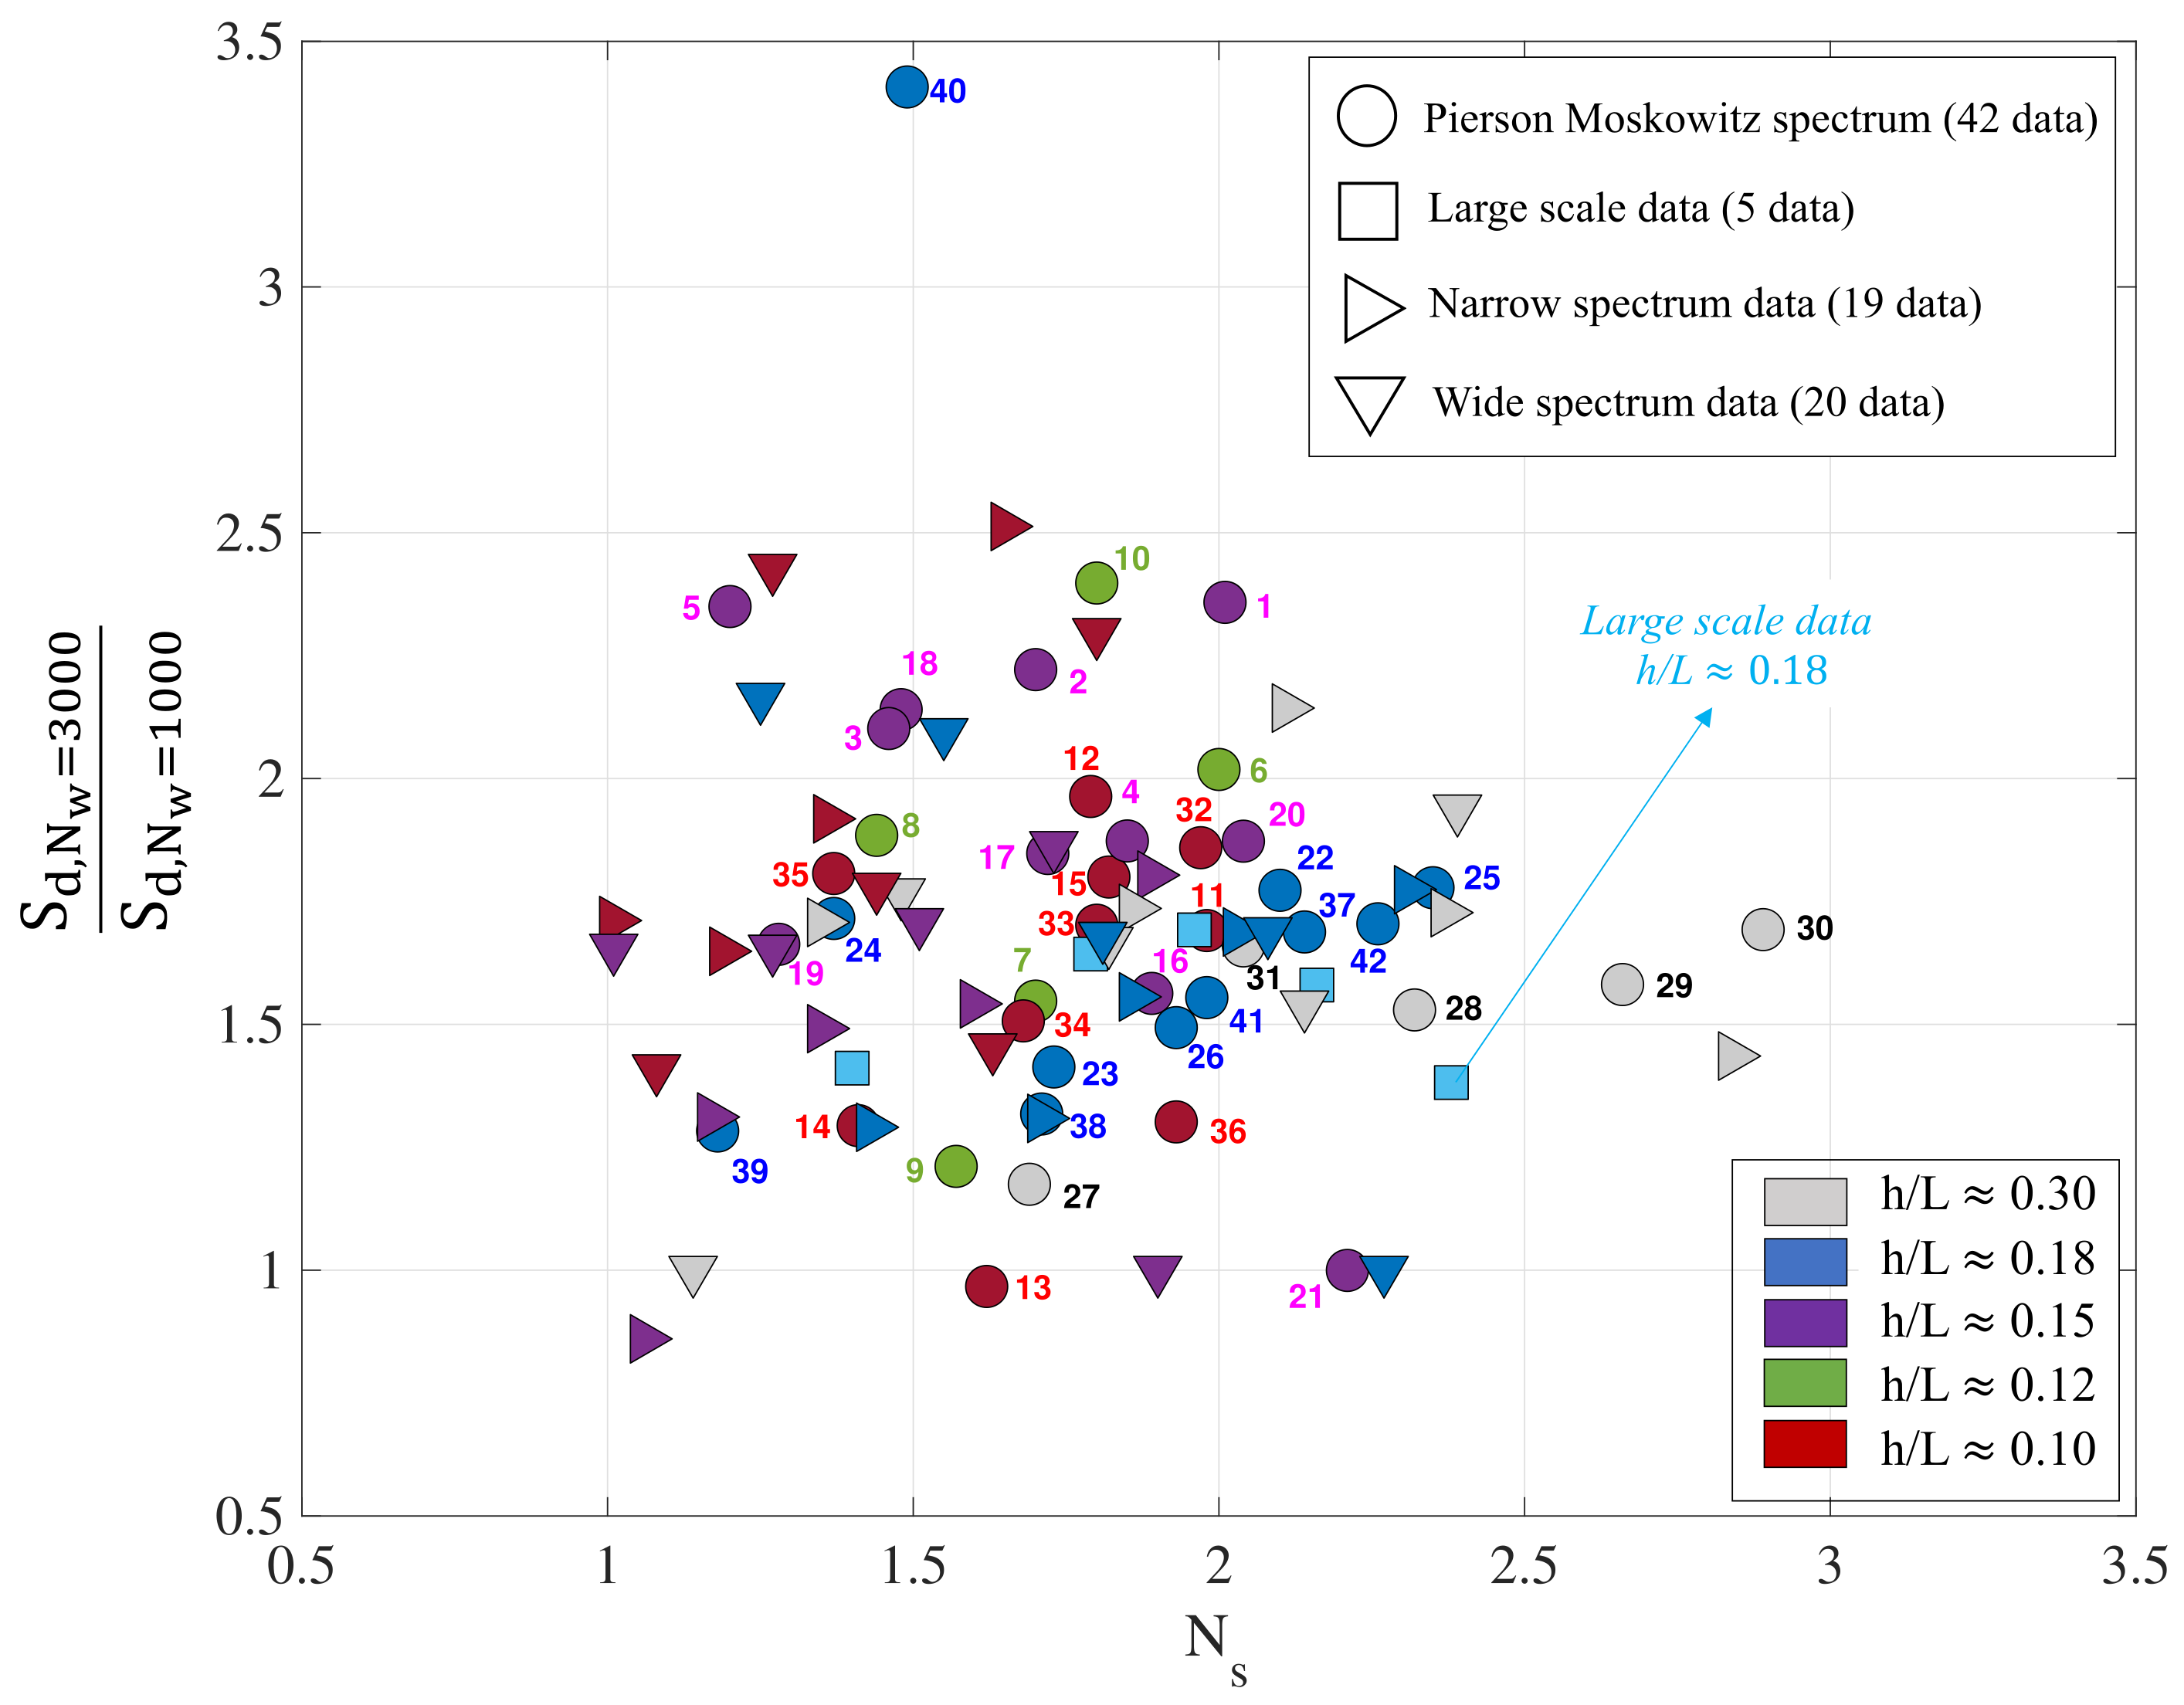
Figure 4 is a scatter diagram of the quotient of the damage under 3000 and 1000 waves,
Sd,Nw=3000/
Sd,Nw=1000 and the stability number. Only for large relative water depths
h/
L ≥ 0.18, the damage progression ratio is approximately constant. For shallower water depths, at first sight, there is no well-defined relationship between the two sets of experimental pairs of values.
Benedicto et al. [
33], Clavero et al. [
34] and Mendoza et al. [
35] showed that the mechanical behavior of homogeneous breakwaters built with rocks or cubes layers (slope 1:1.5 and 1:2), and the evolution of their resulting slope profile depend on
h/
L and
HsI/
L. This behavior was obtained provided that the persistence (i.e., the number of waves) of each test (CTs) was not limited. Then, the progression of the slope form goes through successive equilibrium profiles that modify the type of wave breaking, the reflected energy flux and the rate of energy dissipation of the incident wave.
Hence, at least for intermediate and shallow water depths at the toe of the structure, the parameter should not be considered constant for different stages of damage if they are not at equilibrium.
3.3. Reanalysis of the Breaker Parameter—Relative Stability Number Graph
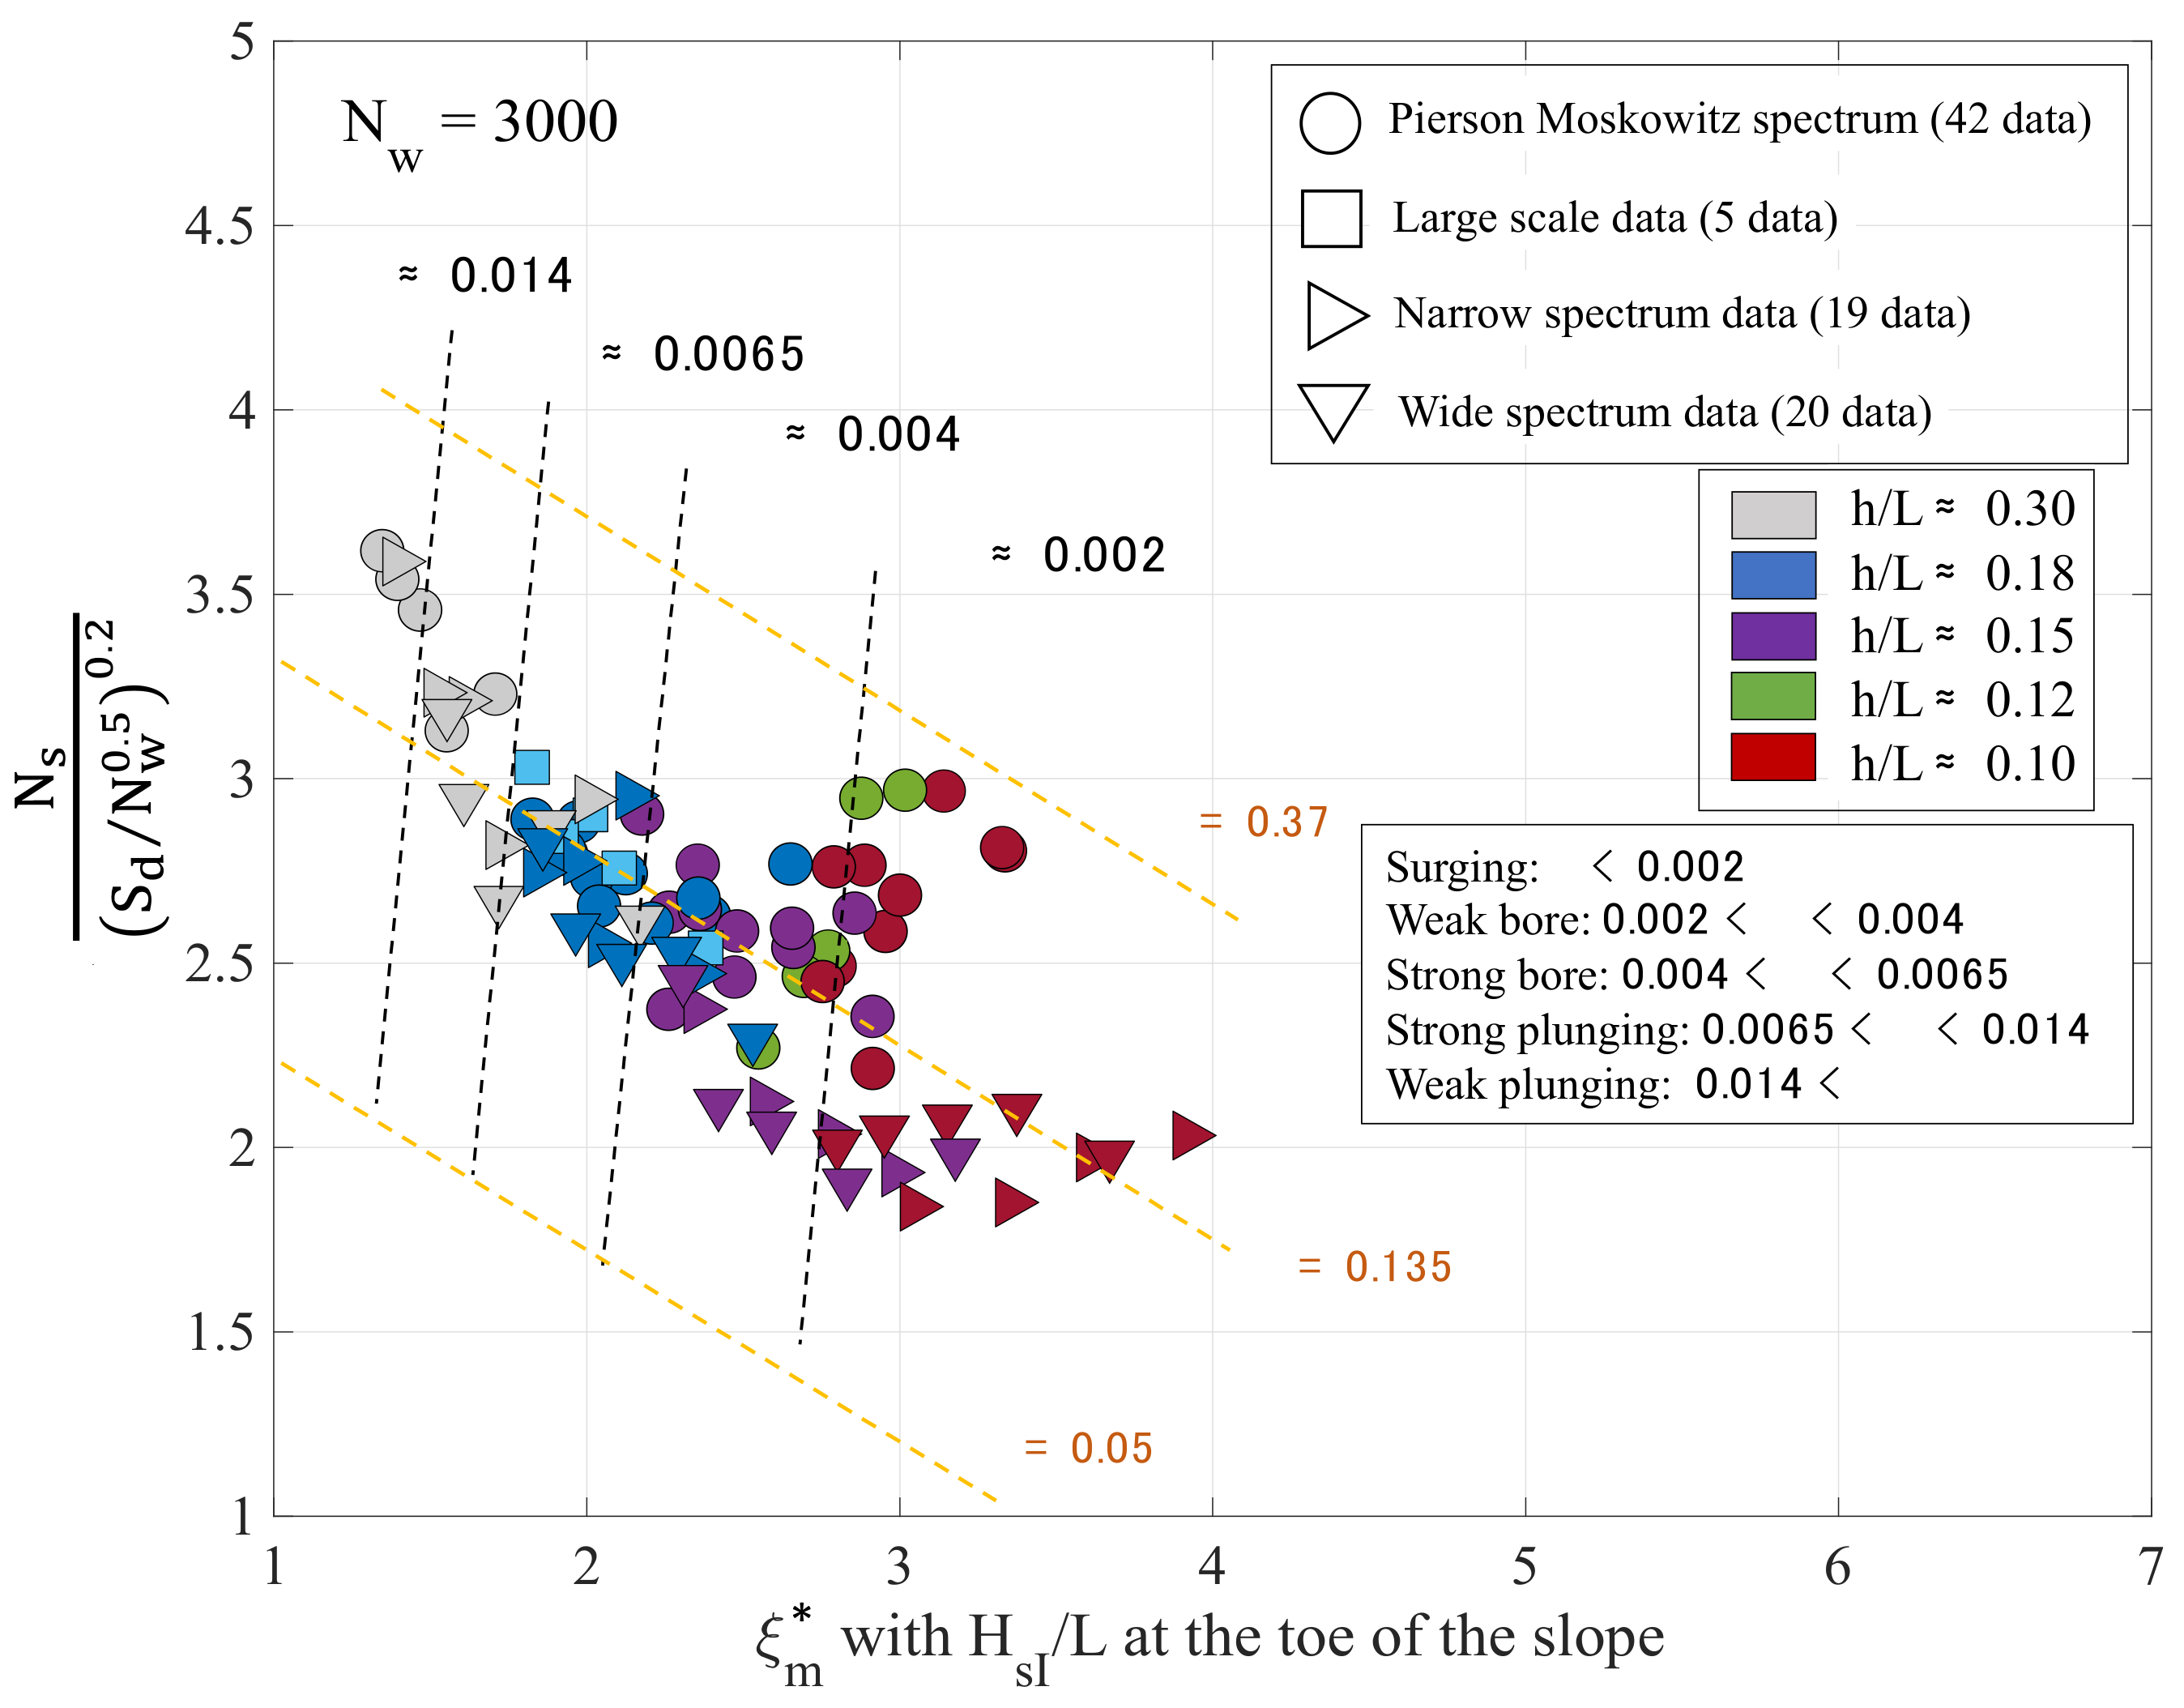
For the same experimental data included in
Figure 1,
Figure 5 is a
graph, which represents the “relative stability number” against the Iribarren number or breaker parameter, calculated at the toe of the slope
, for all the experimental data also plotted in
Figure 1 (rock layer over impermeable core and slope 1:3). The dotted black lines and blue bands represent the constant χ isolines that delimit the different wave breaker types. The dotted yellow lines are the isolines with constant γ. Both values of χ and γ, and its trace, are obtained following
Figure 2.
It is observed that the experimental scatter increases with the progression of wave breaker type from weak plunging to surging, as can also be seen in
Figure 1. This progression depends on the value of χ. In addition, it is observed that the values of the relative stability number,
, follow similar trends as the experimental relative wave height γ increases. This result is congruent with the definition of this parameter and is a clear indication that the depth at the toe of the slope is not included in the formula of Van der Meer. The use of the
graph proposed by Van der Meer [
17] to study the behavior and damage progression of a slope breakwater seems to be uncertain.
In this sense, following the dimensional analysis, Losada [
16] proposed the sigmoid function as an alternate prediction method to capture the damage evolution for the initiation of the damage until the destruction (Figure 10 in [
16]). The sigmoid function has as an independent variable the similarity parameter
[
30], and its fit parameters depend on the relative water depth and the slope angle.
Table A1 gathered in
Appendix A shows the damage level calculated with Losada [
16] taking as input data some of the experimental Pierson Moskowits spectra (1–42 data) tested by Van der Meer. It is observed that, for the same test conditions, the damage calculated by Losada [
16] fits considerably better to the experimental damage than that obtained by the Van der Meer formula.
The application of the logistic sigmoid function to model the progression of damage in a slope has a theoretical justification (Churchill and Usagi [
36]). This function was successfully used to describe various transport phenomena in fluid mechanics, heat transfer, and chemical engineering. It describes a uniform transition between two asymptotes with γ, a blending coefficient, and a parameter of the process inherent to the sigmoid shape. It was successfully applied to quantify the hydrodynamic performance of sloped impermeable structures and mound breakwaters (Vílchez et al. [
37], Díaz-Carrasco et al. [
30], Moragues et al. [
31]). For the description of the progression of damage, the asymptotic values chosen are the initiation and the destruction stages [
16].
3.4. Scaling and Relative Water Depth
In the previous sections it was shown that the Van der Meer formula, both in its 1987 version [
15] and in its graphical version of 2021 [
17], does not include the depth at the toe of the breakwater. This fact connects with the doubts about “that
ξm serves as the sole determining factor for the suitable normalized parameters of the surf” [
27].
The experimental data of Van der Meer [
28] was mostly conducted in a wave flume with constant depth
h = 0.80 m and rock size of the slope
Dn50 ≈ 0.036 m. These tests were usually classified as small-scale. Their application to prototype is based on the Froude similarity between model and prototype. The large-scale tests performed on the Delta flume were run with a scaling ratio for the horizontal lengths of λ ≈ 6.25. The ratio between the wavelength at the toe of the breakwater in the Delta flume (Large Scale,
LLS) and in the small scale test (
LSS) is
LLS/LSS = 6.25. The same scale was applied for the wave height and depth at the toe of the breakwater, although the latter was not provided by Van der Meer. Consequently, the ratio of mean periods is
TmLS/TmSS =
.
Figure 1 includes three worked examples (red and blue stars) corresponding to prototype conditions of a sea state (see also
Table 1). For point 1,
HsI = 2 m and
Tm = 8.3 s, the scale ratio for horizontal length and rock size is λ ≈ 1/20. Then, the model mean wave period is
Tm = 1.86 s;
ξm is conserved (notice that the wavelength is determined in deep water). Applying the Van der Meer formula, the prototype rock diameter is
Dn50 = 0.93 m for
Sd = 2 and
Dn50 = 0.63 m for
Sd = 12.
Moreover, the relative water depth,
h/L0, is conserved if, and only if, the prototype water depth at the toe of the structure,
hp = 6 m, as other vertical quantities, is properly scaled, λ≈ 1/20. However, most of Van der Meer’s experimentation was carried out with constant water depth at the toe of the structure,
hm = 0.80 m. In other words, the model is vertically distorted for the water depth but not for the wave height. As noted by Battjes [
27], a distorted wave-model with the same value of
ξm as the prototype is similar if the pressure distribution in both is hydrostatic. Possibly, except for surging breakers, weak and strong plunging breakers, and strong and weak bore breakers, do not fulfil this requirement. Thus, a stability formula that should be applied to any relative water depth should include the relative water depth at the toe of the structure
h/L in the functional relationship.
3.5. Number of Waves, Sea State Persistence, and Storm Evolution
By definition, the sea state is the time period in which the manifestation of climate agents, their actions, and the functional or structural response of the breakwater is assumed to be stationary in a statistical sense. For this reason, the sea state is generally considered to be the basic time interval in which project requirements and the intended function of the breakwater are verified. In a sea state, the number of waves, Nw, that impinges the structures depends on its persistence, td. If the mean wave period of the sea state is Tm, the average number of waves is Nw = td/Tm.
Van der Meer [
28] carried out the experiments (experimental technique) in Test Series (TS). A TS consisted of five complete tests (CTs) with the same average wave period (constant
h/L) and increasing the incident significant wave height,
HsI. Then each CT is representative of a sea state. Instead to specify the persistence of each CT, he fixed the number of waves for all the CTs, independently of their persistence. The output of a CT consisted of two sets of data of values of damage level,
Sd, for
Nw = 1000 and 3000, corresponding to a given
Tm (or
h/L), and a fixed
HsI (or
HsI/L). After running a CT, the slope was rebuilt. Then, the experimental results can report only information about the damage level in a sea state.
A storm is an arbitrary temporal sequence of sea states, generally with three process domains, related with the sea state evolution: growth, peak, or maximum of the storm and decay. To apply Van der Meer experiments and formula for quantifying the damage under an arbitrary storm it is strictly necessary to assume “basic rules of damage accumulation”. However, the functional relationship including the term, , specific for each CT (sea state), is not compatible with the accumulation of damage occurring during the storm.
On the other hand, for a given wave period (a TS) it may be assumed that the damage evolves (accumulates) “mimicking” the damage observed during each CT. Then, the experimental results can be used to approximate the accumulated damage under a storm, consisted of a sequence of sea states with the same mean wave period and persistence, and growing significant wave height.
3.6. The Inappropriateness of Using the Notional Permeability Factor, P
The stability of permeable structures increases significantly in the surging waves region if the breaker parameter increases. The notional permeability factor P was introduced into the stability formulae to take into account the permeability of the structure. The fixed values of P = 0.1, 0.5, and 0.6 (for impermeable, permeable core and homogeneous structures, respectively) were chosen during the development of the formula. Indeed, P was applied to homogenize the stability experimental results and to connect the three structures with different permeability (impermeable, with permeable core and homogeneous) into one formula.
Present work, as a first step, is devoted to impermeable structures to avoid the dependence on the value of
P. The wave structure interaction consists of reflected wave energy flux and eventually energy dissipation by wave breaking and interaction (circulation and friction) with the main armor layer (two layers of
Dn50). The same methodology can also be applied to analyze the performance of permeable core and homogeneous structures. The presence of a porous core is relevant to the hydrodynamic performance of the breakwater because it determines, among others, the phase lag between the incident and reflected wave trains and its impact on breaker type. This process is described by the relative water depth,
h/L, width
B/L and the relative diameter of the core
D50,p/L, Vilchez et al. [
37,
38], Díaz-Carrasco et al. [
30], and the ratio
B/h, Dalrymple et al. [
39].
In any case the permeability coefficient has no physical meaning [
28]. It is not able to capture and to quantify the different regimes inside the permeable structure. Its presence in the formula is inappropriate as will be shown in a forthcoming study devoted to the performance of the Van der Meer formula against his experimental results for permeable core and homogeneous structures (Figures 6 and 7 in [
17]).
3.7. Conservation Laws and Model-Prototype Similarities
The overall performance of impermeable, permeable core, and homogeneous non-overtopped rock structures depends on the incident wave transformation when the wave train interacts with the structure and on the mechanical response of the rock layer. Its quantification should consider the following three laws: (1) the energy conservation law, to estimate the energy transformation in the wave-structure interaction; (2) the mass conservation law, to calculate run-up, run-down, and the displaced number of rock units; and (3) the momentum conservation law, to evaluate the forces and momentums on the armor units of the maritime structure.
On the other hand, a stability formula from experiments in a wave flume should be based on the following model-prototype similarities:
- (1)
Surf similarity, normalized parameters of the wave progression on the slope:
HsI/L and
h/L must be used to compute χ and γ [
30];
- (2)
Porous flow similarity, normalized parameters of the wave performance inside the structure,
h/L,
B/L and
D50,p/L to compute
B/h and flow regime
Re and
KC [
37];
- (3)
Mechanical similarity, normalized parameters of the extraction and displacement and deposition of the rock armor units,
h/L,
HsI/Dn50, angle of repose to compute the dimensionless eroded area
Ae/(
Dn50)
2, and the reshaped profile [
40].
It is not possible to fulfill simultaneously the three similarities in a single experimental design. Thus, some assumptions and simplifications must be adopted. In addition, all the principal nondimensional parameters necessary to describe the three similarities must be considered. To omit just one of them (h/L or B/L), or to add an inappropriate parameter (the notional permeability factor, P) would increase the epistemic uncertainty and would penalize the validity and the range of application of the developed formula.


