Article

Thermal-Based Remote Sensing Solution for Identifying Coastal Zones with Potential Groundwater Discharge

by
Julián E. Londoño-Londoño
1,
Maria Teresa Condesso de Melo
1,2,
João N. Nascimento
1,2 and
Ana C. F. Silva
1,3,*
1
CERIS, Instituto Superior Técnico, Universidade de Lisboa, Av. Rovisco Pais 1, 1049-001 Lisboa, Portugal
2
Departamento de Engenharia Civil, Arquitectura e Georrecursos, Instituto Superior Técnico, Universidade de Lisboa, 10049-001 Lisboa, Portugal
3
Departamento de Engenharia e Ciências Nucleares (DECN), Instituto Superior Técnico, Universidade de Lisboa, 2695-066 Bobadela, Portugal
*
Author to whom correspondence should be addressed.
J. Mar. Sci. Eng. 2022, 10(3), 414; https://doi.org/10.3390/jmse10030414
Submission received: 16 February 2022 / Revised: 4 March 2022 / Accepted: 9 March 2022 / Published: 12 March 2022
(This article belongs to the Special Issue Coastal Systems: Monitoring, Protection and Adaptation Approaches)

Abstract

:
Submarine Groundwater Discharge (SGD) is an essential process of the hydrological cycle by hydraulically connecting the land and sea. However, the occurrence, importance and effects of SGD remain largely underexplored. Here, we developed and validated a straightforward tool for mapping potential SGD areas in coastal ecosystems of Portugal. Our approach was based on the premise that relatively cooler groundwater discharging to warmer coastal waters manifests in the thermal band of satellite imagery acquired during the summer months. We then used Landsat 8 thermal infrared imagery (TIR) to derive sea surface temperature and standardized temperature anomalies maps. The results confirmed the capacity of TIR remote sensing for identifying SGD areas. The thermal analysis enabled us to acquire a useful visual-spatial correlation between the location of thermal anomalies and potentiometric surfaces of coastal aquifers. This way, over 20 potential SGD areas were identified. Our study makes an important contribute to our current SGD research status by developing a cost-efficient tool which can be used as a first level approach for large areas. Further investigation is needed to quantify the SGD and its potential effect in the receiving ecosystems, especially those located within environmentally protected areas.

1. Introduction

Groundwater discharge is a key factor for hydrological and ecological studies in coastal areas due its significant role in processes such as nutrient cycling, geochemical mass balances and primary productivity in coastal ecosystems [1,2,3]. These ecosystems are called groundwater dependent (GDEs) when this resource is needed to secure the ecosystem services, functioning and community structure [4]. The presence of groundwater drives the evolution, persistence and resilience of GDEs, and their biological perservation state depends on at least two groundwater aspects [5]: (i) physical characteristics, such as the quantity, location, timing, frequency and duration of groundwater delivery (or supply), and (ii) chemical characteristics, such as water quality (especially salinity and nutrient concentrations) and temperature.
Groundwater discharge is a well-known source of solutes and nutrients for various coastal and marine environments and their ecosystem services. Capone and Bautista [6] presented the first substantial evidence of the effect of nitrate-enriched groundwater discharge through coastal sediments into the Great South Bay, New York. Similarly, Bowen et al. [7] established that groundwater-borne nutrient loads increased the nitrogen content of receiving estuaries on the northeast coast of the United States, hence influencing the phytoplankton and macroalgal production and biomass. More recently, Rodellas et al. [8] found that inputs from karstic springs represent the principal source of freshwater of some coastal lagoons, contributing to maintaining them under non-hypersaline conditions for most of the year. In the same way, Fujita et al. [9] revealed that nutrients supplied via submarine groundwater were potentially important for primary production in the coastal sea areas of Japan. Likewise, Starke et al. [10] demonstrated that elevated nutrient concentrations transmitted by submarine springs caused a bottom-up control resulting in a higher abundance of fish in a coastal lagoon of Tahiti, French Polynesia. Hence, groundwater discharge has important implications in coastal zones’ biological functioning, plankton dynamics, sedimentary geochemistry, microbial ecology, and environmental toxicology.
We consider to be fundamental for and effective coastal zone conservation management to recognize the linking role of groundwater discharge in the coastal boundary. Coastal ecosystems such as estuaries, intertidal zone, and lagoons are all currently in great threat [11], so it is timely to have a useful tool to locate ecosystems that may be influenced by groundwater.
The general movement of groundwater towards the coast typically ends as submarine groundwater discharge (SGD). This process has received several definitions, depending on whether it merely takes into account freshwater discharge or also includes re-circulated water seepage [12]. The most widely accepted definition is presented in Burnett et al. [13] corresponding to “any flow of water out across the sea floor”. Whether SGD includes a large component of freshwater or not, also referred to as coastal groundwater discharge (CGD), depends on the local hydrogeological conditions, i.e., aquifer lithology, aquifer type and hydraulic gradients, as well as the groundwater balance and how it is affected by human activities [14].
According to Luijendijk et al. [15], the total flux of groundwater to the ocean can be divided into three distinct contributions: fresh groundwater, near-shore terrestrial groundwater discharge, and recirculated seawater. However, the methodology developed in this study does not focus on the separation of the different fluxes of SGD, rather defines SGD without regard to its composition (e.g., salinity), its origin, or the mechanism(s) driving the flow. Therefore, it will always be indistinctly referred to as Submarine Groundwater Discharge (SGD).
Earlier investigations relied on salinity observations of water collected from seepage meters to assess the relative contribution of fresh SGD to total SGD [16], as well as a comparison between Darcy’s Law derived fresh SGD vs. total SGD derived from seepage meters [16]. Over the last decade, numerous studies worldwide have successfully applied isotopes to quantify SGD fluxes over a range of different time-scales, estimate the magnitude of SGD and determine its relative importance in chemical budgets of coastal waters [17,18]. However, this method can be costly and time consuming. Other methods for mapping SGD such as ground electrical resistivity surveys are only suited for use over small areas (∼100 m2) [19]. Hence, alternative methods for studying the SGD at local to regional scales are urgently required.
More recently, thermal infrared (TIR) remote sensing techniques are employed to evaluate SGD. Wilson and Rocha [20] proposed the use of freely available Landsat Enhanced Thematic Mapper (ETM+) thermal infrared (TIR) imagery for the assessment of submarine groundwater discharge into coastal waters in Ireland. Also, Tamborski et al. [21], combined airborne thermal infrared overflights with shoreline radionuclide surveys to investigate SGD along the north shore of Long Island, New York. More recently, Samani et al. [22] used Landsat 8 thermal sensor data to identify potential sites of SGD at a regional scale in the Northern Persian Gulf. Similarly, Jou-Claus et al. [23] demonstrated the significant use of the thermal infrared imagery as an exploratory tool for identifying SGD springs in karstic coastal aquifers in the Mediterranean Sea basin. Hence, our study objective was to develop a cost-effective and straightforward solution based on thermal infrared satellite imagery analysis, using Portugal as a case study, where there is already evident information signaling the widespread importance of SGD in coastal ecosystems.
In Portugal, SGD has been previously investigated in the Algarve, a region featured by important coastal aquifer systems and associated aquatic ecosystems (sandy shores, estuaries, and coastal lagoons). Relevant information on the distinction of SGD components and the mechanisms of their dispersion throughout the Ria Formosa Lagoon (Faro, Portugal) were provided by Rocha et al. [24], who assessed land–ocean connectivity combining radon measurements and stable isotope hydrology. In the area of the Albufeira-Ribeira de Quarteira aquifer system, SGD was investigated within the scope of a multidisciplinary research project FREEZE (PTDC/MAR/102030/2008) [25] which identified and characterized the effects of the hydrological/hydrogeological conditions on associated ecosystems [14,26,27,28]. Additionally, Silva et al. [29] showed how the estuarine faunal community significantly respond to a gradient dependent on groundwater input, under a predicted climatic scenario of reduction in groundwater discharge into the estuary.
Nevertheless, the occurrence of groundwater discharge and its effects on the crucial intertidal and nearshore ecosystems have scarcely been addressed before. For instance, intertidal rocky shores are one of the most heterogeneous coastal environments [30] and biologically rich in terms of the number and variety of species they support [31]. However, they are under increasing threats due to anthropogenic activity such as increasing population, tourism, trampling and seafood gathering activities and climate change [32].
In southwest Europe, many of these areas are still unexplored in terms of SGD influence, and the effects of groundwater discharge variation is yet unexplained. For instance, in Portugal, although the groundwater discharge influences benthic macrofaunal the study only focused on mobile sediment in subtidal and benthic [33] in the south, whilst a single study evaluated the impacts of groundwater discharges on a rocky intertidal community [30]. These two studies suggest that changes in both quality and quantity of freshwater reaching the rocky shores from coastal aquifers affect the presence and richness of the biodiversity associated with these environments. Nevertheless, there is no mapping of potential GWD locations at the national scale.
In recognition of both the significance of groundwater discharge as a potential source of nutrients and/or pollutants and the challenges of locating potentially groundwater dependent coastal ecosystems, we aimed to identify potential SGD areas through the application of a novel thermal infrared satellite imagery analysis for large regional scales, using the Portuguese coastline as a case study.

2. Methods

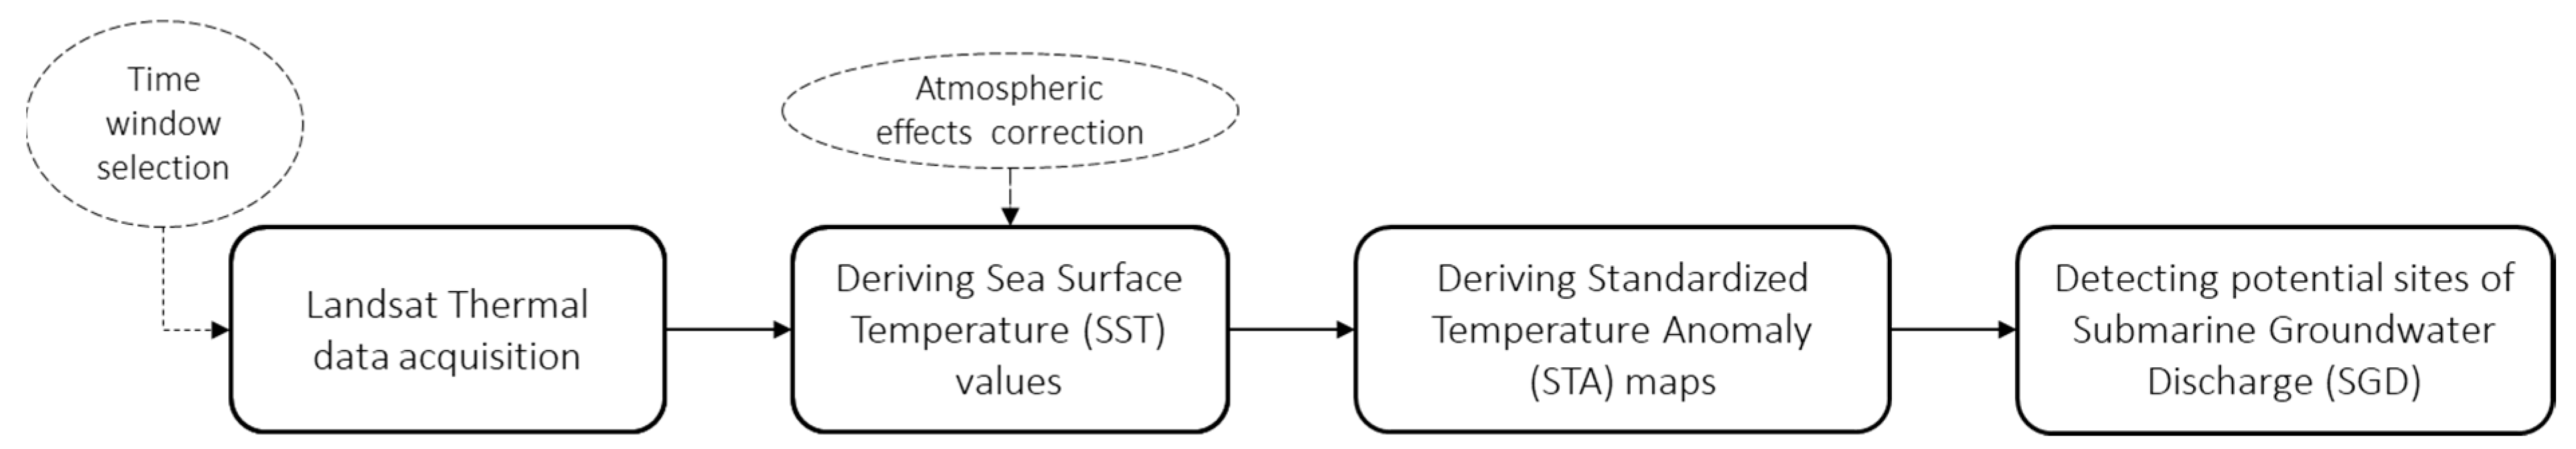
2.1. Rationale and Methodological Framework

Our work is based on the premise that the relatively cooler groundwater discharging to warmer coastal waters manifests in the thermal band of Landsat TIR imagery acquired during the summer months. Other studies have used this rationale to assess SGD as temperature gradients between discharging groundwater and the surface water body. For instance, Wilson & Rocha [20] mapped temperature anomalies in the south and west coasts of Ireland, highlighting the suitability of the approach for a regional scale survey. More recently, Samani et al. [22] used Landsat 8 thermal sensor data to identify potential sites of SGD at a regional scale in the Northern Persian Gulf, Jou-Claus et al. [23] used Landsat 8 imagery as an exploratory tool for identifying SGD in karstic coastal aquifers in the Mediterranean Sea basin. The inverse process—warmer groundwater discharging into colder ocean waters during the winter months—is also coherent and hydrogeologically correct. However, it imposes a major constraint to the methodology since it is difficult to find low cloud cover images during the winter.
Fine spatial resolution airborne, ground-based thermal imaging systems, and handheld thermal sensors are effective methods to identify groundwater discharge into surface water bodies. However, these solutions tend to be extremely costly and unsuitable for application to very large areas, especially if continued monitoring of groundwater discharges is desired. Moreover, despite that in recent decades numerous satellite systems equipped with infrared (IR) radiometers (e.g., AVHRR, MODIS, VIIRS, SLSTR or SEVIRI) have been developed for SST mapping, we considered their spatial resolution (0.75–4.5 km) too coarse to observe the local effects of temperature anomalies [34]. Hence, we used thermal infrared images acquired by the thermal infrared sensor (TIRS) carried on the Landsat 8 satellite with a spatial resolution of 100 m.
As shown in Figure 1, Landsat 8 Thermal Infrared scenes were acquired for a regional analysis to detect potential groundwater discharge zones on the Portuguese coastline. Sea Surface Temperature (SST) and temperature anomalies maps were derived from the Landsat scenes, after processing the images and applying atmospheric correction parameters. The methodological details of these steps are described next.

2.2. Landsat Thermal Data Acquisition

A comparison of sea surface temperature, acquired from the Portuguese Institute for Sea and Atmosphere (IPMA for its acronym in Portuguese) and groundwater temperature, in turn acquired from a selection of near-coast wells in the monitoring network of the National Water Resources Information System (SNIRH), showed that the maximum temperature differences occur through the summer and winter months (Figure 2). However, the general cloud cover in satellite imagery during the winter months was found to be incompatible with for the thermal infrared analysis. Consequently, we selected the summer time window to acquire the Landsat 8 scenes.
The Portuguese coast was divided in 5 distinct subregions: North, North West, Center, South West and South (Table 1), covering the dashed area presented in the map. Images were obtained for the late summer months (July, August, and September) with a low percentage of cloud cover (<10%).

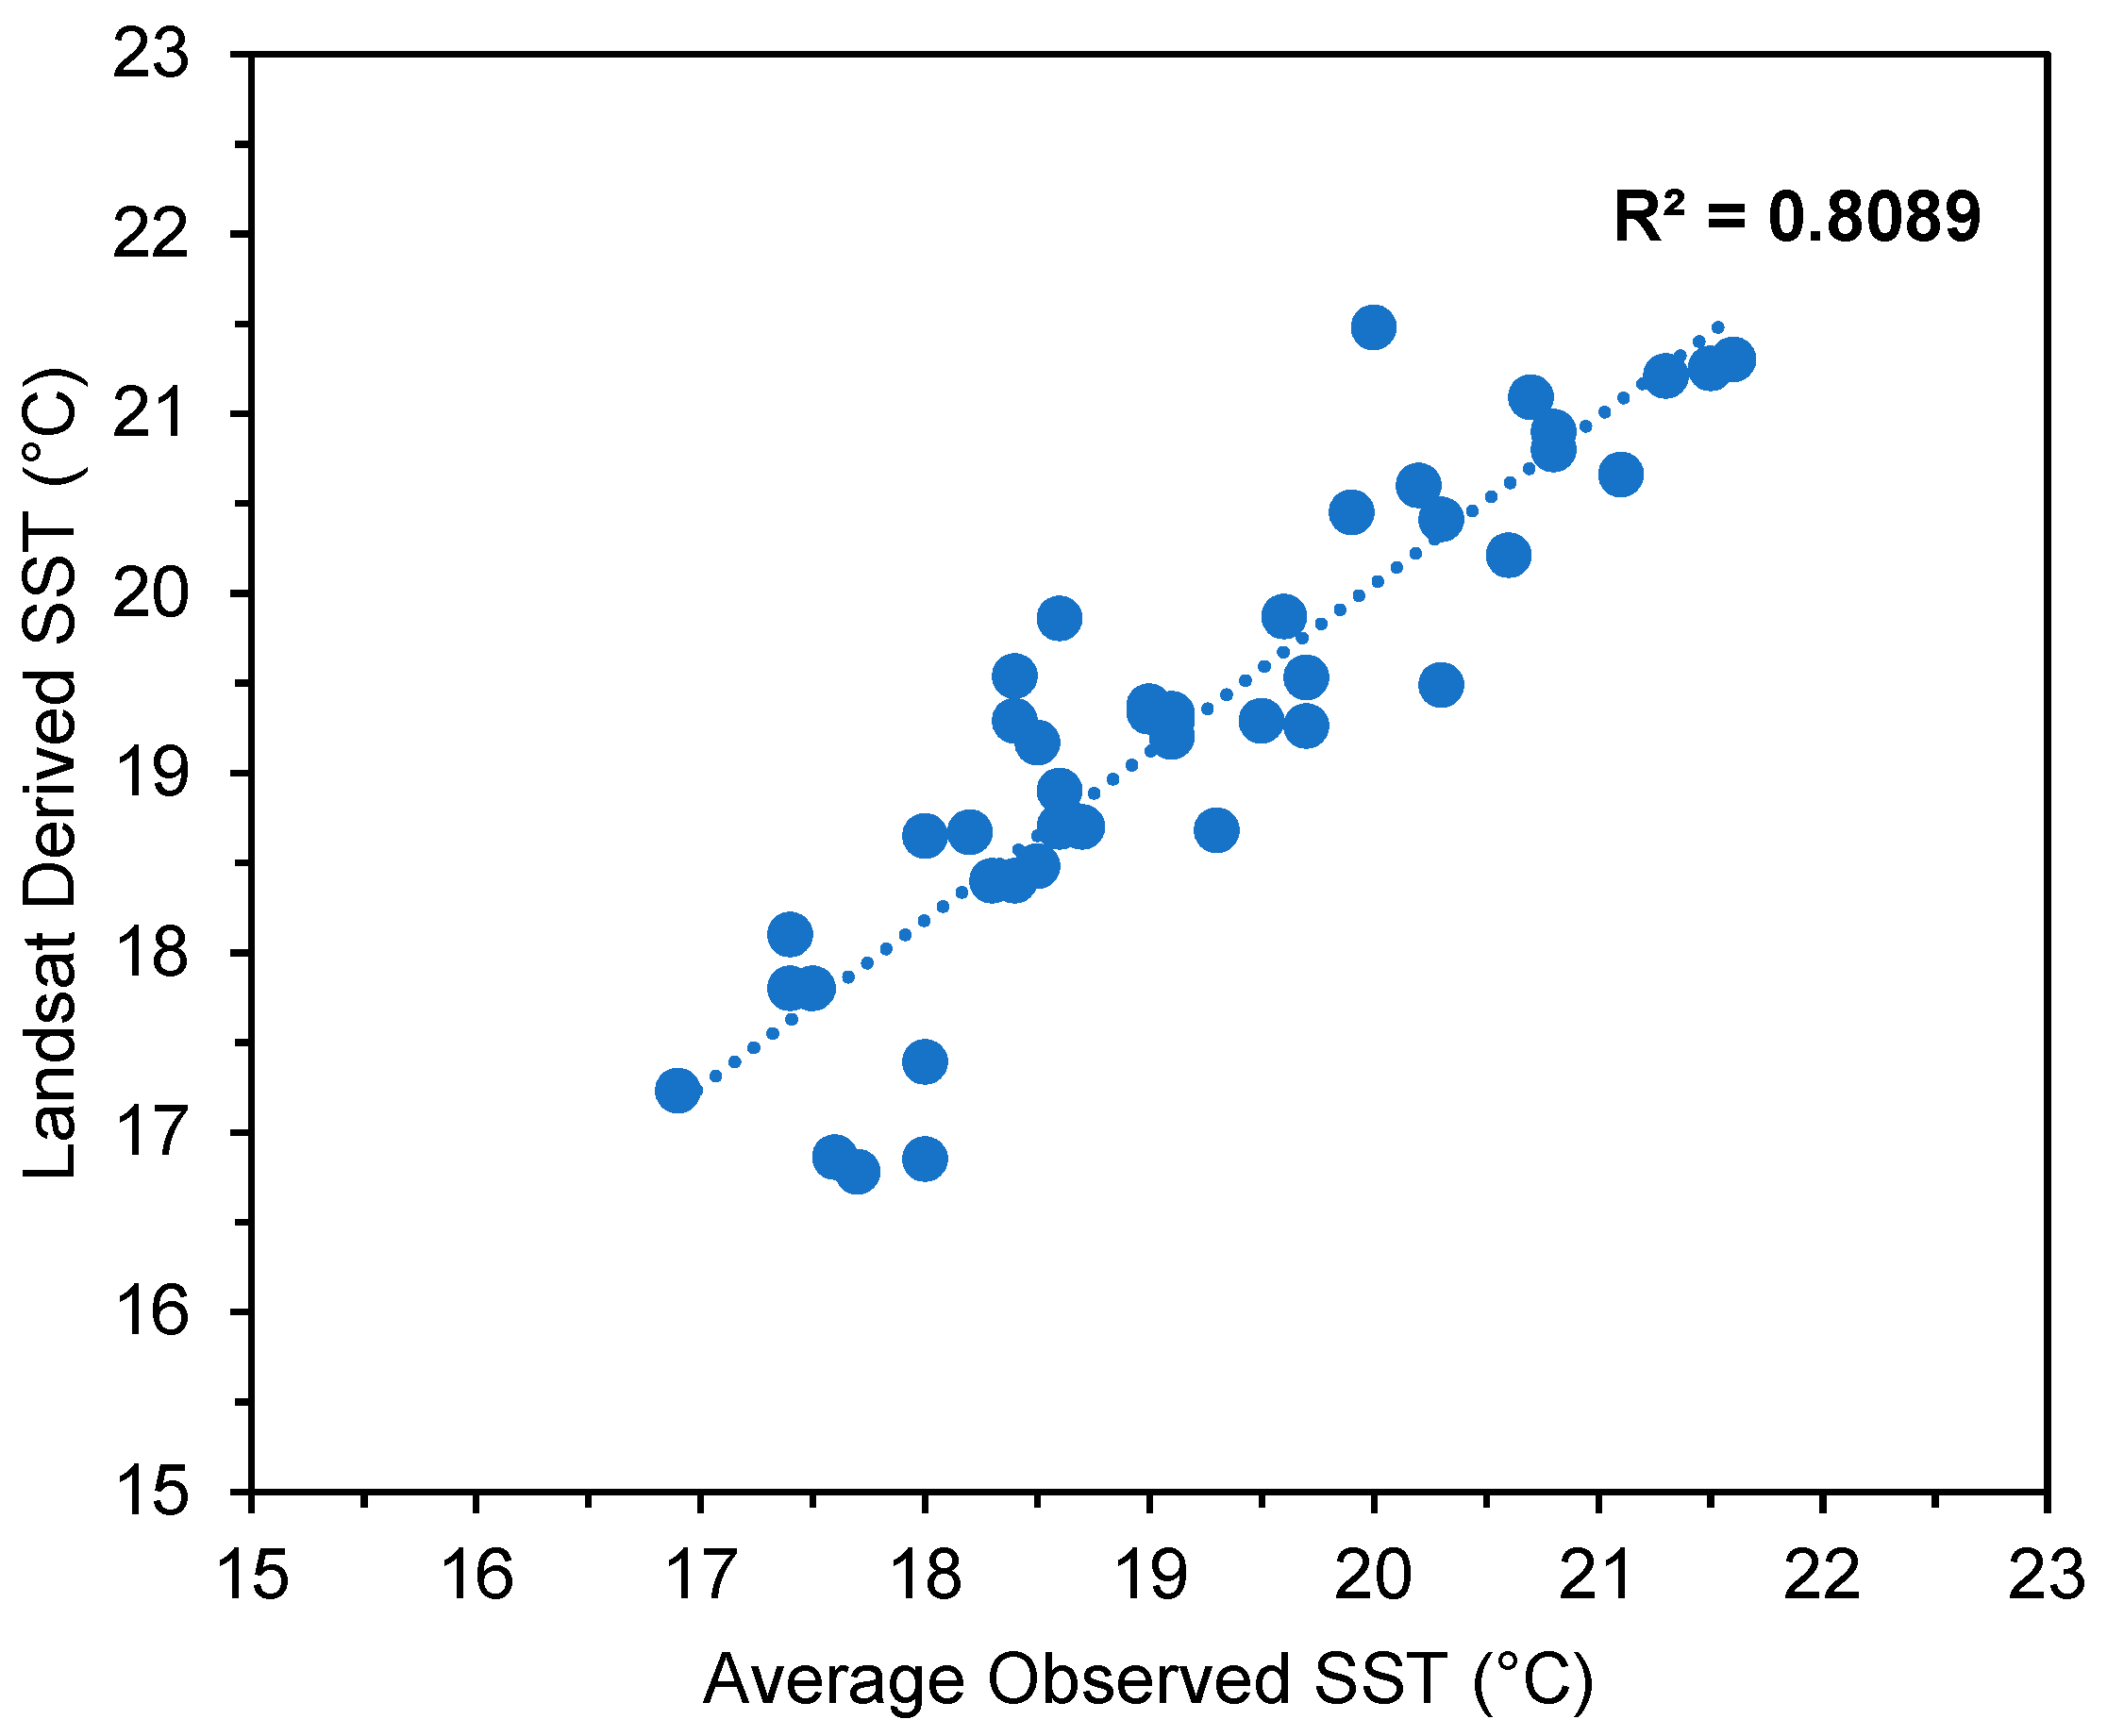
2.3. Thermal Infrared Image Processing

As an initial step, pixel digital numbers (DNs) of the Landsat TIR band 10 were converted to top-of-atmosphere ( T O A ) spectral radiance using Equation (1). [22]:
L λ T O A = M L Q C A L + A L
where L λ T O A is T O A spectral radiance (Watts m−2·sr−1·µm−1), M L is rescaling factor (3.342 × 10⁻⁴ for Landsat-8 band 10), Q C A L is DN values, and A L is rescaling factor (0.1 for Landsat-8 band 10)
The atmospheric correction was applied to prevent changes due to atmospheric effects being interpreted as changes in the water body. The T O A values were corrected for atmospheric effects (Equation (2)) to determine surface water radiance using parameters derived from the NASA’s online atmospheric correction tool (http://atmcorr.gsfc.nasa.gov/; accessed 20 August 2021), and consequently to derive scene at-surface kinetic sea temperature values.
L λ T = L λ T O A L λ U P τ ϵ 1 ϵ ϵ ( L λ D O W N )
where L λ T is the radiance of a blackbody target of kinetic temperature T (Wm−2 sr−1 µm−1), τ is the atmospheric transmission (unitless), and ϵ is emissivity of water (ranges from 0.98 to 0.99). L λ T O A is calculated from Equation (2). We used a constant emissivity of 0.989 as suggested in the literature [20]. L λ U P and L λ D O W N are upwelling (atmospheric path radiance) and downwelling (sky radiance), respectively, obtained from the NASA’s online atmospheric correction tool (Table 2).
Finally, surface water radiance values were converted into temperature using the Equation (3)
T S S = K 2 ln ( K 1 L λ T + 1 )
where, T S S is the SST in Kelvin, and K 1 and K 2 are band-specific thermal conversion constants obtained from the available metadata, K 1 = 774.8853 and K 2 = 1321.0789 for Landsat 8.

2.4. Assessment of Thermal Anomalies

Heat has been considered as a groundwater tracer for over a century and remote sensing-based methods for SGD detection are appropriate where temperature gradients form between discharging groundwater and the surface water bodies [35]. Hence, our analysis is based on the hypothesis that in winter months the SGD is warmer than the receiving surface-waters but in summer SGD is cooler than surface-waters [20,21,22].
To determine the geographical location of potential sites of SGD, a set of temperature anomaly ( T A ) and standardized temperature anomaly ( S T A ) maps was generated from each of the SST layers produced from the remotely sensed imagery. Temperature anomaly has been defined as the difference between the SST value of each pixel and the average SST value estimated for the coastal water body Equation (4).
T A = T p T a .
where, T A is temperature anomaly (Kelvin), T p denotes the temperature value specific to each pixel in the scene (Kelvin), and T a is the average temperature value for the scene (Kelvin). S T A (dimensionless) can be calculated using the following equation (Equation (5)), where, σ is the standard deviation of SST values.
S T A = T A σ

3. Results

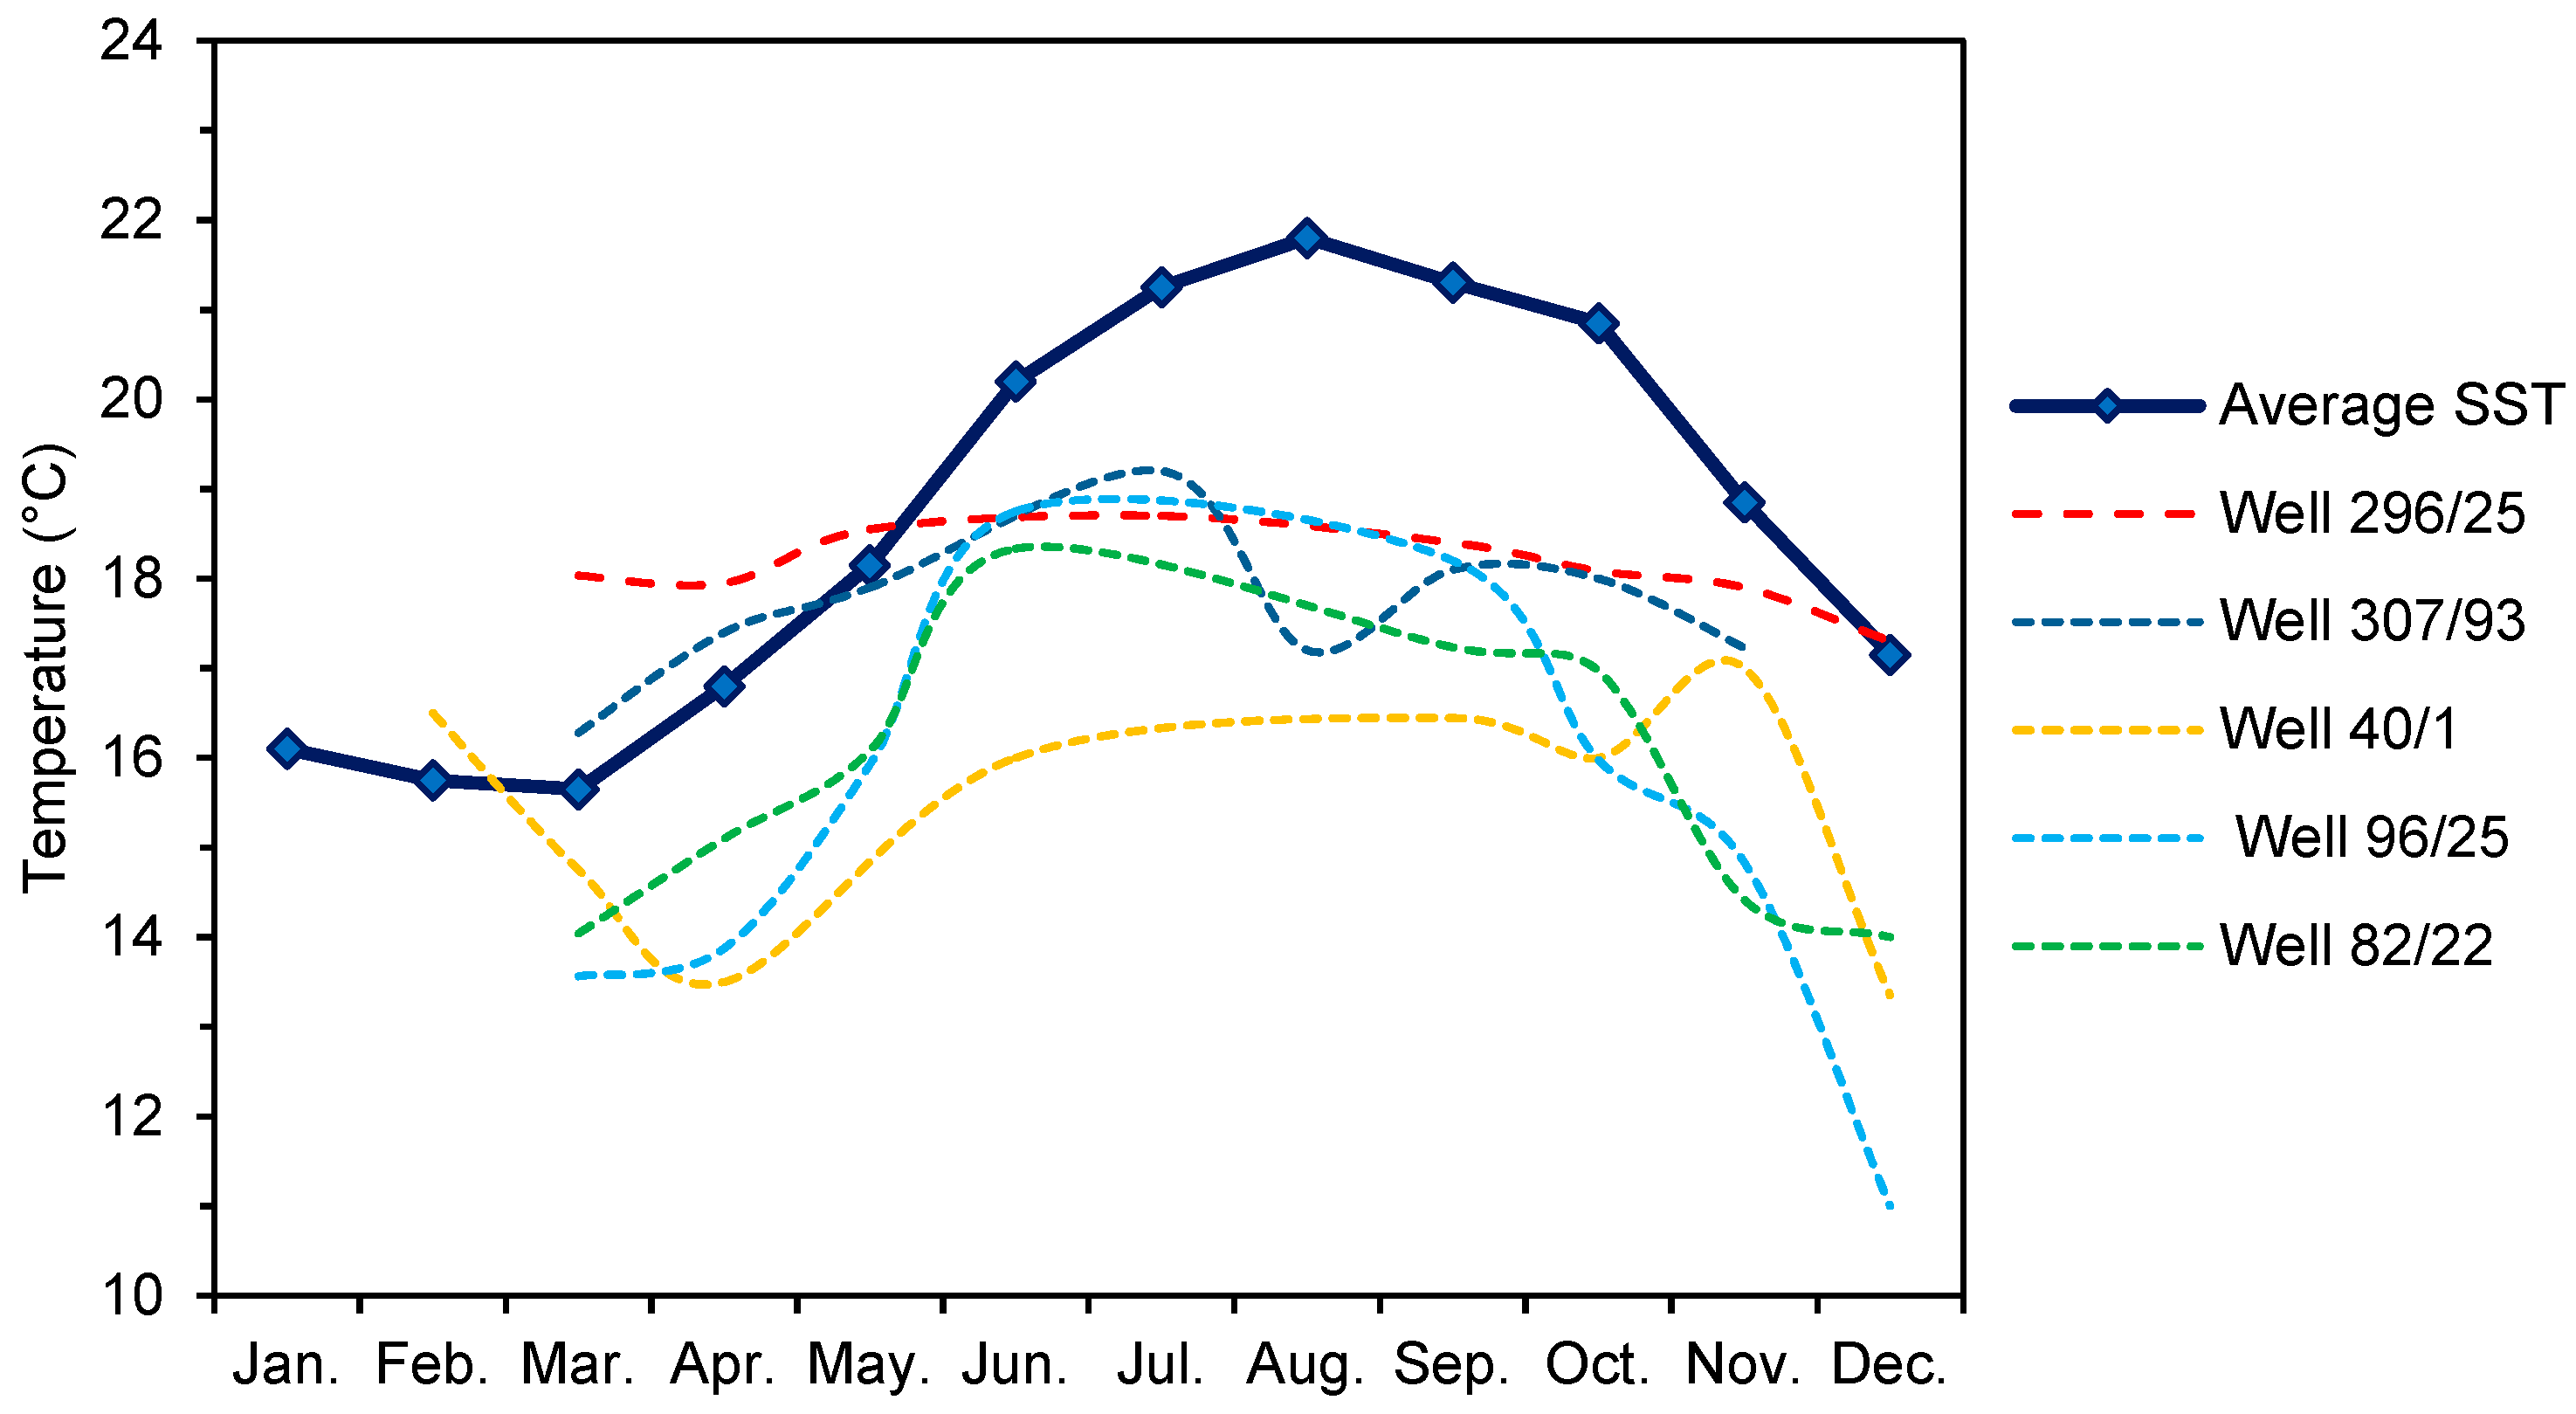
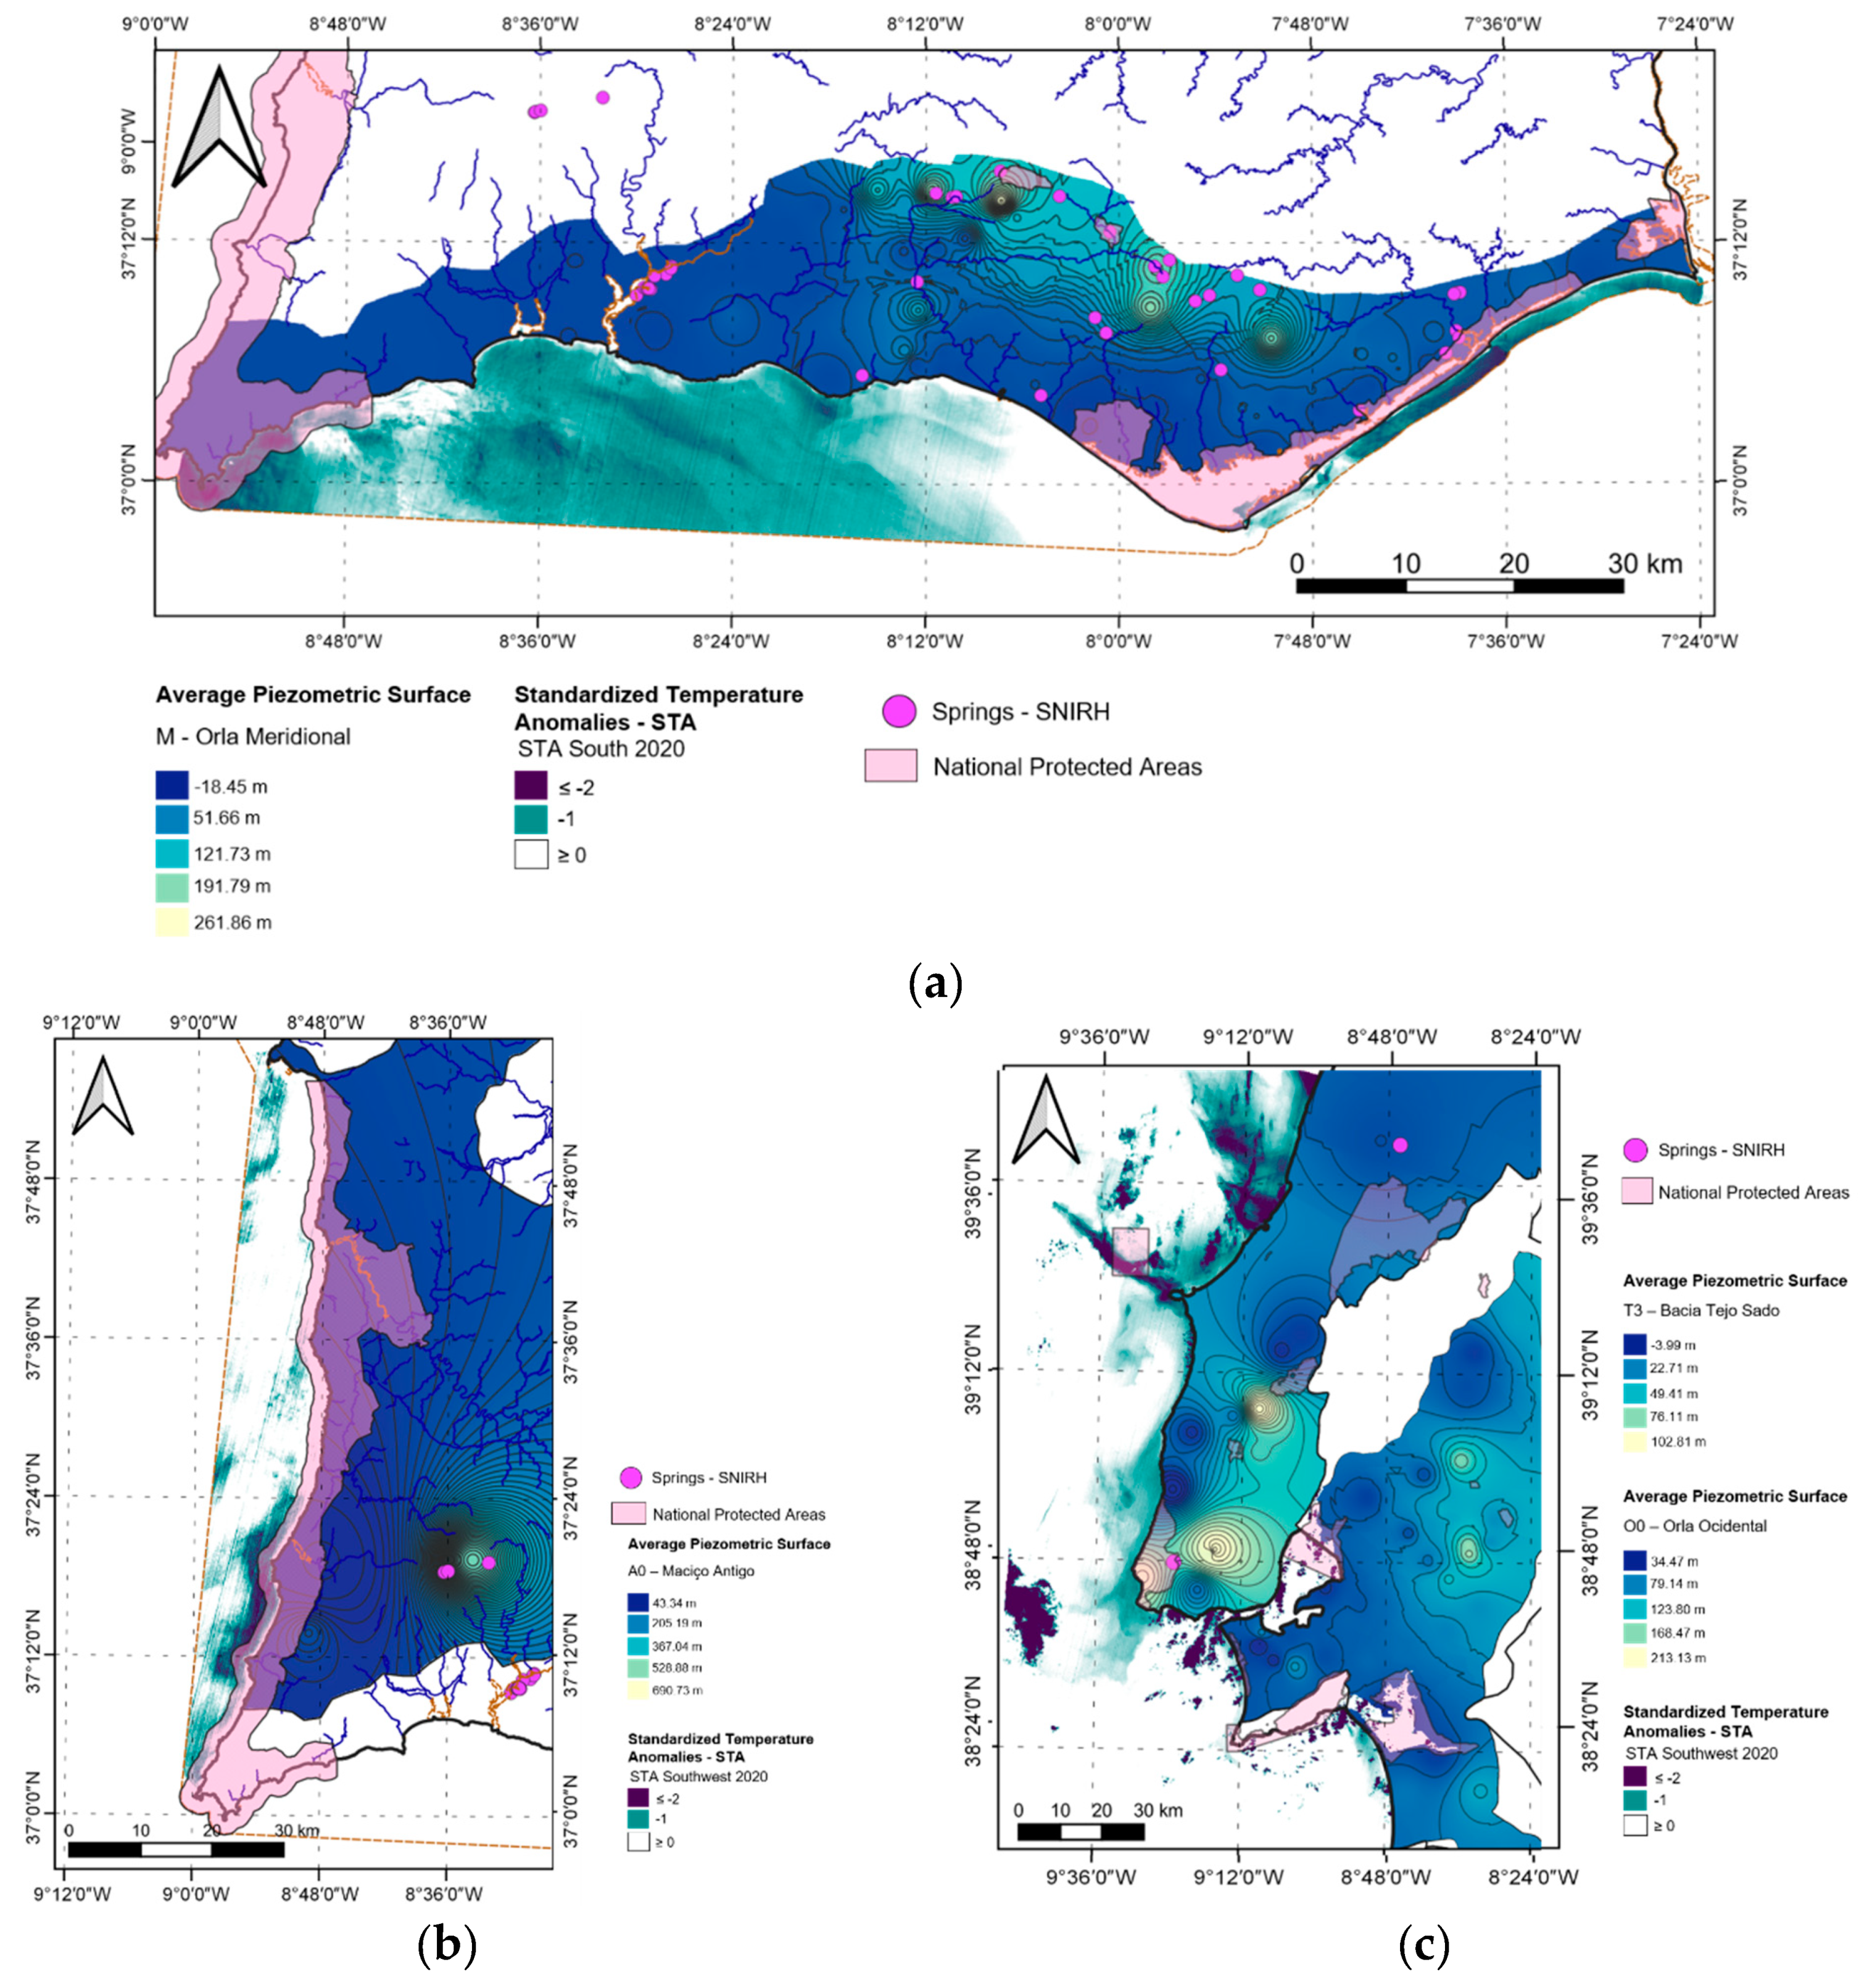
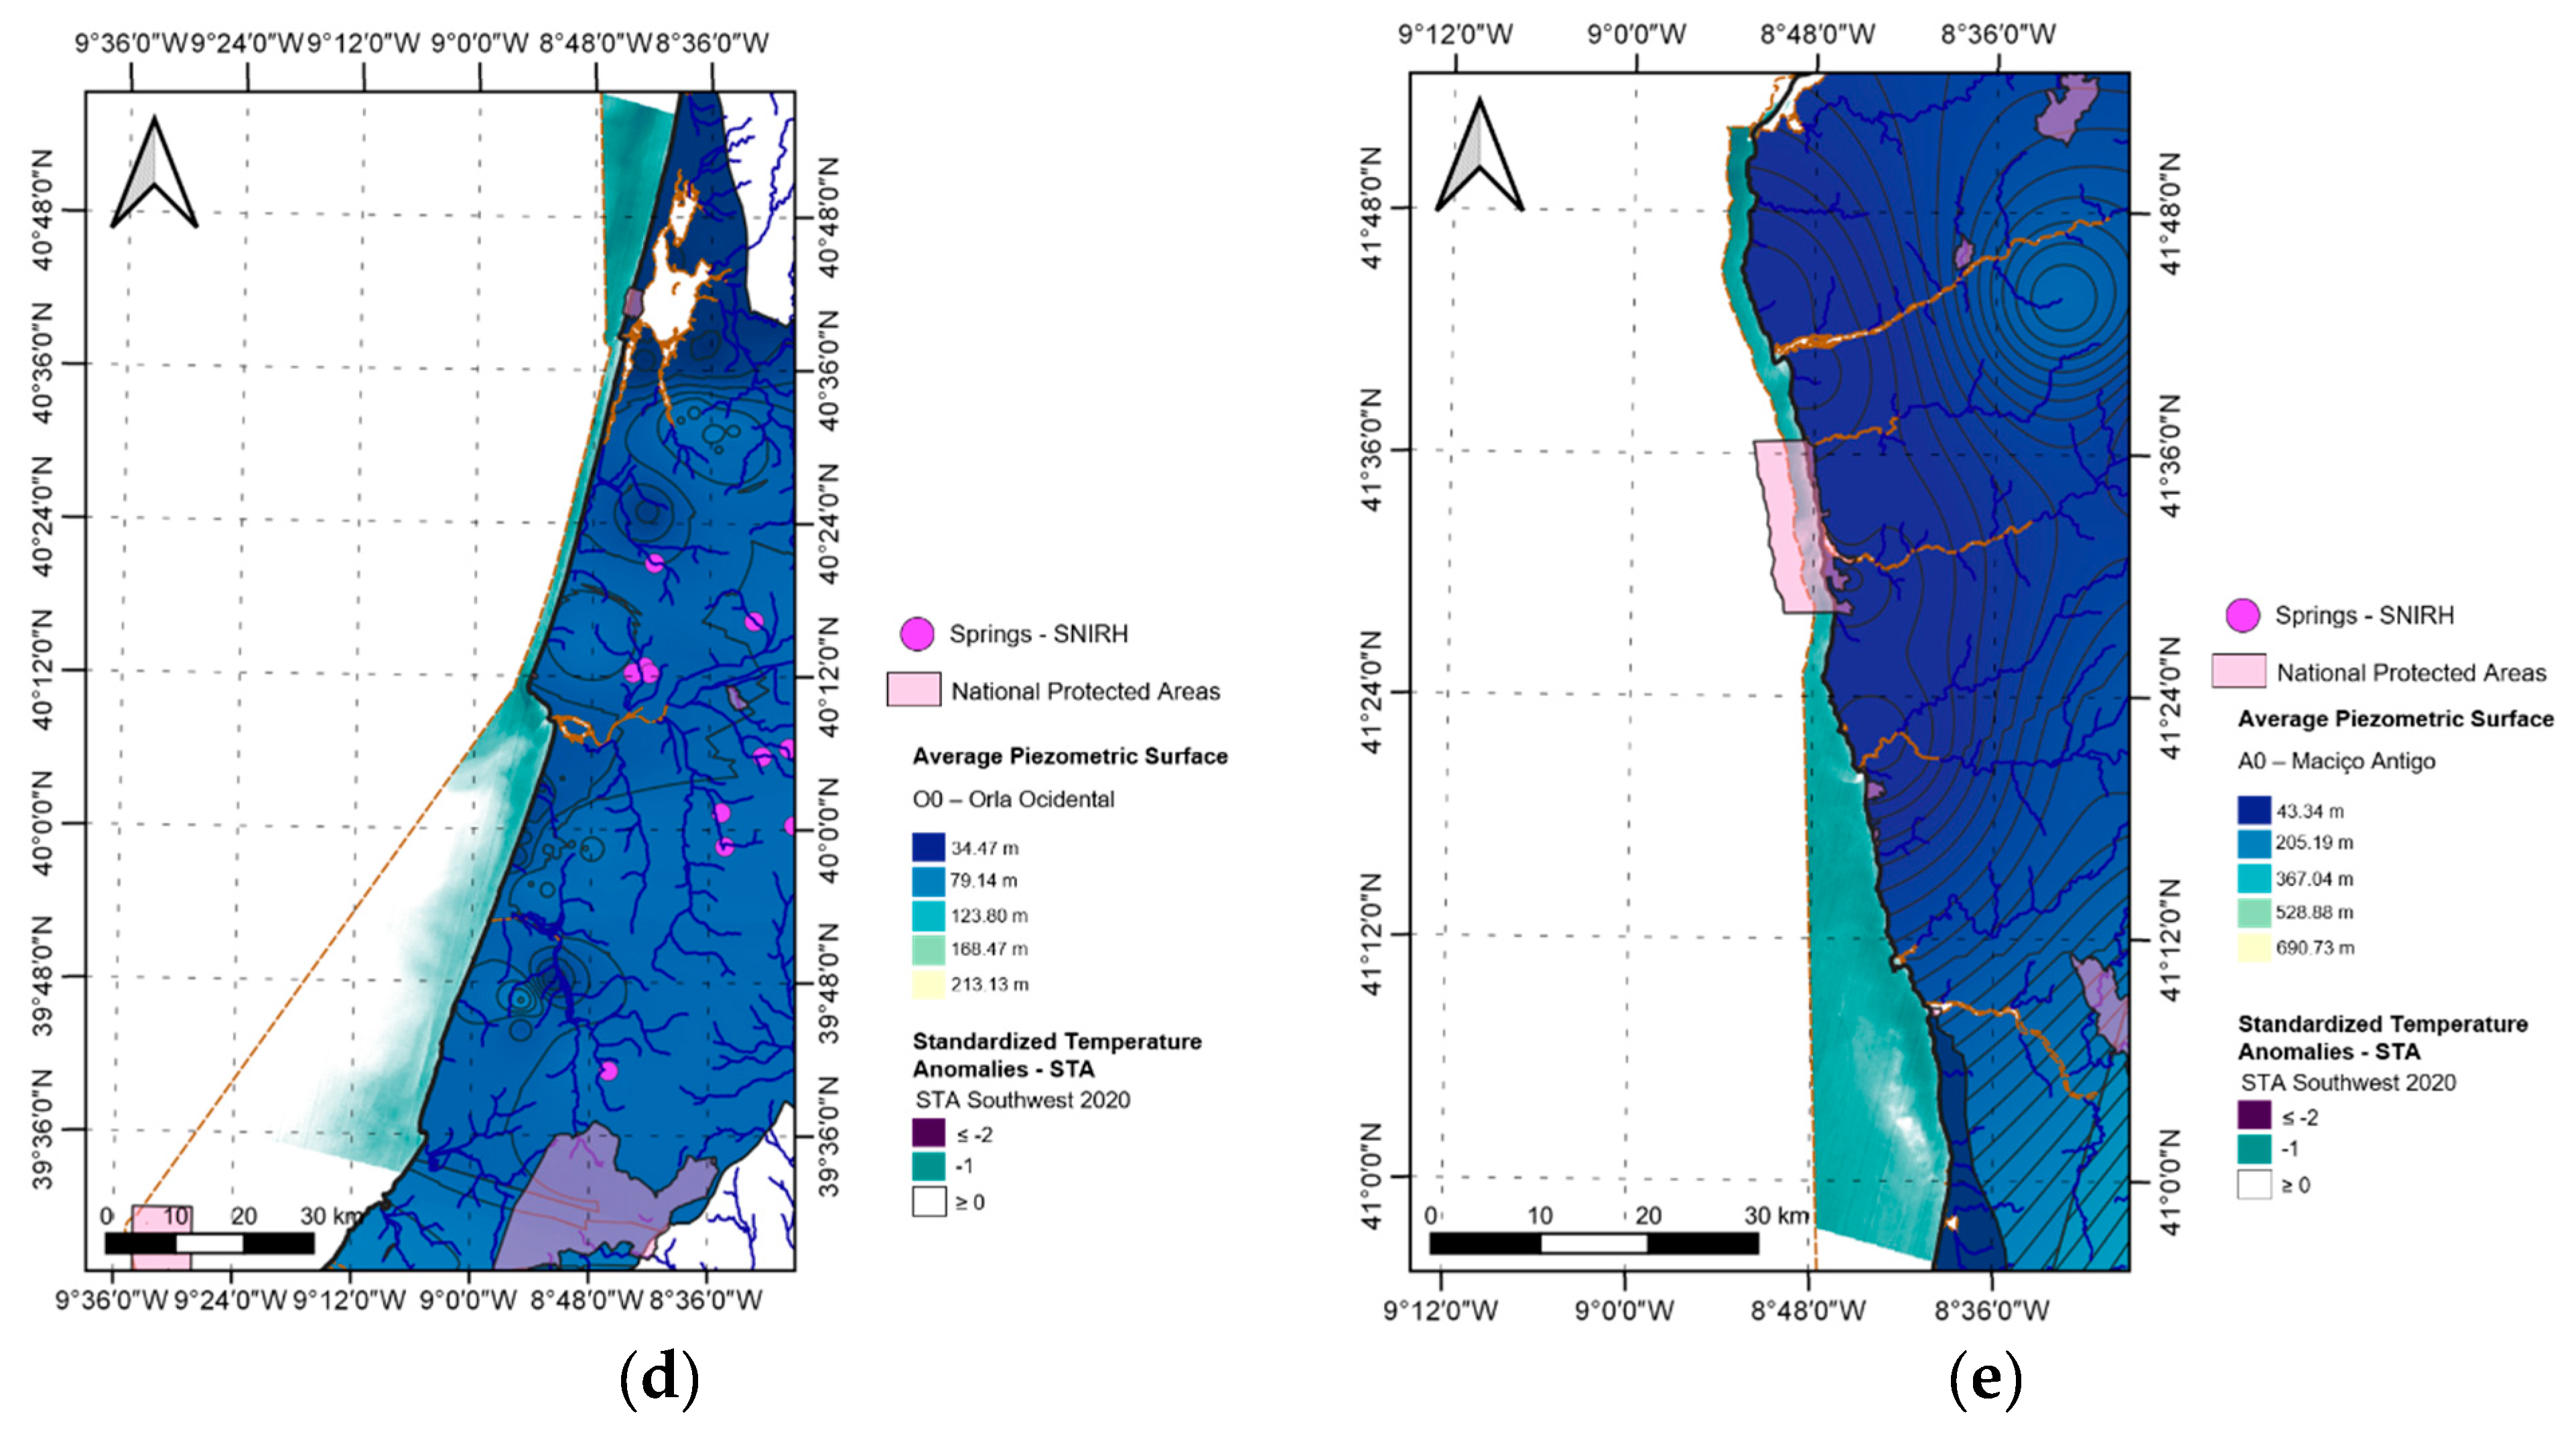
3.1. Temperature and Thermal Anomaly Mapping

The SST derived from Landsat 8 were compared to the average observed SST values of the summer months along the Portuguese coast to validate the satellite data. The observational data was obtained from the Sea Temperature Portal that compiles current and historical data of sea water temperatures of coastal cities around the world from various sources, including National Centers for Environmental Information (NOAA) and meteorological services of different countries (https://www.seatemperature.org/; accessed on 1 March 2022). From the available data, 42 coastal locations were selected to be representative of the entire Portuguese coast. As shown in Figure 3 there was a very high correlation (0.81) between observational data and our SST results for the 2020 summer. This validates our SST results, and therefore also the results of the temperature anomalies.

Standardized Temperature Anomalies

Figure 4 shows the map of negative values of the standardized Temperature Anomaly (STA) for the Portuguese coast. Only the negative standardized anomalies are shown, meaning that the surface temperature in those pixels is lower than the average of the scene. Considering the initial hypothesis that the relatively cool groundwater discharging to warmer coastal waters manifests in the thermal imagery, these anomalies can be interpreted as hits for groundwater discharge into the ocean during the summer months of 2020. Nevertheless, it is important to acknowledge that northerly winds prevail around the Iberian Peninsula during spring and summer promotes upwelling, whilst during autumn and winter, the dominant southerly winds produce downwelling of shelf surface waters [36]. Therefore, the visualization of cooler plumes can be somewhat overestimated by remote sensing instruments.
Figure 5 presents detailed hydrological results for each of the five regions delineated in this work. The figure shows the groundwater flow direction, hence, allowing the comparison between the potential groundwater discharge inferred from the sea surface temperature anomalies and the coastal aquifers flow trends of flow. We identified potential discharge areas in all study subregions, with higher prevalence in the South, Northwest and North region. The results show a predominance of diffuse SGD in most of the scenes, except for the image of the central region (Figure 5c), where less-clear plume shapes are visible due to the presence of clouds, which limited the analysis.
In the South region (Figure 5a), the visible potential SGD sites can be associated with the presence of coastal aquifers, like the Covões system in the left corner near Sagres and Vila do Bispo. Similarly, the Almádena-Odeáxere, Mexilhoeira Grande—Portimão, and Ferragudo-Albufeira aquifer systems can be associated with the plume observed in the Barlovento algarvio. Furthermore, the aquifer systems of São João da Venda-Quelfes and Luz-Tavira might be the source of the cold-water plume observed in the Sotavento algarvio. In this region, it is noticeable the presence of several springs near the coastline matching the presence of thermal plumes, which supports the interpretation of these sites being potential locations of coastal groundwater discharge.
Similarly for the Northwest region (Figure 5d), Vieira de Leiria-Marinha Grande, Leirosa-Monte Real, and Aveiro systems are probably the most relevant contributors to the plumes detected in those scenes. The results also show that the Center region does not have important areas with negative STA. Although this region contains some of the biggest aquifers in the Iberian Peninsula, the thermal effect of SGD into the large estuaries of Tagus and Sado rivers is attenuated by the warmer temperature those bodies have compared to ocean waters.
In the Southwest and North regions (Figure 5b,e respectively), no specific aquifers are recognizable within the hydrogeological unit corresponding to Maciҫo Antigo. Despite the low hydrogeological potential with which this unit is labelled [37], the groundwater resources stored in those systems are of high importance for the dispersed public supply of many municipalities and for activities like agriculture. This exploitation might explain less coastal discharge. These results require examining their correlation with potentiometric level information and the existence of springs to better understand the dynamic of the water movement in coastal ecosystems.

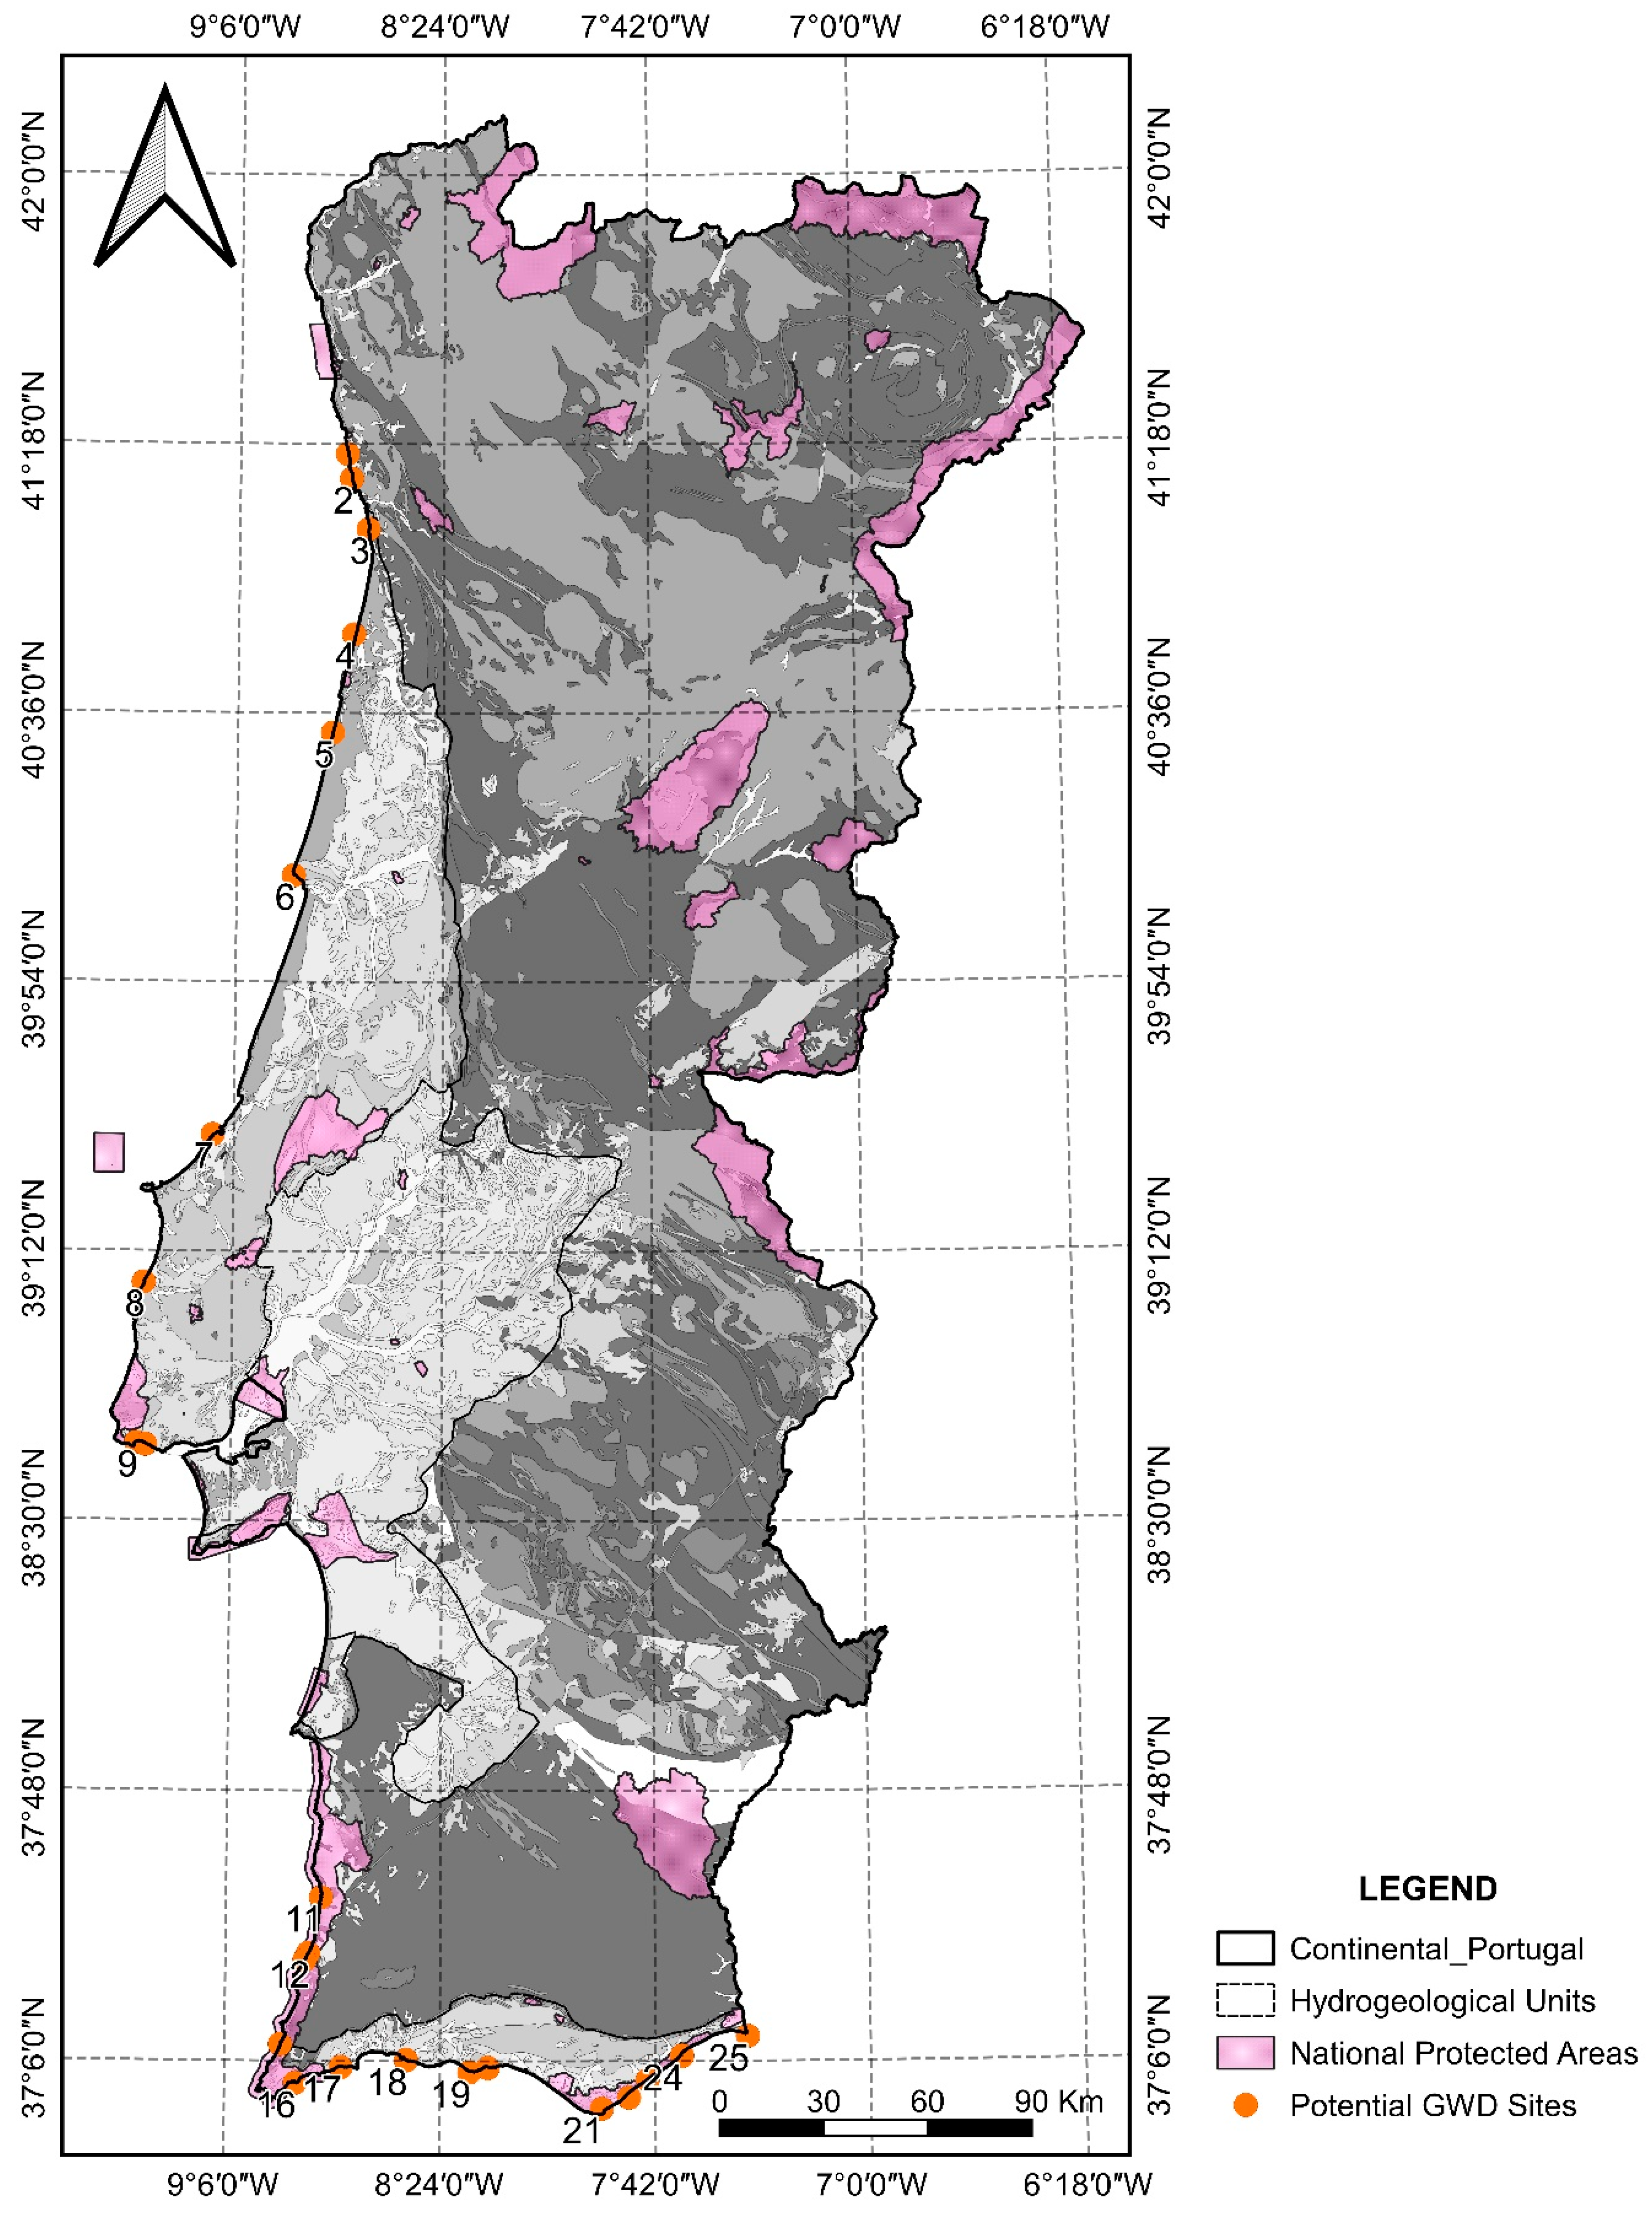
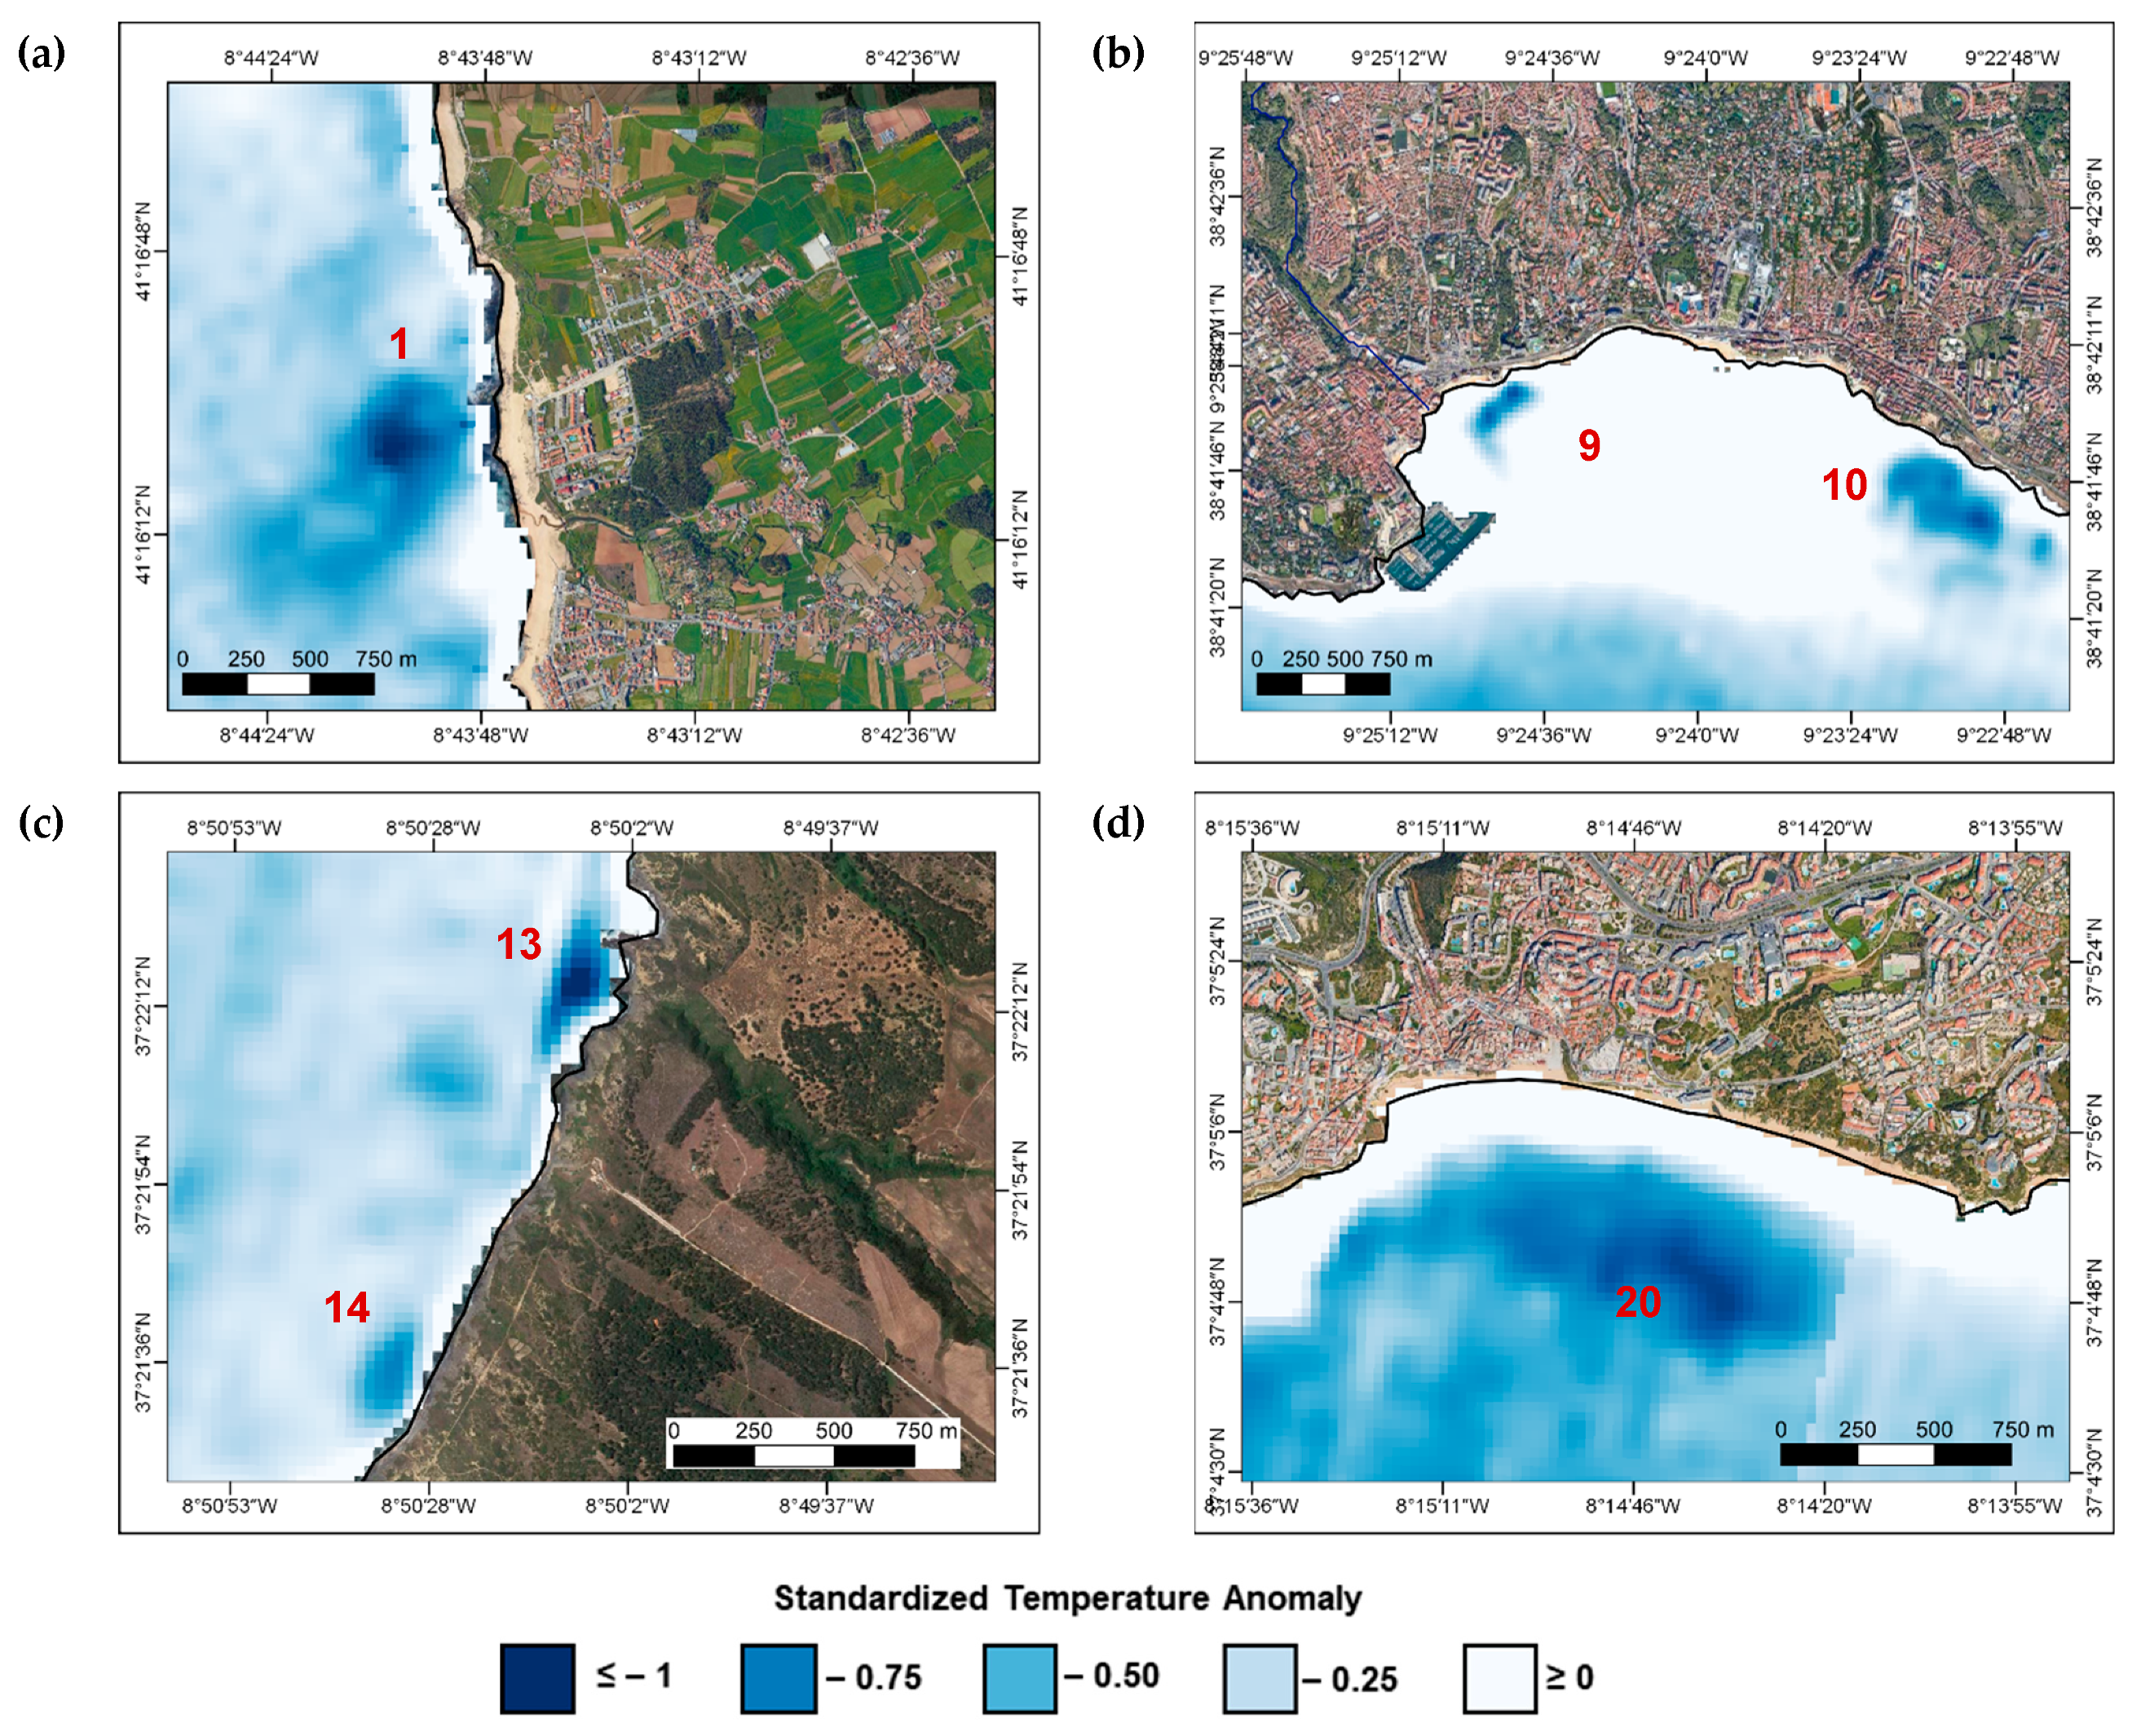
3.2. Identification of Potential Groundwater Discharge Sites

Given the previous results, a visual inspection of temperature anomalies allowed the identification of cold-water anomalies under the premise it represents potential SDG spots. Figure 6 shows the location of 25 identified potential SGD spots. Table 3 includes information about the hydrogeological unit and the dominant lithology of those sites. It is important to highlight the potential SDG sites identified in the south and southwest coasts overlap with national biodiversity protected areas, which gives an early clue that any discharge can have a key influence in terms of flux and solutes for these environments.
Figure 7 presents the negative standardized temperature anomalies from where some examples of the potential SGD described in Table 3 can be detected.

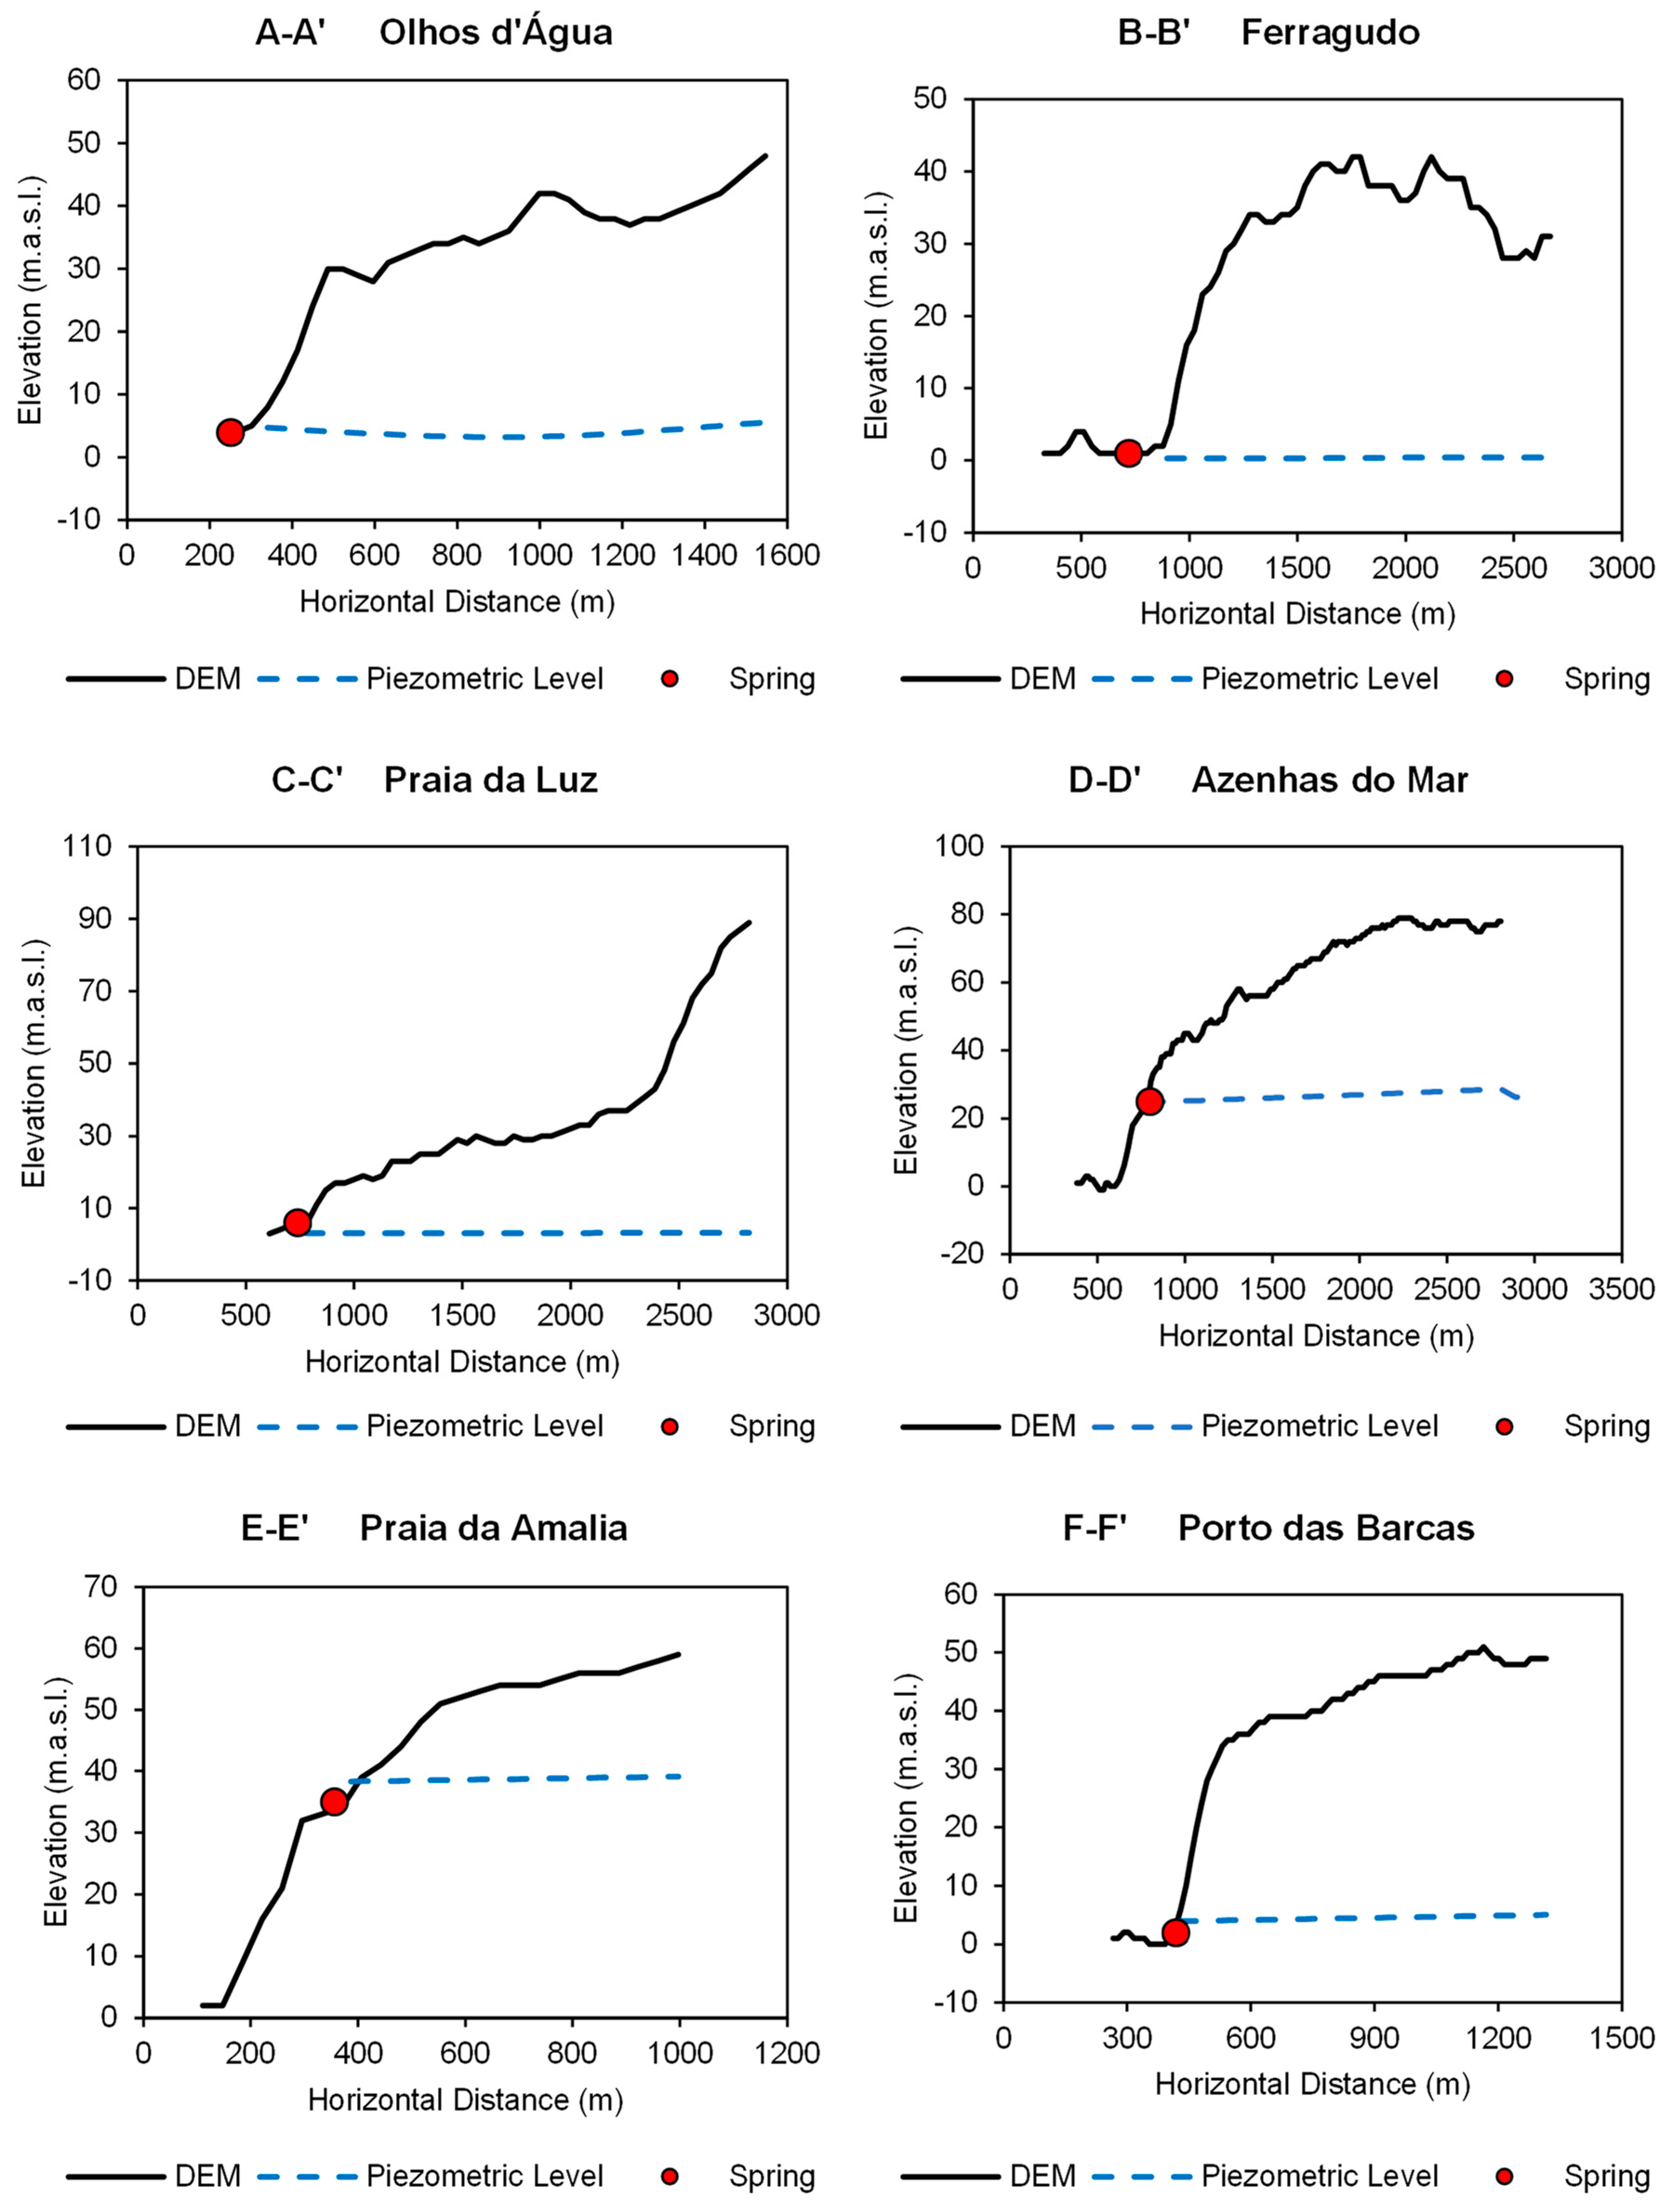
3.3. Piezometric Analysis

As traditionally approached, one of the simplest ways of detecting groundwater discharge is by the analysis of the piezometric surfaces of the aquifers. Here, information from the National Information System of Water Resources (SNIRH-original nomenclature) was used to interpolate over the hydrogeological units. Additionally, a field campaign was carried out to identify potential locally important coastal springs, with a special focus on the southwest region where previous studies had signaled a groundwater effect. Table 4 and Figure 8 present the location of the identified cliff springs discharging into the adjacent intertidal zones.
The profiles of the topography and the piezometric level were built for some of the identified coastal springs using a Digital Elevation Model (DEM). Figure 9 shows the obtained profiles showing that the presence of those springs is explained by the discharge of groundwater. Profiles A-A’, B-B’, and C-C’ are located on the south coast of Portugal, while the three additional profiles correspond to springs in the Southwest region.

4. Discussion

The relevance of Landsat 8 TIR imagery to recognize Submarine Groundwater Discharge (SGD) sites has been effectively applied in previous studies [20,22,23,38]. Here, we also confirmed the capacity of thermal remote sensing for identifying SGD sites at large regional scales. These cold-water plumes can be further interpreted to delineate the location and extent of SDG. To achieve this, we suggest that a complementary analysis must include cross-validation with maps of wind speed and direction to detect and minimize the effect of upwelling and/or downwelling circulation patterns.
The thermal analysis proved to be in our case study by providing a visual-spatial correlation between the location of thermal anomalies plumes and potentiometric surfaces of coastal aquifers. However, it cannot be assumed that the thermal signatures observed are exclusively due to the presence of groundwater as other freshwater sources such as surface runoff can also occur. Local validation would be required but it was beyond the capacity of our study. Nonetheless, the location of the on-field identified springs in the southwest and south rocky shores confirmed the existence of SGD, since a few matched the visual-spatial correlations. It cannot also be assumed that all groundwater seepage points from coastal aquifers can be detected via remote sensing techniques as buoyancy will strongly influence the capacity of the thermal sensor to detect the surface signature [20].
Environmental and marine conditions cause seawater mixing with the discharging groundwater, affecting the thermal contrast between the groundwater plume and seawater [23]. This represents a limitation for the identification of SGD with a thermal-based approach. However, there is little literature discussing the implications of these conditions to the effectiveness of thermal infrared remote sensing techniques to spot potential SGD sites. Jou-Claus et al. [23] discuss the main environmental and marine conditions that can affect SGD identification. On one hand, the action of wind, which can mix the first millimetres of the sea surface water, limits the identification of SGD springs as it weakens the temperature gradient. On the other hand, marine hydrodynamic conditions such as tides, coastal currents and fetch generate seawater movement and mix groundwater with seawater, causing a thermal contrast attenuation. Similarly, the presence of a pycnocline can result in less vertical mixing of the water column. Nonetheless, in subtropical areas with cold winters and hot summers, typical conditions in the areas with the Mediterranean climate, coastal waters often develop a pycnocline during the summer months, as high temperatures increase the evaporation of seawater, generating an increase in salinity and therefore water density. This effect causes cold, fresh groundwater to flow over salty and dense seawater, generating a visible SGD layer on the sea surface [23].
Along the Portuguese coast and usually during the summer, upwelled waters occupy the surface layers over the western shelf and their aerial extension pushes for an onshore-offshore response to the northerly winds cycles. Upwelling events occur due to the interaction between the frictional stress of wind on the ocean surface and the rotation of the earth [39]. Noteworthy, large areas with negative standardized temperature anomalies (STA) were commonly found in regions where hard rocks are dominant. The North and Southwest subregions studied here, correspond to the hydrologically not very productive Maciço Antigo hydrogeological unit. Therefore, we acknowledge the limitation of this methodology in disentangling the effect of SGD and the upwelling of cold waters. It is reasonable to assume to a certain level that at a regional scale, cold waters observed through the infrared imagery might be shaped by the upwelling of cold waters and the hydrodynamic behavior around the steep shelf. The south coast of Portugal is affected directly by upwelling only under locally favorable wind conditions; hence our STA results for this region which indicate large colder water plumes, need to be further analyzed in a more detailed scale.
It is worth remarking that the successful application of thermal imagery to identify sources of SGD is also constrained by the spatial resolution of the remote sensing system employed [20]. The usually coarser spatial resolution of satellite data is unsuccessful in resolving small localized features that are common for SGD [40] especially in highly hydrodynamic shores when the thermal effect of SGD is dissipated [41]. Nonetheless, our results are very promising for regional scale assessments and suggest that the acquisition of higher resolution imagery obtained through airborne surveys would likely serve to elucidate finer-scale patterns of SGD. By doing so, it would likely further highlight numerous and significant inputs of groundwater discharge on a local scale.
Since particular site conditions may also provide clues to the occurrence of SGD, the presence of coastal springs identified in situ reassures that topography and geomorphology can also influence SGD, as described in Samani et al. [22], and Santos et al. [3]. However, these effects remain largely unquantified, hence it offers an opportunity for further research. This research should focus on the correlation of the regional topography of the coastal zone as it determines the slope of the water table, and the inland hydraulic gradient in coastal unconfined aquifers. This gradient governs fresh SGD. Additionally, the identification of unconsolidated coastal ponds and bluffs, which may maintain a high hydraulic head nearshore, maybe other indicators of groundwater discharge sources [13].
The high spatial variability of SGD fluxes results on locally important fluxes in specific areas [15]. The supply of solutes to coastal waters through SGD directly impact the productivity of coastal ecosystems [42,43,44]. SGD can also supply dissolved contaminants to the coastal ocean derived from anthropogenic sources (e.g., agriculture, industrial, mining activities, domestic wastewaters) (e.g., [45,46]), which can endanger the coastal ecosystems and the well-being of local population living around them. In this regard, societies living around SGD-influenced zones may benefit or be harmed by the services and goods provided by the ecosystems influenced by SGD [45]. We showed that some of the identified potential SGD sites are located in national environmental protected areas. The identified GW associated cases in the southwest coast of Portugal correspond to the Southwest Alentejo and Vicentine Coast Natural Park, a world’s heritage site. In the south, some sites overlap with the coastal lagoon Ria Formosa, a RAMSAR site. Hence, this first approach to the identification of potential SGD spots along the Portuguese coast, highlights the need to incorporate the so far ignored effects of SGD on the key biodiversity ecosystems.
Previous studies evaluating the ecological impacts of SGD faced several limitations, mostly associated with the difficulty in locating SGD areas, evaluating the spatial extent of SGD-impacted areas and identifying SGD impacts on local biological communities [2,10,30,44]. Here, we provide a cost-effective solution to address those limitations because satellite TIR imagery is free (Landsat), easily accessible, globally available, multi-temporal and covers a regional scale instantaneously. Furthermore, this study offers a pioneer regional identification of potential SGD spots along the coast of continental Portugal. It constitutes a useful management tool as it guides the future exploration of the dependency of local coastal ecosystems on groundwater discharge.
We suggest that the environmental authorities and coastal water managers should focus their efforts understanding the roles of groundwater in the identified SGD spots, namely, those overlapping with protected areas or are near important coastal ecosystems. A combination of this methodology and that obtained by Ribeiro et al. [47] regarding terrestrial groundwater dependent ecosystems, allows a more efficient implementation of integrated water resources policies.
Different methods are suggested to continue the investigation of potential SGD sites at smaller scales. Finer resolution thermal images using unmanned aerial vehicles would facilitate the identification of local dynamics of SGD in the prioritized spots, and overcome the limitation of the high percentage of cloud cover during the winter and spring months. Additionally, a quantitative combination of the relevant hydrological parameters can serve as a proxy for the SGD conditions. Monitoring of water temperature and salinity with the use of seepage meters, radioactive isotope tracers [20,48], electrical resistivity tomography [49], and correlation with multiple geo-environmental variables [22], is suggested to quantify the SGD and its potential effect in the receiving ecosystems.

5. Conclusions

Our study fills an important gap in the current state of the art by applying a cost-efficient tool for identifying SGD areas at large scales. This tool offers a straightforward procedure to identify potential areas of interest to be prioritize in the implementation of management measures targeting the sustainability of both groundwater and coastal ecosystems.
We suggest future studies should tier up this methodology by including a detailed characterization of potential SGD areas. To this end, finer resolution thermal images, hydrological parameter, tracers, and geophysics, offer advantageous add-ons. Environmental authorities and water managers should focus their efforts in quantifying the SGD and its potential effect in the receiving ecosystems, especially those located in environmentally protected areas.

Author Contributions

Conceptualization, J.E.L.-L., M.T.C.d.M., A.C.F.S.; methodology, J.E.L.-L., M.T.C.d.M.; writing—original draft preparation. J.E.L.-L., A.C.F.S.; writing—review and editing, A.C.F.S., M.T.C.d.M., J.N.N.; supervision, A.C.F.S., M.T.C.d.M.; Funding acquisition M.T.C.d.M. All authors have read and agreed to the published version of the manuscript.

Funding

The authors are grateful for the Foundation for Science and Technology’s support through funding UIDB/04625/2020 from the research unit CERIS.

Institutional Review Board Statement

Not applicable.

Informed Consent Statement

Not applicable.

Data Availability Statement

The data presented in this study are available on request from the corresponding author. The data are not publicly available due to.

Acknowledgments

We would like to thank the European Commission for funding a 2-year Erasmus Mundus scholarship for following the Joint Master Degree Programme on Groundwater and Global Change—Impacts and Adaptation (acronym GroundwatCh), and the research center CERIS—Civil Engineering Research and Innovation for Sustainability at the Civil Engineering, Architecture and Georesources Department of Instituto Superior Técnico of Lisbon.

Conflicts of Interest

The authors declare no conflict of interest.

References

  1. Sawyer, A.H.; Shi, F.; Kirby, J.T.; Michael, H.A. Dynamic response of surface water-groundwater exchange to currents, tides, and waves in a shallow estuary. J. Geophys. Res. Ocean. 2013, 118, 1749–1758. [Google Scholar] [CrossRef]
  2. Amato, D.W.; Bishop, J.M.; Glenn, C.R.; Dulai, H.; Smith, C.M. Impact of submarine groundwater discharge on marine water quality and reef biota of Maui. PLoS ONE 2016, 11, e0165825. [Google Scholar] [CrossRef] [PubMed] [Green Version]
  3. Santos, I.R.; Chen, X.; Lecher, A.L.; Sawyer, A.H.; Moosdorf, N. Submarine groundwater discharge impacts on coastal nutrient biogeochemistry. Nat. Rev. Earth Environ. 2021, 2, 307–323. [Google Scholar] [CrossRef]
  4. Richardson, S.; Irvine, E.; Froend, R.; Boon, P.; Barber, S.; Bonneville, B. Australian Groundwater-Dependent Ecosystems Toolbox Part 1: Assessment Framework; National Water Commision: Camberra, Australia, 2011. [Google Scholar]
  5. Brown, J.; Wyers, A.; Aldous, A.; Bach, L. Groundwater and Biodiversity Conservation: A Methods Guide for Integrating Groundwater Needs of Ecosystems and Species into Conservation Plans in the Pacific Northwest; The Nature Conservancy: Portland, OR, USA, 2007; pp. 1–176. [Google Scholar]
  6. Capone, D.G.; Bautista, M.F. A groundwater source of nitrate in nearshore marine sediments. Nature 1985, 313, 214–216. [Google Scholar] [CrossRef]
  7. Bowen, J.L.; Kroeger, K.; Tomasky, G.; Pabich, W.; Cole, M.; Carmichael, R.; Valiela, I. A review of land-sea coupling by groundwater discharge of nitrogen to New England estuaries: Mechanisms and effects. Appl. Geochem. 2007, 22, 175–191. [Google Scholar] [CrossRef]
  8. Rodellas, V.; Stieglitz, T.C.; Andrisoa, A.; Cook, P.G.; Raimbault, P.; Tamborski, J.J.; van Beek, P.; Radakovitch, O. Groundwater-driven nutrient inputs to coastal lagoons: The relevance of lagoon water recirculation as a conveyor of dissolved nutrients. Sci. Total Environ. 2018, 642, 764–780. [Google Scholar] [CrossRef] [PubMed]
  9. Fujita, K.; Shoji, J.; Sugimoto, R.; Nakajima, T.; Honda, H.; Takeuchi, M.; Tominaga, O.; Taniguchi, M. Increase in fish production through bottom-up trophic linkage in coastal waters induced by nutrients supplied via submarine groundwater. Front. Environ. Sci. 2019, 7, 82. [Google Scholar] [CrossRef]
  10. Starke, C.; Ekau, W.; Moosdorf, N. Enhanced Productivity and Fish Abundance at a Submarine Spring in a Coastal Lagoon on Tahiti, French Polynesia. Front. Mar. Sci. 2020, 6, 809. [Google Scholar] [CrossRef] [Green Version]
  11. Lu, Y.; Yuan, J.; Lu, X.; Su, C.; Zhang, Y.; Wang, C.; Cao, X.; Li, Q.; Su, J.; Ittekkot, V.; et al. Major threats of pollution and climate change to global coastal ecosystems and enhanced management for sustainability. Environ. Pollut. 2018, 239, 670–680. [Google Scholar] [CrossRef] [PubMed] [Green Version]
  12. Taniguchi, M.; Burnett, W.C.; Cable, J.E.; Turner, J.V. Investigation of submarine groundwater discharge. Hydrol. Process. 2006, 16, 2115–2129. [Google Scholar] [CrossRef]
  13. Burnett, W.C.; Aggarwal, P.; Aureli, A.; Bokuniewicz, H.; Cable, J.; Charette, M.; Kontar, E.; Krupa, S.; Kulkarni, K.; Loveless, A.; et al. Quantifying submarine groundwater discharge in the coastal zone via multiple methods. Sci. Total Environ. 2006, 367, 498–543. [Google Scholar] [CrossRef] [PubMed]
  14. Hugman, R.; Stigter, T.Y.; Monteiro, J.P.; Costa, L.; Nunes, L.M. Modeling the spatial and temporal distribution of coastal groundwater discharge for different water use scenarios under epistemic uncertainty: Case study in South Portugal. Environ. Earth Sci. 2015, 73, 2657–2669. [Google Scholar] [CrossRef]
  15. Luijendijk, E.; Gleeson, T.; Moosdorf, N. Fresh groundwater discharge insignificant for the world’s oceans but important for coastal ecosystems. Nat. Commun. 2020, 11, 1260. [Google Scholar] [CrossRef] [PubMed] [Green Version]
  16. Taniguchi, M.; Dulai, H.; Burnett, K.M.; Santos, I.; Sugimoto, R.; Stieglitz, T.; Kim, G.; Moosdorf, N.; Burnett, W.C. Submarine Groundwater Discharge: Updates on Its Measurement Techniques, Geophysical Drivers, Magnitudes, and Effects. Front. Environ. Sci. 2019, 7, 141. [Google Scholar] [CrossRef]
  17. Burnett, W.C.; Peterson, R.; Moore, W.S.; de Oliveira, J. Radon and radium isotopes as tracers of submarine groundwater discharge—Results from the Ubatuba, Brazil SGD assessment intercomparison. Estuar. Coast. Shelf Sci. 2008, 76, 501–511. [Google Scholar] [CrossRef]
  18. Devries, T.; Sarmiento, J.L.; Charette, M.A.; Cho, Y. Global estimate ofsubmarinegroundwater discharge basedonanobservationallyconstrained radium isotope model. Geophys. Res. Lett. 2014, 41, 8438–8444. [Google Scholar] [CrossRef]
  19. Stieglitz, T.; Rapaglia, J.; Bokuniewicz, H. Estimation of submarine groundwater discharge from bulk ground electrical conductivity measurements. J. Geophys. Res. 2008, 113, 8007. [Google Scholar] [CrossRef]
  20. Wilson, J.; Rocha, C. Regional scale assessment of Submarine Groundwater Discharge in Ireland combining medium resolution satellite imagery and geochemical tracing techniques. Remote Sens. Environ. 2012, 119, 21–34. [Google Scholar] [CrossRef]
  21. Tamborski, J.J.; Rogers, A.D.; Bokuniewicz, H.J.; Cochran, J.K.; Young, C.R. Identification and quantification of diffuse fresh submarine groundwater discharge via airborne thermal infrared remote sensing. Remote Sens. Environ. 2015, 171, 202–217. [Google Scholar] [CrossRef] [Green Version]
  22. Samani, A.N.; Farzin, M.; Rahmati, O.; Feiznia, S.; Kazemi, G.; Foody, G.; Melesse, A. Scrutinizing relationships between submarine groundwater discharge and upstream areas using thermal remote sensing: A case study in the northern Persian gulf. Remote Sens. 2021, 13, 358. [Google Scholar] [CrossRef]
  23. Jou-Claus, S.; Folch, A.; Garcia-Orellana, J. Applicability of Landsat 8 Thermal Infrared Sensor to Identify Submarine Groundwater Discharge Springs in the Mediterranean Sea Basin. Hydrol. Earth Syst. Sci. Discuss. 2021, 25, 4789–4805. [Google Scholar] [CrossRef]
  24. Rocha, C.; Veiga-Pires, C.; Scholten, J.; Knoeller, K.; Gröcke, D.R.; Carvalho, L.; Anibal, J.; Wilson, J. Assessing land–ocean connectivity via submarine groundwater discharge (SGD) in the Ria Formosa Lagoon (Portugal): Combining radon measurements and stable isotope hydrology. Hydrol. Earth Syst. Sci. 2016, 20, 3077–3098. [Google Scholar] [CrossRef] [Green Version]
  25. Sousa, F.; Frazão, H.; Carrara, G.; Fernandes, J. Hydrological Characteristics of the Submarine Groundwater Discharges at Olhos de Agua, Algarve—FREEZE Project. In Proceedings of the IX Sympasium on the Iberian Atlantic Margin, Coimbra, Portugal, 4–7 September 2018. [Google Scholar]
  26. Encarnação, J.; Leitão, F.; Range, P.; Piló, D.; Chícharo, M.A.; Chícharo, L. The influence of submarine groundwater discharges on subtidal meiofauna assemblages in south Portugal (Algarve). Estuar. Coast. Shelf Sci. 2013, 130, 202–208. [Google Scholar] [CrossRef] [Green Version]
  27. Fernandes, J.; Carrara, G.; Terrinha, P.; Sousa, F.; Leitão, F.; Loureiro, M.; Roque, C.; Noiva, J.; Boutov, D.; Range, P.; et al. Descargas do Sistema Aquífero Albufeira-Ribeira de Quarteira em Meio Marinho: Métodos e Cartografia. In Proceedings of the X Seminário sobre Águas Subterrâneas, Évora, Portugal, 10 April 2015. [Google Scholar]
  28. Hugman, R.; Stigter, T.; Monteiro, J.P. Potential Offshore Submarine Groundwater in the Albufeira-Ribeira de Quarteira aquifer system (Algarve, Portugal). EGU Gen. Assem. Conf. Abstr. 2015, 146. [Google Scholar]
  29. Silva, A.C.F.; Tavares, P.; Shapouri, M.; Stigter, T.; Monteiro, J.P.; Machado, M.; da Fonseca, L.C.; Ribeiro, L. Estuarine biodiversity as an indicator of groundwater discharge. Estuar. Coast. Shelf Sci. 2012, 97, 38–43. [Google Scholar] [CrossRef]
  30. Piló, D.; Barbosa, A.; Teodósio, M.; Encarnação, J.; Leitão, F.; Range, P.; Krug, L.; Cruz, J.; Chícharo, L. Are submarine groundwater discharges affecting the structure and physiological status of rocky intertidal communities? Mar. Environ. Res. 2018, 136, 158–173. [Google Scholar] [CrossRef] [PubMed]
  31. Satyam, K.; Thiruchitrambalam, G. Habitat Ecology and Diversity of Rocky Shore Fauna; Elsevier Inc.: Amsterdam, The Netherlands, 2018. [Google Scholar]
  32. Mieszkowska, N. Intertidal Indicators of Climate and Global Change. In Climate Change, 2nd ed.; Letcher, T.M., Ed.; Elsevier: Amsterdam, The Netherlands, 2016; pp. 213–229. [Google Scholar]
  33. Encarnação, J.; Leitão, F.; Range, P.; Piló, D.; Chícharo, M.A.; Chícharo, L. Local and temporal variations in near-shore macrobenthic communities associated with submarine groundwater discharges. Mar. Ecol. 2015, 36, 926–941. [Google Scholar] [CrossRef]
  34. Bradtke, K. Landsat 8 data as a source of high resolution sea surface temperature maps in the Baltic sea. Remote Sens. 2021, 13, 4619. [Google Scholar] [CrossRef]
  35. Anderson, M.P. Heat as a ground water tracer. Ground Water 2005, 43, 951–968. [Google Scholar] [CrossRef] [PubMed]
  36. Ibánhez, J.S.P.; Álvarez-Salgado, X.A.; Nieto-Cid, M.; Rocha, C. Fresh and saline submarine groundwater discharge in a large coastal inlet affected by seasonal upwelling. Limnol. Oceanogr. 2021, 66, 2141–2158. [Google Scholar] [CrossRef]
  37. Almeida, C.; Mendonça, J.; Jesus, M.; Gomes, A. Sistemas Aquíferos de Portugal Continental; Instituto da Água: Lisbon, Portugal, 2000; Available online: https://snirh.apambiente.pt/snirh/download/aquiferos_PortugalCont/Introducao_Macico_Antigo.pdf (accessed on 1 March 2022).
  38. Wilson, J.; Rocha, C. A combined remote sensing and multi-tracer approach for localising and assessing groundwater-lake interactions. Int. J. Appl. Earth Obs. Geoinf. 2016, 44, 195–204. [Google Scholar] [CrossRef]
  39. Fiuza, A.F.G. Upwelling Patterns Off Portugal; NATO Conference Series, (Series) 4: Marine Sciences 1983; Springer: Boston, MA, USA, 1983; Volume 10A, pp. 85–98. [Google Scholar] [CrossRef]
  40. Kelly, J.L.; Glenn, C.R.; Lucey, P.G. High-resolution aerial infrared mapping of groundwater discharge to the coastal ocean. Limnol. Oceanogr. Methods 2013, 11, 262–277. [Google Scholar] [CrossRef]
  41. Robinson, C.E.; Xin, P.; Santos, I.R.; Charette, M.A.; Li, L.; Barry, D.A. Groundwater dynamics in subterranean estuaries of coastal unconfined aquifers: Controls on submarine groundwater discharge and chemical inputs to the ocean. Adv. Water Resour. 2018, 115, 315–331. [Google Scholar] [CrossRef]
  42. Johannes, R.E. The ecological significance of the submarine discharge ofgroundwater. Mar. Ecol. Prog. Ser. 1980, 3, 365–373. [Google Scholar] [CrossRef]
  43. Erostate, M.; Huneau, F.; Garel, E.; Ghiotti, S.; Vystavna, Y.; Garrido, M.; Pasqualini, V. Groundwater dependent ecosystems in coastal Mediterranean regions: Characterization, challenges and management for their protection. Water Res. 2020, 172, 115461. [Google Scholar] [CrossRef] [PubMed]
  44. Lecher, A.L.; Mackey, K.R.M. Synthesizing the Effects of Submarine Groundwater Discharge on Marine Biota. Hydrology 2018, 5, 60. [Google Scholar] [CrossRef] [Green Version]
  45. Alorda-Kleinglass, A.; Ruiz-Mallén, I.; Diego-Feliu, M.; Rodellas, V.; Bruach-Menchén, J.M.; Garcia-Orellana, J. The social implications of Submarine Groundwater Discharge from an Ecosystem Services perspective: A systematic review. Earth-Sci. Rev. 2021, 221, 103742. [Google Scholar] [CrossRef]
  46. Rodellas, V.; Garcia-Orellana, J.; Masqué, P.; Feldman, M.; Weinstein, Y.; Boyle, E.A. Submarine groundwater discharge as a major source of nutrients to the Mediterranean Sea. Proc. Natl. Acad. Sci. USA 2015, 112, 3926–3930. [Google Scholar] [CrossRef] [Green Version]
  47. Ribeiro, L.; Nascimento, J.; Buxo, A.C.; de Melo, M.T.C.; Silva, A.; Mendes, M.P. Metodologia Para a Identificação de Ecossistemas Terrestres Dependentes das águas Subterrâneas (ETDAS) em Portugal; Report Made for Agência Portuguesa do Ambiente; Tecnico Lisboa: Amadora, Portugal, 2015; 89p. [Google Scholar]
  48. Garcia-Solsona, E.; Garcia-Orellana, J.; Masque, P.; Garcés, E.; Radakovitch, O.; Mayer, A.; Estrade, S.; Basterretxea, G. An assessment of karstic submarine groundwater and associated nutrient discharge to a Mediterranean coastal area (Balearic Islands, Spain) using radium isotopes. Biogeochemistry 2010, 97, 211–229. [Google Scholar] [CrossRef]
  49. Fu, T.; Zhang, Y.; Xu, X.; Su, Q.; Chen, G.; Guo, X. Assessment of submarine groundwater discharge in the intertidal zone of Laizhou Bay, China, using electrical resistivity tomography. Estuar. Coast. Shelf Sci. 2020, 245, 106972. [Google Scholar] [CrossRef]
Figure 1. Methodological flow chart for the selection, acquisition, processing and analysis of the Thermal Infrared Landsat 8 images.
Jmse 10 00414 g001
Figure 2. Comparison of groundwater average temperature values in several wells and SST measures obtained from Portuguese Institute for Sea and Atmosphere.
Jmse 10 00414 g002
Figure 3. Correlation of the Sea Surface Temperature between the derived SST from Landsat 8 and observed SST in replicated points along the Portuguese coast.
Jmse 10 00414 g003
Figure 4. Negative standardized Temperature Anomalies (STA) in the coastal zone of Portugal. Negative STA indicates colder water assumed to potentially be groundwater discharge.
Jmse 10 00414 g004
Figure 5. Standardized Temperature Anomaly and Potentiometric Surface for the (a) South, (b) Southwest, (c) Center, (d) Northwest, and (e) North subregions.
Jmse 10 00414 g005aJmse 10 00414 g005b
Figure 6. Location of potential sites of groundwater discharge in the Portuguese coastline based on visual inspection of temperature anomalies.
Jmse 10 00414 g006
Figure 7. Standardized Temperature Anomaly maps and potential SGD sites in (a) Praia de Labruge (1) in the North, (b) Baía de Cascais (9) and Sao Joao de Estoril (10) in the Center region, (c) Praia de Carriagem (13) and Praia de Amoreira (14) in the Southwest coast, and (d) Albufeira (20) in the South coast of Portugal.
Jmse 10 00414 g007
Figure 8. Potential Groundwater Discharge Springs identified in situ in South and Southwest Portugal.
Jmse 10 00414 g008
Figure 9. Coastal springs profiles based on the comparison of the Digital Elevation Model (DEM) and the average piezometric surface of the hydrological units.
Jmse 10 00414 g009
Table 1. Landsat 8 scenes acquired for regional analysis in the coastline of Portugal (map) and data acquisition details.
Coverage AreaPathRowCenter LatitudeCenter Longitude
Jmse 10 00414 i001South2033437.4745−7.7507
South West2043437.4747−9.2899
Center2043338.9045−8.8684
North West2043240.3326−8.4204
North2053141.7596−9.5063
Table 2. Atmospheric correction parameters used for the study sub-regions: Upwelling and downwelling radiances, atmospheric transmission.
Scene DateCoverage AreaPathRowTimeUpwelling
W·m−2·sr−1·µm−1
Downwelling
W·m−2·sr−1·µm−1
Transmission %
19 August 2020South2033411:09:031.091.850.88
10 August 2020Southwest2043411:15:091.662.690.80
25 July 2020Center2043311:14:421.602.630.81
25 July 2020Northwest2043211:14:181.532.520.82
16 July 2020North2053111:20:031.592.610.81
Table 3. Description of the cold-water anomalies and potential sites of groundwater discharge.
IDNameLatitudeLongitudeHydrogeological UnitLithology
1Praia de Labruge41.27360−8.73318Maciço AntigoGranites and related rocks
2Praia do Aterro41.20936−8.71803Maciço AntigoSand and gravels
3Praia de Francelos41.07932−8.66160Orla OcidentalDunes and eolian sand
4Quintas do Norte40.80460−8.70720Orla OcidentalDunes and eolian sand
5Praia da Duna Alta40.54517−8.77860Orla OcidentalDunes and eolian sand
6Redondos40.16267−8.88326Orla OcidentalConglomerates, sandstones, limestones, dolomitic limestones, loamy limestones, marls
7Salir do Porto39.50304−9.17079Orla OcidentalConglomerates, sandstones, limestones, dolomitic limestones, loamy limestones, marls
8Praia Azul39.11729−9.39564Orla OcidentalConglomerates, sandstones, limestones, dolomitic limestones, loamy limestones, marls
9Baia de Cascais38.69938−9.41320Orla OcidentalSandstones, Conglomerates, limestones, dolomitic limestones, loamy limestones, marls
10Sao Joao de Estoril38.69500−9.38345Orla OcidentalSandstones, Conglomerates, limestones, dolomitic limestones, loamy limestones, marls
11Zambujeira do Mar37.52343−8.78933Maciço AntigoClayey shales and schists, greywackes, sandstones
12Praia de Vale dos Homes37.37861−8.83011Maciço AntigoClayey shales and schists, greywackes, sandstones
13Praia de Carriagem37.37050−8.83593Maciço AntigoClayey shales and schists, greywackes, sandstones
14Praia de Amoreira37.35930−8.84234Maciço AntigoAlluvium
15Praia do Mirouco37.14162−8.91981Maciço AntigoClayey shales and schists, greywackes, sandstones
16Zavial37.04208−8.87103Orla MeridionalSedimentary Formation. Conglomerates, sandstones, limestones
17Praia da Luz37.08306−8.72242Orla MeridionalSandstones, Conglomerates, limestones, dolomitic limestones, loamy limestones, marls
18Ferragudo37.10202−8.50998Orla MeridionalSandstones, more or less marly limestone, sand, gravel, clay
19Evaristo37.07112−8.30435Orla MeridionalSandstones, more or less marly limestone, sand, gravel, clay
20Albufeira37.08242−8.24468Orla MeridionalSandstones, more or less marly limestone, sand, gravel, clay
21Ilha do Faron Ria Formosa36.97688−7.87467Orla MeridionalAlluvium
22Armona37.00560−7.78606Orla MeridionalAlluvium
23Fuseta37.05151−7.72536Orla MeridionalAlluvium
24Tavira37.11274−7.61348Orla MeridionalAlluvium, Dunes and eolian sand
25Santo Antonio37.16320−7.39936Orla MeridionalAlluvium, Dunes and eolian sand
Table 4. Location of coastal springs identified in situ during the fieldwork reconnaissance campaign in the South and Southwest coast of Portugal.
NameLatitudeLongitude
1Almograve37.65083−8.80253
2Alteirinhos37.51851−8.78819
3Carvalhal37.50016−8.79107
4Ferragudo37.10452−8.51325
5Foz do Almograve37.65772−8.80002
6Foz do Barranco do Cavaleiro37.60297−8.81520
7Lapa de Pombas37.63606−8.80846
8Porto das Barcas37.55092−8.79188
9Machados37.49146−8.79405
10Nascedios A37.68144−8.79515
11Olhos d’Agua37.08953−8.18867
12Praia da Amalia37.48142−8.79476
13Praia da Luz37.08550−8.72883
14Ribeira da Azenha37.46322−8.79685
15Zambujeira37.52250−8.78655
Publisher’s Note: MDPI stays neutral with regard to jurisdictional claims in published maps and institutional affiliations.

