1. Introduction
For many years, most large intercontinental vessels such as tankers and bulk carriers rely on large slow-running two-stroke engines as their main source of propulsion. With the ability to run on cheaper, low-quality fuel, ship owners can save a huge portion of operating costs, generating a larger profit margin. Throughout the years, two-stroke engines are constantly being improved, and they are highly optimized for the slow, constant speed operation of large merchant vessels, providing higher thermal efficiency of up to 55% [
1]. However, due to the increasing global demands for CO
2 emission reduction and the implementation of more stringent environmental regulations, the sustainability of the current propulsion technology becomes questionable.
On the other hand, small to medium vessels [
2], such as tugboats and ferries, use relatively low-powered two- and four-stroke engines, which tend to be less efficient than their larger counterparts. Hybrid propulsion technology [
3,
4,
5,
6,
7] has been adopted onboard smaller vessels, providing opportunities such as fuel saving, emission reduction, and efficiency improvement. Hybrid propulsion works well with smaller vessels, as they tend to operate with a significant amount of time spent on idling, loitering at low speeds, and operating at varying speeds. With variable engine loads, these vessels operate inefficiently, resulting in a higher fuel consumption rate [
8].
In 2014, the study performed by the International Maritime Organization (IMO) [
9] predicted that international shipping accounts for around 2.2% of global annual CO
2 emissions. With the growth in seaborne trade, a 50 to 250 percent greenhouse emission growth is expected to happen by the year 2050. To curb the emission issue, the IMO aims to reduce emissions up to 40 percent by 2030 and 70 percent by 2050, followed by the complete phase-out in subsequent measures.
Apart from the greenhouse gas emissions, fossil fuel prices and the global Sulphur emission compliance are also factors that concern ship owners. As most slow-running two-stroke diesel engines rely on low-grade fuel, the combustion process could produce pollutants such as Sulphur oxides and Nitrogen oxides. The formation of Nitrogen oxides is caused by high temperatures during the fuel burning processes. Similarly, Sulphur oxides also form under high temperatures, and can also be produced during the incomplete combustion process. Both pollutants react with atmospheric gases to form by-products that damage human health and the environment. To combat emissions, control measures such as IMO Marpol Annex VI restrict Nitrogen oxide emissions for vessels fitted with marine diesel engines with over 130 kW output. The emission limit is based on the vessel’s construction date and the engine’s rated speed. In addition, effective 1 January 2020, the IMO implemented regulation reducing the Sulphur limit for marine fuels used globally from 3.5% to 0.5%.
With the imminent environmental regulations and the rising cost of fossil fuel, using batteries might just be the next step into cleaner and relatively efficient shipping. However, integrating the systems onboard large merchant vessels is not as straightforward. Some of the challenges faced are that current battery technology might not sustain the long voyages due to the lack of capacity, the lack of a shore facility to recharge the batteries, and associated implementation costs such as operational costs and installation costs. In addition, further justification of the battery system is needed before actual implementation.
This paper first looks at how transient engine operation affects vessel parameters such as efficiency, fuel consumption, and emission generation. Using fuel consumption data from a model vessel, an estimate of the emission generation can be tabulated with the widely adopted empirical formulas. Secondly, the selection and sizing of hybrid and battery storage systems is performed using collected data. Peak shaving and boosting applications are applied, and fuel consumption and emission reduction are highlighted. Lastly, feasibility and economic assessment is conducted.
2. Transient Loads of Engine
Transient loading of the engine can be caused by several factors: the cold start of the engine, environmental conditions, and vessel mission. During operation, a series of increases and decreases of the ship’s resistance is felt by the propeller due to the ocean currents and waves. This causes the engine to experience cyclic load due to the different demands in power. A study carried out by MAN Energy Solutions [
10] shows how transient load affects engine operation. The engine specified in the test is simulated under rough ocean conditions, operating at a steady engine load of 75%. The waves resulted in a cyclic load effect on the engine, causing the engine load to peak at 87% and dip to 65%. The load could affect the specific fuel oil consumption, peaking at 174 g/kWh and dipping to 163 g/kWh.
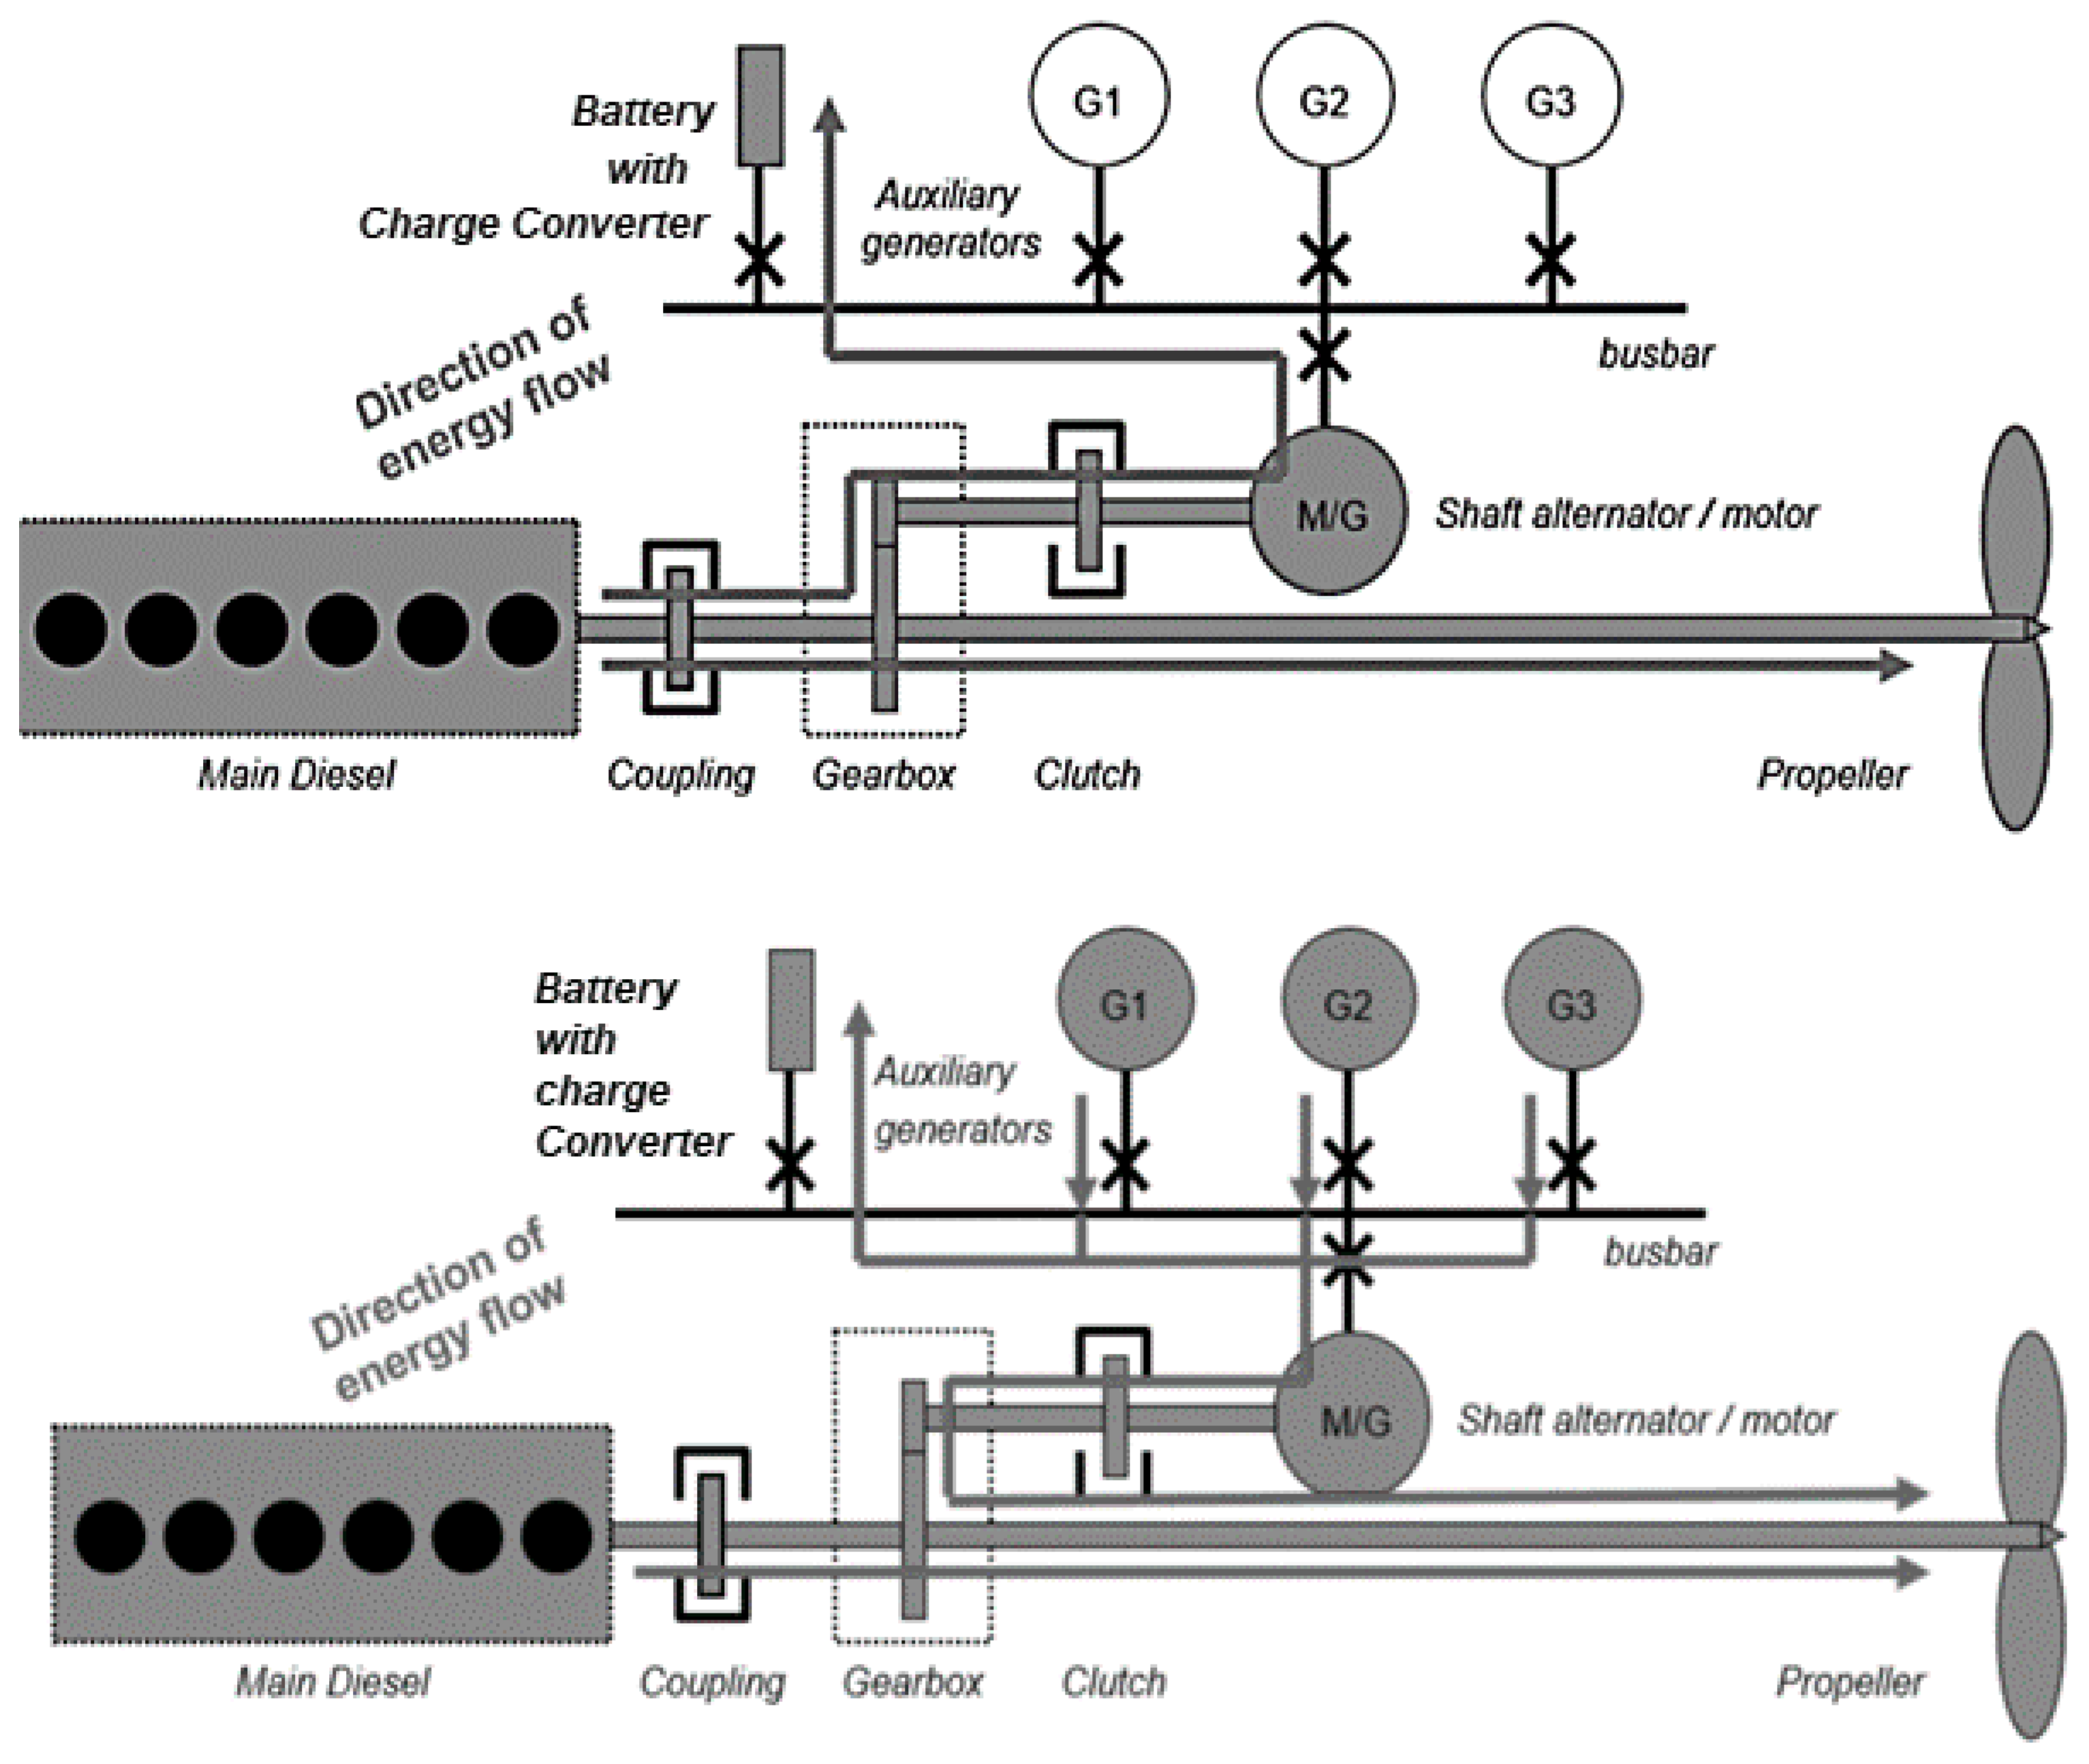
To keep the power fixed and maintain a steady load, a hybrid battery diesel propulsion system can be adopted, as shown in
Figure 1. During the PTO (Power Take Out) mode of operation, the shaft generator is operating as an alternator to provide the primary power supply for the vessel electrical systems, while in PTI (Power Take In) mode of operation, the shaft generator is operating as a synchronous motor. It can provide a boost in power together with the main engine to allow the main engine to reduce power. In addition, the charge controller ensures the battery is adequately charged and not over-charged. Incorporating a battery allows for peak shaving for the main engine, thus reducing fuel consumption. An approximate 5% reduction in specific fuel oil consumption can be recorded after peak shaving.
3. Ship Model and Route Selection
With 17,229 billion tonne-miles of major bulk traded in 2018, major dry bulk trades contribute to about one-third of the overall tonne-miles generated by seaborne trade [
11]. The seaborne trade reflects the distance travelled by the vessels, equating to the amount of emission generated. In this paper, a bulk carrier classed under ClassNK is chosen. Parameters for the vessel are tabulated in
Table 1. Note that the deadweight tonnage consists of fuel, cargo, fresh water, ballast water, passengers, provisions, and crew members. In addition, the vessel operates with a two-stroke single-acting, 6-cylinder Mitsui MAN B&W engine, as seen in
Table 1.
The trade route for the vessel takes on the commodity the vessel is carrying. Australia is one of the biggest iron ore exporters, supplying iron ore to Europe as well as Asia. Two routes with varying distances are selected to show the difference in savings to the distance travelled. Alternatively, different routes can be chosen for the study.
There are a few software options that we can use, but we chose FastSeas, as it is an opensource weather routing tool used to compute the quickest route from point A to point B given the information from current oceanic currents and the National Oceanic and Atmospheric Administration (NOAA) Global Forecast System (GFS) weather forecast. With the aid of the weather routing tool FastSeas, various route data such as voyage distance and duration can be obtained via the FastSeas website. The tabulated data can be seen in
Table 2 and the plotted routes in
Figure 2. The ideal duration is simulated under no ocean current and wind effects, thus resulting in a shorter period. Information such as the vessel’s average speed can be fed into FastSeas. Typically, the hull speed can be estimated using the following relationship.
where
Vhull is the hull speed (in knots),
LWL is the length of a ship at the level where it sits in the water (in feet), and the constant is given as
.
However, the average speed of a bulk carrier is around 13 to 15 knots. Hence, in this paper, the average hull speed of 14 knots is assumed for the subsequent computation.
4. Emission Estimation
A vessel’s emission depends on many different variables, but the engine parameters such as size, speed, load type have a more significant impact. There are currently two methods of emission calculation [
12] that are extensively being used worldwide. The first method, the top-down approach, evaluates fuel consumption statistics or bunker fuel statistics in the marine field. The data allow researchers to estimate the average emission factor [
13]. The second method, called the bottom-up approach, calculates a significantly higher percentage of fuel consumption than the top-down method since this approach considers more parameters, such as installed power and operating profile of vessel. We examine the three primary emissions produced by shipping operations, namely, Carbon dioxide (CO
2), Sulphur oxides (SO
x), and Nitrogen oxides (NO
x).
CO
2 is mainly dependent on the amount of fuel burnt during voyages. Knowing the vessel’s total fuel consumption per voyage, the CO
2 emitted can be estimated. Sulphur oxides and Nitrogen oxides form under high temperatures during the fuel-burning process. Sulphur oxide production is closely related to the percentage of Sulphur content in the fuel. Sulphur content varies depending on the type of fuel burnt, but currently, the commonly used marine fuel contains around 2.7% Sulphur content. Sulphur oxide emissions (g/kg
fuel) from fuel usage can be estimated as follows [
14].
where
fs (%) is the mass fraction of Sulphur in fuel, and factor 20 comes from recalculation of the molar weight from S to SO
2 and from % to g/kg. In this case, the Sulphur content of 2.7% is used.
Nitrogen oxide is harder to estimate. The emission can be lowered by reducing the maximum combustion temperature. It depends on the operation as well as the specifications of the engine. Equation (3) uses an activity-based method [
14] to deduce the emission production (g).
where
MCR (maximum continuous rating that the generator can produce over a year under normal condition) of the engine (kW),
Load is the loading of the engine per day as calculated by interpolation of shop test and sea trial data (no unit),
Time is the activity time of the vessel (h), and
EF is the emission factor (g/kWh). The duration of the voyage can be obtained from the above routes, while the emission factor can be obtained from
Table 3. The two emission factors, power based (in g/kWh) and fuel based (in g/kg
fuel), can be seen in
Table 3. The mutual relation is the amount of pollutant (g) present in the emission.
5. Hybrid Battery System
The diesel mechanic system is the most used system for large merchant vessels. It uses a two-stroke main engine for propulsion and four-stroke medium-speed engines working as auxiliary generators. For a semi-hybrid diesel mechanic system, a battery is included in the conventional system where the electric grid is separated from the main propulsion. The integration of a battery allows for peak shaving. The batteries are incorporated, with the combination of PTO and PTI on the main engine. The battery and auxiliary engine support the main engine during operation and allow charging the battery at sea, allowing emission-free port stays.
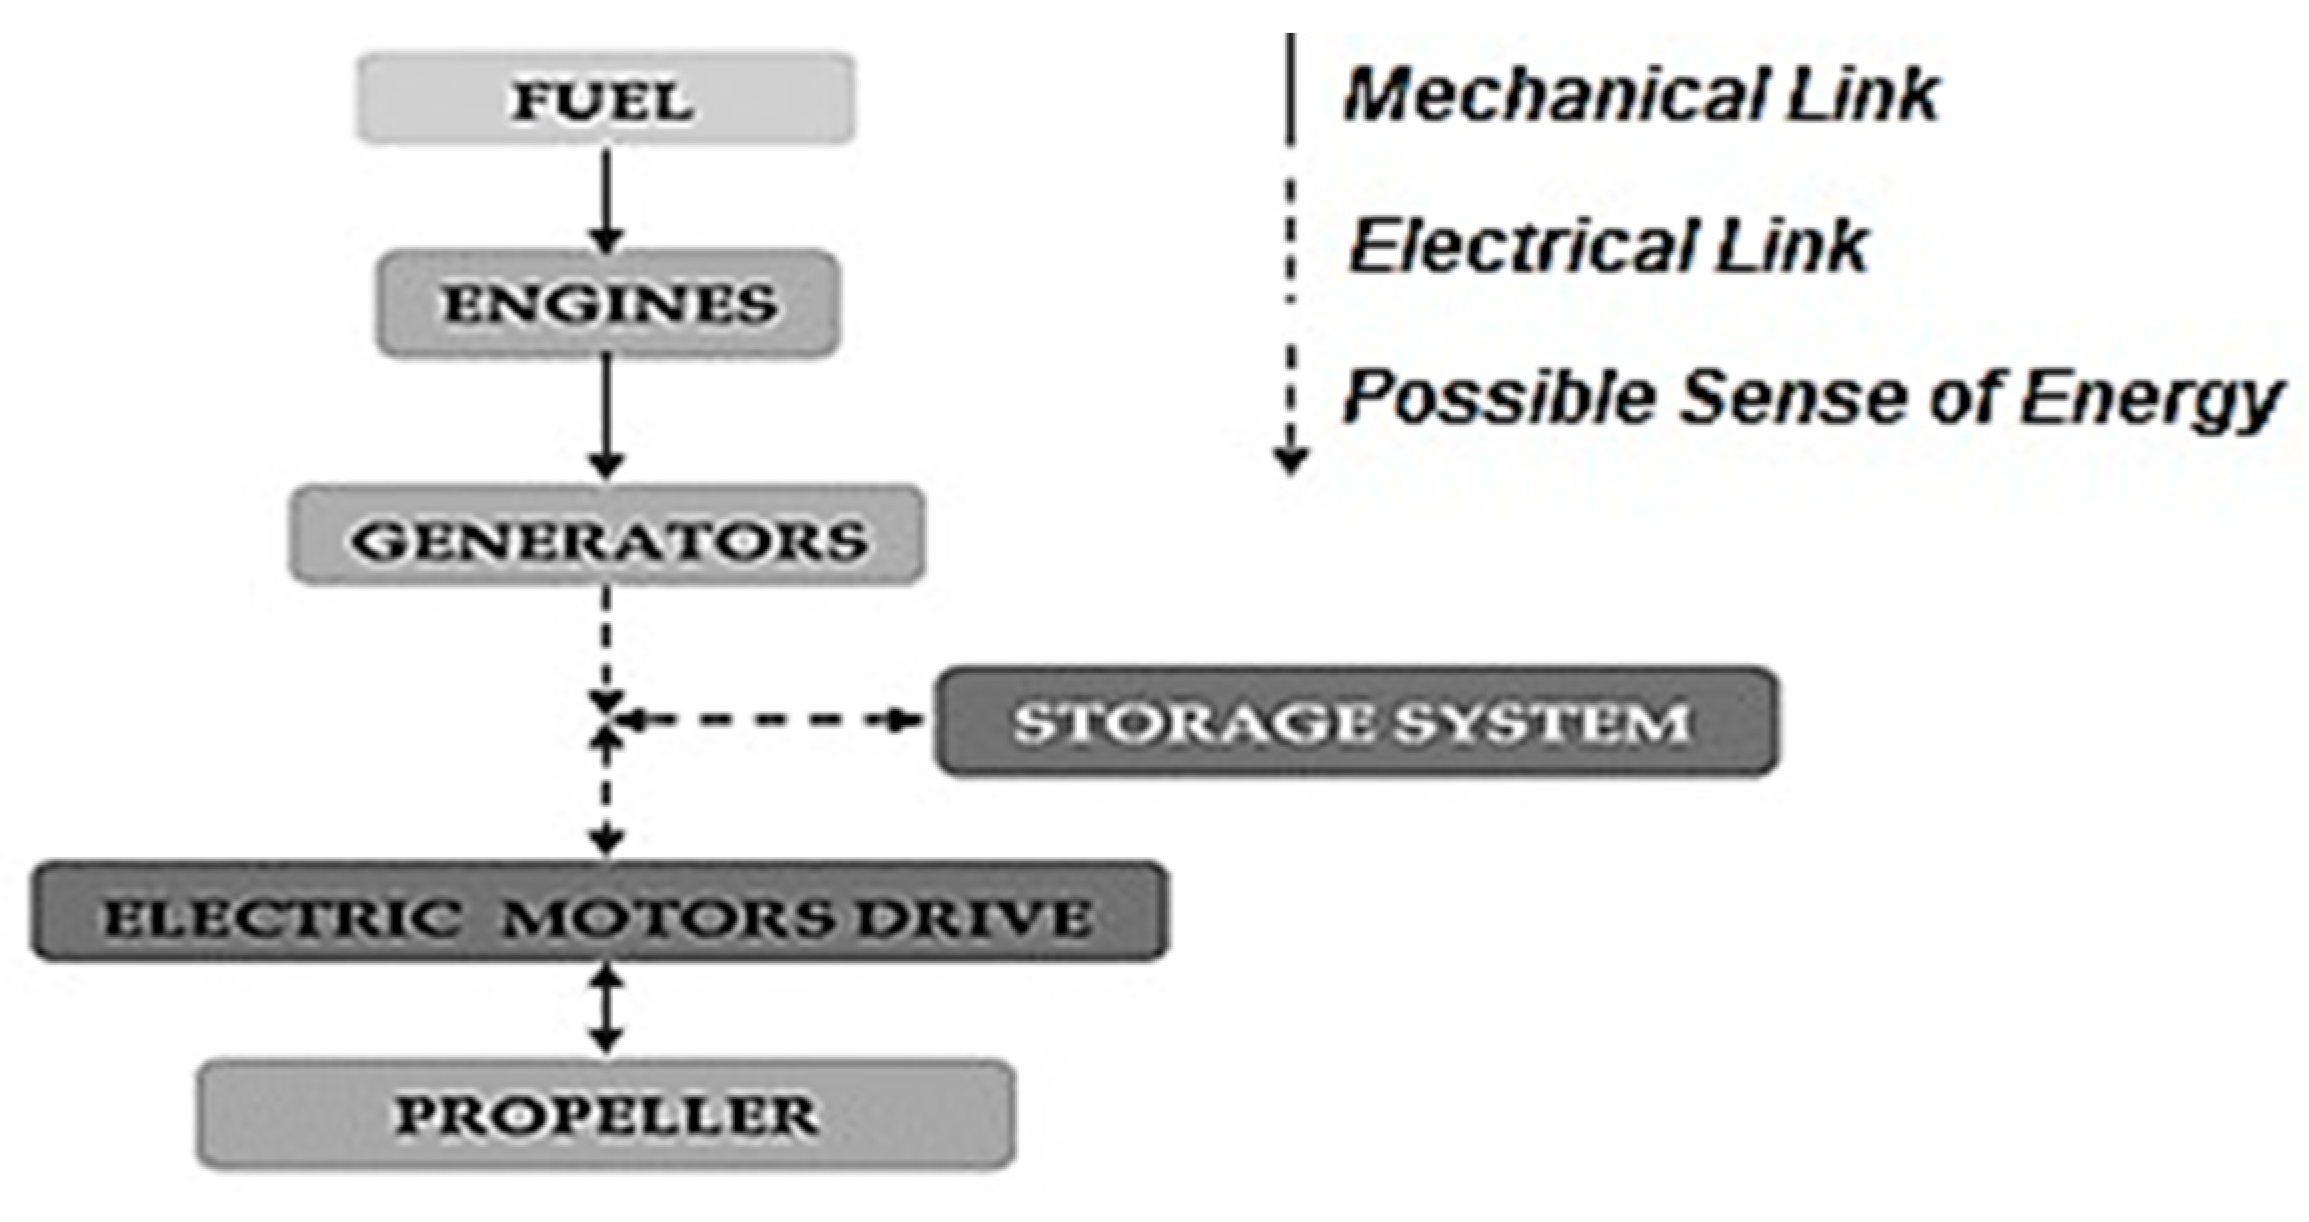
Unlike the typical mechanical propulsion chain, the series hybrid configuration does not require a direct mechanical connection between the engine and propeller. The series hybrid configuration can be seen in
Figure 3. It relies solely on the electric motor to drive the propeller. There are two options for the series configuration. The first is using the combustion engine to drive a set of generators which then supplies electrical power for the propulsion motor. The other is utilizing energy storage systems such as batteries or batteries and generators for propulsion power generation. Using multiple generators and energy storage systems allows the combustion engines to run at optimal conditions to provide fuel-saving opportunities.
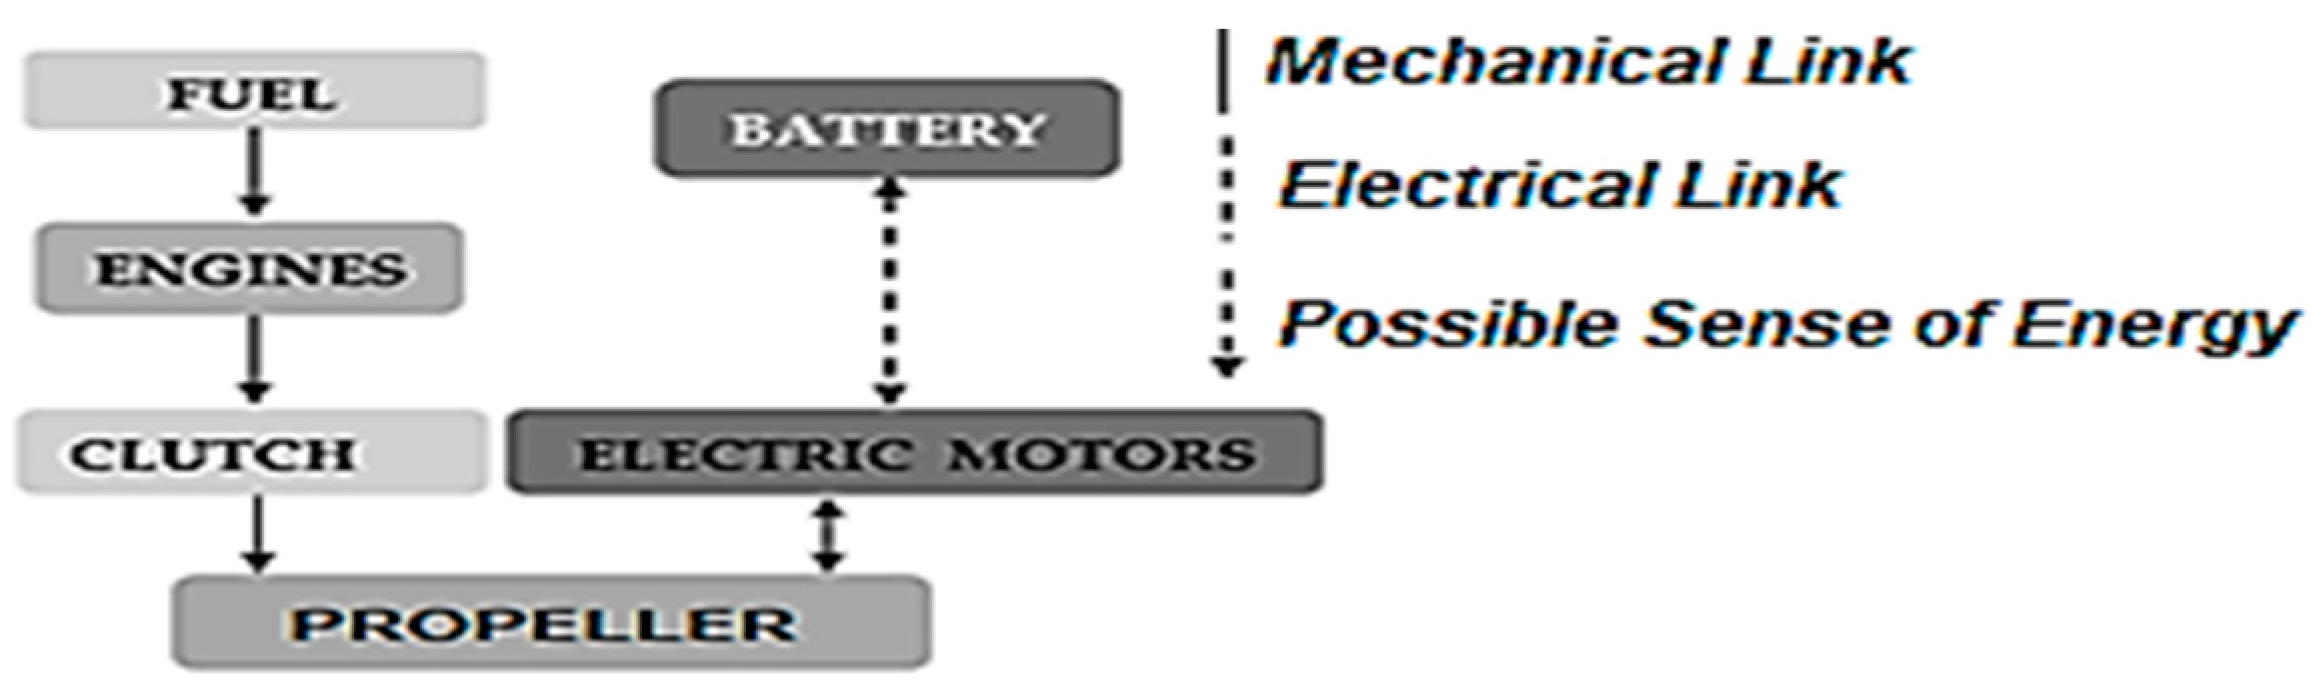
The parallel hybrid configuration is shown in
Figure 4. It combines the combustion engine and electrical motor by mechanically coupling them to the same shaft via gearbox and clutches.
The combustion engine and electrical system can be used independently, or the secondary system can be used to boost the primary system during transient loading and to optimize the operation. The series–parallel configuration is essentially the combination of both configurations as mentioned above. It allows the vessel to operate with both series and parallel configurations, thus, inheriting their advantages.
Note that the hybrid propulsion system provides greater redundancy, protection against uncertainty of future fuel cost, insurance against increasing environmental legislation, and noise reduction. Hybrid propulsion also allows for design flexibility, as the vessel can be configured to help to balance between the economic constrain and the environmental advantage. However, hybrid propulsion is more complex and requires higher capital costs and knowledge capital. As the hybrid propulsion system advances, maintenance and spare part procurement may pose an issue in the long term. Notably, the hybrid propulsion system is not an option for some merchant ships if the payback time is too long. Nevertheless, in this study, the parallel hybrid propulsion configuration is used.
As mentioned, the battery is used in the propulsion system. The battery is chosen over other types of energy storage systems due to its reliability and high energy density. A comparison between typical energy storage systems can be seen in
Table 4.
As seen in
Table 4, the battery provides the highest power density, but it lacks overall efficiency as compared to the other energy storage systems. Flywheel, on the other hand, is the most durable system, offering a 20,000 to 100,000 lifecycle and a lifetime of 15 to 20 years. However, due to the low power density, it might not provide sufficient power for the vessel.
Table 5 compares the various battery performances.
Lead–acid batteries are one of the earliest types of rechargeable battery. They are frequently used for automobiles, and these batteries can be easily recycled. They are highly reliable but offer low specific power and energy. Nickel hydride batteries are widely used for hybrid electric and electric vehicles. They are relatively better than a lead–acid battery, providing higher capacity and a longer lifecycle. Lithium batteries are superior to the earlier mentioned batteries in terms of energy density, lifecycle, and efficiency. Lithium batteries have been gaining traction throughout the years, with many applications including portable electronics such as mobile phones, and automobile applications such as electric vehicles. They are also slowly being adopted for marine, aerospace, and military applications. Lithium batteries are highly versatile energy storage devices that can be altered to meet specific demands, making them one of the best choices for marine application.
Although modern lithium-ion batteries are lighter than the commonly used lead–acid batteries, the weight and volume and the price of the battery system are still concerning factors. Compared to other automobile applications, vehicles tend to have a lower state of charge requirements, less fire insulation between modules, and less of a firefighting support system to combat possible fire caused by thermal runaway. All these factors significantly reduce the specific weight and cost of the battery. The cost of heavy-duty marine lithium-ion batteries above 1 MWh in different setups can be observed in
Table 6.
A significant portion of the price difference between marine and automobile battery applications is closely related to associated system costs such as insulation requirements, fire detection, cooling, and firefighting equipment. A study conducted on the feasibility of battery propulsion on merchant vessels concluded that it was not economically viable. It estimated the required weight and volume of the battery system to propel various merchant vessels according to their size and estimated energy consumption. Even with the best-case scenario of half the present service speed of an 82,000 dwt bulk carrier, the weight of the battery system constitutes ¼ of its capacity. The demand for lithium-ion batteries in the automobile industry is still on the rise, driving further research and development, potentially offering higher energy density and lower-cost products in the future. However, for now the most viable approach for a marine application is to partially electrify the vessel using the battery (named as a hybrid battery system) configured as shown in
Figure 4. The battery can be used to buffer unforeseen cases and optimize the engine’s fuel consumption via peak load shaving operation.
6. Conventional Systems
The following sections show the fuel consumption and emission calculation for the conventional system without the battery system.
6.1. Fuel Consumption
Table 7 presents the information needed for fuel consumption calculation for Route 1 and 2, the voyage from Australia to China and Australia to Japan, respectively. To obtain specific fuel consumption for the calculation, MAN CEAS engine calculation software in Germany is used. The information generated is tabulated in
Table 8. Total fuel consumed for each voyage can be computed by applying Equations (4) and (5).
where
BP is the break power (kW),
is the break mean effective (
BME) pressure (Pa),
is the stroke length (m),
A is the area of the cylinder (
,
N is the revolution per minute of engine crankshaft (rev/s),
FC (tonnes) is the fuel consumption,
SFOC is the specific fuel oil consumption (g/kWh), and
T is the duration of voyage (h). The results are tabulated in
Table 9.
6.2. Emission
The greenhouse gases, namely CO
2, NO
x, and SO
x emission, can be calculated using the fuel consumption and the emission factors in
Table 3. Emissions for both routes are computed via Equation (6), and the results are shown in
Table 9.
where
FC is the fuel consumption (tonnes), and
EF is the emission factor.
7. Applications
This section highlights how the hybrid battery systems can solve common problems faced by the conventional two-stroke engines commonly used by the large bulk carriers. Applications such as peak shaving, barred speed range boosting, and torque boosting are studied along with supporting calculations using the simulated route and vessel.
7.1. Peak Shaving
The hybrid battery configuration can shave main engine peak loads to maintain steady operation. The peak shaving strategy [
10] used in this paper is as follows. The battery is charged when the measured power consumption is less than the target peak demand setpoint. When the measured power consumption is greater than the setpoint, the battery is discharged. As the operation of the ship and battery change, the target peak demand setpoint changes. The battery enables the engine to operate at an average load (see average curve), charging the battery at its lowest, and discharging at its peaks. Peak shaving decreases the overall energy consumption for dynamic loads such as thrusters or crane operations. In this study, the MAN Energy Solutions provided a maximum of 5% saving due to the peak shaving. The effects due to the increase in fuel consumption are performed using the calculations from the previous sections. The losses in the electrical generator are assumed to be negligible.
Table 10 shows the specific fuel oil consumption after peak shaving. Note that 0% represents SFOC before peak shaving.
Computations for the fuel consumed
and emission of CO
2, SO
x, and NO
x follow similar steps. They show a decreasing trend in emission production, thus reflecting an increase in fuel savings. The reduction in emission and fuel savings for
Route 1 and
2 can be observed in
Table 11 and
Table 12, respectively. Fuel consumption for each peak shaving scenario, 1% to 5%, is computed. Fuel savings can be obtained by subtracting each peak shaving result with the original 0%.
With the price of very low Sulphur fuel oil of USD 352.50/mt from an average of 20 global ports and with peak shaving of 5%, approximately USD 380/mt could be saved for Route 1 and USD 465/mt for Route 2 and about 5% of CO2 emission for both routes.
7.2. Boosting
Apart from peak shaving to reduce fuel consumption and emission, the hybrid battery system provides additional support for the conventional two-stroke propulsion engines equipped with a Power Take Off/Power Take In (PTO/PTI). Boosting helps vessels during operation, such as providing extra power to reduce time spent in the barred speed range region and providing additional power during adverse weather conditions to help maintain the minimum speed requirement set by the IMO.
A barred speed range (BSR) is a speed range in which the engine experiences harmful torsional vibration. Prolonged operation in that region will cause an increased risk of shafting damage from excessive stresses. Before implementing the IMO’s energy efficiency design index (EEDI) back in 2013, vessels were able to operate quickly through the barred speed range, keeping the risk to a minimal. However, after implementing EEDI, the reduced power margin affected the vessel’s ability to accelerate past the barred speed range quickly. Using a battery pack or auxiliary engine, additional power can be supplied to help boost the main engine past the barred speed range.
For example, take an engine load diagram [
17] with 5% light running margin and bollard pull curve running 17.5% heavy. Barred speed ranges from approximately 57% to 63% of specified maximum continuous rating (SMCR) speed. With SMCR of 9660 kW at 89 rpm, the BSR power margin can be determined as follows.
where
BSRmargin is the barred speed range power margin (kW),
is the upper engine power limit (kW) at BSR, approximately 42.5% of SMCR,
is the boost power (kW) provided by battery,
is the intersection between the upper limit of BSR, and bollard pull curve (kW) is approximately 40% of SMCR. By applying Equation (7), the power margin of 6.25% is obtained without using the batteries.
To reduce the duration in which the vessel operates in the barred speed range region, a battery is utilized to achieve an assumed 20% margin. To obtain the 20% margin, 531.3 kW of boost power is required. With a 30 s window to pass the barred speed range, the capacity of the battery can be estimated to be 4.4275 kWh. The C rate of a battery can be determined by dividing the boost power by the battery’s capacity. The C rate is 120, which cannot be sustained by a battery. With a maximum C rate of 1 and 531.3 kWh capacity required, a short duration of boosting past barred speed range is suitable.
The combination of batteries and Power Take In (PTI) can be used to assist the main propulsion system in the event of adverse weather conditions. According to the guidelines published by the IMO [
9], a minimum of 4 knots (2.057 m/s) of navigation speed is required to facilitate the vessel to leave a certain coastal area in the event of adverse weather conditions.
Table 13 shows the adverse weather condition applied to vessels with respect to different ship parameters. From
Table 13, the vessel with an overall length of 228.99 m gives a significant wave height of 4 m and a mean wind speed of 15.7 m/s.
Additional load is experienced by the vessel due to adverse weather conditions. The loads involved are wind resistance and wave resistance. Equations (8) and (9) are used to calculate the resistive loads experienced by the vessel.
Table 14 shows the vessel parameters and other additional information for the calculations.
where
is the wind resistance (kN),
is the density of air(kg/m
3),
is the wind resistance coefficient,
is the frontal area of vessel (m
2),
is the mean wind speed (m/s), and
is the vessel speed (m/s).
where
is the resistance cause by waves,
is the vessel speed (m/s),
B is the breadth (m),
DT is the draught (m),
(m) is the length between perpendicular, and
is the wave height (m).
Effective power of a vessel is equal to the product of the vessel’s resistance and the vessel’s speed. With added resistance from wind and wave effects, higher power is required to propel the vessel. For our case study, with the vessel travelling at 4 knots, approximately 1034.5 kW of power is required to overcome the wind and wave resistance. Assuming the vessel is caught in the storm for 2 days and the battery supplies 20% of the power to support the main propulsion engine, as a result, 9.9312 MWh from the batteries is needed.
Adverse weather conditions require a battery system to operate over a long time, requiring batteries with larger capacity and increasing the cost of operation. The cost of an 82,000 dwt bulk carrier is about USD 10 to 20 million, depending on the age of the vessel. Assuming the cost of USD 20 million, the battery costs more than 10% of the vessel. For battery systems to be efficient, the operation should be kept to a short duration. Applications with longer durations could utilize auxiliary engines to provide the additional power needed.
7.3. Critical Operation Incorporating Battery
Using the first 5 nm as an example, as seen in
Table 15, the battery system can handle the base hotel load of 0.28 MW for a period, and it can supply additional power during an emergency to provide basic manoeuvring services. Consider a scenario whereby the vessel runs two auxiliary engines during critical operation. Both engines run at approximately 1000 h a year at about 40% load. Utilizing a battery system to reduce the number of engines running to only one and operating the remaining generator at 80% load can help reduce specific fuel oil consumption without compromising the system’s redundancy.
The cost saving of the mentioned arrangement can be estimated by Equations (10) and (11). SFOC of 40% load 80% load can be obtained from
Figure 5.
where
Pgen is the total power (kW) required from generator,
SFOC is the difference in specific fuel consumption (g/kWh) between 40% to 80% (i.e., 15 g/kWh), and
T is the duration of operation (h) in a year. Note that the price of heavy fuel oil (
Pricehf) is assumed to be USD 640/mt.
The maintenance cost per year can be computed as follows.
where
cost is the approximate cost per hour, assumed to be 10;
Neng is the number of engine and
T duration of operation (h) in a year. Note that 1000 h for one engine is assumed. However, it can be adjusted to the actual operating hour.
A total of USD 16,796.8 can be saved per year from the fuel and maintenance while incorporating batteries. We examined the feasibility of incorporating a full battery system onboard a large merchant vessel, for an 82,000 dwt tonne bulk carrier, to aid the operation and reduce emission to cope with the stringent environmental regulations. The current battery technology cannot sustain the huge power demand of large merchant vessels for a long duration. With the capacity of current battery technology, multiple battery systems have to be installed to sustain the long voyages. Although the battery system can reduce a substantial amount of emissions, the increased operating cost and weight could make it economically impossible.
A hybrid battery system takes advantage of the benefits of a battery system, providing applications such as peak shaving and boosting for barred speed range and during adverse weather conditions. With peak shaving of 5%, the specific fuel oil consumption dropped approximately 5% from 1605.2 g/kWh to 156.94 g/kWh. It reduced to 3.4 tonnes of CO2 and saved more than a tonne of fuel. With the lowered specific fuel oil consumptions, the vessel effectively saves more for the longer duration and distance of the voyage. Using the battery system to help the propulsion engine boost past barred speed range reduces the chances of damage to the propulsion system. As the duration of the operation is short, the operation cost of the battery system is insignificant compared to the possible replacement or repair costs associated with shafting damage. However, the long-duration operation is still costly, as seen in the boosting application during adverse weather. As storms usually last more than a day, substantial power is required for boosting applications.
8. Conclusions
We examined battery technology being adopted onboard large merchant vessels to help tackle problems the industry faces, such as meeting emission regulations and increasing fuel prices, through simulation. Both pure and hybrid battery configurations were considered and evaluated. With the current battery technology, a full battery system is still only viable for small to medium vessels due to cost and weight factors. With electro chemistry developing so rapidly throughout the years, battery technology can be expected to improve further, producing more competitive products in the future and providing more opportunities for more battery applications onboard marine vessels. Integration of batteries into the electric grid of large merchant vessels in a hybrid configuration can bring about more advantages. It complements the operation of two-stroke slow-speed engines, bringing many benefits. However, the main factor still lies with the duration of operating the battery system. It showed that the integration of the battery system for peak shaving and boosting applications resulted in the reduction of emissions and fuel-saving opportunities. The savings are much more significant during severe dynamic loading conditions, and greater benefits can be achieved if the battery system can replace idling auxiliary engines running as backup during critical situations. Using auxiliary generators during longer duration operation such as boosting during adverse weather conditions is still more economical than using a battery system.
The hybrid electric and battery systems are constantly being improved throughout the years. The development of more powerful and lower-cost batteries in the future can help implement a full battery system onboard a large merchant vessel. With the possibility of more vessels incorporating energy storage systems onboard to combat emission requirements in the future, more shore facilities will be built to accommodate such systems. The battery system will undoubtedly help ease the transition towards carbon-neutral shipping in the future.


