Article

Determining Role of Human Factors in Maritime Transportation Accidents by Fuzzy Fault Tree Analysis (FFTA)

Department of International Shipping, School of Naval Architecture, Ocean and Civil Engineering, Shanghai Jiao Tong University, Shanghai 200240, China
*
Author to whom correspondence should be addressed.
J. Mar. Sci. Eng. 2022, 10(3), 381; https://doi.org/10.3390/jmse10030381
Submission received: 1 January 2022 / Revised: 20 February 2022 / Accepted: 25 February 2022 / Published: 7 March 2022
(This article belongs to the Section Ocean Engineering)

Abstract

:
Safety has been a primary concern in every industry. It includes system, personnel, environmental safety, etc. Maritime transportation safety is of the utmost importance because a lot of economic and environmental damage has been caused by ship-related accidents. The majority of these accidents have resulted from human factors. For the analysis of accidents and future safety, various accident models have been created. In this study, human-based errors are analyzed and quantified by using the fuzzy fault tree analysis, which helps calculate the failure probability of the causes. A real-life case of a chemical tanker Key Bora was studied and analyzed, which happened on 28 March 2020, at Kyleakin Pier, Isle of Skye, Scotland. The ship’s hull was seriously damaged and was flooded. According to the analysis, two main human factors that contributed the most to the occurrence of this accident were found. These incidents can be avoided by ensuring proper measures are followed, and the results can be used as guidelines for future marine accident investigations and safety.

1. Introduction

According to Dasgupta [1] and the International Maritime Organization (IMO) [2], risk is defined as “a composite of the frequency and severity of the consequence”. Consequently, there are two main elements to the likelihood of occurrence and the likelihood of magnitude of unforeseen impacts [1]. “Risk is typically described as a measure of the occurrence probability of an incident, as well as the severity of injury or damage that it could result in” [3,4]. Essentially, risk evaluation, as per the study conducted by Dasgupta [1], is evaluating the company’s systems and procedures, recognizing where a fault might occur, and selecting appropriate methods to prevent it. Risk is evaluated in four steps, recognizing the danger, risk assessment, risk reduction controls, and lastly, monitoring the effectiveness of the controls. The technique for recognizing dangers, according to the author, is critical since it defines the subsequent course of action. Tracking the activities allows for a high level of precision and accomplishment, which could be achieved via the use of a thorough approach [1]. An accident is defined as “financial and non-financial harm to a person, an asset, or the environment as a result of an unintended or unplanned event” [4,5,6,7,8,9]. Marine catastrophes or tragedies at sea, as defined by the IMO [2] and Uğurlu et al. [6], are unplanned occurrences that prove fatal, cause injury, shipping losses, vessel or container damage, damage to equipment, or environmental degradation.
There are many causes of accidents in the maritime industry. They can be caused by system failures or by environmental factors, but the numbers of accidents caused by these elements are smaller. According to Ren et al. [10] and Marine insight [11], the most common causes, such as fires, explosions, ships going missing, and ship collisions, are all the result of human mistakes in some way. A remarkable amount of research into marine accidents is needed in order to determine their causes. The goal of these studies conducted on marine transportation accidents was to determine the fundamental causes of these incidents to improve marine safety. Human mistake was shown to be the most common cause of marine mishaps (almost 96 percent), according to the findings [11,12].
From the review of literature, some of the human factors found include lack of awareness of the situation of the surroundings, tiredness, use of substance and/or being medically unfit, being overworked, lack of vigilance, being less attentive, lacking in proper training and qualification, insufficient collaboration, inadequate dissemination of information, absence of safety measures, not using standard guidelines, and being complacent in performing duties [12,13].
The marine industry has advanced and grown a lot with the help of technology; however, the advancement in maritime transportation is not without peril, particularly when hazardous products are transported [14]. The marine vulnerability assessment process facilitates in calculating the potential for harm and its potential ramifications for every danger associated with the threats. This enables the company to effectively set goals and efficiently utilize the available resources. It is crucial to evaluate the frequency of incidents when considering the establishment of safeguard mechanisms because a probable intrinsic risk could be more difficult to handle than a rare yet substantial hazard [1]. In order to assess these accidents, numerous accident models have been presented in the literature. The purpose of these models is to analyze the case and determine the cause of the accident in order to ensure the safety of cargo, vessels, crew members, and the environment because these accidents not only cause financial damage in respect to vessel and the cargo, they also cause human injuries and environmental damage (spills and ship wreckage, etc.). There are a lot of accident models that are employed in various professions [6,15]. According to their similarity and conceptualities, Hollnagel and Goteman [16] investigated methodologies and grouped them into three distinct categories:
  • Consecutive models.
  • Epidemiological models.
  • Systemic models.
These are aptly acknowledged by researchers and were utilized in various other industries. Other methods that have come forward are:
  • Data-driven approach.
  • Card sorting method.
Each of these models has its significance in the literature. The model used in this study is the fuzzy fault tree analysis (FFTA), which is an extension of the fault tree analysis (type of consecutive model).
The fuzzy fault tree analysis is used in situations where there is minimal to no existing quantitative information about the incident. It uses the possibility of basic events as fuzzy numbers because in those cases the mathematical values are unavailable. The fuzzy fault tree analysis (FFTA) model makes use of fuzzy sets and possibility theory to cope with unclear, subjectively deficient, ill-defined, and erroneous data.
The FFTA’s major purpose, according to Sahin [17] and Kuzu et al. [18], is to uncover potential causes of system failure. The method is used to evaluate the top event’s (the visible failure causing the accident) likelihood, which needs system quantitative reliability data [19]. Expert judgment may be a reasonable alternative in the procedure because lack of data is one of the primary difficulties in the maritime industry [18,20,21]. Most human judgments are based on qualitative and prospective words rather than statistical terms. Fuzzy logic is a type of logic that turns probabilistic concepts into probabilistic values [22]. As a result, the FTA employs fuzzy sets to translate expert judgment opinions into probabilities [23]. Expert judgment can be described as linguistic variables in natural language using fuzzy set theory [24,25,26,27]. Probability refers to the numerical (quantitative) aspect of an event’s occurrence, whereas possibility refers to the qualitative aspect of an occurrence [18].
The FFTA is utilized in system safety and reliability analysis, particularly for complex and large-scale systems, such as nuclear reactors, aircraft, electronics, electric power, chemical, mechanical, civil engineering, petrochemical industries, and pipelines [27]. Various scholars have efficiently used the FFTA approach for a wide range of domains, including operations management, engineering, and management applications [23,28,29,30,31,32]. Mentes and Helvacioglu [33] used the FFTA to develop a technique for analyzing the hazards of tanker–buoy spread mooring systems, which they put to the test in their study. Kuzu et al. [18] investigated an accident that happened during the docking of the tanker ship M/T Zarga using the FFTA model and established critical basic events that contributed to the accident along with measures to minimize their probabilities.
The FFTA is a complete model that analyzes the potential of risk in any system by breaking it into smaller components and finding the major components causing the accident and their quantitative values.
Human factors are a major contributor to accidents in the maritime industry and many other models have been used to establish their contribution to the accidents. The application of the FFTA model to analyze the role of human factors covers a prominent research gap since there is limited literature available. The FFTA can be used by breaking down the whole incident into small events and analyzing them. By using this model, the role of human factors can be established along with their probability, and this prominent research gap will add useful knowledge to the existing literature about determining the quantitative contribution of human factors.
The main objective of this study is to determine the contribution of human factors in the occurrence of accidents by quantifying them so they can be addressed by taking proper measures to ensure the safety of marine vessels and the environment. The paper is divided into five sections. The current section contains the importance of marine safety, accident models, and a brief introduction of the existing methods as well as an introduction of the fuzzy fault tree analysis (FFTA) that is used in the research. Section 2 contains the methods and sequence of the model. Section 3 contains the steps to perform the analysis using this method and a list of tables and figures obtained that will be used to determine the results. Section 4 contains the discussion of results obtained from the analysis. Section 5 concludes the findings of the study in accordance with the results.

2. Materials and Methods

In this section, the concept and working of the fuzzy fault tree analysis is explained in sequence.

2.1. Fuzzy Sets

According to Mahmood et al. [27], Tanaka et al. [34], and Weber [35], the fuzzy number is also called fuzzy probability and reflects ‘vagueness’ with equivalent to ‘crispness’, for example, near 7, ‘high failure,’ and ‘very low failure,’ respectively. In the probability domain, a fuzzy set denotes a fuzzy range of 0 to 1 that is assigned to the probability of an incidence [36]. Triangular fuzzy number (TFN) and trapezoidal fuzzy number (TZFN) are the two types of fuzzy numbers that are commonly used in reliability analysis. The method used in this work is trapezoidal fuzzy number.
A membership function fI(y) is associated with each element y in Y (a classical set, which is a collection of items or objects) via a real integer between 0 and 1 and can demonstrate a fuzzy subset I inside Y [37,38].
The following equation shows trapezoidal Fuzzy number:
f I ( y ) = { y i j i , , i y j 1 , , j y k k y k j , , k y l o t h e r w i s e   0 ,

2.2. Fuzzy Fault Tree Analysis (FFTA)

The fuzzy fault tree analysis is used to analyze the failure probability of the system. It helps break down the structure into small components and calculates the chances of each component and its role in the occurrence of the incident. But there is data limitation in the shipping industry about the accident details, which this model counters by using the input of experts about each scenario and changing that input into a mathematical value, which is one of the methods to counter data limitation. These values then help in calculating the failure probability. When using this method for accident analysis, it is crucial to determine the main event, i.e., top event. Mostly, the visible effect of the accident is usually a top event. Then each event is determined by the inputs of the experts after that fault tree diagram is created. Input about the occurrence of each event is obtained from experts. Then those values are assigned a fuzzy number, and an aggregation stage is applied, which gives out the possibilities. Those are then defuzzified and then converted into failure probabilities. Then main events probability is determined by minimal cut sets, and then these sets are ranked according to their contribution to the failure of the system.
The analysis of the model is run in the following sequence.

2.3. Fault Rree Diagram

After determining the top event, the first step is to create the fault tree (FT) diagram. It describes the relationship between the events and their impact on the top event. It is related to other events that lead to the TE via logic gates. After carefully reading the literature and reports on the case study, a survey was designed to establish TE and other basic events. The questions included specific information about the episodes that transpired prior to the accident, and they were heavily focused on the human contribution. Those occurrences were chosen for the survey based on a list of human errors published in the literature, and after a thorough analysis and comparison, similar ones were chosen. All of the events were given a qualitative score.

2.4. Converting Linguistic Values into Possibilities

Linguistic terms were obtained from the opinion of marine experts. This was done due to the lack of data available in the maritime industry. They provided their verbal prediction about the possibility of each basic event (BE). Each expert’s opinion about each event was different, and each opinion was prioritized based on the relative experience (sea and shore time experience), rank, education, and the professional position. This is due to the fact that every person has his/her concepts and ideas about the subject he/she is related to, and therefore other factors mentioned above had to be considered, and the value should be given according to their relative expertise. Table 1 shows the assessment values of diverse experts [18].
A method was introduced by Chen and Hsu [39], which helped in deriving fuzzy numerical values from the verbal opinion of a set of heterogeneous experts and is called “Similarity Aggregation Method (SAM)”. This method is performed in the following steps.

2.4.1. Step 1: Aggregating Obtained Possibilities

In this step, imagine every expert, E k ( k = 1 , 2 , , M ) shows his/her views about specific traits with respect to a certain environment by an anticipated set of verbal parameters. That is then altered into fuzzy digits. The concept of this method is described below [38,40].

2.4.2. Step 2: Calculate the Degree of Agreement

Let us suppose Ex and Ey are two variables that represent a pair of an expert. S M x y ( R x ˜ , R y ˜ ) contains their opinion, and the similarities between their opinion can be represented by X ˜ = ( x 1 , x 2 , x 3 , x 4 )   and   Y ˜ = ( y 1 , y 2 , y 3 , y 4 ) . The degree of agreement of experts is obtained with the help of the following equation:
S ( X ˜ , Y ˜ ) = 1 1 4 i = 1 4 | x i y i |
where S ( X ˜ , Y ˜ ) represents similarity function and S ( X ˜ , Y ˜ ) [ 0 , 1 ]

2.4.3. Step 3: Average Agreement (AA)

Average agreement (AA) is obtained through applying the following formula:
A A ( E x ) = 1 N 1 x y N S ( Q x ˜ Q y ) ˜

2.4.4. Step 4: Relative Agreement (RA)

Relative agreement of the experts is determined by the following equation:
E x ( x = 1.2 , , N )   w h e r e   R A ( E x ) = A ( E x ) x = 1 N A ( E x )

2.4.5. Step 5: Consensus Coefficient (CC)

Consensus coefficient (CC) of the experts is calculated by using the following formula:
E x ( x = 1 , 2 , , N ) W h e r e   C C ( E x ) = α × γ ( E x ) + ( 1 α ) × R A ( E x )

2.4.6. Step 6: Aggregate Results of Possibilities

Aggregated results of expert’s opinion (AGG) can be obtained by Equation (6):
S ˜ ( A G G ) = B ( E x p 1 ) × Q ˜ 1 + B ( E x p 2 ) × Q ˜ 2 + + B ( E x p N ) × Q ˜ N

2.4.7. Step 7: Defuzzifying of Fuzzy Possibility

In order to get a solid value, defuzzifying is necessary of expert judgments. This is done by the following equation:
Y * = V i ( y ) y d y V i ( y )
  • where Y* represents the fuzzy possibility.
  • Vi(y) shows the aggregated membership function.
  • Y denotes output variable.

2.4.8. Step 8: Converting Possibilities into Probabilities

Equations (7) and (8) were used by Onisawa [41] to convert fuzzy failure possibility to fuzzy failure probability. “Fuzzy probability rate (FPT) can be taken from fuzzy possibility rates (FPs)”. The equations are as follows:
P r = { 1 10 k , Fp s 0 0 , Fp s = 0
K = [ ( 1 F P s F P s ) ] 1 3 × 2.301

2.5. Calculating TE Probability Using Minimal Cut Sets (MCSs)

Equation (9) shows MCS denoted by (MS) in equation below:
T E = M S 1 + M S 2 + + M S M = i = 1 m c M S
In case of independent MS, the following equation is applied to establish the probability of TE.
P ( T E ) = P ( M S 1 M S 2 M S M ) = P ( M S 1 ) + P ( M S 2 ) + P ( M S M ) ( P ( M S 1 M S 2 ) + P ( M S 1 M S 3 ) + P ( M S i M S j ) ) + ( 1 ) M 1 P ( M S 1 M S 2 M S M )

2.6. Classification of Minimal Cut Sets (MCSs)

To rank MS’s, “Fussell–Vesely Importance Measure (FVIM)” was used [18]. The classification was done by the equation below
I j FVM ( y ) = P j ( y ) P k ( y )

3. Analysis

The case study chosen for this analysis was the Key Bora ship. The Gibraltar-registered chemical tanker ‘Key Bora’ ran aground at Kyleakin Pier on the Isle of Skye, Scotland, around 15:05 on 28 March 2020. The grounding ripped a hole in the hull of the Key Bora, and floodwater flooded the empty ballast tanks, but there were no injuries or pollution. The master was controlling the steering of the ship from the starboard bridge wing console as ‘Key Bora’ approached Kyleakin Pier. This was the vessel’s and master’s first visit to this pier, and the berthing had been timed to coincide with low water when the tidal stream was expected to be slack. The Key Bora ran aground on a recorded 4.9 m impediment as it approached the dock. Key Bora floated free and was berthed with its power 12 min after it ran aground [42]. Damage was done to the vessel, but no human loss or spill occurred.
Experts were required to determine the basic and top events following the procedure in the literature, according to the model’s requirements. They were given a survey containing a list of basic and top events, and they were asked to fill out the required details as well as the verbal importance of each event. The survey included five professionals, two masters, two academics, and a pilot to help determine the basic events (BE) and their possibilities in relation to the incident. Each professional has significant experience in the field and was weighted according to their credibility. Table 2 shows the expert profile.
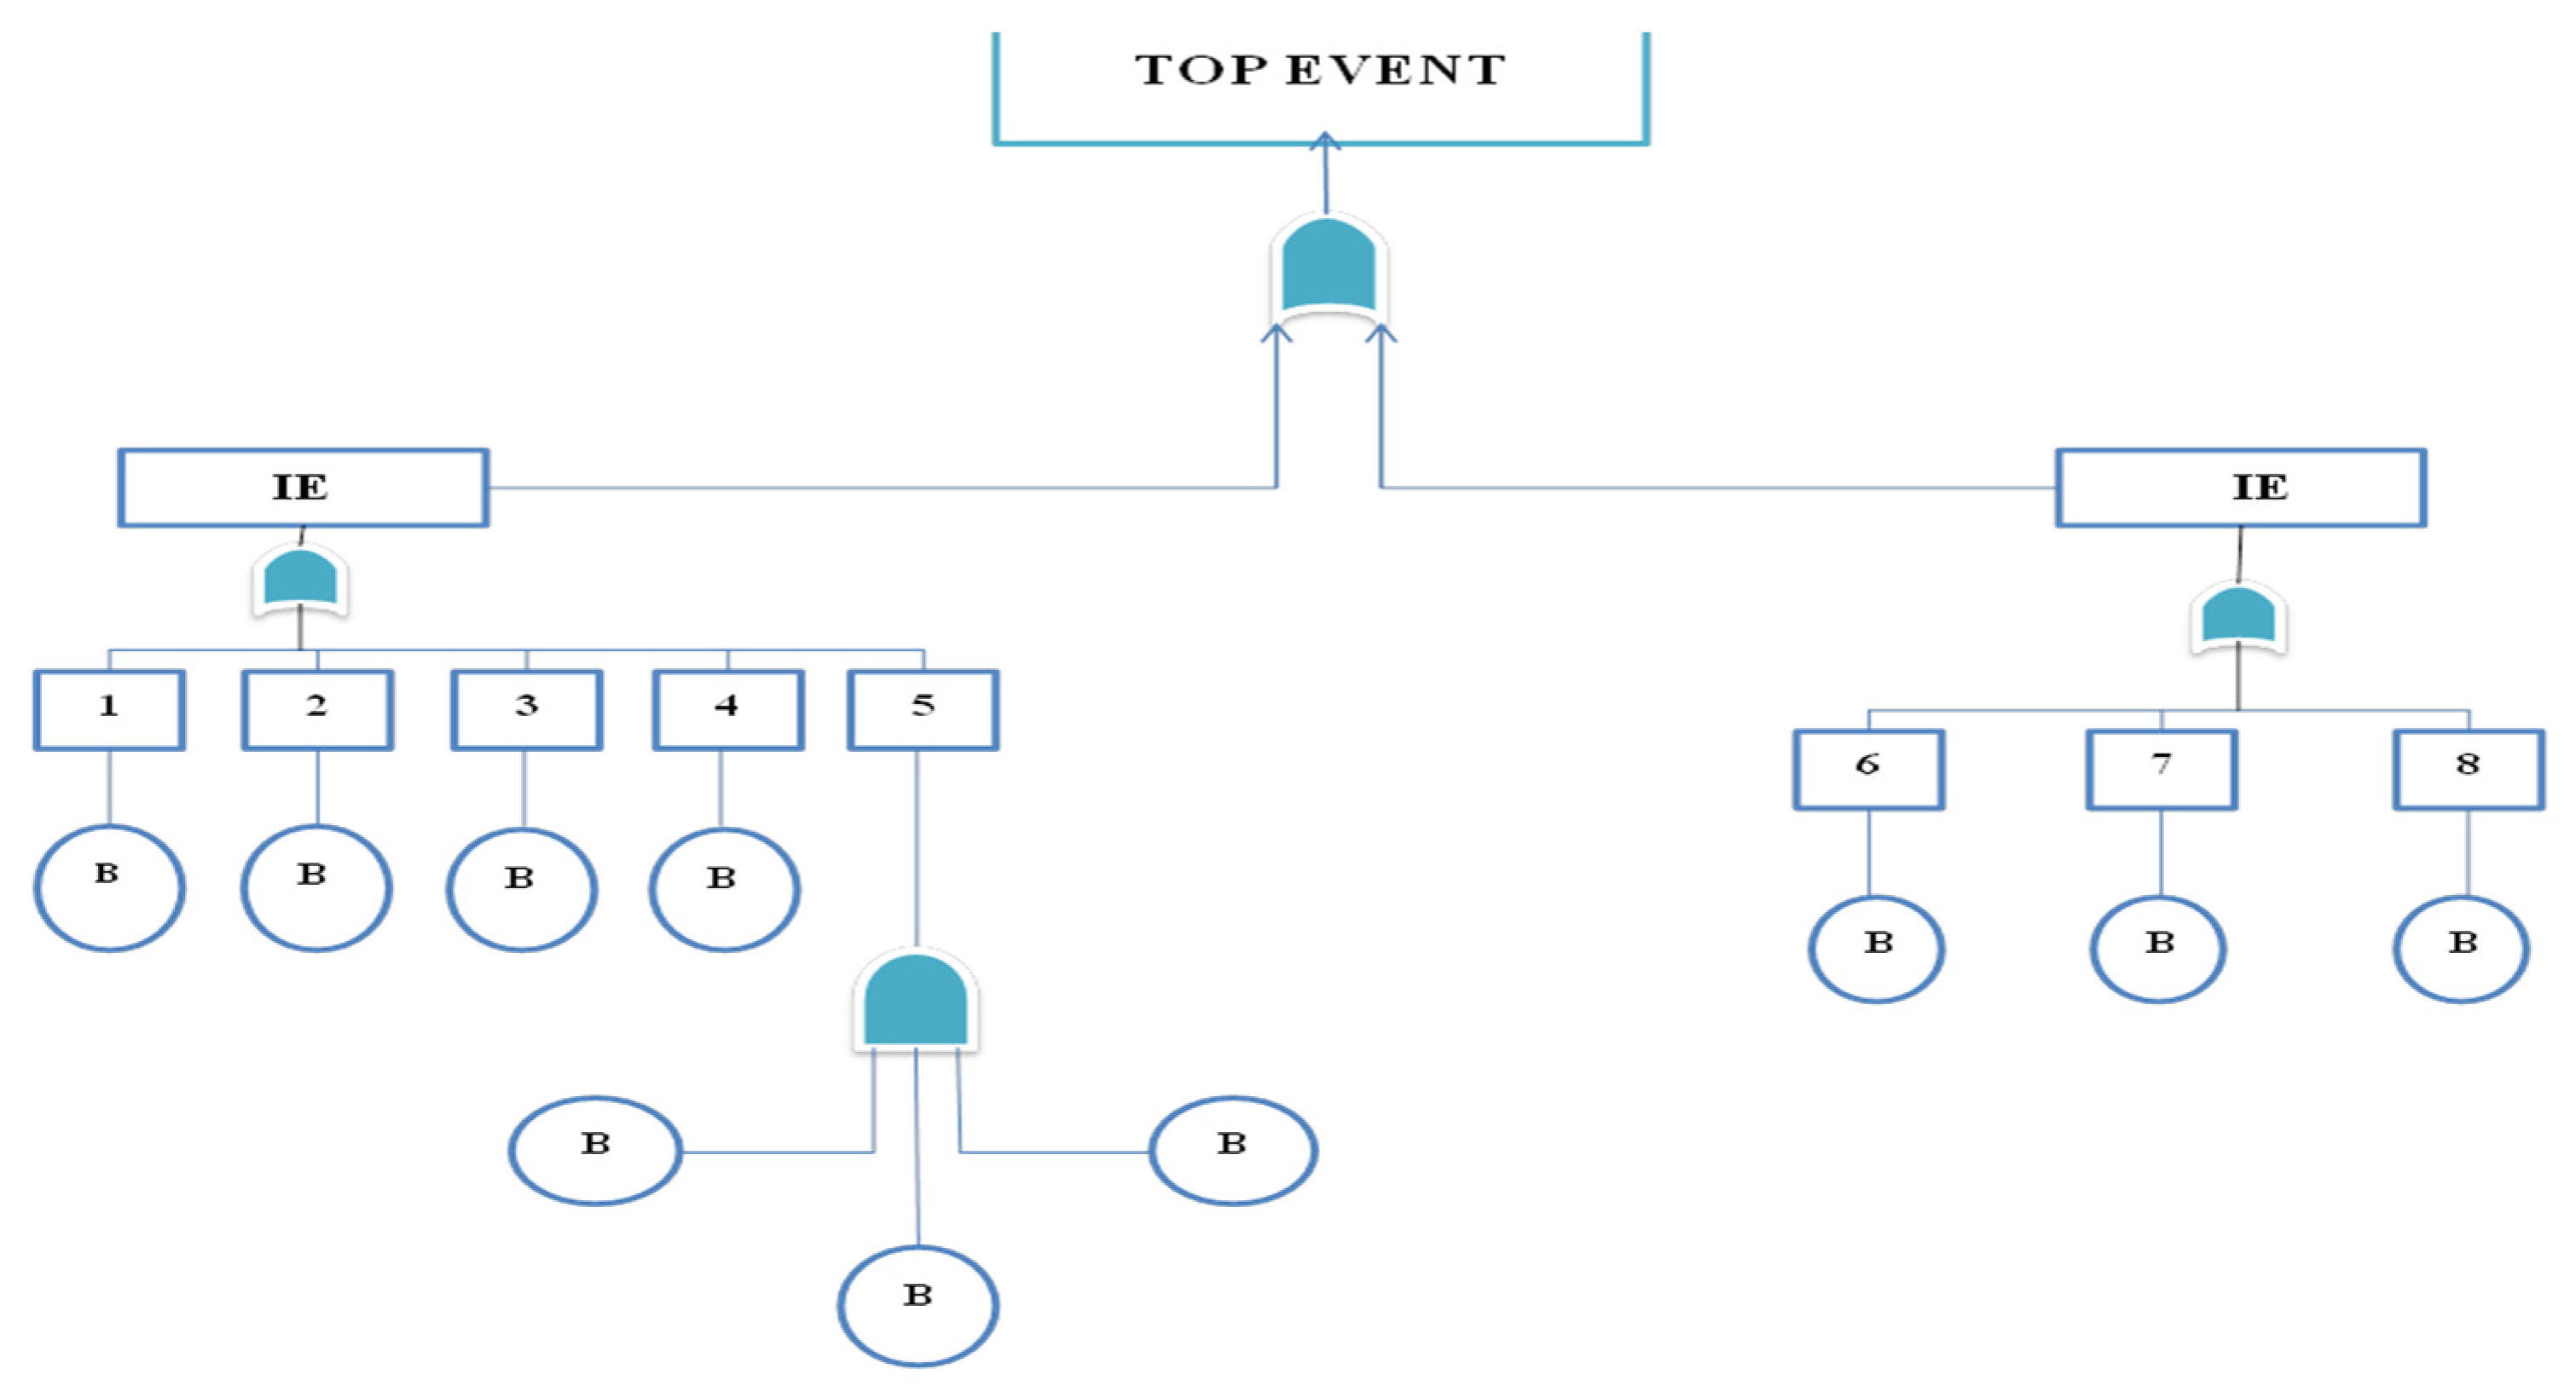
The first step was determining the top event, which according to the experts was the ship running aground and being flooded. The top event (TE) is the major event that must be removed to prevent the incident from causing damage. After establishing the TE, a fault tree (FT) diagram was created based on the opinions of experts. Figure 1 contains the sketch of a fault tree diagram. The diagram is read from basic events towards the top event, which is the last part of the diagram.
A total of 10 events were determined according to their priority. Ten basic events and three intermediate events. Intermediates are events that connect basic events with top events with the help of logic gates and are significant in the analysis. The list of basic events derived from the MAIB report [42] and their description is shown in Table 3.
Because there is a shortage of data in the marine sector, fuzzy sets are employed to determine the rate of failure [18]. These spoken opinions can be converted into fuzzy values [17,18]. Table 4 displays a collection of fuzzy numbers in relation to voice values that explains the probability of each incidence [18]. The numbers are in the trapezoidal fuzzy form, which will be converted to a solid value later in the process.
A numerical estimating system was proposed by Chen et al. [42], which uses seven systematized verbal scales: “Very Low (VL), Low (L), Mildly Low (ML), Medium (M), Mildly High (MH), High (H), and Very High (HV)”. According to their respective experience, each expert’s weighting factor and score are listed in Table 5 shown below:
The experts had differing perspectives on each basic event and its likelihood of occurring. The experts’ verbal judgments on the possibility of each BE are shown in Table 6. They assigned a verbal value to each basic event in this table, and each verbal value has a fuzzy value associated with it, as shown in the previous table.
Each event’s probability must be evaluated once the possibility has been determined. To do so, the first step is to aggregate all of the events. Because there was a total of ten basic events, each one had to be aggregated and displayed in the tables. For this, Equations (2)–(5) were applied. The similarity function and its value for each expert for BE1 are shown in Table 7:
After determining the similarity function, to proceed further in aggregation, the relative agreement (RA), average agreement (AA), and consensus coefficient (CC) of each event was calculated because this helps in categorizing and prioritizing each event’s probability and is used in the failure probability of each event. Table 8 displays these values of only the first basic event as a reference.
Calculating the RA, AA, and CC of each event is critical since these values aid in the discovery of possibilities and, ultimately, probabilities in the model. All of the specialists were believed to be equal; therefore α is equal to 0.5 [43]. After that, Equation (6) was used to combine the expert assessments, and Equation (7) was used to turn the fuzzy values into crisp values. Table 9 contains the aggregated possibilities of the specialist opinions and result possibilities of each basic event.
Equations (10) and (11) were utilized to calculate the value of TE and MCSs in order to obtain the risk of each incidence. The probability of each event was converted from the possibilities of all incidents in Table 10.
Keeping in mind the fault tree diagram and the logic gates representing the process, the probability of TE is 7.97 × 10⁻². After that, Equation (12) was applied to calculate the MCSs, their occurrence probability, and the FVIM in Table 11.

4. Results and Discussion

According to the findings of the analyses, the probability of TE indicates a high likelihood of an accident on the ship. The events with higher probabilities of accident are (BE2), (BE8), (BE5), (BE6), and (BE7) as shown in Table 12.
According to the failure probability findings, BE8 “inaccurate information that was provided about the conditions at the seaport by the third party” is one of the main contributors in this accident determined by its probability. According to the literature, this falls under the category of misinformation or inadequate information. The master of the ship prioritized this information without any confirmation over other readings of the situation. Misinformation can affect the process because it can cause operation failures that will result in accidents. According to the report of MAIB [42], the second officer in charge, who, after his observation, informed the shipmaster about the 4.0 m depth ahead, which according to the data provided, was 7.0 m, when the ship reached on site. By comparing the ENC data with the information provided by the agent, the master and the officer reviewed it. The master and second officer in charge discovered that the ENC’s 4.9 m sounding was missing from the dredging survey and the photocopy of the admiralty paper chart provided by the agent. The agent’s information was used instead of the ship’s electronic navigation chart since it came from a seemingly credible source and appeared to be accurate and current. The protocol procedure is to confirm whether the situation on site is similar to the data provided, which the master of the ship did not confirm himself; he chose instead to use the unconfirmed information.
If there is a conflict of information, the protocol measure is ‘to confirm it in time’ with the information provided by the ship’s navigation system or from the parent company. This decision of not reporting it to the company (BE2) put the vessel at serious risk. In this case, an external assessment would give confidence to the decision. The master was required under the safety management system to notify the company when vessels were sent to a port or harbor for the first time, or where opposing advice arose. Regardless of whether the master was aware of the safety management system responsibility, failing to obtain an external evaluation, particularly in the absence of pilotage services, increased the overall navigational risk.
He prioritized third-party information without comparing it with the ship’s navigation system (BE5) even when informed about the conflict of information by the second officer of the ship, who suggested changing the course of the ship. The master, believing that the information given to him was correct, rejected the suggestion and continued with his plan (BE6). The ship was installed with the latest technology electronic chart display and information system (ECDIS) for navigational purposes. The ECDIS on the ‘Key Bora’ was set up to receive and update electronic navigation chart data without requiring any input from the crew. This was a useful aspect of the system because it ensured that the principal navigation method was up to date. The operator might also examine the status of electronic chart corrections using the view update feature. The master and second officer, on the other hand, never investigated the system in this way, and neither was aware that the 4.9m sounding was a recent correction.
(BE5), (BE6), and (BE7) could have been avoided if the master had followed the protocol and procedures, listened to the insight from the crew members, and used the latest technology for navigation accordingly. These events point toward a lack of awareness and poor collaboration and communication among the crew members and not using the more accurate source of information was an error made by the master of the ship. In the analysis model, these three represent minimal cut sets. For the safety of the system according to the model, they have to be minimized to ensure the safety and security of the ship and its components.
The results point toward the involvement of human factors in the occurrence of this particular accident. Misinformation, lack of experience, and not adhering to the suggestions of crew member are all part of a human mistake. The master of the ship was visiting the site for the first time, which points toward the unawareness of the surroundings.
In order to avoid these types of mistakes in the future, crew members should be informed about the environmental and geological conditions of the destination and should have a prior briefing about the site and knowledge to overcome the hurdles that can occur because of unforeseen conditions. Before accepting any information from a third party, it should be reviewed by either the technology of the ship or by reporting it to the company officials to confirm the accuracy of the data. In addition, proper safety management and risk assessment training and workshops should be attended in order to improve the safety culture and proper communication among the crew members, and all those measures should be properly monitored. By ensuring these measures, the loss of cargo, ships, and lives can be minimized.
This study complements the current investigation and adds the quantitative results of the human components, categorizes them according to the literature, and determines their mathematical probability and importance of each event in the occurrence of the accident according to their failure probability, which is not provided in the report.

5. Conclusions

The study was performed to obtain quantitative results about the contribution and identification of human factors in maritime accidents. For this purpose, the fuzzy fault tree analysis method was used, which helps in obtaining mathematical values about each factor causing the accident. For the purpose of analysis, a real-life case study was chosen. Events and their verbal assessment were determined by expert input and then analyzed using the model. The analysis showed two main basic events and a minimal cut set of three events. These events were attributed to human factors according to their description. These were quantified and determined as misinformation about the conditions of the site, lack of awareness, lack of teamwork, and wrong judgment under pressure. Lack of teamwork points toward the lack of collaboration among the master and crew members in particular the second officer, who informed the master of the ship because he observed the obstacles present on site and suggested changing the route of the ship. His suggestion was not heeded, and the master preferred the information he had. In addition, the ship navigation system would have warned about the danger ahead but was turned off.
All of the events are interrelated. By identifying these events, they can be avoided in the future by making sure the parties involved are properly informed and trained about these situations, risk mitigation measures are observed, and proper data is provided before any journey to ensure the safety of the ships.
The FFTA model was developed to counter the limitations of data scarcity by using the expert elicitation method as one of the ways to counter the lack of quantitative data availability of industries by consulting experts of the same industry to find out the probable cause and components and then quantify those results. In case the access to expert’s opinion is unavailable, the model cannot be applied in that particular situation.
The paper provides extensive details about some of the human factors that contribute to shipping accidents that can occur during any operation during their journey. These identified human factors can be used as a reference for the future safety training of crew members on their journey in order to avoid the risk of accidents. That will help prevent financial losses (such as ship damage and loss of cargo), human loss, and environmental damage and increase marine safety as well.

Author Contributions

A.Z., R.U.K. and J.Y. identified the major factors and conceptualized and developed the model. A.Z. ran the model, analyzed the results, and wrote the manuscript. J.Y. supervised the overall study. All authors have read and agreed to the published version of the manuscript.

Funding

This research received no external funding.

Institutional Review Board Statement

Not applicable.

Informed Consent Statement

Informed consent was obtained from all subjects involved in the study.

Data Availability Statement

Not applicable.

Acknowledgments

I would like to Specially Thank Emre Aykuz from Istanbul Technical University, Turkey for his help in providing valuable data that were the basis of this research.

Conflicts of Interest

The authors declare no conflict of interest.

References

  1. Dasgupta, S. Risk Assessment for Ships: A General Overview. 2021. Available online: https://www.marineinsight.com/marine-safety/risk-assessment-for-ships-a-general-overview/ (accessed on 4 June 2021).
  2. IMO. Code of the international standards and recommended practices for a safety investigation into a marine casualty or marine incident (Casualty Investigation Code). In MSC 255; International Maritime Organization: London, UK, 2008. [Google Scholar]
  3. Li, K.X.; Yin, J.; Bang, H.S.; Yang, Z.; Wang, J. Bayesian network with quantitative input for maritime risk analysis. Transp. A Transp. Sci. 2014, 10, 89–118. [Google Scholar] [CrossRef]
  4. Manuele, F.A. On the Practice of Safety; John Wiley & Sons: New York, NY, USA, 2003. [Google Scholar]
  5. Harrald, J.R.; Mazzuchi, T.A.; Spahn, J.; Van Dorp, R.; Merrick, J.; Shrestha, S.; Grabowski, M. Using system simulation to model the impact of human error in a maritime system. Saf. Sci. 1998, 30, 235–247. [Google Scholar] [CrossRef]
  6. Uğurlu, Ö.; Yıldız, S.; Loughney, S.; Wang, J. Modified human factor analysis and classification system for passenger vessel accidents (HFACS-PV). Ocean. Eng. 2018, 161, 47–61. [Google Scholar] [CrossRef] [Green Version]
  7. Abbot, J.; Renwick, N. Pirates? Maritime piracy and societal security in Southeast Asia. Pac. Rev. Peace Secur. Glob. Change 1999, 11, 7–24. [Google Scholar] [CrossRef]
  8. Etman, E.; Halawa, A. Safety culture, the cure for human error: A critique. Dmitriy Zhukov 2007, 115, 115–126. [Google Scholar]
  9. Grabowski, M.; You, Z.; Song, H.; Wang, H.; Merrick, J.R.W. Sailing on Friday: Developing the link between safety culture and performance in safety-critical systems. IEEE Trans. Syst. Man Cybern. Part A Syst. Hum. 2010, 40, 263–284. [Google Scholar] [CrossRef]
  10. Ren, J.; Jenkinson, I.; Wang, J.; Xu, D.L.; Yang, J.B. A methodology to model causal relationships on offshore safety assessment focusing on human and organizational factors. J. Saf. Res. 2008, 39, 87–100. [Google Scholar] [CrossRef]
  11. MI News Network. The Relation between Human Error and Marine Industry. Available online: https://www.marineinsight.com/marine-safety/the-relation-between-human-error-and-marine-industry/ (accessed on 7 September 2021).
  12. Khan, R.U.; Yin, J.; Mustafa, F.S.; Farea, A.O.A. A data centered human factor analysis approach for hazardous cargo accidents in a port environment. J. Loss Prev. Process Ind. 2022, 75, 104711. [Google Scholar] [CrossRef]
  13. Harvey, C.; Stanton, N.; Zheng, P. The Ergonomist. Safety at Sea: Human Factors Aboard Ship. Available online: https://www.ergonomics.org.uk/Public/Resources/Articles/Safety_at_sea__human_factors_aboard_ship.aspx (accessed on 1 January 2022).
  14. Khan, R.U.; Yin, J.; Mustafa, F.S. Accident and pollution risk assessment for hazardous cargo in a port environment. PLoS ONE 2021, 16, e0252732. [Google Scholar] [CrossRef]
  15. Kristiansen, S. Maritime Transportation: Safety Management and Risk Analysis; Routledge: London, UK, 2013. [Google Scholar]
  16. Hollnagel, E.; Goteman, O. The functional resonance accident model. Proc. Cogn. Syst. Eng. Process Plant 2004, 2004, 155–161. [Google Scholar]
  17. Sahin, B. Consistency control and expert consistency prioritization for FFTA by using extent analysis method of trapezoidal FAHP. Appl. Soft Comput. 2017, 56, 46–54. [Google Scholar] [CrossRef]
  18. Kuzu, A.C.; Akyuz, E.; Arslan, O. Application of fuzzy fault tree analysis (FFTA) to maritime industry: A risk analysing of ship mooring operation. Ocean. Eng. 2019, 179, 128–134. [Google Scholar] [CrossRef]
  19. Lavasani, S.M.; Zendegani, A.; Celik, M. An extension to Fuzzy Fault Tree Analysis (FFTA) application in petrochemical process industry. Process Saf. Environ. Prot. 2015, 93, 75–88. [Google Scholar] [CrossRef]
  20. Akyuz, E. Application of fuzzy FMEA to perform an extensive risk analysis in maritime transportation engineering. Int. J. Marit. Eng. 2017, 159. [Google Scholar] [CrossRef]
  21. Soner, O.; Celik, E.; Akyuz, E. Application of AHP and VIKOR methods under interval type 2 fuzzy environment in maritime transportation. Ocean. Eng. 2017, 129, 107–116. [Google Scholar] [CrossRef]
  22. Baig, A.A.; Ruzli, R. Estimation of failure probability using fault tree analysis and fuzzy logic for CO2 transmission. Int. J. Environ. Sci. Dev. 2014, 5, 26. [Google Scholar]
  23. Celik, M.; Lavasani, S.M.; Wang, J. A risk-based modelling approach to enhance shipping accident investigation. Saf. Sci. 2010, 48, 18–27. [Google Scholar] [CrossRef]
  24. Demirel, H.; Akyuz, E.; Celik, E.; Alarcin, F. An interval type-2 fuzzy QUALIFLEX approach to measure performance effectiveness of ballast water treatment (BWT) system on-board ship. Ships Offshore Struct. 2019, 14, 675–683. [Google Scholar] [CrossRef]
  25. Akyuz, E.; Celik, E. A quantitative risk analysis by using interval type-2 fuzzy FMEA approach: The case of oil spill. Marit. Policy Manag. 2018, 45, 979–994. [Google Scholar] [CrossRef]
  26. Gul, M.; Celik, E.; Akyuz, E. A hybrid risk-based approach for maritime applications: The case of ballast tank maintenance. Hum. Ecol. Risk Assess. Int. J. 2017, 23, 1389–1403. [Google Scholar] [CrossRef]
  27. Mahmood, Y.A.; Ahmadi, A.; Verma, A.K.; Srividya, A.; Kumar, U. Fuzzy fault tree analysis: A review of concept and application. Int. J. Syst. Assur. Eng. Manag. 2013, 4, 19–32. [Google Scholar] [CrossRef]
  28. Turan, O.; Öiçer, A.İ.; Martin, P.L. Risk assessment of loss of life for fishing vessels in fuzzy environment. In Safety and Reliability; Taylor & Francis: London, UK, 2003; Volume 23, pp. 19–38. [Google Scholar]
  29. Hauptmanns, U. Semi-quantitative fault tree analysis for process plant safety using frequency and probability ranges. J. Loss Prev. Process Ind. 2004, 17, 339–345. [Google Scholar] [CrossRef]
  30. Yuhua, D.; Datao, Y. Estimation of failure probability of oil and gas transmission pipelines by fuzzy fault tree analysis. J. Loss Prev. Process Ind. 2005, 18, 83–88. [Google Scholar] [CrossRef]
  31. Mentes, A.; Helvacioglu, I.H. Fuzzy risk assessment for spread mooring systems. In Proceedings of the 1st International Conference on Floating Structures for Deepwater Operations, Glasgow, UK, 21–23 September 2009; pp. 21–23. [Google Scholar]
  32. Ferdous, R.; Khan, F.; Veitch, B.; Amyotte, P.R. Methodology for computer aided fuzzy fault tree analysis. Process Saf. Environ. Prot. 2009, 87, 217–226. [Google Scholar] [CrossRef] [Green Version]
  33. Mentes, A.; Helvacioglu, I.H. An application of fuzzy fault tree analysis for spread mooring systems. Ocean. Eng. 2011, 38, 285–294. [Google Scholar] [CrossRef]
  34. Tanaka, H.; Fan, L.T.; Lai, F.S.; Toguchi, K. Fault-tree analysis by fuzzy probability. IEEE Trans. Reliab. 1983, 32, 453–457. [Google Scholar] [CrossRef]
  35. Weber, D.P. Fuzzy fault tree analysis. In Proceedings of the 3rd IEEE Conference on Computational Intelligence, Fuzzy Systems 1994b, IEEE World Congress, Padua, Italy, 18–23 July 1994; Volume 3, pp. 1899–1904. [Google Scholar]
  36. Misra, K.B.; Soman, K.P. Multi state fault tree analysis using fuzzy probability vectors and resolution identity. In Reliability and Safety Analyses Under Fuzziness; Springer: Berlin/Heidelberg, Germany, 1995; pp. 113–125. [Google Scholar]
  37. Tunçel, A.L.; Akyüz, E.; Arslan, Ö. An extended event tree risk analysis under fuzzy logic environment: The case of fire in ship engine room. J. ETA Marit. Sci. 2021, 9, 210–220. [Google Scholar] [CrossRef]
  38. Zadeh, L.A. Fuzzy sets. In Fuzzy Sets, Fuzzy Logic, and Fuzzy Systems: Selected Papers by Lotfi a Zadeh; World Scientific: Singapore, 1996; Volume 8, pp. 338–353. [Google Scholar]
  39. Hsu, H.M.; Chen, C.T. Aggregation of fuzzy opinions under group decision making. Fuzzy Sets Syst. 1996, 79, 279–285. [Google Scholar]
  40. Onisawa, T. An approach to human reliability in man-machine systems using error possibility. Fuzzy Sets Syst. 1988, 27, 87–103. [Google Scholar] [CrossRef]
  41. Marine Accident Investigation Branch. In Grounding of Chemical Tanker Key Bora; UK Government: London, UK, 2021; Available online: https://www.gov.uk/maib-reports/grounding-of-chemical-tanker-key-bora (accessed on 16 December 2021).
  42. Chen, P.; Mou, J.; Li, Y. Risk analysis of maritime accidents in an estuary: A case study of Shenzhen Waters. Zesz. Nauk. Akad. Mor. W Szczec. 2015, 42, 54–62. [Google Scholar]
  43. Senol, Y.E.; Aydogdu, Y.V.; Sahin, B.; Kilic, I. Fault tree analysis of chemical cargo contamination by using fuzzy approach. Expert Syst. Appl. 2015, 42, 5232–5244. [Google Scholar] [CrossRef]
Figure 1. Fault tree diagram.
Jmse 10 00381 g001
Table 1. Expert weightage according to their credentials.
PositionShipmaster5
Pilot4
Academician3
Chief officer2
Junior officer or below1
Service time (sea)16 yrs or more5
11 to 15 yrs4
6 to10 yrs3
3 to 5 yrs2
Less than 2 yrs1
EducationPhD5
Master’s4
Bachelor’s3
HND2
School-level1
Service time (shore)20 yrs or more5
15 to 19 yrs4
10 to 14 yrs3
6 to 9 yrs2
Less than 5 yrs1
Table 2. Expert profile.
Professional PositionSea Service TimeShore Service TimeEducation Level
1Master11–1510–14MSc
2Master6–106–9Bachelor’s
3Academician6–106–9PhD
4Academician3–5≤5MSc
5Pilot3–5≤5Bachelor’s
Table 3. Description of the events.
Serial NoDescriptionOperational Faults
TEThe ship ran aground and flooded
IEHuman errors caused by ship crew members
1BE1Bridge team not following standard resource management measures
2BE2Not informing about the contradiction of information to the parent company on time
3BE3Lack of knowledge of crew members of the geographical conditions on site.
4BE4Crew was short staffed
5IE2Master’s decision
6BE5Using third-party information rather than accurate information from ship’s navigation system
7BE6Continue the task while informed about the situation
8BE7ECDIS technology not used properly
9IELack of understanding and information about the site
10BE8Inaccurate information provided by the third party about the geological and environmental conditions
11BE9Presence of a boulder on site
12BE10Late awareness of C/O about the conditions of the depth of water on site
Table 4. Verbal terms and equivalent fuzzy numbers [18].
Linguistic TermFuzzy Numbers
Very low (VL)(0.0, 0.1, 0.2)
Low (L)(0.1, 0.2, 0.2, 0.3)
Medium low (ML)(0.2, 0.3, 0.4, 0.5)
Medium (M)(0.4, 0.5, 0.5, 0.6)
Medium high (MH)(0.5, 0.6, 0.7, 0.8)
High (H)(0.7, 0.8, 0.8, 0.9)
Very high (VH)(0.8, 0.9, 1.0)
Table 5. Each expert’s score.
Weighting FactorTWWeighting Score
5434160.26
5323130.21
3325130.21
3214100.16
4213100.16
Table 6. Verbal assessment of each basic event.
M. Exp1M. Exp2M. Exp3M. Exp4M. Exp5
BE1MHMLMML
BE2HMHMHMH
BE3LLVLML
BE4MMMLMH
BE5VHHHMHVH
BE6VHVHHHH
BE7HMHVHVHVH
BE8VHVHVHHMH
BE9MLLLLML
BE10MMLVLM
Table 7. Similarity function values of each pair of experts for BE1.
Similarity Function (BE1)
1S(E1&E2)0.88
2S(E1&E3)0.88
3S(E1&E4)0.73
4S(E1&E5)1.00
6S(E2&E3)1.00
7S(E2&E4)0.85
8S(E2&E5)0.88
10S(E3&E4)0.85
11S(E3&E5)0.88
13S(E4&E5)0.73
Table 8. Average agreement (AA), relative agreement (RA), and consensus coefficient (CC). Values of BE1.
M. Exp.AARACC
10.590.190.23
20.590.190.20
30.650.210.21
40.560.180.17
50.650.210.19
Table 9. Defuzzified values obtained by aggregating possibilities.
Aggregated Expert Judgments on FailuresDefuzzified Possibility
BE10.3280.4280.4680.5680.448
BE20.5650.6650.7070.8070.686
BE30.1280.2080.2280.3280.225
BE40.4090.5090.5280.6280.519
BE50.7070.8070.8650.9240.824
BE60.7430.8430.8860.9430.851
BE70.7190.8190.8960.9390.841
BE80.7310.8310.9130.9480.854
BE90.1400.2400.2810.3810.261
BE100.2740.3570.3740.4740.371
Table 10. Probabilities of each event calculated from possibilities.
EventsProbabilities of Failures Obtained from Possibilities
BE13.41 × 10−3
BE21.68 × 10−2
BE33.33 × 10−4
BE45.69 × 10−3
BE54.20 × 10−2
BE65.18 × 10−2
BE74.78 × 10−2
BE85.27 × 10−2
BE95.53 × 10−4
BE101.80 × 10−3
Table 11. Occurrence probability and FVIM values.
MCSOccurrence ProbabilityFVIM
BE13.41 × 10−30.04186
BE21.68 × 10−20.20658
BE33.33 × 10−40.00409
BE45.69 × 10−30.06990
BE5BE6BE71.04 × 10−40.00128
BE85.27 × 10−20.64741
BE95.53 × 10−40.00680
BE101.80 × 10−30.02208
Table 12. Failure probabilities.
Basic EventsFailure Probabilities
BE21.68 × 10−2
BE33.33 × 10−4
BE45.69 × 10−3
BE54.20 × 10−2
BE65.18 × 10−2
BE74.78 × 10−2
BE85.27 × 10−2
Publisher’s Note: MDPI stays neutral with regard to jurisdictional claims in published maps and institutional affiliations.

