Article

Influence of Different Particle Parameters and Operating Conditions on Flow Characteristics and Performance of Deep-Sea Mining Pump

1
College of Mechanical and Electrical Engineering, Central South University, Changsha 410083, China
2
National Key Laboratory of Deep Sea Mineral Researches Development and Utilization Technology, Changsha 410083, China
*
Author to whom correspondence should be addressed.
J. Mar. Sci. Eng. 2022, 10(3), 363; https://doi.org/10.3390/jmse10030363
Submission received: 1 December 2021 / Revised: 23 February 2022 / Accepted: 26 February 2022 / Published: 3 March 2022
(This article belongs to the Section Ocean Engineering)

Abstract

:
A key piece of equipment in deep-sea mineral particle transportation systems, the deep-sea mining pump can be affected by factors such as different mineral particle parameters as well as its operating conditions. In this study, the influence of different particle parameters—such as particle size, concentration, and density—and different operating conditions—such as flow rate and speed—on the pressure and particle velocity distribution in a mining pump, as well as the movement trajectory of the particles in it, were analyzed. The reduction in the head and efficiency of the mining pump were obtained, and a comparison between experimental results and numerical calculations was conducted. The experimental and numerical analysis results showed good agreement, verifying the analytical results and the performance of the mining pump.

1. Introduction

Rich reserves of mineral resources such as polymetallic nodules and sulfides and cobalt-rich crusts are available in the deep sea. Based on their working environment, deep-sea mining pumps transport mostly coarse-grained mineral nodules. Since the parameters of these coarse-grained minerals differ, the operating conditions of deep-sea mining pumps are constantly changing [1,2]. Different particle parameters and operating conditions affect the pump’s flow characteristics, including pressure, speed, particle trajectory, as well as its performance, indicated by its head and efficiency [3,4,5,6].
Since the development of computational fluid dynamics (CFD) tools in the 1980s, many studies on the internal flow fields of slurry pumps based on numerical analysis have emerged. Some studies have simulated the solid-liquid two-phase flow to predict the trajectory of particles in a pump [7,8]. Wang et al. used the particle model to analyze the internal flow field characteristics of a centrifugal pump transporting solid-liquid two-phase flow [9]. Gandhi et al. proposed a new method to analyze the flow characteristics of flow passage components based on the characteristics of the slurry pump [10]. Peng et al. analyzed the flow characteristics of the solid-liquid two-phase flow in a pump using a mixed Euler–Euler model based on an optimized impeller of a centrifugal slurry pump. Moreover, the original pump and the optimized design of the pump were tested and verified, the results indicating that compared to the original pump, the optimized pump exhibited significantly improved flow performance [11]. Tarodiya et al. used a sliding grid method to model the particle-size distribution of slurry containing particles of different sizes. The influence of particle size changes on the movement characteristics of particles was analyzed based on a Euler–Euler model, and experiments were conducted for comparison. The results showed that changes in particle-size distribution significantly affected the movement characteristics of the particles in the impeller and the flow channel. As the number of fine-grained particles increased, the pressure and maximum viscosity of the particles both decreased [12]. Several researchers have also studied the movement characteristics of solid particles in centrifugal pumps from different perspectives through experiments analyzing the influence of slurry concentration and particle size on the pump’s flow characteristics. These studies have provided a reference for the influence of different particle parameters on the pressure and velocity distribution in pumps [13,14].
Different particle parameters and operating conditions have a significant impact on pump performance. Wang et al. studied the influence of sludge concentration and particle size on the performance of a double-suction centrifugal pump. Their results showed that owing to the presence of sludge, the pump head and shaft power were lower than when pure water was transported, which also decreased as the sludge concentration and sludge particle size increased [15]. Gahlot et al. studied the influence of coal and tailings on the performance of a centrifugal slurry pump. Their results showed that the particle concentration and flow rate affected the pump head and efficiency [16]. Sellgren et al. studied the influence of sand-clay mixtures on the performance of a centrifugal slurry pump. Their results showed that the pump head loss was reduced by approximately 30% after adding clay [17]. Li et al. studied the effect of flow rate and particle size on the performance of a centrifugal slurry pump using numerical analysis. Their results showed that as particle size and flow rate increased, the performance of the pump gradually deteriorated [18]. Serrano et al. analyzed pump performance under different sediment conditions [19]. Zhao used experimental methods to study the influence of solid materials on the efficiency of a centrifugal pump. The results showed that as the concentration of solid particles increased, the pump head gradually decreased, the efficiency also decreasing (exponentially) [20]. Jeon et al. used design optimization to evaluate pump performance to improve its efficiency [21]. Tarodiya et al. adopted the mixture model and the Eulerian–Eulerian multiphase model to analyze the performance changes of a centrifugal slurry pump during solid-liquid two-phase flow. Their simulation results were compared with experimental results, showing that predictions using the Eulerian–Eulerian model confirmed that the pump head and efficiency decreased as the solid particle size and concentration increased, unlike those of the mixture model [22]. Some researchers have also analyzed the influence of different operating conditions on the flow characteristics in pumps [23,24,25].
In summary, under different particle parameters and working conditions, the flow characteristics and hydraulic performance of deep-sea mining pumps show different characteristics. Reasonable numerical calculation methods and models have been used for analysis, and hydraulic performance tests have been carried out. A test pump was developed to verify the numerical calculation method and model. Further study of these problems has very important practical significance for the design, research, test and engineering application of deep-sea mining pump.

2. Three-Dimensional Model and Numerical Calculation Strategy

2.1. Three-Dimensional Model

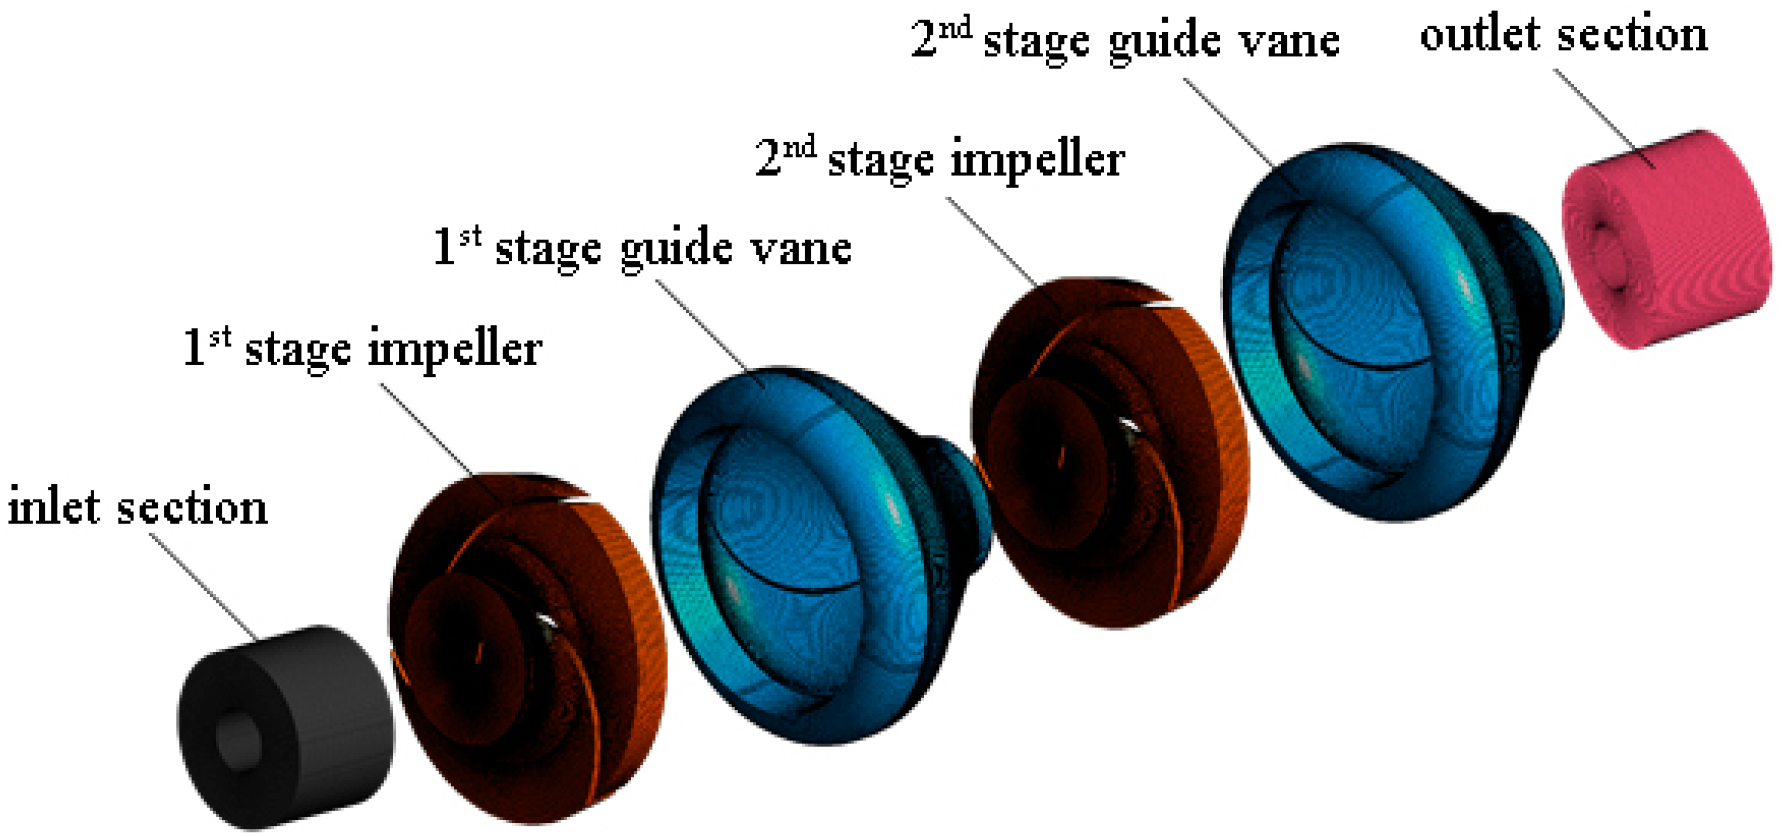
The main design parameter values of deep-sea mining pumps adopted in this study were a rated flow rate Qd = 420 m3/h, a single-stage head Hd = 45 m, a rated efficiency ηd = 52%, and a rated rotational speed n = 1450 r/min. The overall structure model is shown in Figure 1.
The mining pump impeller design has the geometric parameters shown in Table 1.
In the numerical simulations, the full flow-field computational domain includes the inlet section, the first-stage impeller, the first-stage guide vane, the second-stage impeller, the second-stage guide vane, and the outlet section, as shown in Figure 2.

2.2. Numerical Calculation Strategy

Ansys Fluent 18.0 software was used for the numerical simulation of the mining pump in the calculation domain. It was assumed that there is no energy and mass exchange between the particle phase and the fluid phase, and gravity was taken into consideration. The SST kω turbulence model was used for the fluid domain calculation, whereas DPM based on a Euler–Lagrange coordinate system was used to calculate the motion of the particle phase in the calculation domain. That is, the fluid phase was calculated as a continuum in Euler coordinates, and the solid particles were tracked as discrete in Lagrange coordinates. The model can fully consider the turbulence effect under the premise of setting the material properties of particles, capturing the movement details of particles in the flow field, and obtaining the erosion and wear effect of particles on the flow components. The Navier–Stokes equations were discretized using a second-order upwind method. A convergence accuracy criterion of 10−4 was set for the numerical simulation. Convergence was judged when the monitored pressure and pump inlet and outlet mass flow rate change between adjacent iteration steps was not more than 0.001%.
ANSYS Fluent predicts the trajectory of a discrete phase particle by integrating the force balance on the particle, which is written in a Lagrangian reference frame. This force balance equates the particle inertia with the forces acting on the particle. Taking the force in the X direction, it can be written as:
d u p d t = F D ( u u p ) + g x ( ρ p ρ ) ρ p + F V + F P + F x
F D ( u u p ) is the drag force on a unit mass of solid-phase particles, as follows:
F D = 18 μ ρ p d p 2 C D R e 24
where u is the fluid velocity (m/s), u p is the particle velocity (m/s), μ is the dynamic viscosity (N·s/m2), ρ is the fluid density (kg/m3), ρ p is the particle density (kg/m3), d p is the particle diameter (mm), g x is the acceleration of gravity in the x-axis direction (m/s2), F V is additional mass force, F P is the additional force induced by pressure gradient in flow field, and F X is the force in the x-direction.
The drag force on a unit mass of solid-phase particles is shown in Equation (3):
τ r = ρ p d p 2 18 υ 24 C D R e
where υ is the dynamic viscosity of fluid (N·s/m2).
The Re is defined as:
R e ρ d p | u p u | υ
F V = 1 2 ρ ρ p d d t ( u u p )
F P = ρ ρ p u p u x
If the particle shape is irregular, its drag force can be calculated according to the following formula:
C D = 24 R e s p h ( 1 + b 1 R e s p h b 2 ) + b 3 R e s p h b 4 + R e s p h
where
b 1 = exp ( 2.3288 6.4581 φ + 2.4486 φ 2 )
b 2 = 0.0964 + 0.5565 φ
b 3 = exp ( 4.905 13.8944 φ + 18.4222 φ 2 10.2599 φ 3 )
b 4 = exp ( 1.4681 + 12.2584 φ 20.7322 φ 2 + 15.8855 φ 3 )
To calculate the motion trajectory of the solid-phase particles after colliding with the surface of the pump’s through-passage components, it is necessary to obtain the velocity direction and the magnitude of the velocity after colliding with the wall. As there is a certain degree of energy consumption after the particles collide with the surface of the through-passage components and rebound and velocity attenuation occurs, it is necessary to introduce an energy recovery coefficient related to the surface material properties of the through-passage components to express this consumption. In this paper, the random particle-wall collision model proposed by Tabakoff is used to calculate the energy recovery coefficient, and it can be expressed as follows:
e N = 1.0 0.0211 θ + 0.00228 θ 2 0.000000876 θ 3
e T = 0.953 0.000446 θ + 0.00000648 θ 3
where eN is the normal recovery coefficient, eT is the tangential recovery coefficient, and θ is the collision angle between the particle and the surface of the through-passage component.
Since the particle volume concentration used in this study was less than 12%, the fluid-to-particle unidirectional coupling method was used in the numerical simulation to calculate the motion trajectory of the solid-phase particle. The interval for computation of the particle trajectory was 20 steps. That is, every 20 steps of calculation for the fluid phase was used as the benchmark, and a particle trajectory computation was performed on this basis, and so on.

2.3. Boundary Condition Setting

The mining pump inlet adopts the form of a velocity-inlet. The inlet velocity is calculated based on the inlet flow and the inlet through-passage cross-sectional area. At the same time, it is defined that the solid-phase particles at the inlet face enter the computational domain axially, their entry velocity being the same as the fluid velocity. That is, there is no relative velocity. The outlet of the mining pump adopts the boundary condition in the form of outflow and defines the flow velocity weighting to be 1. All through-passage surfaces in the computational domain adopt nonslip boundary conditions, the wall roughness being defined to be 0.5 based on the real blades of the model pump. The data transmission between the inlet section and the impeller and between the impeller and the spatial guide vane adopts the interface method. In the setting of the boundary conditions for solid-phase particles, the escape boundary condition was used for the pump inlet and outlet, respectively, and the reflect boundary condition was used for the surfaces of other through-passage components.

3. Influence on Flow Characteristics and Performance

3.1. Numerical Analysis Scheme

Based on the actual operating conditions of a deep-sea mining pump, the solid particle size, particle concentration, particle density various flow conditions and different rotational speeds were selected as factors of influence in the numerical calculations. The specific parameter values and operating conditions are shown in Table 2.

3.2. Influence of Different Particle Parameters

3.2.1. Different Particle Sizes

Existing literature has indicated that particle size has a significant influence on the flow characteristics inside a pump with solid-liquid two-phase flow [26,27,28,29]. The numerical calculations in this paper used the following parameters: the volume concentration of the solid phase transported was 7.5%; the flow rate was 420 m3/h; the pump speed was 1450 rpm; and the particle sizes were 3, 6, 10, 14, 17, and 20 mm, respectively.
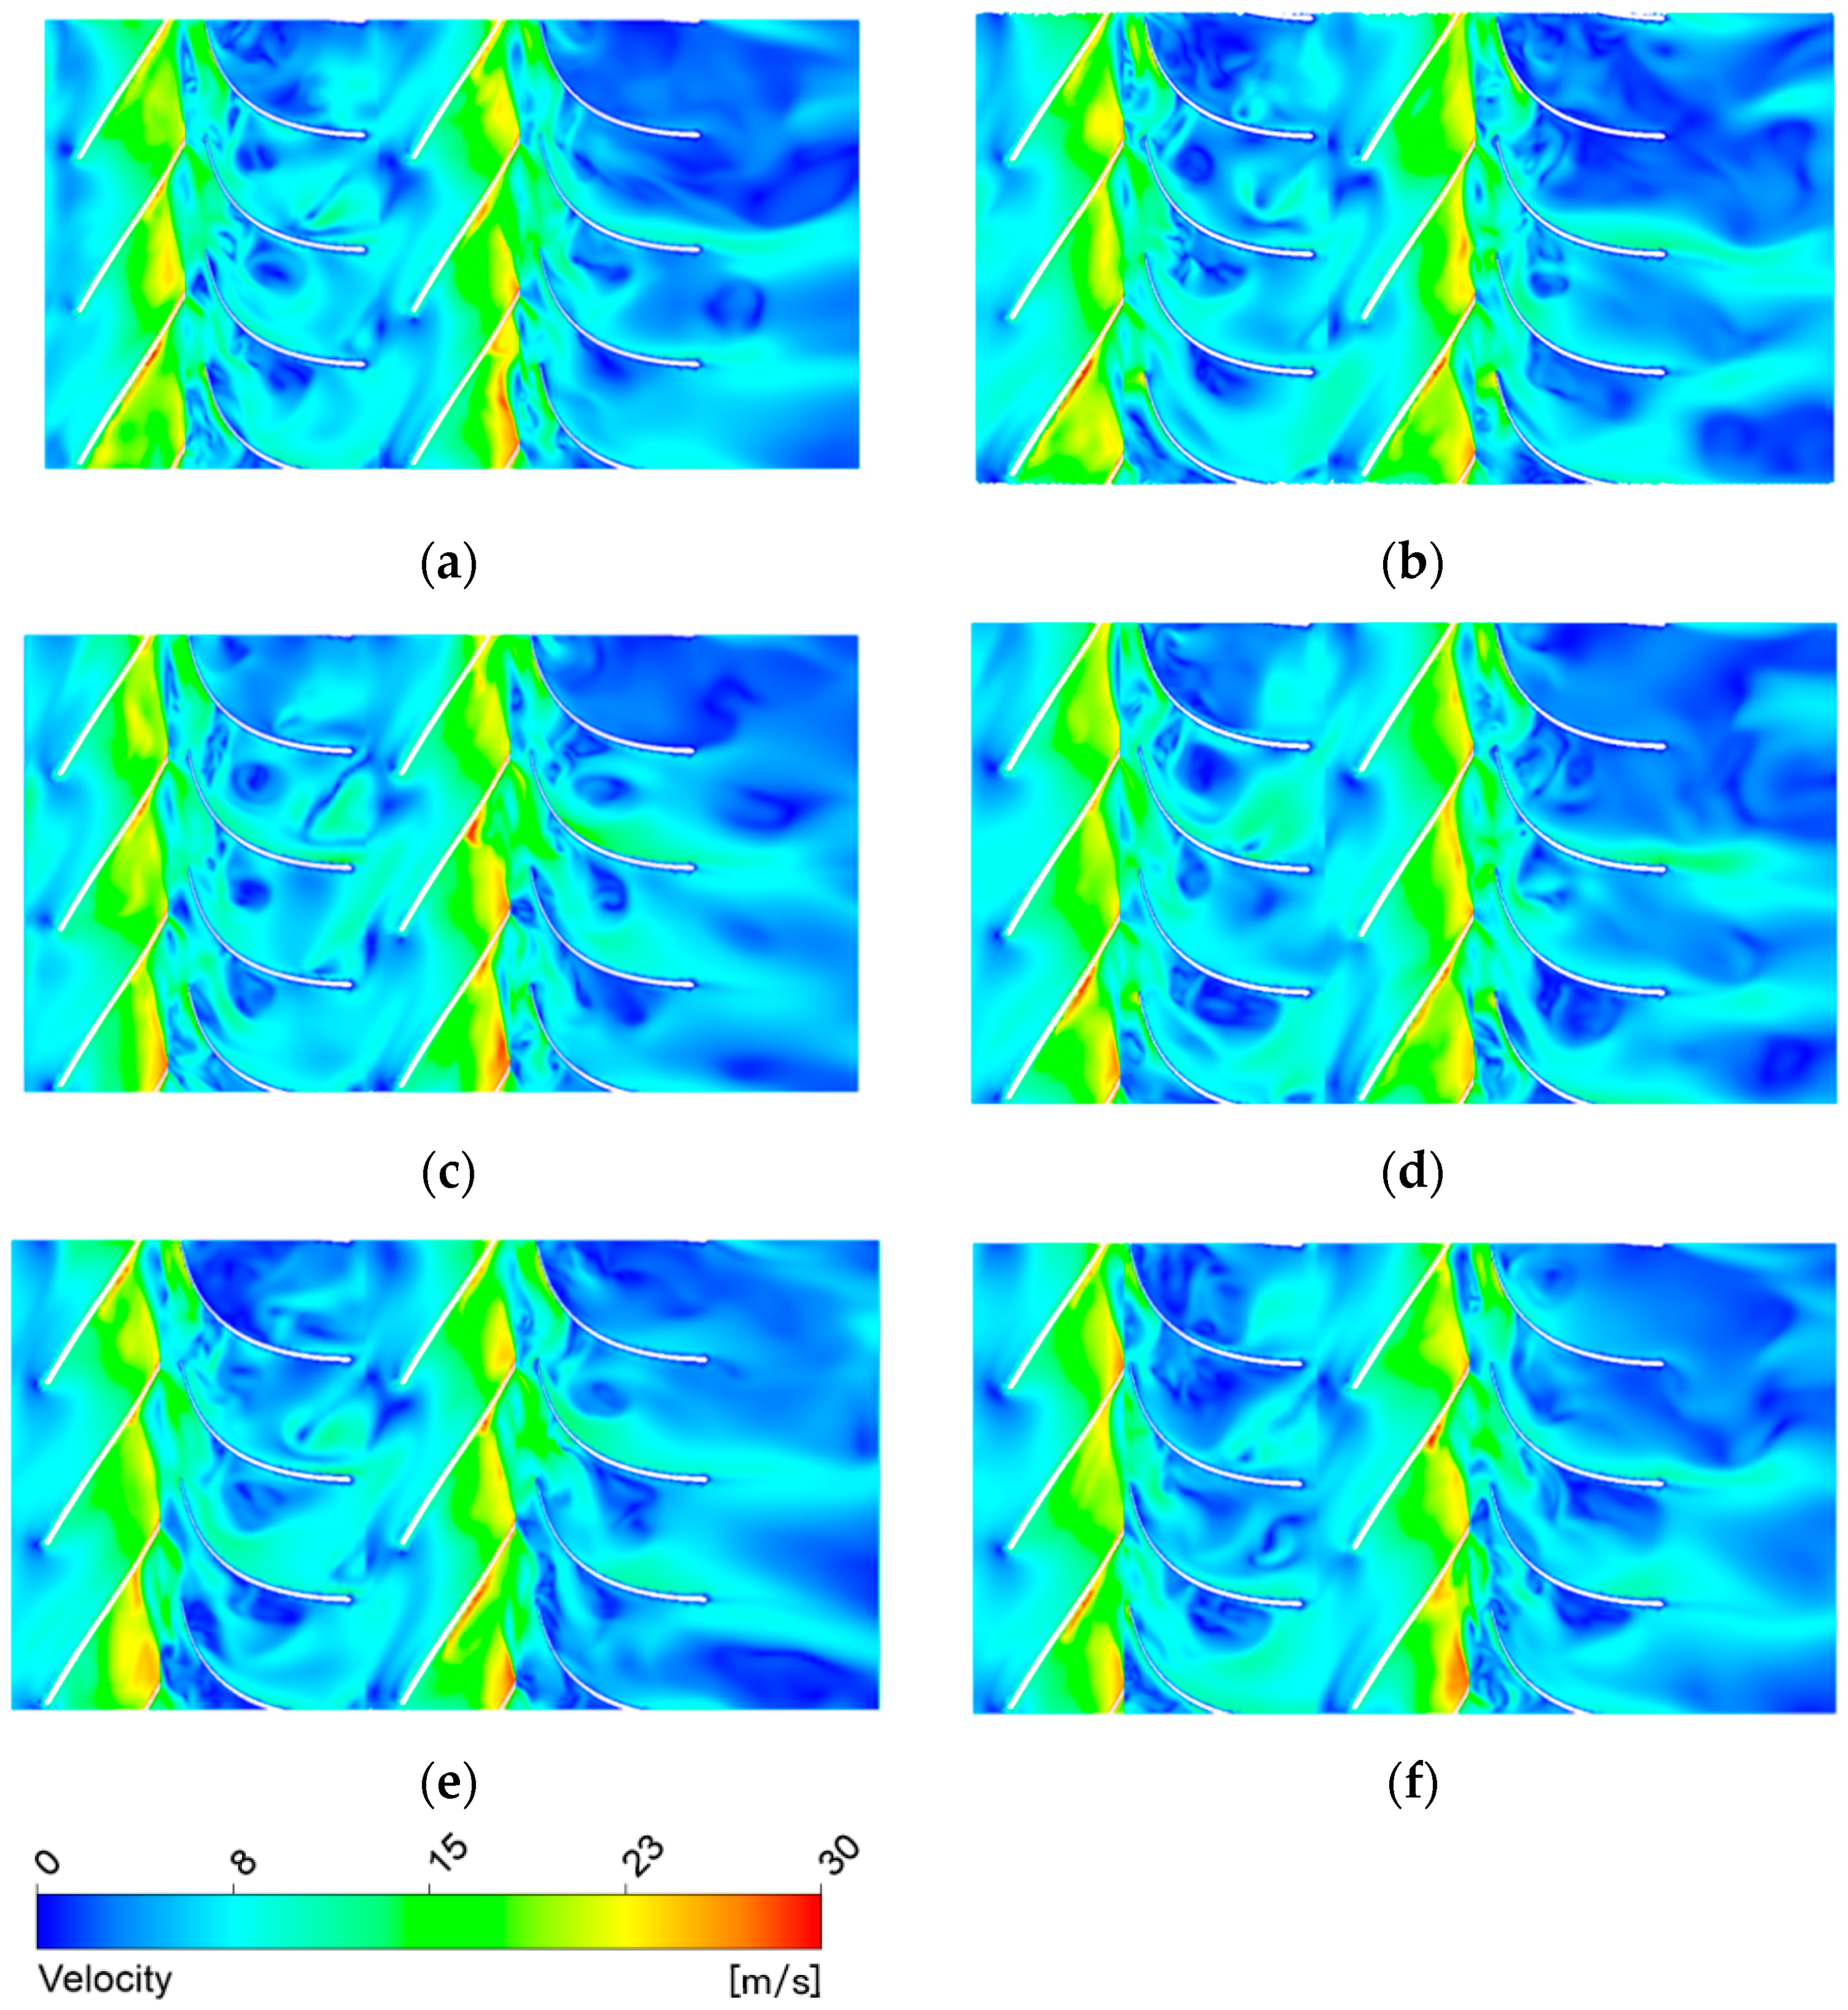
It can be seen from Figure 3 and Figure 4 that the pressure changes in the blade-to-blade (B2B) view are similar to those of the middle cross-section in the calculation domain, indicating that the impeller rotation could function normally with the various particle sizes. However, owing to the interference between the dynamic impeller and the static space guide vane, the flow in the region where the two connect is relatively turbulent. A local high-speed zone appears at the impeller outlet, while a local low-speed zone appears at the outlet of the guide vane. Moreover, the low-speed zone at the outlet of the second-stage guide vane is relatively large in area. The low velocity zone increases with the increase of particle size. This is because the restriction of the guide vane on the flow is reduced, causing the local low-energy flow to expand near the outlet.
In addition, as the particle size increases, the areas of the low-speed zones in the first-stage and second-stage guide vanes also increase, the flow becoming more turbulent. In particular, when the particle size is 20 mm, the low-speed zones at the outlet of the first-stage guide vane, at the junction between the second-stage impeller and the second-stage guide vane, as well as at the outlet of the second-stage guide vane, all reach the maximum area, allowing the areas of vortices generated by reflux and secondary flow structures in the flow passage to increase, leading to turbulence. This is because as the particle size and volume increase, the viscous resistance and inertia, and even the interference owing to self-rotation of the particles on the fluid flow structure, also increase. The blockage of the fluid owing to the particles has a greater impact than the particle entrainment by the fluid, thereby causing flow instability.
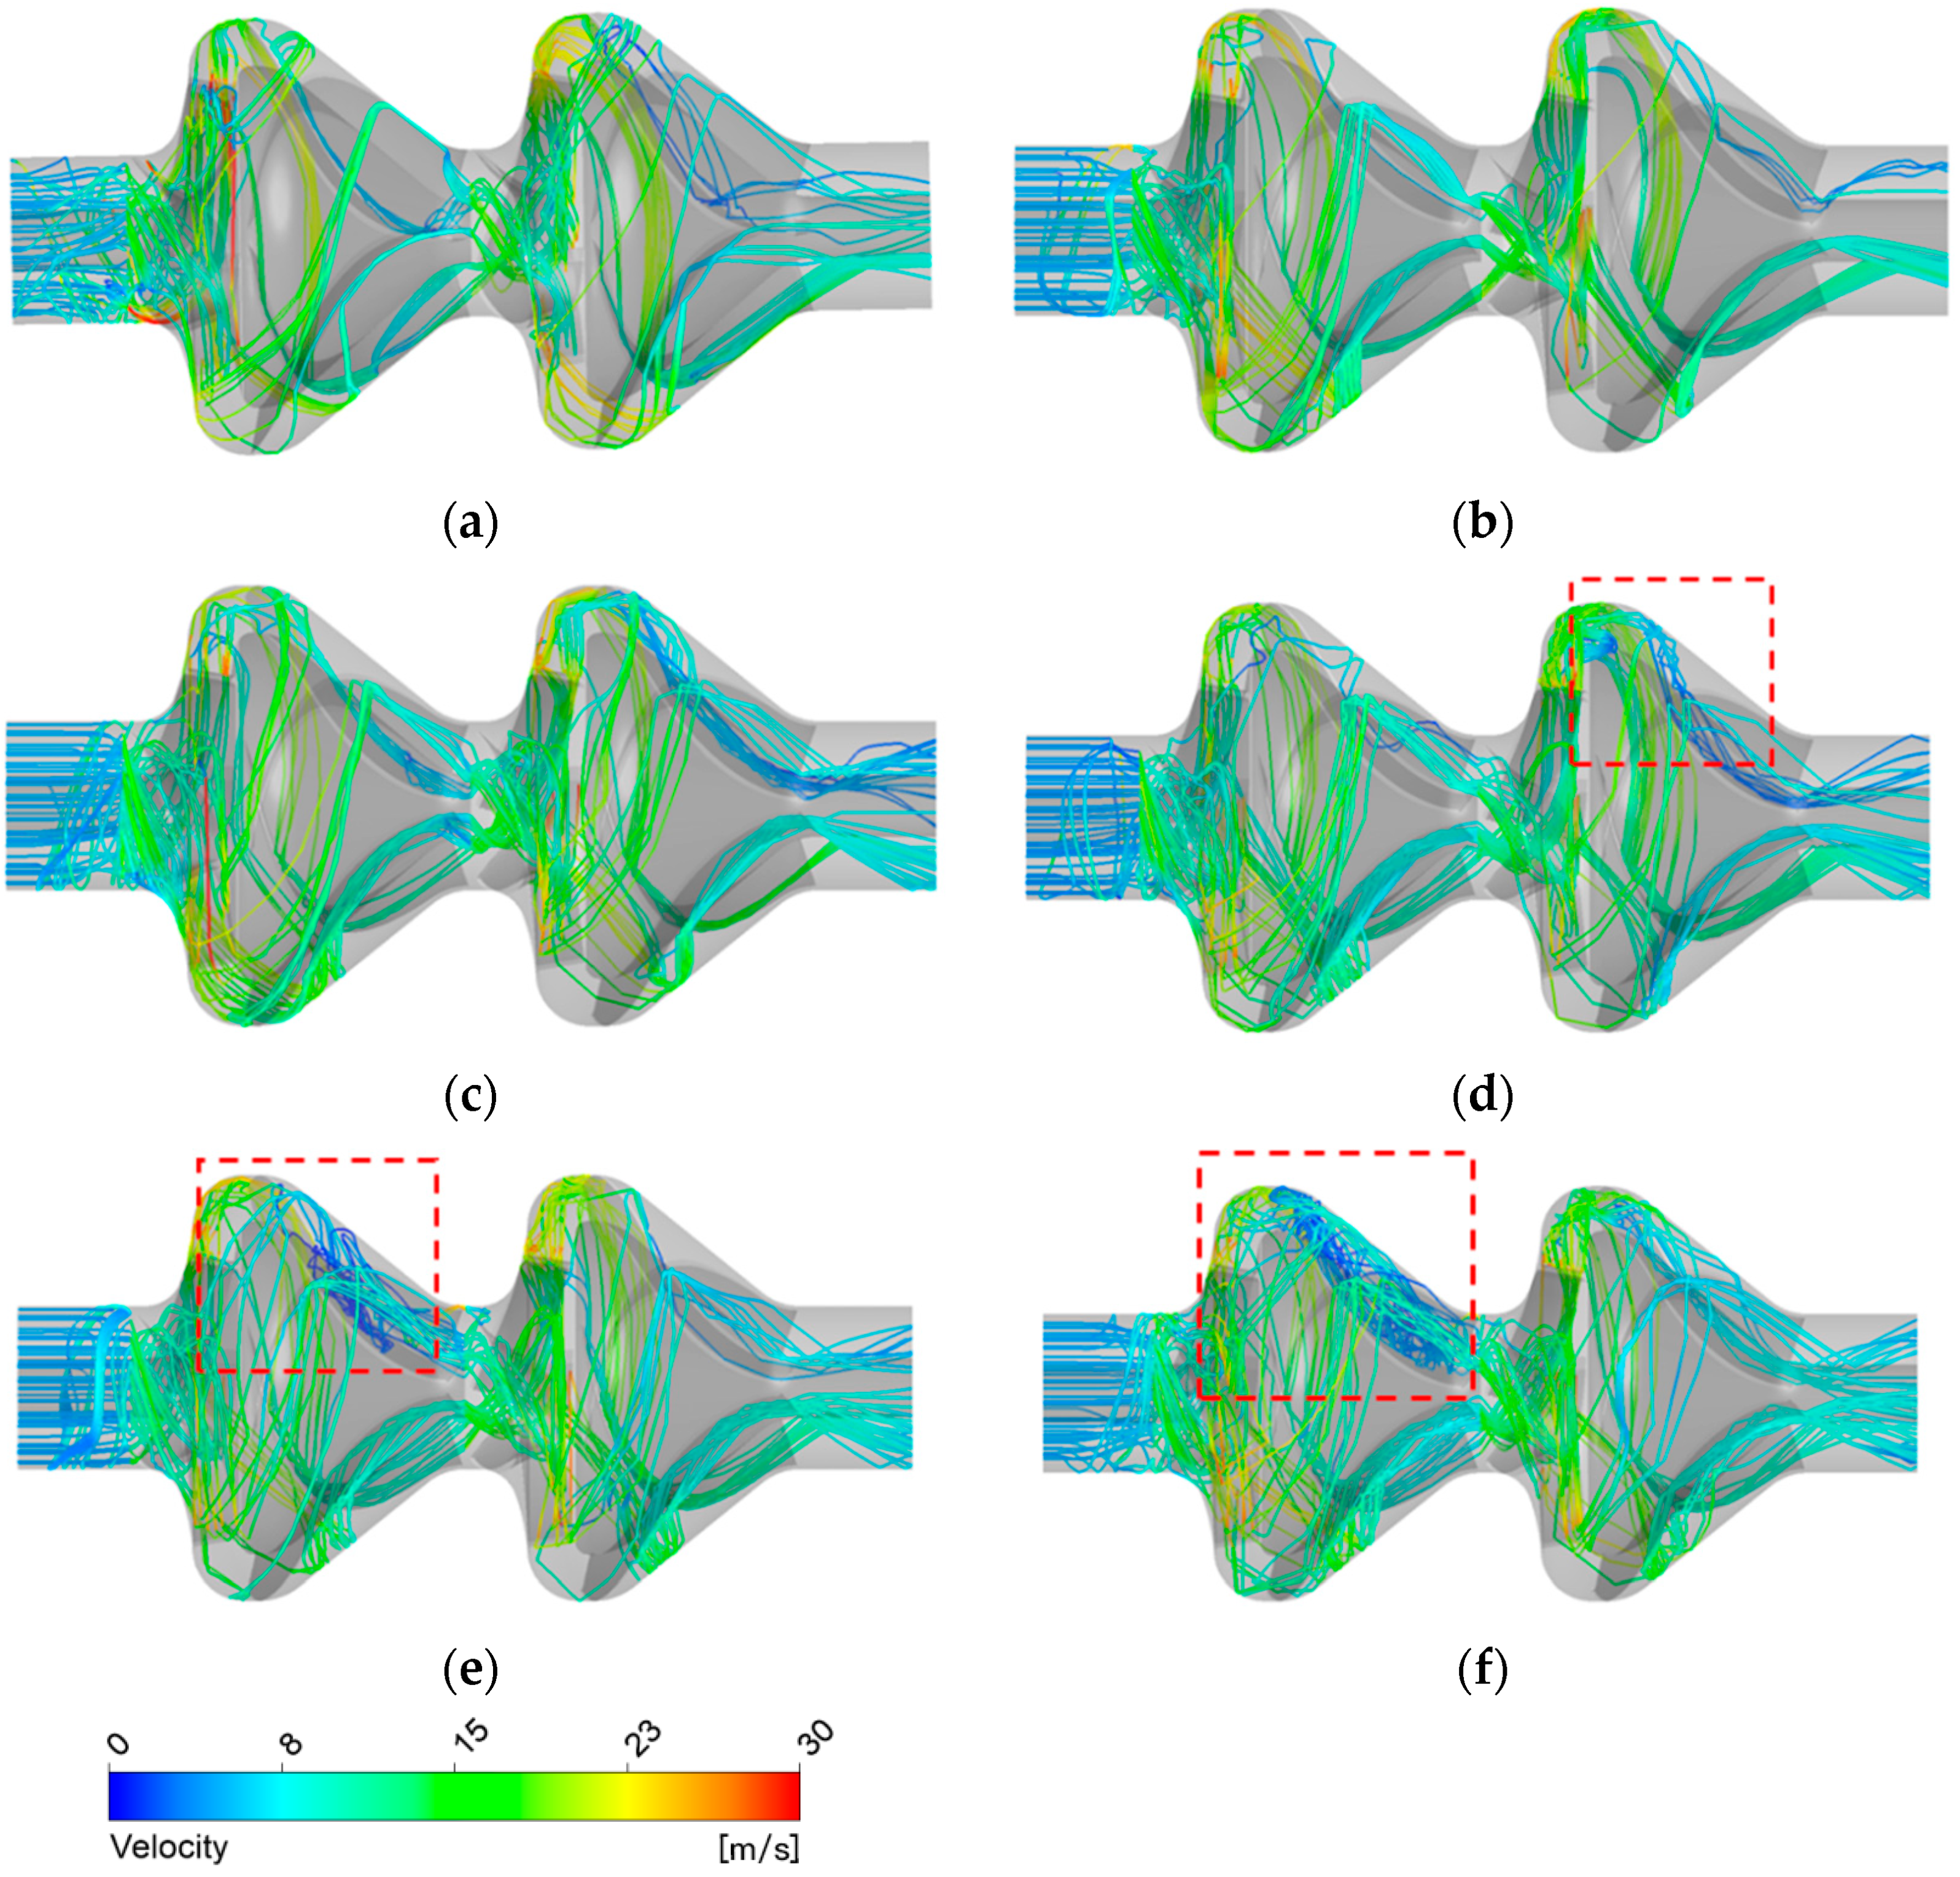
It can be seen from Figure 5 that the solid particles show varying degrees of velocity fluctuation along the normal direction of the main stream in the inlet section of the pump. This fluctuation is especially significant when the particle size is 3 mm, indicating that a relatively small particle size can better follow turbulent pulsation. Conversely, Figure 5b–f show that as the particle size gradually increases, the movement trajectories exhibit relatively small velocity fluctuations in the inlet section of the pump. This is because, as the solid-phase particle size increases, the single particle mass also increases, leading to a higher inertia, which lowers the followability of the particles to the fluid in the two-phase flow. As such, the particles tend to maintain their own movement directions.
The relationship between solid particle parameters and pump characteristics has been studied in slurry pumps, solid-liquid two-phase flow centrifugal pumps, and hydraulic turbines. Compared to when only pure water is transported, the pump performance is affected to different degrees when a two-phase flow of solid particles is conducted. Consequently, the head variation coefficient, Hr, and the efficiency variation coefficient, ηr. can be introduced, as follows:
Hr = Hm/Hw
ηr = ηm/ηw
where Hm and Hw are the pump head values when transporting solid-fluid two-phase flow and pure water (m), respectively; and ηm and ηw are the pump efficiencies when transporting solid-fluid two-phase flow and pure water (%), respectively.
In the above equations, the pump head can be calculated as follows:
H = p 2 p 1 ρ g + v 2 2 v 1 2 2 g
The pump efficiency can be calculated using:
η = ρ g Q H P × 100 %
where p 1 and p 2 are the inlet and outlet pressures of the pump (Pa), respectively; v 1 and v 2 are the inlet and outlet velocities of the pump (m/s), respectively; ρ is the fluid density (kg/m3); Q is the slurry pump inlet flow rate (m3/s); g is the gravitational acceleration (m/s2); and P is the shaft power (kW).
On this basis, the reduced head (RH) and reduced efficiency (RE) when transporting solid-fluid two-phase flow can be defined as:
R H = 1 H r
R E = 1 η r
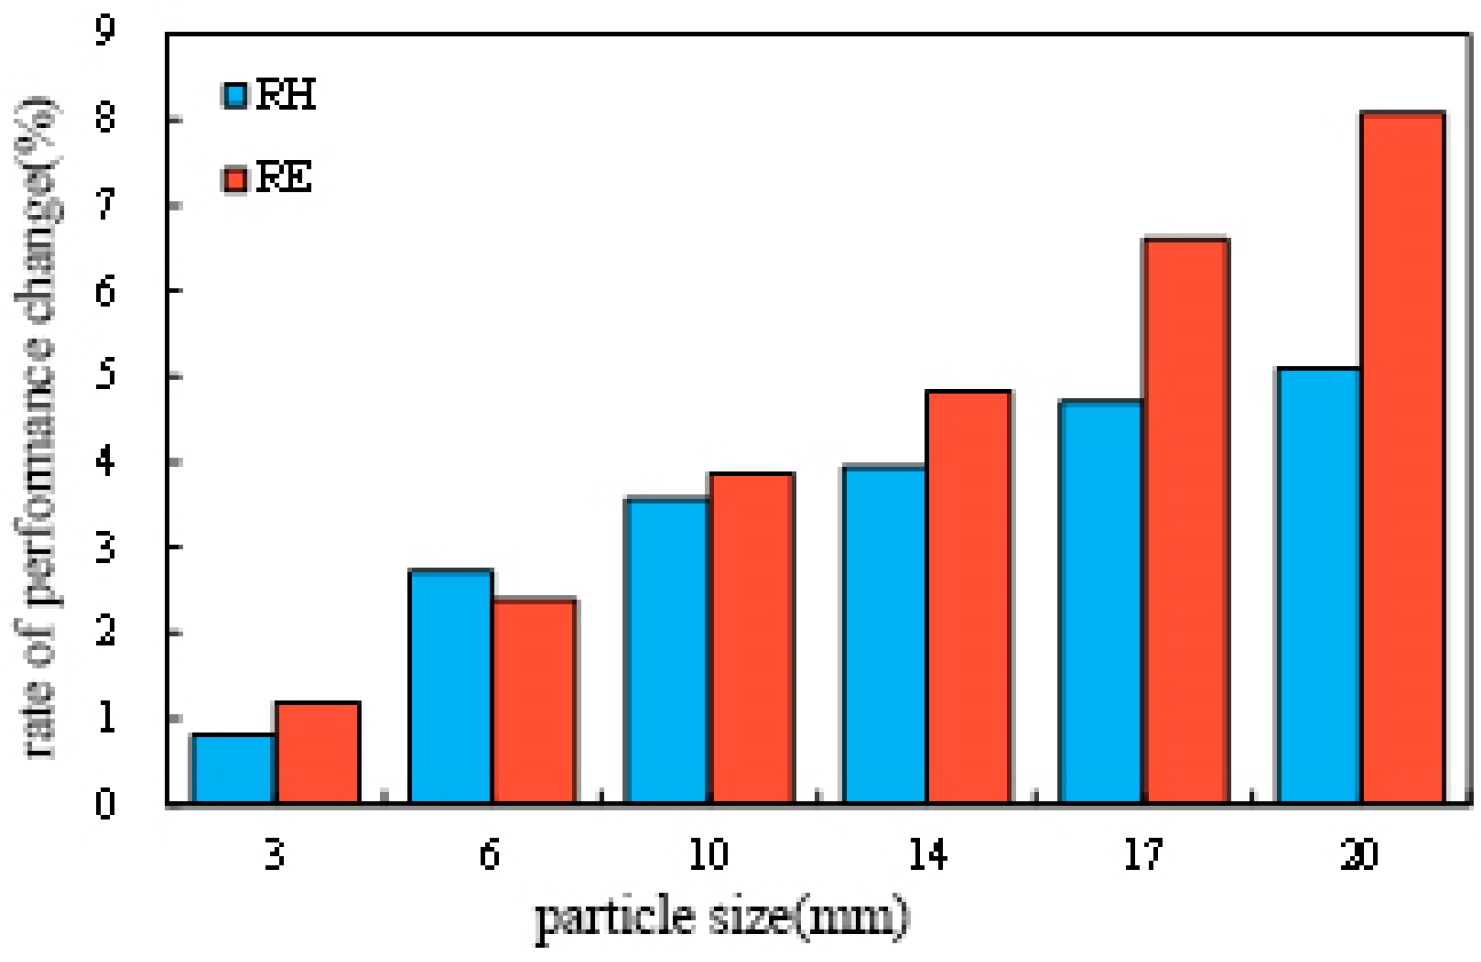
Figure 6 shows the changes in pump performance when transporting solid-phase particles of different particle sizes.
It can be seen from Figure 6 that when the solid-phase particle size increases from 3 to 20 mm, both RH and RE increase to varying degrees. The value of RH increases from 0.81 to 5.1%, while the value of RE increases from 1.2 to 8.1%, showing that there is a positive correlation between the solid-phase particle size and reduced pump performance when transporting solid-fluid two-phase flow. Moreover, when the particle size exceeds 3 mm, the reduction in pump performance becomes significant. This is because the increase in particle size enhances the influence of particles on the flow, thus aggravating the surface wear damage of the flow passage components. Moreover, as the particle size increases from 10 to 20 mm, the difference between RE and RH increases from 0.2 to 3%.

3.2.2. Different Concentrations

In the numerical calculation, the concentration of particles transported, Cv, was set to 4, 7.5, and 11.5%, respectively, with a flow rate of 420 m3/h, a pump rotational speed of 1450 rpm, and a particle size of 6 mm.
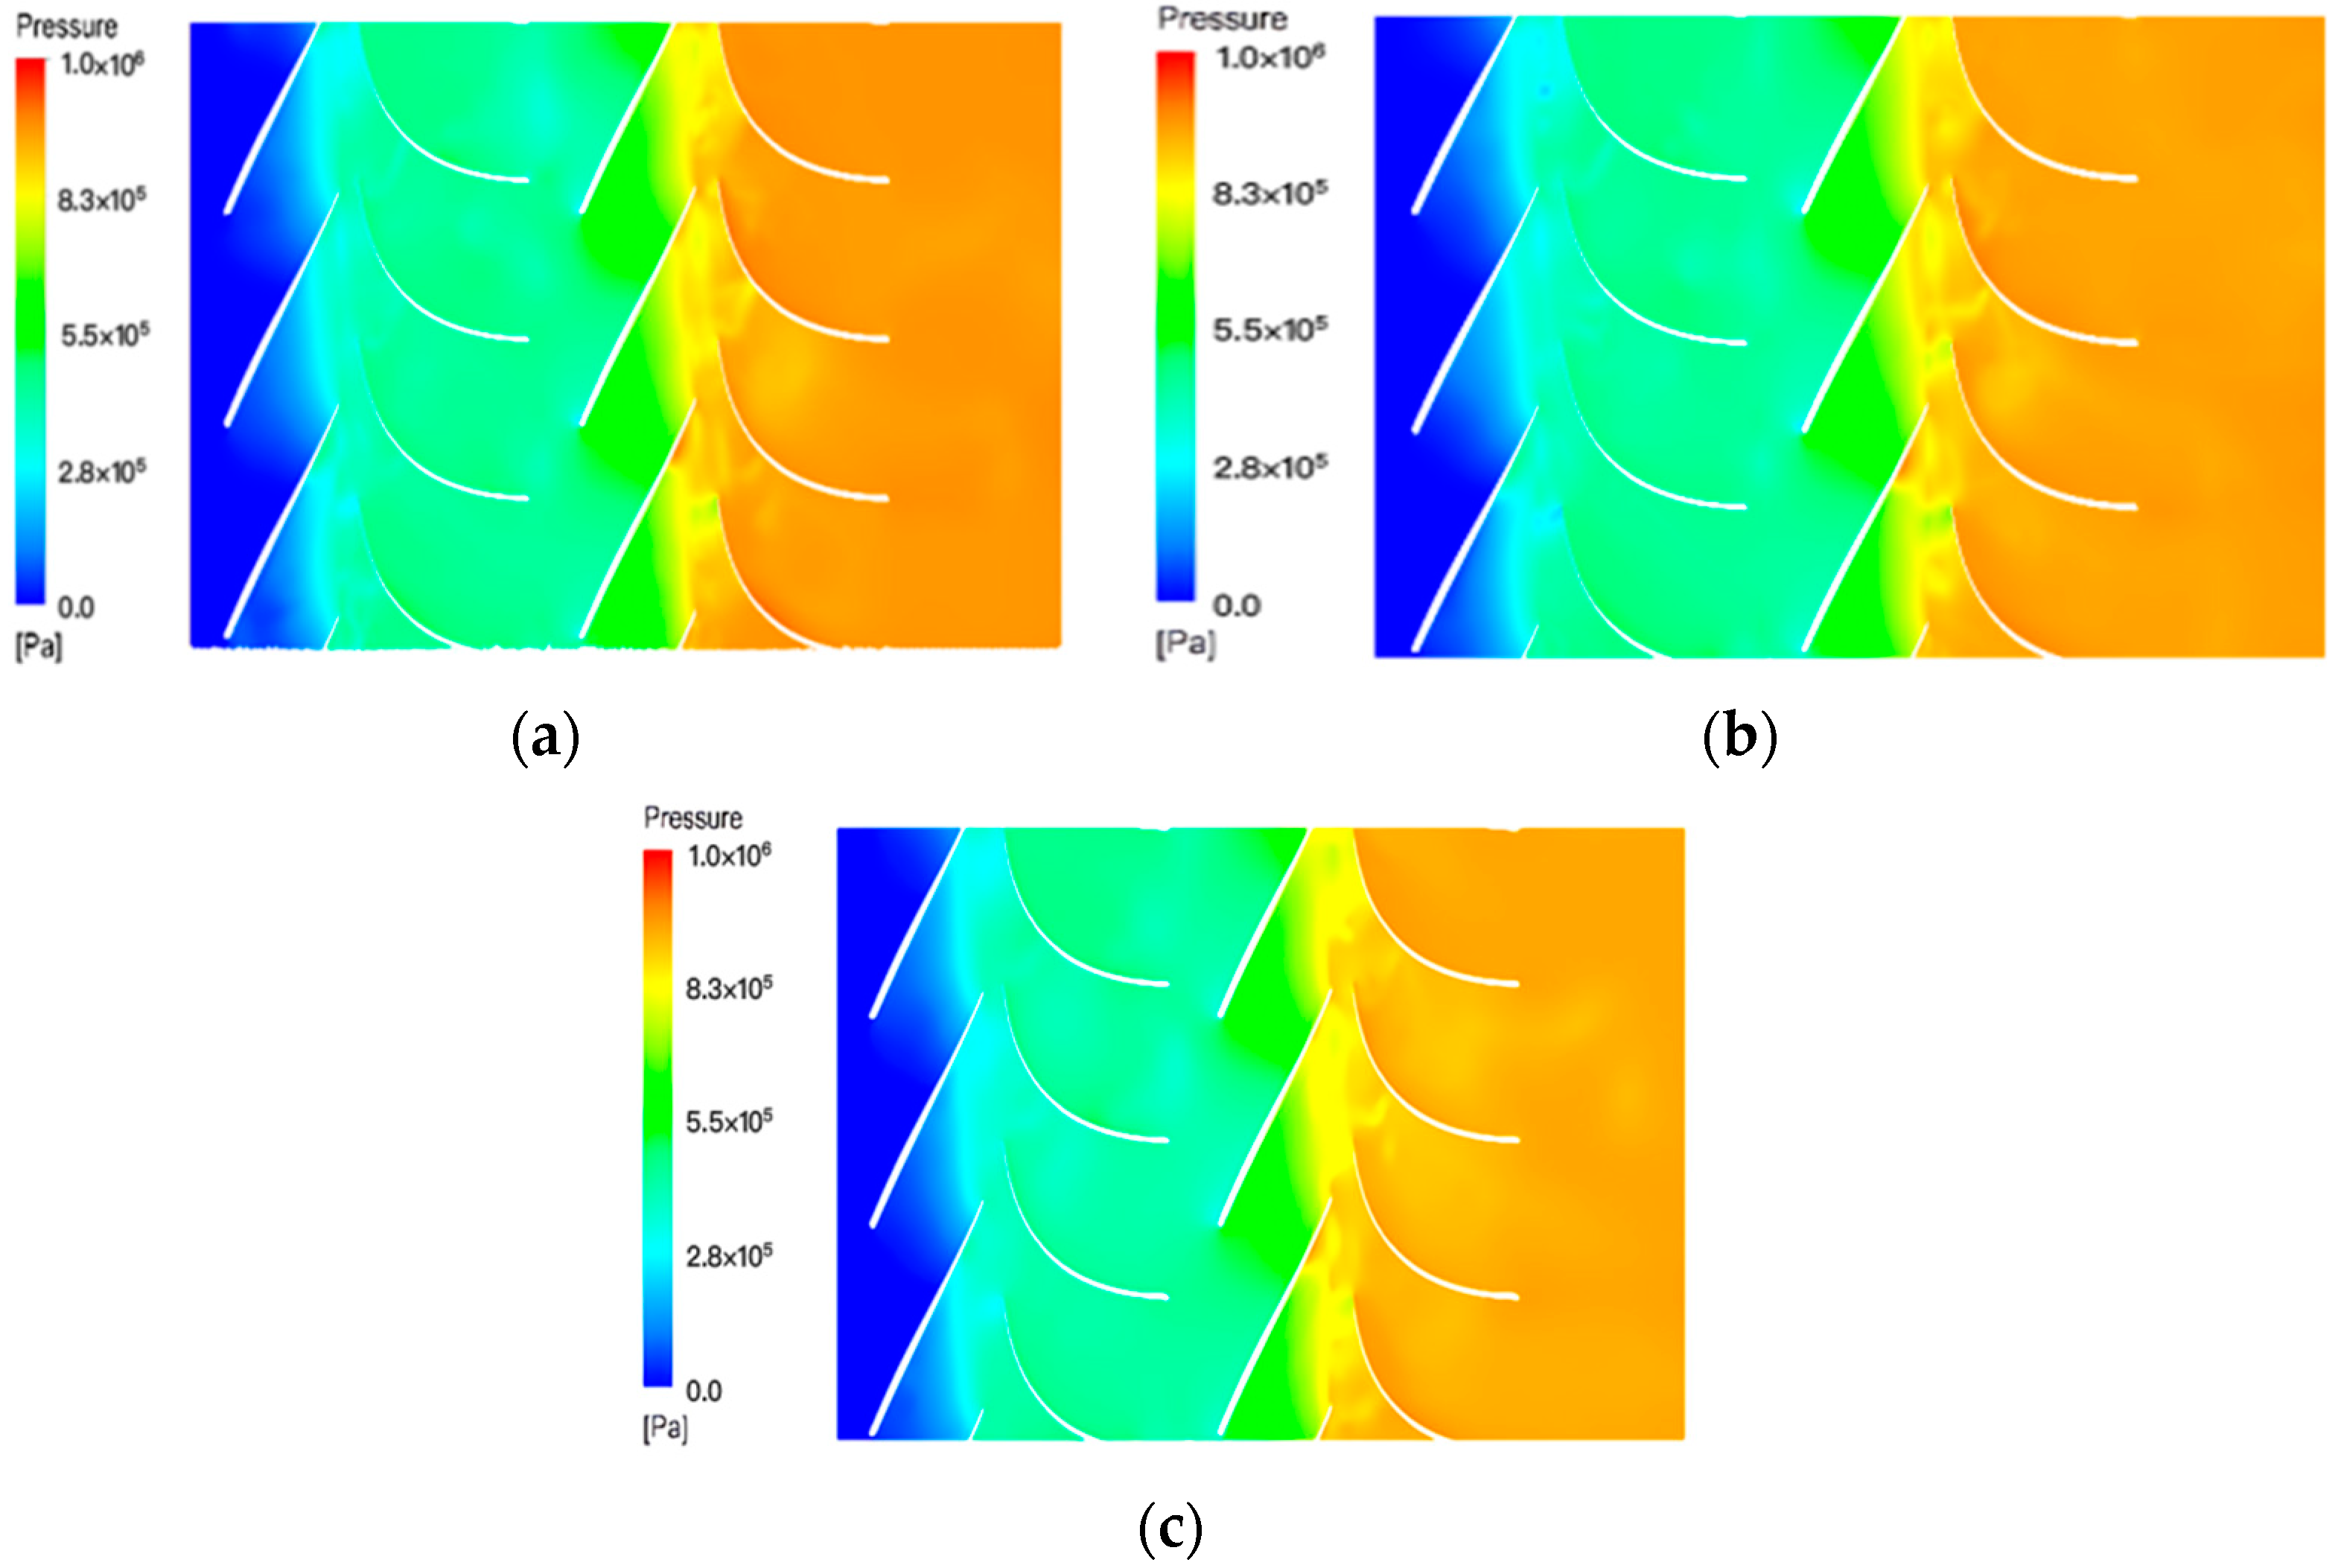
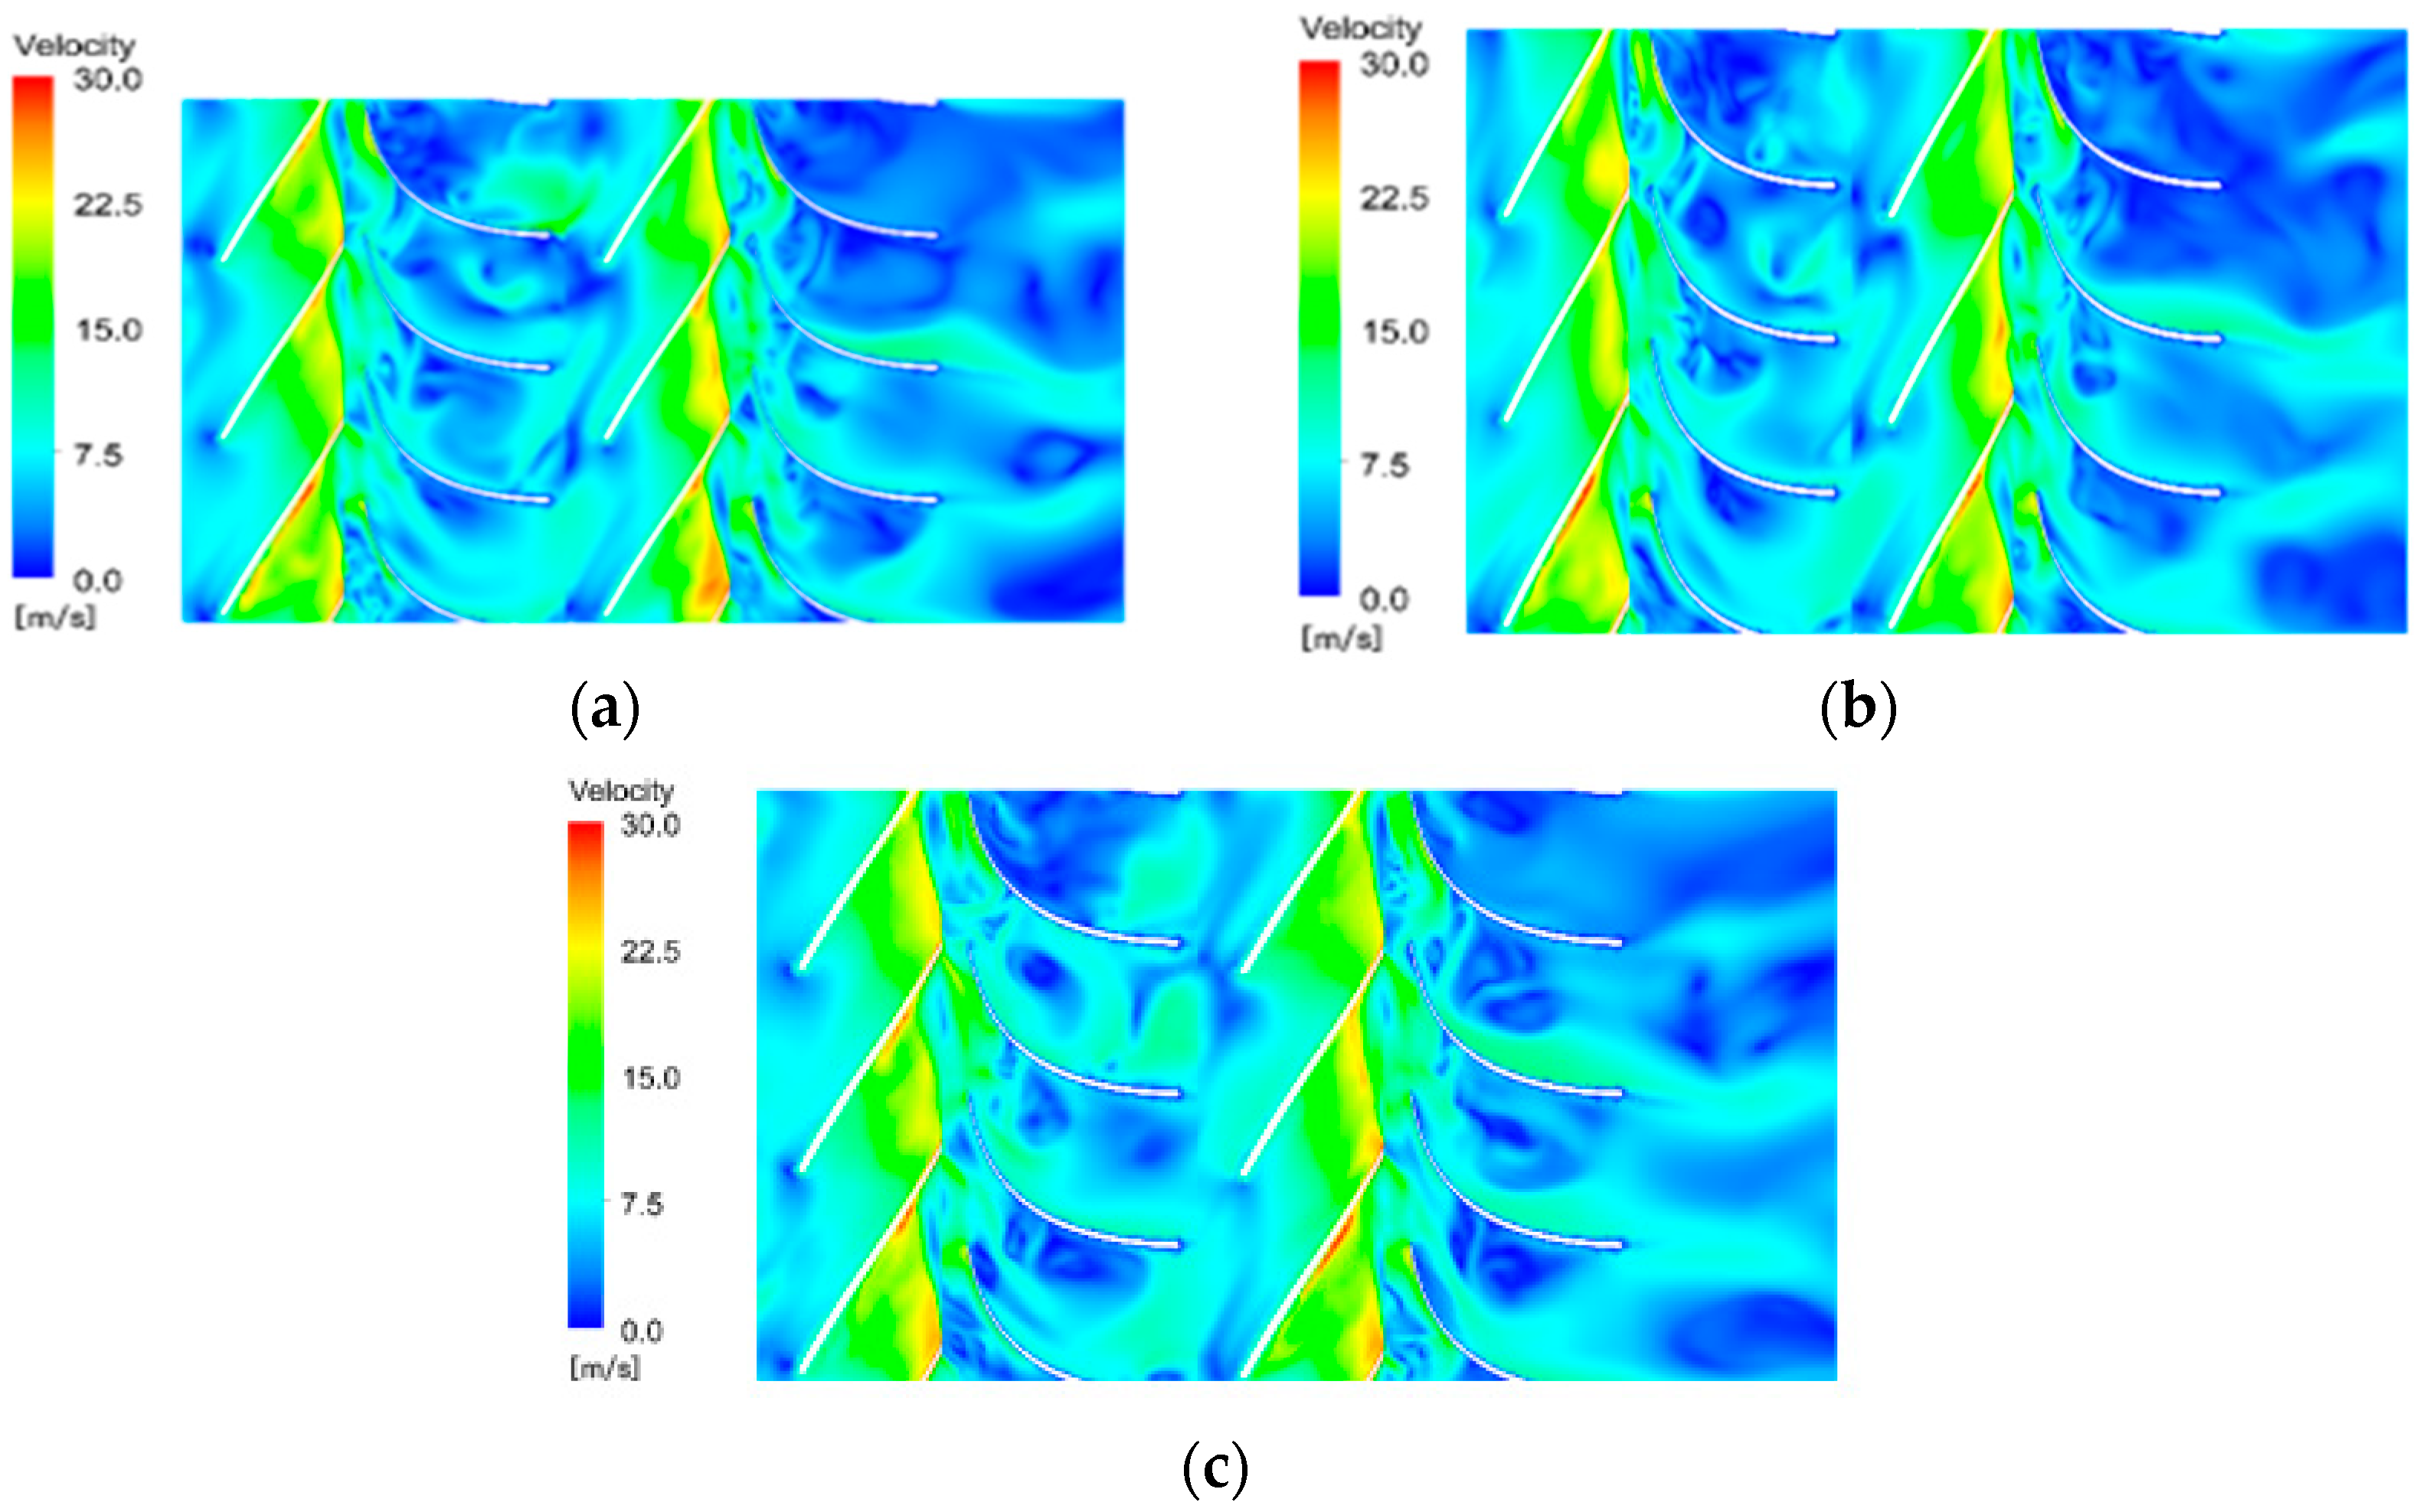
It can be seen from Figure 7 and Figure 8 that when the value of Cv is between 4 and 11.5%, the main flow passage components, including the impellers and guide vanes, are capable of normal energy conversion for the flow transported in the calculation domain. Under the action of the impellers, the fluid pressure gradually increases from the inlet to the outlet of the pump, the fluid velocity also increasing within the impellers. However, as the particle concentration increases, the low-speed zones in the space vane guide expand, suggesting that the increase in the number of particles causes the fluid flow pattern to deteriorate.
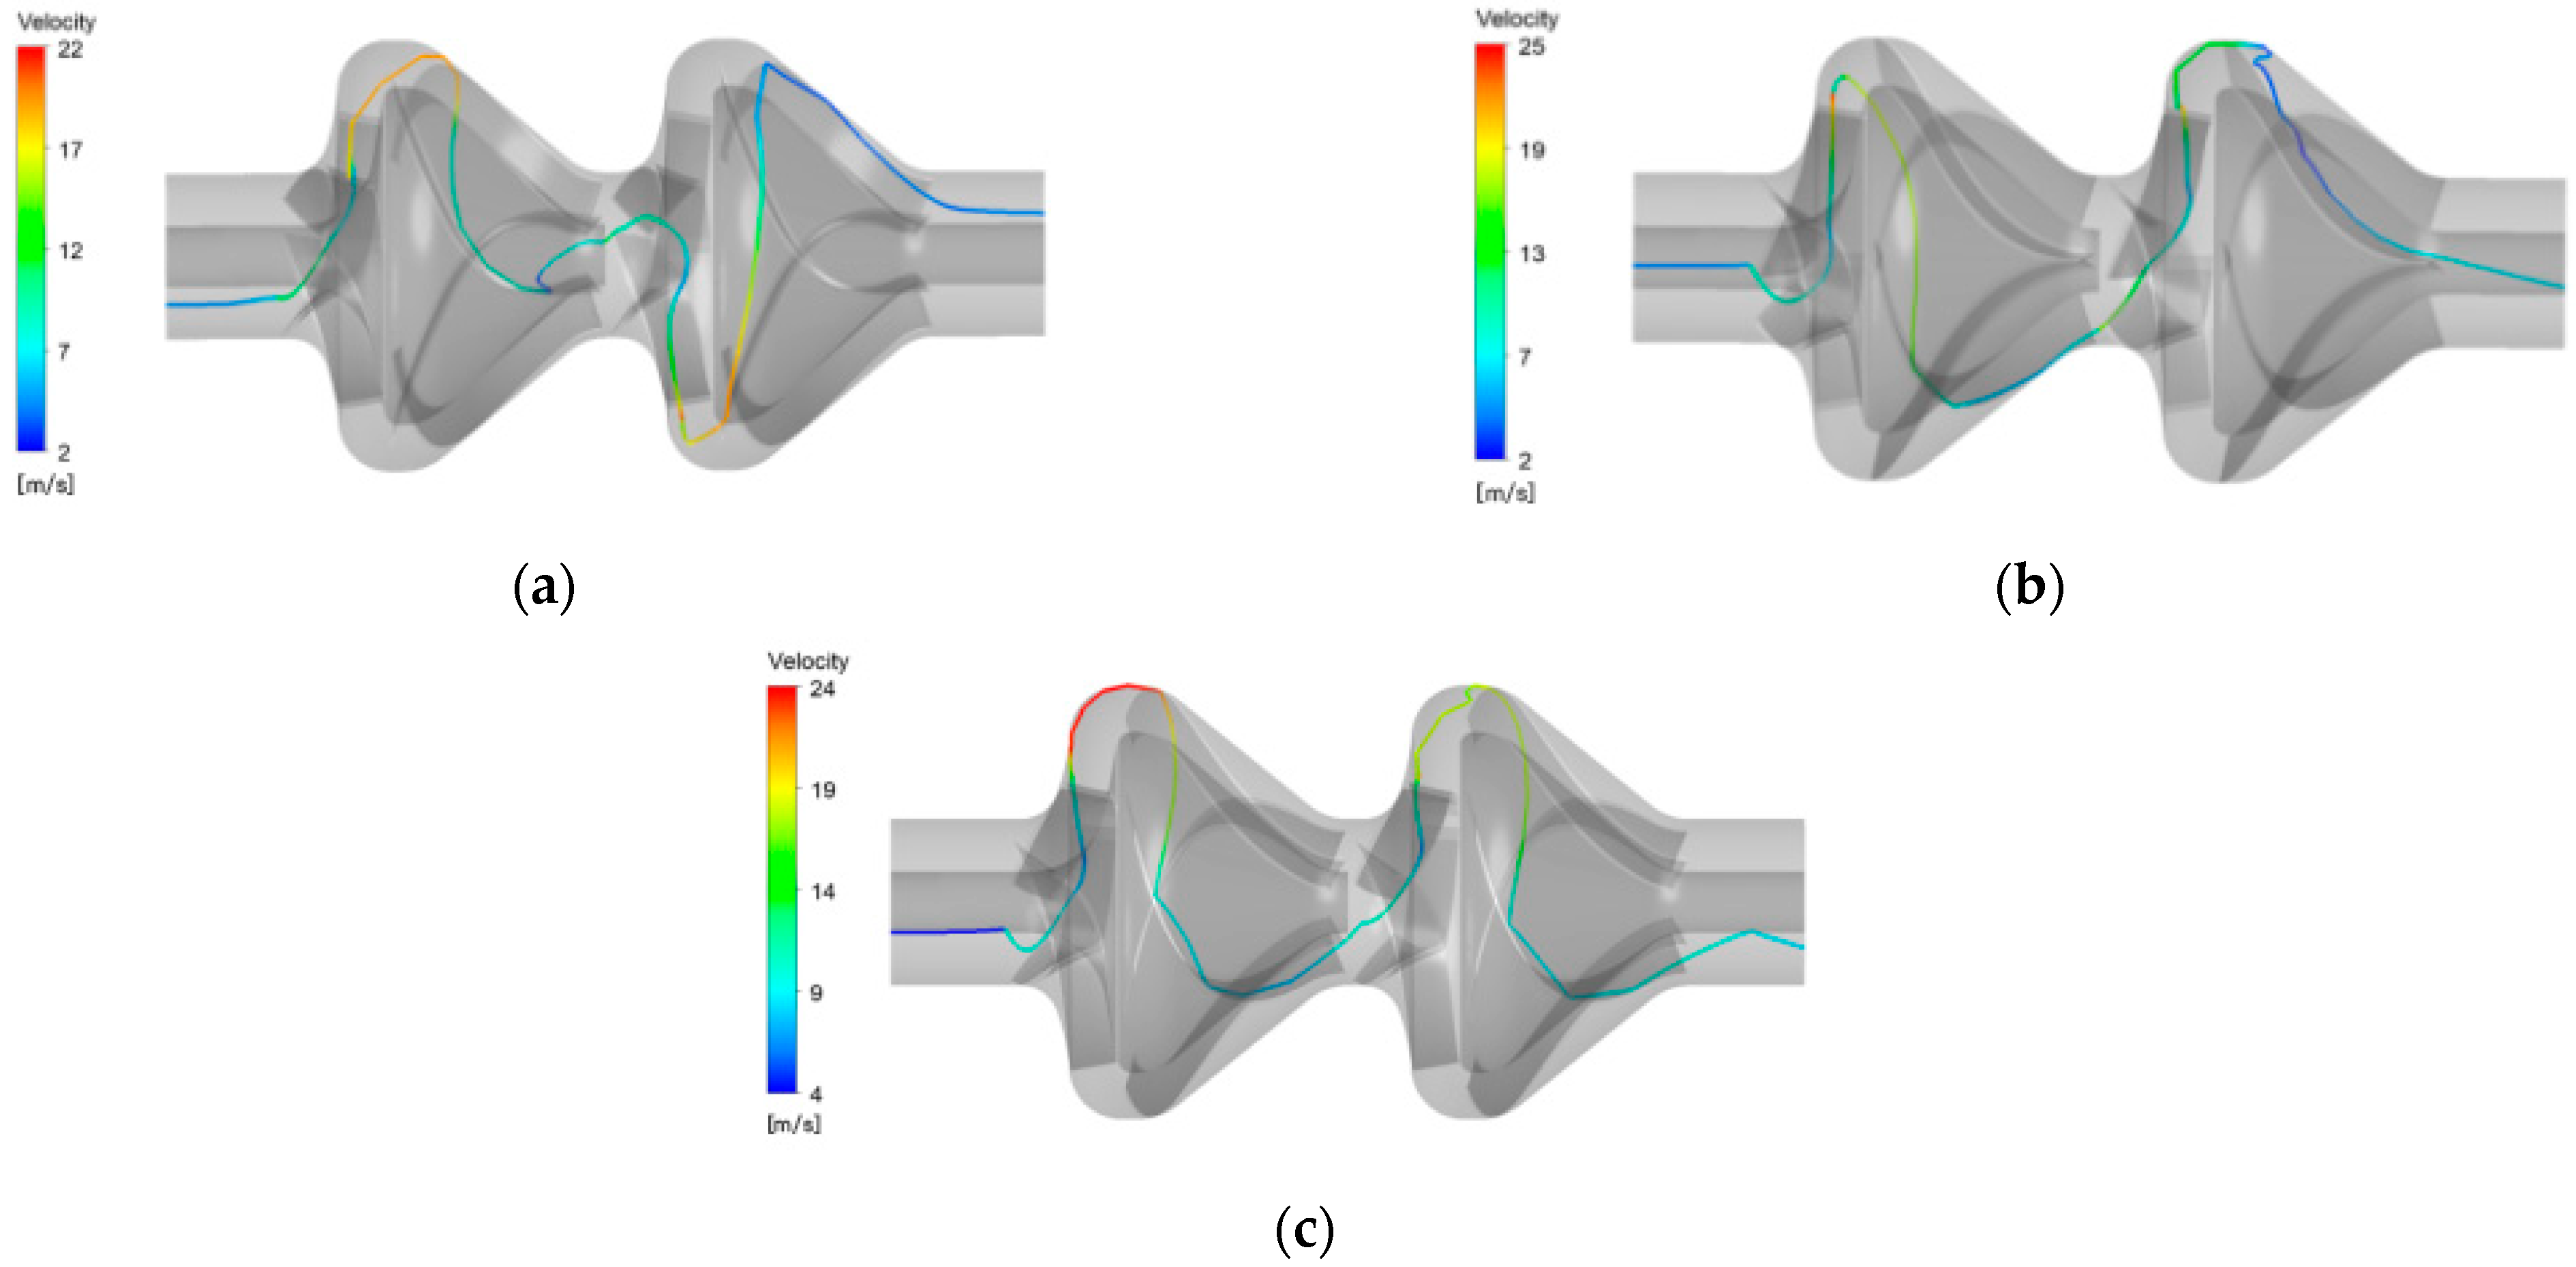
Figure 9 shows the movement trajectories of the particles in the calculation domain with different particle concentrations.
It can be seen from Figure 9 that as the particle concentration increases, the movement trajectories of the particles inside the impellers and the space vane guides become increasingly turbulent. Moreover, the region of turbulent flow also expands in area when compared to the situation when the particle volume concentration is low. In particular, when the particle concentration reaches 11.5%, flow instability can be seen at the inlet section before the impeller inlet. This is because the probability of collision between the particles increases as the particle concentration increases, causing more significant blockage to the fluid flow, which has a negative impact on the fluid flow pattern.
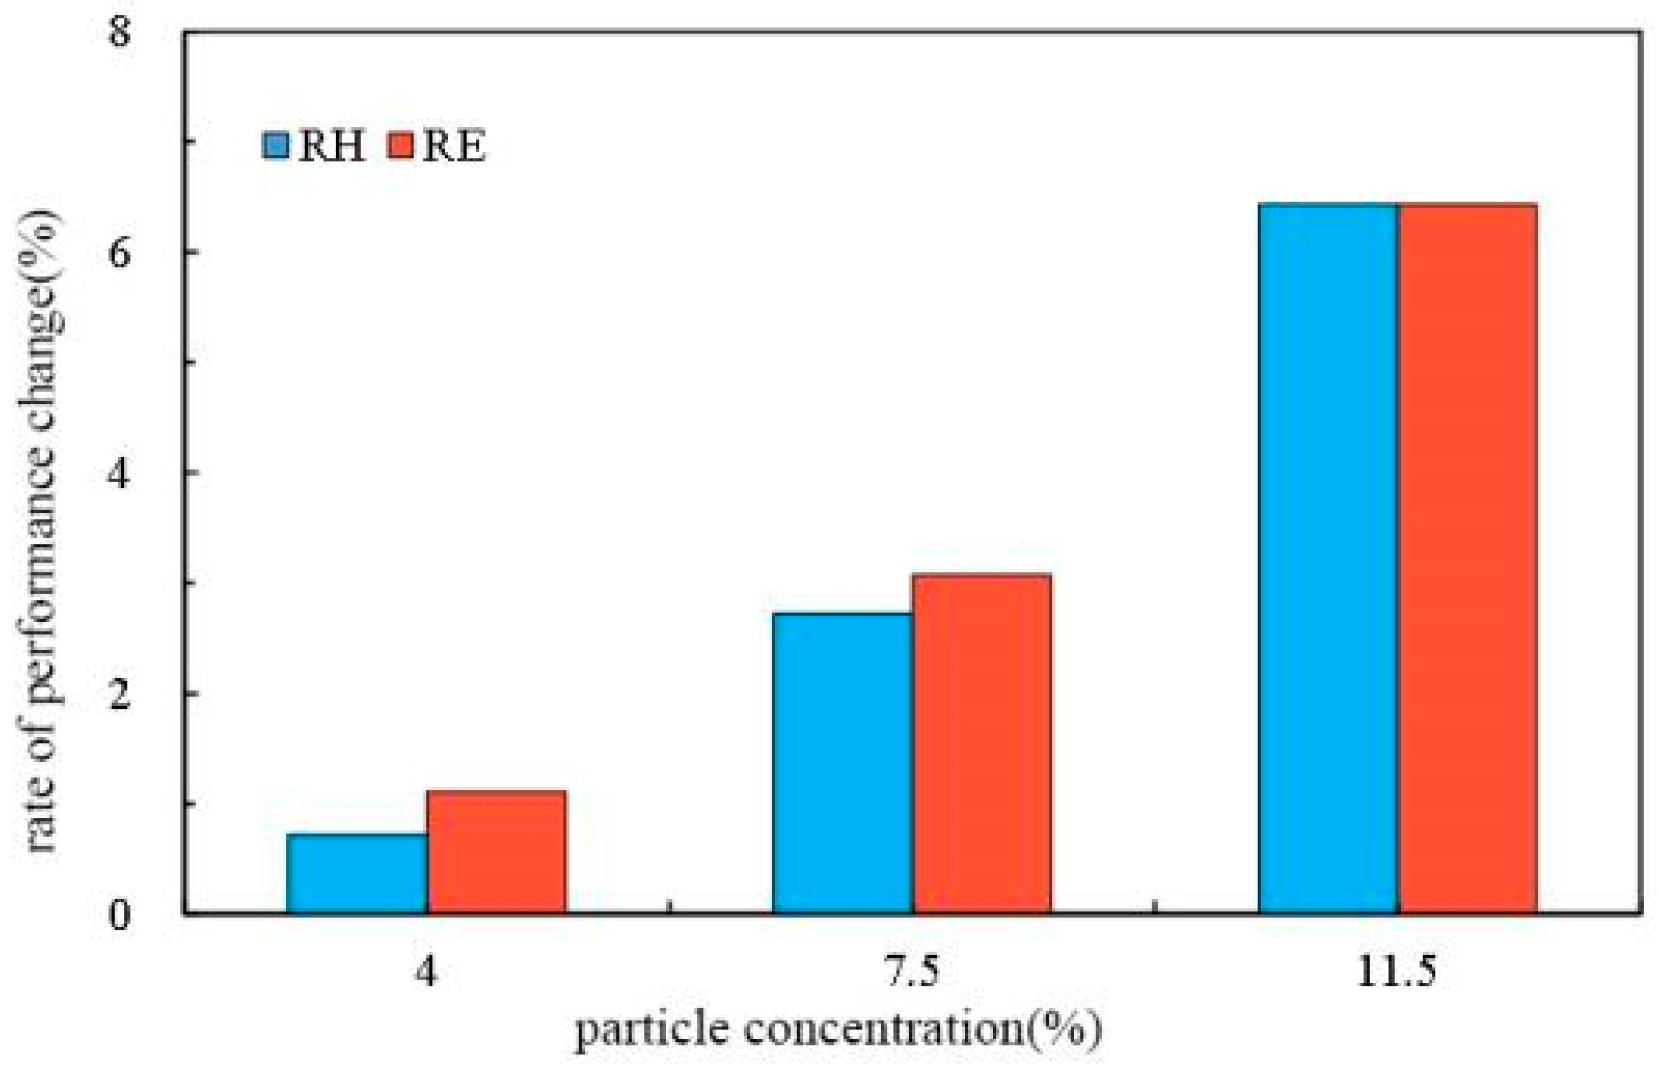
Figure 10 shows the influence of different particle concentrations on pump performance. It can be seen from Figure 11 that as the particle concentration increases, the values of both RH and RE increase, indicating that the particle concentration is negatively correlated to the pump performance and that an increasing proportion of particles in the liquid-phase have a negative impact on the transportation performance of the pump. This is because the volume occupied by the particles increases as the particle concentration increases, causing the particle movement to become more turbulent. At the same time, the probability of collision between particles, as well as between particles and flow passage components, also increases, leading to a significant reduction in pump performance.

3.2.3. Different Particle Densities

To study the influence of particle density, the pump was set to have a rotational speed of 1450 rpm and a flow rate of 420 m3/h, while the particles transported had a particle size of 6 mm, a particle concentration of 7.5%, and particle densities of 1400, 1900, and 2800 kg/m3, respectively.
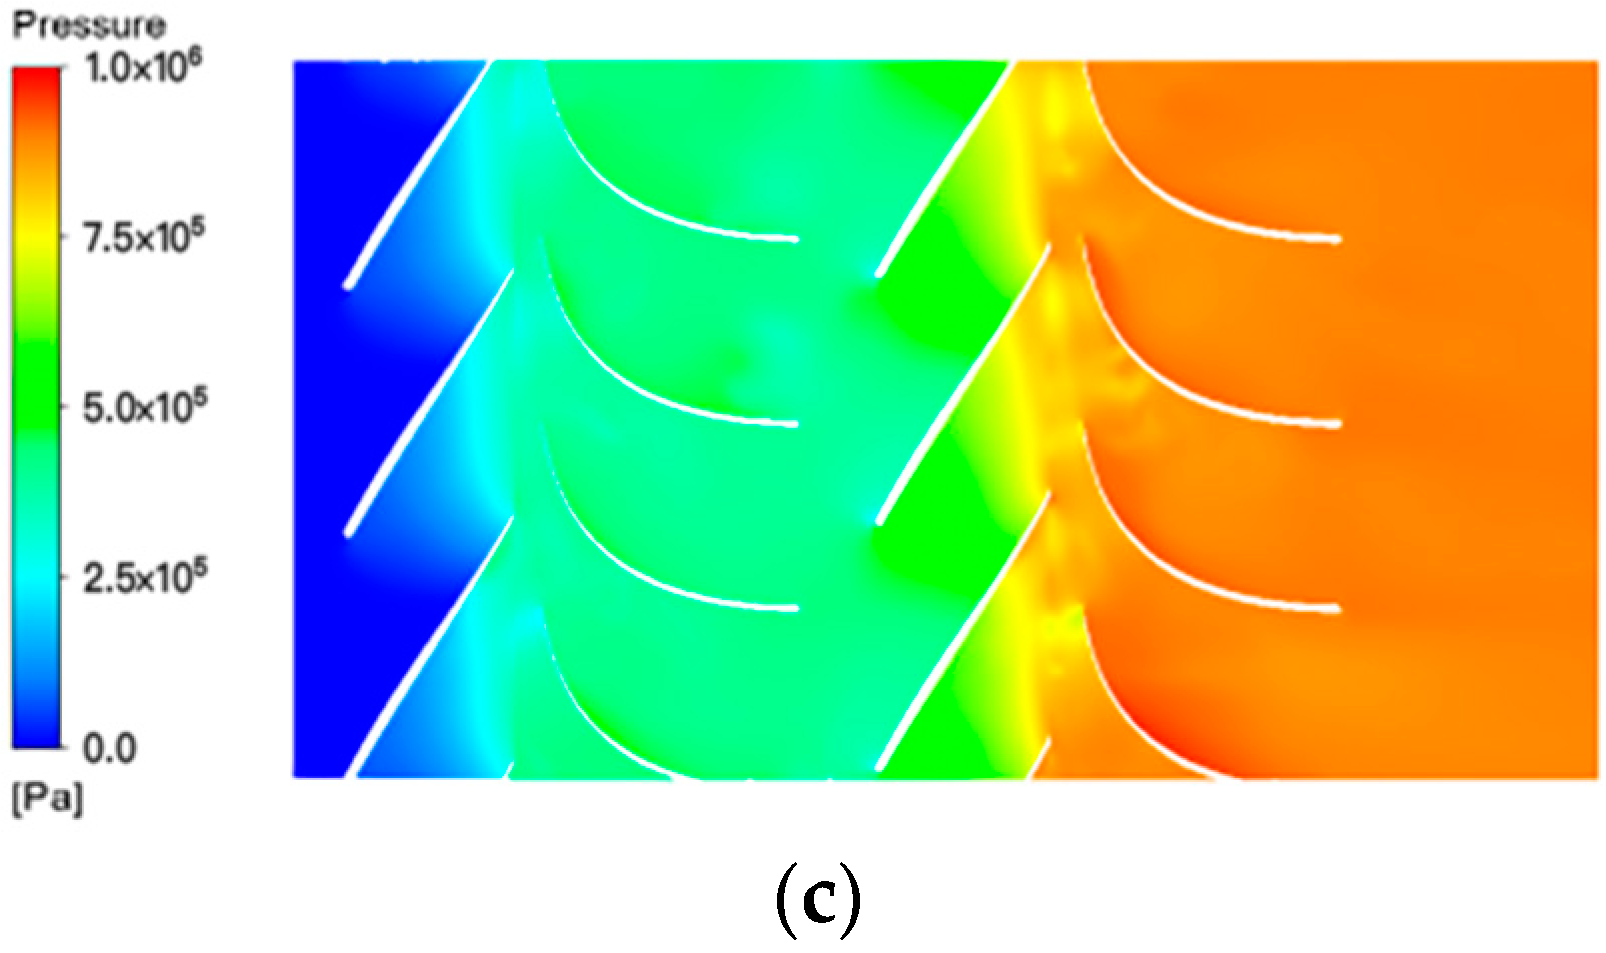
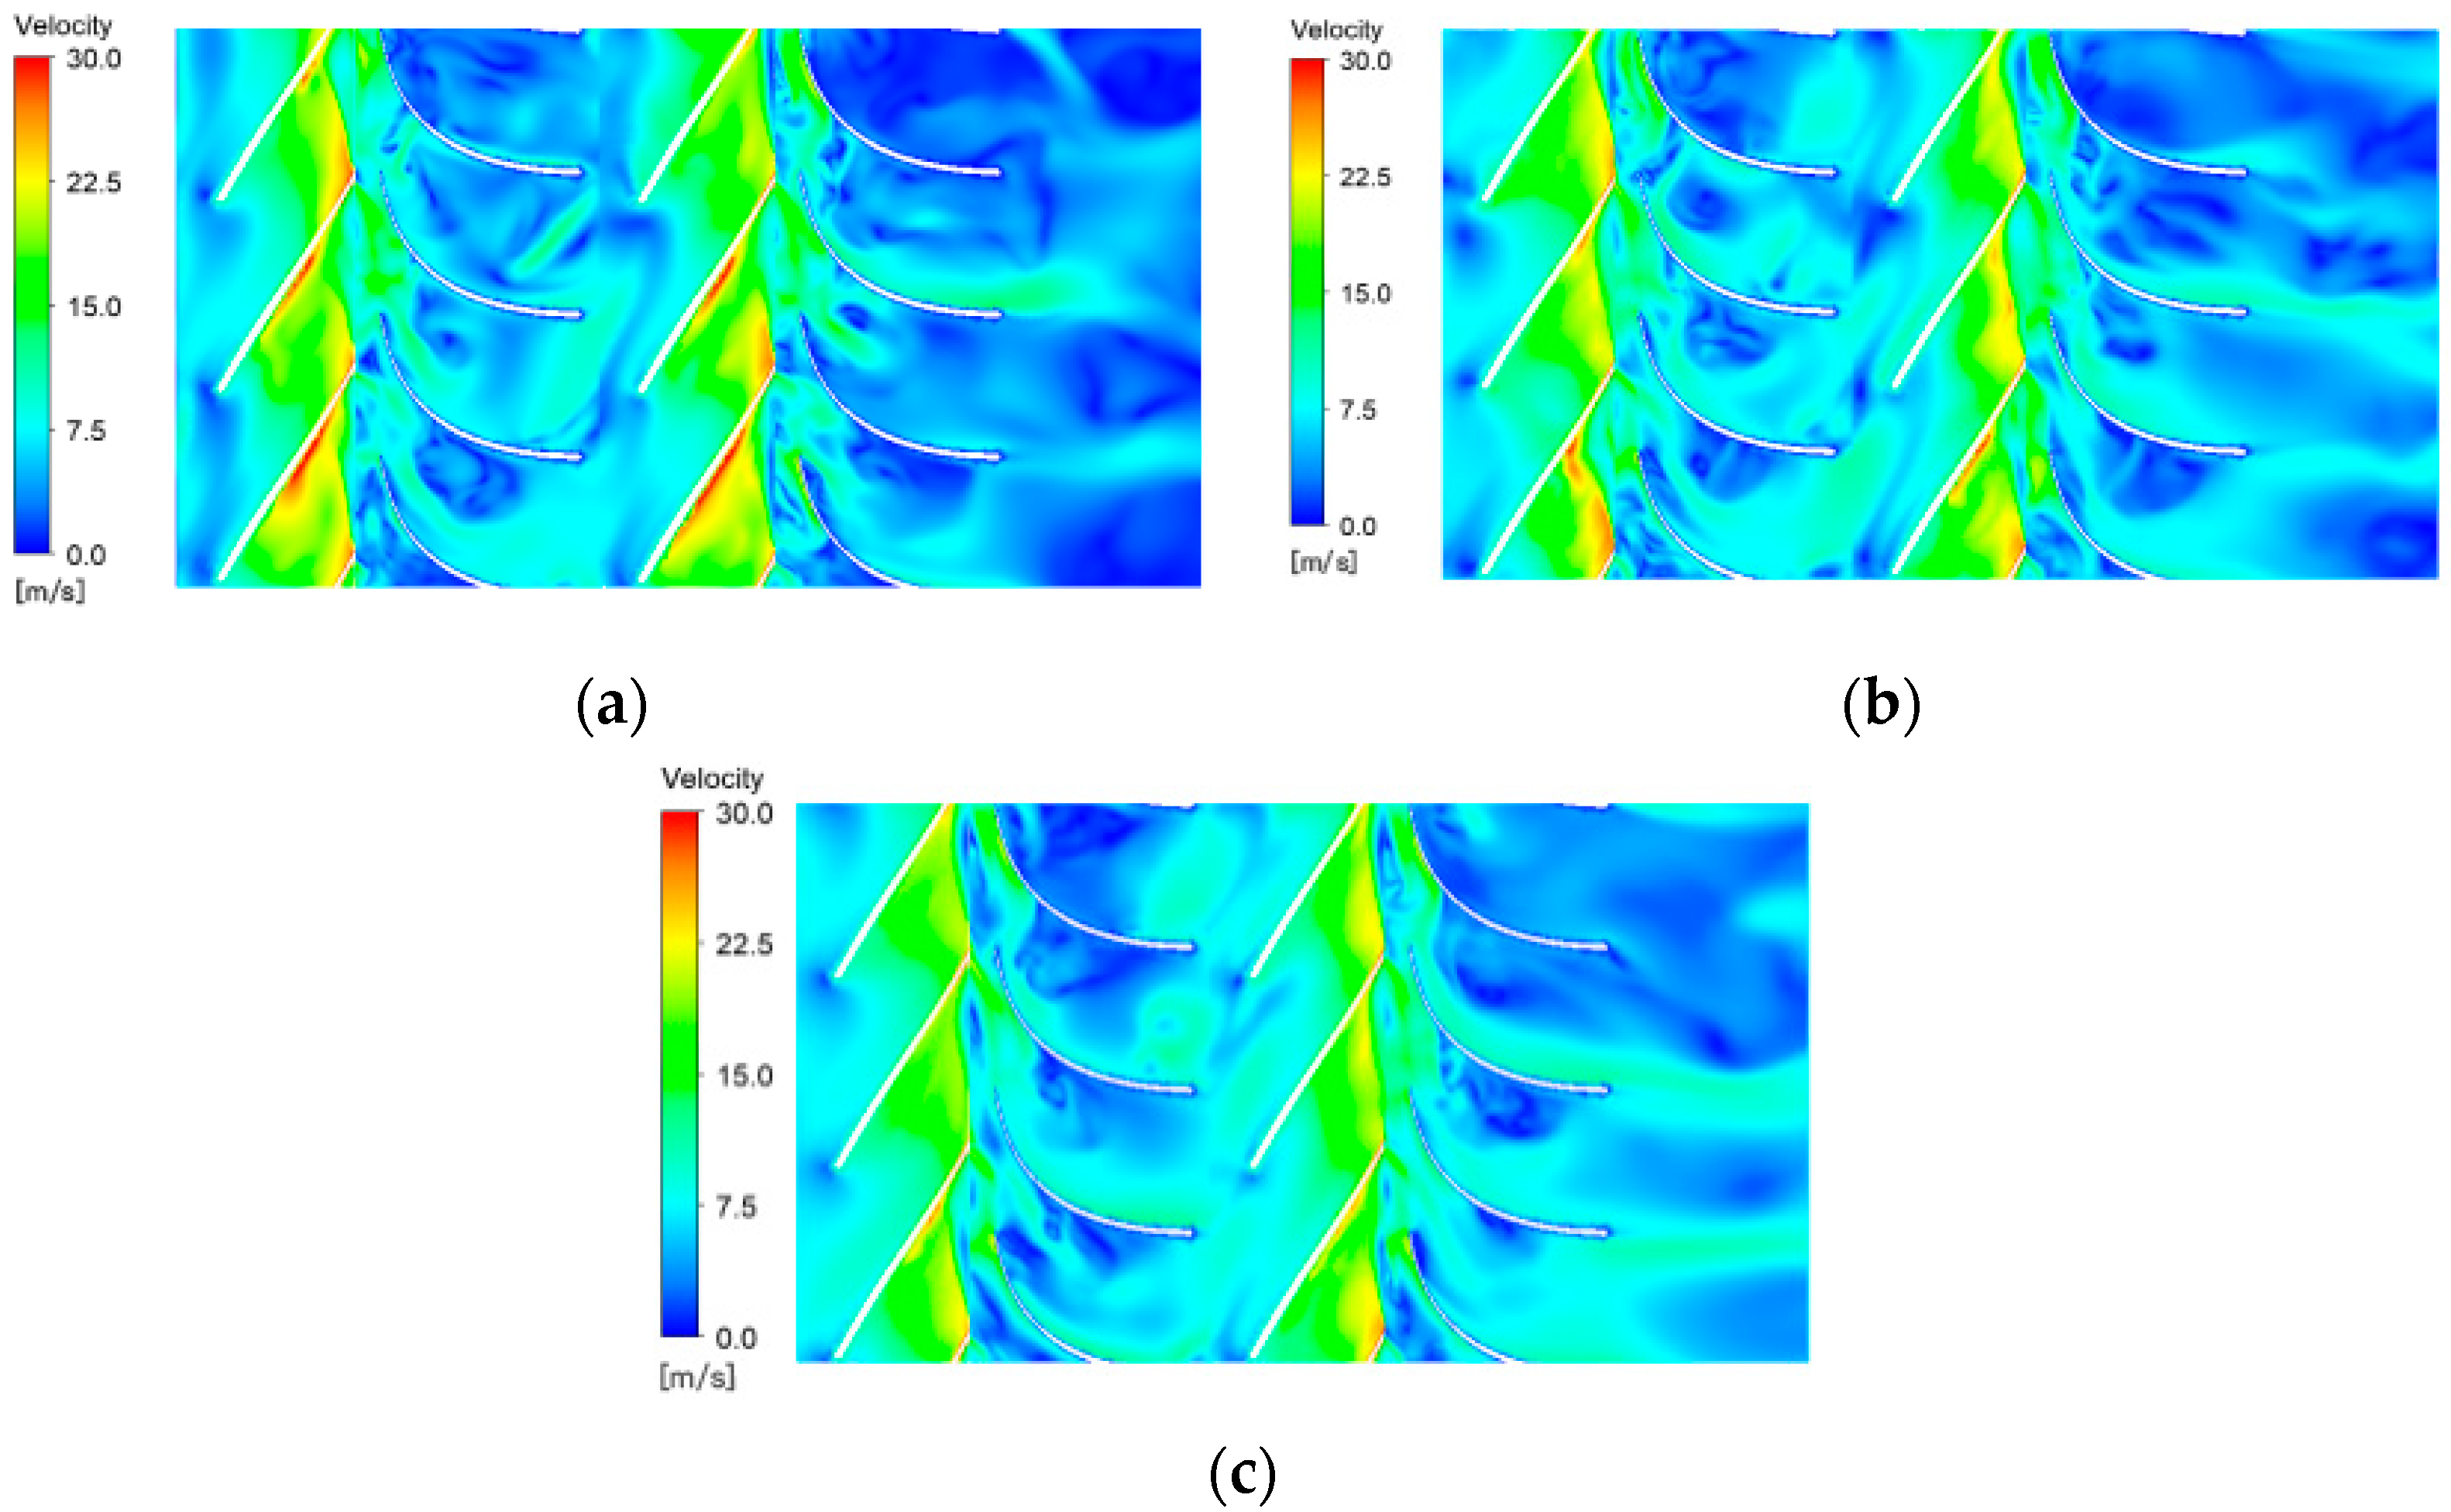
It can be seen from Figure 11 and Figure 12 that with the same particle concentration, the changes in particle density have relatively little impact on the pressure and velocity in the calculation domain, having no significant influence on the work generated by the impellers and the vane guides.
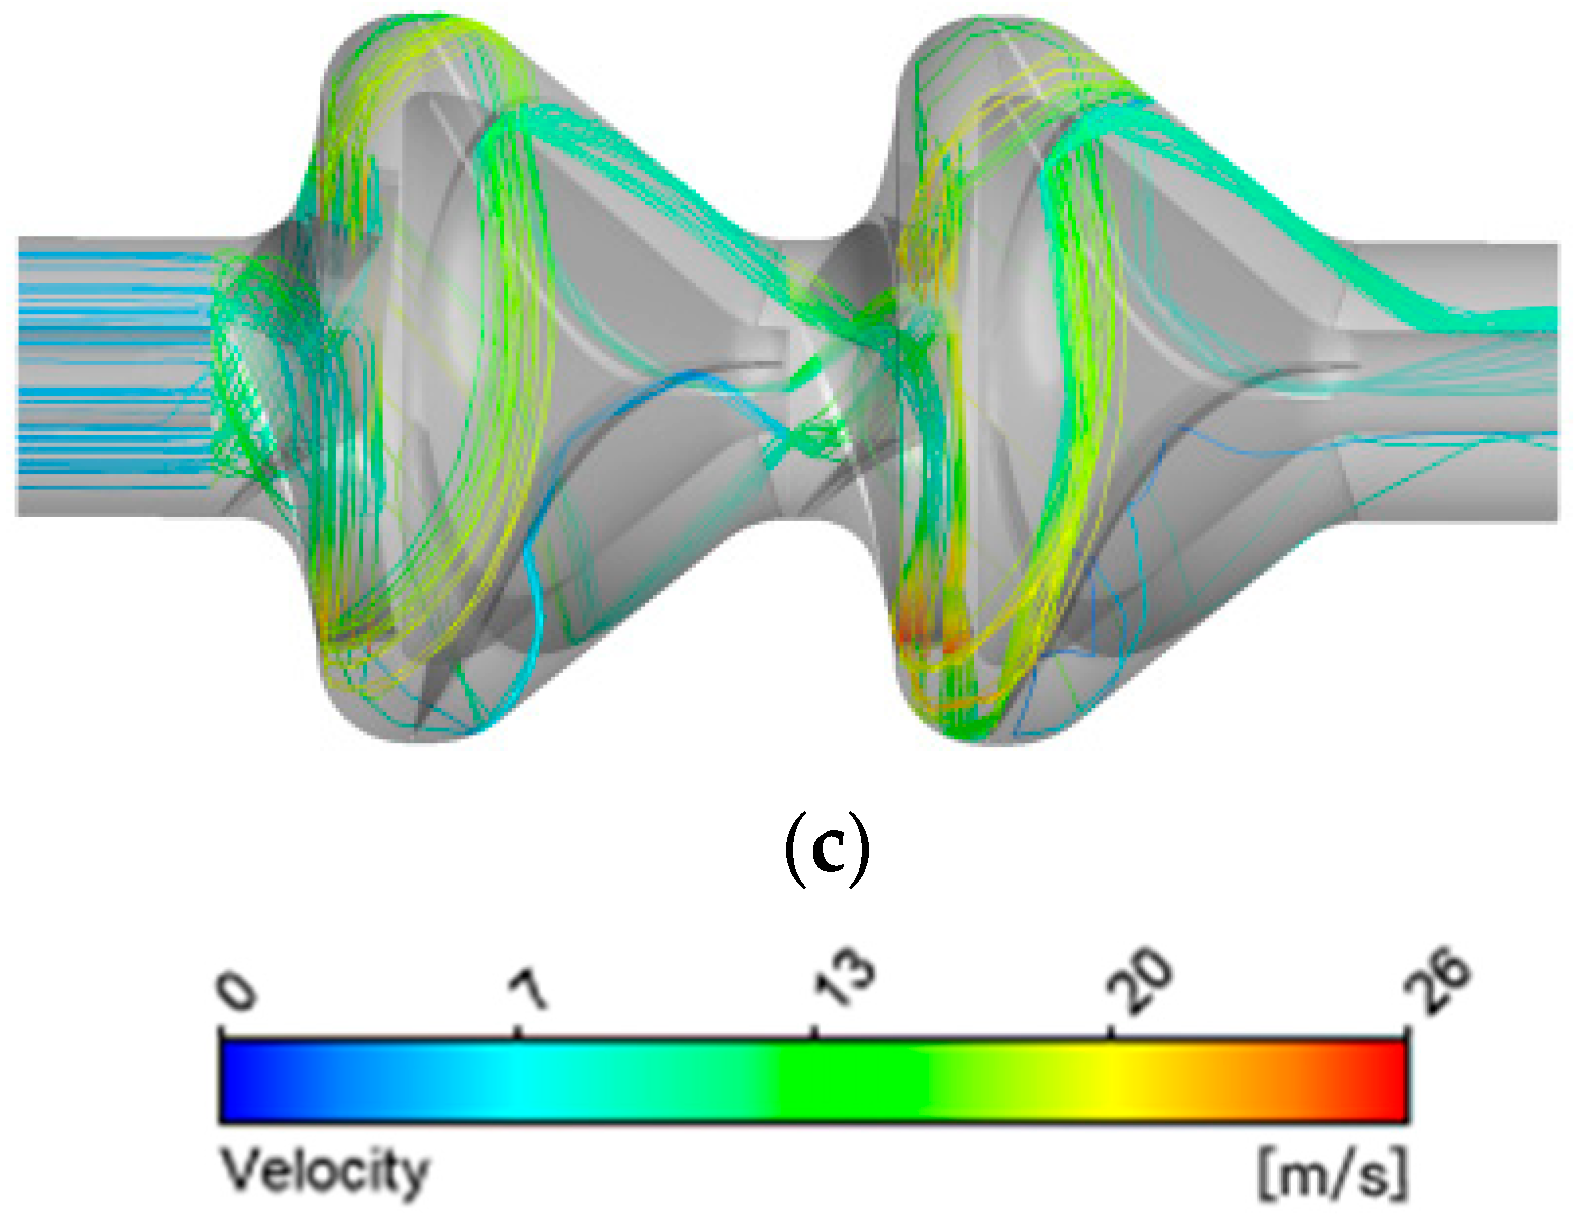
Figure 13 shows the movement trajectories of three solid-phase particles of different densities in the calculation domain.
It can be seen from Figure 13 that owing to the rotation of the first-stage and second-stage impellers, the solid-phase particles are accelerated twice within the calculation domain, reaching a maximum velocity at the outlet of the respective impeller. The three particles of different densities show different trajectory lengths in the flow passage. The particle of density 1400 kg/m3 has the longest movement trajectory in the flow passage, followed by the particle of density 1900 kg/m3, and finally the particle of density 2800 kg/m3. Moreover, the respective collisions between the three particles and the space vane guide hub in the outlet section of the pump indicate that the densest particle has the largest angle of collision. Moreover, it also has the largest elastic recovery coefficient after collision with the flow passage component surface, thus the smallest flow loss owing to the collision. Additionally, the densest particle travels the longest radial distance after being energized by the first-stage impeller before being ejected from the impeller outlet owing to inertia and subsequently collides with the flow passage components in the impeller-vane guide transition section many times.
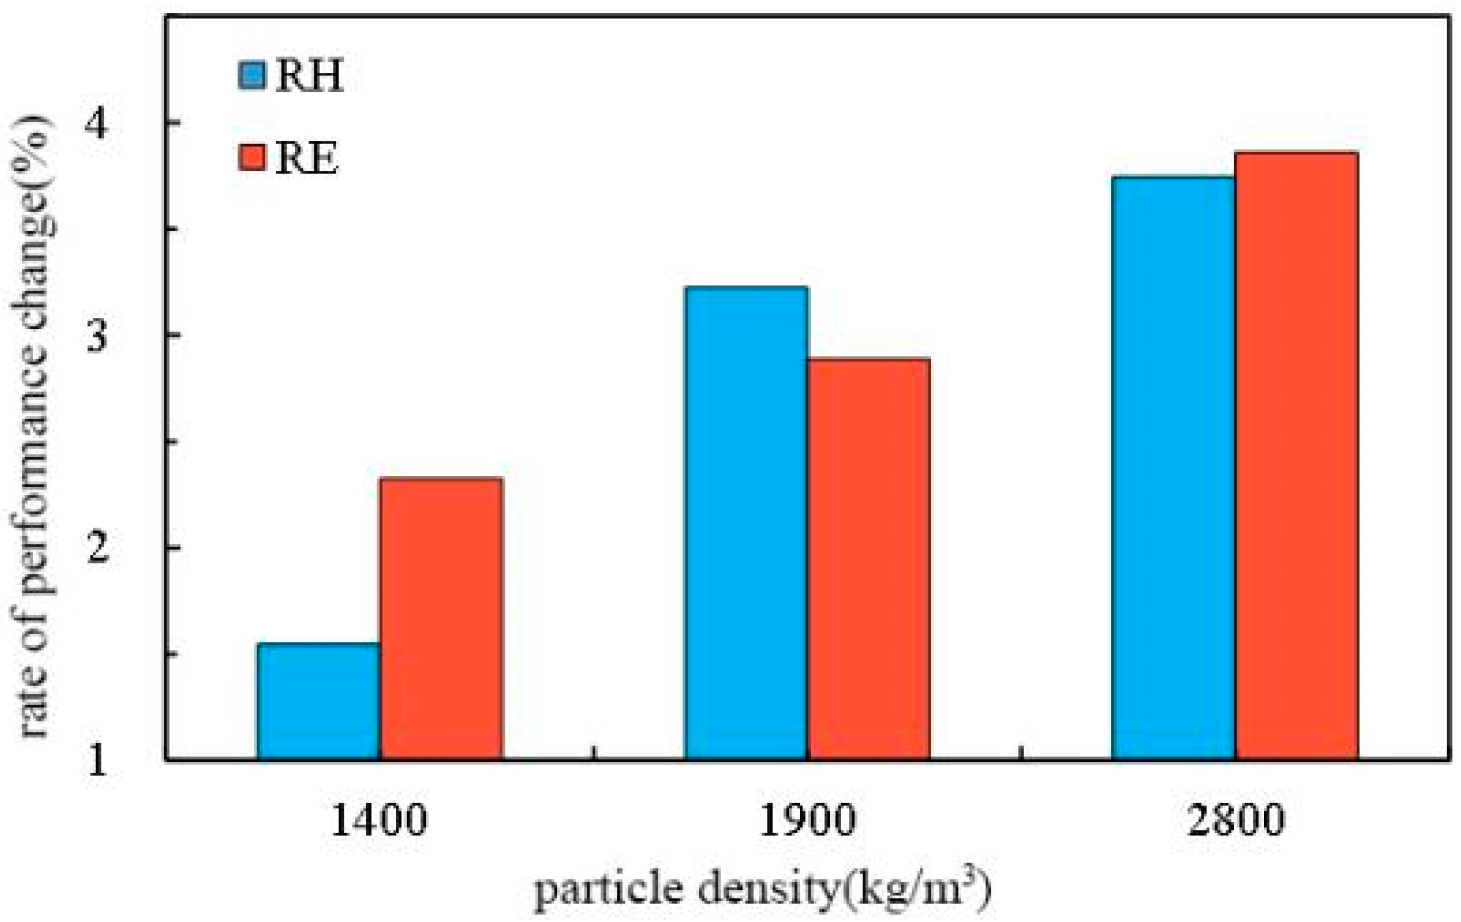
Figure 14 shows the changes in RH and RE, which represent the pump performance changes with different solid-phase particle densities.
It can be seen from Figure 14 that the particle density is positively correlated with the reduction in pump performance. With the same solid-phase particle concentration, an increase in particle density affects both the pump head and transportation efficiency. However, this influence is relatively small when compared to that of the particle size and particle concentration.

3.3. Influences of Different Operating Conditions

3.3.1. Different Flow Rates

Flow rates of 0.68 Qd, 1.0 Qd, and 1.33 Qd were used, respectively. The particle concentration was set to 7.5%, the pump rotational speed to 1450 rpm, and the particle size to 6 mm.
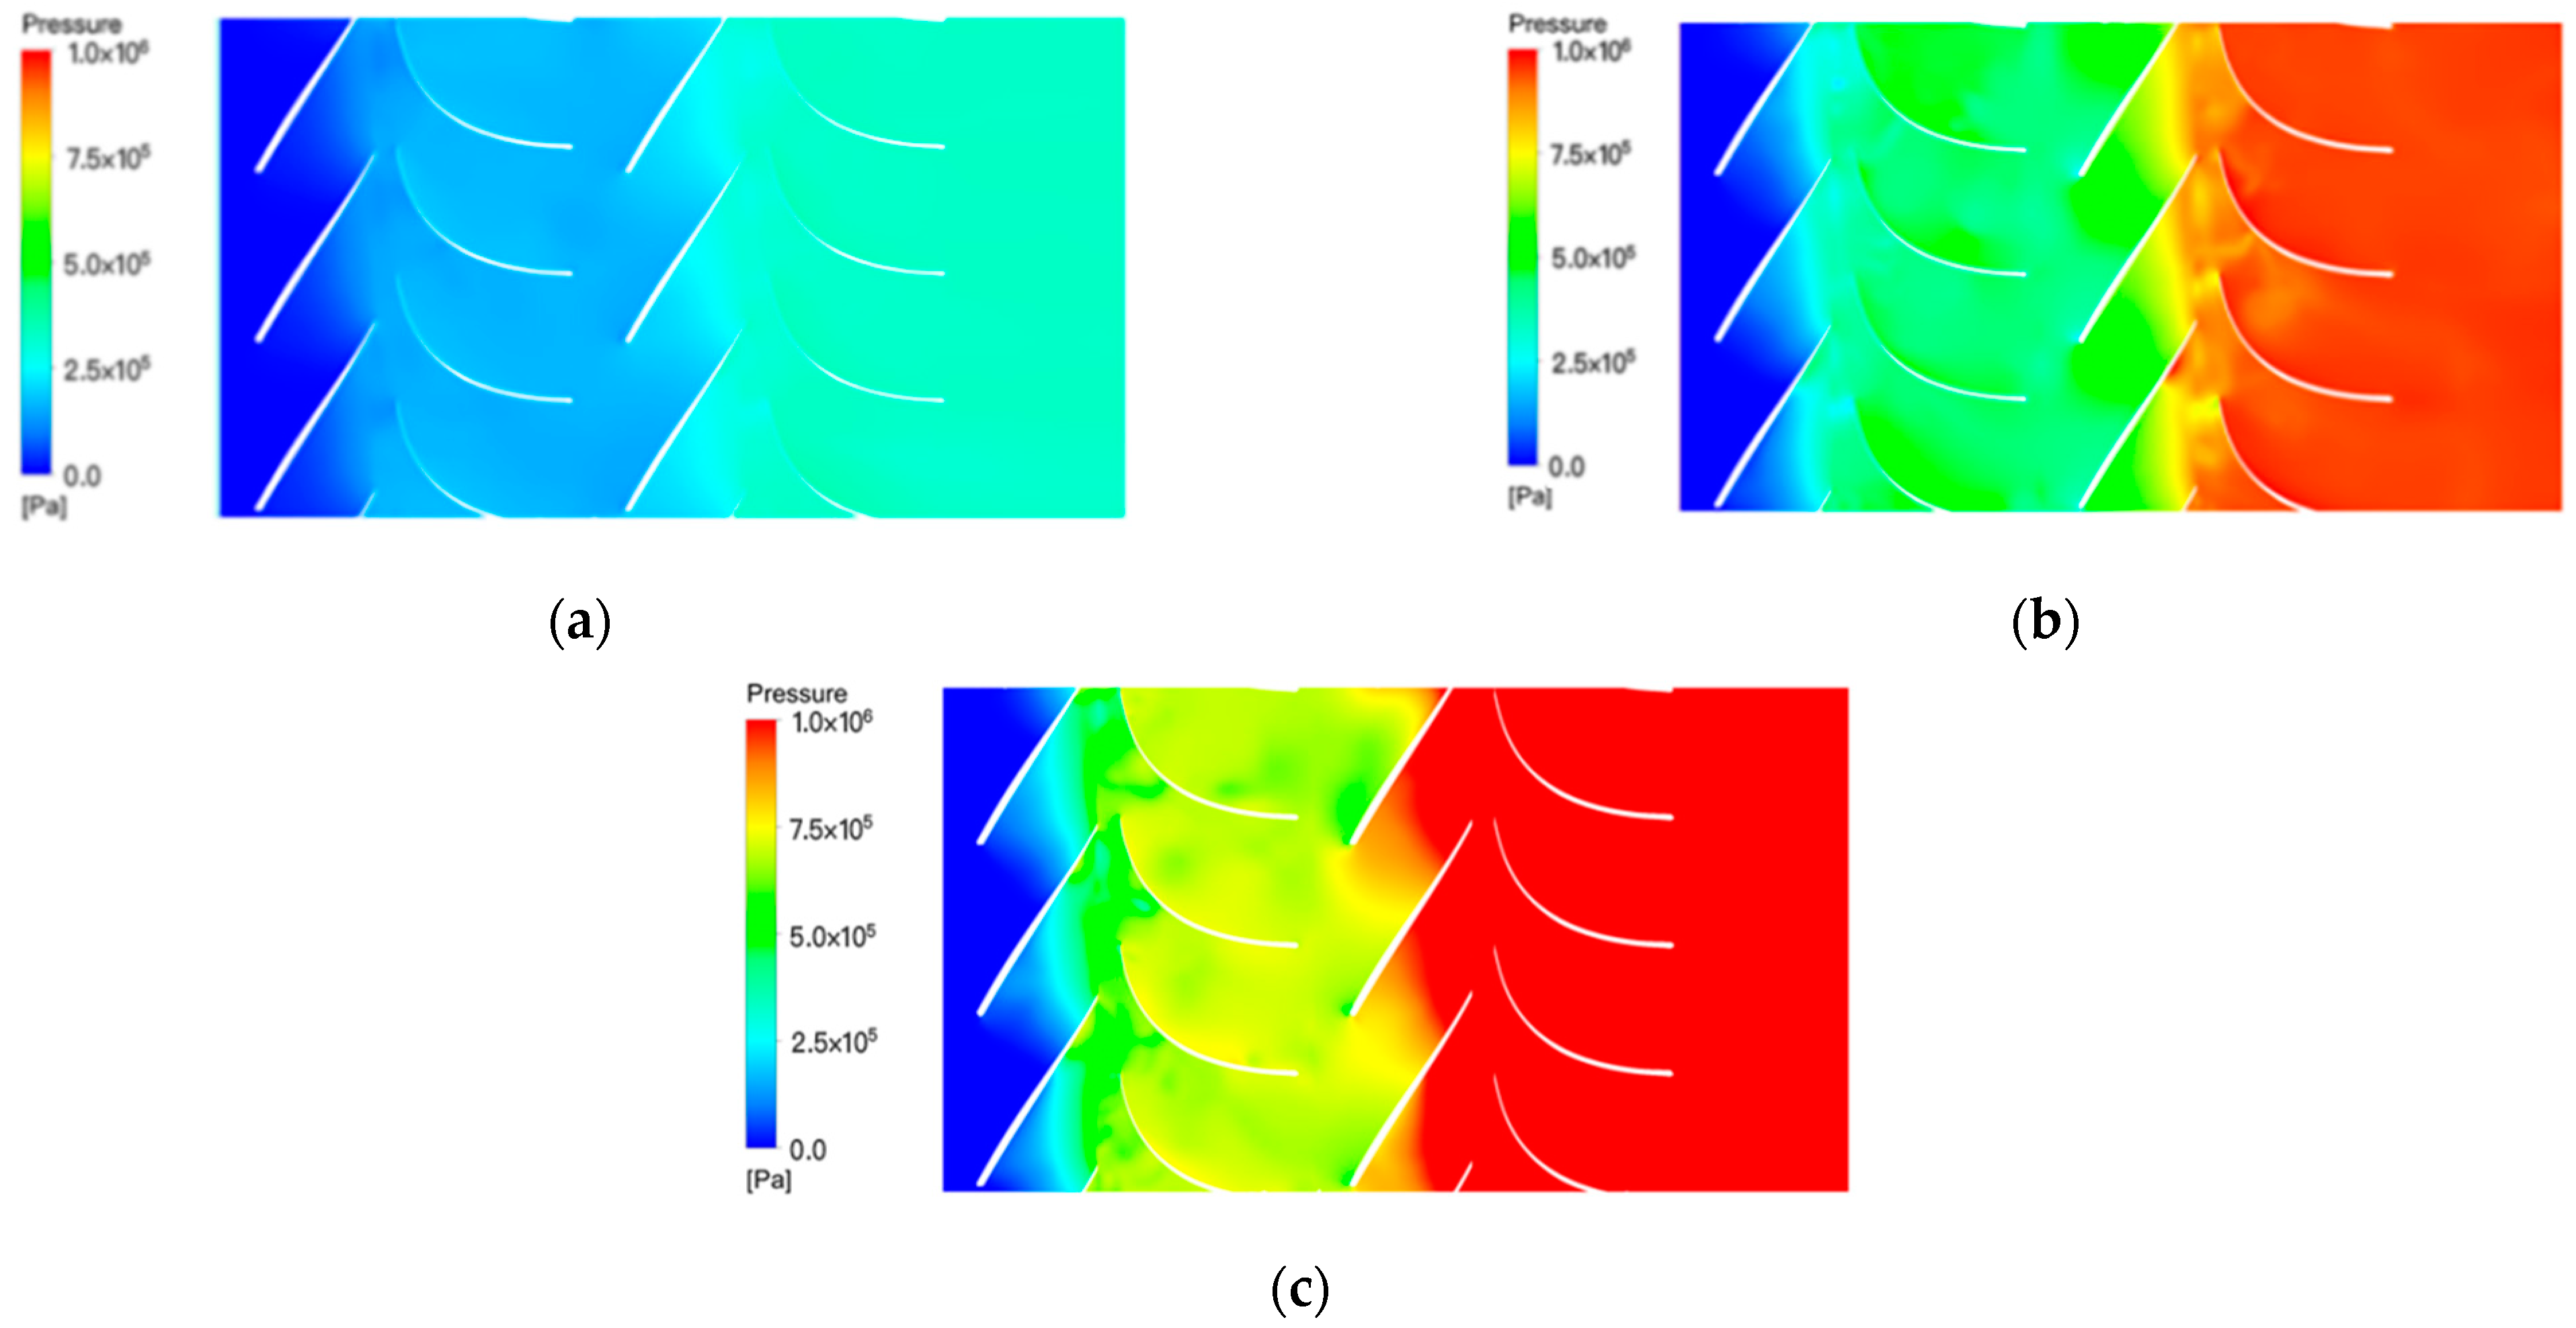
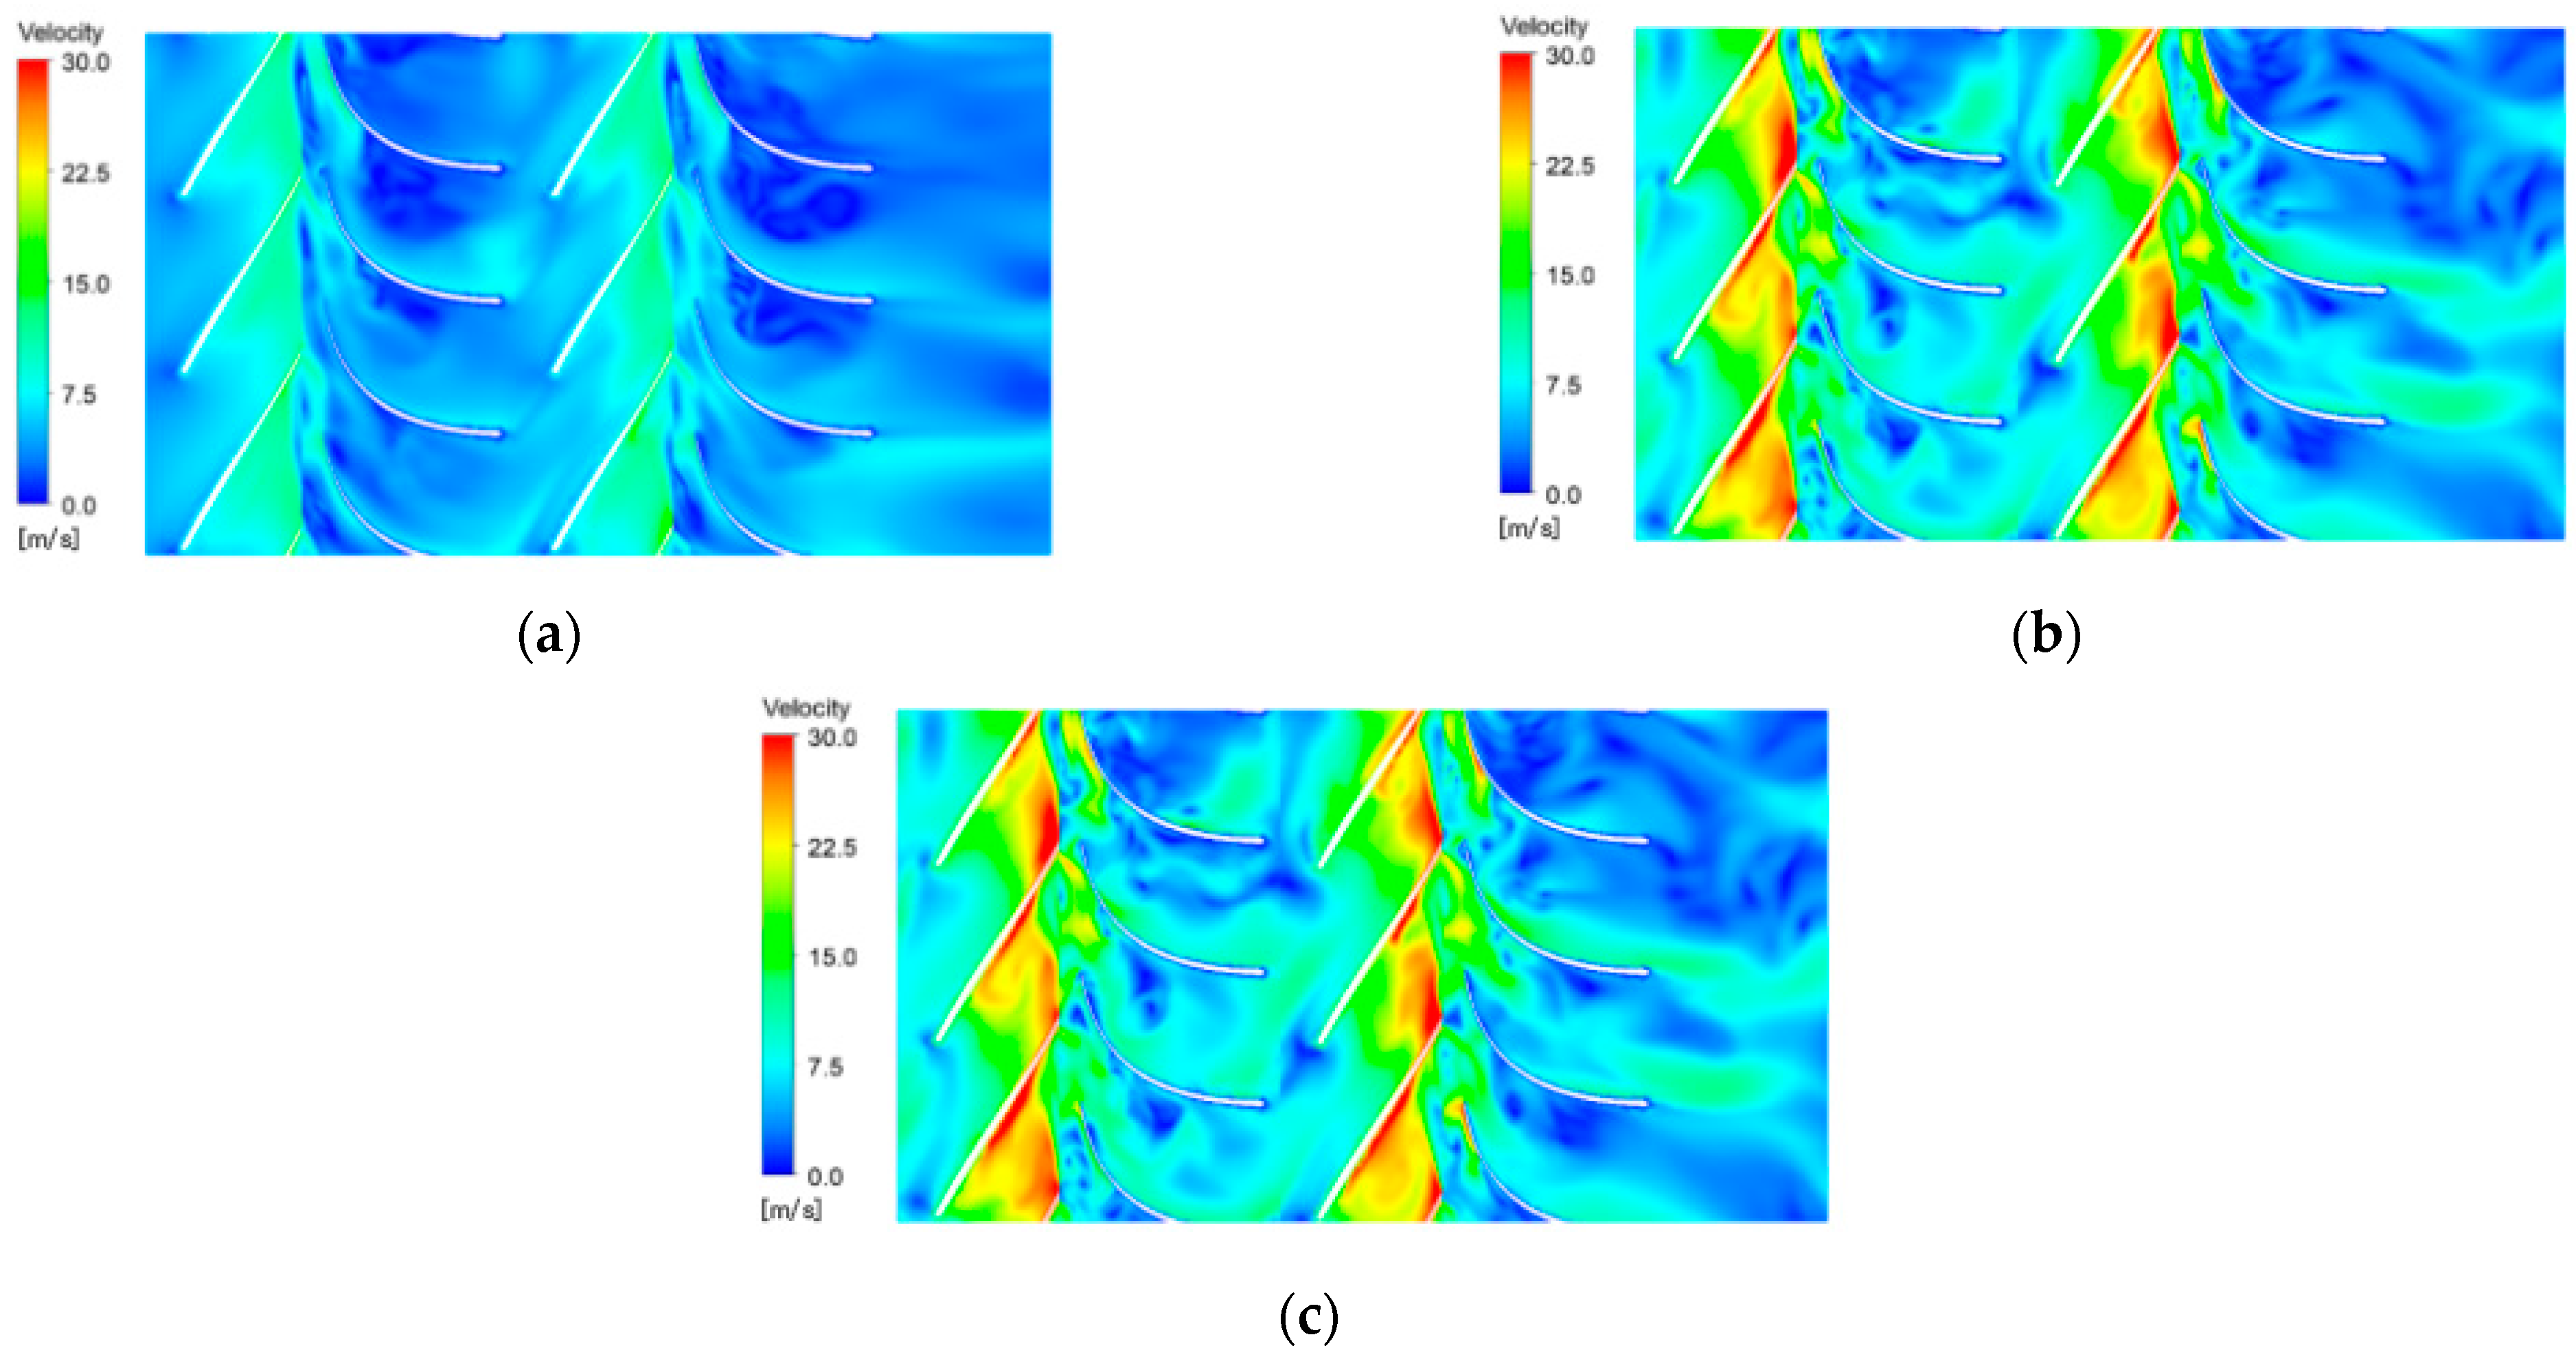
Figure 15 and Figure 16 show the pressure and velocity distributions on the impeller-guide vane B2B view, respectively.
It can be seen from Figure 15 and Figure 16 that the two impellers increase the energy of the fluid medium to different degrees for the various flow rates. For both pressure and velocity, the physical quantity in the B2B view with a small flow rate changes more turbulently, affecting the pump performance to a certain extent.
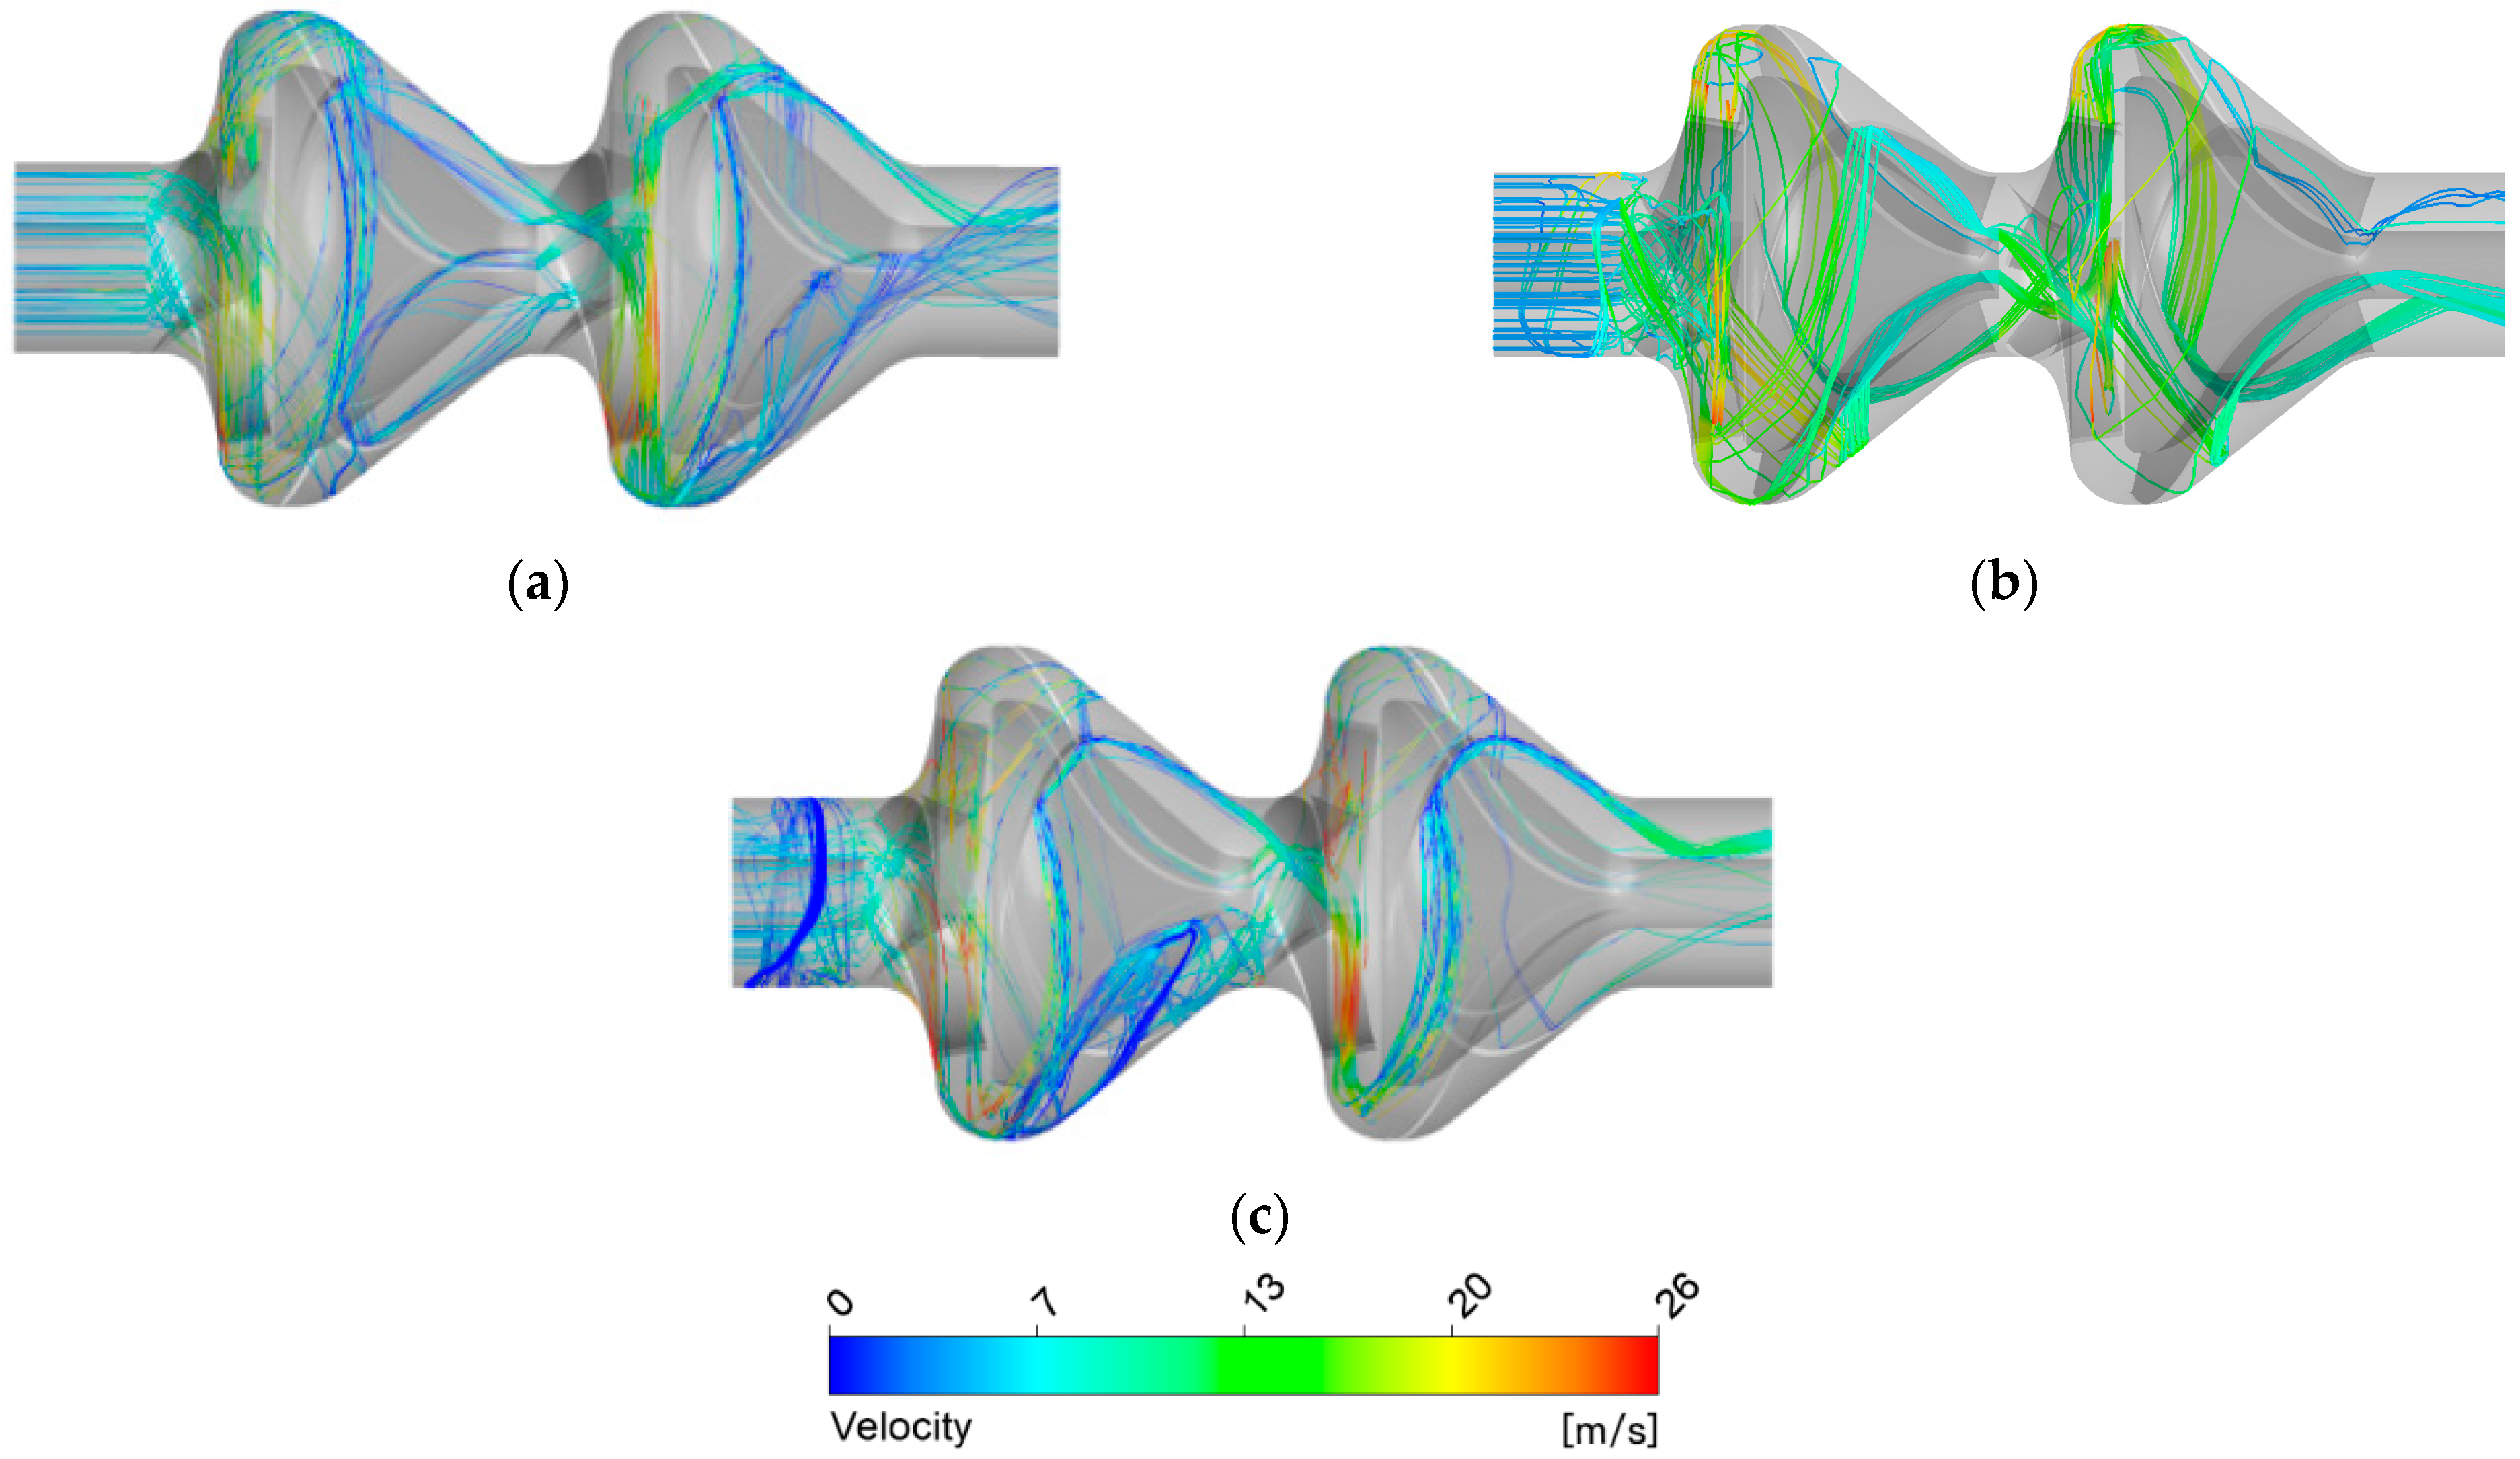
Figure 17 shows the solid-phase particle movement trajectories in the calculation domain with the three flow rates.
It can be seen from Figure 17 that, similar to the particle movement trajectories with other inlet boundary conditions, the solid-phase particles are accelerated twice within the calculation domain of the impellers with the different flow rates, the velocities of which are reduced after they enter the space guide vanes. However, with the small flow rate of 0.68 Qd, the particle movement trajectories in the calculation domain are obviously more turbulent than those with the design or large flow rates, indicating flow instability. Since the inlet flow rate is less than the design flow rate, both the fluid and the particles enter the flow field with a relatively low velocity, the relatively large rotational speed of the impellers causing the formation of a large preswirl that worsens the structure of the flow field and increases the flow loss at the pump inlet.
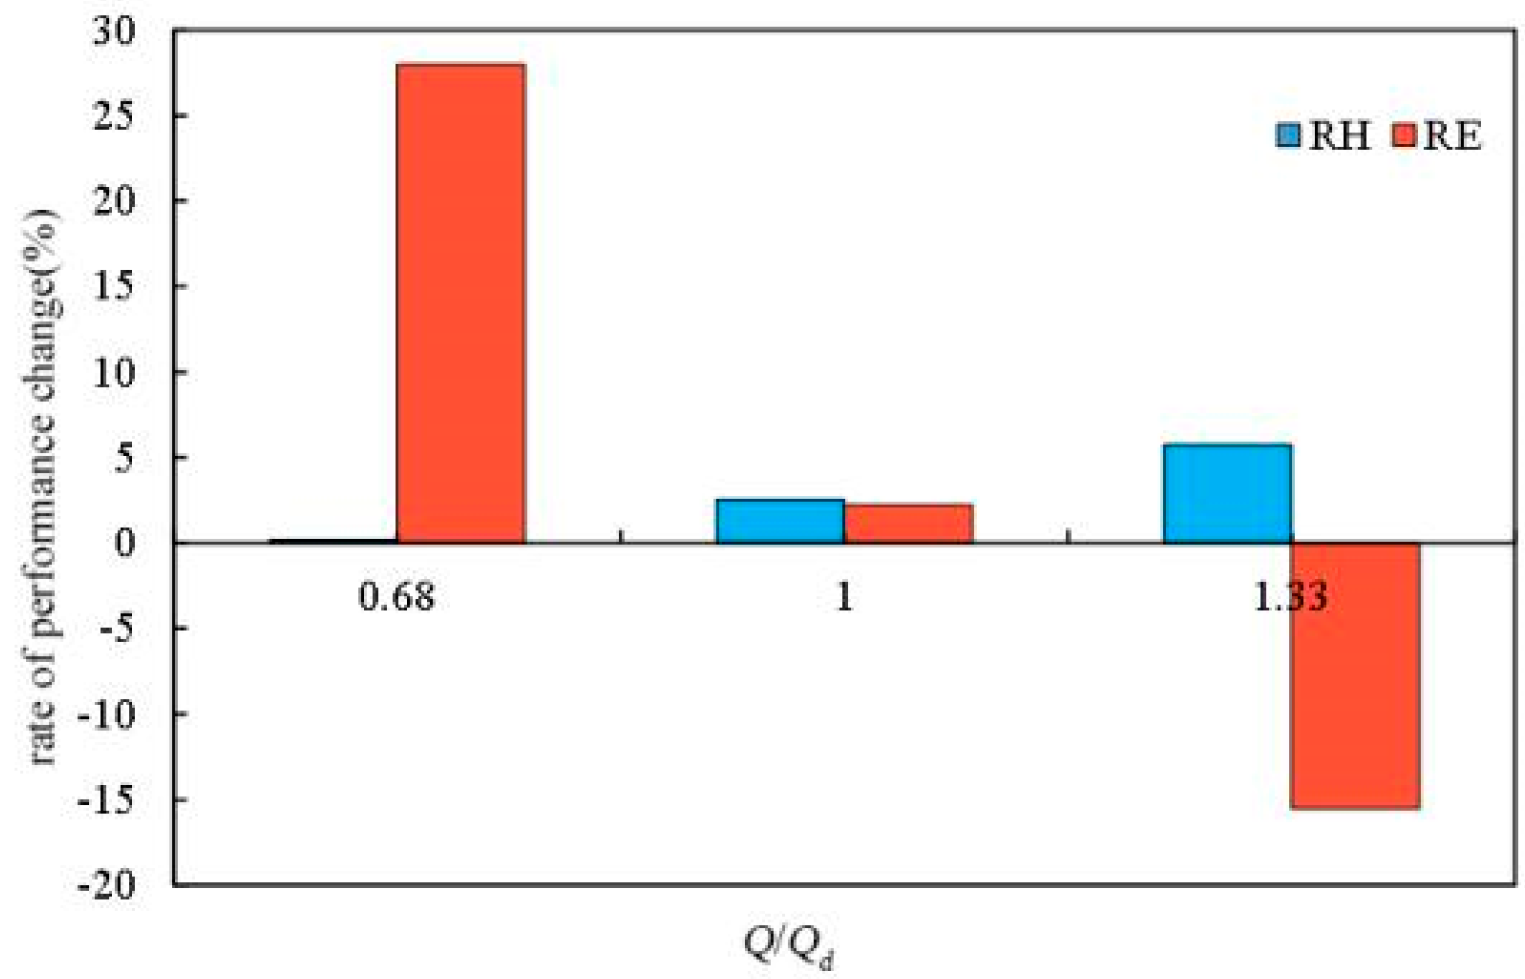
It can be seen from Figure 18 that the inlet flow rate is positively correlated with the RH and negatively correlated with the RE. The maximum RH is 5.7% when Q = 1.33 Qd, while the maximum RE is 28% when Q = 0.68 Qd. This indicates that with this particle size, an increase in inlet flow rate causes the head to decrease and the efficiency to increase when transporting solid-fluid two-phase flow. The small flow rate causes the internal flow structures of the pump to become turbulent more easily, leading to phenomena such as cavitation that signify instability, increasing the flow loss of the internal flow field, which in turn leads to low pump efficiency.

3.3.2. Different Rotational Speeds

The pump rotational speed was set to 900 rpm, 1450 rpm, and 1800 rpm, respectively, with a flow rate of 420 m3/h. The volume concentration of the solid-phase particles being transported was 7.5%, and the particle size was 6 mm.
Figure 19 and Figure 20 show the pressure and velocity distributions in the first-stage impeller-vane guide B2B view, respectively.
It can be seen from Figure 19 and Figure 20 that the rotational speed has no influence on how the impeller-guide vanes generate work. In the B2B view, the pressure still increases gradually from the pump inlet to the pump outlet, and different degrees of flow instability occur in the region of the interface between the impeller outlet and the guide vane inlet. Moreover, the pressure at the same position increases as the rotational speed increases. However, when the rotational speed increases to 1800 rpm, the low-pressure zone between the impeller outlet and the guide vane inlet increases in size, and the flow becomes more turbulent.
Figure 21 shows the particle trajectories in the calculation domain with solid-fluid two-phase flow.
It can be seen from Figure 21 that as the rotational speed of the pump impeller increases from 900 to 1800 rpm, the degree of preswirl in the inlet section of the first-stage impeller also gradually increases. The axial velocity changes completely to radial velocity in advance, the particles being driven by the fluid to move in a circumferential direction earlier. In particular, when the rotational speed is 1800 rpm, the particles move in circular motion immediately after entering the pump inlet. In addition, other than at the rated rotational speed of 1450 rpm, the particle motion is more disorderly at the other two speeds in the calculation domain. That is, too low or too high a rotational speed makes it impossible for the particles to complete the normal energy transfer in the calculation domain.
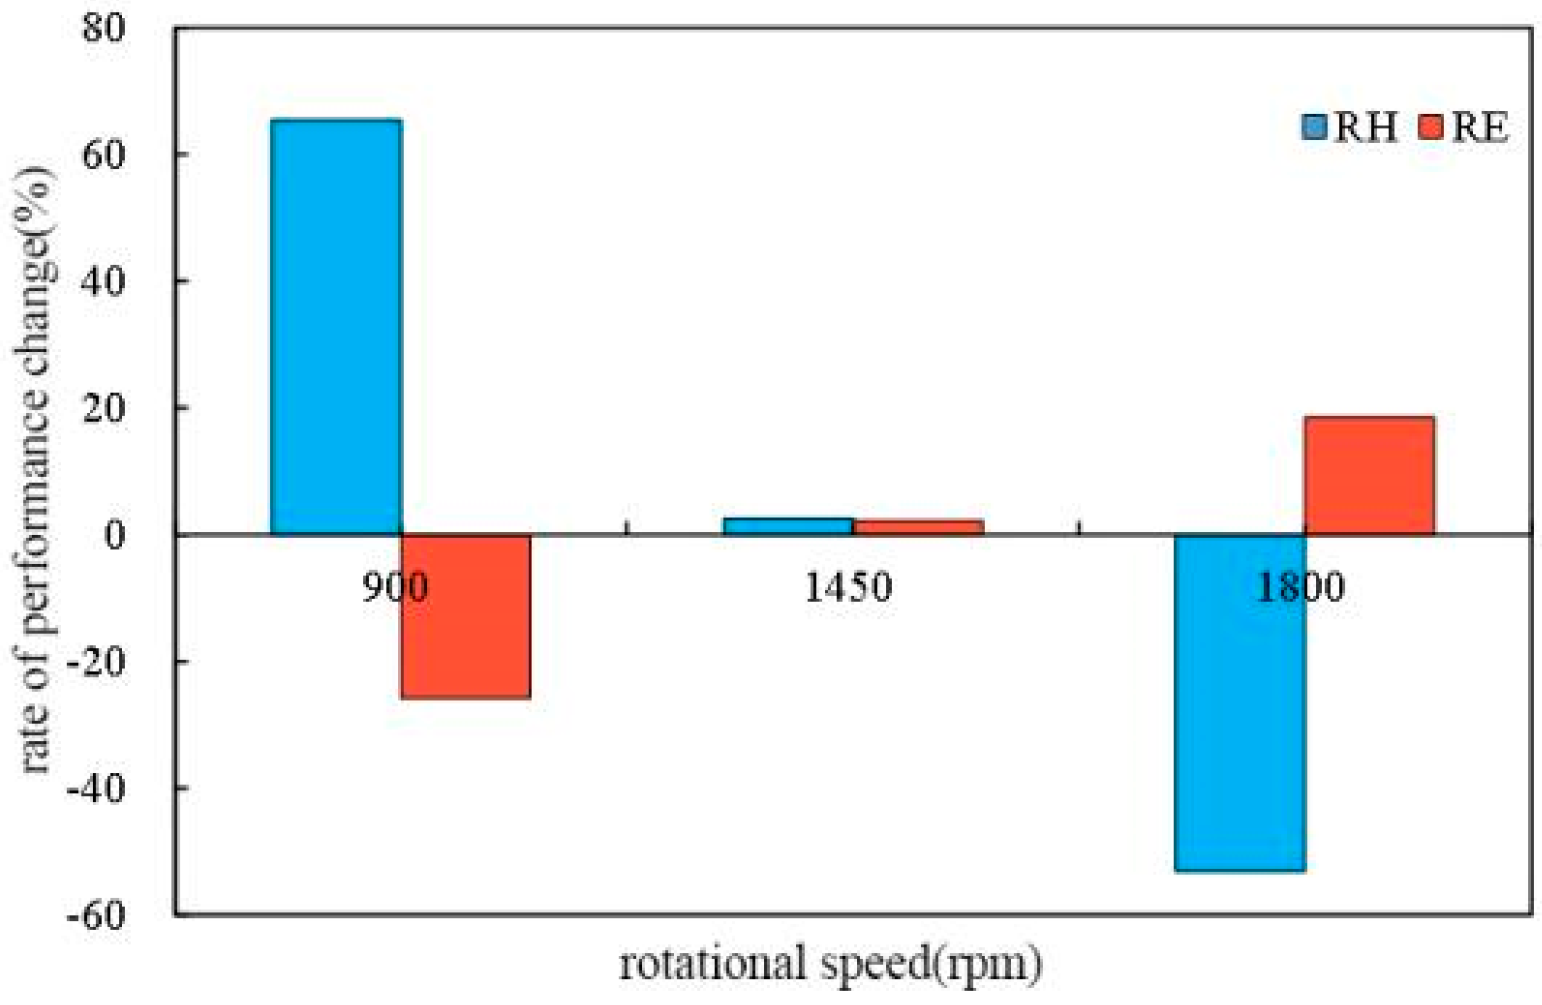
It can be seen from Figure 22 that the changes in pump performance owing to the different rotational speeds compared to the rated speed at 1450 rpm—that is, either too low or too high a rotational speed—have a significant influence on the pump performance. The rotational speed is negatively correlated to RH but positively correlated to RE with solid-fluid two-phase flow. In particular, RH reaches its maximum value of 65.4% at a rotational speed of 900 rpm, while RE reaches its maximum value of 18.5% at a rotational speed of 1800 rpm.
The relationship between the head and rotational speed in the affinity law can be expressed by Equation (20), as follows:
H p H m = ( D 2 p D 2 m ) 2 ( n p n m ) 2
where H p and H m are the head values for the actual pump and the model pump (m), respectively; D 2 p and D 2 m are the impeller outlet diameters of the actual pump and the model pump (mm), respectively; and n p and n m are the shaft rotational speeds of the actual pump and the model pump (rpm), respectively.
It can be seen from Equation (20) that the pump head changes proportionately to the square of rotational speed. When the rotational speed increases, the pump head increases accordingly. It can be seen from the RH changes in Figure 22 that when the rotational speed reaches 1800 rpm, RH reaches 53%. That is, the pump head increases by 53% at this point. By comparison, an increase in rotational speed influences the pump efficiency negatively.
Under normal circumstances, the changes of pump efficiency are closely related to hydraulic efficiency, ηh, volumetric efficiency, ηv, and mechanical efficiency, ηm, in the fluid domain during operation. In particular, the friction loss of the disc that affects mechanical efficiency is directly related to the rotational speed. The power owing to friction loss of the pump disc can be calculated based on the empirical formula of Equation (21), as follows:
Δ P m 2 = β ρ u 2 3 D 2 2
where β is the comprehensive coefficient (generally β = (0.81 − 0.88) × 10−6); ρ is the fluid density (kg/m3); u 2 is the circumferential velocity component at the impeller outlet (m/s); and D 2 is the outer diameter of the impeller (mm).
Consequently, because of the disc, the friction loss, Δ P m 2 , is proportional to the cube of the rotational speed of the pump. Moreover, the increase in rotational speed increases not only the velocity of the fluid medium in the pump, but also the local loss of the fluid in the flow passage and the friction loss with the flow passage components, which further leads to a corresponding increase in the flow loss in the calculation domain, resulting in a decrease in pump efficiency.

4. Hydraulic Performance Experiment

4.1. Experiment Principle

A deep-sea mining pump was fabricated according to the parameters in Section 2.1. A comparative experiment was conducted for different flow rates, the particles used to be 6 mm in size with a concentration of 7.5%. The performance testing system of the mining pump was composed of components to regulate the voltage of the water supply and for measurements, control, feeding, and lifting. The test procedure was as follows:
(1) Install mining pumps, motors, pipelines and other equipment in accordance with the test requirements, and check the pipelines and instruments to ensure normal operation.
(2) Turn on the power switch of the test bench and switch the voltage to 3 kV.
(3) Open the valve, open the mining pump performance test control platform, and enter the “pump performance test” program.
(4) Click the “Record” button to record the pressure, flow, power, and other related data, and record the data of 13 flow operating points in total.
(5) After the test is completed, organize the test site, analyze the data, and draw the curve diagram.
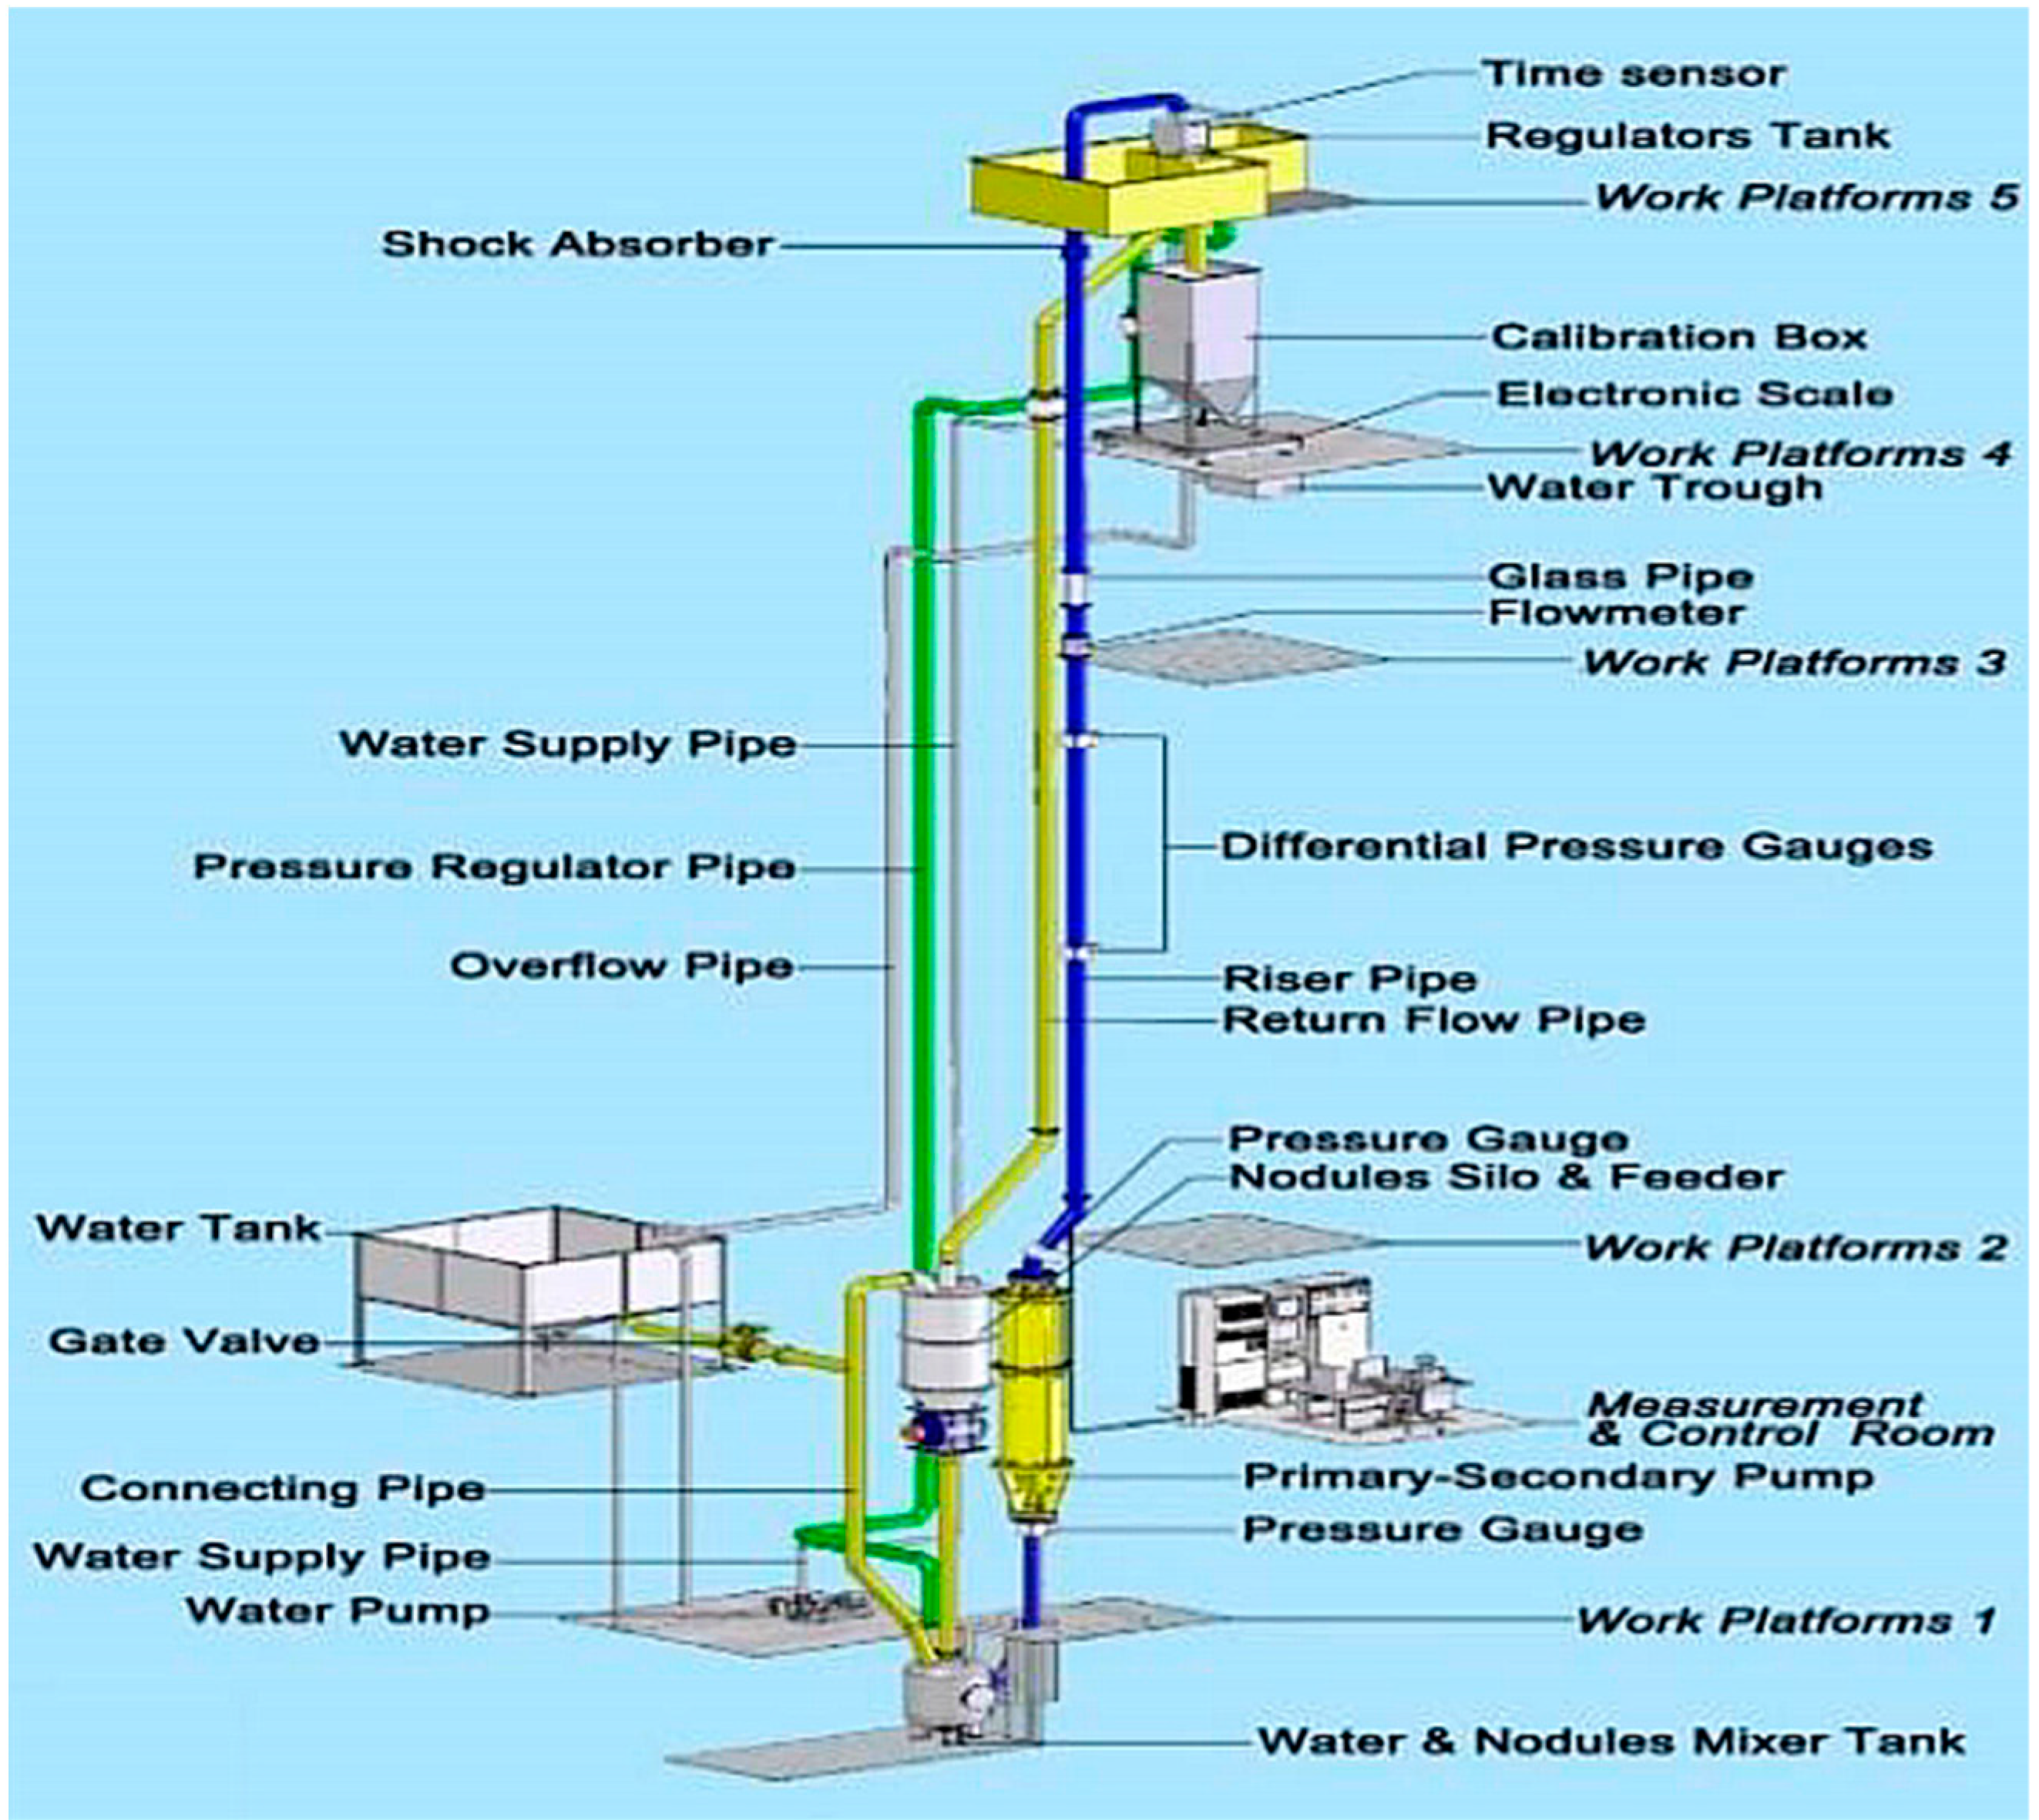
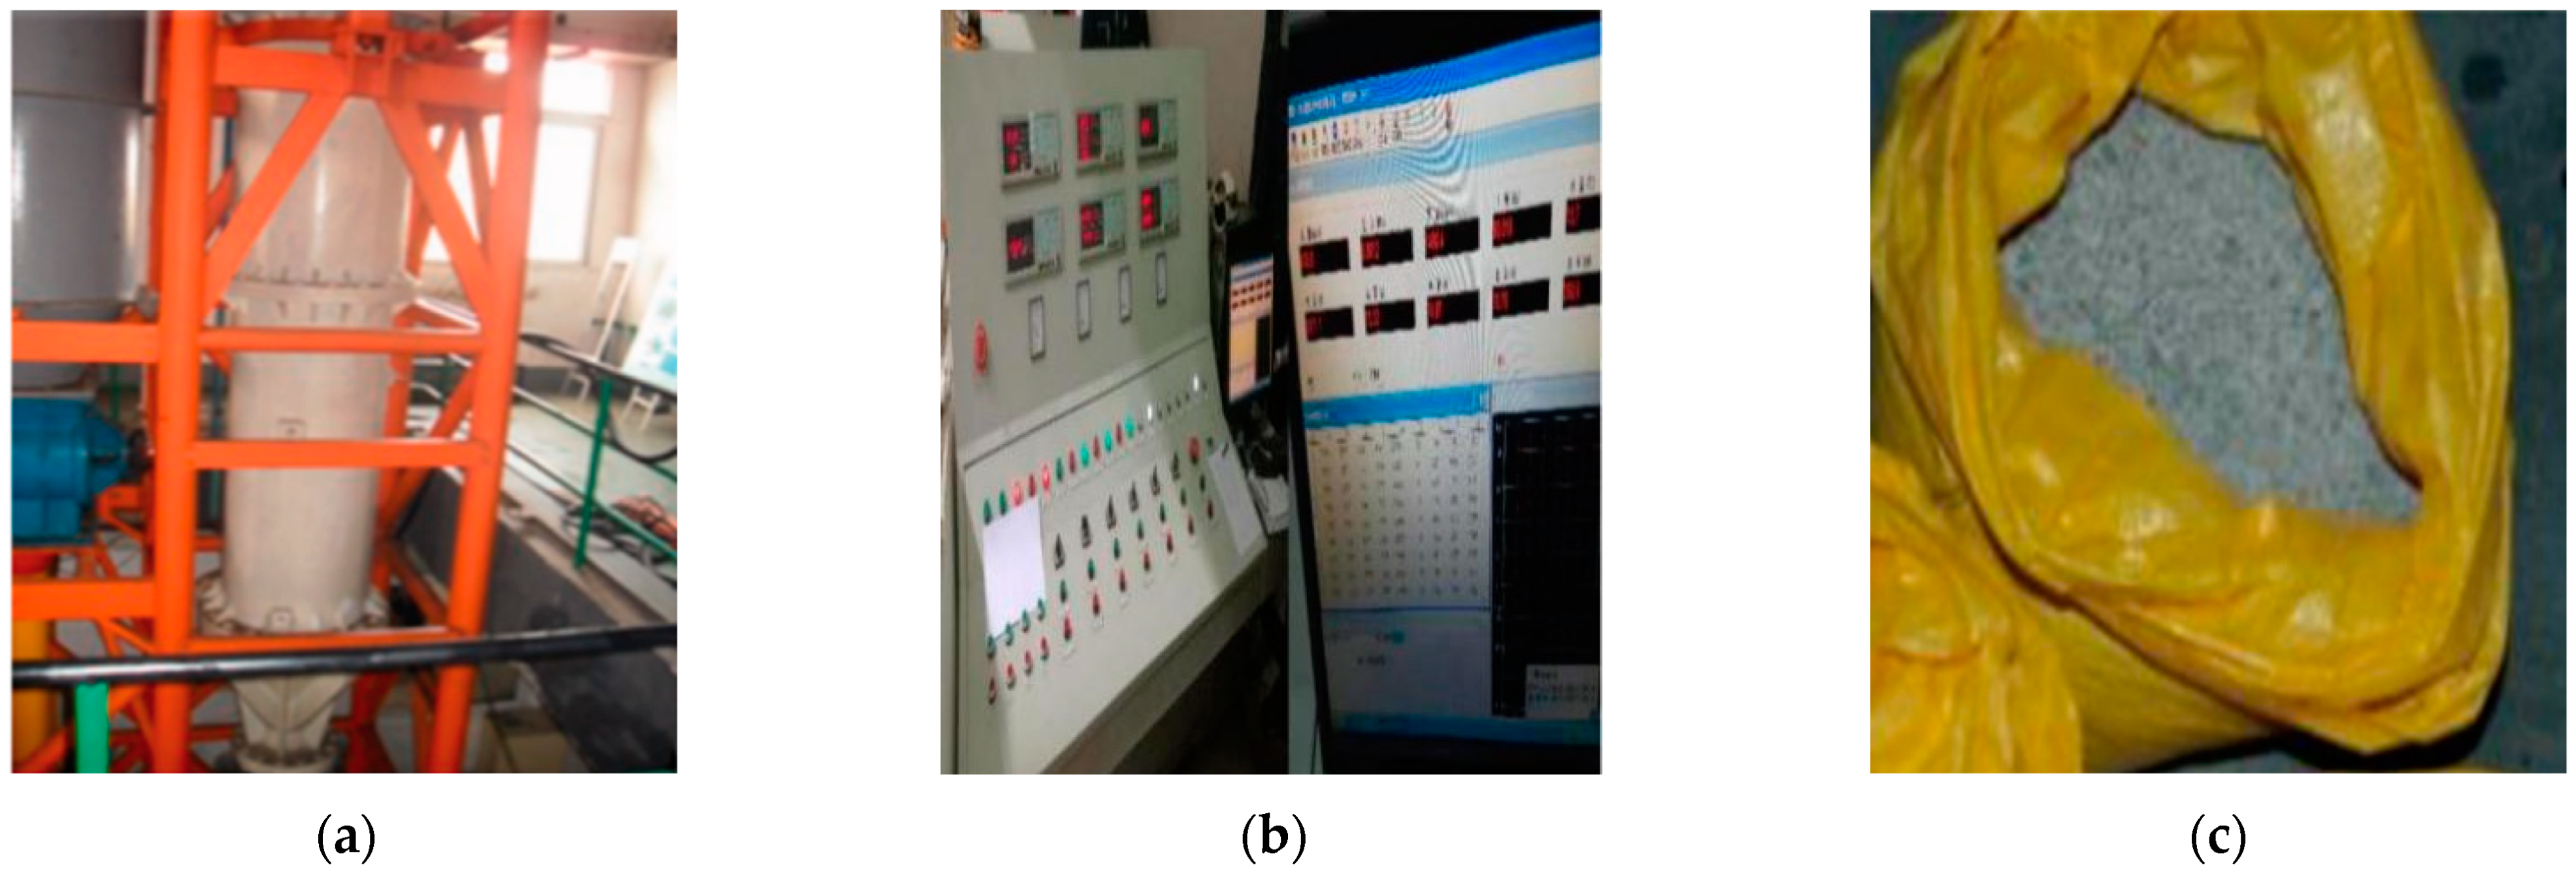
Figure 23 shows a schematic diagram of the mining pump testing system. Figure 24 shows a photo of the test site.
During the testing process, the head, shaft power, and efficiency of the mining pump were determined using the following formulas.
The head was calculated according to Equation (16). The efficiency of the mining pump was calculated using Equation (22):
η = N e P = ρ g Q H 1000 × 3600 P
The shaft power of the mining pump was calculated using Equation (23):
P = 0.995 n n 0 [ P 1 P 0 0.0015 ( R 1 I 1 2 R 0 2 ) ]
where n 0 is the synchronous speed of the motor, n 0 = 120 f / j [rpm]; j is the number of stages of the motor; f is the AC frequency [s−1]; n is the test speed of the pump [rpm]; P 0 and P 1 are respectively the measured no-load power and power under a load [kW]; I 1 is the measured current under a load [A]; and R 0 and R 1 are respectively the motor DC wire resistances after the no-load and load tests [Ω].

4.2. Comparative Analysis of Results

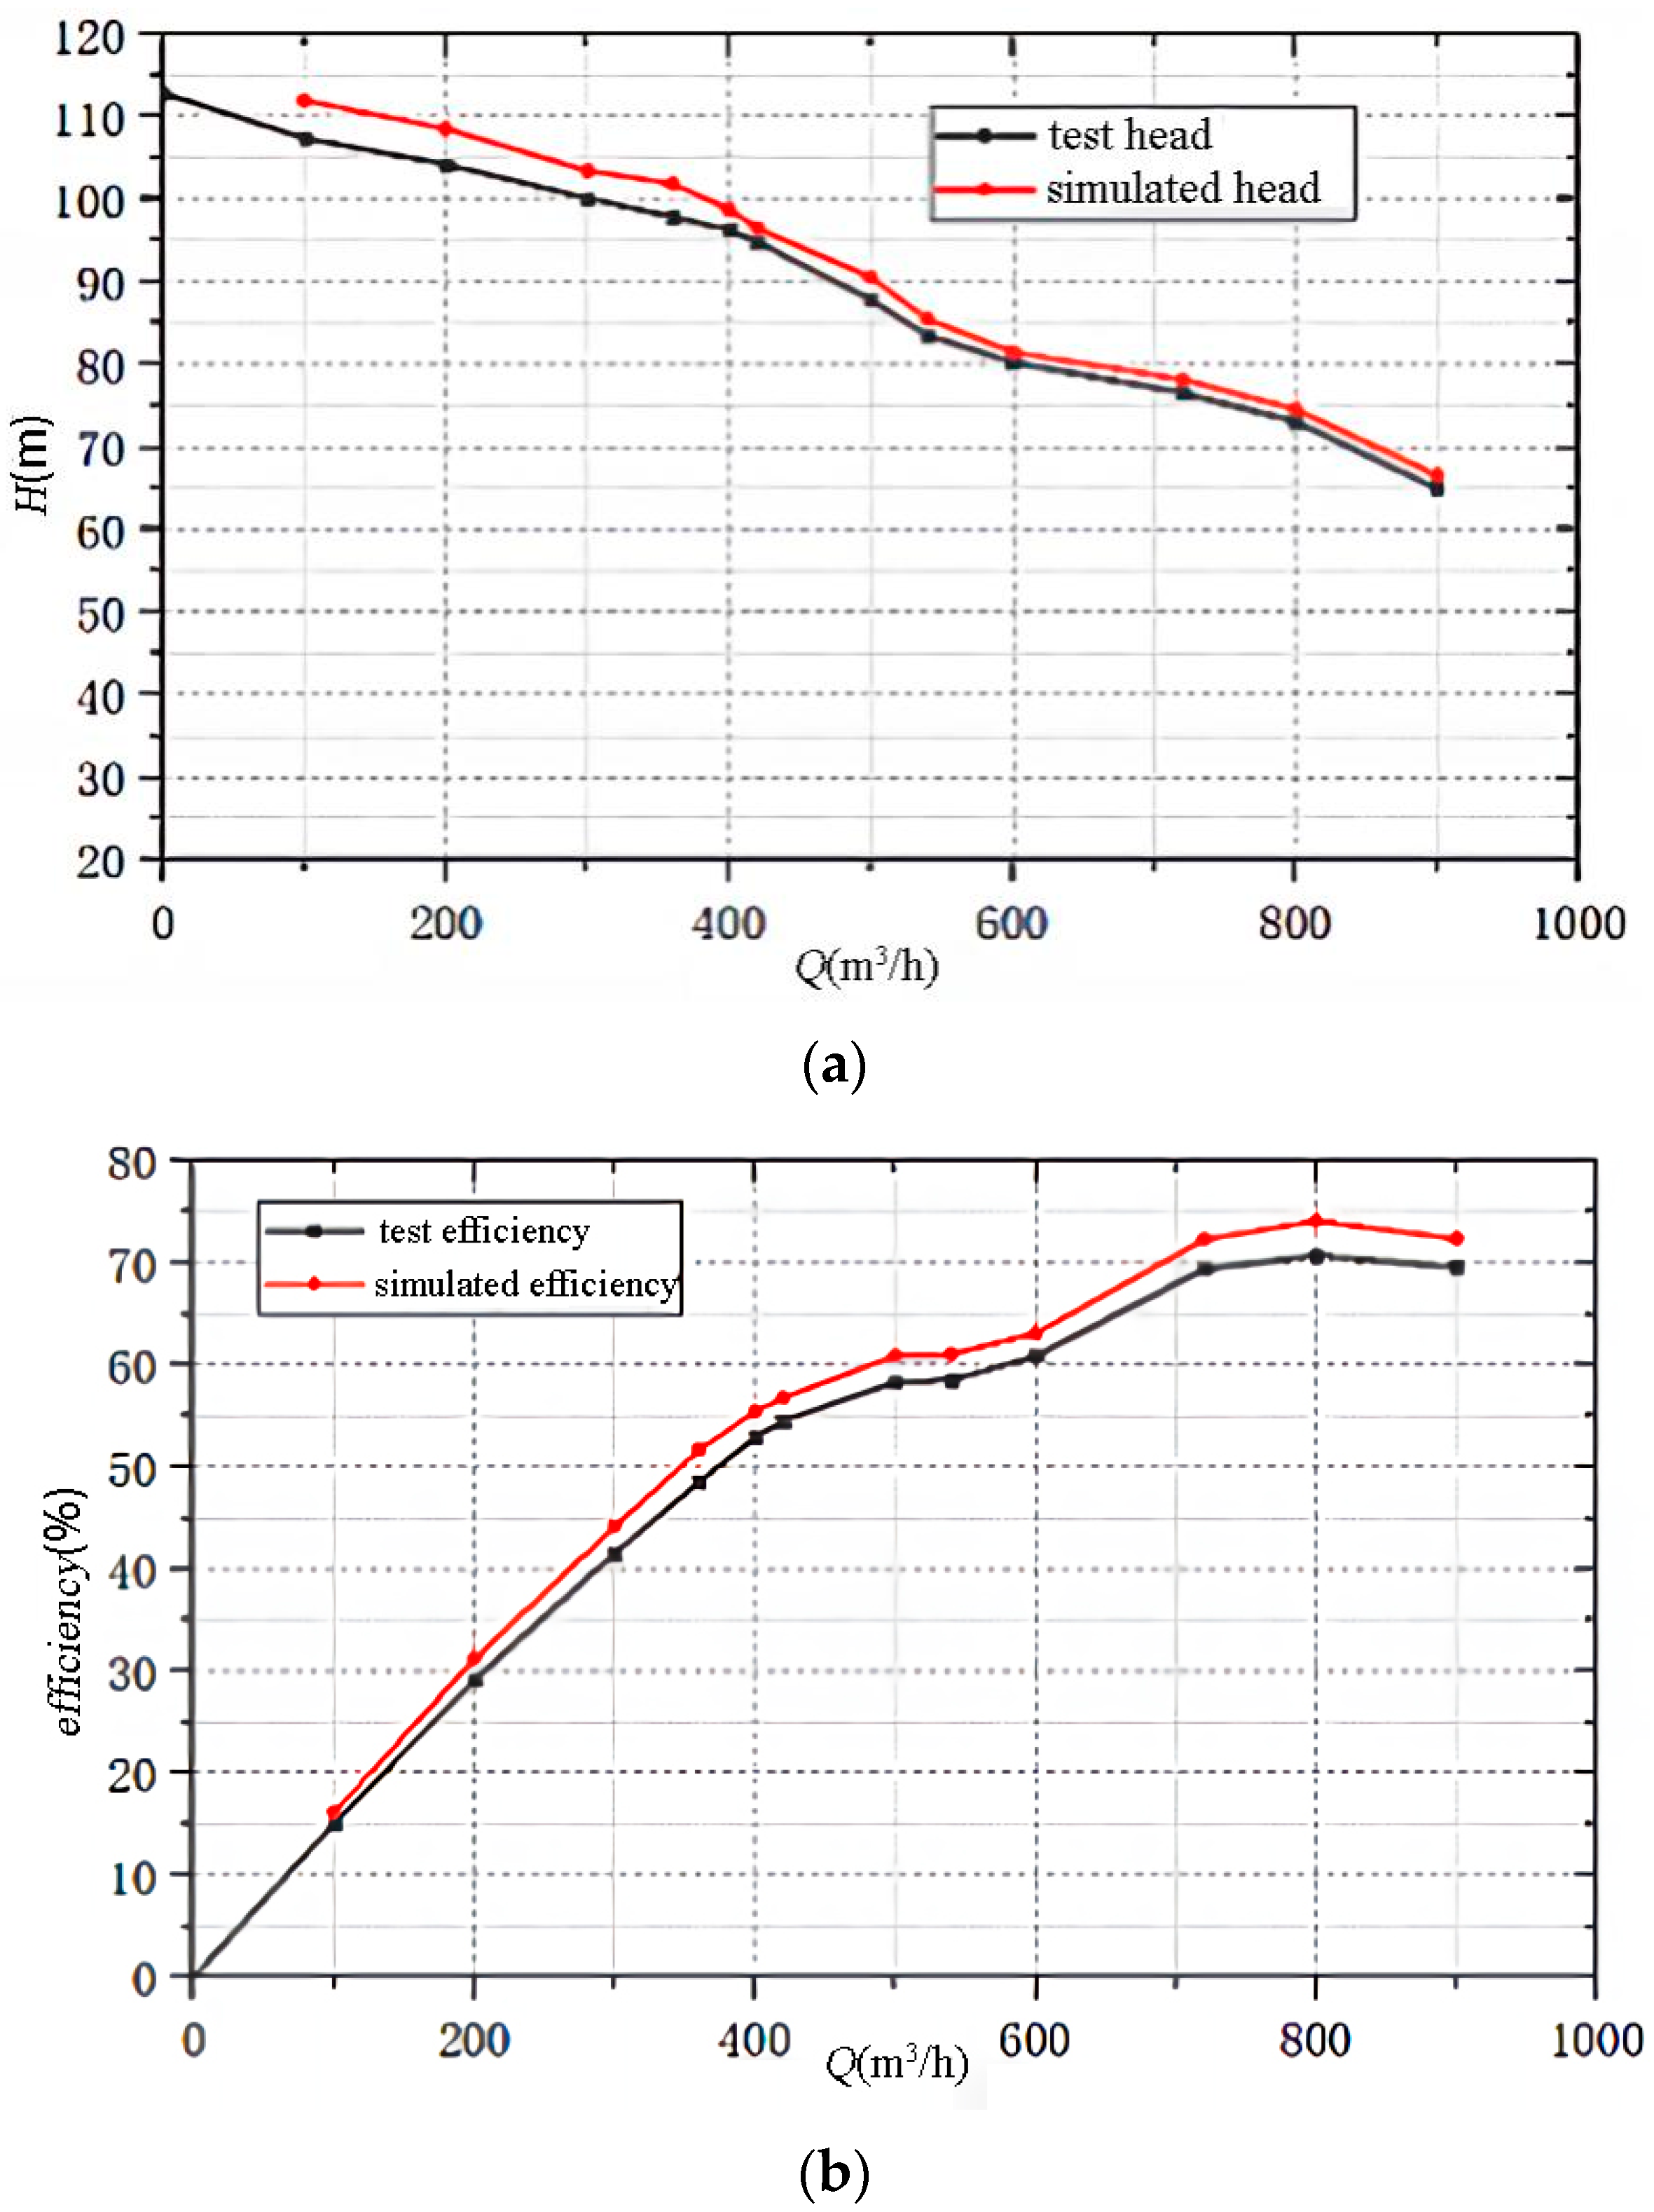
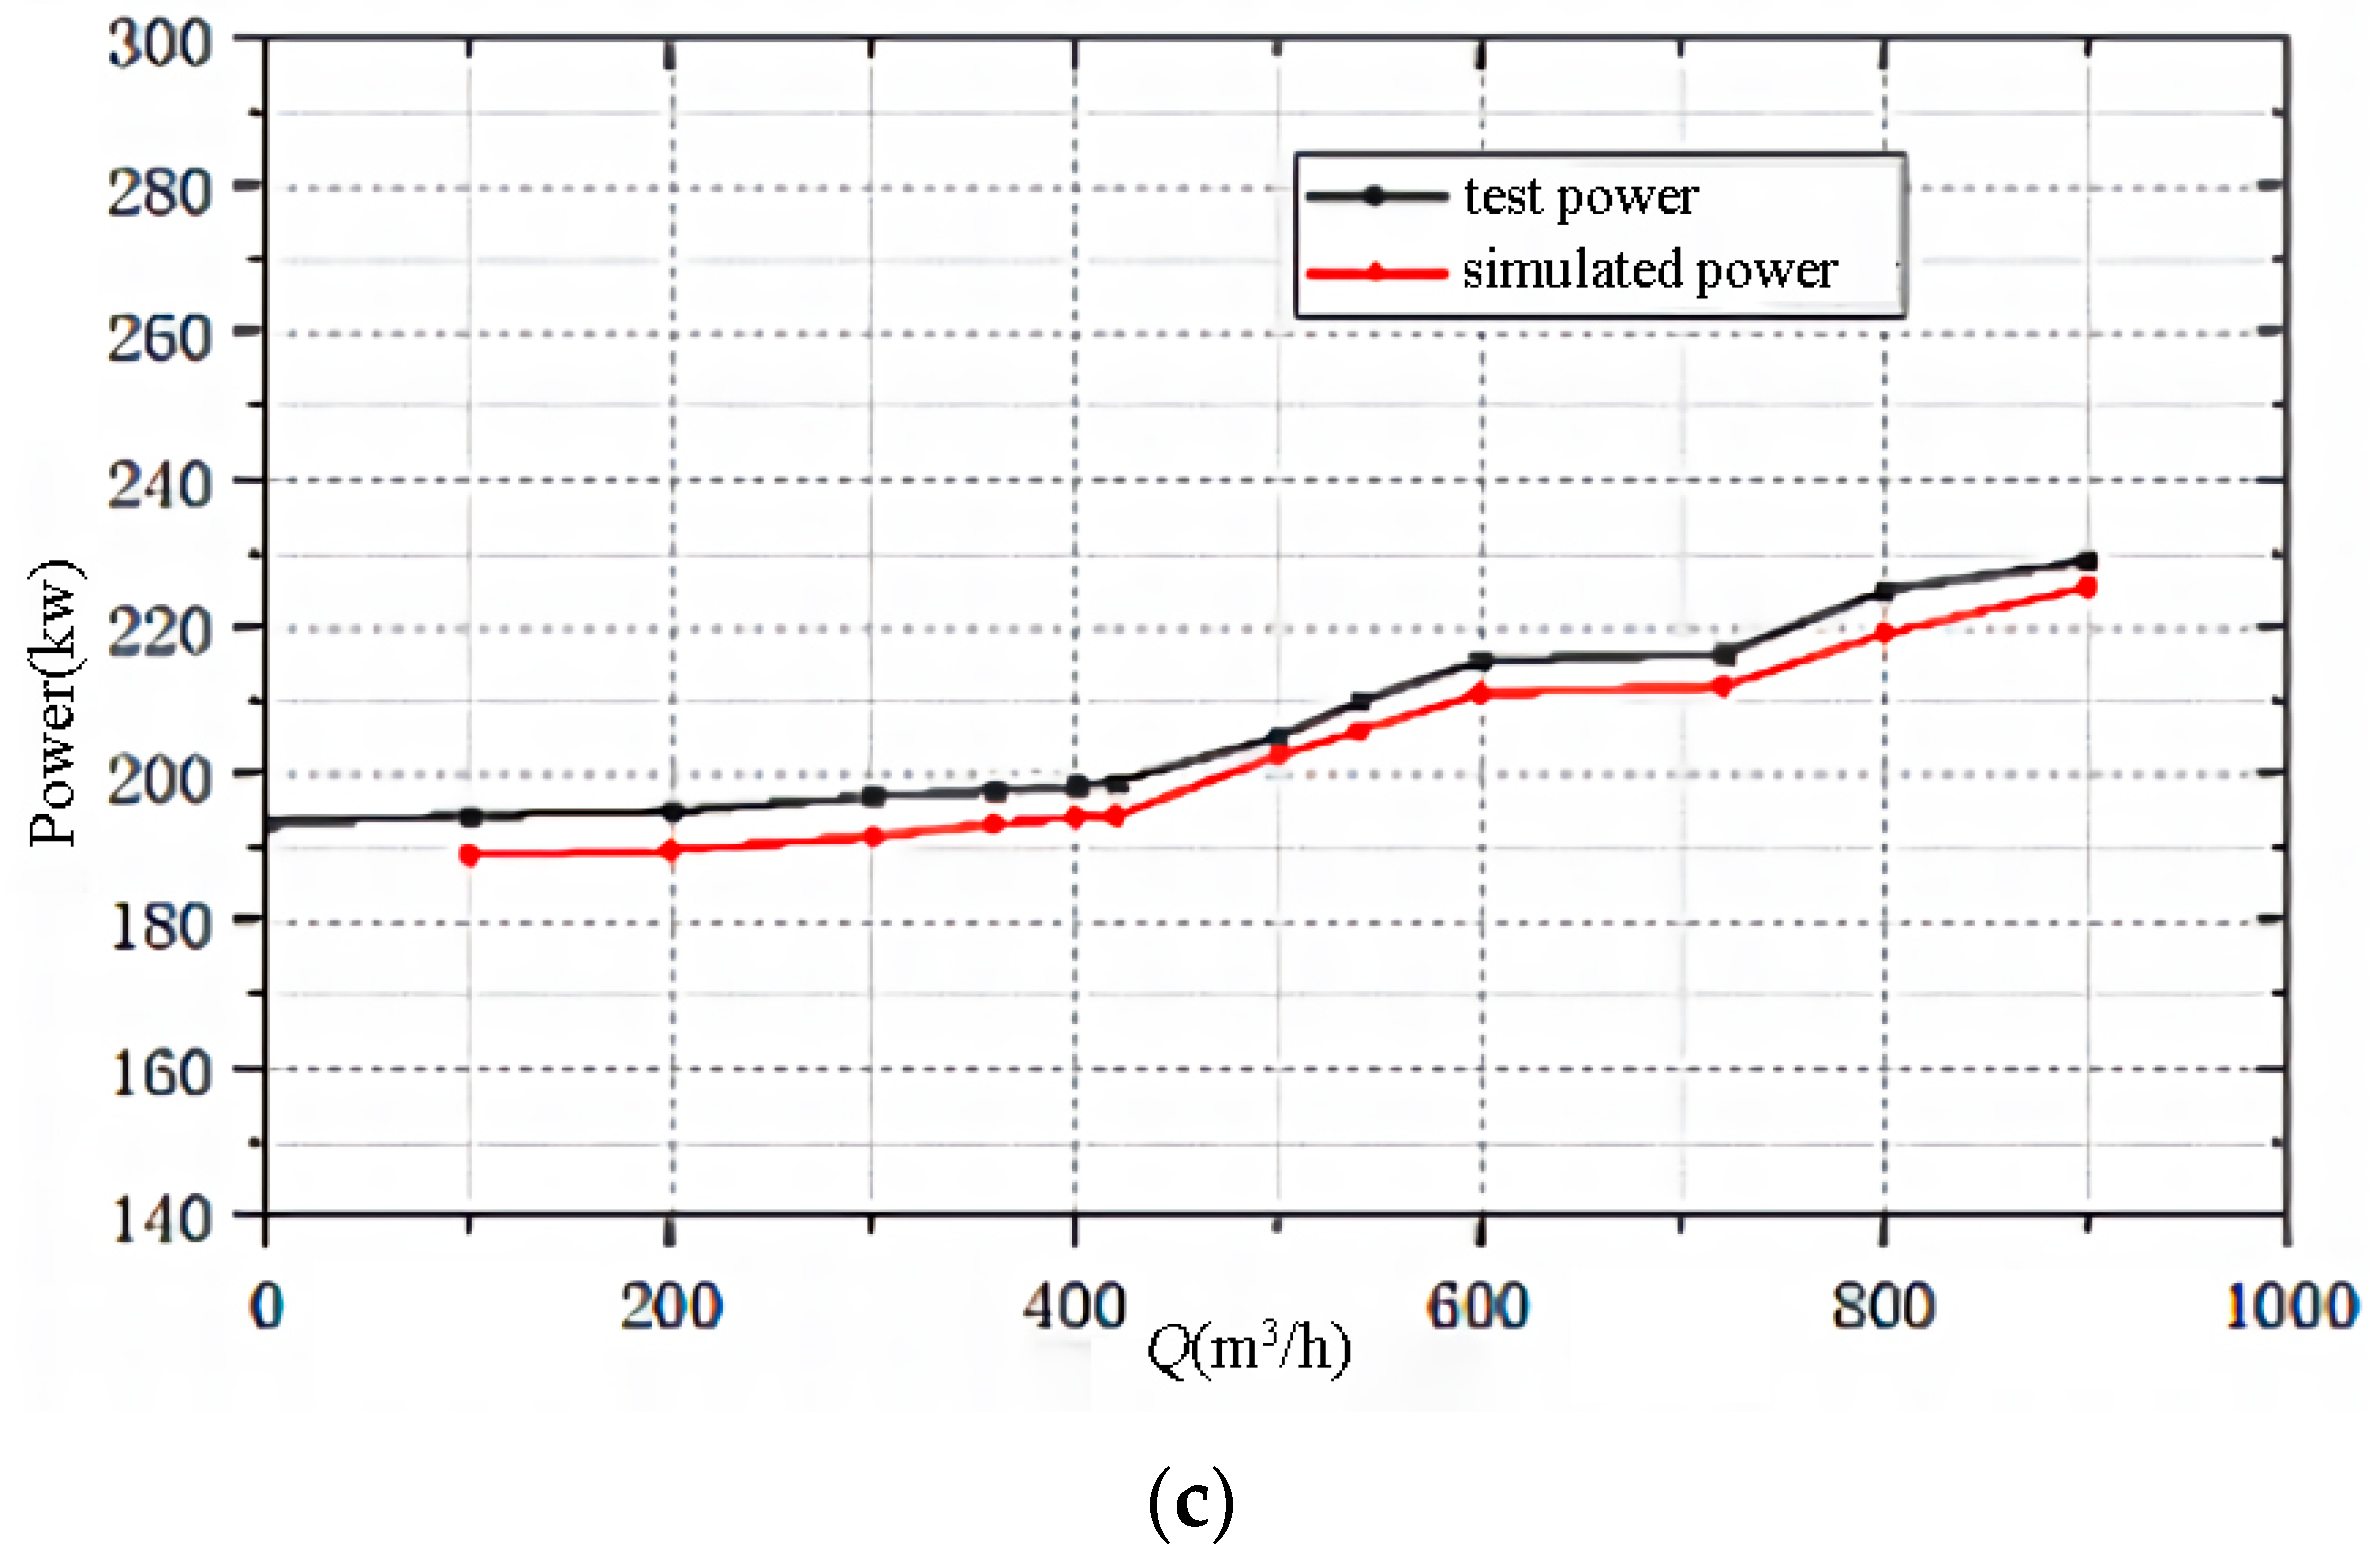
Based on the performance requirements of mining pumps, the changes in the head, efficiency, and shaft power under 13 flow conditions were numerically simulated and analyzed. The flow-head curve, flow-efficiency curve, and flow-shaft power curve of the mining pump are shown in Figure 25a–c, respectively.
It can be seen from Figure 25a that both the test head and the numerically simulated head decrease with increasing flow and that the overall trends are in good agreement. At the rated flow point Qd = 420 m3/h, the test head is 94.86 m, and the simulated head is 96.51 m, a relative error of just 1.7%. The maximum relative error occurs when the flow is Q = 100 m3/h, the relative error being 4.3%, which is within a reasonable range. It can be seen from Figure 25b that the test efficiency and the numerically simulated efficiency are also in good agreement. At the rated flow point Qd = 420 m3/h, the relative error is 4.1%, while the maximum relative error occurring when the flow is Q = 100 m3/h is 7.3%, which is again within a reasonable range. Similarly, the overall trends of the tested shaft power and simulated shaft power are in good agreement. At the rated flow point Qd = 420 m3/h, the relative error is −2.3%. Over the entire flow range, the maximum relative error is −2.8%, the relative error being within a reasonable range.
Based on the above analysis, the head, efficiency, and shaft power obtained from the tests were consistent with the overall trends of head, efficiency, and shaft power obtained from the simulations, the errors being relatively small. The hydraulic performance of the newly designed mining pump certainly meets the design requirements.

5. Test Validation of Method and Model

5.1. Testing Principle

Due to the difficulty of carrying out erosion tests on deep-sea mining pumps, the conditions for the erosion test are not yet available. To verify the accuracy of the numerical calculation method and the model used in this article, we made a small test pump with the same specific speed and similar structure as the deep-sea mining pump for the erosion test. To facilitate verification, we used a qualitative erosion test, which has been used in many research studies [11,29,30].
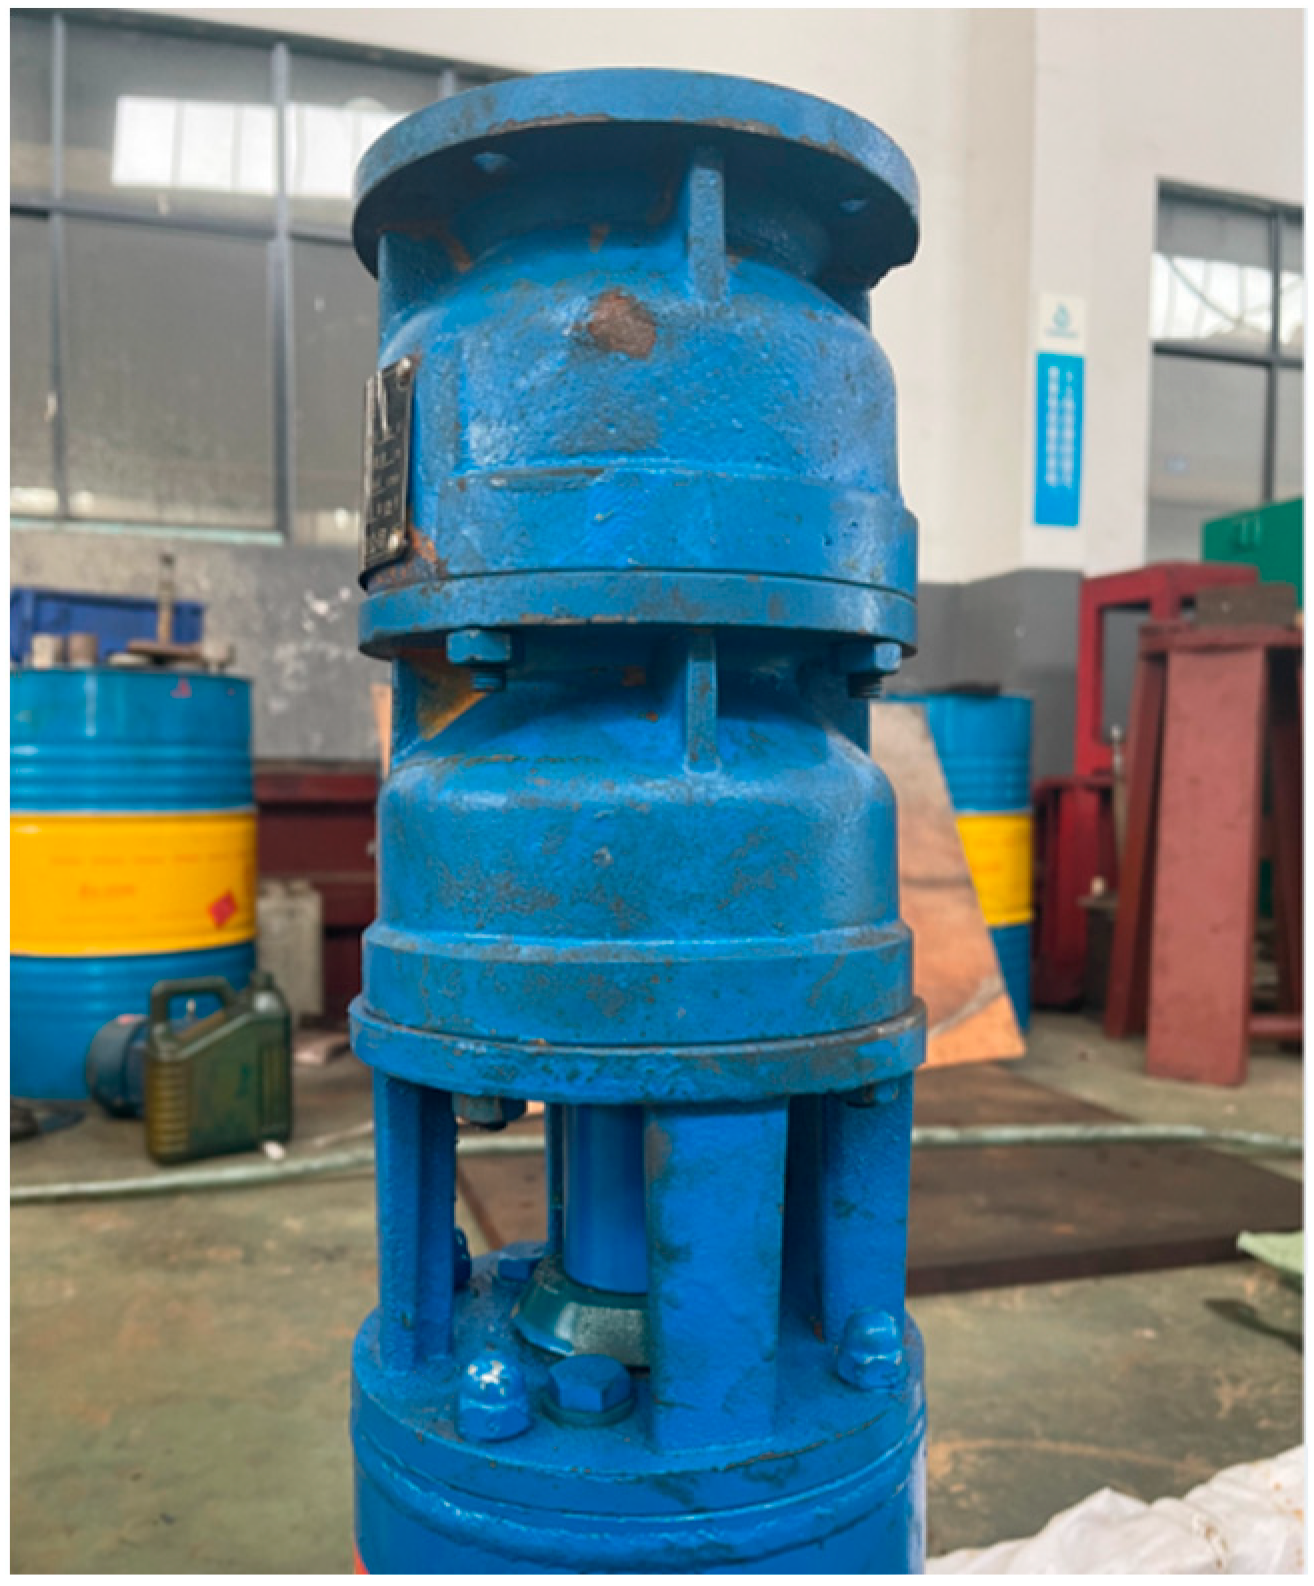
The main parameter values of the test pump were a rated flow rate Qd = 20 m3/h, a single-stage head Hd = 15 m, a rated efficiency ηd = 64%, and a rated rotational speed n = 2860 r/min. The actual test pump is shown in Figure 26.
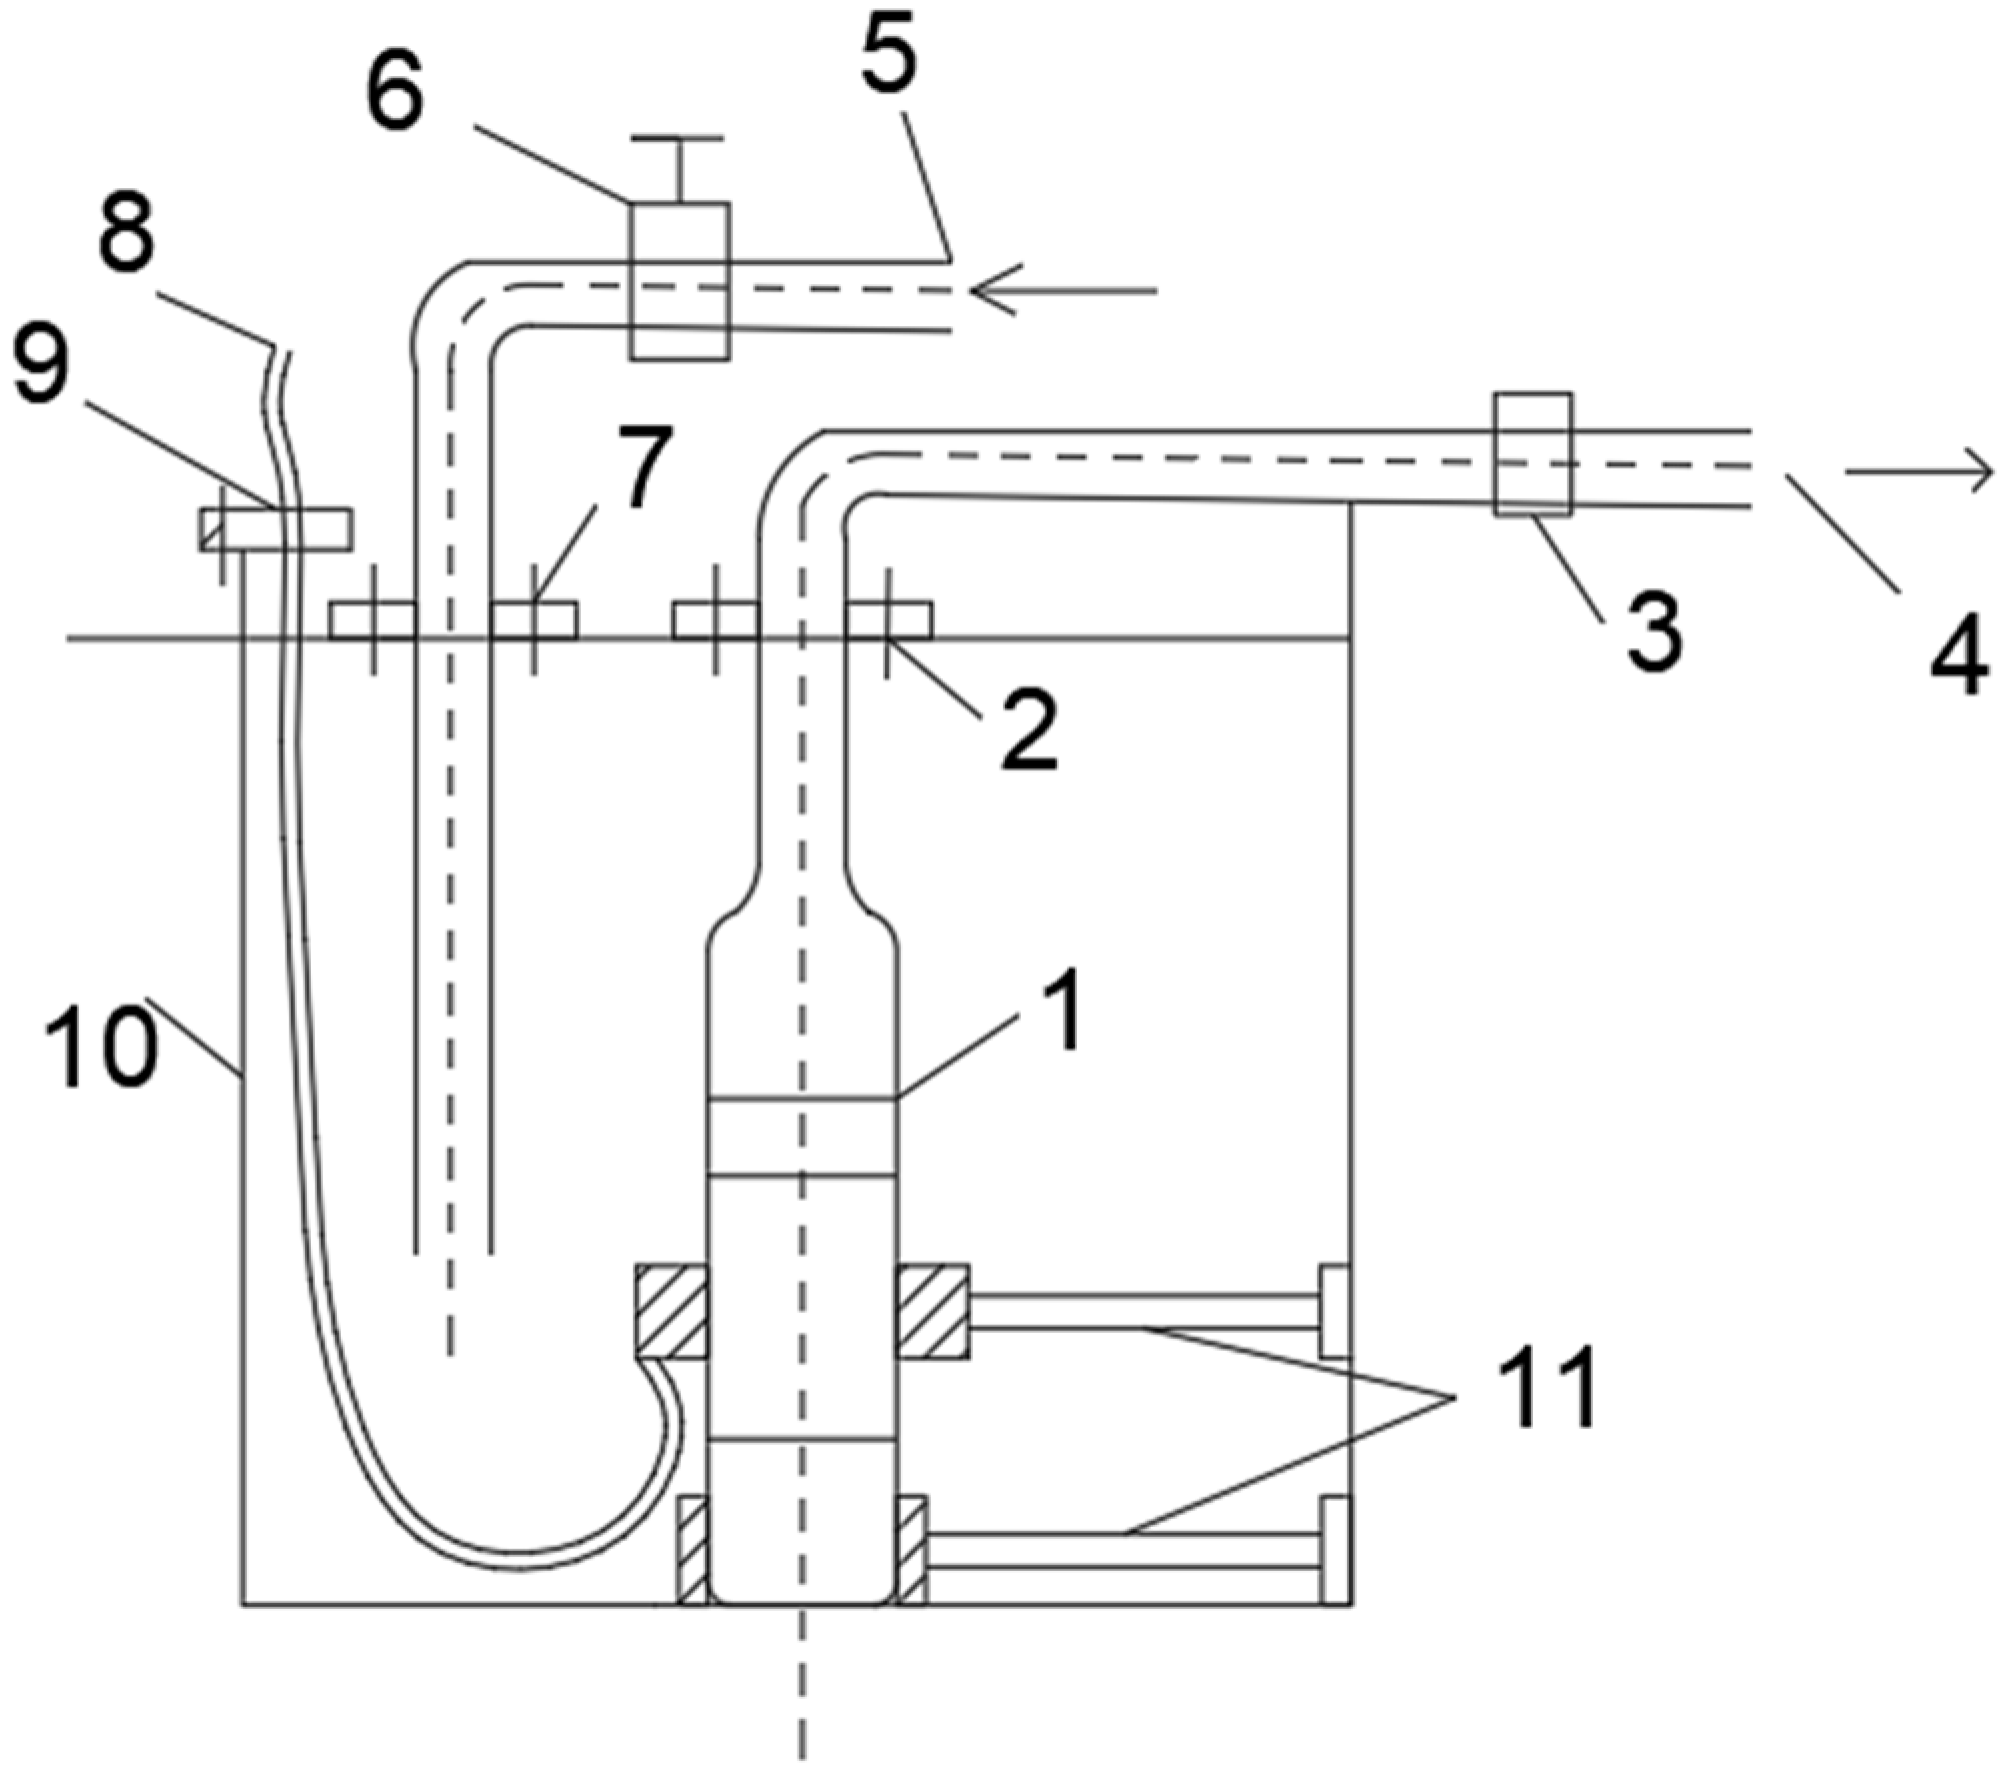
The test system was mainly composed of test pumps, water tanks, regulating valves, pipelines, data measurement systems, etc., which is shown in Figure 27.
Considering the actual situation of the test pump flow channel, this test used regular solid particles with a particle size of 3mm, and the test concentration was set to 7.5%. The test was carried out under low flow (13 m3/h), rated flow (20 m3/h) and large flow (26 m3/h) conditions. Before the test, the same thickness of water-based paint was applied to the impeller runners. After the paint was completely dried, the test was carried out. We observed the impact of the particles on the runners after 2 h of unsteady flow in the runners, and then the numerical calculation results under the same boundary conditions were compared. The comparison diagrams of the impeller before and after applying water-based paint are shown in Figure 28.
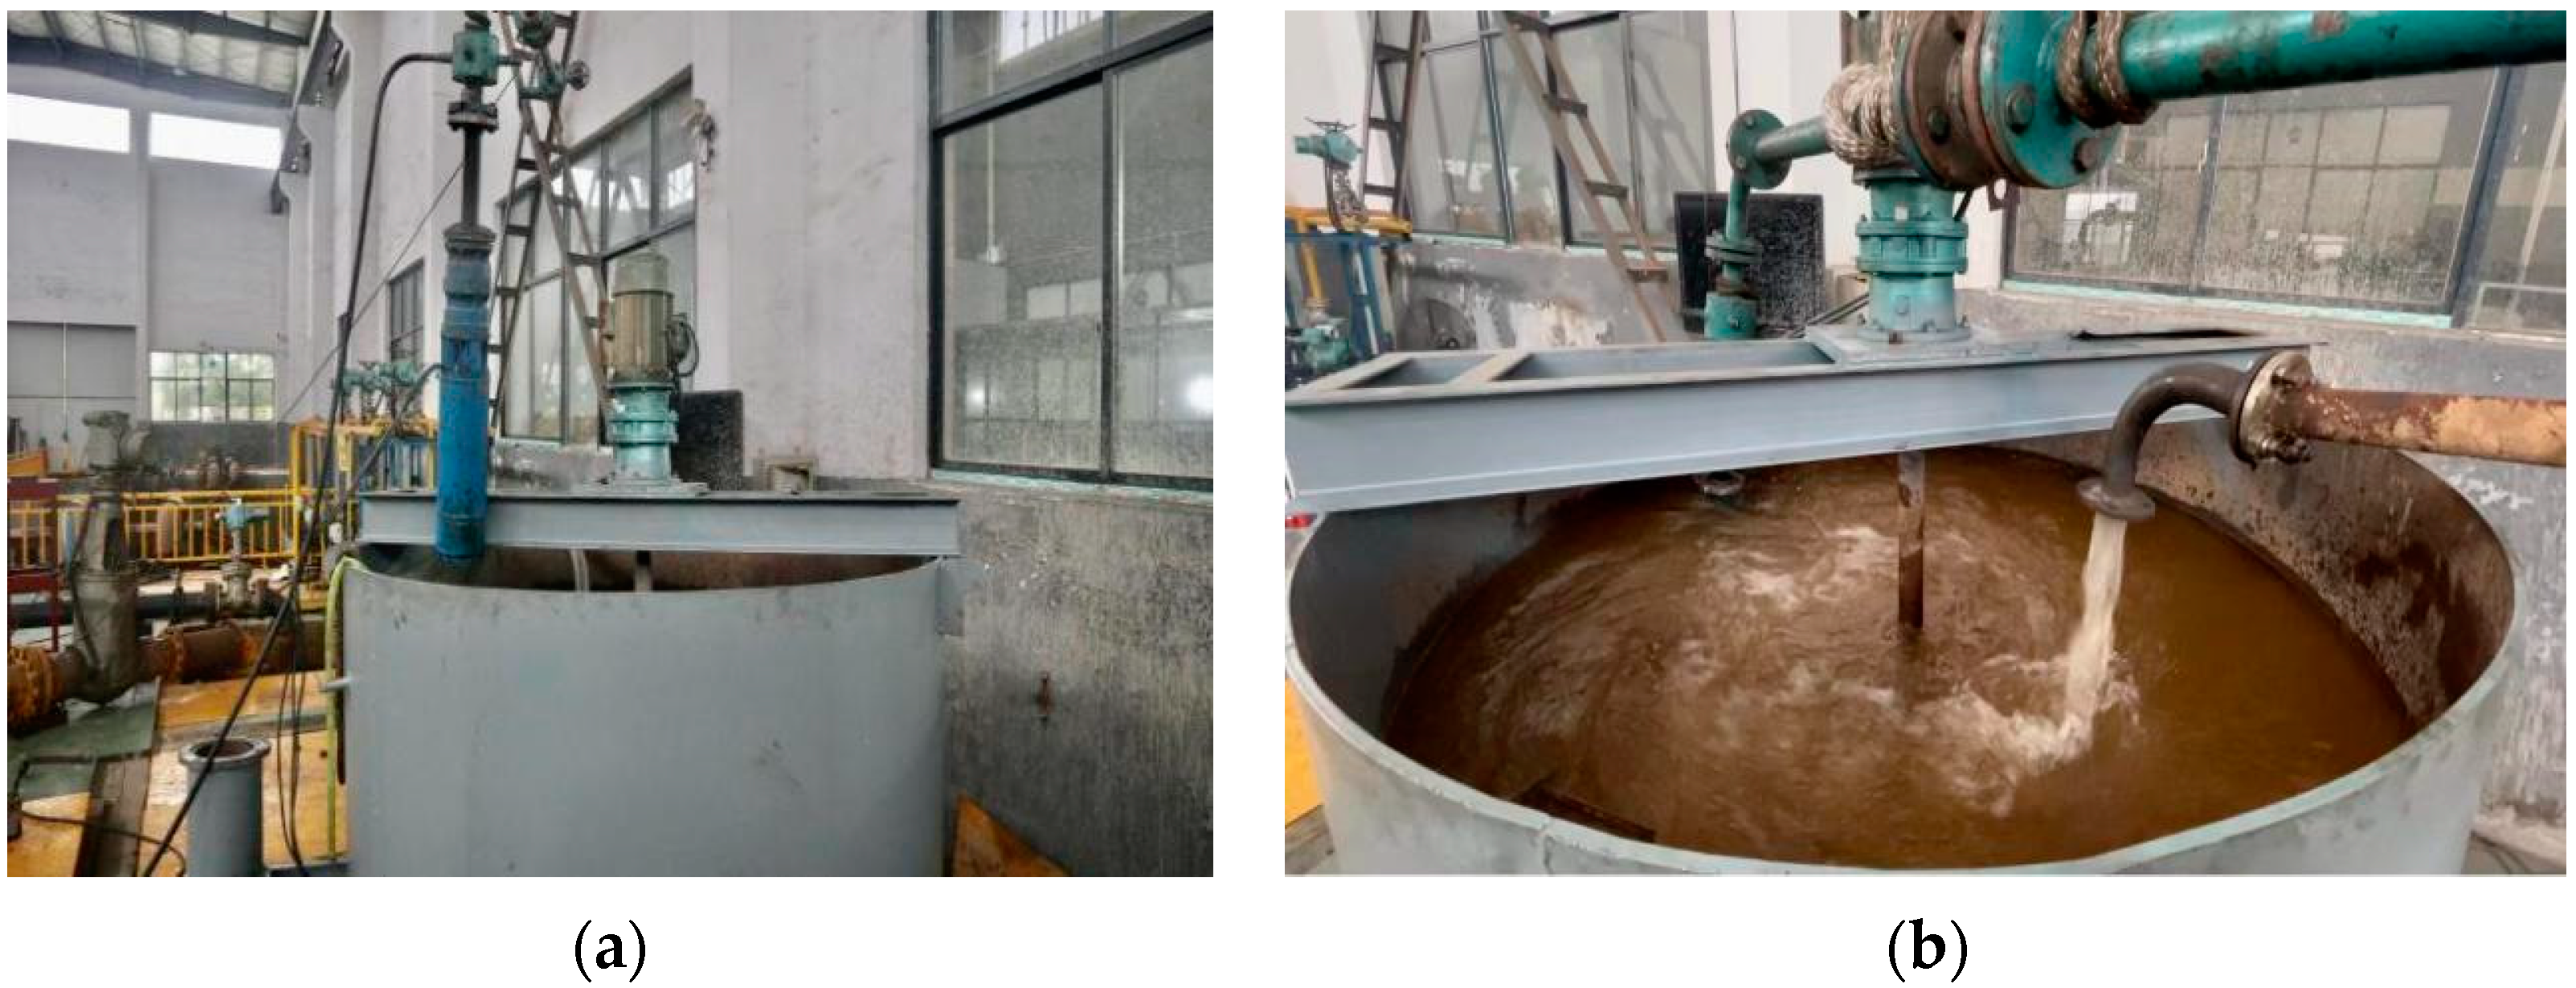
During the erosion test under 13 m3/h, 20 m3/h, and 26 m3/h flow conditions, the site is shown in Figure 29.

5.2. Comparative Analysis of the Results

5.2.1. Low Flow Conditions

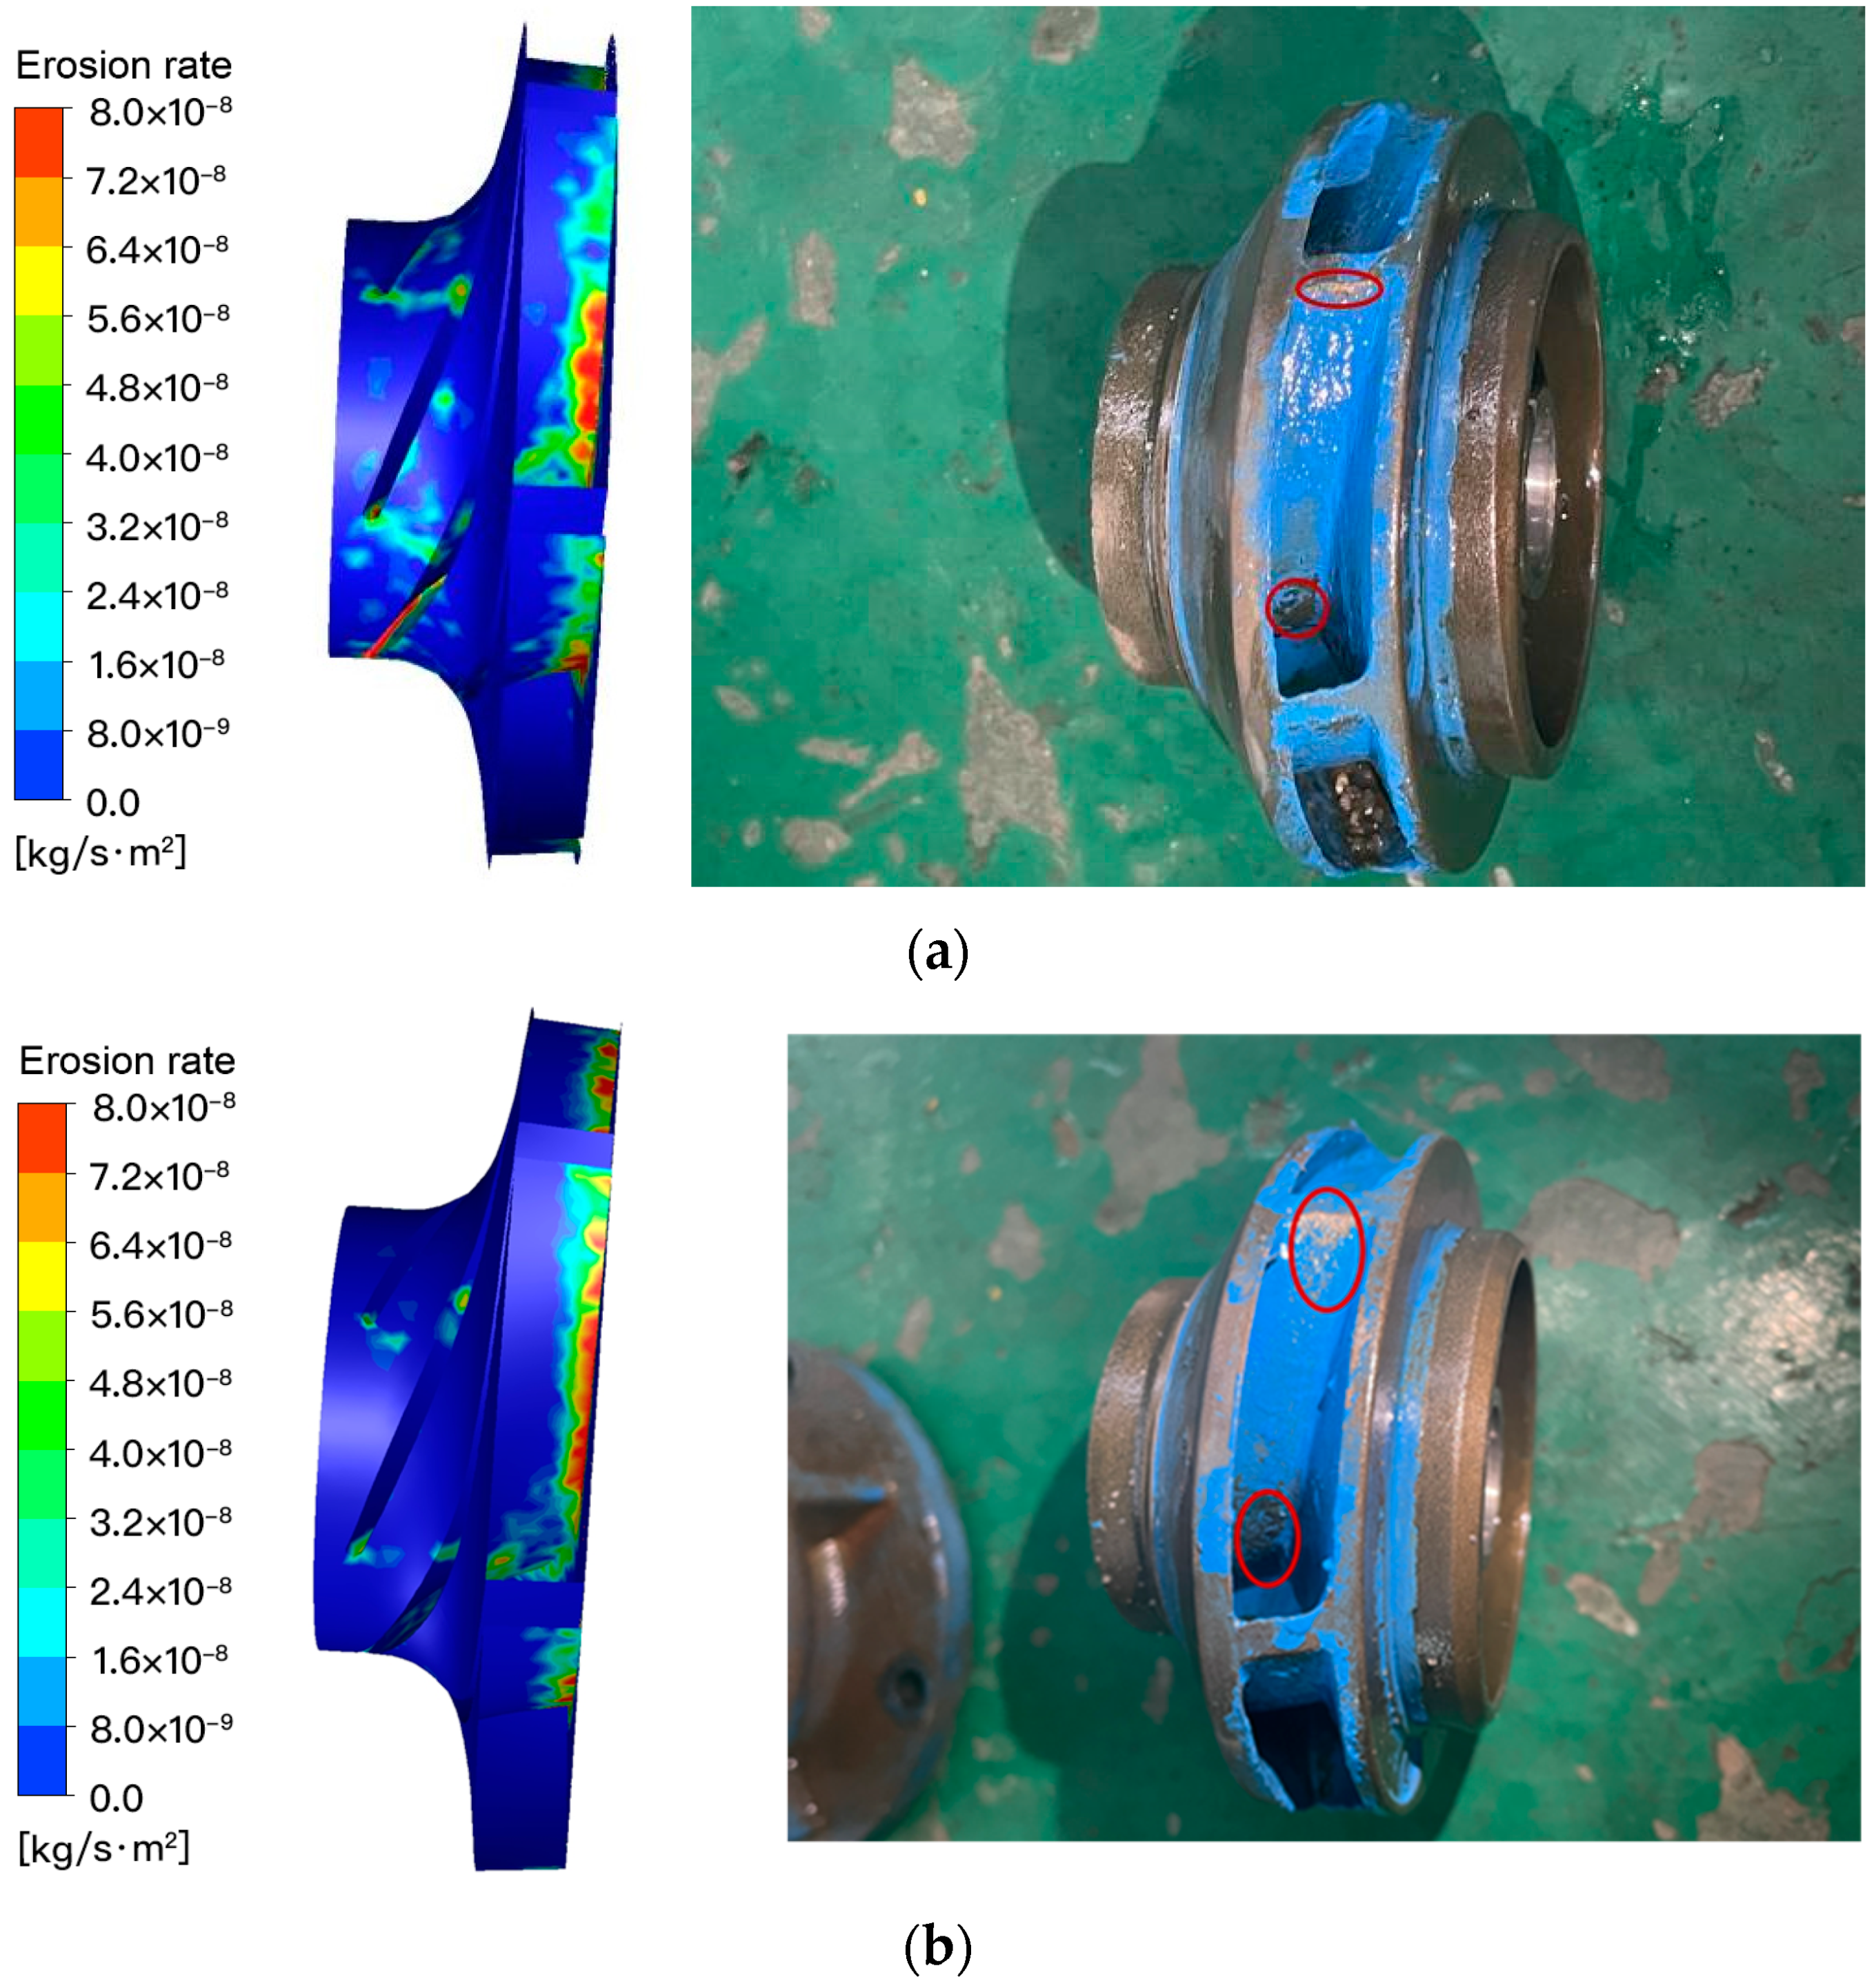
In the numerical calculation of the erosion characteristics of the test pump under low flow conditions, the calculation results of the state of the erosion area of the first stage impeller and the secondary impeller of the test pump were obtained, and the test results were compared and analyzed, as shown in Figure 30.
It can be seen from Figure 30a,b that under the erosion and damage of solid phase particles, the surface erosion of the impeller blade was mainly concentrated in the vicinity of the blade inlet and the blade outlet. On the inlet side of the blade, the solid phase particles entered the inlet of the impeller in the axial direction, and the speed direction transitioned from the axial direction to the radial direction driven by the rotation of the impeller. The erosion and damage were serious here. The erosion near the blade outlet was mainly due to the increase of the kinetic energy of the particles under the work of the impeller, and the tangential component of the velocity at the impeller outlet reached the maximum, which intensified the erosion of the blade outlet edge, where the erosion form was mainly abrasive erosion.
In addition, compared with the first-stage impeller, at the same surface position, the surface erosion of the secondary impeller was higher than that of the first-stage impeller, because the kinetic energy of the particles was further increased after the particles were energized by the two-stage impeller, and the impact speed on the blade surface was greater.

5.2.2. Rated Flow Conditions

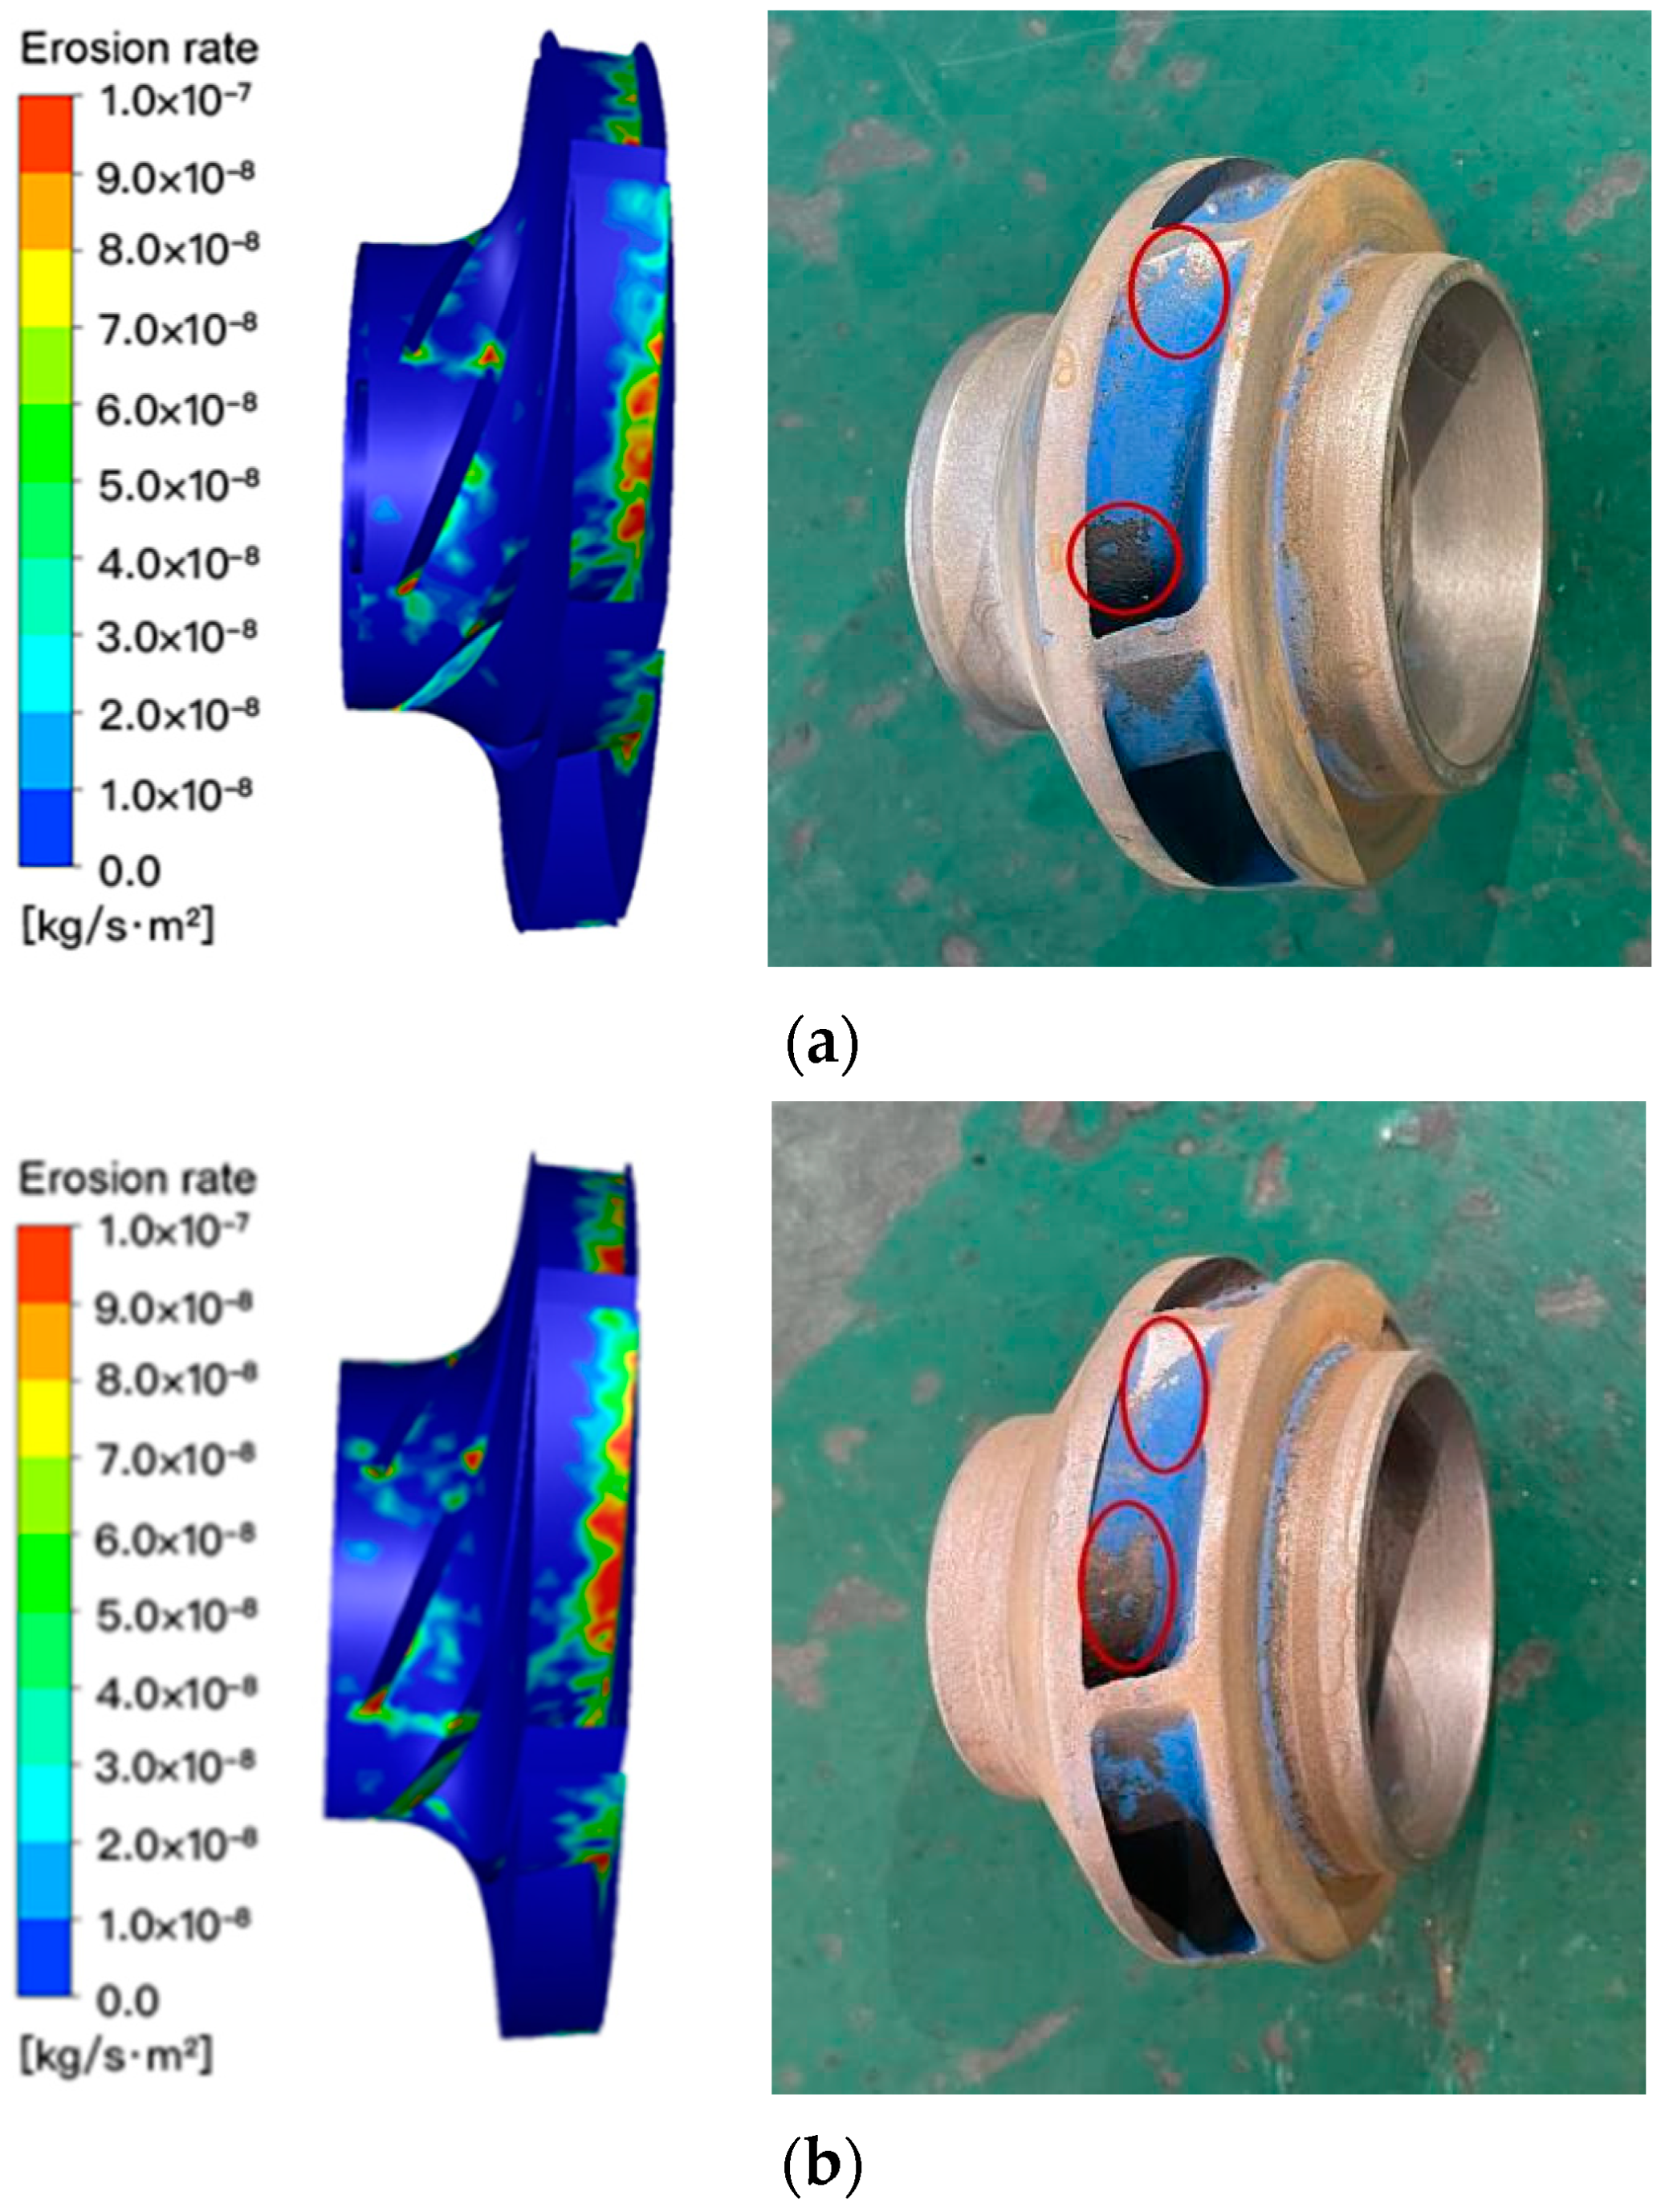
The erosion area at the first- and second-stage impellers of the experimental pump were simulated under rated flow conditions, and the results obtained were compared to the experimental results, as shown in Figure 31.
At the impellers (Figure 31a,b), surface erosion mainly occurred near their leading edge (LE) and trailing edge (TE). At the LE, solid particles moved in the axial direction into the impeller LE, and the rotations of the impeller resulted in their corresponding velocity changing from axial to radial. Consequently, this change resulted in high impact angles and collisions with the LE, causing severe erosion at this location. The erosion at the TE was primarily because the work done by the impeller increased the kinetic energy of the particles, whose tangential velocity was maximal at the TE, thus exacerbating erosion at the TE. Moreover, the type of erosion that occurred here was mainly abrasive erosion. Furthermore, the erosion on the second-stage impeller’s surfaces was more eroded than that on the corresponding surfaces of the first-stage impeller because the particles experienced two rounds of acceleration by the second stage, and the resulting increase in particle kinetic energy also increased impact damage on the surfaces of the second-stage impeller’s blades.

5.2.3. Large Flow Conditions

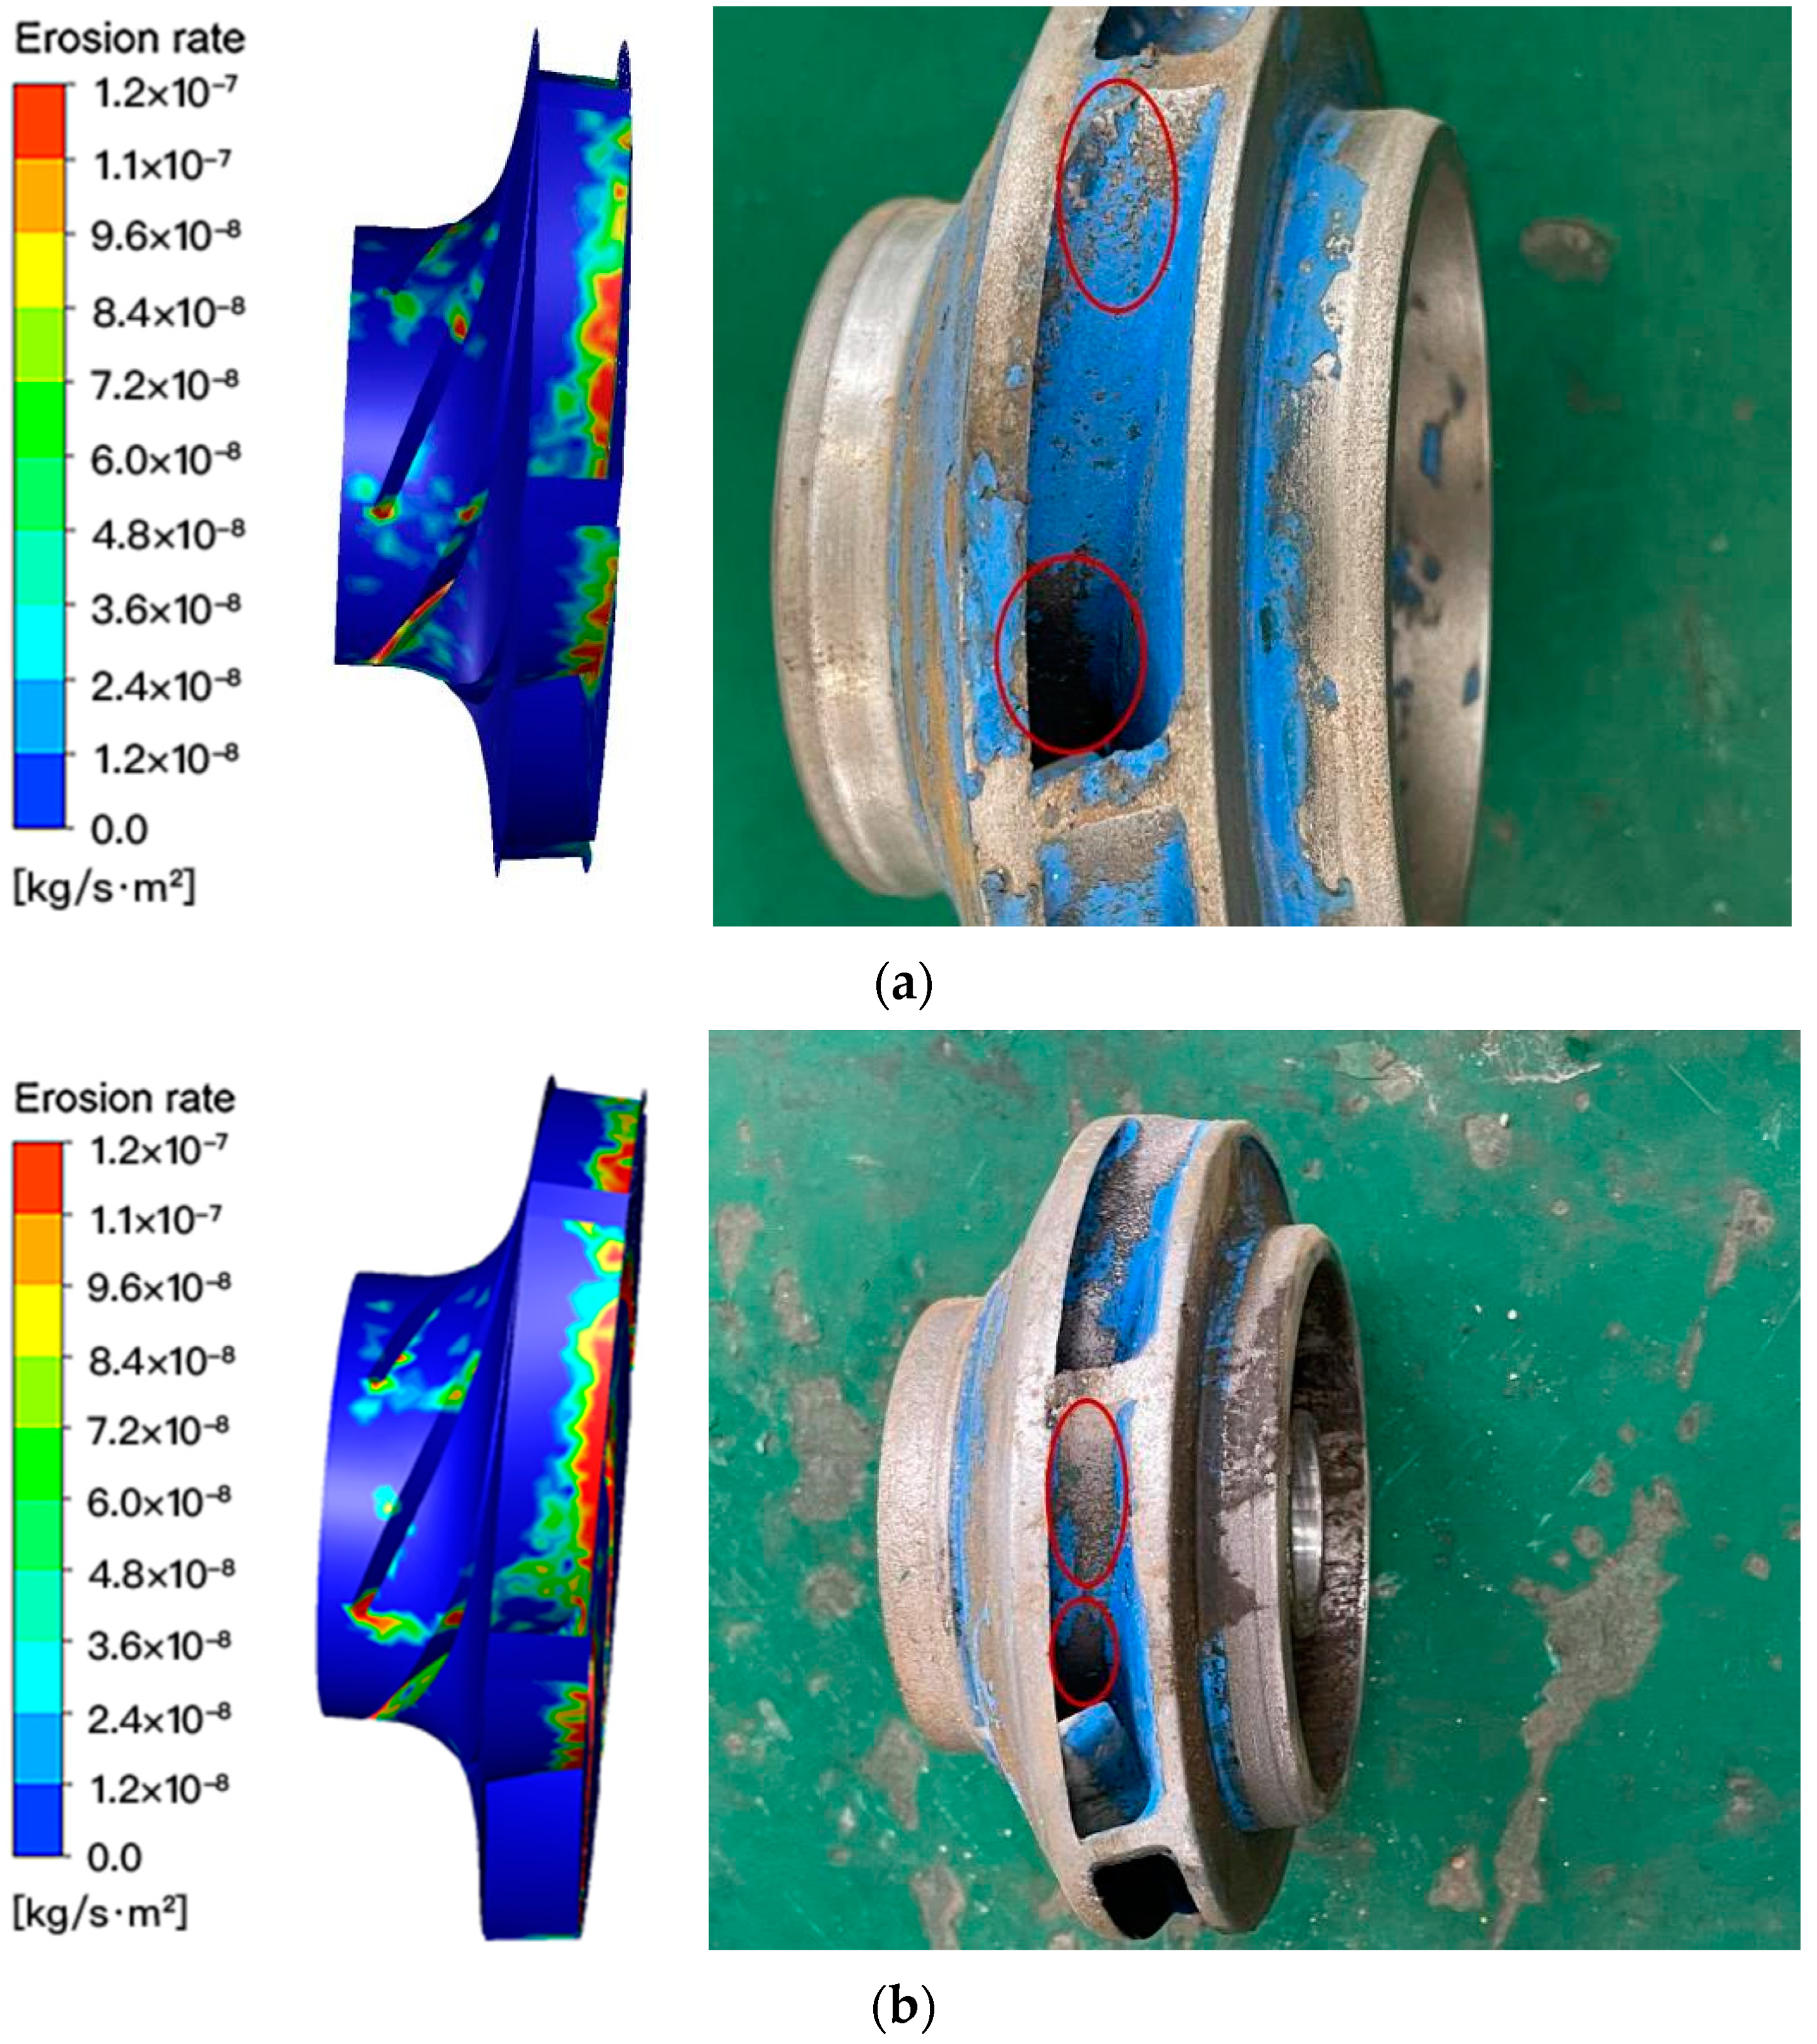
In the numerical calculation of the wear characteristics of the test pump under large flow conditions, the calculation results of the state of the erosion area of the first stage impeller and the secondary impeller of the test pump were obtained, and the test results were compared and analyzed, as shown in Figure 32.
It can be seen from Figure 32a,b that the erosion of the surfaces of the first-stage impeller and the secondary impeller was very serious, especially the secondary impeller, when the particle velocity increased with the increase of the flow rate. The rear cover plate of the impeller collided several times, resulting in increased erosion there.
Combining the comparison results under the three flow conditions, the experimental erosion results and the numerical simulation erosion results are in good agreement, which shows that the numerical calculation method and model in this paper are accurate, and they can accurately predict the flow characteristics and hydraulic performance of deep-sea mining pumps.

6. Conclusions

Factors such as particle size, concentration, and density affect the pressure, velocity, and particle movement trajectory inside a deep-sea mining pump. The larger the particle size, the larger the low-speed area, the more turbulent the flow, and the smaller the velocity fluctuation in particle movement trajectories at the pump inlet. The higher the particle concentration, the more the fluid pressure and velocity increase (gradually) from the pump inlet to the outlet, the particle movement trajectories in the impellers and the space vane guides becoming increasingly turbulent. The smaller the particle density, the longer the particle movement trajectories in the flow passage.
In terms of the influence of different operating conditions, a small flow rate leads to relatively large fluctuations in pressure and velocity in the pump. Regardless of the flow rate, the particles show two clear acceleration processes in the impellers, their velocity decreasing after entering the space guide vanes. As the flow rate decreases, the flow becomes more turbulent. The larger the rotational speed, the more turbulent the internal flow of the pump with particles exhibiting circumferential motion.
In terms of the influence on pump performance, as the particle size and concentration increase, both the RH and RE increase, the particle density having a relatively small influence on the pump performance. As the flow rate increases, the pump head decreases, and pump efficiency increases. Thus, when the flow rate is small, the pump efficiency is relatively low. When the rotational speed is below or above the rated value, the influence on pump performance is relatively large. The lower the rotational speed, the larger the RH; the larger the rotational speed, the larger the RE.
The experimentally obtained curves of RH and RE show good agreement with the numerical analysis results, showing the numerical analysis and pump performance test results to be reasonable.
The method validation test results show that the SST k-ω model and the DPM model can accurately predict the flow characteristics and hydraulic performance of deep-sea mining pumps and provide a reliable model for the study of the internal flow characteristics of deep-sea mining pumps.

Author Contributions

Conceptualization, S.H.; methodology, S.H. and X.H.; software, S.H.; validation, S.H.; formal analysis, S.H.; investigation, S.H.; resources, S.H. and X.H.; data curation, S.H.; writing—original draft preparation, S.H.; writing—review and editing, S.H. and X.H.; visualization, S.H.; supervision, S.H.; project administration, S.H.; funding acquisition, X.H. All authors have read and agreed to the published version of the manuscript.

Funding

This work was supported by the National Key Research and Development Project of China, grant number2016YFC0304103.

Institutional Review Board Statement

Not applicable.

Informed Consent Statement

Not applicable.

Data Availability Statement

Not applicable.

Acknowledgments

This work was supported by National Key Research and Development Project of China (2016YFC0304103).

Conflicts of Interest

The authors declare no conflict of interest.

Nomenclature

Cvparticle volume concentrationp1inlet pressure of the pump
dpparticle diameterp2outlet pressure of the pump
eNnormal recovery coefficientQpump inlet flow rate
eTtangential recovery coefficientQdrated flow rate
fAC frequencyR0the motor DC wire resistances after the no-load tests
FPadditional force induced by pressure gradientR1the motor DC wire resistances after the load tests
FVadditional mass forceRHreduced head
FXforce in the x-directionReReynolds number
ggravitational accelerationREreduced efficiency
gxacceleration of gravity in x-axis directionupparticle velocity
Hhead for pumpv1inlet velocity of the pump
Hsingle-stage headv2outlet velocity of the pump
Hmhead for transporting two-phase flowβcomprehensive coefficient
Hphead values for the actual pumpηefficiency for pump
Hrhead variation coefficientηmefficiency for transporting two-phase flow
Hwhead for transporting pure waterηr efficiency variation coefficient
I1the measured current under a loadηwefficiency for transporting pure water
nrotational speedθcollision angle
n0synchronous speed of the motorμdynamic viscosity
nmshaft rotational speeds of model pumpρfluid density
npshaft rotational speeds of actual pumpρpparticle density
Pshaft powerυdynamic viscosity of fluid
P0the measured under no-load power
P1the measured under load power

References

  1. Yu, H.Y.; Liu, S.J. Dynamics of vertical pipe in deep-ocean mining system. J. Cent. South Univ. Technol. 2007, 14, 552–556. [Google Scholar] [CrossRef]
  2. Zou, W.S.; Li, Z.H.; Chen, A.L. Lifting motor pump in deep sea mining. J. Cent. South Univ. Nat. Sci. Ed. 2011, 42, 221–225. [Google Scholar]
  3. Mortazavi, F.; Riasi, A.; Nourbakhsh, S.A. Numerical investigation of back vane design and its impact on pump performance. J. Fluids Eng. 2017, 139, 121104. [Google Scholar] [CrossRef]
  4. Engin, T.; Gur, M.; Calli, I. Slurry and tip clearance effects on the performance of an open impeller centrifugal pump. Handb. Powder Technol. 2001, 10, 499–504. [Google Scholar]
  5. Bai, L.; Zhou, L.; Han, C.; Zhu, Y.; Shi, W. Numerical study of pressure fluctuation and unsteady flow in a centrifugal pump. Processes 2019, 7, 354. [Google Scholar] [CrossRef] [Green Version]
  6. Huang, S.; Huang, J.; Mo, Y.; Zhang, Z. Study on wear properties of the flow parts in a centrifugal pump based in EDEM-Fluent coupling. J. Eng. Therm. Energy Power 2019, 7, 431. [Google Scholar] [CrossRef] [Green Version]
  7. Zhou, L.; Wang, W.; Hang, J.; Shi, W.; Yan, H.; Zhu, Y. Numerical investigation of a high-speed electrical submersible pump with different end clearances. Water 2020, 12, 1116. [Google Scholar] [CrossRef] [Green Version]
  8. Minemura, K.; Zhong, Y.; Uchiyama, T. Numerical Prediction of Erosion Wear on Pump Casing under Solid-Water Two-Phase Flow Conditions. Multiph. Flow 1995, 61, 2571–2578. [Google Scholar] [CrossRef] [Green Version]
  9. Wang, J.; Jiang, W.; Kong, F.; Qu, X.; Su, X. Numerical simulation of solid-liquid two-phase flow field in centrifugal pump based on particle model. J. Drainage Irrigat. Mach. Eng. 2013, 31, 846–850+878. [Google Scholar]
  10. Gandhi, B.K.; Singh, S.N.; Seshadri, V. Prediction of performance characteristics of a centrifugal slurry pump handling clear liquid. Indian J. Eng. Mater. Sci. 1998, 5, 91–96. [Google Scholar]
  11. Peng, G.J.; Fan, F.Y.; Zhou, L.; Huang, X.; Ma, J. Optimal hydraulic design to minimize erosive wear in a centrifugal slurry pump impeller. Eng. Fail. Analysis 2021, 120, 105105. [Google Scholar] [CrossRef]
  12. Tarodiya, R.; Gandhi, B.K. Effect of particle size distribution on performance and particle kinetics in a centrifugal slurry pump handling multi-size particulate slurry. Adv. Powder Technol. 2020, 31, 4751–4767. [Google Scholar] [CrossRef]
  13. Gandhi, B.K.; Singh, S.N.; Seshadri, V. Effect of speed on the performance characteristics of a centrifugal slurry pump. J. Hydraul. Eng. 2002, 182, 225–233. [Google Scholar] [CrossRef]
  14. Zarya, A.N. The effect on the solid phase of a slurry on the head developed by a centrifugal pump. Fluid Mech. Sov. Res. 1975, 4, 144–154. [Google Scholar]
  15. Wang, Z.; Qian, Z. Effects of concentration and size of silt particles on the performance of a double-suction centrifugal pump. Energy 2017, 123, 36–46. [Google Scholar] [CrossRef]
  16. Gahlot, V.K.; Seshadri, V.; Malhotra, R.C. Effect of density, size distribution, and concentration of solid on the characteristics of centrifugal pumps. ASME J. Fluids Eng. 1992, 114, 386. [Google Scholar] [CrossRef]
  17. Sellgren, A.; Addie, G.; Scott, S. The effect of sand-clay slurries on the performance of centrifugal pumps. Can. J. Chem. Eng. 2000, 78, 764–769. [Google Scholar] [CrossRef]
  18. Li, Y.; Zhu, Z.; He, W.; He, Z. Numerical simulation and experimental research on the influence of solid-phase characteristics on centrifugal pump performance. Chin. J. Mech. Eng. 2012, 25, 1184–1189. [Google Scholar] [CrossRef]
  19. Serrano, R.O.P.; Ferreira, A.G., Jr.; Castro, A.L.P.; Santos PA, B.V.; Menezes, M.V.; Martinez, C.B. Desgaste do rotor por abrasão: O efeito do bombeamento de água bruta com diferentes cargas de sedimento. In Proceedings of the XXVII Congreso Latinoamericano de Hidráulica, Lima, Peru, 26–30 September 2016; p. 9. [Google Scholar]
  20. Zhao, J. Experimental study on the effect of solid materials on the performance of centrifugal pumps. J. Tsinghua Univ. (Natl. Sci. Ed.) 1986, 1, 91–99. [Google Scholar]
  21. Jeon, S.Y.; Kim, C.K.; Lee, S.M.; Yoon, J.-Y.; Jang, C.-M. Performance enhancement of a pump impeller using optimal design method. J. Therm. Sci. 2017, 26, 119–124. [Google Scholar] [CrossRef]
  22. Tarodiya, R.; Gandhi, B.K. Numerical simulation of a centrifugal slurry pump handling solid-liquid mixture: Effect of solids on flow field and performance. Adv. Powder Technol. 2019, 30, 2225–2239. [Google Scholar] [CrossRef]
  23. Tarodiya, R.; Gandhi, B.K. Hydraulic performance and erosive wear of centrifugal slurry pumps—A review. Powder Technol. 2017, 305, 27–38. [Google Scholar] [CrossRef]
  24. Kadambi, J.R.; Charoenngam, P.; Subramanian, A.; Wernet, M.P.; Sankovic, J.M.; Addie, G.; Courtwright, R. investigations of particle velocities in a slurry pump using PIV: Part 1, the tongue and adjacent channel flow. J. Energy Res. Technol. 2004, 126, 271–278. [Google Scholar] [CrossRef]
  25. Kumar, S.; Gandhi, B.K.; Mahapatra, S.K. Investigation on centrifugal slurry pump performance with variation of operating speed. Int. J. Mech. Mater. Eng. 2013, 8, 40–47. [Google Scholar]
  26. Bai, L.; Zhou, L.; Jiang, X.; Pang, Q.; Ye, D. Vibration in a multistage centrifugal pump under varied conditions. Shock. Vib. 2019, 2019, 2057031. [Google Scholar] [CrossRef]
  27. Dong, X.; Zhang, H.L.; Wang, X.Y. Finite element analysis of wear for centrifugal slurry pump. Procedia Earth Planet. Sci. 2009, 1, 1532–1538. [Google Scholar]
  28. Noon, A.A.; Kim, M.H. Erosion wear on centrifugal pump casing due to slurry flow. Wear 2016, 364, 103–111. [Google Scholar] [CrossRef]
  29. Shen, Z.J.; Chu, W.; Li, X.J.; Dong, W. Sediment erosion in the impeller of a double-suction centrifugal pump-A case study of the Jingtai Yellow River Irrigation Project. Wear 2019, 422, 269–279. [Google Scholar] [CrossRef]
  30. Song, X.J.; Yao, R.; Shen, Y.B.; Bi, H.; Zhang, Y.; Du, L.; Wang, Z. Numerical Prediction of Erosion Based on the Solid-Liquid Two-Phase Flow in a Double-Suction Centrifugal Pump. J. Mar. Sci. Eng. 2021, 9, 836. [Google Scholar] [CrossRef]
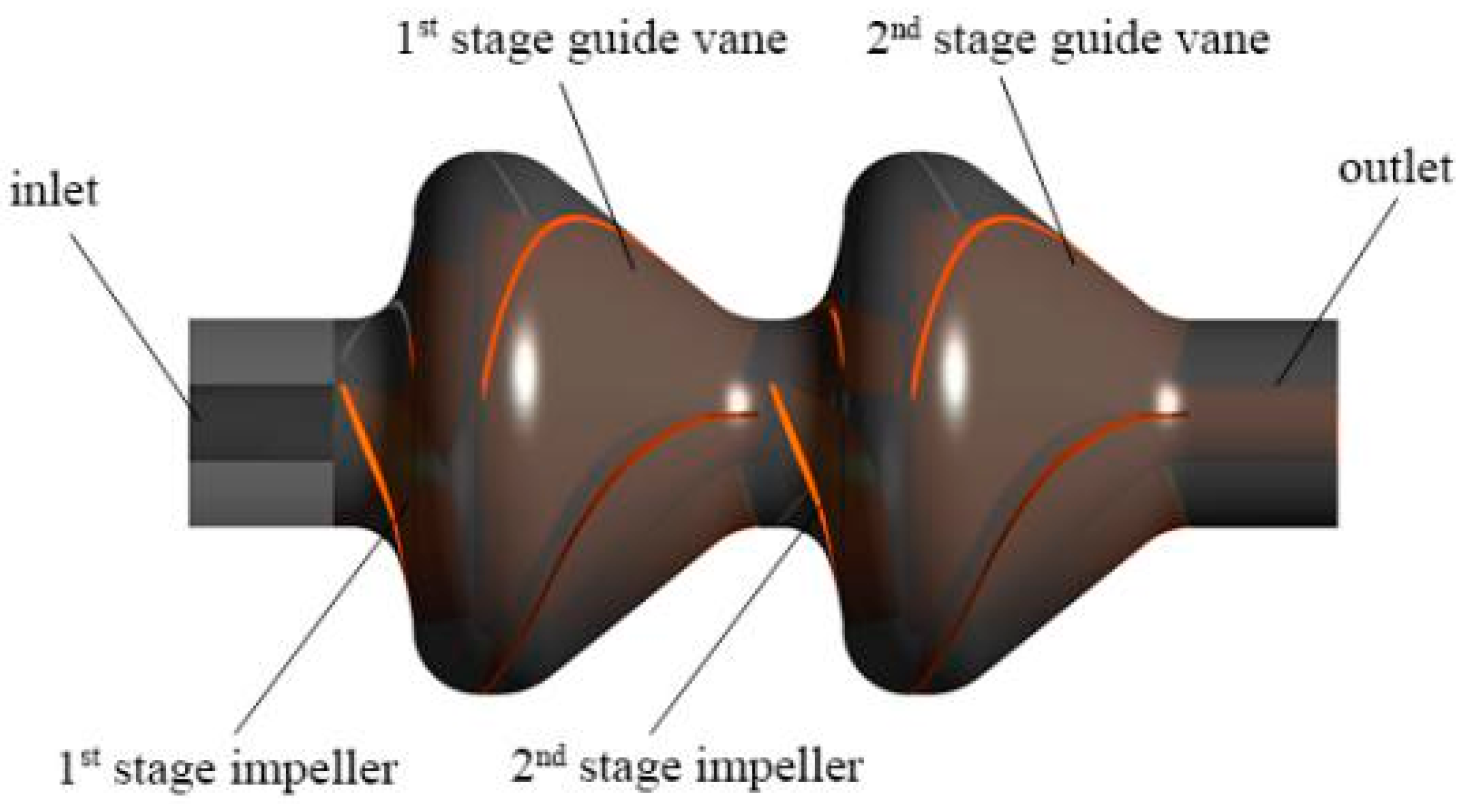
Figure 1. Structure model diagram of mining pump.
Jmse 10 00363 g001
Figure 2. Model pump computational domain meshes.
Jmse 10 00363 g002
Figure 3. Pressure distribution on first-stage impeller-guide vane B2B view: (a) dp = 3 mm; (b) dp = 6 mm; (c) dp = 10 mm; (d) dp = 14 mm; (e) dp = 17 mm; (f) dp = 20 mm.
Jmse 10 00363 g003
Figure 4. Velocity distribution on first-stage impeller-guide vane B2B view: (a) dp = 3 mm; (b) dp = 6 mm; (c) dp = 10 mm; (d) dp = 14 mm; (e) dp = 17 mm; (f) dp = 20 mm.
Jmse 10 00363 g004
Figure 5. Particle movement trajectories in the calculation domain: (a) dp = 3 mm; (b) dp = 6 mm; (c) dp = 10 mm; (d) dp = 14 mm; (e) dp = 17 mm; (f) dp = 20 mm.
Jmse 10 00363 g005
Figure 6. Influence of different solid-phase particle sizes on pump performance.
Jmse 10 00363 g006
Figure 7. Pressure distribution on first-stage impeller-guide vane B2B view: (a) Cv = 4%; (b) Cv = 7.5%; (c) Cv = 11.5%.
Jmse 10 00363 g007
Figure 8. Velocity distribution on first-stage impeller-guide vane B2B view: (a) Cv = 4%; (b) Cv = 7.5%; (c) Cv = 11.5%.
Jmse 10 00363 g008
Figure 9. Particle movement trajectories in the calculation domain; (a) Cv = 4%; (b) Cv = 7.5%; (c) Cv = 11.5%.
Jmse 10 00363 g009
Figure 10. Influence of different particle concentrations on pump performance.
Jmse 10 00363 g010
Figure 11. Pressure distribution on first-stage impeller-guide vane B2B view. (a) 1400 kg/m3; (b) 1900 kg/m3; (c) 2800 kg/m3.
Jmse 10 00363 g011
Figure 12. Velocity distribution on first-stage impeller-guide vane B2B view: (a) 1400 kg/m3; (b) 1900 kg/m3; (c) 2800 kg/m3.
Jmse 10 00363 g012
Figure 13. Single particle movement trajectory in the calculation domain: (a) 1400 kg/m3; (b) 1900 kg/m3; (c) 2800 kg/m3.
Jmse 10 00363 g013
Figure 14. Influence of different particle densities on pump performance.
Jmse 10 00363 g014
Figure 15. Pressure distribution on first-stage impeller-guide vane B2B view: (a) 0.68 Qd; (b) 1.0 Qd; (c) 1.33 Qd.
Jmse 10 00363 g015aJmse 10 00363 g015b
Figure 16. Velocity distribution on first-stage impeller-guide vane B2B view: (a) 0.68 Qd; (b) 1.0 Qd; (c) 1.33 Qd.
Jmse 10 00363 g016
Figure 17. Particle movement trajectories in the calculation domain: (a) 0.68 Qd; (b) 1.0 Qd; (c) 1.33 Qd.
Jmse 10 00363 g017aJmse 10 00363 g017b
Figure 18. Influence of different inlet flow rates on pump performance.
Jmse 10 00363 g018
Figure 19. Pressure distribution on first-stage impeller-guide vane B2B view: (a) n = 900 r/min; (b) n = 1450 r/min; (c) n = 1800 r/min.
Jmse 10 00363 g019
Figure 20. Velocity distribution on first-stage impeller-guide vane B2B view: (a) n = 900 r/min; (b) n = 1450 r/min; (c) n = 1800 r/min.
Jmse 10 00363 g020
Figure 21. Particle movement trajectories in the calculation domain: (a) n = 900 r/min; (b) n = 1450 r/min; (c) n = 1800 r/min.
Jmse 10 00363 g021
Figure 22. Influence of different rotational speeds on pump performance.
Jmse 10 00363 g022
Figure 23. Schematic of the mining pump testing system.
Jmse 10 00363 g023
Figure 24. Test site: (a) mining pump test bench; (b) measurement and control system; (c) test particles.
Jmse 10 00363 g024
Figure 25. Performance curves of the mining pump under thirteen flow conditions: (a) flow-head curve; (b) flow-efficiency curve; (c) flow-shaft power curve.
Jmse 10 00363 g025aJmse 10 00363 g025b
Figure 26. Test pump.
Jmse 10 00363 g026
Figure 27. Test system diagram: 1—test pump (including motor); 2—test pump support mechanism; 3—flow meter; 4—outlet pipe; 5—return pipe; 6-regulating valve; 7—return pipe support member; 8—cable terminal; 9—cable fixing component; 10—water tank; 11—anti-submersible pump swing component.
Jmse 10 00363 g027
Figure 28. Comparison diagram of impeller runner before and after applying water-based paint: (a) before painting; (b) after painting.
Jmse 10 00363 g028
Figure 29. Test site: (a) test pump installation; (b) test process diagram.
Jmse 10 00363 g029
Figure 30. Comparison of numerical calculation results and test results of the erosion area under low flow conditions: (a) first stage impeller; (b) secondary impeller.
Jmse 10 00363 g030
Figure 31. Comparison of numerical calculation results and test results of the erosion area under rated flow conditions: (a) first stage impeller; (b) secondary impeller.
Jmse 10 00363 g031
Figure 32. Comparison of numerical calculation results and test results of the erosion area under large flow conditions: (a) first stage impeller; (b) secondary impeller.
Jmse 10 00363 g032
Table 1. Geometric parameters of model pump impeller.
ParameterValue
ImpellerInlet diameter/mm216.8
Outlet diameter/mm440
No. of blades3
Blade wrap angle/°140
Outlet placement angle/°28
Outlet width/mm61
Outlet inclination angle/°10
Table 2. Numerical calculation scheme settings.
ParameterUnitValue
Particle diameter dpmm3, 6, 10, 14, 17, 20
Particle volume concentration Cv%4, 7.5, 11.5
Particle density ρkg/m31400, 1900, 2800
Inlet flow rate Q/Qd/0.68, 1.0, 1.33
Rotational speeds nrpm900, 1450, 1800
Publisher’s Note: MDPI stays neutral with regard to jurisdictional claims in published maps and institutional affiliations.