Article

Scour Characteristics and Equilibrium Scour Depth Prediction around a Submarine Piggyback Pipeline

1
College of Environmental Science and Engineering, Ocean University of China, Qingdao 266000, China
2
Key Lab of Marine Environment and Ecology (Ocean University of China), Ministry of Education, Qingdao 266000, China
3
Key Laboratory of Shandong Province for Marine Environment and Geological Engineering (Ocean University of China), Qingdao 266000, China
*
Author to whom correspondence should be addressed.
J. Mar. Sci. Eng. 2022, 10(3), 350; https://doi.org/10.3390/jmse10030350
Submission received: 30 January 2022 / Revised: 22 February 2022 / Accepted: 23 February 2022 / Published: 2 March 2022
(This article belongs to the Section Ocean Engineering)

Abstract

:
Local scour around a submarine piggyback pipeline in combined waves and current is investigated experimentally. Based on the experimental results, the scour evolution and scour morphology are firstly analyzed. Then, a comparison with the equilibrium scour depth Seq between the present experimental data and predicted results is conducted. After that, the correlation between the dimensionless scour timescale T* and the maximum Shields parameter θcw is investigated, and a formula is obtained to describe the variation trend between T* and θcw for different gap ratios G/D. Furthermore, the parametric study is carried out to study the effects of Reynolds number Red and θcw on Seq, respectively. The results indicate that the Seq below the piggyback pipeline increases when the gap ratio G/D increases from 0 to 0.1, and it gradually decreases when G/D > 0.1. For a given KC, the Seq increases with the increase of the ratio of velocities Ucw. In addition, when Ucw is fixed, a higher KC results in a greater Seq. The T* is closely related to θcw and G/D. The higher Red and θcw both tend to result in the greater scour depth below a piggyback pipeline in combined waves and current.

1. Introduction

Submarine pipelines are vital for transporting oil, natural gas, wastewater, and hydrocarbons in ocean engineering. Recently, a new type of submarine pipeline, called a piggyback pipeline, has been widely adopted in offshore engineering due to technical and economical purposes [1,2,3]. The piggyback pipeline is usually made up of a large (or main) pipeline and a small pipeline with the small one being installed directly above the large one. The large pipeline usually carries gas, oil, and other liquids, while the small pipeline transports monitoring signals and oil displacement material [1]. Because the piggyback pipeline has several advantages over the conventional single pipeline, it has been utilized widely in practice engineering, such as the offshore oil fields in the Bohai Sea, China [4]. When a pipeline is placed on an originally plane seabed, local scour occurs around the pipeline due to the action of waves and tidal current [5,6]. The scour will lead to some serious challenges, such as pipeline damage and oil or gas leakage, which causes serious economic losses and catastrophic seawater pollution for marine environments [7,8]. Thus far, extensive studies have been conducted experimentally and numerically on the local scour below a single pipeline in waves, current, and combined waves and current [9,10,11,12,13,14].
The onset of scour below a pipeline is primarily caused by seepage due to the pressure difference between the upside and downside of the pipeline, so the piping is the dominant cause of the initial scour [15]. Sumer et al. [9] carried out laboratory tests and videotaped the whole scour process underneath a pipeline, indicating that the horseshoe vortexes and wake vortexes facilitate the scour by dragging soil particles from the seabed. Lu et al. [16] investigated the scour mechanism around a pipeline by numerical simulation, and the results indicated that the piping beneath the pipeline promotes the initial scour simultaneously. However, the experiments conducted by Chiew [15] showed that without piping, the vortex alone is unable to cause tunnel scour below a pipeline. In wave-only conditions, the soil particles in the vicinity of a pipeline are easily dragged and mobilized by the shear stress than the conditions of current-only. Fredsøe et al. [17] conducted a series of scour tests around a single pipeline in waves, and the results instructed that the scour morphology is significantly influenced by the lee-wake vortex. What is more, the equilibrium scour depth Seq below the pipeline is closely related to the KC number. Liu et al. [18] built a numerical model to predict the maximum scour depth beneath a pipeline, finding that the larger wave height and greater wave period led to a greater scour depth. A group of numerical simulations conducted by Fuhrman et al. [19] indicated that the scour and backfilling process below a pipeline are obviously influenced if an extreme wave condition was introduced. Zhao et al. [20] studied the hydrodynamic characteristics and scour evolution around a pipeline in combined solitary waves and current based on a coupled numerical model. The results showed that the solitary waves govern the scour equilibrium state when the current is weak. Ahmad et al. [21] developed a group of numerical models to investigate the scour process beneath a pipeline under combined waves and current, indicating that for a given KC, a higher current velocity results in a greater scour depth.
For the piggyback pipeline, Zhao et al. [2] found that the scour morphology and scour depth below the pipeline are affected by the installation position of the small pipeline. Zhao and Cheng [22] established numerical models to simulate the scour process around a piggyback pipeline in a steady current, and the results indicated that the gap ratio G/D between two pipelines influences the process of lee-wake shedding, and there is only one vortex street behind the piggyback pipeline if the G/D is less than the critical gap ratio (G/D)cr. Yang et al. [23] found the scour depth below a piggyback pipeline is much greater than the case of a single pipeline under the same hydraulic conditions. Zang and Gao [24] conducted an investigation experimentally on local scour around a piggyback pipeline considering the vortex-induced vibration in a steady current. Through this test, the effects of gap ratio, pipeline diameter, and installation angle on scour depth were analyzed. Zhao et al. [25] adopted the laboratory experiments and numerical models to study the effects of gap ratio, inflow Reynolds number, and pipe diameter on the scour depth in a steady current. Based on the results of laboratory tests and numerical simulations for a traditional piggyback pipeline, Yang et al. [26] proposed a novel piggyback pipeline configuration, which can effectively decrease the pressure difference between the upside and downside of a pipeline, and consequently reduce scour depth. More recently, Yang et al. [27] examined and discussed the effects of a small pipeline on scour topography in the vicinity of a piggyback pipeline under a steady current by numerical simulation, indicating that the small pipeline installed at the upstream edge of the large pipeline leads to more serious scour.
Thus far, however, studies on the local scour around a piggyback pipeline in combined waves and current are limited. Hence, in the present study, a series of laboratory experiments are carried out to investigate the scour morphology, scour depth, and scour timescale around a piggyback pipeline in combined waves and current. Based on experimental results, the scour evolution and scour morphology around a piggyback pipeline are firstly analyzed. Then, a comparison with the equilibrium scour depth Seq between the present experimental data and the predicted results from Sumer and Fredsøe [28] is conducted. After that, the correlation between the dimensionless scour timescale T* and the maximum Shields parameter θcw is investigated, and a formula is obtained to describe the behavior between T* and θcw for different gap ratios. Furthermore, the parametric study is carried out to study the effects of Reynolds number Red and θcw on Seq, respectively. Finally, the local scour below the piggyback pipeline is remarked upon and discussed comprehensively.

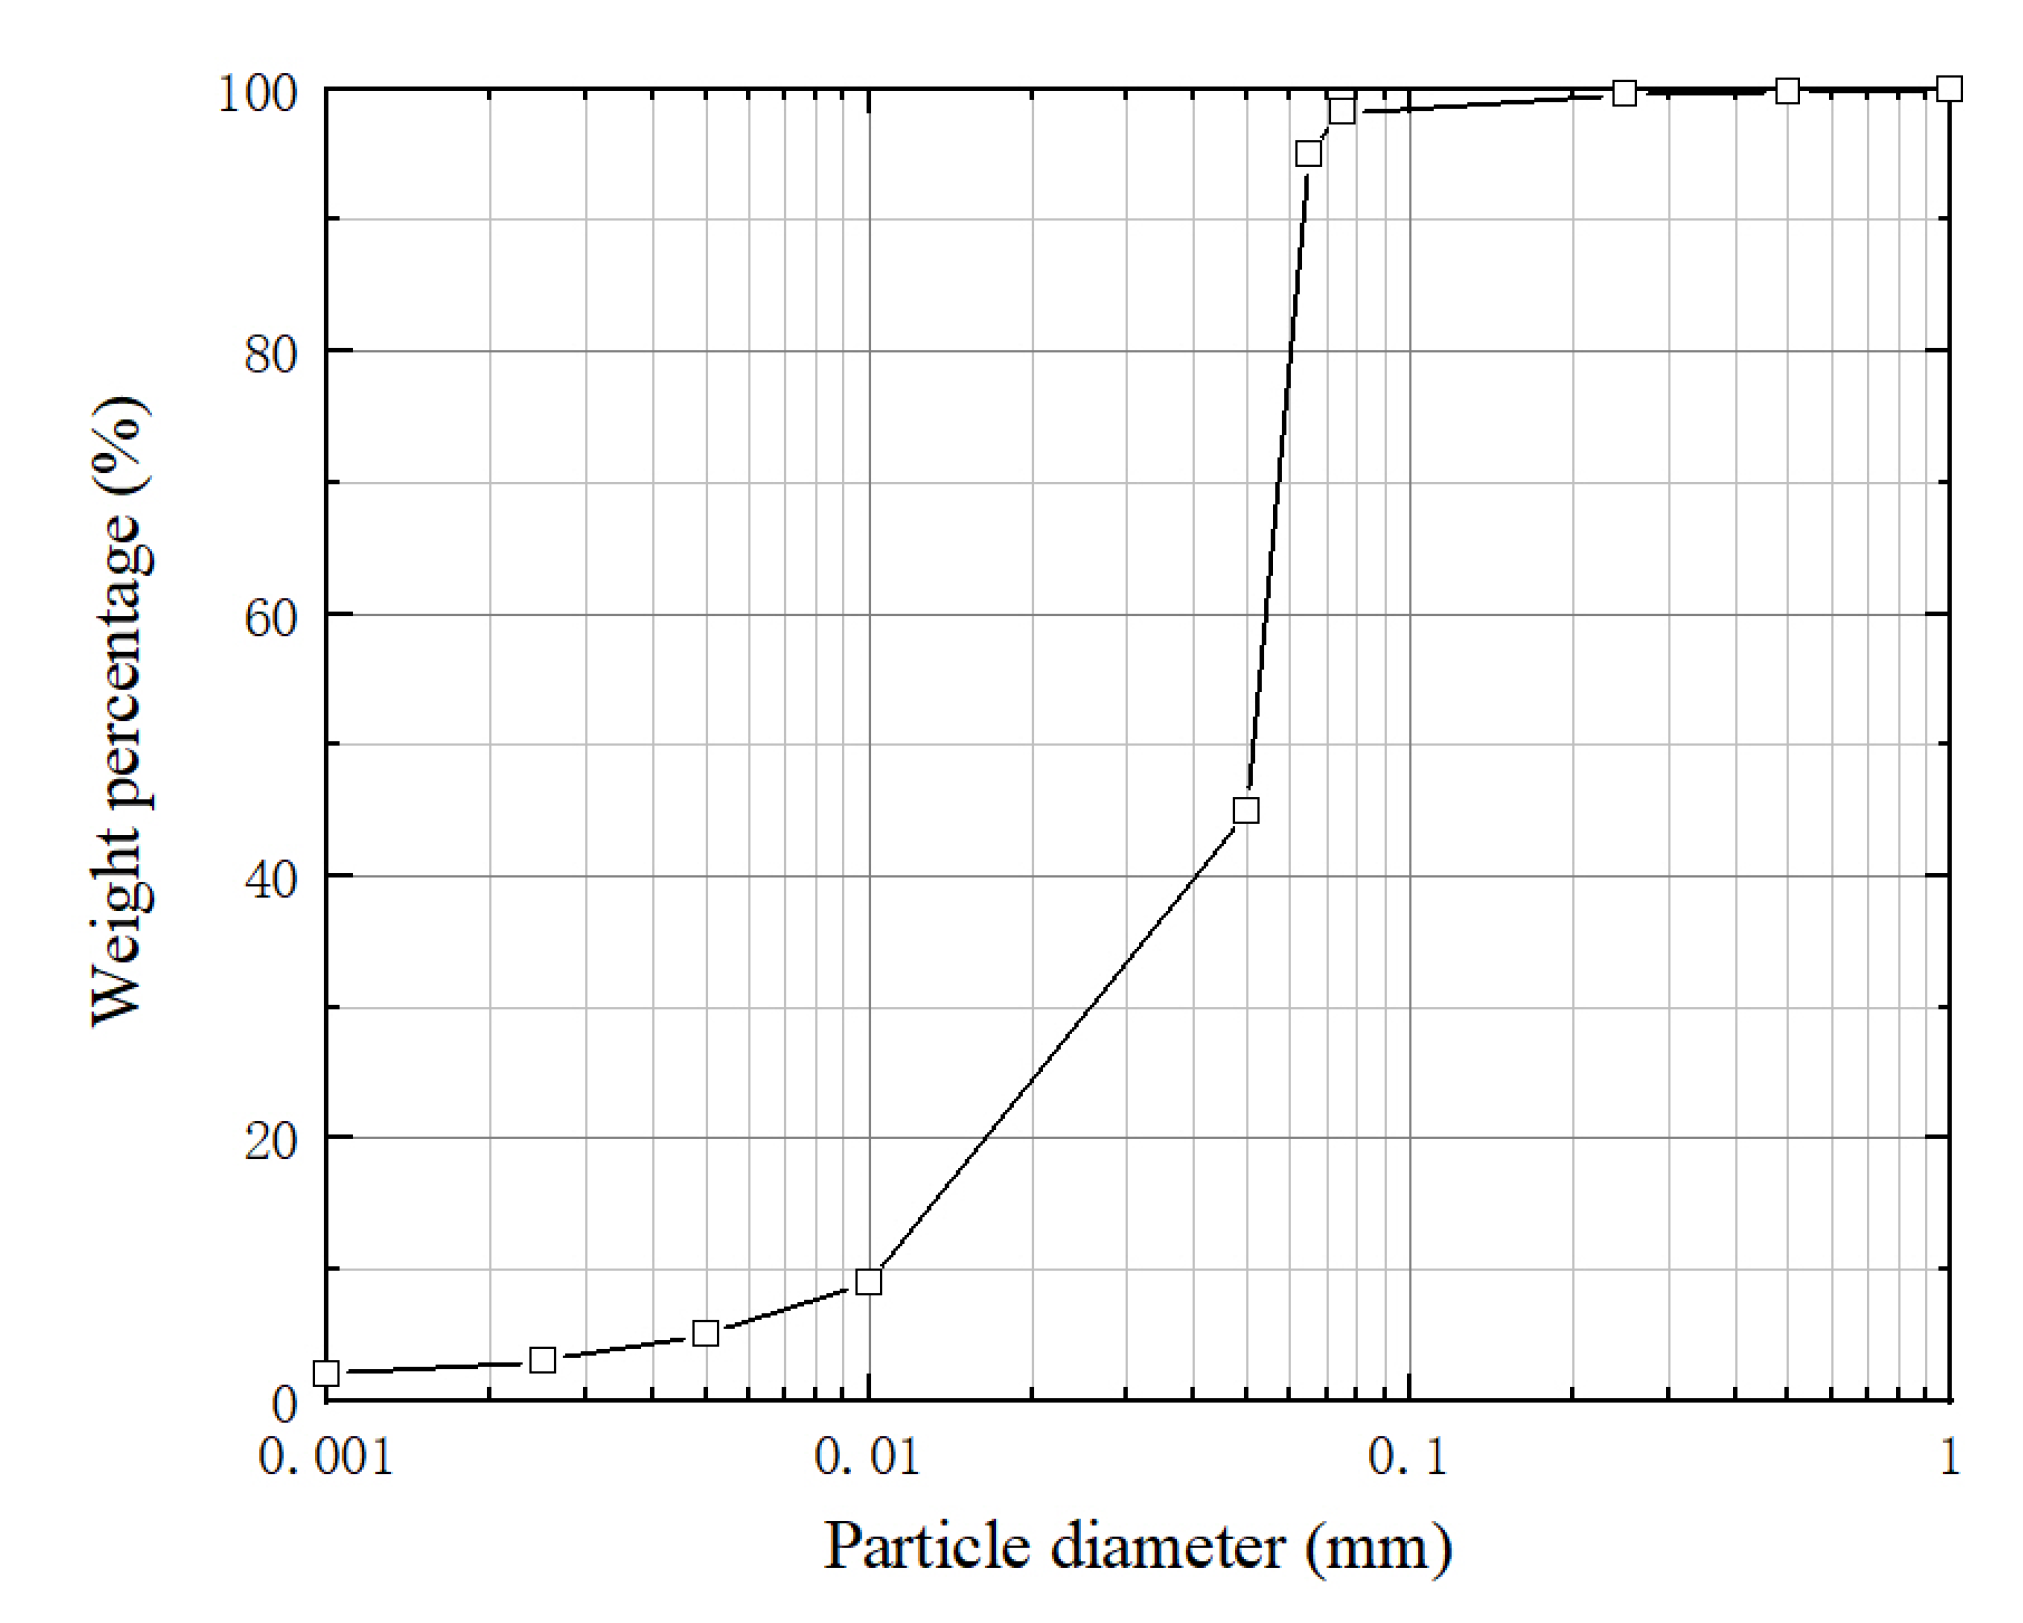
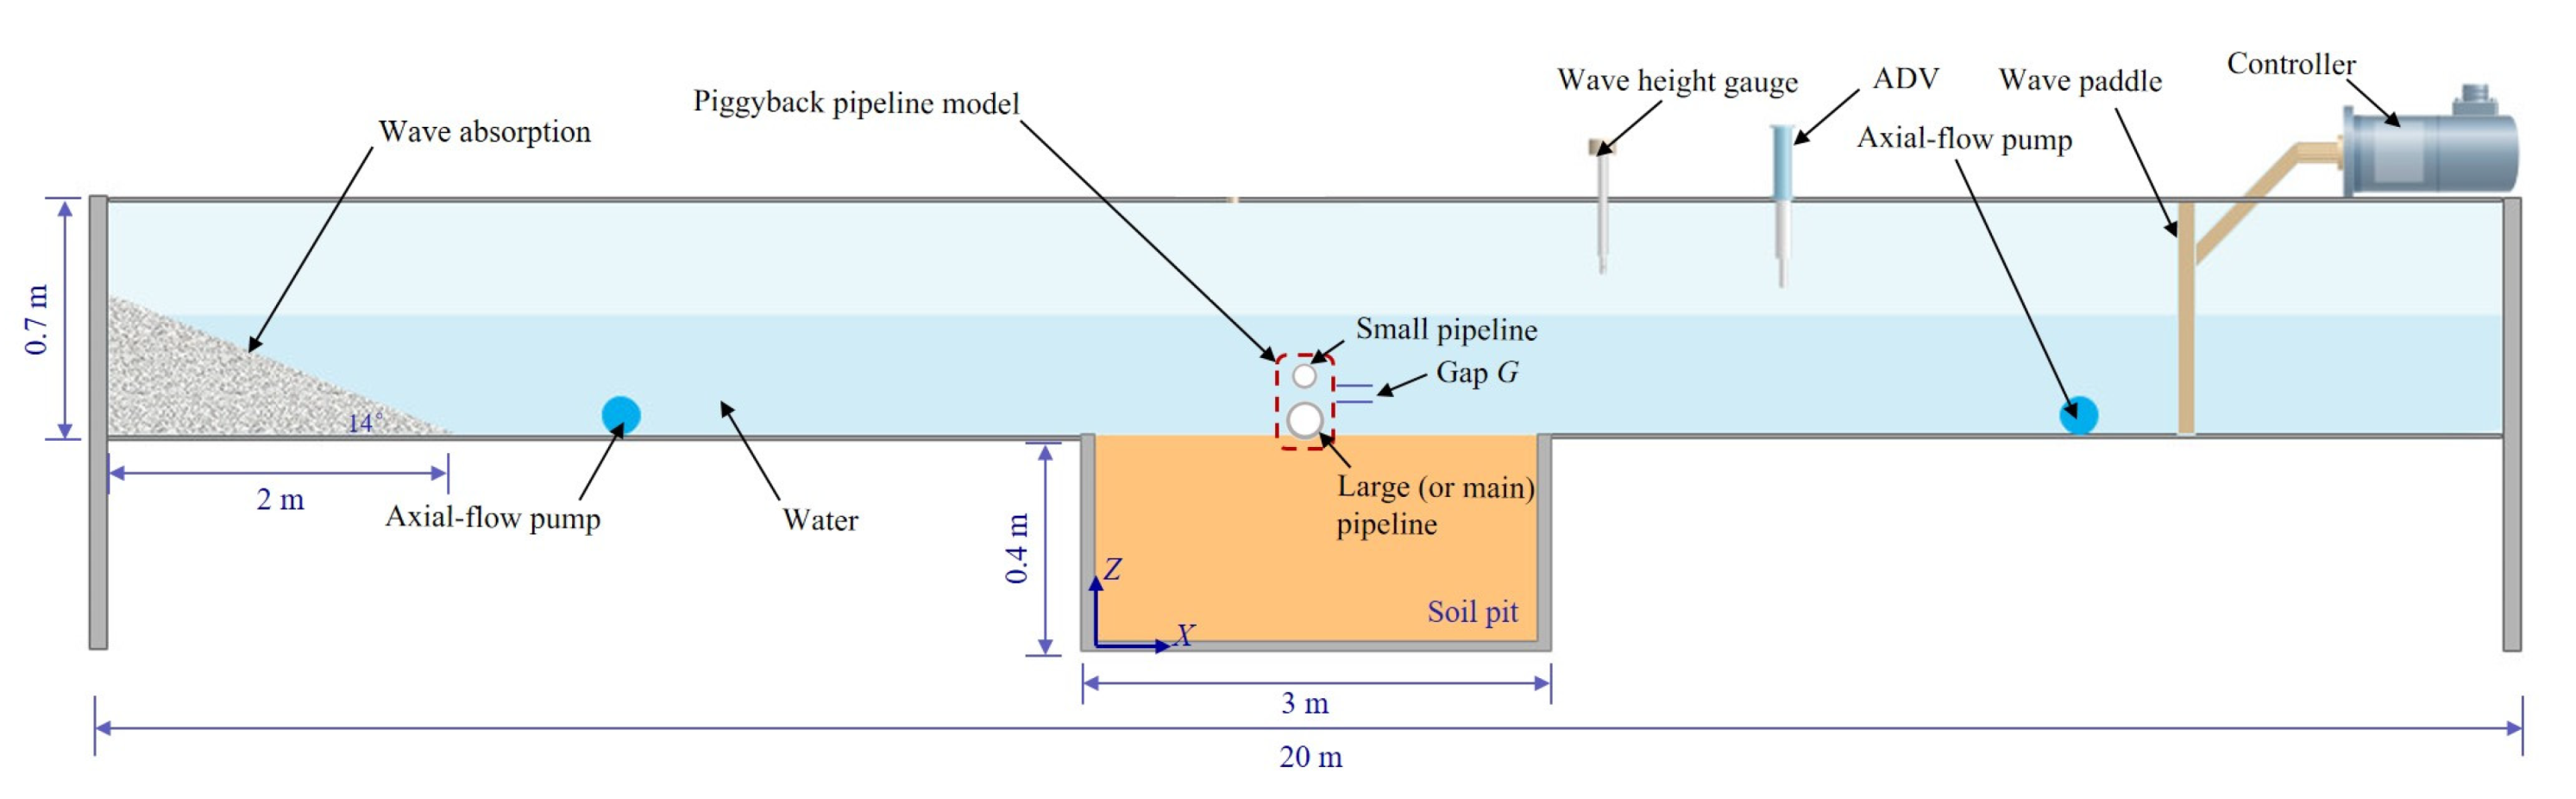
2. Experiment Design

Scour tests were conducted using a piggyback pipeline in the wave–current flume (Figure 1) with 20 m in length, 1.0 m in width, and 1.2 m in depth. A soil pit with 3.0 m in length and 0.4 m in depth was installed in the center section of the flume, and the piggyback pipeline model rested on the bed without any gap. The piggyback pipeline model comprises one large pipeline with one small pipeline that is located above the large one. The diameter of the large pipeline D and the small pipeline d′ are 3 cm and 1 cm, respectively, and the corresponding model scale is 1/33.3. The gap ratio G/D between the two pipelines ranges from 0 to 0.3 with an interval of 0.1. The piggyback pipeline model was rigidly fixed across the full length of pipeline in order to avoid the sagging process in tests.
A wave generation system consists of the double-piston wave paddle, piston rod, and electric controller, and it was set at the offshore side of the flume to produce regular waves. At the onshore side of the flume, there was a wave absorption band (2 m in length, 14° in inclination) made up of gravel and pebbles to reduce wave reflection. Two axial-flow pumps were installed on the offshore and onshore sections of the flume, respectively. The wave height gauge was employed to measure the wave profile, which was located in the center upstream section of the flume. The maximum value of the near-bed orbital velocity at the center upstream of the pipeline model was measured by an Acoustic Doppler Velocimeter (ADV). To monitor the instantaneous scour depth, a scour probe was fixed vertically to the bottom center of the big pipeline. In the experiments, the type of scour probe used was CSP1 produced by Shuguang Technologies of Beijing Ltd., Beijing, China. The multichannel data acquisition system (DEWE-43-A) was used to connect with the scour probe so as to capture the signals with a sampling rate of 50 Hz. The scour probe was calibrated before installation, and its measuring accuracy was about 0.5%. Sandy silt with the specific gravity Gs = 2.64 and the median diameter d50 = 0.051 mm was adopted to simulate the seabed, and the particle size grading curve is illustrated in Figure 2.
In all experiments, the water depth d was maintained constantly at 0.34 m. The wave height Hw = 0.08 and 0.10 m, and the wave period T = 1.5 s were used. Each scour test was carried out for about 3.33 h. Table 1 lists the experimental conditions and some specified test parameters.
In Table 1, the KC number was calculated by Equation (1) [29]:
KC = U wm T D
where Uwm is the maximum undisturbed orbital velocity above the wave boundary layer.
The ratio of velocities Ucw can be computed by Equation (2) [29]:
U cw = U wm U wm + U c
where Uc is the current velocity.
The Shields parameter θcur for the current-only case was calculated by the theoretical expression given by Soulsby [30]:
θ cur = θ f , c 2 ( ρ s / ρ w 1 ) g d 50
where Uf,c is the friction velocity in the current-only condition. ρs and ρw are the soil density and the fluid density, respectively. g is the gravity acceleration. For the wave-only case, the Uf,c in Equation (3) is replaced by the Uf,w, and the Uf,w represents the maximum near-bed friction velocity for the wave-only case, so the Shields parameter θw for the wave-only case is expressed by
θ w = θ f , w 2 ( ρ s / ρ w 1 ) g d 50
For the combined wave and current case, the maximum Shields parameter θcw was calculated by the formula proposed by Soulsby [30]:
θ cw = θ m + θ w
θ m = θ cur ( 1 + 1.2 ( θ w θ cur + θ w ) 3.2 )
where θm is the mean Shields parameter.

3. Experimental Results and Discussion

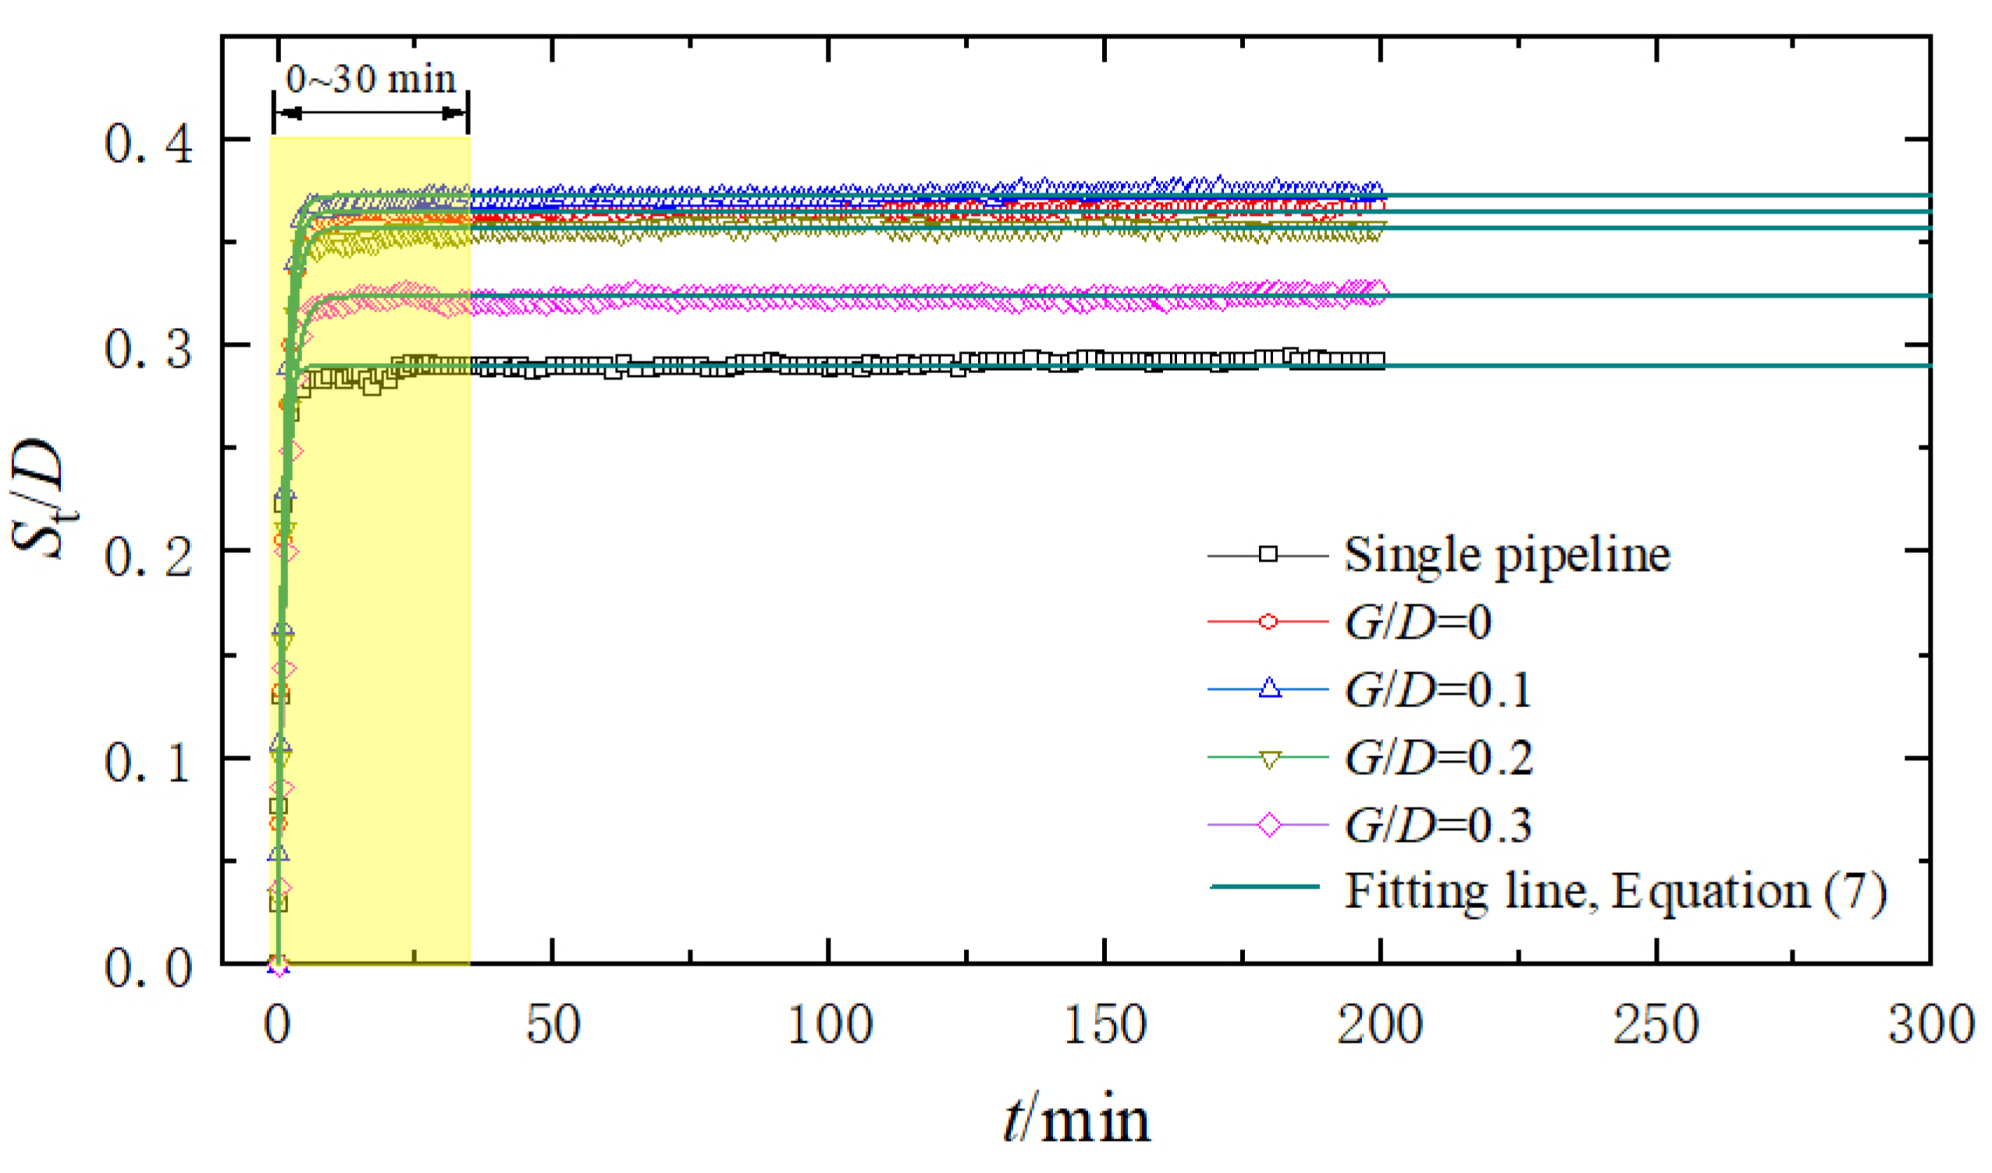
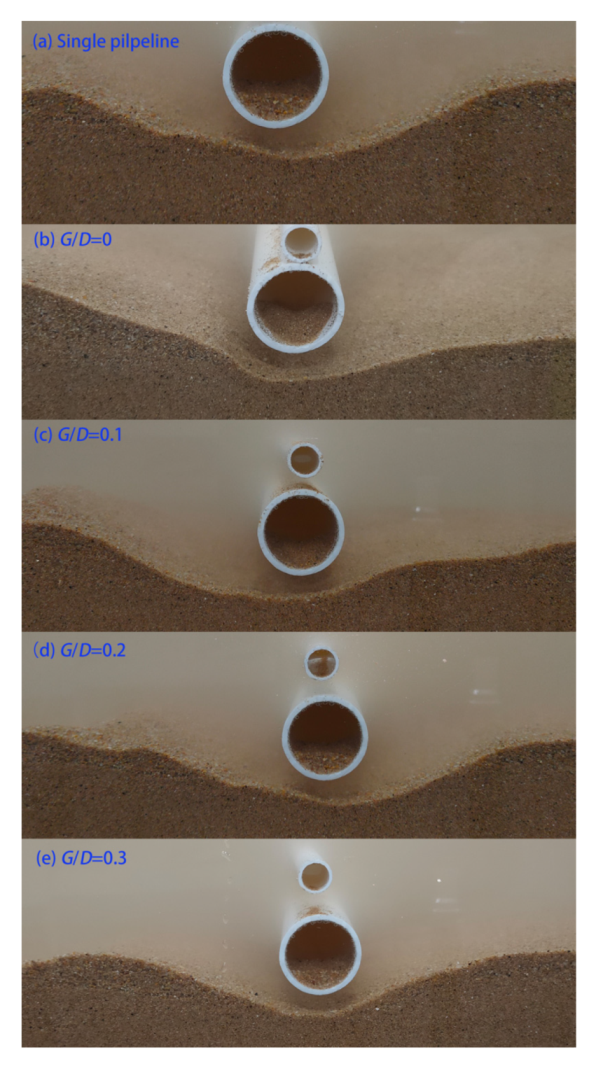
3.1. Scour Evolution and Scour Morphology

Figure 3 and Figure 4 present the time history of the instantaneous scour depth St for Case 2 below the piggyback pipeline center. To facilitate comparison, the scour depth evolution below the single pipeline center was also plotted in Figure 3 and Figure 4. As displayed in Figure 3 and Figure 4, the scour depth shows a sharp increase at the early stage. Then, the scour rate gradually decreases during the later stage of the scouring process, and the scour depth keeps stable and approaches the asymptotic value. The temporal evolution of the scour depth below the single pipeline can be depicted using Equation (7) proposed by Whitehouse [31].
S t / D = S eq / D ( 1 exp ( t / T c ) p )
where p is an empirical exponent obtained from fitting results. Tc denotes the time scale in the scour process, which can be interpreted from Figure 4 as the required time duration for the scour depth adequately developed, i.e., 0.63 Seq [32].
According to the fitting results from experimental data, p = 1/6 was chosen for the best fitting effect in the present study. The comparison between the fitting results when p = 1/6 and the experimental data is also displayed in Figure 3. As Figure 3 shows, the fitting results show favorable agreement with experimental data, indicating that Equation (7) can predict the scour depth underneath the piggyback pipeline in combined waves and current. Based on the scour equilibrium guideline proposed by Zhao and Cheng [22], the equilibrium scour depth is reached when scour rate beneath the pipeline is less than 0.0002 D per minute. According to Figure 3, at the end of tests, the scour rate generally approaches zero for both single and piggyback pipelines, which satisfies the scour equilibrium criterion suggested by Zhao and Cheng [22], and so it can be reasonably concluded that the scour reaches the equilibrium state at the end of the tests for the present study.
Figure 5 gives the experimental photographs of scour profiles at the moment t = 200 min for single and piggyback pipelines (G/D = 0, 0.1, 0.2, and 0.3). For the piggyback pipeline, the scour hole has an asymmetrical shape, and the similar scour profiles were also reported by Zhao and Cheng [22], Zhao et al. [25], Yang et al. [19], and Asrari et al. [33] for the piggyback pipeline and Sumer et al. [9], Larsen et al. [34], and Xu et al. [35] for the single pipeline.
Figure 6 shows the relationships between the equilibrium scour depth Seq below the piggyback pipeline and the gap ratio G/D. As shown in Figure 6, the G/D has an obvious influence on the Seq below the piggyback pipeline. The Seq increases when the G/D increases from 0 to 0.1, and it gradually decreases when G/D > 0.1. This phenomenon indicated that a large amount of fluid can pass through the gap between the large and small pipeline with insignificant disturbance to the flow field and turbulent velocity around the pipeline when G/D is large enough, resulting in the seabed sediment transport decreasing, and so the Seq reduces and finally approaches the results of the single pipeline. That is to say, the effects of the small pipeline on the Seq can be ignored when the G/D is large enough. The Seq for G/D = 0.1 and G/D = 0.3 is about 1.45 times and 1.28 times of the case of the single pipeline, respectively. However, when G/D < 0.1, a smaller G/D results in a greater Seq. Especially for G/D = 0, the small pipeline acts like a rigid spoiler attached on the top of the large pipeline, which significantly increases the block area and turbulent velocity around the pipeline and causes more soil particles to be mobilized, and consequently leading to more serious scour. Furthermore, the G/D also influences the scour profiles around the piggyback pipeline. For G/D = 0.1, the maximum scour depth is located at the downstream section close to the large pipeline, and on the contrary, it appears at the upstream side adjacent to the large pipeline for G/D = 0.2, which may be attributed to the G/D being closely related to the lee-wake shedding process [22].

3.2. Equilibrium Scour Depth Prediction

In combined wave and current conditions, Sumer and Fredsøe [28] have shown that the Seq depends on KC and Ucw. Based on that, they proposed Equation (8) to predict the Seq underneath a single pipeline in combined waves and current. Here, the predicted results from Equation (8) were compared with the present experimental data to validate the adaptation and accuracy of Equation (8) for a piggyback pipeline.
S eq / D = ( S c / D ) F
where Sc is the equilibrium scour depth in a current-only condition, and it is calculated by Equation (9). F can be obtained from Equation (10).
S c / D = 0.6 ± 0.2
F = { 5 / 3 ( KC ) a exp ( 2.3 b ) , 0 U cw 0.7 1 , U cw > 0.7
where a and b are empirical factors, which are computed by Equations (11) and (12), respectively.
a = { 0.557 0.912 ( U cw 0.25 ) 2 , 0 U cw 0.4 2.14 U cw + 1.46 , 0.4 < U cw 0.7
b = { 1.14 + 2.24 ( U cw 0.25 ) 2 , 0 U cw 0.4 3.5 U cw 2.5 , 0.4 < U cw 0.7
Figure 7 depicts the experimental data and predicted results from Equation (8). Figure 7 indicates that the present experimental data for the single pipeline agree well with the predicted results from Equation (8), proving that the present test setup provides a reliable and consistent result compared with the existing experimental data and the theoretical formulas. For the piggyback pipeline, the variation trend of the present experimental data is basically consistent with the predicted results from Equation (8). For example, for a given KC, the Seq increases with the increase of Ucw. In addition, when Ucw is fixed, a higher KC results in a greater Seq. However, Equation (8) generally underestimates the Seq for the piggyback pipeline, especially for a small gap ratio, such as G/D = 0 and 0.1. As described above (Section 3.1), for a small gap ratio, the large and small pipelines behave as a single body, similar to a rigid spoiler installed on the large pipeline, which increases flow blockage and gap flow velocity, contributing to the greater scour depth. When the gap ratio is sufficiently large, the flow passes the gap without significant effects on the flow field and disturbance to the sediment transport.
Moreover, Figure 7 shows that the upper limit values of Equation (8) correlate well with the experimental data for G/D = 0~0.3, so it is advisable to use the upper limit values of Equation (8) to predict the Seq for below the piggyback pipeline when G/D is in the range of 0 and 0.3. As a check, Figure 8 presents a comparison between the present experimental data for the piggyback pipeline and predicted results (the upper limit values) according to Equation (8). The results indicate that the upper limit values calculated by Equation (8) collapse well with the present experimental data. Hence, the upper limit results from Equation (8) are capable of predicting the Seq below the piggyback pipeline with favorable effects for G/D = 0~0.3.

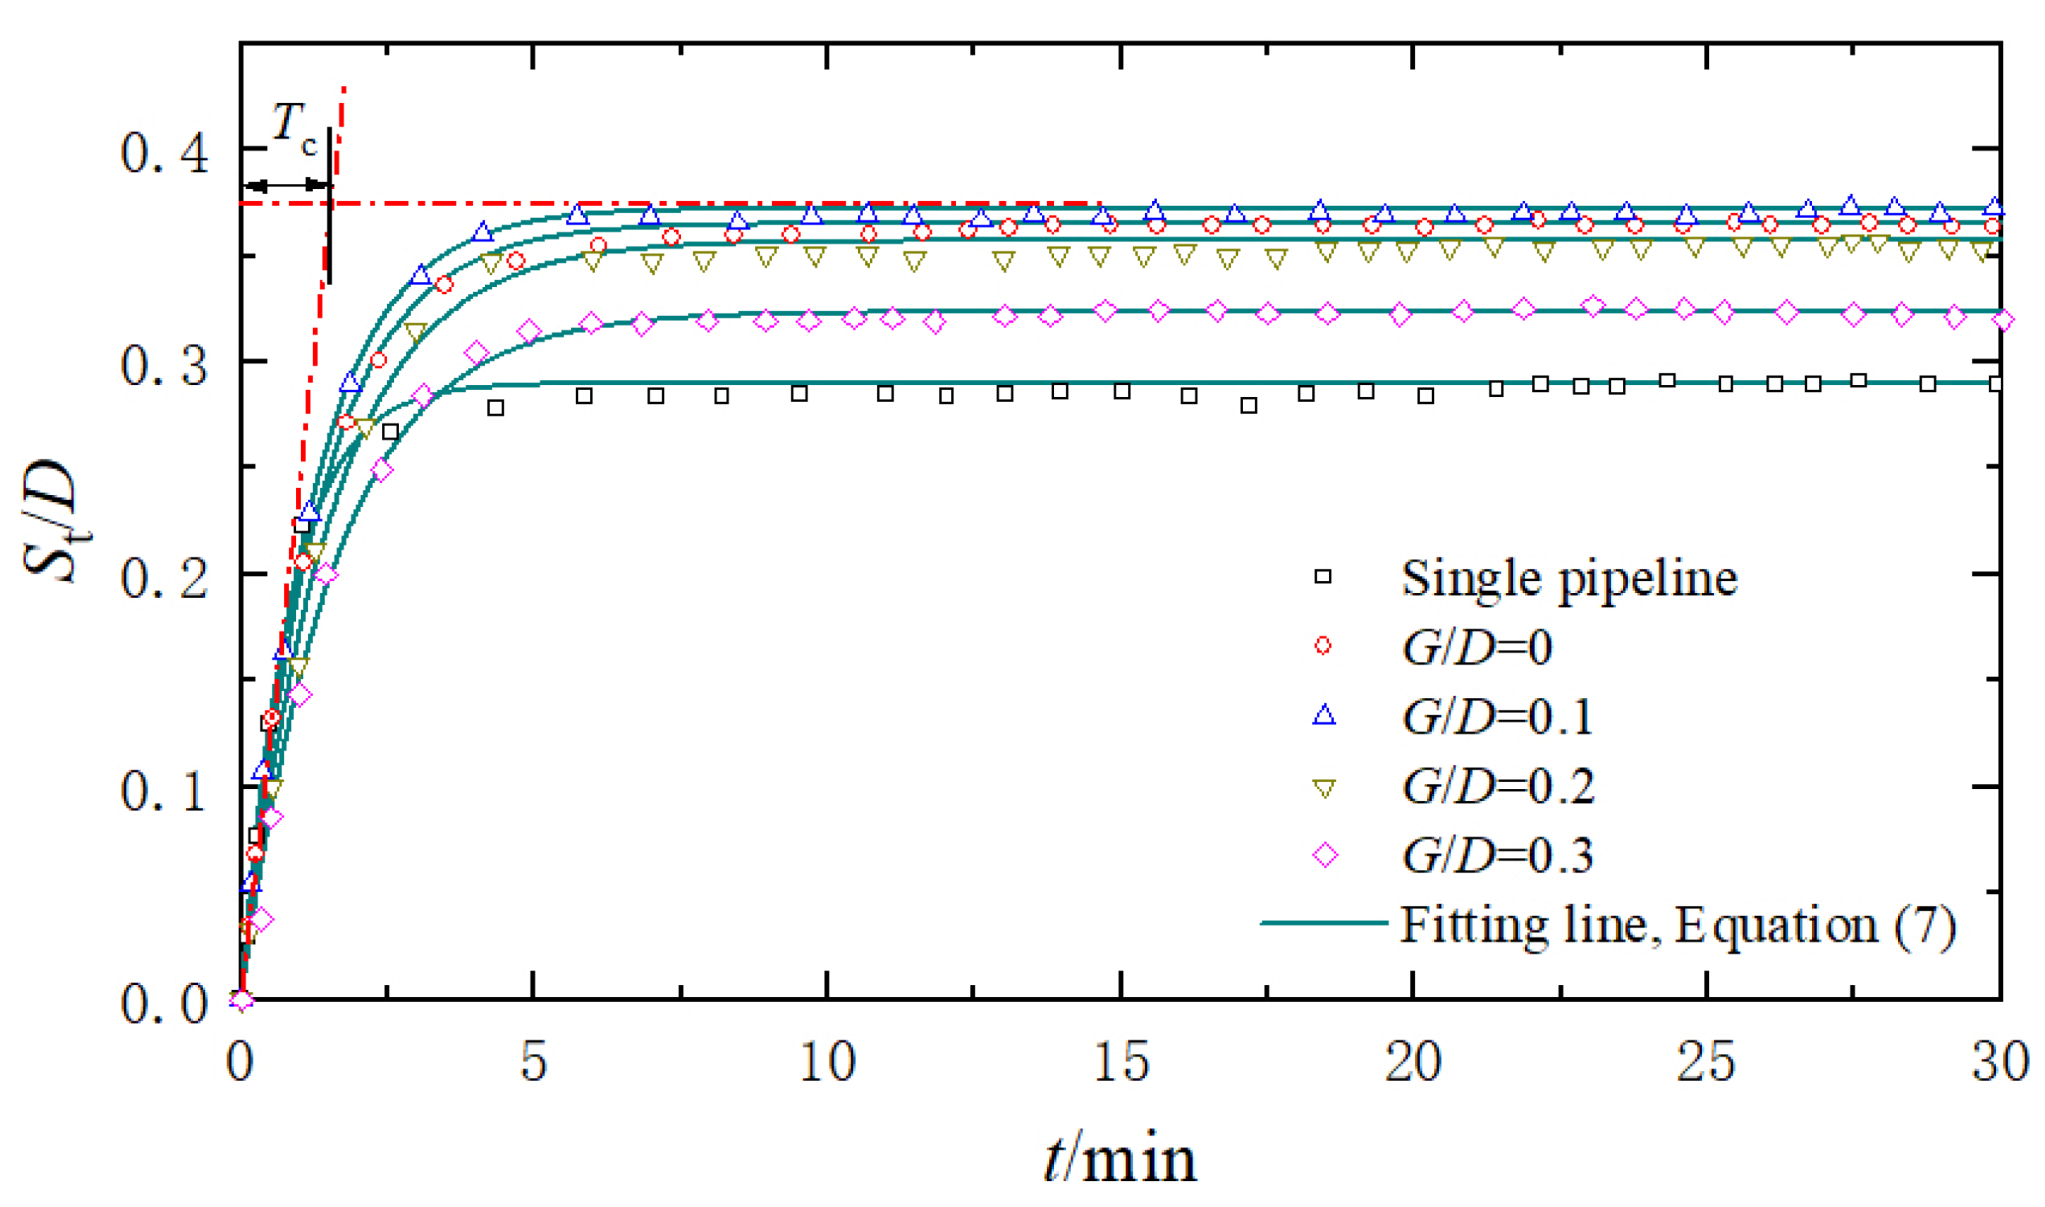
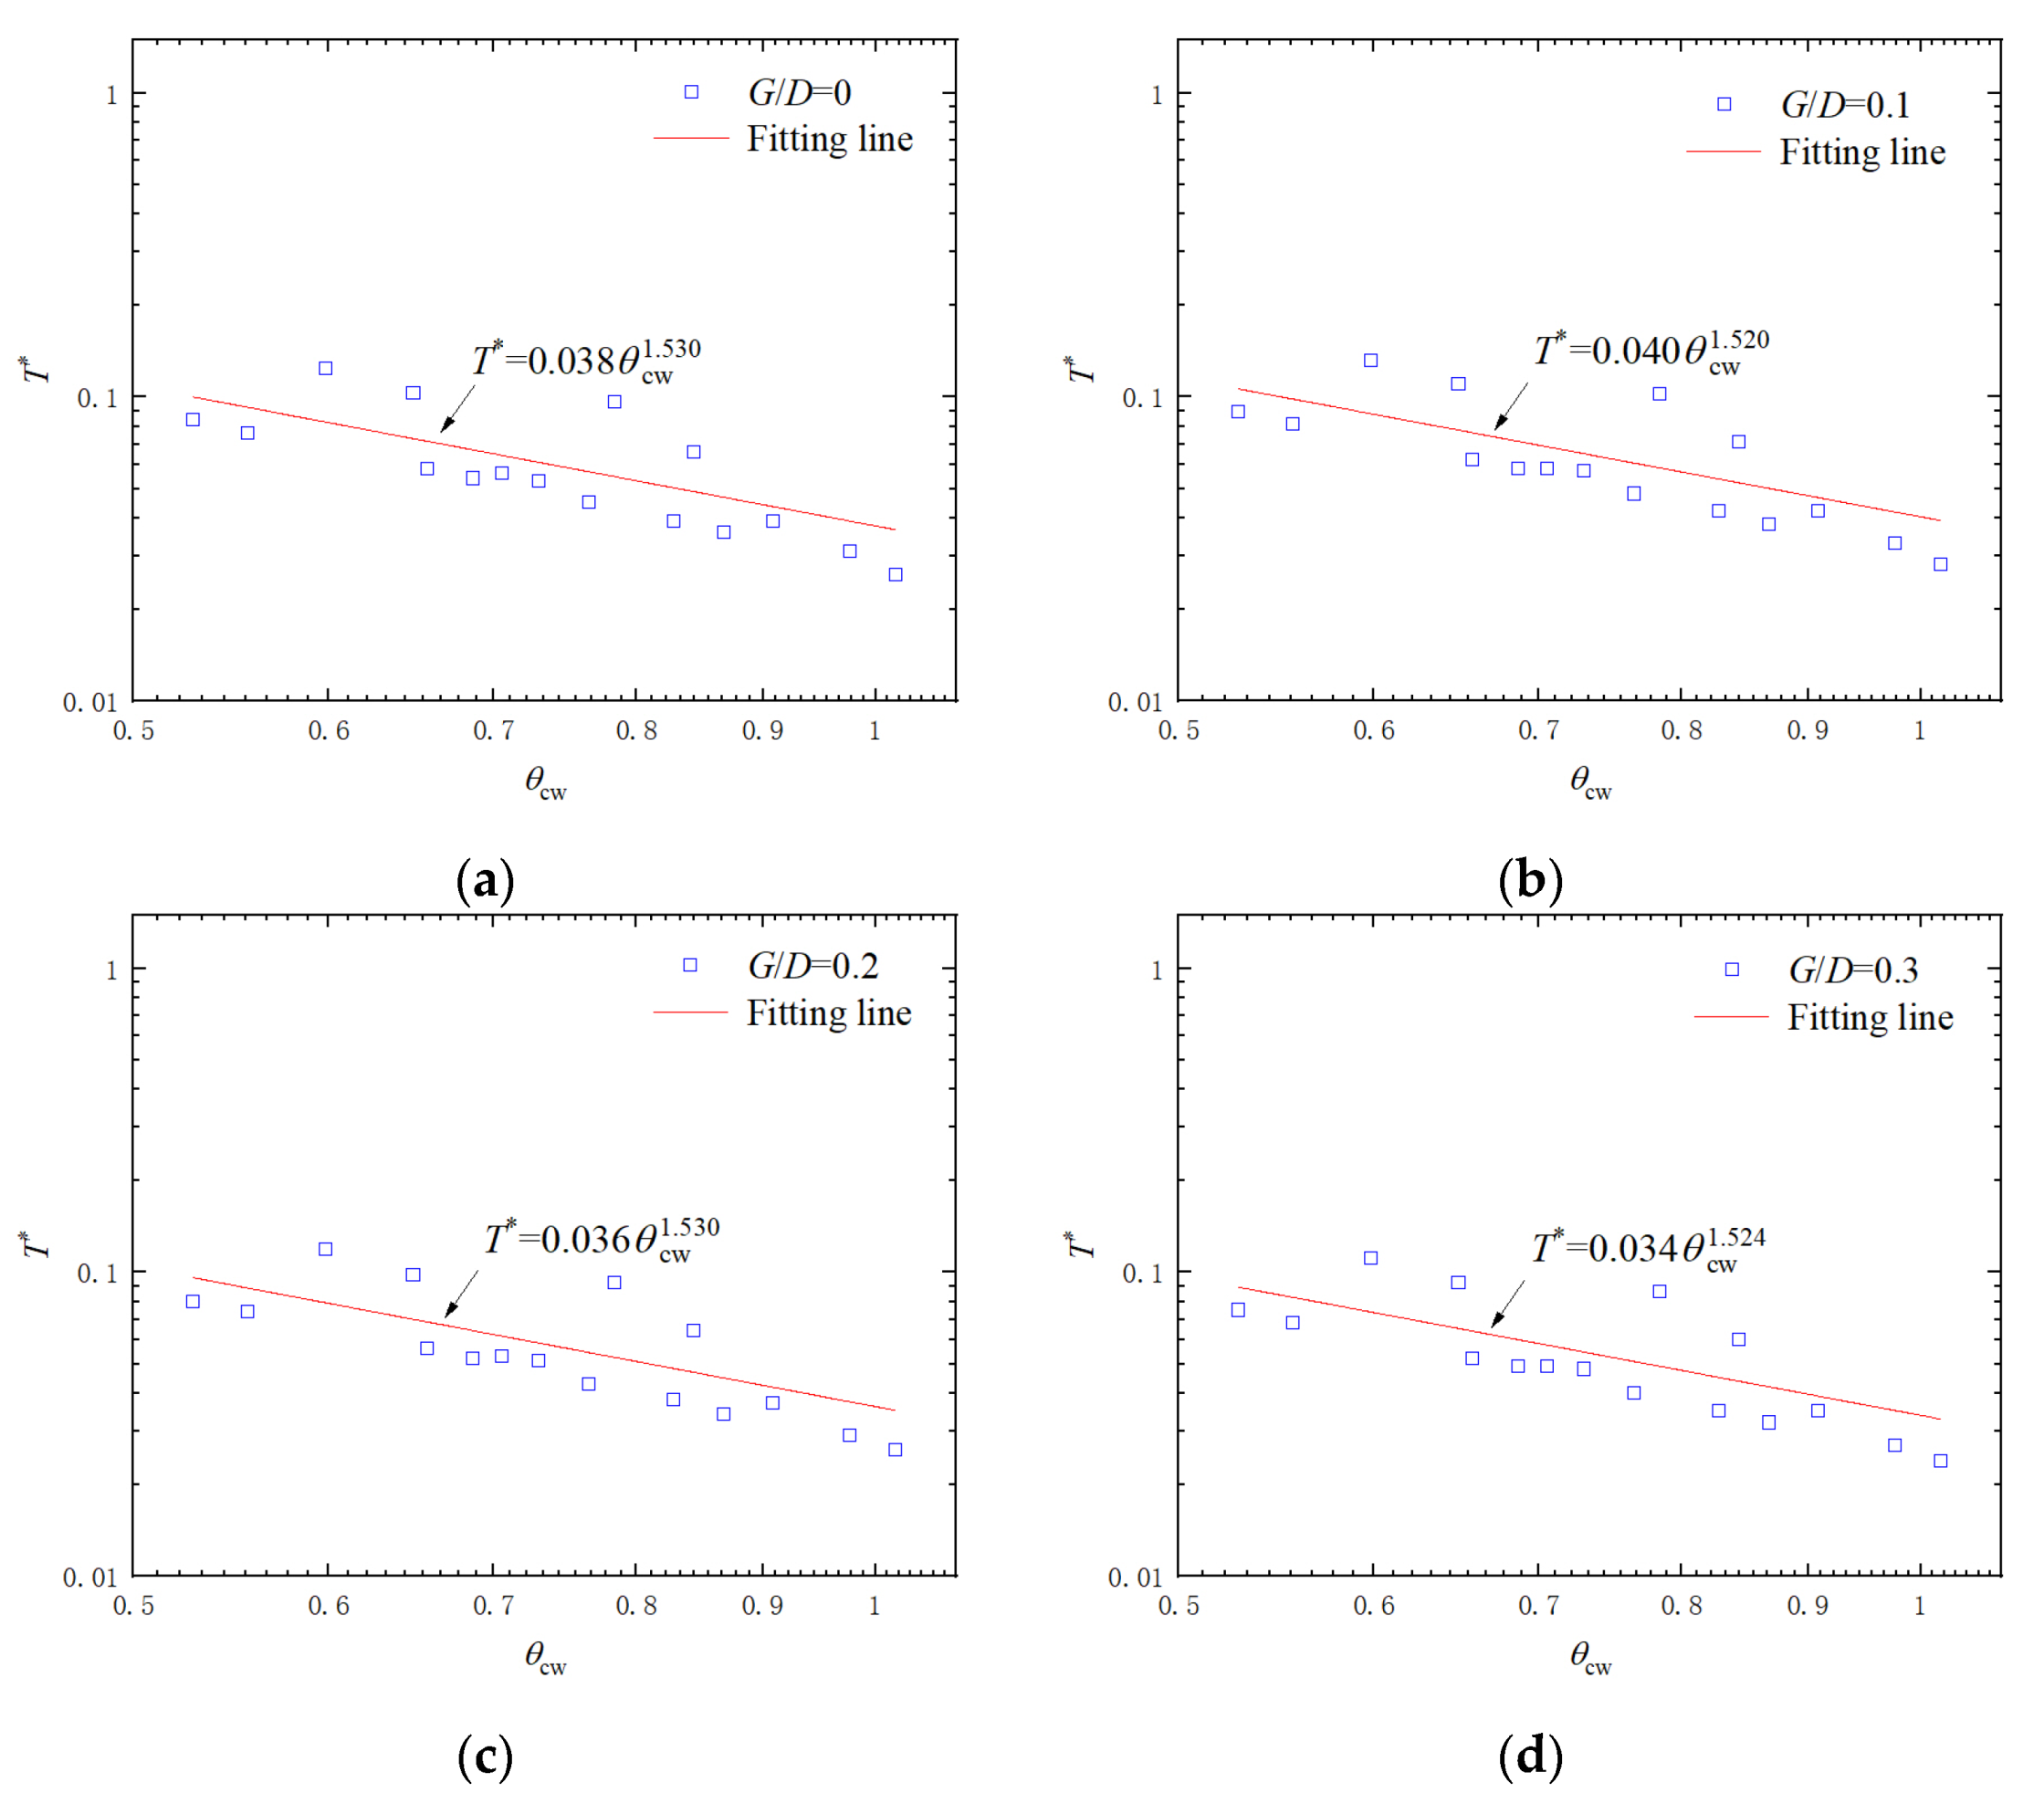
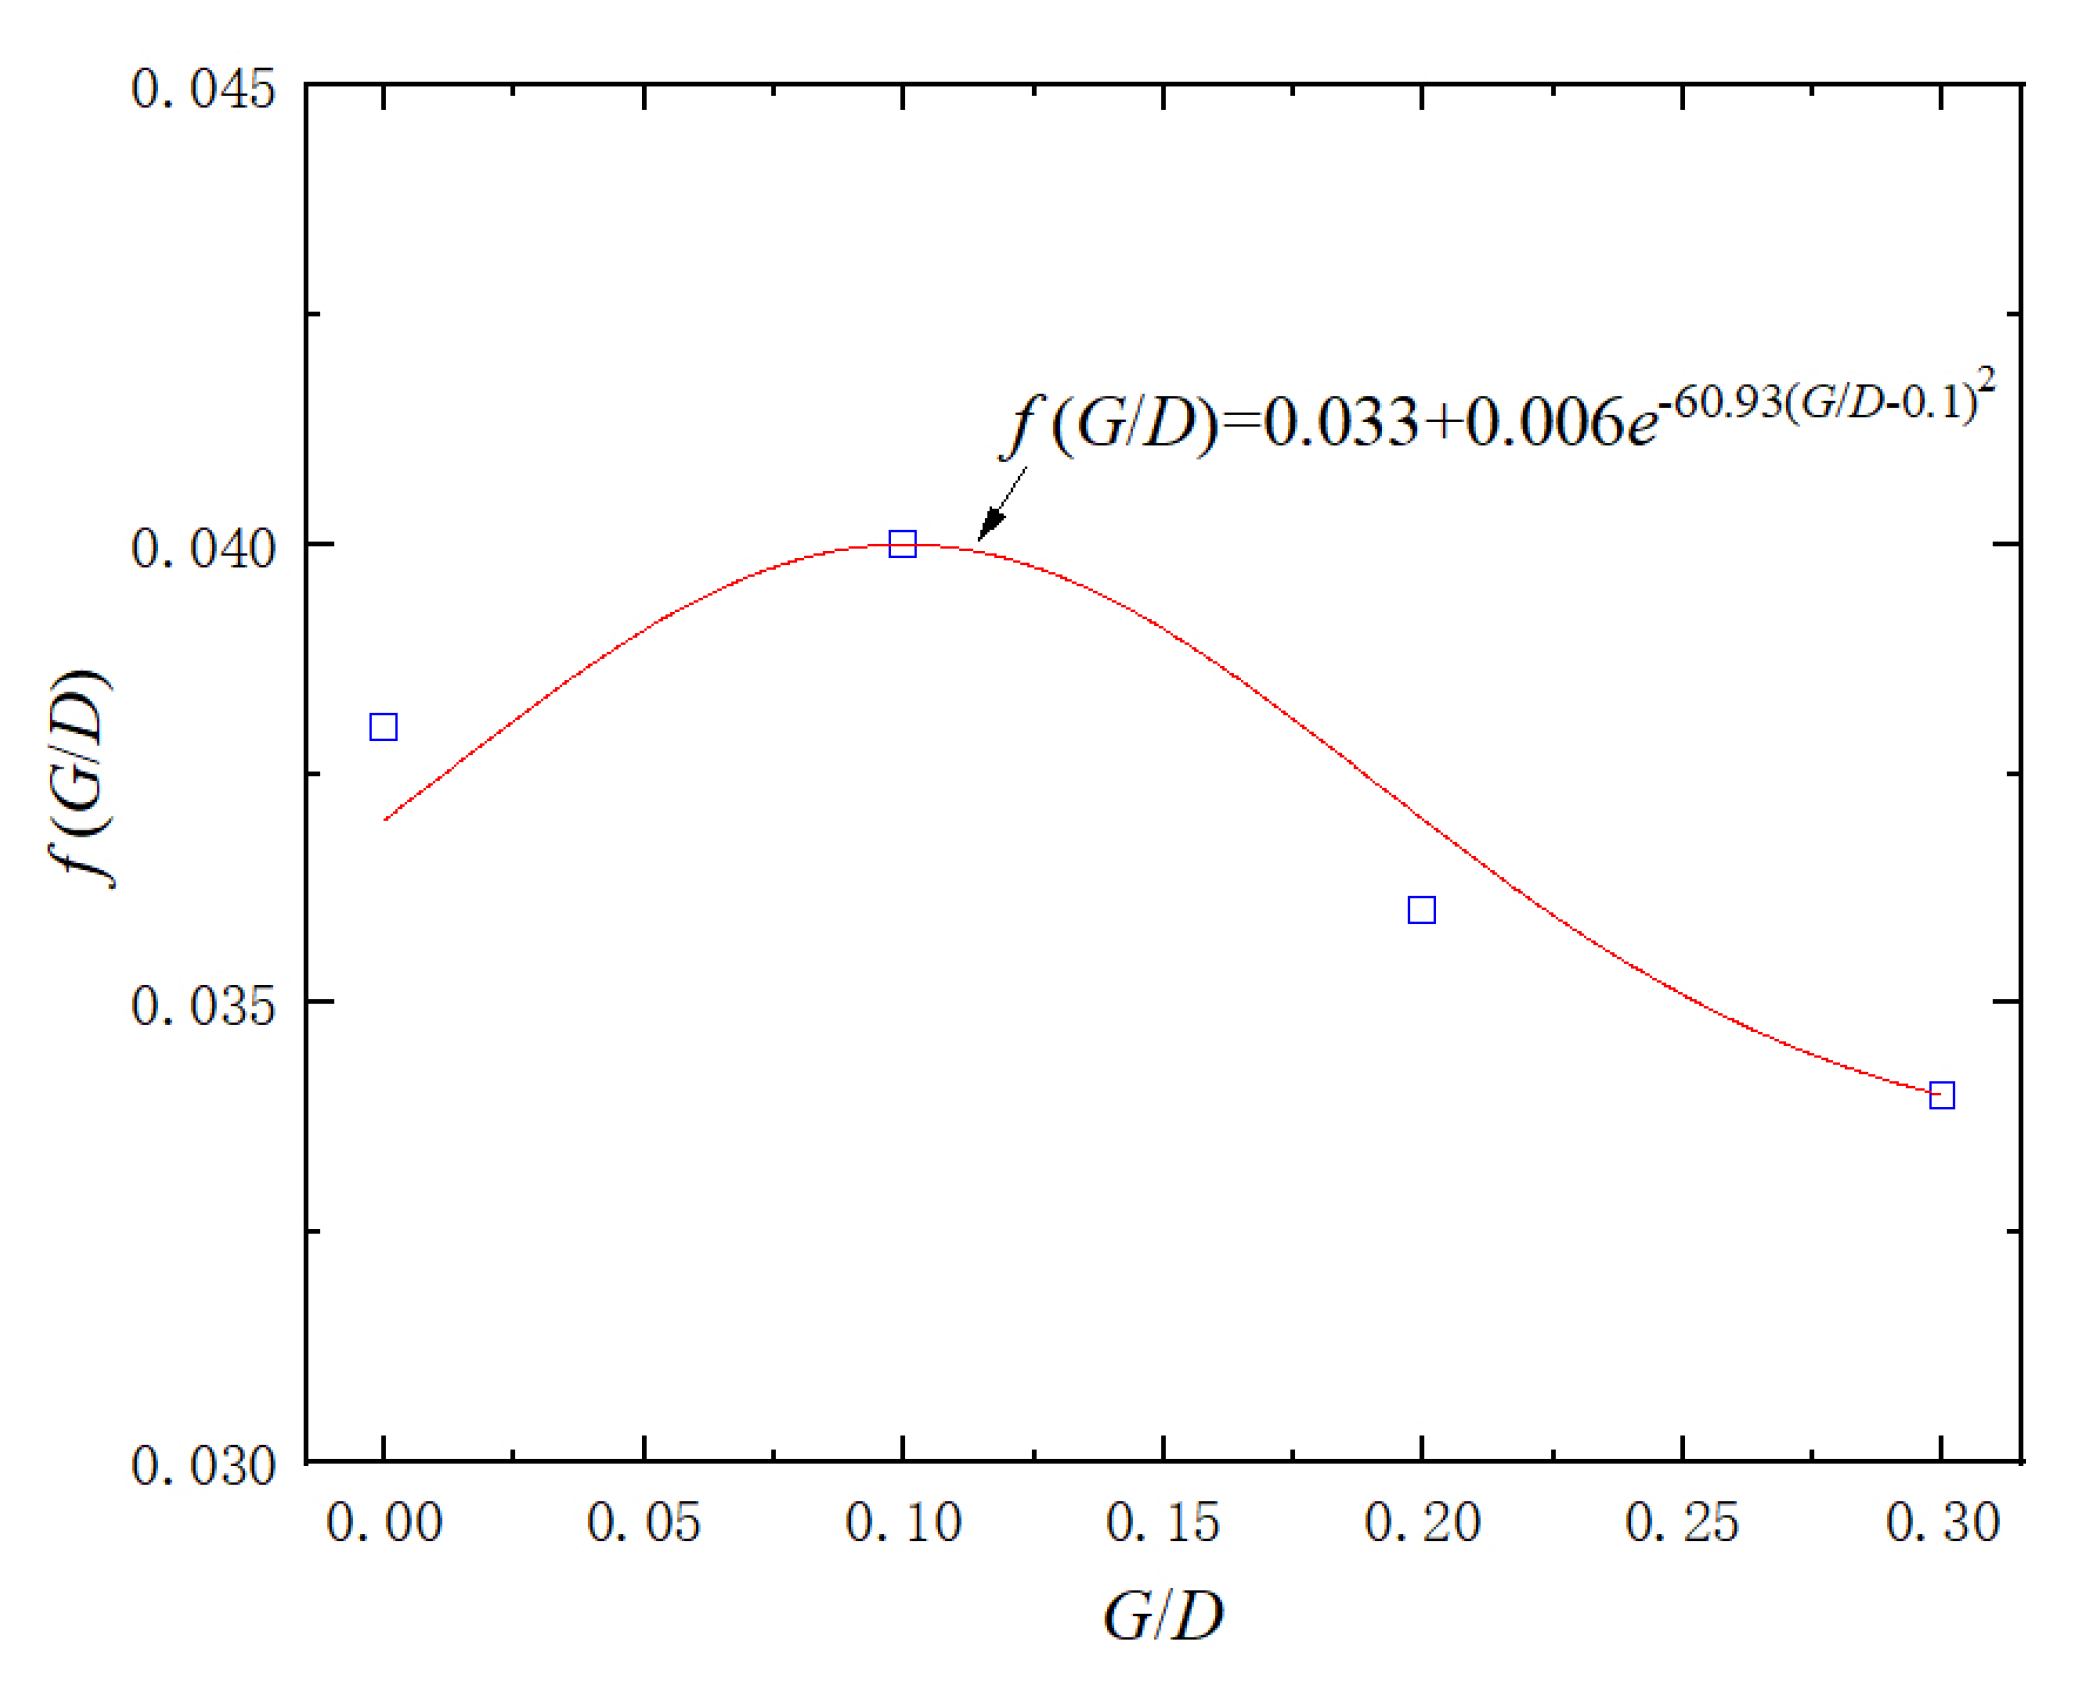
3.3. Scour Timescale

The scour timescale Tc denotes the required time duration for the scour depth to become significantly developed. The dimensionless timescale T* can be calculated based on the theoretical expression (Equation (13)) proposed by Fuhrman et al. [19].
T * = g ( s 1 ) d 3 D 2 T c
According to Fredsøe and Deigaard [36], the T* around a single pipeline can be expressed by
T * = 1 / 50 θ 5 / 3
Equation (14) is valid for both current-only and wave-only conditions, so the Shields parameter θ can be replaced by the θcur for the current-only case and θw for the wave-only case. To validate the adaptation of Equation (14) for the combined waves and current case, Larsen et al. [34] used the θcw for the combined waves and current condition to calculate T* and compared the calculating values by Equation (14) with experimental data, indicating that Equation (14) generally underestimates the T* for the combined waves and current case. Such an increase in the T* can be explained as follows. For the flows in combined waves and current, it oscillates and endures a strong and a weak current at wave crest and trough period, respectively, leading to the more serious scour when enduring the wave crest phase, and much less at wave trough stage; thus, for the same θ, the scour in the current-only case develops faster than the current-dominated flows in combined waves and current, where the flow reaches the maximum value only in a fraction of one wave period [34]. According to Equation (14), for the scour around the single pipeline in combined waves and current, the T* is closely related to the θcw [34], and for the piggyback pipeline, the scour evolution curves (in Figure 3) demonstrate that the T* also depends on G/D. Given that Equation (14) is valid for both the wave-only case and the current-only case, it can be expected that the similar expression (Equation (15)) can also be adapted to the combined waves and current case.
T * = f ( G / D ) θ cw m
where f (G/D) is the function of G/D. m is an empirical exponent, which can be obtained from fitting results.
To obtain f (G/D), the T* was plotted against θcw in Figure 9 for G/D = 0, 0.1, 0.2, and 0.3. For each G/D, the value of f (G/D) can be obtained by fitting the experimental data using Equation (16). The results in Figure 9 indicate that given the G/D, Equation (15) is capable of depicting the relationship between T* and θcw with favorable effects.
Figure 10 shows the relationship between the best-fit values for f (G/D) with G/D. According to the results in Figure 10, it can be found that the fitting line expressed by Equation (16) can provide a favorable prediction for f (G/D).
f ( G / D ) = 0.033 + 0.006 e 60.93 ( G / D 0.1 ) 2
As displayed in Figure 10, the f (G/D) increases with G/D when the G/D increases from 0 to 0.1, and it decreases with the increase of G/D when G/D is larger than 0.1. According to Equation (16), a higher f (G/D) results in a greater T* for a given G/D, indicating that the more sediments were mobilized and transported for relatively small G/D and, consequently, a slower scour process, which is generally consistent with the variation trend between Seq and G/D for a given Ucw discussed previously. It should be noted that Equation (16) is only valid for the condition of combined collinear waves and current. The adaptation and accuracy of Equation (16) for random, directional waves still needs more validations.

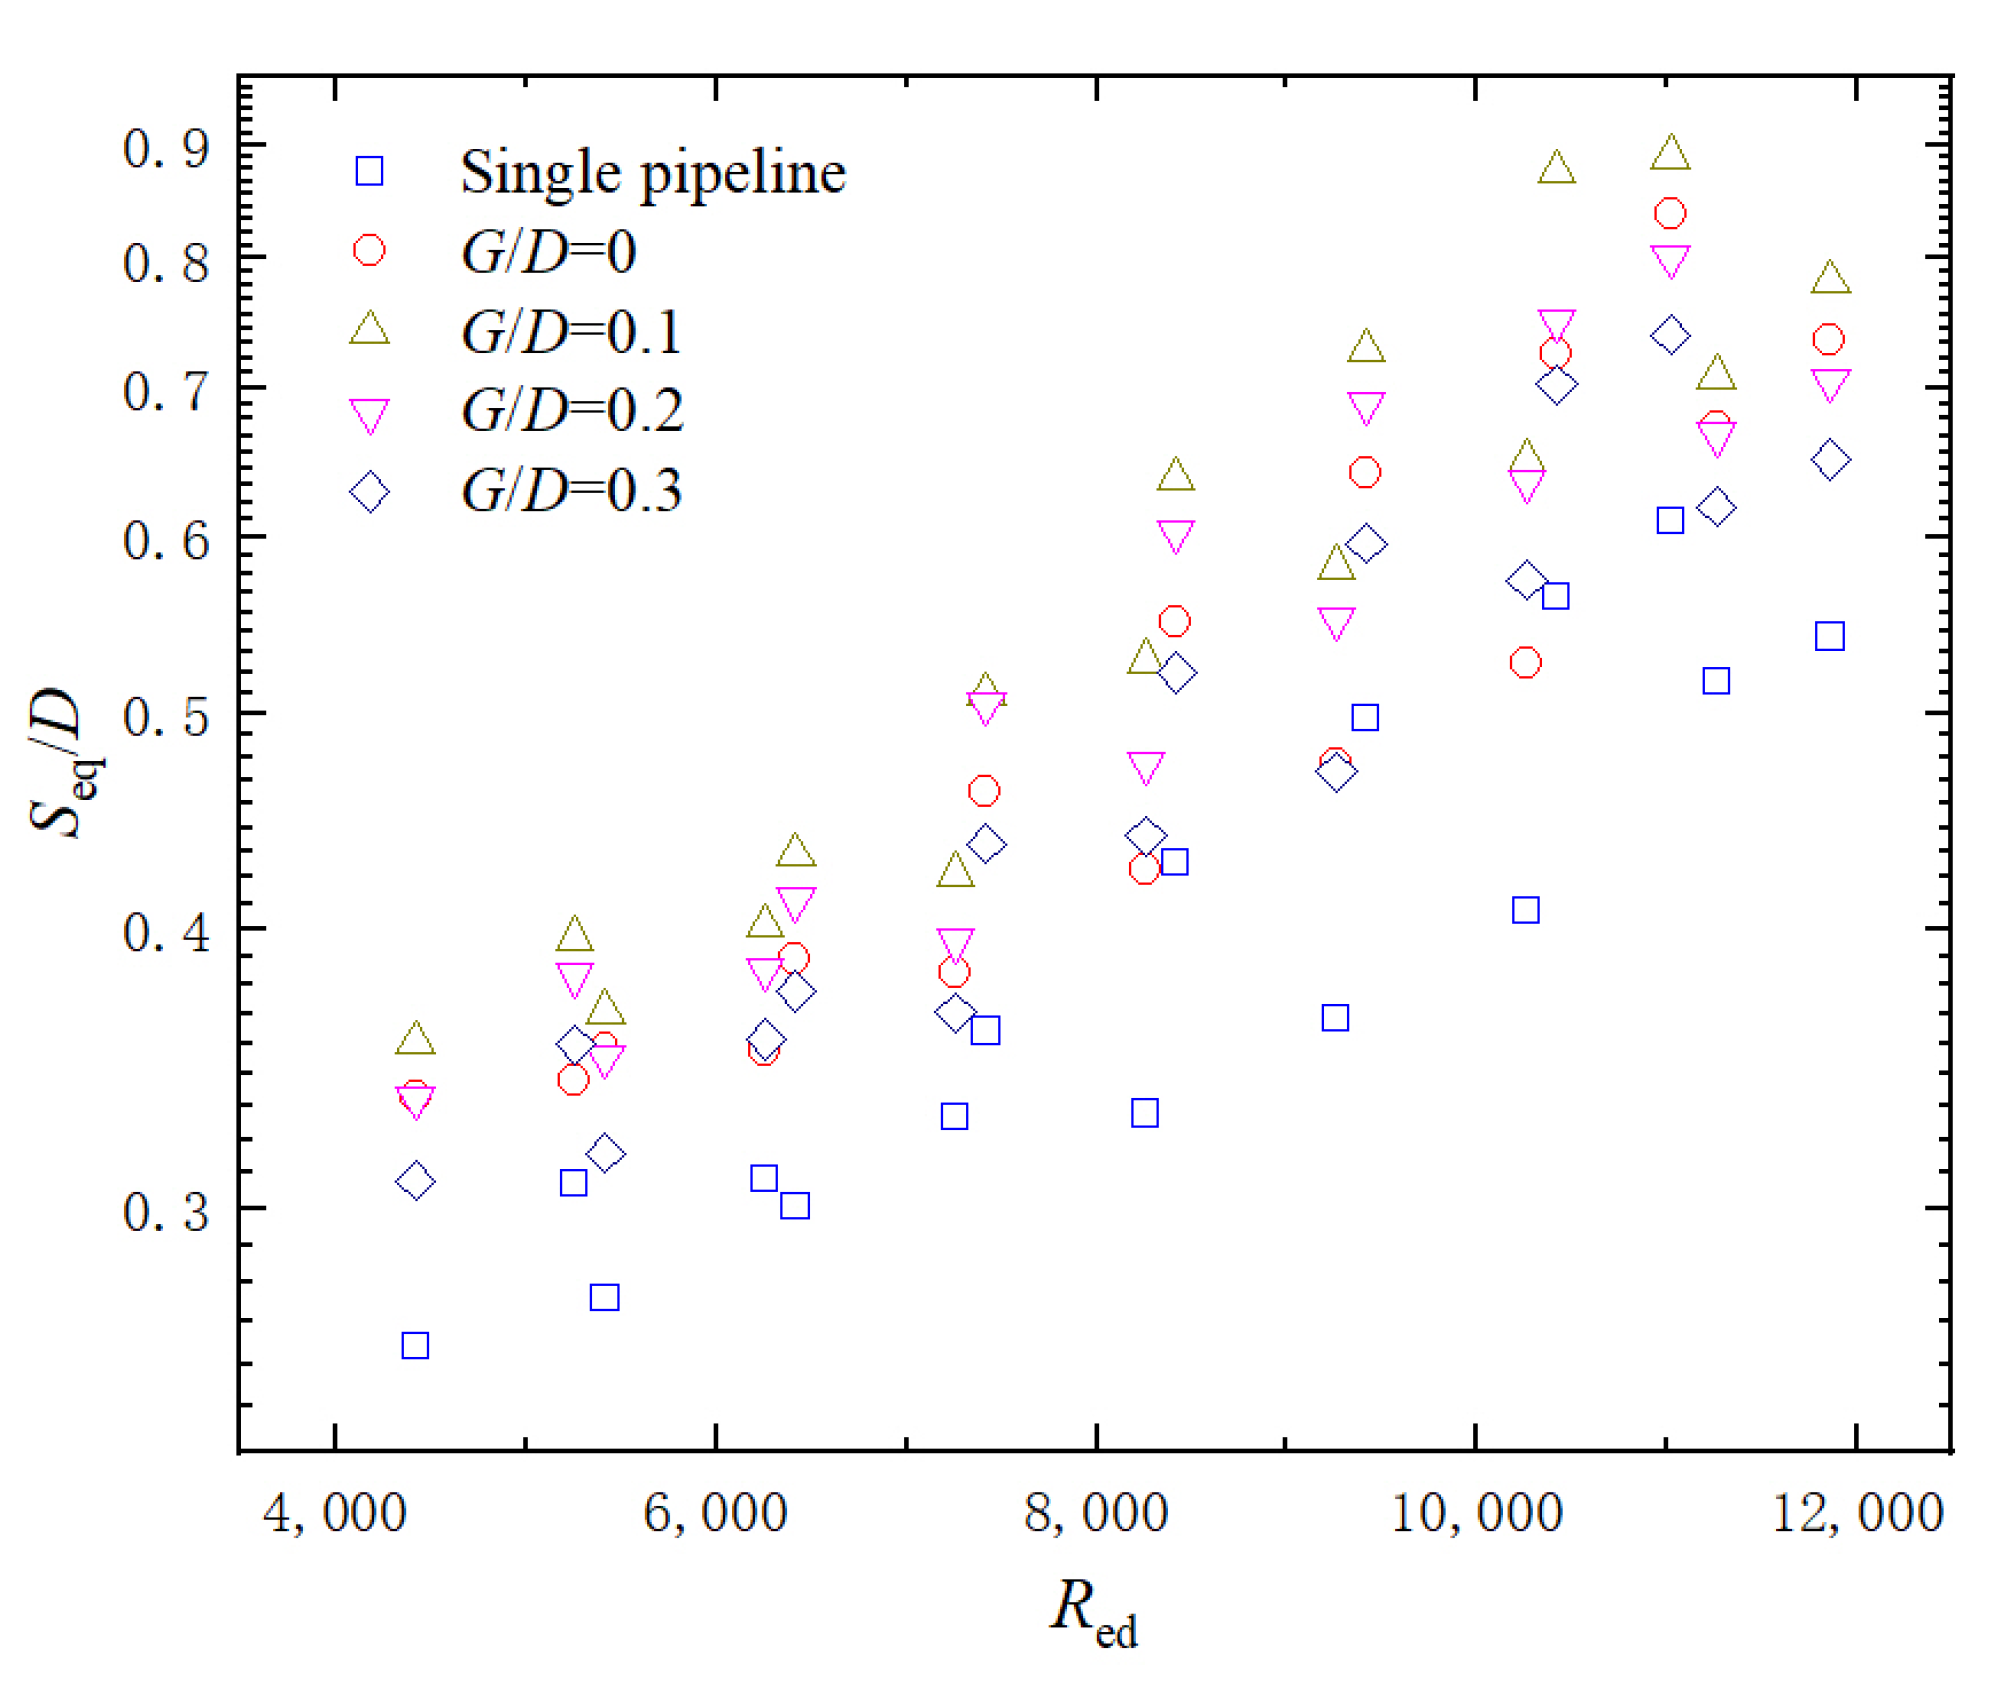
3.4. Influence of the Inflow Reynolds Number Red on Seq

The inflow Reynolds number Red depends on current velocity, pipeline diameter, and coefficient of viscosity. Based on the experimental and numerical results of Zhao et al. [25] and Yang et al. [26], the scour depth below the pipeline is obviously influenced by the inflow Reynolds number Red. In this chapter, the effect of Red on Seq below the piggyback pipeline was investigated.
The Reynolds number Red can be calculated using Equation (17) [37].
R ed = U m D υ
where Um is the maximum value of the near-bed flow velocity in combined waves and current. ν is the kinematic viscosity of water.
Figure 11 presents the relationship between Seq and Red for different gap ratios. As displayed in Figure 11, for combined waves and current conditions, a higher Red usually has a potential to cause a greater Seq, although considerable scatter exists. The similar variation trend was also reported by Zhao et al. [25] and Yang et al. [26] for a piggyback pipeline in steady current and wave-only conditions. This is because a higher Red causes a greater shear stress on the seabed induced by waves and current, and, consequently, an enhanced pressure gradient around the pipeline, which dominates the onset of scour and tunnel scour below the pipeline. Thus, this process should be characterized by Red, and the increased Red contributes to a greater scour depth.

3.5. Influence of the Maximum Shields Number θcw on Seq

As discussed above, the θcw has a significant influence on dimensionless scour timescale T*, indicating that the θcw dominates the scour process around the piggyback pipeline in combined waves and current. Given that, it can be reasonably inferred that the θcw is also closely related to the Seq around the piggyback pipeline. Here, the correlation between θcw and Seq was investigated. Figure 12 displays the variation trend of Seq with θcw for different gap ratios. The results indicate that the Seq is influenced significantly by θcw. Generally, a higher θcw causes a greater Seq, although there are some scatters. For the present study, the live bed scour prevails because the θcw is greater than the critical Shields number θcr. The θcw dominates the maximum sediment transport, and a higher θcw means that a larger soil particle can be dragged away from the seabed by the shear stress induced by waves and current, and then mobilized and transported with flow. As a result, more sediments are washed away around the piggyback pipeline and are deposited in a far-field region, resulting in greater scour depth. In the present study, only the live bed conditions were realized due to the limitation of the experimental setup, and so in following studies it is vital to further investigate the variation trend of the Seq for the relative lower θcw in a clear bed scour regime.

3.6. Remarks Regarding the Local Scour around the Piggyback Pipeline

This study presents a group of scour experiments for a piggyback pipeline in combined waves and current. Based on the experimental results, the scour evolution and scour morphology were firstly analyzed. Then, a comparison with the Seq between the present experimental data and predicted results from Sumer and Fredsøe [28] was conducted. After that, the correlation between T* and θcw was investigated, and a formula (Equation (15)) was obtained to describe the behavior between T* and θcw for different gap ratios. Finally, the parametric study was carried out to study the effects of Red and θcw on the Seq, respectively. The present results may provide some useful perspective for piggyback pipelines in engineering design.
However, there are still some limits about the present experiments. For example, the piggyback pipelines used in tests were directly placed on the seabed with zero embedment. According to Sumer et al. [9], Chiew [15], and Zang [38], the scour process has a strong correlation with embedment depth of the pipeline, especially the initial scour and tunnel scour beneath the pipeline. What is more, in real engineering, the small pipeline is usually placed close to the large one, so the gap ratio G/D only ranges from 0 to 0.3 with an interval of 0.1 in the present experiments, and the relatively large G/D is not considered in the present study. It is noteworthy that for G/D = 0.3, the small pipeline still has non-negligible effects on the Seq compared with the single pipeline conditions (about 1.26 times of the case of single pipeline). In addition, the scour morphology and hydrodynamic force in the vicinity of the piggyback pipeline under a steady current are significantly influenced by the position angle of the small pipeline [27]. Based on that, it can be asserted that the effects also exist in combined wave and current conditions. Hence, further studies are still necessary to explore the effects of above points on local scour around piggyback pipelines in combined waves and current.

4. Conclusions

According to above analysis, the primary conclusions can be obtained:
(1)
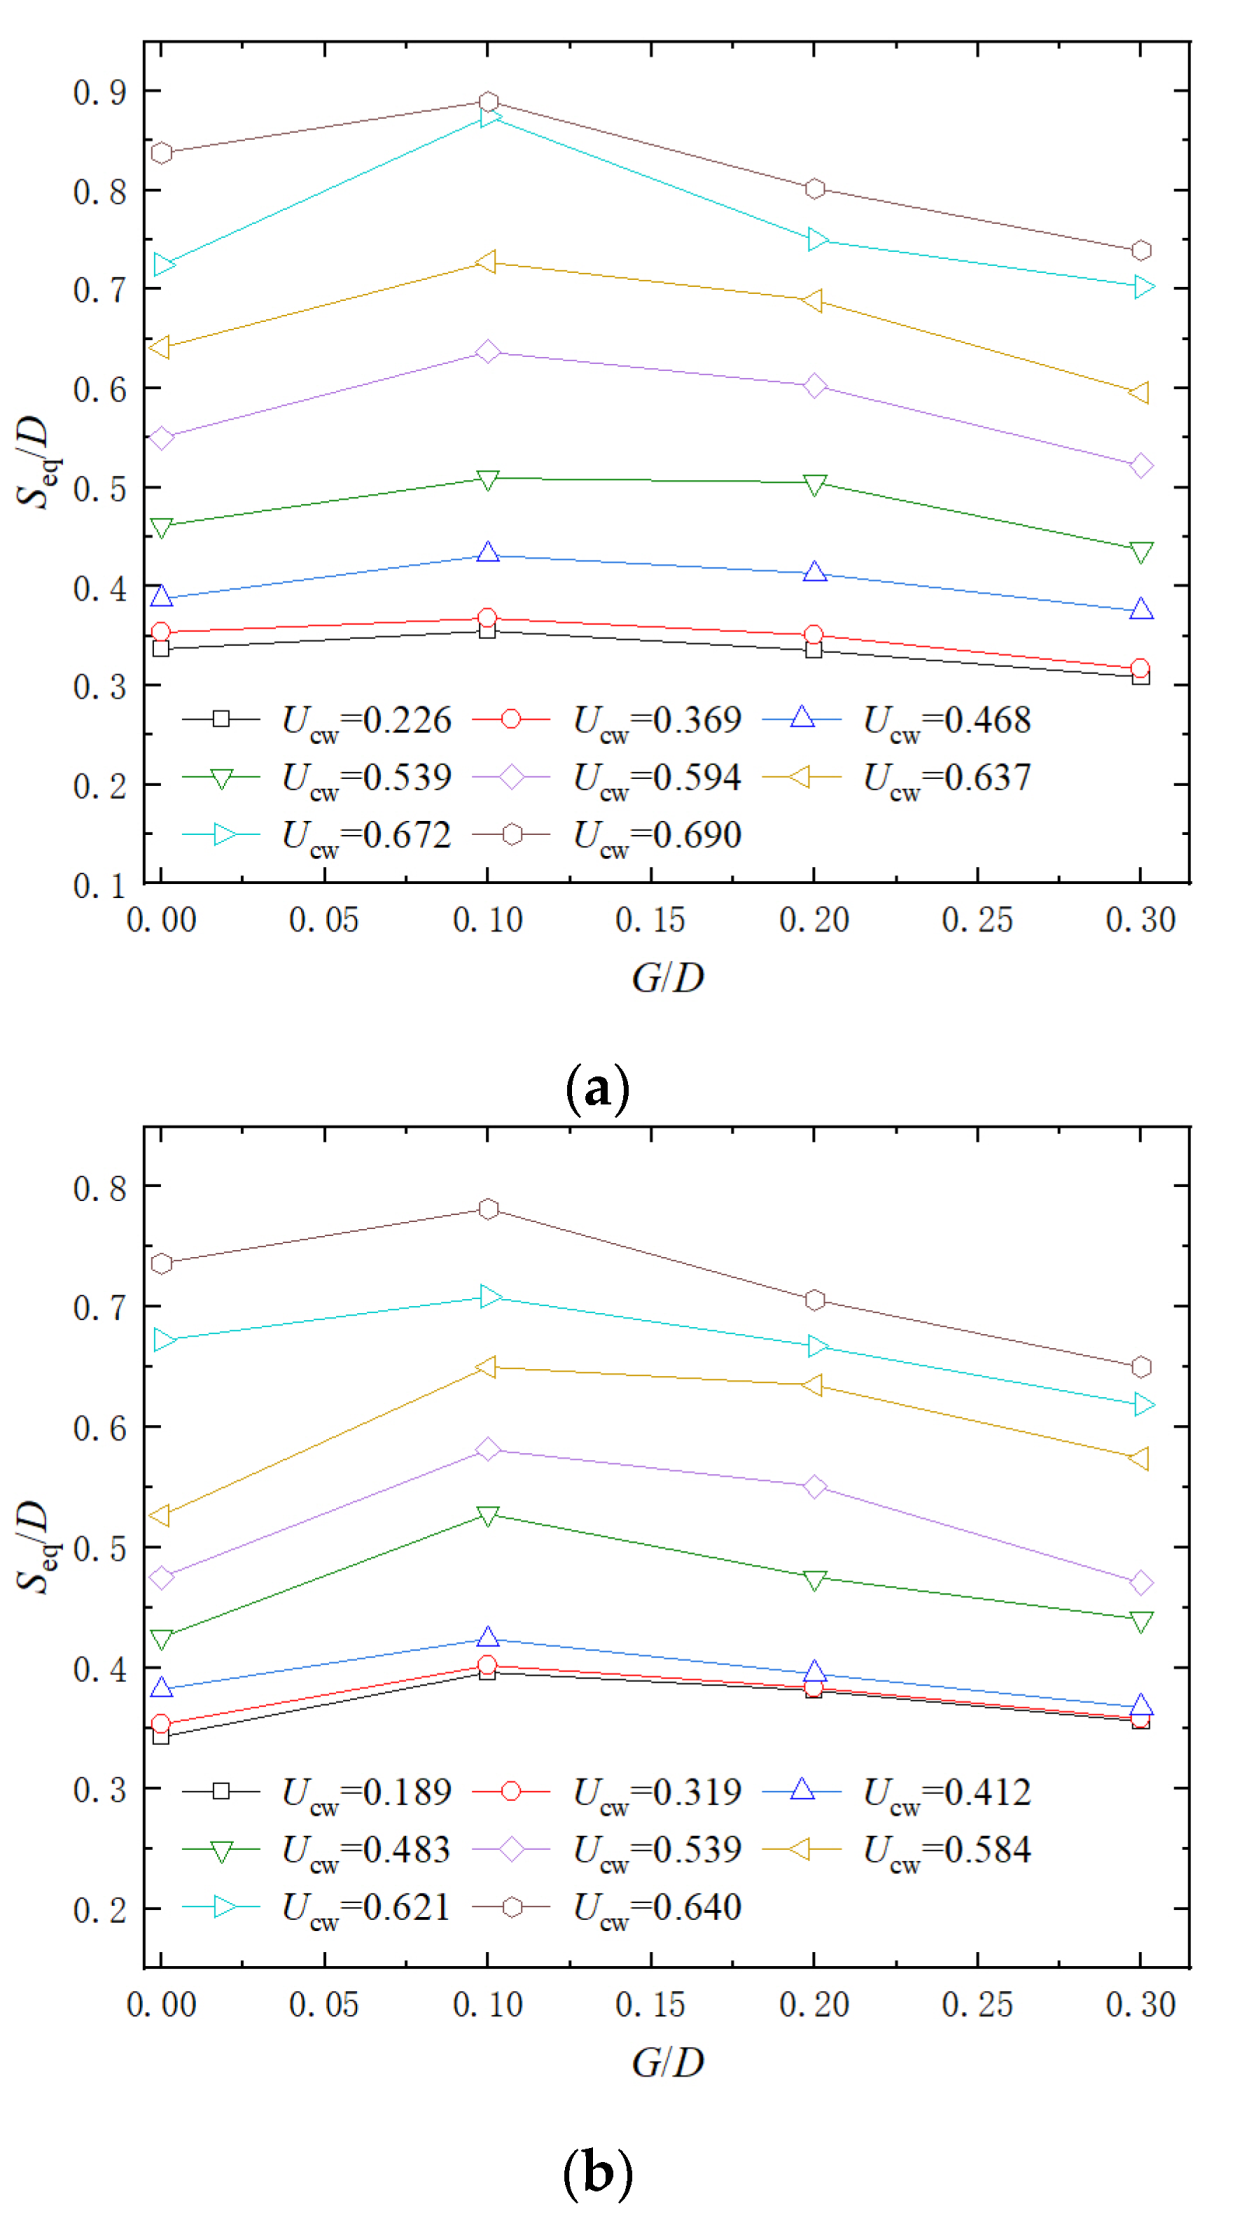
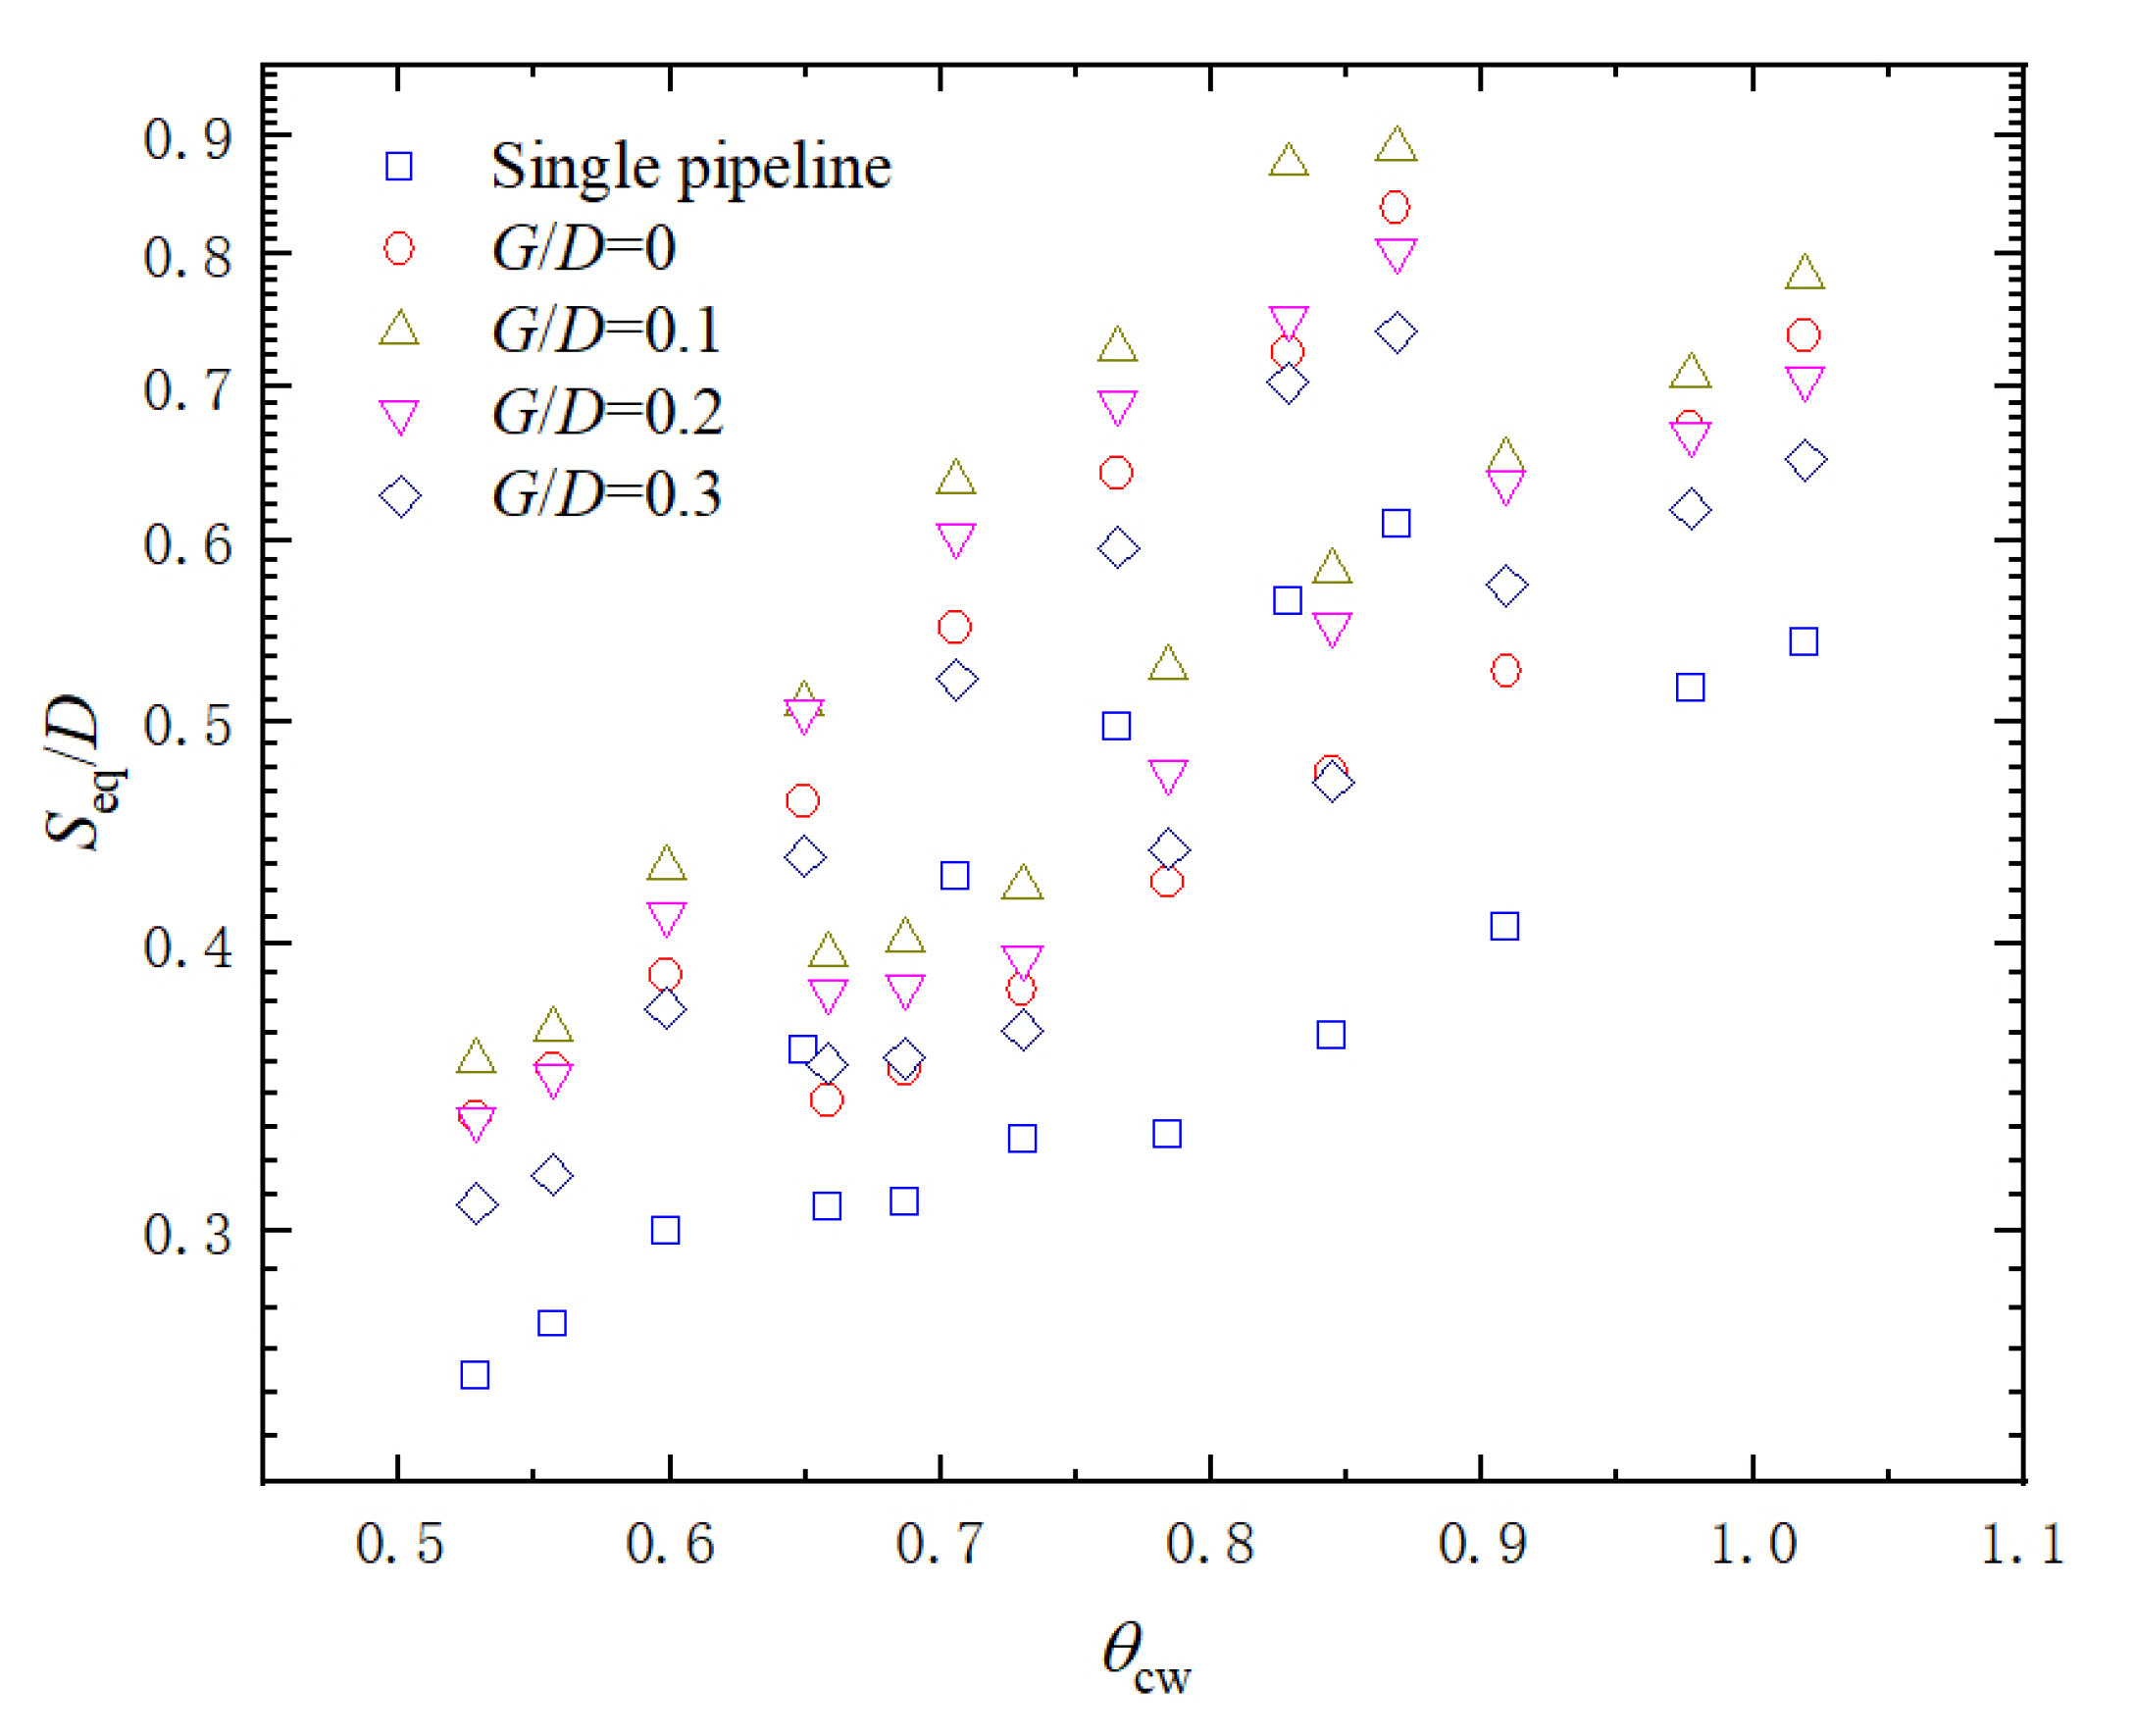
The equilibrium scour depth Seq below piggyback pipelines increases when the gap ratio G/D increases from 0 to 0.1, and it gradually decreases when G/D > 0.1. For small G/D, the small pipeline acts like a rigid spoiler attached on the top of the larger pipeline, which significantly increases the block area and turbulent velocity around the pipeline, causing more soil particles to be mobilized and, consequently, leading to more serious scour.
(2)
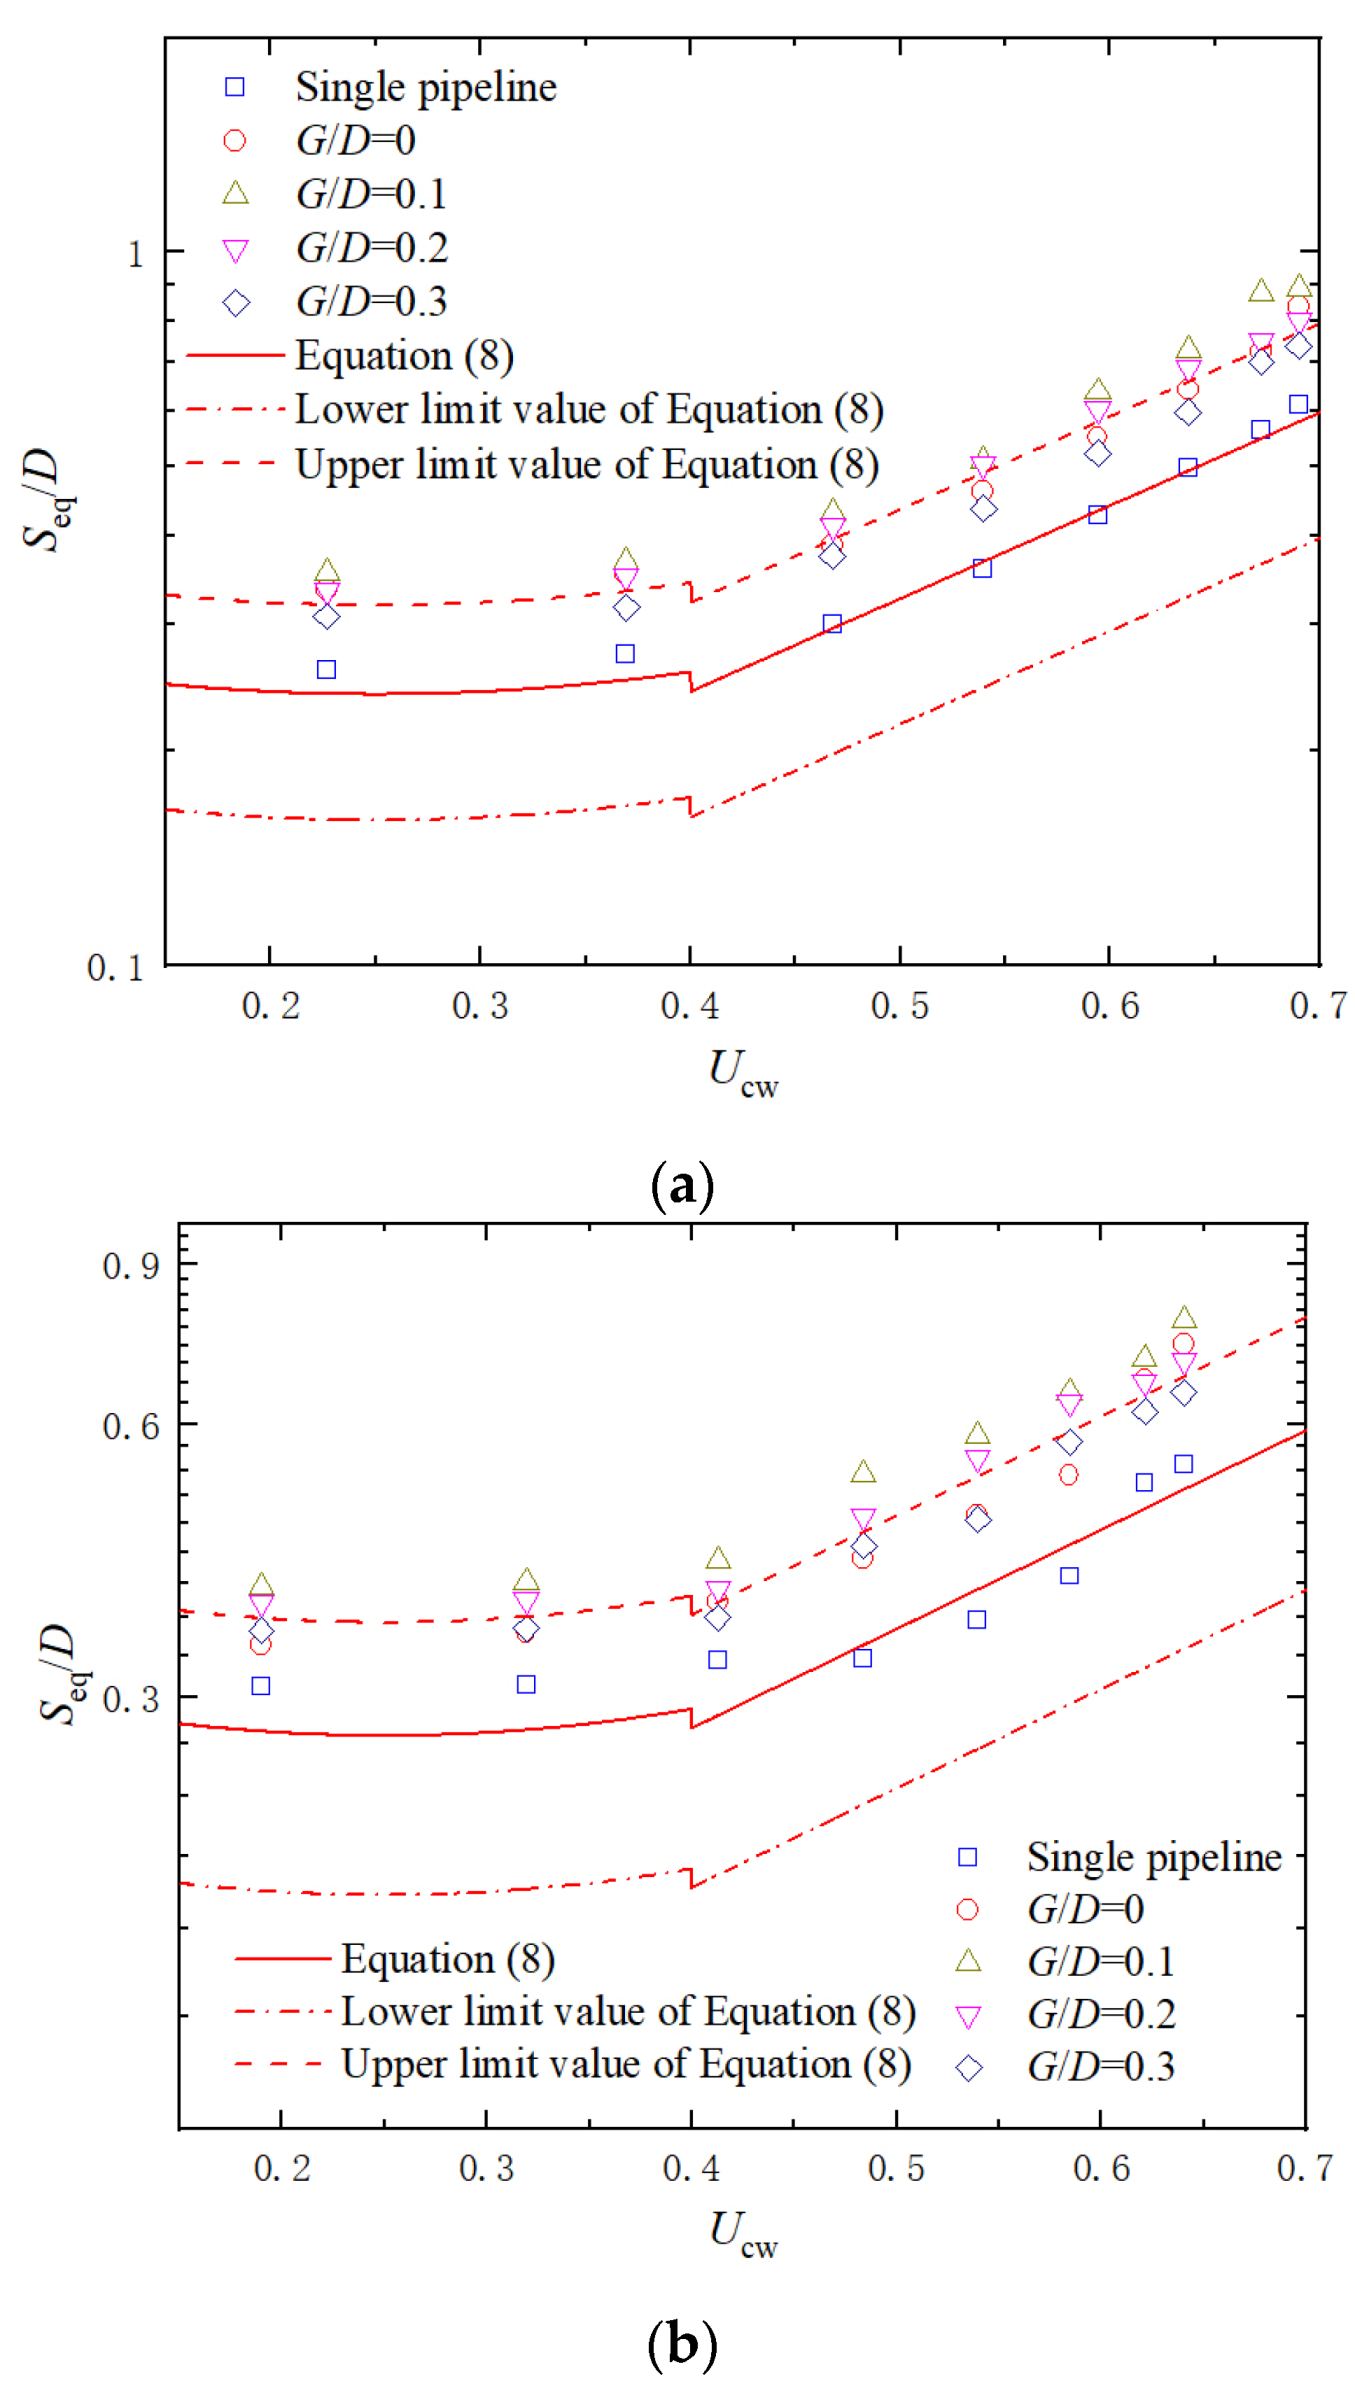
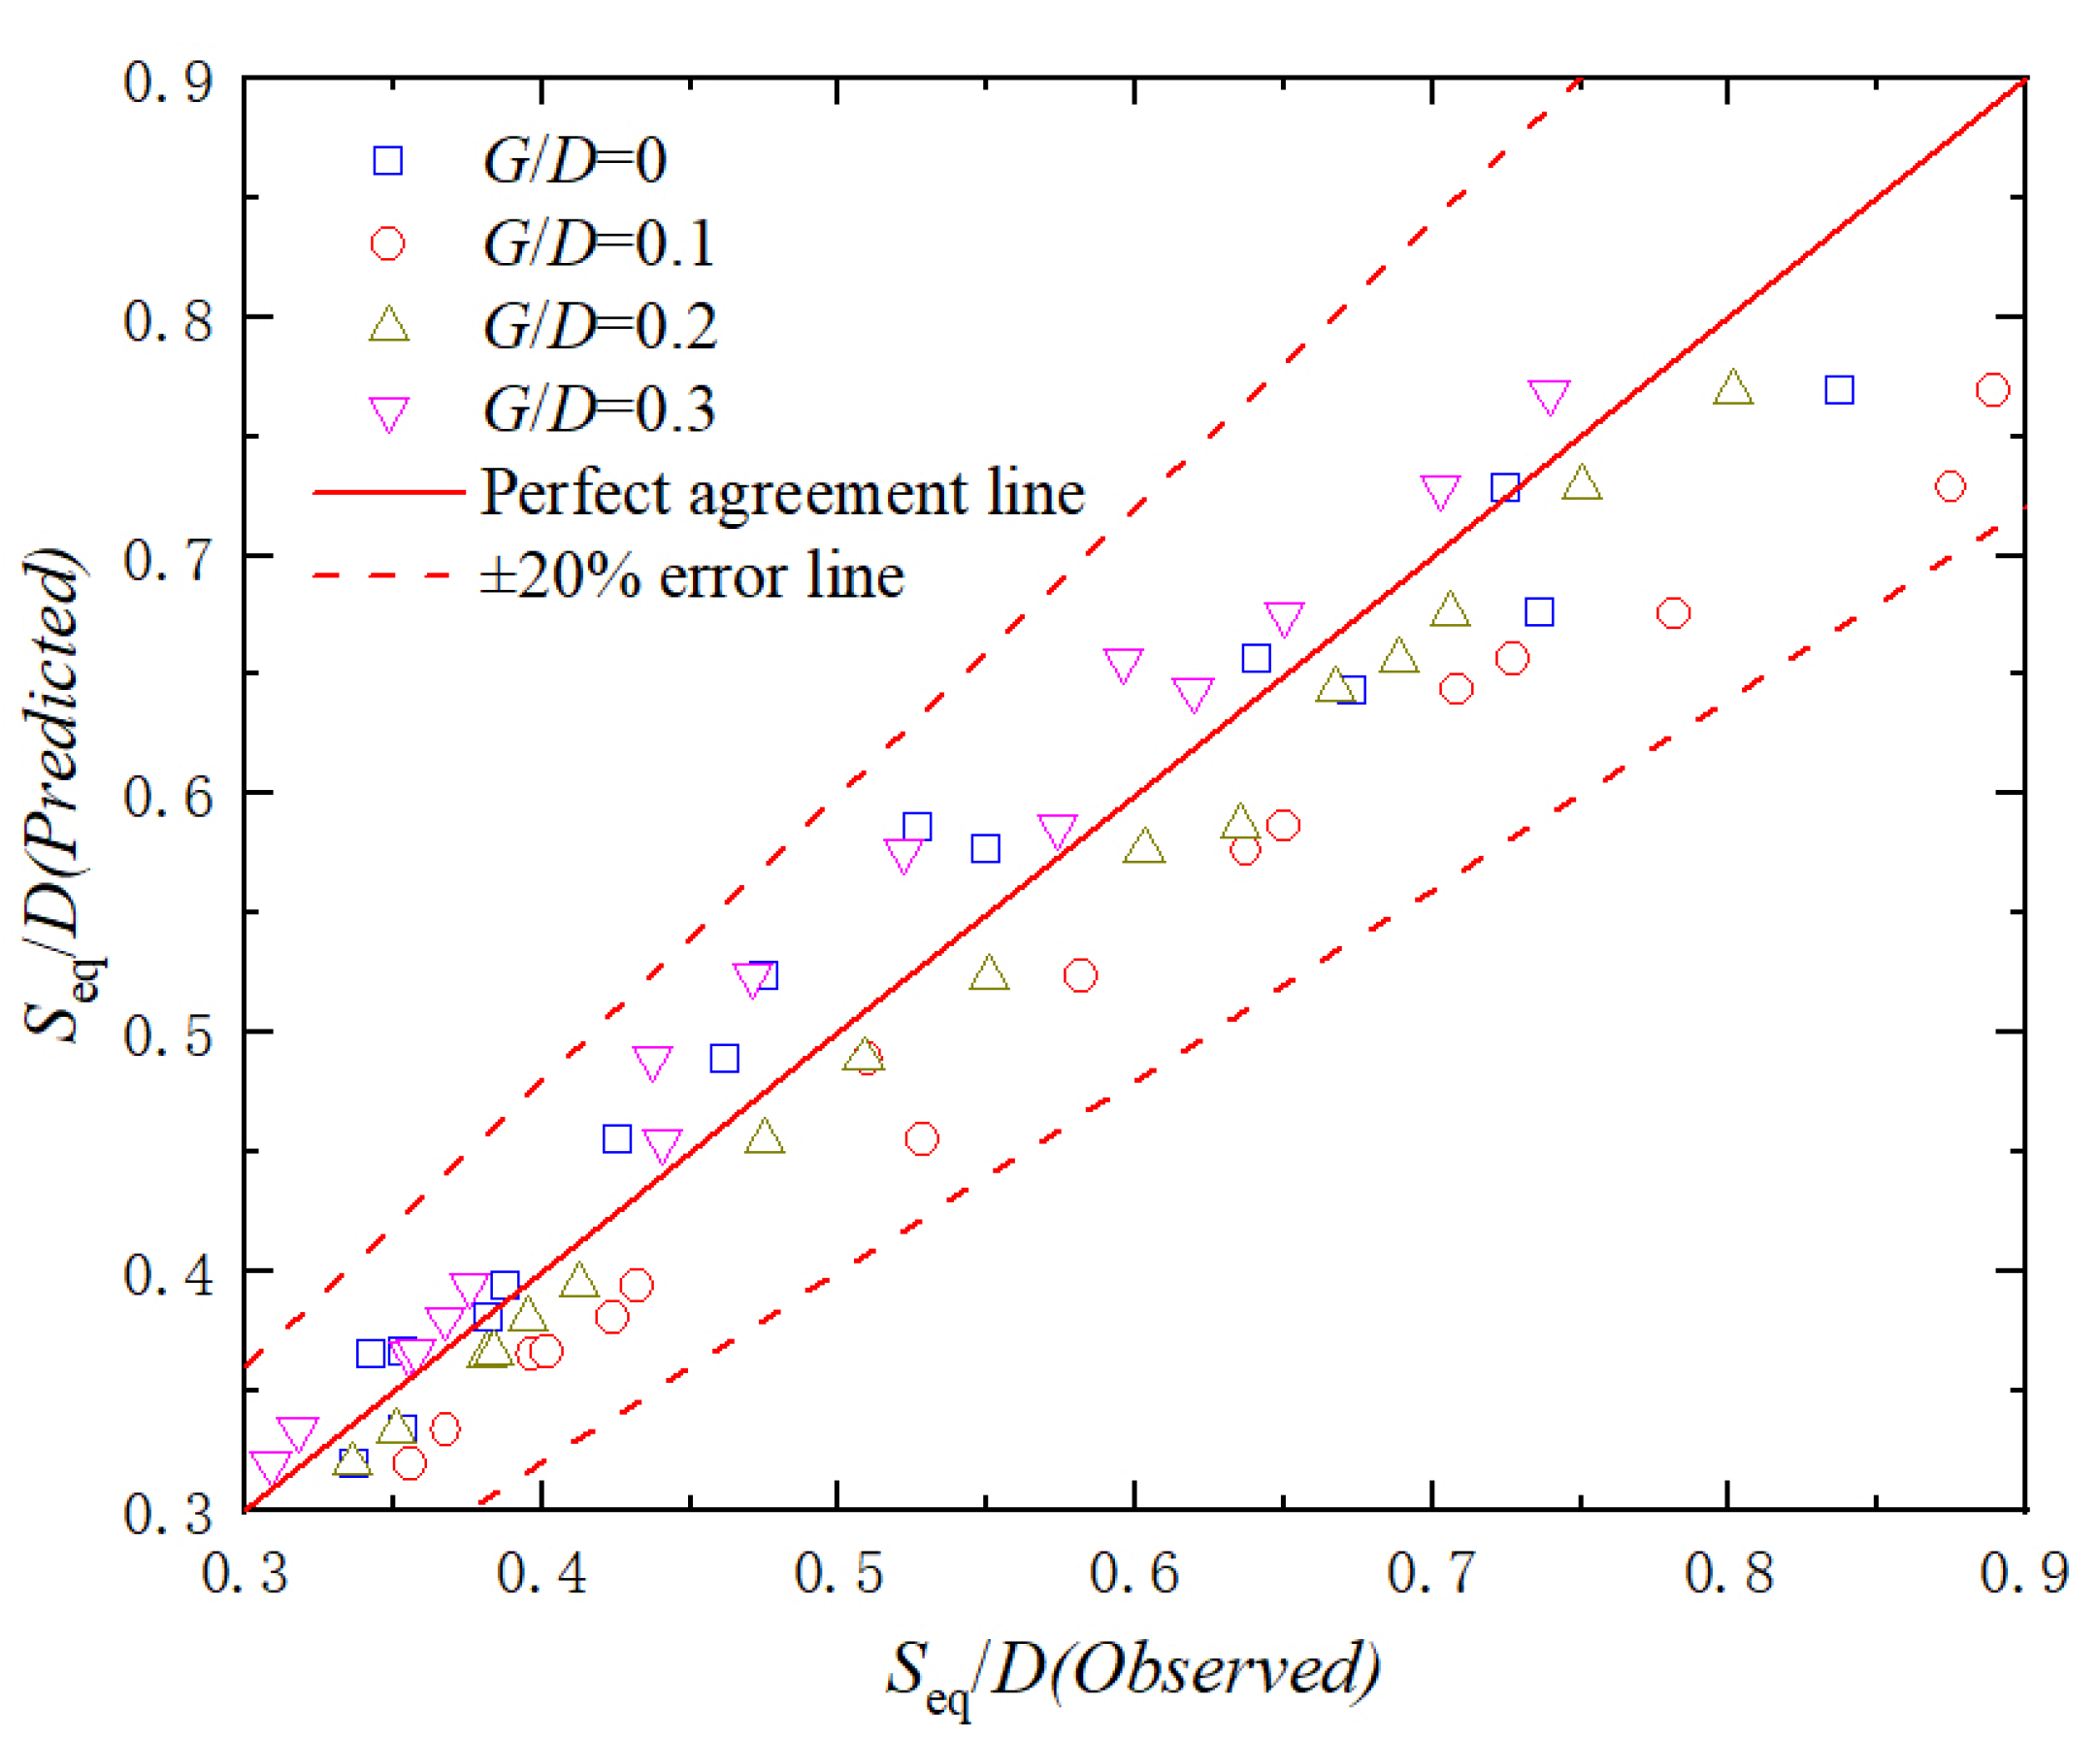
For a given KC, the Seq below the piggyback pipeline increases with the increase of the ratio of velocities Ucw. In addition, when Ucw is fixed, a higher KC results in a greater Seq. The upper limit results from Sumer and Fredsøe [28] are capable of predicting the Seq with favorable effects for G/D = 0~0.3.
(3)
The dimensionless scour timescale T* is closely related to the maximum Shields parameter θcw and the gap ratio G/D. Based on that, a new analytical expression is proposed to calculate the T* for a piggyback pipeline in combined waves and current.
(4)
The higher Red and θcw both tend to result in the greater scour depth below the piggyback pipeline in combined waves and current.

Author Contributions

Conceptualization, X.W.; Data curation, R.H. and H.L. (Hao Leng); Formal analysis, X.W. and H.L. (Hongjun Liu); Funding acquisition, X.W.; Writing—original draft, R.H. and Y.L.; Writing—review and editing, X.W. and H.L. (Hongjun Liu). All authors have read and agreed to the published version of the manuscript.

Funding

This research was funded by the Fundamental Research Funds for the Central Universities (grant number 202061027) and the National Natural Science Foundation of China (grant number 41572247).

Institutional Review Board Statement

Not applicable.

Informed Consent Statement

Not applicable.

Data Availability Statement

The data presented in this study are available on request from the corresponding author.

Conflicts of Interest

The authors declare no conflict of interest.

Notation

Hwwave height
Twave period
dwater depth
Gsspecific gravity of sediment particles
d50median diameter of sediment
ρsdensity of sediment
ρwdensity of fluid
ggravity acceleration
Ddiameter of the large pipeline
d′diameter of the small pipeline
G/Dgap ratio
Stinstantaneous scour depth
Scequilibrium scour depth in current-only condition
Seqequilibrium scour depth in combined waves and current
Tctime scale in scour process
T*dimensionless scour timescale
θcurShields parameter for the current-only case
θwShields parameter for the wave-only case
θmmean Shields parameter
θcwmaximum Shield parameter
Uccurrent velocity
Uwmmaximum undisturbed orbital velocity above the wave boundary layer
Ucwratio of velocities
Uf,wmaximum near-bed friction velocity for the wave-only case
Ummaximum value of the near-bed flow velocity in combined waves and current
RedReynolds number

References

  1. Jakobsen, M.L.; Sayer, P. Hydrodynamic forces on piggyback pipelines. In Proceedings of the 5th International Offshore and Polar Engineering Conference, Hague, Netherlands, 11–15 June 1995. [Google Scholar]
  2. Zhao, M.; Cheng, L.; Teng, B.; Dong, G. Hydrodynamic forces on dual cylinders of different diameters in steady currents. J. Fluids Struct. 2006, 23, 59–83. [Google Scholar] [CrossRef]
  3. Zhao, M.; Cheng, L.; Teng, B. Numerical Modeling of Flow and Hydrodynamic Forces around a Piggyback Pipeline near the Seabed. J. Waterw. Port. Coast. Ocean. Eng. 2007, 133, 286–295. [Google Scholar] [CrossRef]
  4. Yang, H.; Ni, H. An applicable replacement bundled pipeline structure for offshore marginal oilfield development. Ship Build. China 2007, 48, 563–570. [Google Scholar]
  5. Fredsøe, J. Pipeline–seabed interaction. J. Waterw. Port Coast. Ocean Eng. 2016, 142, 03116002. [Google Scholar] [CrossRef] [Green Version]
  6. Liang, D.; Cheng, L. Numerical Model for Wave-Induced Scour below a Submarine Pipeline. J. Waterw. Port Coast. Ocean. Eng. 2005, 131, 193–202. [Google Scholar] [CrossRef]
  7. Seth, D.; Manna, B.; Shahu, J.T.; Fazeres-Ferradosa, T.; Pinto, F.T.; Rosa-Santos, P.J. Buckling Mechanism of Offshore Pipelines: A State of the Art. J. Mar. Sci. Eng. 2021, 9, 1074. [Google Scholar] [CrossRef]
  8. Fazeres-Ferradosa, T.; Rosa-Santos, P.; Taveira-Pinto, F.; Vanem, E.; Carvalho, H.; Correia, J.A.F.D.O. Advanced research on offshore structures and foundation design: Part 1. Proc. Inst. Civ. Eng. Marit. Eng. 2019, 4, 118–123. [Google Scholar] [CrossRef]
  9. Sumer, B.; Truelsen, C.; Sichmann, T.; Fredsøe, J. Onset of scour below pipelines and self-burial. Coast. Eng. 2001, 42, 313–335. [Google Scholar] [CrossRef]
  10. Yang, L.; Shi, B.; Guo, Y.; Wen, X. Calculation and experiment on scour depth for submarine pipeline with a spoiler. Ocean Eng. 2012, 55, 191–198. [Google Scholar] [CrossRef]
  11. Yang, L.; Shi, B.; Guo, Y.; Zhang, L.; Zhang, J.; Han, Y. Scour protection of submarine pipelines using rubber plates underneath the pipes. Ocean Eng. 2014, 84, 176–182. [Google Scholar] [CrossRef] [Green Version]
  12. Zang, Z.; Tang, G.; Chen, Y.; Cheng, L.; Zhang, J. Predictions of the equilibrium depth and time scale of local scour below a partially buried pipeline under oblique currents and waves. Coast. Eng. 2019, 150, 94–107. [Google Scholar] [CrossRef]
  13. Hu, R.; Wang, X.; Liu, H.; Leng, H. Scour Protection of Submarine Pipelines Using Ionic Soil Stabilizer Solidified Soil. J. Mar. Sci. Eng. 2022, 10, 76. [Google Scholar] [CrossRef]
  14. Gao, F.-P. Flow-pipe-soil coupling mechanisms and predictions for submarine pipeline instability. J. Hydrodyn. 2017, 29, 763–773. [Google Scholar] [CrossRef]
  15. Chiew, Y.M. Mechanics of Local Scour around Submarine Pipelines. J. Hydraul. Eng. 1990, 116, 515–529. [Google Scholar] [CrossRef]
  16. Lu, L.; Li, Y.; Chen, B. Mechanism of Local Scour around Submarine Pipelines Based on Numerical Simulation of Turbulence Model. In Proceedings of the 24th International Conference on Offshore Mechanics and Arctic Engineering, Halkidiki, Greece, 12–17 June 2005; pp. 677–683. [Google Scholar] [CrossRef]
  17. Fredsoe, J.; Sumer, B.M.; Arnskov, M.M. Time scale for wave/current scour below pipelines. In Proceedings of the 1st International Offshore and Polar Engineering Conference, Edinburgh, UK, 11–16 August 1991. [Google Scholar]
  18. Liu, M.-M.; Lu, L.; Teng, B.; Zhao, M.; Tang, G.-Q. Numerical modeling of local scour and forces for submarine pipeline under surface waves. Coast. Eng. 2016, 116, 275–288. [Google Scholar] [CrossRef]
  19. Fuhrman, D.R.; Baykal, C.; Sumer, B.M.; Jacobsen, N.G.; Fredsøe, J. Numerical simulation of wave-induced scour and back-filling processes beneath submarine pipelines. Coast. Eng. 2014, 94, 10–22. [Google Scholar] [CrossRef]
  20. Zhao, E.; Dong, Y.; Tang, Y.; Sun, J. Numerical investigation of hydrodynamic characteristics and local scour mechanism around submarine pipelines under joint effect of solitary waves and currents. Ocean Eng. 2021, 222, 108553. [Google Scholar] [CrossRef]
  21. Ahmad, N.; Bihs, H.; Myrhaug, D.; Kamath, A.; Arntsen, A. Numerical modelling of pipeline scour under the combined action of waves and current with free-surface capturing. Coast. Eng. 2019, 148, 19–35. [Google Scholar] [CrossRef]
  22. Zhao, M.; Cheng, L. Numerical Modeling of Local Scour below a Piggyback Pipeline in Currents. J. Hydraul. Eng. 2008, 134, 1452–1463. [Google Scholar] [CrossRef]
  23. Yang, S.; Shi, B.; Guo, Y. Investigation on scour scale of piggyback pipeline under wave conditions. Ocean Eng. 2019, 182, 196–202. [Google Scholar] [CrossRef]
  24. Zang, Z.P.; Gao, F.P. Steady current induced vibration of near-bed piggyback pipelines: Configuration effects on VIV sup-pression, Appl. Ocean Res. 2014, 46, 62–69. [Google Scholar] [CrossRef] [Green Version]
  25. Zhao, E.; Shi, B.; Qu, K.; Dong, W.; Zhang, J. Experimental and Numerical Investigation of Local Scour Around Submarine Piggyback Pipeline under Steady Current. J. Ocean Univ. China 2018, 17, 244–256. [Google Scholar] [CrossRef]
  26. Yang, S.; Shi, B.; Guo, Y.; Yang, L. Investigation on scour protection of submarine piggyback pipeline. Ocean Eng. 2019, 182, 442–450. [Google Scholar] [CrossRef]
  27. Yang, S.; Guo, Y.; Shi, B.; Yu, G.; Yang, L.; Zhang, M. Numerical investigation of the influence of the small pipeline on local scour morphology around the piggyback pipeline. Ocean Eng. 2021, 240, 109973. [Google Scholar] [CrossRef]
  28. Sumer, B.M.; Fredsøe, J. Scour around pipelines in combined waves and current. In Proceedings of the Offshore Mechanics and Arctic Engineering, New York, NY, USA, 16–20 June 1996. [Google Scholar]
  29. Sumer, B.M.; Fredsøe, J. Scour around Pile in Combined Waves and Current. J. Hydraul. Eng. 2001, 127, 403–411. [Google Scholar] [CrossRef]
  30. Soulsby, R. Dynamics of Marine Sands; Thomas Telford Ltd.: London, UK, 1998. [Google Scholar]
  31. Whitehouse, R. Scour at Marine Structures: A Manual for Practical Applications; Thomas Telford Ltd.: London, UK, 1998. [Google Scholar]
  32. Zhang, Q.; Draper, S.; Cheng, L.; An, H. Time Scale of Local Scour around Pipelines in Current, Waves, and Combined Waves and Current. J. Hydraul. Eng. 2017, 143, 04016093. [Google Scholar] [CrossRef]
  33. Asrari, S.; Hakimzadeh, H.; Kardan, N. Investigation on the local scour beneath piggyback pipelines under clear-water conditions. China Ocean Eng. 2021, 35, 422–431. [Google Scholar] [CrossRef]
  34. Larsen, B.E.; Fuhrman, D.R.; Sumer, B.M. Simulation of Wave-Plus-Current Scour beneath Submarine Pipelines. J. Waterw. Port, Coastal, Ocean Eng. 2016, 142, 04016003. [Google Scholar] [CrossRef] [Green Version]
  35. Xu, J.; Li, G.; Dong, P.; Shi, J. Bedform evolution around a submarine pipeline and its effects on wave-induced forces under regular waves. Ocean Eng. 2010, 37, 304–313. [Google Scholar] [CrossRef]
  36. Fredsøe, J.; Deigaard, R. Mechanics of Coastal Sediment Transport; World Scientific: Singapore, 1992. [Google Scholar]
  37. Qi, W.; Gao, F. Equilibrium scour depth at offshore monopile foundation in combined waves and current. Sci. China Technol. Sci. 2014, 57, 1030–1039. [Google Scholar] [CrossRef] [Green Version]
  38. Zang, Z.; Cheng, L.; Zhao, M.; Liang, D.; Teng, B. A numerical model for onset of scour below offshore pipelines. Coast. Eng. 2009, 56, 458–466. [Google Scholar] [CrossRef]
Figure 1. Sketch of experimental setup.
Jmse 10 00350 g001
Figure 2. Grain size distribution curves of the sandy silt for scour experiments.
Jmse 10 00350 g002
Figure 3. Temporal development of scour depth for Case 2.
Jmse 10 00350 g003
Figure 4. Closeup of the highlighted area of Figure 3.
Jmse 10 00350 g004
Figure 5. Scour profiles at the end of tests for Case 2.
Jmse 10 00350 g005
Figure 6. The curves between Seq/D and G/D for different Ucw: (a) KC = 8.53; (b) KC = 10.67.
Jmse 10 00350 g006
Figure 7. The relationships of Seq/D and Ucw for different G/D: (a) KC = 8.53; (b) KC = 10.67.
Jmse 10 00350 g007
Figure 8. Comparison of experimental values and predicted results by Equation (8).
Jmse 10 00350 g008
Figure 9. The relationships of T* and θcw for different G/D: (a) G/D = 0; (b) G/D = 0.1; (c) G/D = 0.2; (d) G/D = 0.3.
Jmse 10 00350 g009
Figure 10. The fitted results between f (G/D) and G/D.
Jmse 10 00350 g010
Figure 11. The relationships between Seq/D and Red for single and piggyback pipelines.
Jmse 10 00350 g011
Figure 12. The relationships between Seq/D and θcw for single and piggyback pipelines.
Jmse 10 00350 g012
Table 1. Experimental plans and parameters for single and piggyback pipelines.
CaseHw(m)Uc(m/s)KCUcwθwθcurθcw
10.080.058.530.2270.5190.0050.529
20.080.108.530.3690.5190.0180.557
30.080.158.530.4680.5190.0410.599
40.080.208.530.5400.5190.0730.650
50.080.258.530.5940.5190.1150.706
60.080.308.530.6370.5190.1650.765
70.080.358.530.6720.5190.2240.828
80.080.388.530.6900.5190.2650.868
90.100.0510.670.1900.6480.0050.658
100.100.1010.670.3190.6480.0180.687
110.100.1510.670.4130.6480.0410.730
120.100.2010.670.4840.6480.0730.784
130.100.2510.670.5400.6480.1150.844
140.100.3010.670.5840.6480.1650.909
150.100.3510.670.6210.6480.2240.977
160.100.3810.670.6400.6480.2651.019
Publisher’s Note: MDPI stays neutral with regard to jurisdictional claims in published maps and institutional affiliations.

