
Human Error Probability Assessment for LNG Bunkering Based on Fuzzy Bayesian Network-CREAM Model


Abstract
:1. Introduction
- (1)
- All HEPs in a specific LNG bunkering operation are the same. There are two reasons for this. Firstly, the individual differences of operators are ignored due to few on-site operators needed according to practice. Usually, there are less than five on-site operators during LNG bunkering. Secondly, all human operations are stipulated in the LNG bunkering operation manual, and any possible human error is a violation of the procedures in the operation manual. In other words, human error modes are essentially the same.
- (2)
- The HEP is independent of time. This means that HEP remains the same irrespective of how long the bunking operations last. This is different from the probabilities of failure of technical equipment, which increase with time or deterioration of the equipment. This is equivalent to treating a person as “a new equipment” at all times [9].
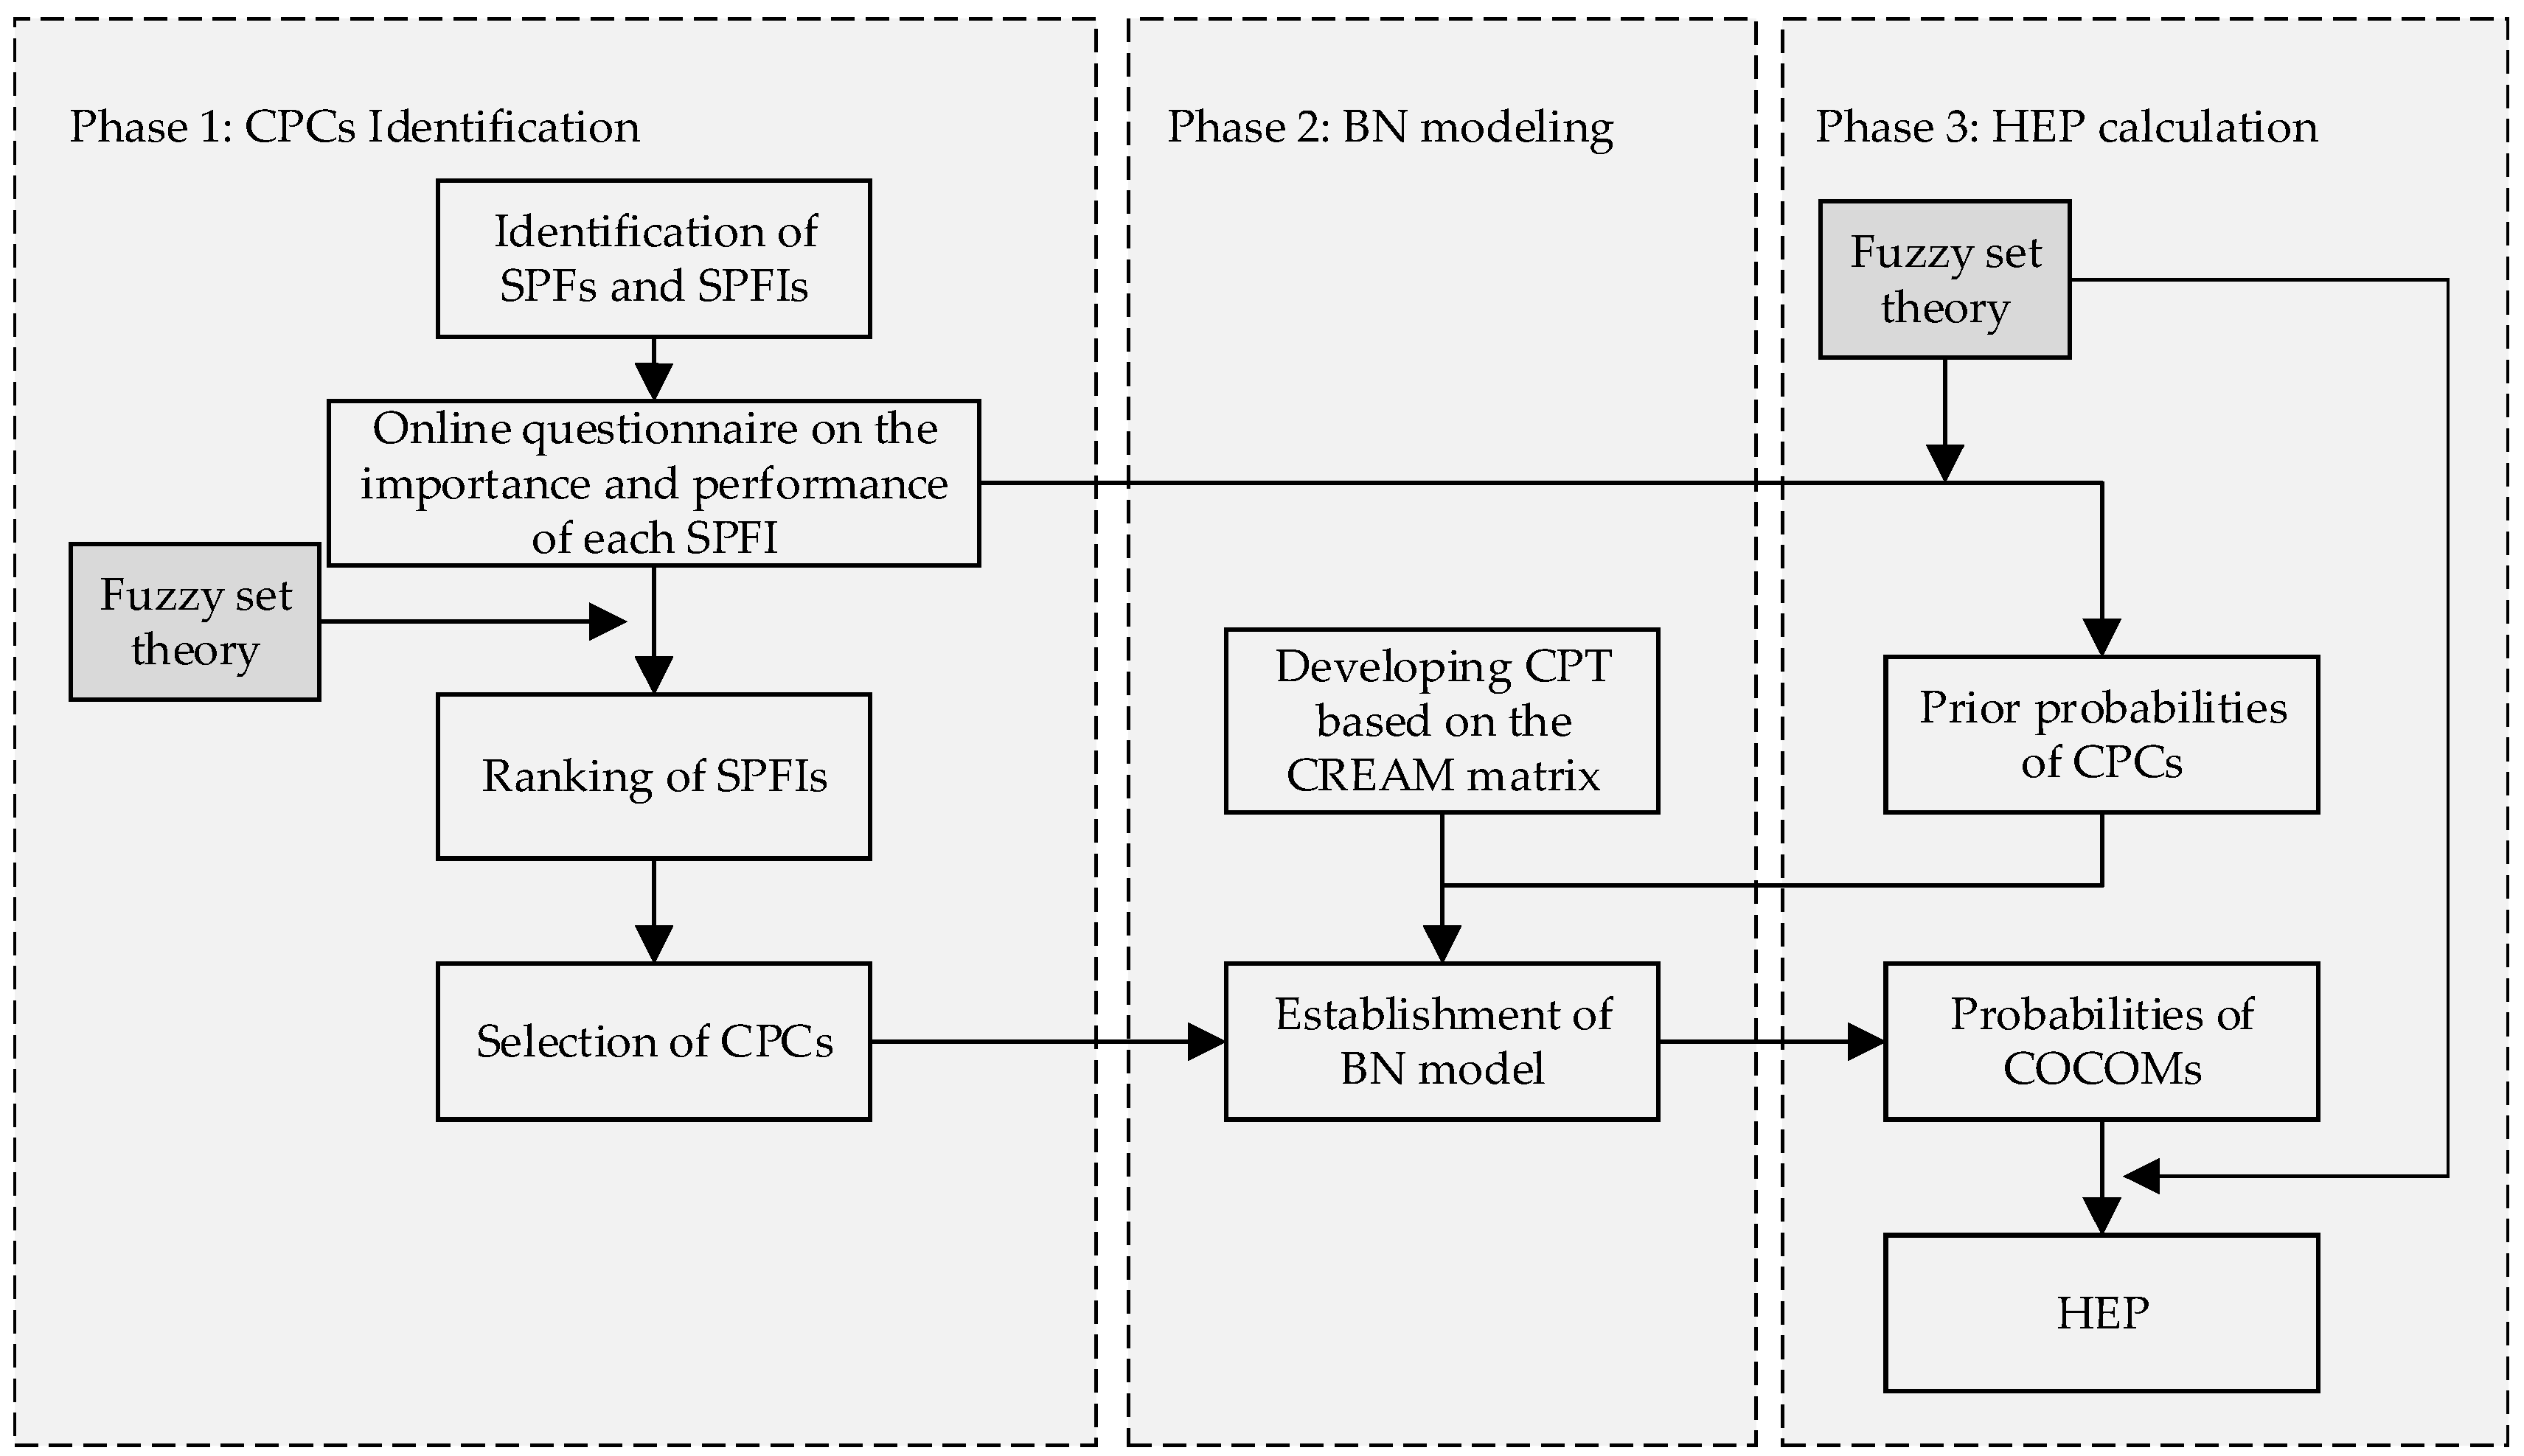
2. Methodology
2.1. Identification of the Common Performance Condition Indicators (CPCs)
2.1.1. Identifications of the Safety Philosophical Factors (SPFs) and the Safety Philosophical Factors’ Indicators (SPFIs)
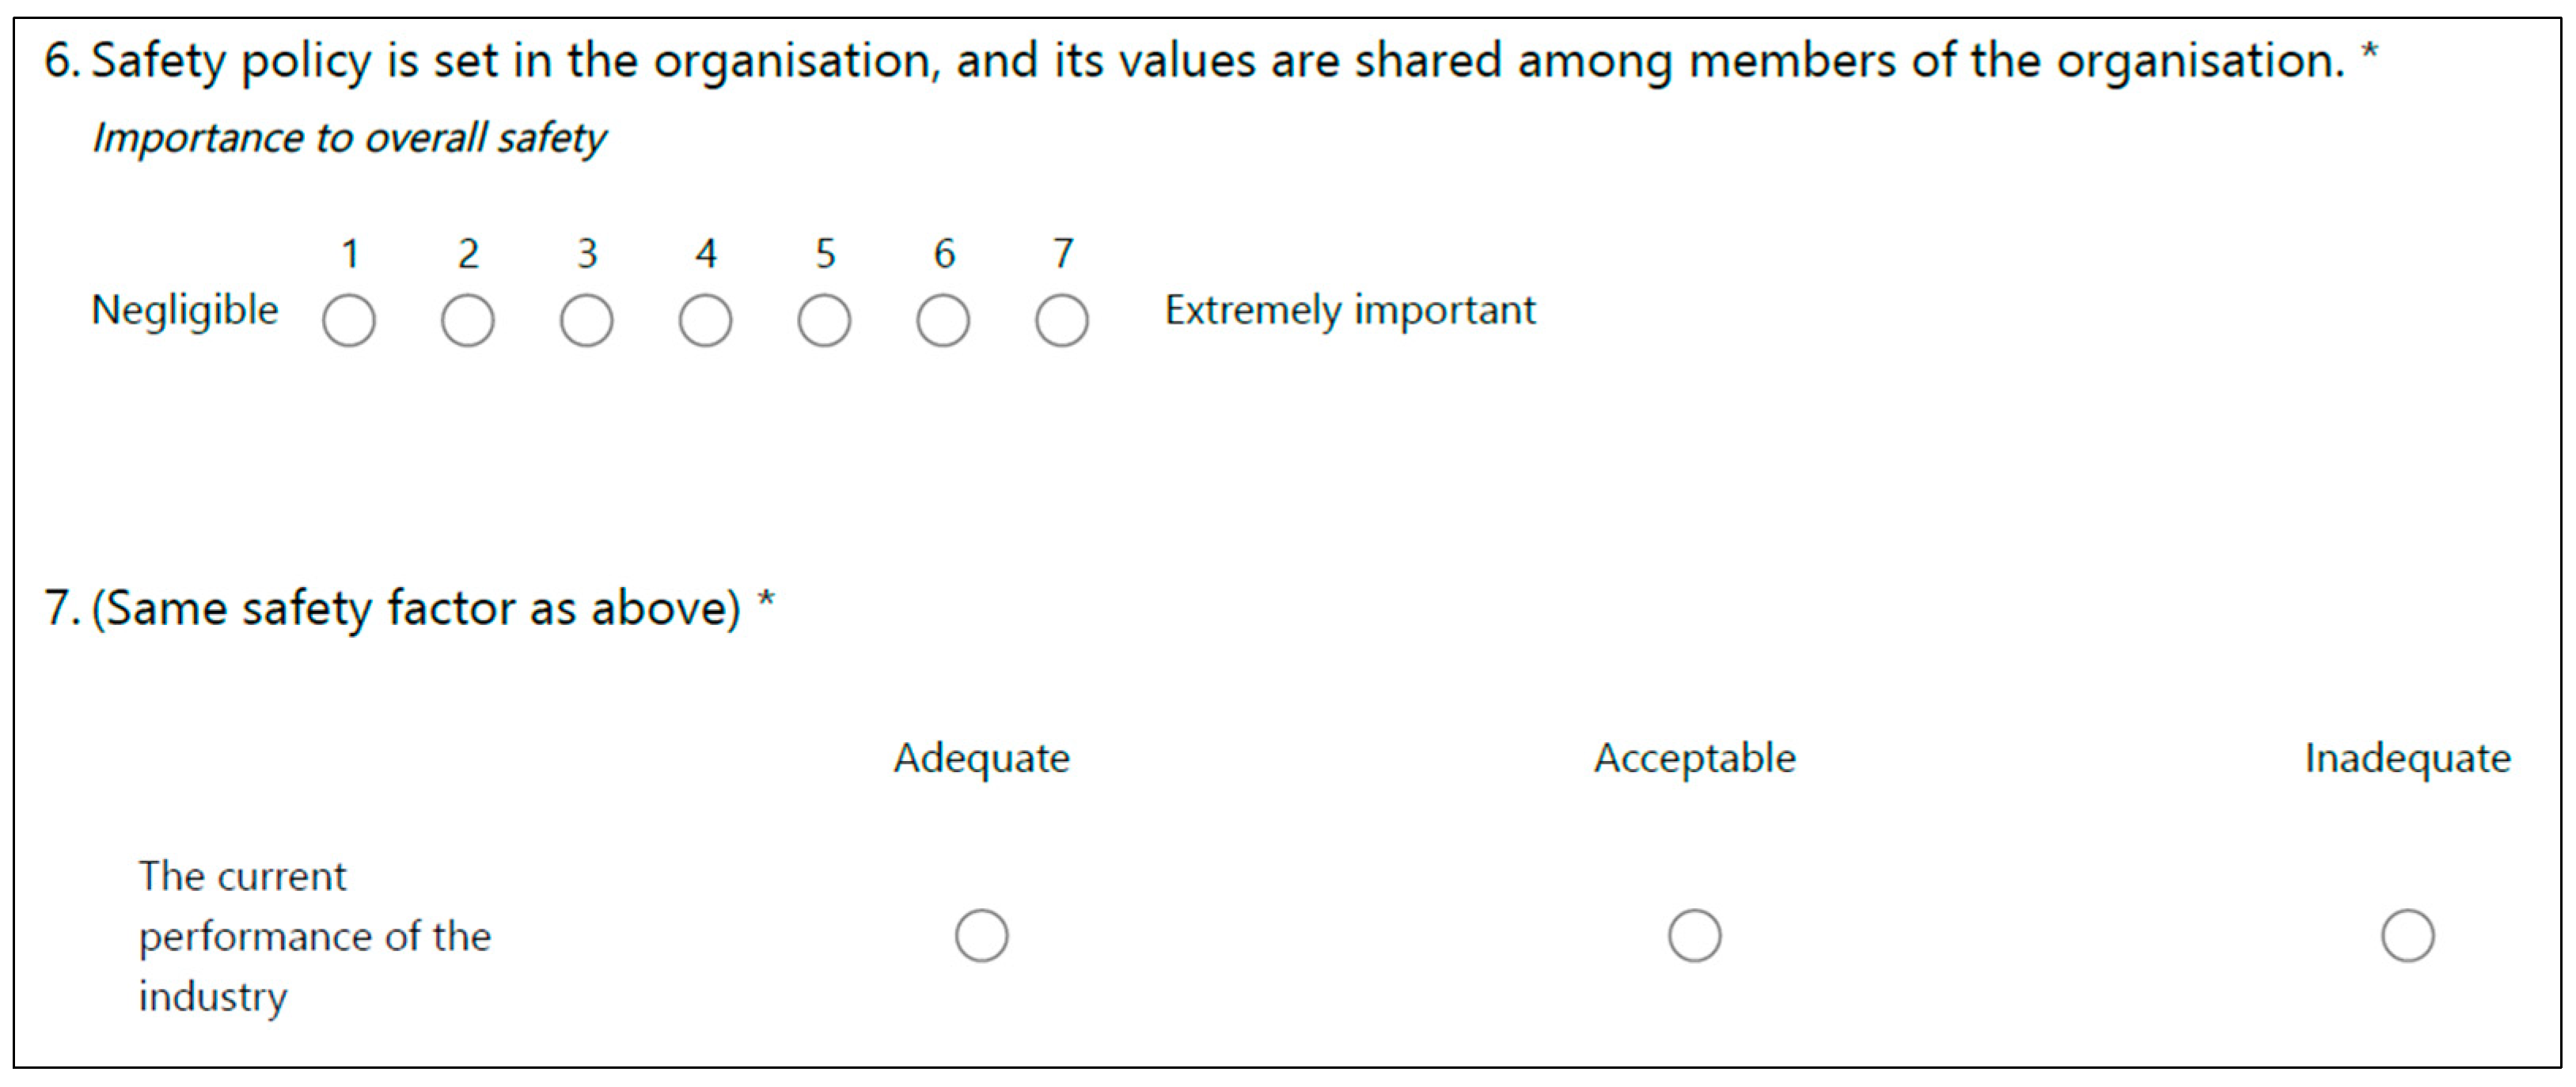
2.1.2. Online Questionnaire on Importance and Performance of the Safety Philosophical Factors’ Indicators (SPFIs)
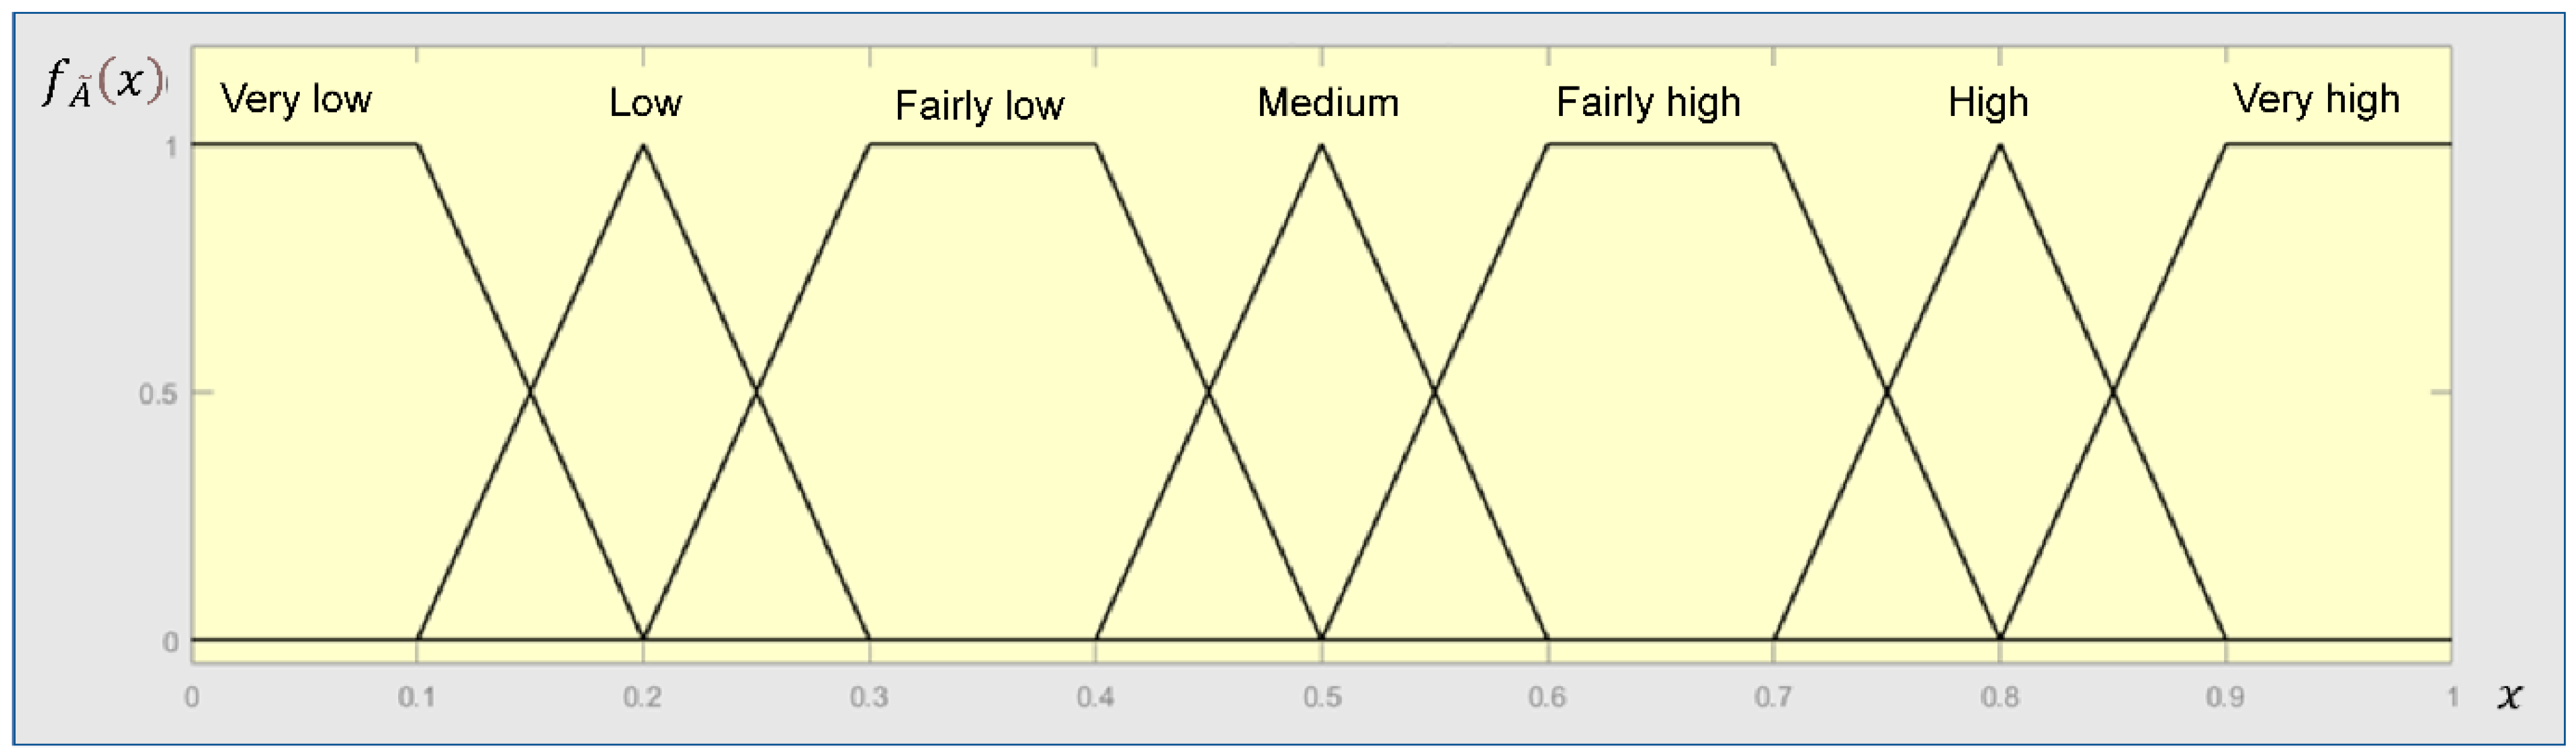
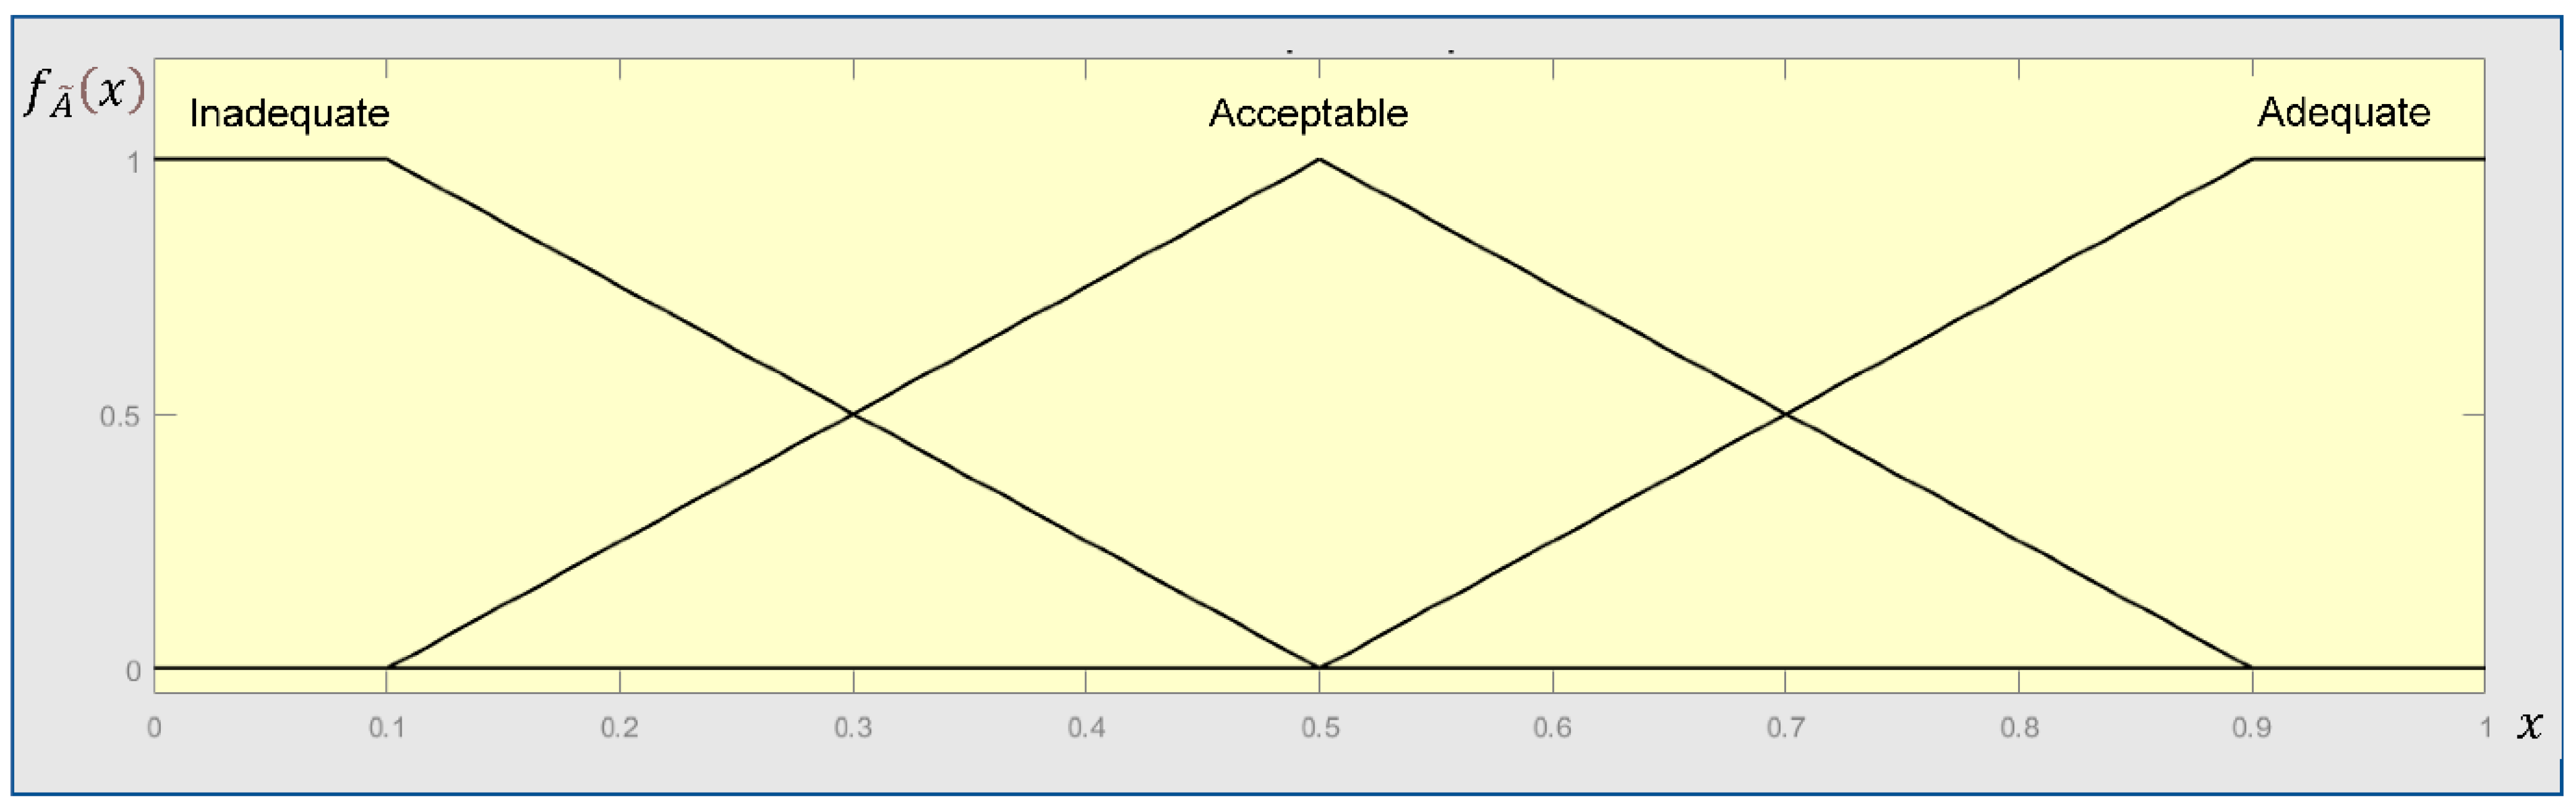
2.1.3. Converting the Experts’ Qualitative Linguistic Expression into Fuzzy Numbers (FNs)
- (1)
- outside some interval ;
- (2)
- is non-decreasing (monotonic increasing) on ; and non-increasing (monotonic decreasing) on ;
- (3)
- for each .
2.1.4. Aggregating the Fuzzy Sets into an Integrated Fuzzy Set
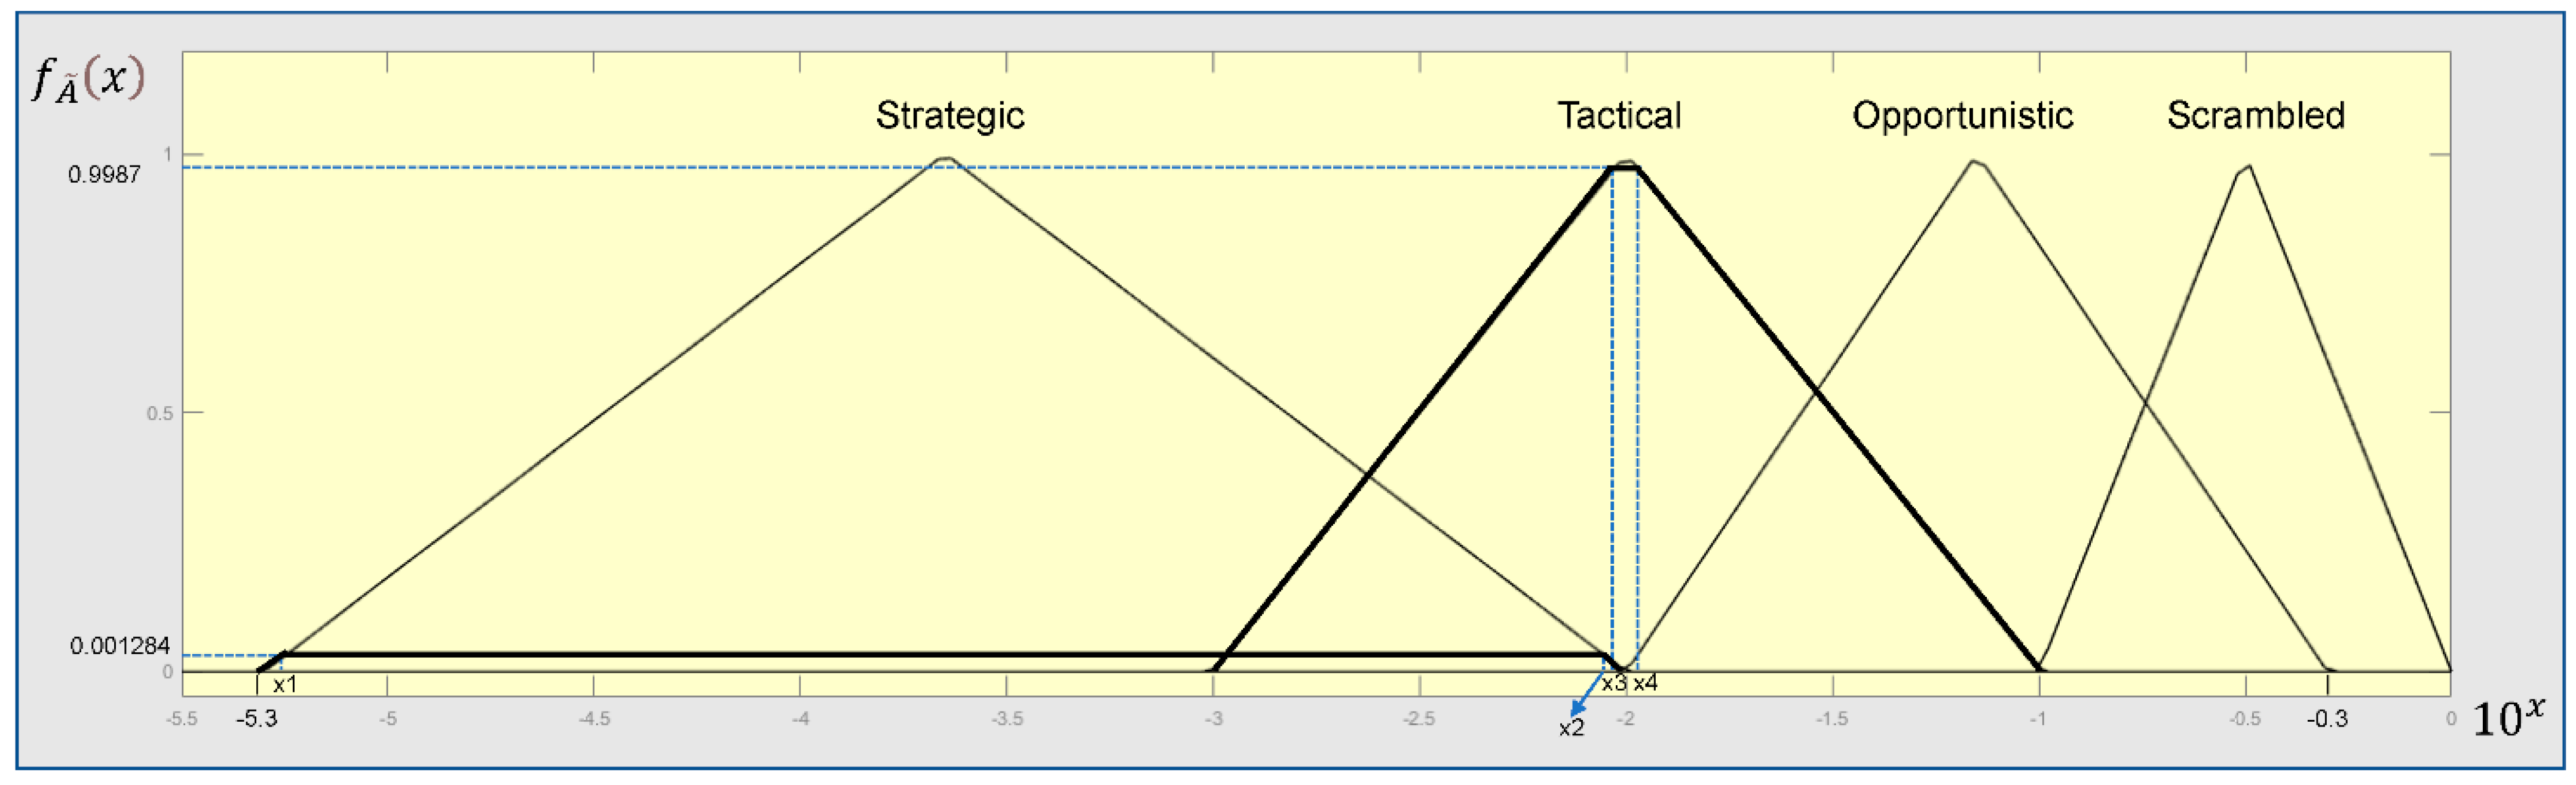
2.1.5. Defuzzification
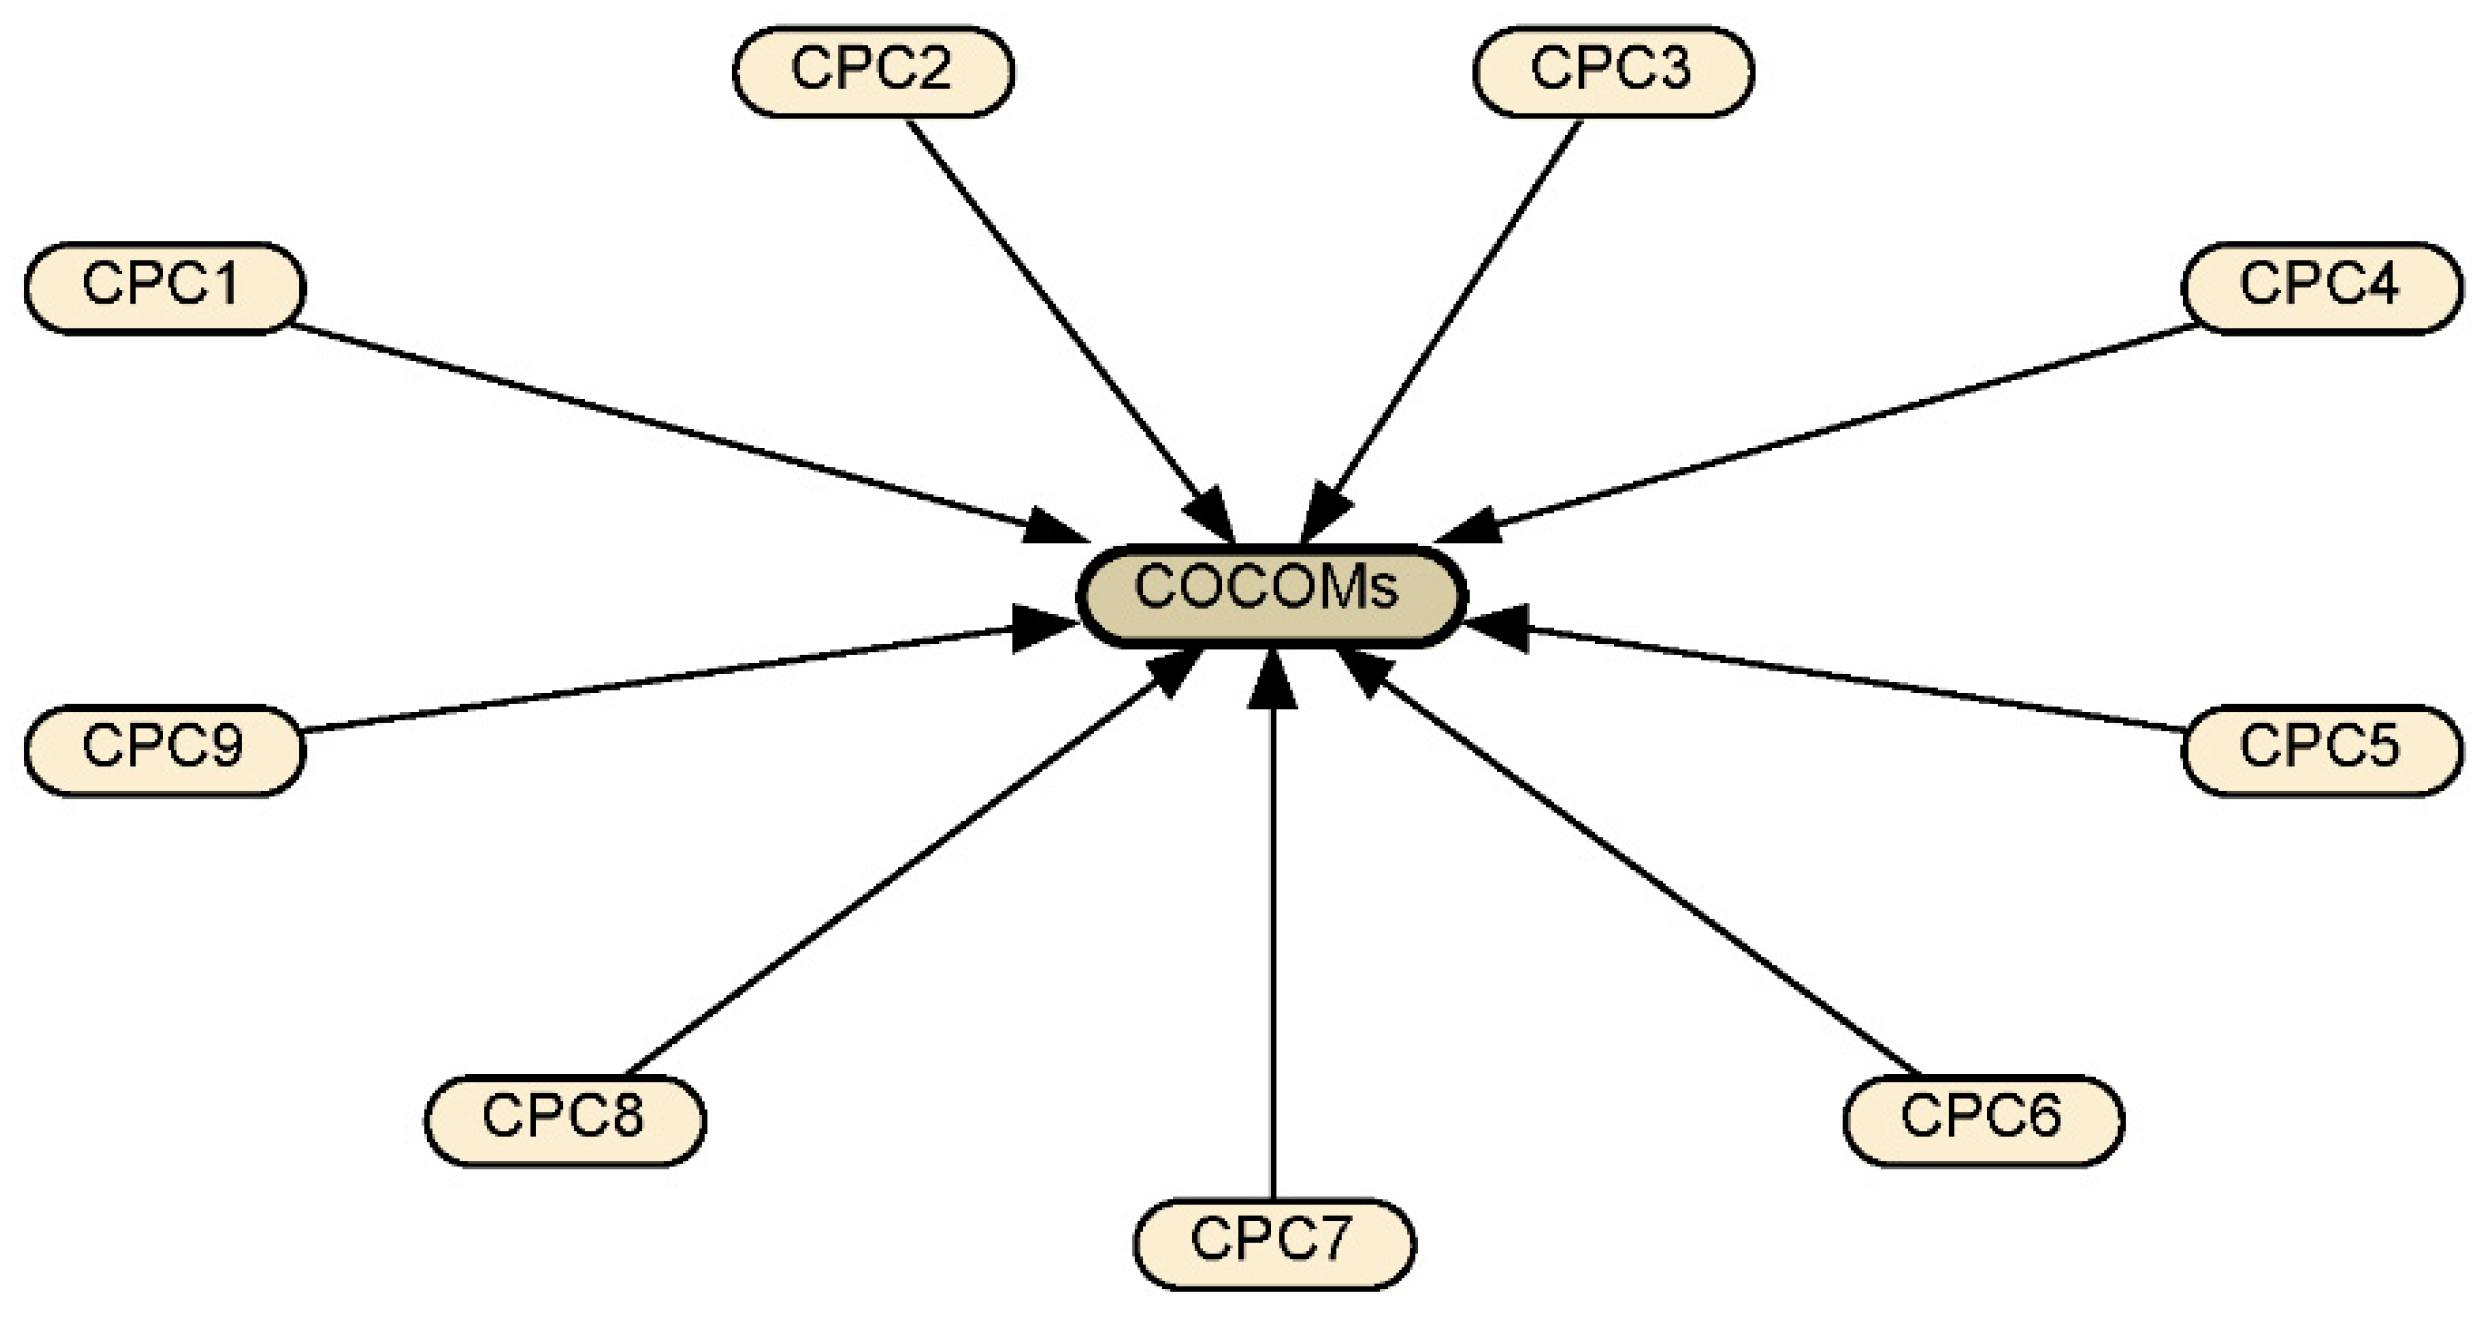
2.2. BN Modelling
2.3. Human Error Probability (HEP) Calculation
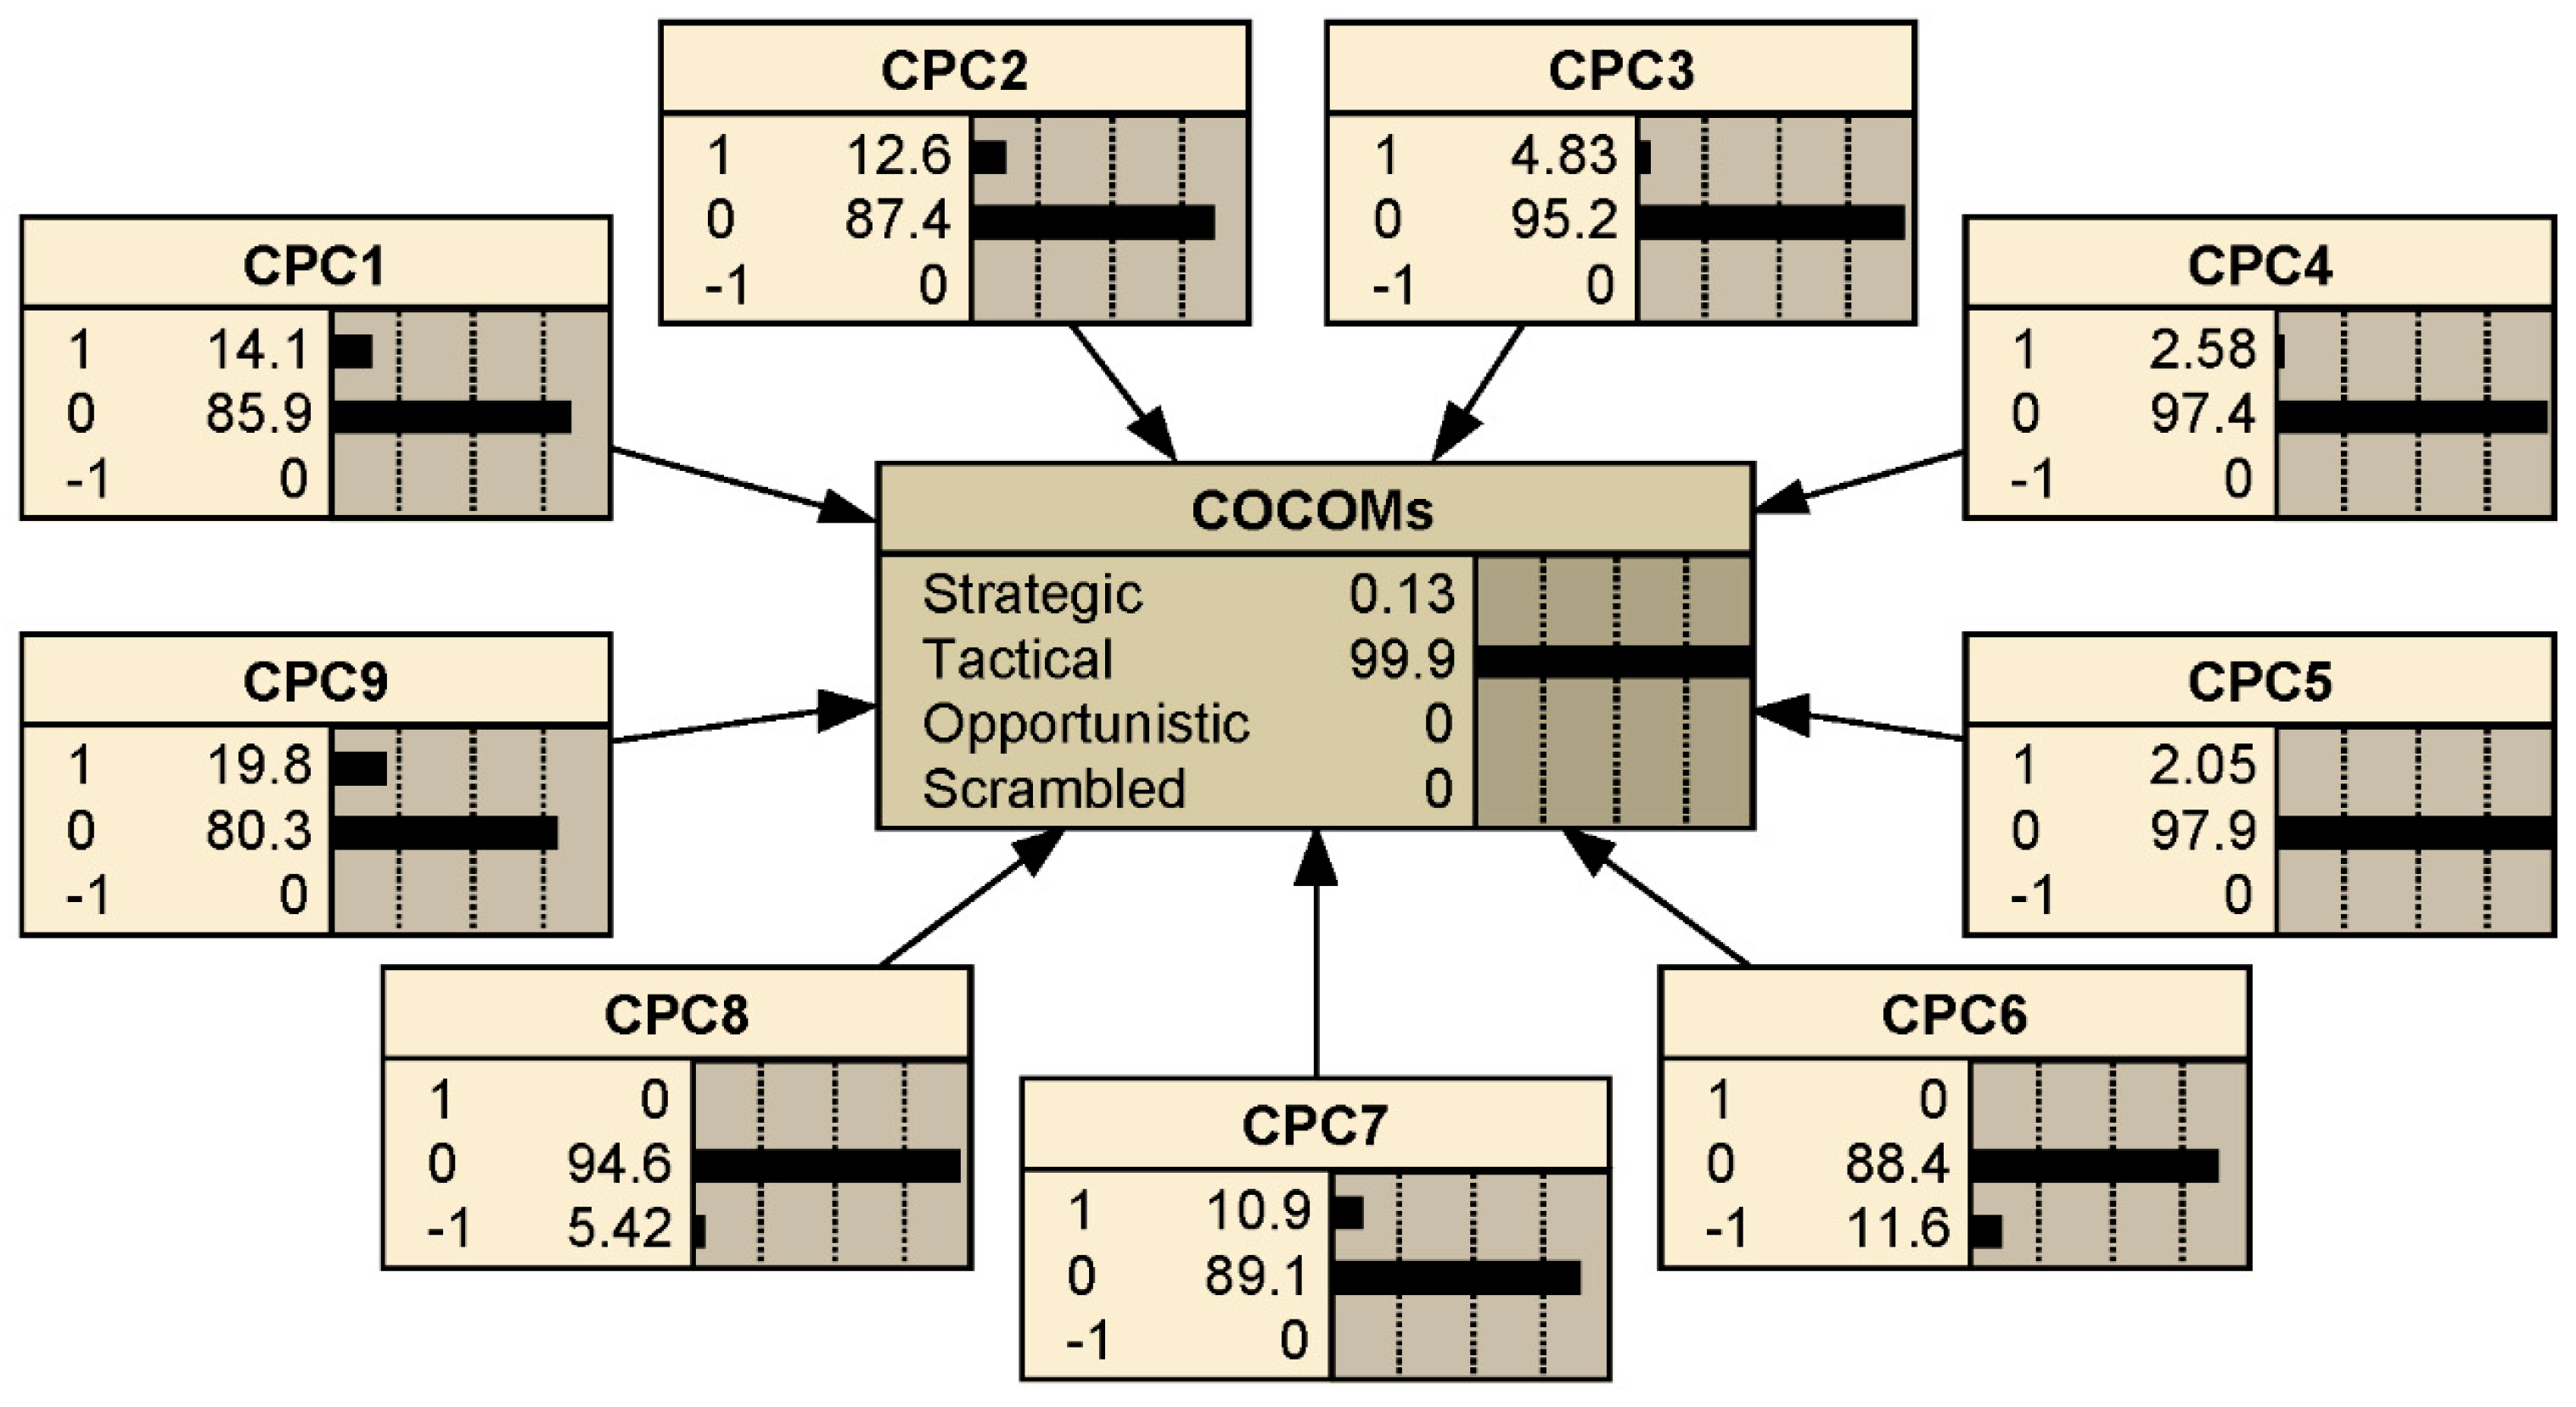
2.3.1. Prior Probabilities of the Common Performance Condition Indicators (CPCs)
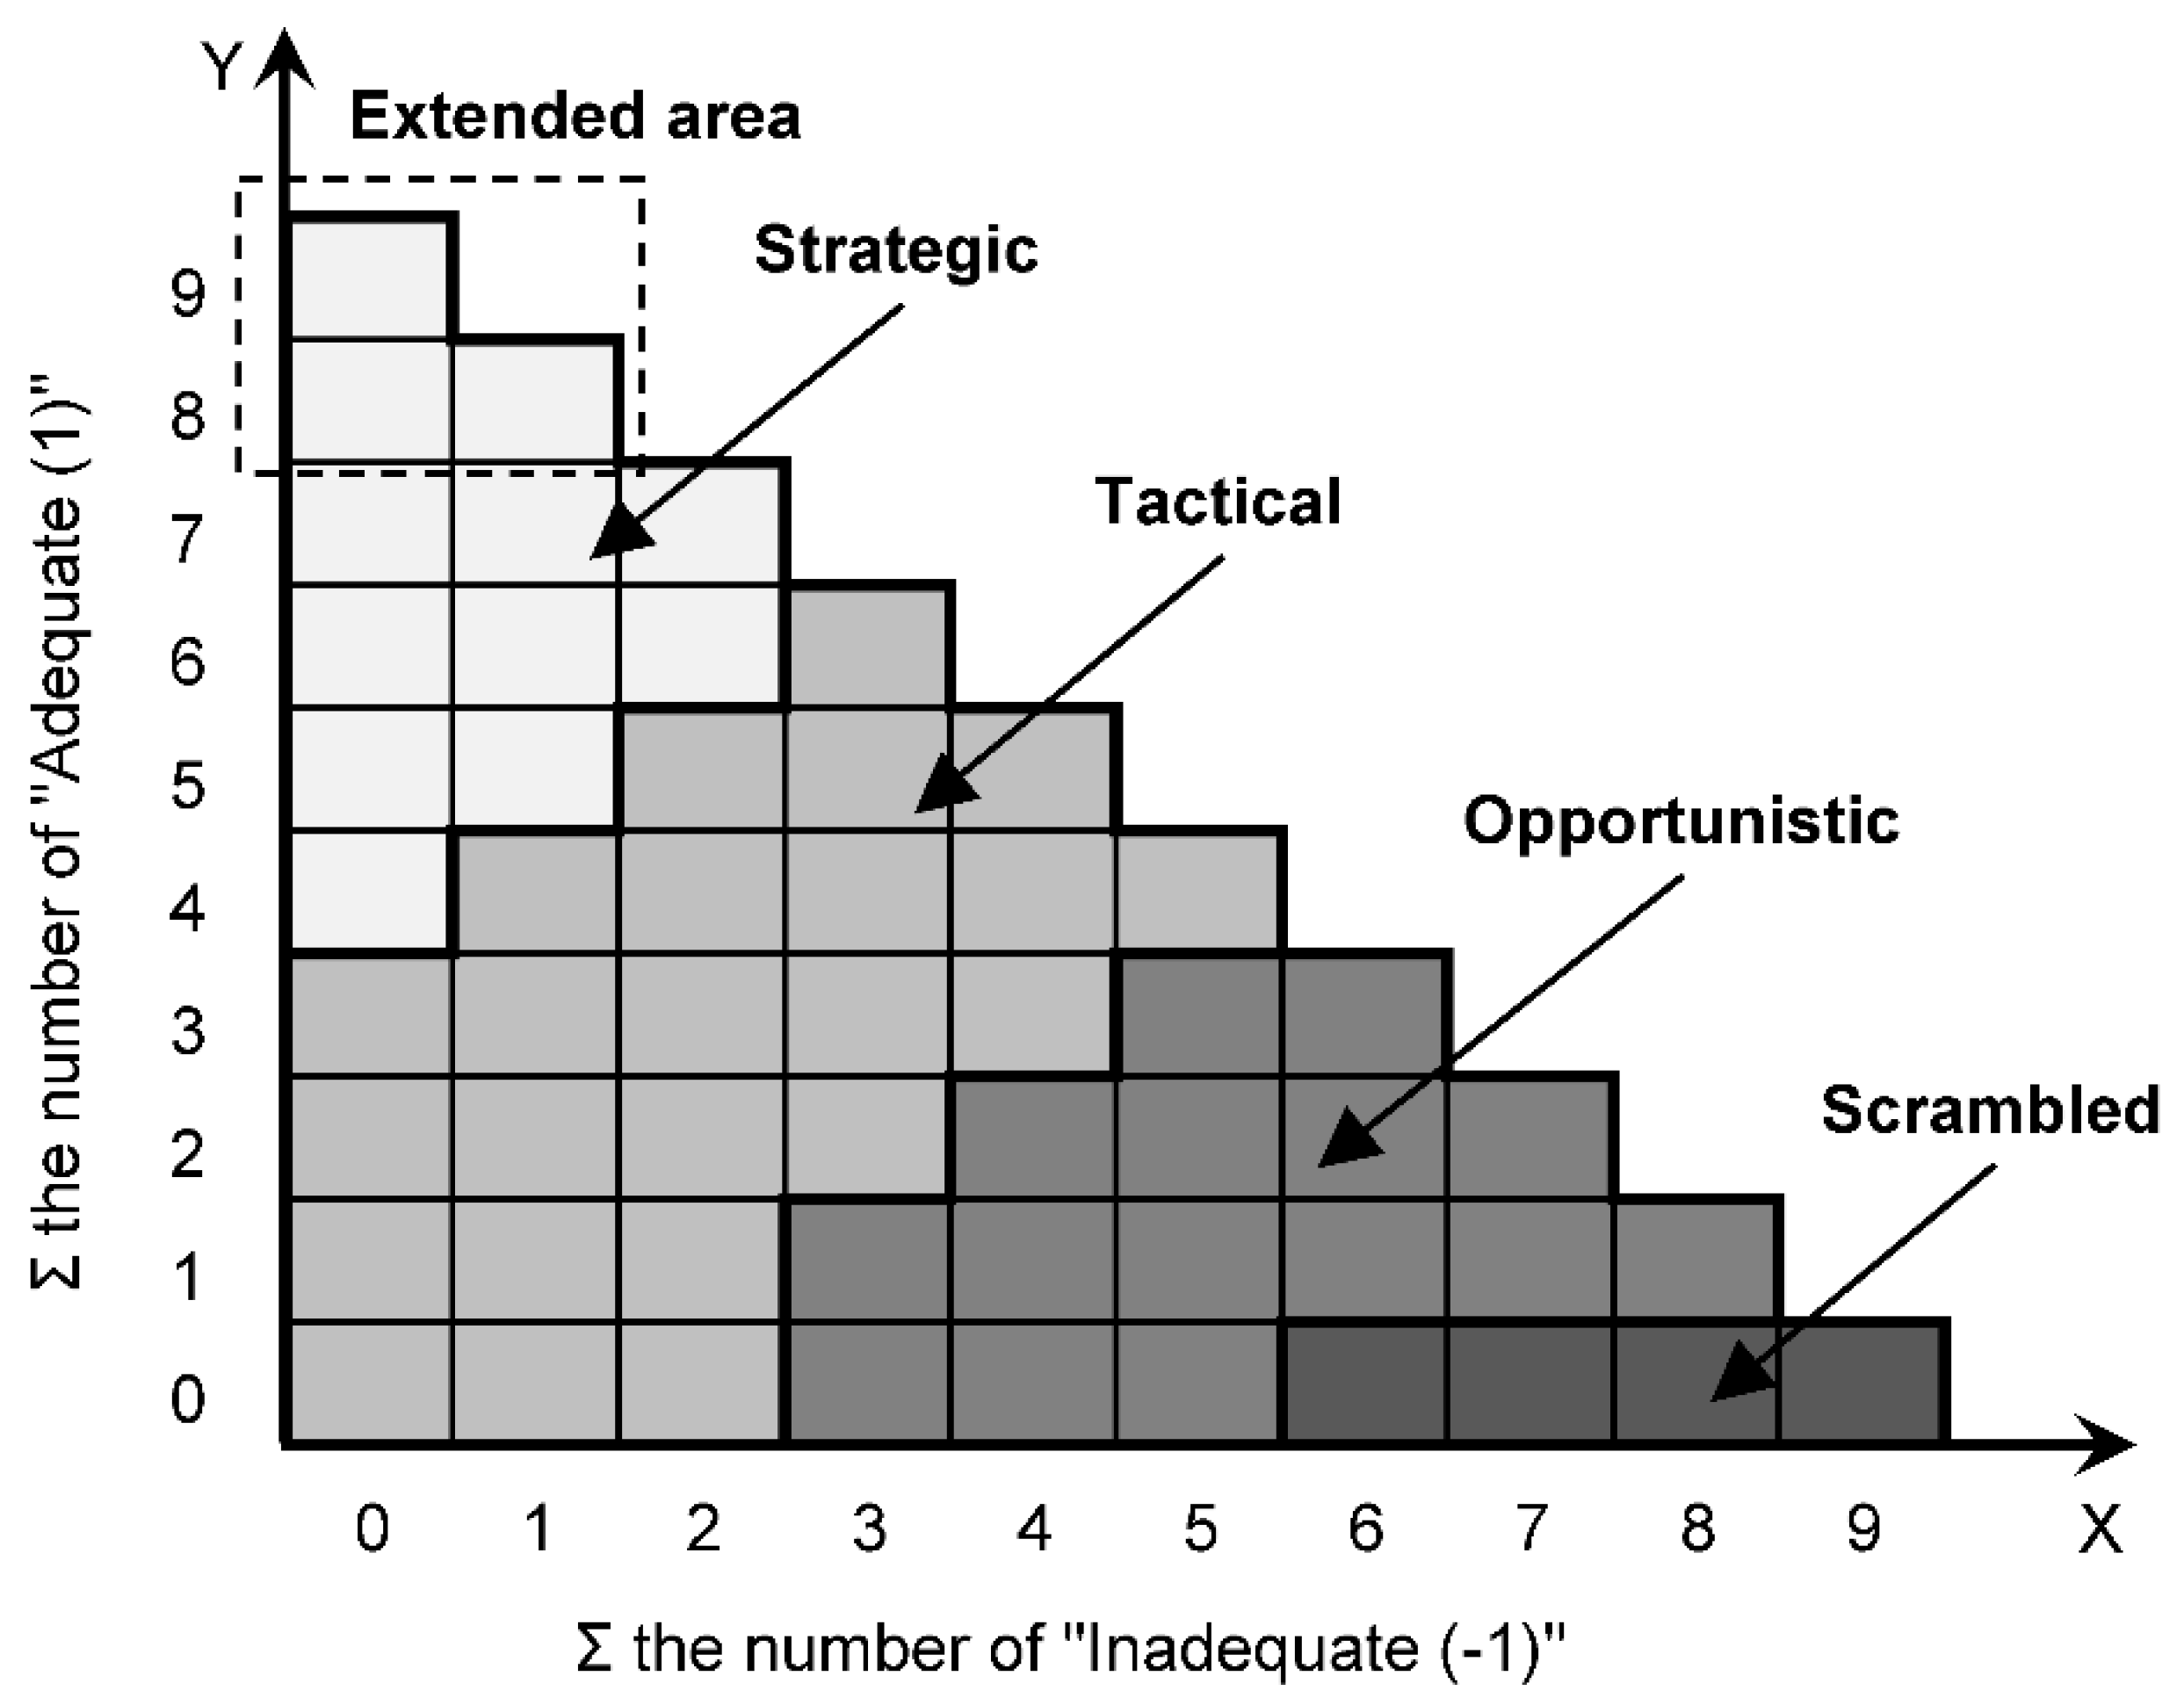
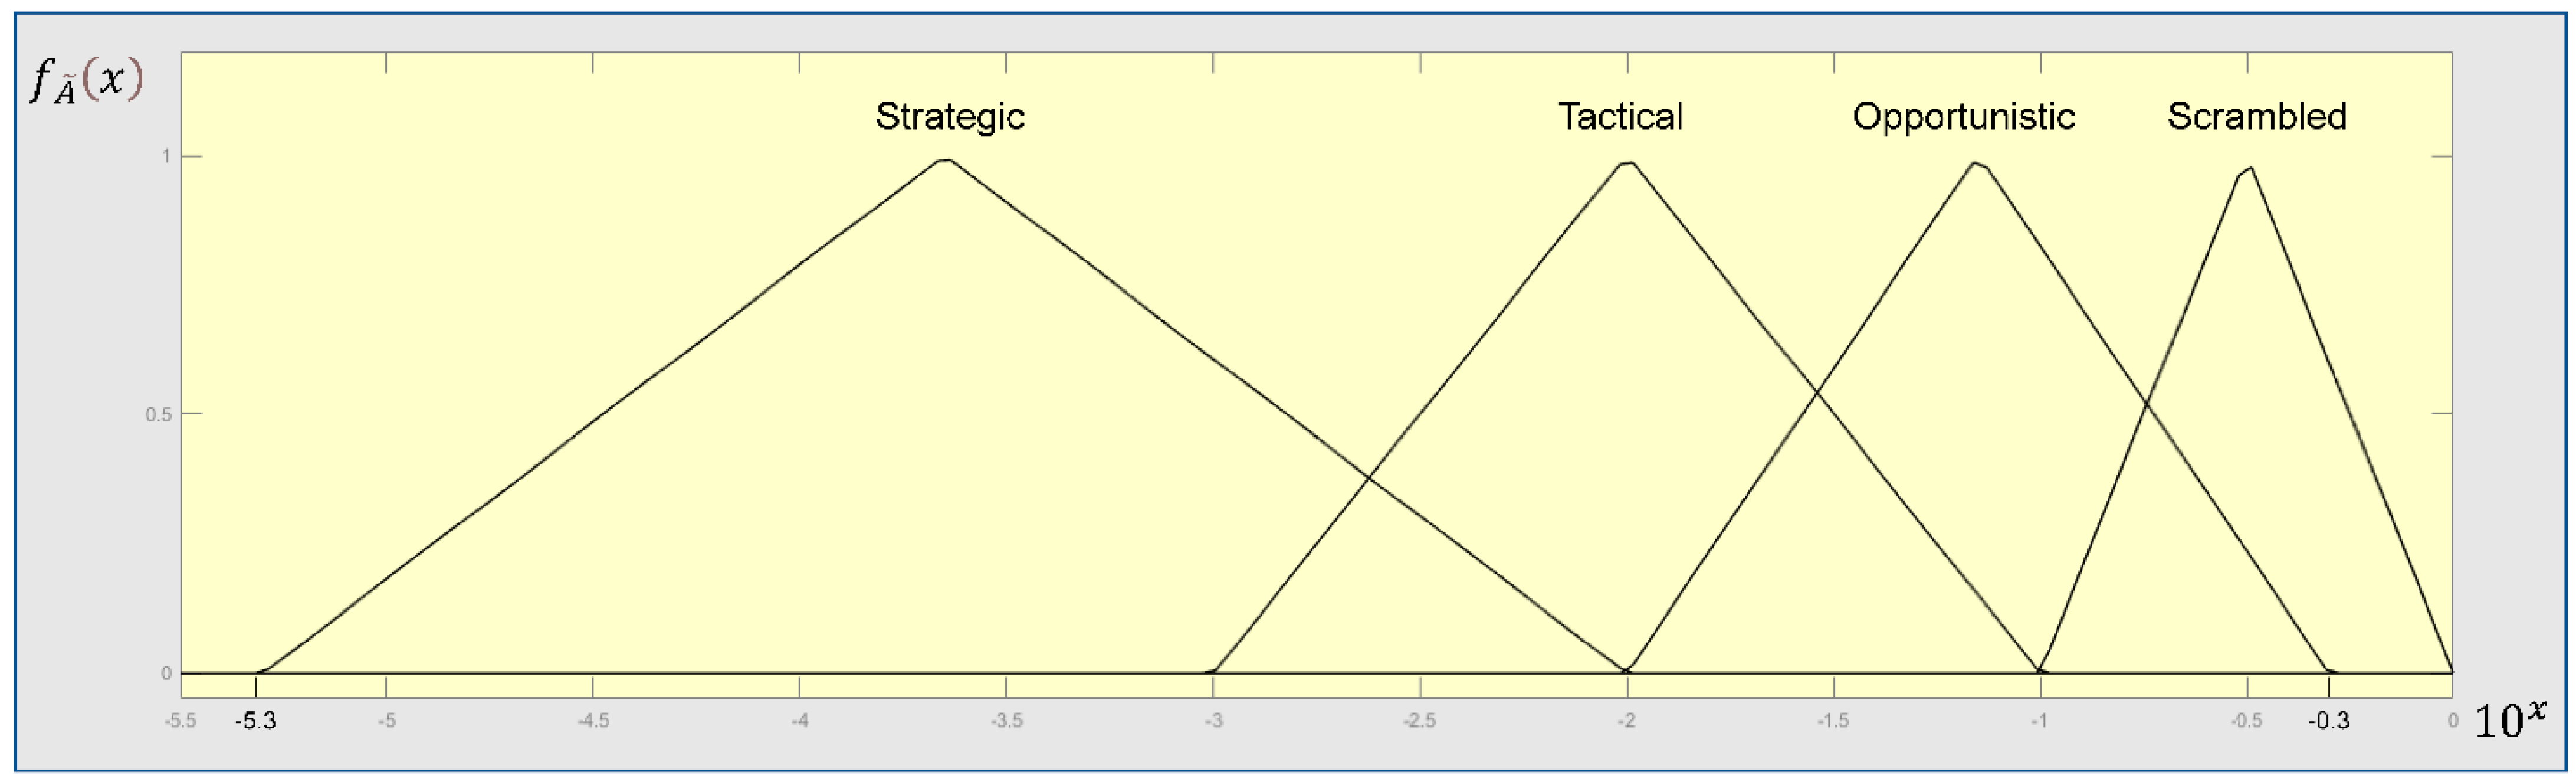
2.3.2. Defuzzification of the Fuzzy Sets for COCOMs and HEP Calculation
3. Data Acquisition and Analysis
3.1. Ranking of the Safety Philosophical Factors’ Indicators (SPFIs) and Selection of the Common Performance Condition Indicators (CPCs)
3.2. Prior Probabilities of Common Performance Conditions (CPCs)
4. Results and Discussion
4.1. Results
4.2. Discussion
5. Conclusions
- The prior HEP of 0.009841 was obtained which represents the current human safety level in the LNG bunkering industry. The analysis process showed the fuzzy BN-CREAM model is efficient in performing the HEP assessment.
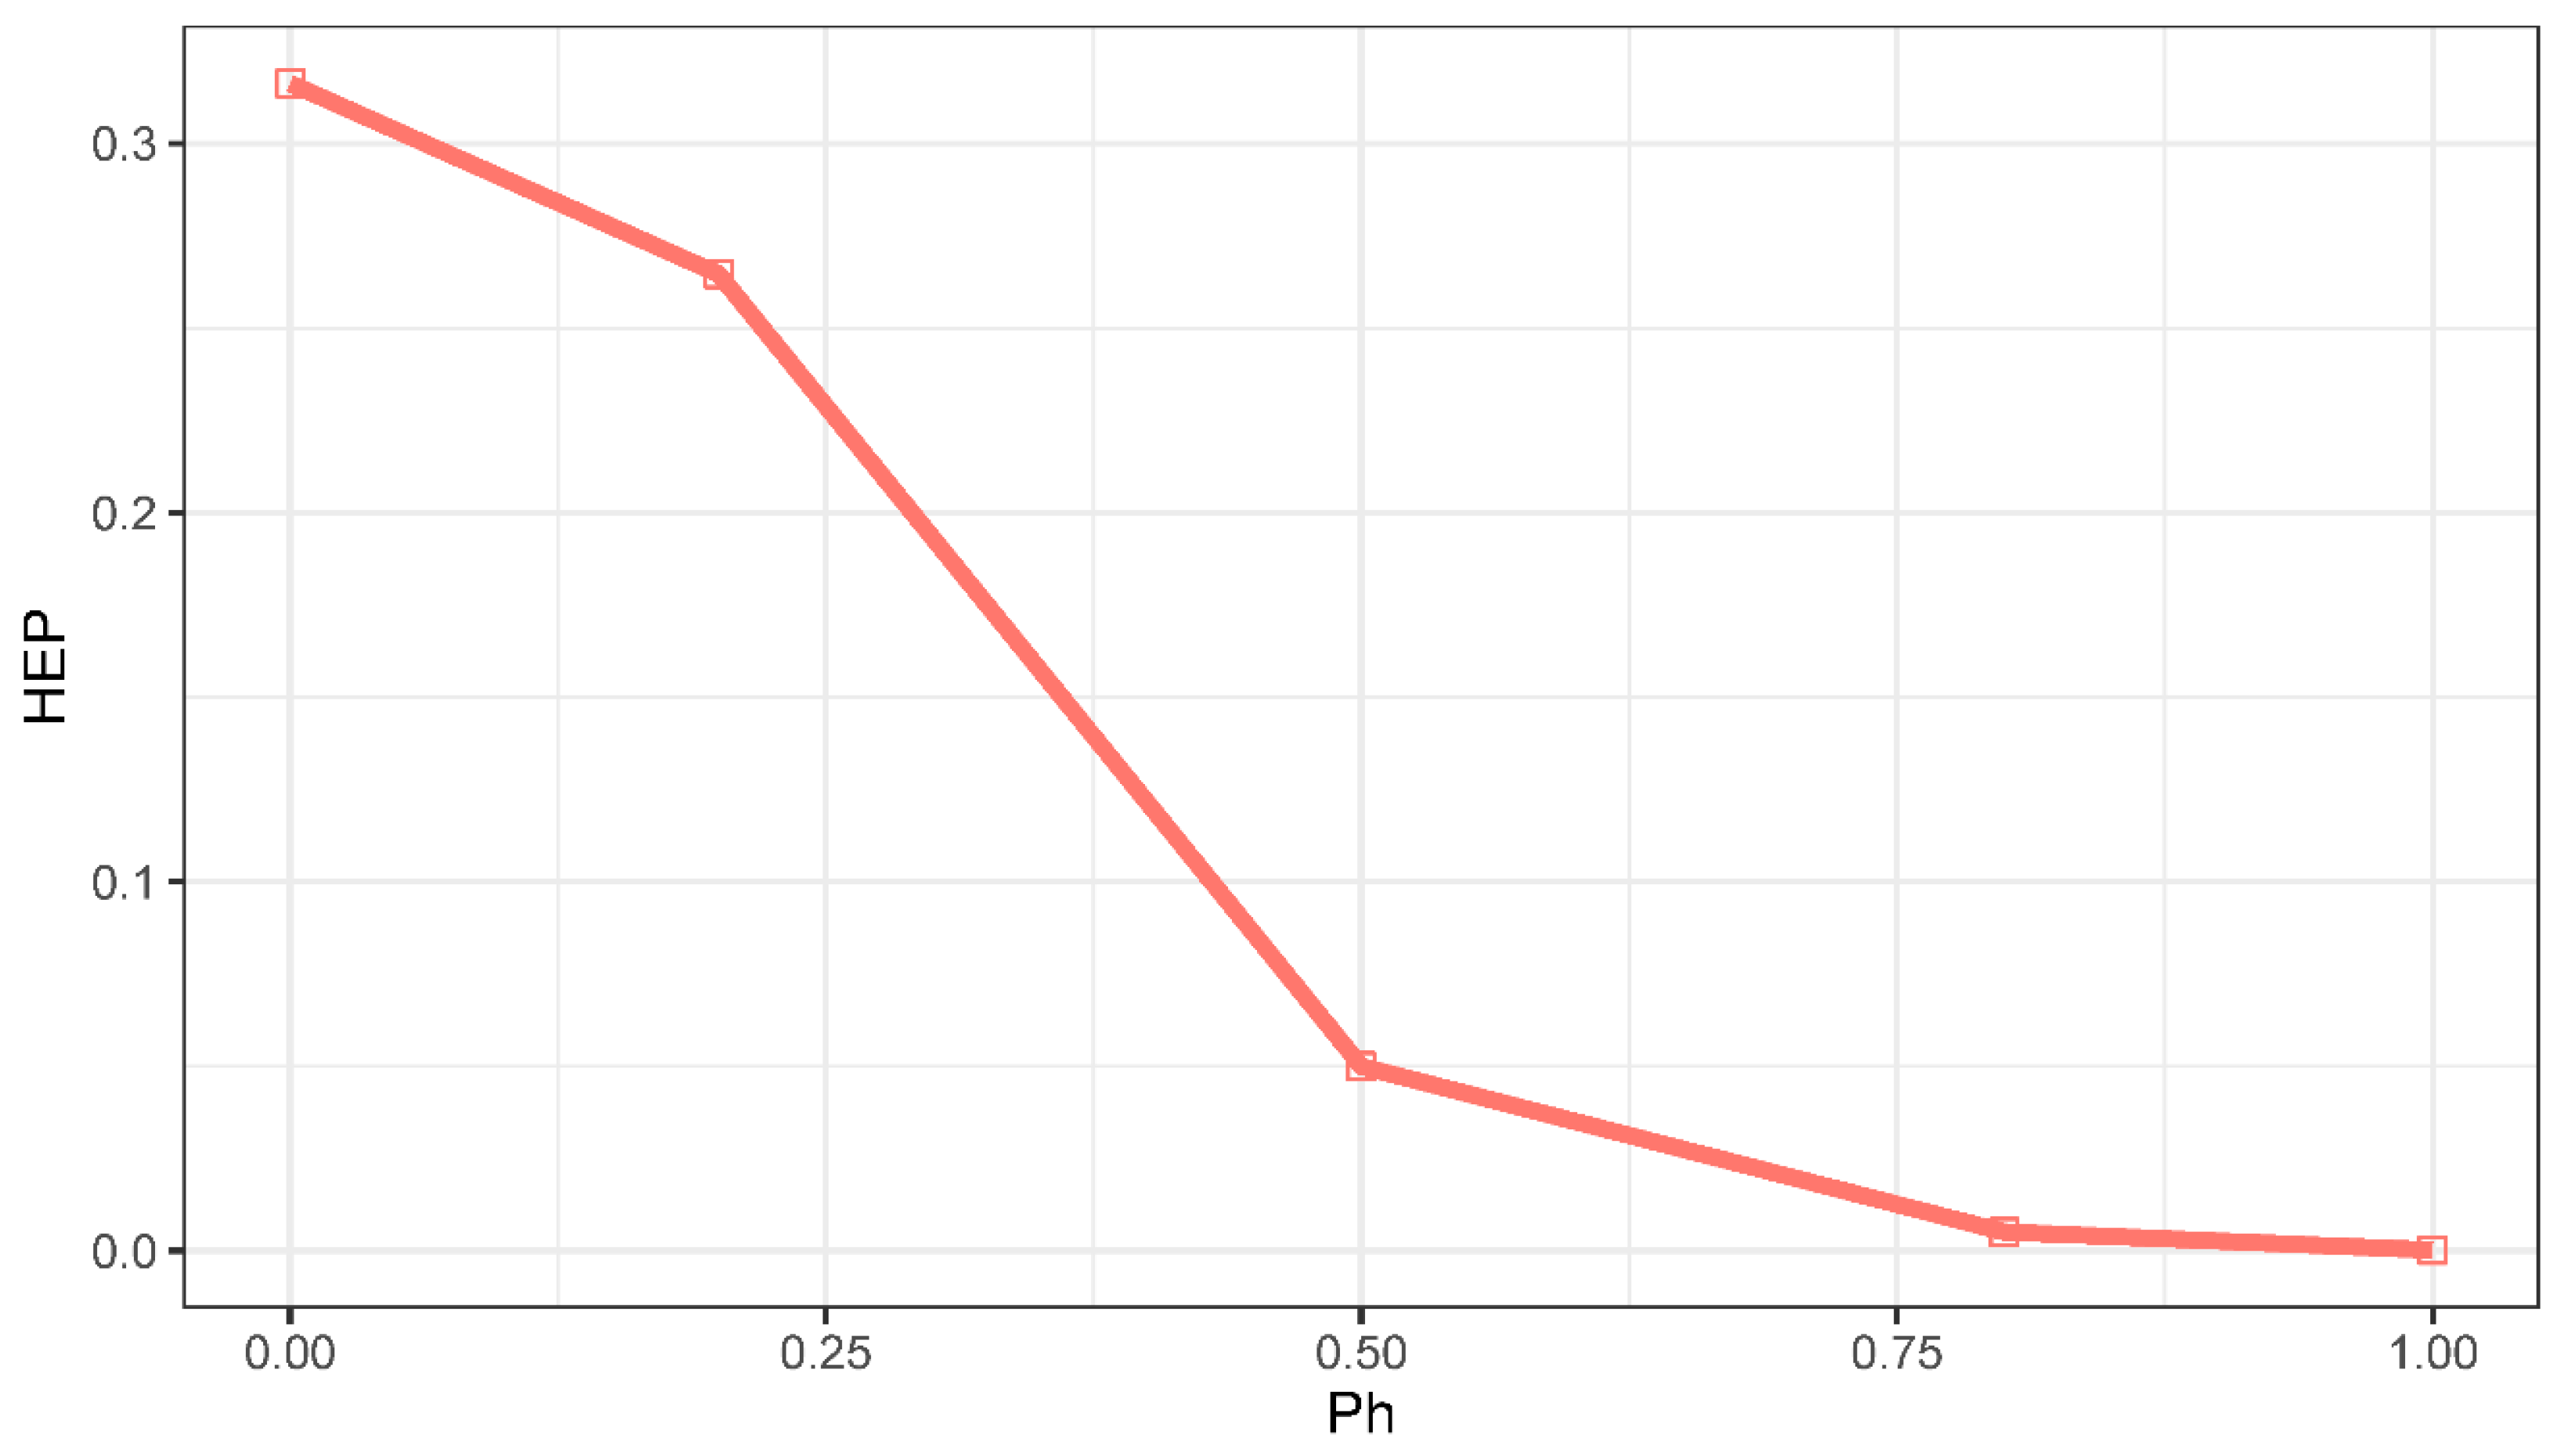
- Five hypothetical case studies demonstrated that an increase in the homogenized probability of CPCs leads to an increase in the human safety level. It can be seen that the CPCs provide insights that may improve the human safety level in an LNG bunkering project.
- The proposed model can be used to dynamically grasp the changes of HEP. If the reassessments identify the changes in the on-site CPCs, then these changes can be converted into quantitative data, where the input into the model obtains the latest HEP. Furthermore, this dynamic HEP assessment can be an input to a dynamic QRA model to obtain more accurate risk profiles.
Supplementary Materials
Author Contributions
Funding
Institutional Review Board Statement
Informed Consent Statement
Data Availability Statement
Acknowledgments
Conflicts of Interest
Abbreviations
| Ac | Acceptable |
| Ad | Adequate |
| BN | Bayesian network |
| COCOM | Contextual control mode |
| CPC | Common performance condition |
| CPT | Conditional probability table |
| CREAM | The cognitive reliability and error analysis method |
| DN | Defuzzification number |
| E | Engineer |
| ELS | Education level score |
| ESD | Emergency shutdown |
| FN | Fuzzy number |
| FST | Fuzzy set theory |
| HEP | Human error probability |
| HRA | Human reliability assessment |
| IFS | Integrated fuzzy set |
| In | Inadequate |
| JMA | Junior Manager |
| LNG | Liquified natural gas |
| Opp | Opportunistic |
| PPS | Professional position score |
| QRA | Quantitative risk assessment |
| SA | Safety awareness |
| SC | Safety culture |
| Scr | Scrambled |
| SM | Safety management |
| SMA | Senior Manager |
| SP | Safety process |
| SPF | Safety philosophical factor |
| SPFI | Safety philosophical factor’s measurable indicator |
| ST | Safety training |
| Str | Strategic |
| STS | Service time score |
| T | Technician |
| Tac | Tactical |
| W | Worker |
| Symbols | |
| Fuzzy set | |
| Linguistic expression corresponding fuzzy set obtained from expert about indicator | |
| Education level score of the th expert | |
| Aggregated integrated fuzzy set (IFS) of the th SPFI | |
| Membership function of the fuzzy set | |
| Left side of the membership function | |
| Right side of the membership function | |
| Occurrence probability of evidence | |
| Homogenized probability of CPCs | |
| Joint probability distribution of variables | |
| Posterior probability of the variables () given the evidence | |
| Probability of and happening together | |
| Parent set of | |
| Professional position score of the th expert | |
| Service time score of the th expert | |
| Weight given to the th expert | |
| Weight score of the th expert | |
| Defuzzification number of the fuzzy set |
References
- SGMF. LNG Fueled Ships Database; Society for Gas as a Marine Fuel: London, UK, 2021. [Google Scholar]
- Schuller, O.; Kupferschmid, S.; Hengstler, J.; Whitehouse, S. 2nd Life Cycle GHG Emission Study on the Use of LNG as Marine Fuel; Sphera: Leinfelden-Echterdingen, Germany, 2021. [Google Scholar]
- Park, N.K.; Park, S.K. A study on the estimation of facilities in LNG bunkering terminal by Simulation-Busan port case. J. Mar. Sci. Eng. 2019, 7, 354. [Google Scholar] [CrossRef] [Green Version]
- MSC 95/INF.17 Information on Incidents During Bunkering of LNG; IMO: London, UK.
- Fan, H.; Enshaei, H.; Gamini Jayasinghe, S. Safety philosophy and risk analysis methodology for LNG bunkering simultaneous operations (SIMOPs): A literature review. Saf. Sci. 2021, 136, 105150. [Google Scholar] [CrossRef]
- Sánchez-Beaskoetxea, J.; Basterretxea-Iribar, I.; Sotés, I.; Machado, M.d.l.M.M. Human error in marine accidents: Is the crew normally to blame? Marit. Transp. Res. 2021, 2, 100016. [Google Scholar] [CrossRef]
- Islam, R.; Yu, H.; Abbassi, R.; Garaniya, V.; Khan, F. Development of a monograph for human error likelihood assessment in marine operations. Saf. Sci. 2017, 91, 33–39. [Google Scholar] [CrossRef]
- Bai, Y.; Jin, W.-L. Chapter 43—Human Reliability Assessment. In Marine Structural Design, 2nd ed.; Bai, Y., Jin, W.-L., Eds.; Butterworth-Heinemann: Oxford, UK, 2016; pp. 793–802. [Google Scholar]
- Rausand, M. Risk Assessment: Theory, Methods, and Applications; John Wiley & Sons, Inc.: Hoboken, NJ, USA, 2011. [Google Scholar]
- Arnet, N.M.L. Establish Probabilistic Safety Distances for LNG Bunkering Operations. Master’s Thesis, Norwegian University of Science and Technology, Trondheim, Norway, 2014. [Google Scholar]
- Jeong, B.; Lee, B.S.; Zhou, P.; Ha, S.M. Determination of safety exclusion zone for LNG bunkering at fuel-supplying point. Ocean Eng. 2018, 152, 113–129. [Google Scholar] [CrossRef] [Green Version]
- Fan, H.; Zhang, H.; Xu, J. Assessment of the hazard distance of pool fire for LNG bunkering pontoon. Ship Build. China 2013, 54, 186–195. [Google Scholar]
- Park, S.; Jeong, B.; Yoon, J.Y.; Paik, J.K. A study on factors affecting the safety zone in ship-to-ship LNG bunkering. Ships Offshore Struct. 2018, 13, 312–321. [Google Scholar] [CrossRef] [Green Version]
- Park, S.I.; Kim, S.K.; Paik, J.K. Safety-zone layout design for a floating LNG-Fueled power plant in bunkering process. Ocean Eng. 2019, 196, 106774. [Google Scholar] [CrossRef]
- Gerbec, M.; Vidmar, P.; Pio, G.; Salzano, E. A comparison of dispersion models for the LNG dispersion at port of Koper, Slovenia. Saf. Sci. 2021, 144, 105467. [Google Scholar] [CrossRef]
- Park, S.-I.; Paik, J.K. A hybrid method for the safety zone design in truck-to-ship LNG bunkering. Ocean Eng. 2021, 243, 110200. [Google Scholar] [CrossRef]
- Lim, B.H.; Ng, E.Y. Model for Cryogenic Flashing LNG Leak. Appl. Sci. 2021, 11, 9312. [Google Scholar] [CrossRef]
- Fan, H.; Cheng, K.; Wu, S. CFD Based Simulation of LNG Release during Bunkering and Cargo Loading/Unloading Simultaneous Operations of a Containership. J. Shipp. Ocean Eng. 2017, 2017, 51–58. [Google Scholar] [CrossRef]
- Jeong, B.; Park, S.; Ha, S.; Lee, J.U. Safety evaluation on LNG bunkering: To enhance practical establishment of safety zone. Ocean Eng. 2020, 216, 107804. [Google Scholar] [CrossRef]
- Jeong, B.; Lee, B.S.; Zhou, P.; Ha, S.M. Evaluation of safety exclusion zone for LNG bunkering station on LNG-fuelled ships. J. Mar. Eng. Technol. 2017, 16, 121–144. [Google Scholar] [CrossRef] [Green Version]
- Halford, A.; Robinson, C.; Haynes, D. The safety assessment of LNG marine bunkering. In Proceedings of the Institution of Chemical Engineers Symposium Series, Birmingham, UK, 22–24 May 2019. [Google Scholar]
- Wu, S.; Luo, X.; Fan, H.; Zhang, R. Quantitative risk analysis on refuelling of LNG-fuelled ships with tank trucks. Nat. Gas Ind. 2015, 35, 111–116. [Google Scholar] [CrossRef]
- Iannaccone, T.; Landucci, G.; Scarponi, G.E.; Bonvicini, S.; Cozzani, V. Inherent safety assessment of alternative technologies for LNG ships bunkering. Ocean Eng. 2019, 185, 100–114. [Google Scholar] [CrossRef]
- Iannaccone, T.; Cozzani, V.; Jeong, B.; Zhou, P. Safety analysis of liquefied natural gas bunkering and simultaneous port operations for passenger ships. In Proceedings of the International Conference on Offshore Mechanics and Arctic Engineering—OMAE, Online, 3–7 August 2020. [Google Scholar]
- Wu, J.; Bai, Y.; Zhao, H.; Hu, X.; Cozzani, V. A quantitative LNG risk assessment model based on integrated Bayesian-Catastrophe-EPE method. Saf. Sci. 2021, 137, 105184. [Google Scholar] [CrossRef]
- Vairo, T.; Gualeni, P.; Reverberi, A.P.; Fabiano, B. Resilience Dynamic Assessment Based on Precursor Events: Application to Ship LNG Bunkering Operations. Sustainability 2021, 13, 6836. [Google Scholar] [CrossRef]
- Aneziris, O.; Gerbec, M.; Koromila, I.; Nivolianitou, Z.; Pilo, F.; Salzano, E. Risk assessment for LNG storage and bunkering at ports. In Proceedings of the 30th European Safety and Reliability Conference, ESREL 2020 and 15th Probabilistic Safety Assessment and Management Conference, Venice, Italy, 1–5 November 2020; pp. 597–604. [Google Scholar]
- Kim, I.; Kim, H.; Chang, D.; Jung, D.-H.; Sung, H.G.; Park, S.-K.; Choi, B.C. Emergency evacuation simulation of a floating LNG bunkering terminal considering the interaction between evacuees and CFD data. Saf. Sci. 2021, 140, 105297. [Google Scholar] [CrossRef]
- Stokes, J.; Moon, G.; Bend, R.; Owen, D.; Wingate, K.; Waryas, E. Understanding the human element in LNG bunkering. In Marine Technology and Standards; American Society of Mechanical Engineers: New York, NY, USA, 2018; pp. 105–111. [Google Scholar]
- Uijt de Haag, P.A.M.; Ale, B.J.M.; Post, J.G. T10-1—The ‘Purple Book’: Guideline for Quantitative Risk Assessment in the Netherlands. In Loss Prevention and Safety Promotion in the Process Industries; Pasman, H.J., Fredholm, O., Jacobsson, A., Eds.; Elsevier Science B.V.: Amsterdam, The Netherlands, 2001; pp. 1429–1438. [Google Scholar]
- OGP. Risk Assessment Data Directory: Process Release Frequencies; International Association of Oil and Gas Producers, International Association of Oil and Gas Producers: London, UK, 2010. [Google Scholar]
- SINTEF. OREDA Offshore Reliability Data Handbook, 4th ed.; OREDA Participants: Trondheim, Norway, 2002. [Google Scholar]
- HSE. Failure Rate and Event Data for Use Within Risk Assessments; 2012. Available online: https://www.hse.gov.uk/landuseplanning/failure-rates.pdf (accessed on 24 January 2022).
- Risk Assessment Data Directory: Human Factors in QRA; OGP: London, UK, 2010.
- Swain, A.D.; Guttmann, H.E. Handbook of Human Reliability Analysis with Emphasis on Nuclear Power Plant; Sandia National Laboratories: Albuquerque, NM, USA, 1983; 87185 US. [Google Scholar]
- Bell, J.; Holroyd, J. Review of Human Reliability Assessment Methods; Health & Safety Laboratory: Buxton, UK, 2009. [Google Scholar]
- Wu, B.; Yip, T.L.; Yan, X.; Guedes Soares, C. Review of techniques and challenges of human and organizational factors analysis in maritime transportation. Reliab. Eng. Syst. Saf. 2022, 219, 108249. [Google Scholar] [CrossRef]
- Pasquale, V.D.; Iannone, R.; Miranda, S.; Riemma, S. An Overview of Human Reliability Analysis Techniques in Manufacturing Operations. In Operations Management; Schiraldi, M.M., Ed.; IntechOpen: London, UK, 2013. [Google Scholar]
- Kirwan, B. The validation of three human reliability quantification techniques THERP, HEART and JHEDI: Part 1—Technique descriptions and validation issues. Appl. Ergon. 1996, 27, 359–373. [Google Scholar] [CrossRef]
- Yang, Y.; Chen, S.; Zheng, W.X.; Kang, R. Human reliability test and identification of HCR model basic parameters for single factor “meta-operation”. Chem. Eng. Trans. 2013, 33, 421–426. [Google Scholar] [CrossRef]
- Hollnagel, E. Chapter 6—CREAM—A Second Generation HRA Method. In Cognitive Reliability and Error Analysis Method (CREAM); Hollnagel, E., Ed.; Elsevier Science Ltd.: Oxford, UK, 1998; pp. 151–190. [Google Scholar]
- Blackman, H.S.; Gertman, D.I.; Boring, R.L. Human error quantification using performance shaping factors in the SPAR-H method. In Proceedings of the Human Factors and Ergonomics Society; 2008; pp. 1733–1737. Available online: https://journals.sagepub.com/doi/abs/10.1177/154193120805202109 (accessed on 24 January 2022).
- Thompson, C.M.; Cooper, S.E.; Kolaczkowski, A.M.; Bley, D.C.; Forester, J.A.; Wreathall, J. Application of ATHEANA: A technique for human error analysis. In Proceedings of the IEEE Conference on Human Factors and Power Plants, Orlando, FL, USA, 8–13 June 1997; pp. 9.13–19.17. [Google Scholar]
- Chang, Y.H.J.; Mosleh, A. Cognitive modeling and dynamic probabilistic simulation of operating crew response to complex system accidents: Part 1: Overview of the IDAC Model. Reliab. Eng. Syst. Saf. 2007, 92, 997–1013. [Google Scholar] [CrossRef]
- Ekanem, N.J.; Mosleh, A.; Shen, S.-H. Phoenix—A model-based Human Reliability Analysis methodology: Qualitative Analysis Procedure. Reliab. Eng. Syst. Saf. 2016, 145, 301–315. [Google Scholar] [CrossRef] [Green Version]
- Alvarenga, M.A.B.; Frutuoso e Melo, P.F. A review of the cognitive basis for human reliability analysis. Prog. Nucl. Energy 2019, 117, 103050. [Google Scholar] [CrossRef]
- Parhizkar, T.; Utne, I.B.; Vinnem, J.-E. Human Factor Analysis and Quantification. In Online Probabilistic Risk Assessment of Complex Marine Systems: Principles, Modelling and Applications; Springer International Publishing: Cham, Switzerland, 2022; pp. 75–102. [Google Scholar]
- Akyuz, E.; Celik, M. Application of CREAM human reliability model to cargo loading process of LPG tankers. J. Loss Prev. Process. Ind. 2015, 34, 39–48. [Google Scholar] [CrossRef]
- Wu, Y.; Xu, K.; Wang, R.; Xu, X. Human reliability analysis of hightemperature molten metal operation based on fuzzy CREAM and Bayesian network. PLoS ONE 2021, 16, e0254861. [Google Scholar] [CrossRef]
- Zhang, R.; Tan, H.; Afzal, W. A modified human reliability analysis method for the estimation of human error probability in the offloading operations at oil terminals. Process. Saf. Prog. 2021, 40, 84–92. [Google Scholar] [CrossRef]
- Yang, Z.; Wang, J.; Rochdi, M.; Belkacem, O. Bayesian modelling for human error probability analysis in CREAM. In Proceedings of the 2011 International Conference on Quality, Reliability, Risk, Maintenance, and Safety Engineering, Xi’an, China, 17–19 June 2011; pp. 137–142. [Google Scholar]
- Yang, Z.L.; Bonsall, S.; Wall, A.; Wang, J.; Usman, M. A modified CREAM to human reliability quantification in marine engineering. Ocean Eng. 2013, 58, 293–303. [Google Scholar] [CrossRef]
- Zhou, Q.; Wong, Y.D.; Loh, H.S.; Yuen, K.F. A fuzzy and Bayesian network CREAM model for human reliability analysis—The case of tanker shipping. Saf. Sci. 2018, 105, 149–157. [Google Scholar] [CrossRef]
- Ung, S.-T. Evaluation of human error contribution to oil tanker collision using fault tree analysis and modified fuzzy Bayesian Network based CREAM. Ocean Eng. 2019, 179, 159–172. [Google Scholar] [CrossRef]
- Chen, D.; Fan, Y.; Ye, C.; Zhang, S. Human reliability analysis for manned submersible diving process based on CREAM and Bayesian network. Qual. Reliab. Eng. Int. 2019, 35, 2261–2277. [Google Scholar] [CrossRef]
- Abbasinia, M.; Kalatpour, O.; Motamedzadeh, M.; Soltanian, A.; Mohammadfam, I. Dynamic Human Error Assessment in Emergency Using Fuzzy Bayesian CREAM. J. Res. Health Sci. 2020, 20, e00468. [Google Scholar] [CrossRef] [PubMed]
- Ghasemi, F.; Ghasemi, A.; Kalatpour, O. Prediction of human error probability during the hydrocarbon road tanker loading operation using a hybrid technique of fuzzy sets, Bayesian network and CREAM. Int. J. Occup. Saf. Ergon. 2021, 1–11. [Google Scholar] [CrossRef] [PubMed]
- Zadeh, L.A. Fuzzy sets. Inf. Control 1965, 8, 338–353. [Google Scholar] [CrossRef] [Green Version]
- Chen, S.-J.; Hwang, C.-L. Fuzzy multiple attribute decision making methods. In Fuzzy Multiple Attribute Decision Making; Springer: Berlin/Heidelberg, Germany, 1992; pp. 289–486. [Google Scholar]
- Stone, M. The opinion pool. Ann. Math. Stat. 1961, 1339–1342. [Google Scholar] [CrossRef]
- Ishikawa, A.; Amagasa, M.; Shiga, T.; Tomizawa, G.; Tatsuta, R.; Mieno, H. The max-min Delphi method and fuzzy Delphi method via fuzzy integration. Fuzzy Sets Syst. 1993, 55, 241–253. [Google Scholar] [CrossRef]
- Rani, P.; Mishra, A.R. Multi-criteria weighted aggregated sum product assessment framework for fuel technology selection using q-rung orthopair fuzzy sets. Sustain. Prod. Consum. 2020, 24, 90–104. [Google Scholar] [CrossRef]
- Cornejo, M.E.; Lobo, D.; Medina, J. On the solvability of bipolar max-product fuzzy relation equations with the standard negation. Fuzzy Sets Syst. 2020. [Google Scholar] [CrossRef]
- Clemen, R.T.; Winkler, R.L. Combining Probability Distributions From Experts in Risk Analysis. Risk Anal. 1999, 19, 187–203. [Google Scholar] [CrossRef]
- Cheliyan, A.S.; Bhattacharyya, S.K. Fuzzy fault tree analysis of oil and gas leakage in subsea production systems. J. Ocean Eng. Sci. 2018, 3, 38–48. [Google Scholar] [CrossRef]
- Leekwijck, W.V.; Kerre, E.E. Defuzzification: Criteria and classification. Fuzzy Sets Syst. 1999, 108, 159–178. [Google Scholar] [CrossRef]
- Patel, A.V.; Mohan, B.M. Some numerical aspects of center of area defuzzification method. Fuzzy Sets Syst. 2002, 132, 401–409. [Google Scholar] [CrossRef]
- Wang, Y.-M.; Yang, J.-B.; Xu, D.-L.; Chin, K.-S. On the centroids of fuzzy numbers. Fuzzy Sets Syst. 2006, 157, 919–926. [Google Scholar] [CrossRef]
- Jensen, F.V. Bayesian Networks and Decision Graphs; Springer: Berlin/Heidelberg, Germany, 2001. [Google Scholar]

| Generation | Main Characteristics | Representative Approaches |
|---|---|---|
| First | Regarding humans as equipment. Calculating HEP using traditional methods such as the event tree analysis. | THERP (Technique for Human Error-Rate Prediction). HCR (Human Cognitive Reliability). HEART (Human Error Assessment and Reduction Technique). |
| Second | Considering behavioural science, cognitive science, and psychology. Describing the underlying causes of specific erroneous human actions or context in which human errors occur. Quantifying the HEP based on error-producing conditions or context. | CREAM (Cognitive Reliability and Error Analysis Method). SPAR-H (Standardized Plant Analysis Risk HRA). ATHEANA (A Technique for Human Event Analysis). |
| Third | Use artificial intelligence and computer-aided simulation techniques to predict HEP. | IDAC (Information-Decision-Action Crew). Phoenix (Phoenix, as the name implies is developed from the ashes of its predecessors in an attempt to address the current issues in the field of HRA). MERMOS (Method d’Evaluation de la Realisation des Missions Operator pout la Surete). Dynamic HRA method. |
| COCOM (Contextual Control Mode) | HEP (Human Error Probability) Interval |
|---|---|
| Strategic | (0.000005, 0.01) |
| Tactical | (0.001, 0.1) |
| Opportunistic | (0.01, 0.5) |
| Scrambled | (0.1, 1.0) |
| SPF | SPFI | Description |
|---|---|---|
| Safety culture (SC) | SC1 | Safety policy is set in the organisation, and its values are shared among members of the organisation. |
| SC2 | The roles and responsibilities for safety are clearly understood. | |
| SC3 | Mistakes are reported without consequences and punishment. | |
| SC4 | Vertical/horizontal safety-related communication is encouraged. (Vertical communication is the transmission of information between different levels of the organizational hierarchy. Horizontal communication is the transmission of information between people, divisions, departments, or units within the same level of organizational hierarchy.) | |
| SC5 | Managers are committed to safety practices. | |
| Safety management (SM) | SM1 | Management encourages employees to voice concerns and safety improvement proposals. |
| SM2 | Employees are involved in setting safety objectives, decision making, and improvement plans. | |
| SM3 | The company has a clear reward and punishment mechanism for employees’ safety practices. | |
| SM4 | Employees are given enough time to carry out their tasks. | |
| SM5 | A positive work environment is provided. | |
| Safety process (SP) | SP1 | Safety audits for the safety management system are well implemented. |
| SP2 | Risk assessment is well conducted in the organisation. | |
| SP3 | Safety checklist related to LNG bunkering simultaneous operations is well developed in the organisation. | |
| SP4 | Emergency plans and procedures are well developed in the organisation. | |
| Safety training (ST) | ST1 | Specialised training and education are periodically offered as part of training program. |
| ST2 | Employees learn lessons from near misses and incident/accidents reports (if applicable). | |
| ST3 | Employees are trained for the company’s safety policy. | |
| ST4 | Learning and contentious safety improvement is part of staff training. | |
| ST5 | Safety training and education are given according to personnel’s level. | |
| Safety awareness (SA) | SA1 | Safety information (i.e., procedures) is commonly demonstrated in the workplace. |
| SA2 | Clear mission statements (e.g., slogans and logos) are commonly demonstrated in the workplace. | |
| SA3 | Supervisors are made responsible to convey safety information to employees. | |
| SA4 | The correct safety signage is implemented. |
| PPS | STS | ELS | |||
|---|---|---|---|---|---|
| Category | Score | Category | Score | Category | Score |
| Senior Manager (SMA) | 5 | ≥ 30 years | 5 | PhD | 5 |
| Junior Manager (JMA) | 4 | 20–29 years | 4 | Master’s | 4 |
| Engineer (E) | 3 | 10-19 years | 3 | Bachelor’s | 3 |
| Technician (T) | 2 | 6-9 years | 2 | Vocational education | 2 |
| Worker (W) | 1 | ≤5 years | 1 | High school | 1 |
| Row No. | CPC | COCOM 1 | |||||||||||
|---|---|---|---|---|---|---|---|---|---|---|---|---|---|
| 1 | 2 | 3 | 4 | 5 | 6 | 7 | 8 | 9 | Str | Tac | Opp | Scr | |
| 1 | 1 | 1 | 1 | 1 | 1 | 1 | 1 | 1 | 1 | 1 | 0 | 0 | 0 |
| 2 | 1 | 1 | 1 | 1 | 1 | 1 | 1 | 1 | 0 | 1 | 0 | 0 | 0 |
| 3 | 1 | 1 | 1 | 1 | 1 | 1 | 1 | 1 | -1 | 1 | 0 | 0 | 0 |
| … | … | … | … | … | … | … | … | … | … | … | … | … | … |
| 19,683 | −1 | −1 | −1 | −1 | −1 | −1 | −1 | −1 | −1 | 0 | 0 | 0 | 1 |
| Expert | PP | PPS | ST | STS | EL | ELS | |
|---|---|---|---|---|---|---|---|
| E1 | JMA | 4 | 10–19 years | 3 | Bachelor | 3 | 0.00657462 |
| E2 | E | 3 | 20–29 years | 4 | Bachelor | 3 | 0.00657462 |
| E3 | E | 3 | 10–19 years | 3 | Master | 4 | 0.00657462 |
| … | … | … | … | … | … | … | … |
| E137 | SMA | 5 | 20–29 years | 4 | Master | 4 | 0.00854701 |
| Expert | SPFI | ||||||||||||||||||||||
|---|---|---|---|---|---|---|---|---|---|---|---|---|---|---|---|---|---|---|---|---|---|---|---|
| SC1 | SC2 | SC3 | SC4 | SC5 | SM1 | SM2 | SM3 | SM4 | SM5 | SP1 | SP2 | SP3 | SP4 | ST1 | ST2 | ST3 | ST4 | ST5 | SA1 | SA2 | SA3 | SA4 | |
| E1 | 6 | 6 | 6 | 6 | 6 | 6 | 5 | 7 | 5 | 6 | 6 | 5 | 6 | 6 | 6 | 6 | 6 | 6 | 6 | 7 | 7 | 5 | 6 |
| E2 | 6 | 6 | 6 | 6 | 6 | 6 | 5 | 7 | 7 | 6 | 6 | 7 | 7 | 7 | 7 | 6 | 7 | 6 | 6 | 7 | 7 | 6 | 7 |
| E3 | 6 | 7 | 5 | 7 | 7 | 7 | 7 | 7 | 7 | 6 | 7 | 7 | 7 | 7 | 7 | 7 | 7 | 7 | 7 | 7 | 6 | 7 | 7 |
| … | … | … | … | … | … | … | … | … | … | … | … | … | … | … | … | … | … | … | … | … | … | … | … |
| E137 | 7 | 6 | 7 | 7 | 6 | 7 | 6 | 6 | 7 | 6 | 7 | 7 | 7 | 7 | 7 | 7 | 5 | 6 | 3 | 6 | 5 | 6 | 7 |
| No. | SPFI | IFS | FN | Ranking | CPC |
|---|---|---|---|---|---|
| 1 | SP4 | (0.7632,0.8632,0.9440,0.9677) | 0.881791 | 1 | CPC1 |
| 2 | SP3 | (0.7503,0.8503,0.9304,0.9586) | 0.869727 | 2 | CPC2 |
| 3 | SC1 | (0.7435,0.8435,0.9259,0.9527) | 0.863768 | 3 | CPC3 |
| 4 | SC2 | (0.7272,0.8272,0.9051,0.9397) | 0.847293 | 4 | CPC4 |
| 5 | ST1 | (0.7286,0.8280,0.8996,0.9393) | 0.846449 | 5 | CPC5 |
| 6 | ST2 | (0.7214,0.8213,0.8881,0.9327) | 0.838476 | 6 | CPC6 |
| 7 | SP1 | (0.7183,0.8183,0.8903,0.9349) | 0.838169 | 7 | CPC7 |
| 8 | SP2 | (0.7160,0.8155,0.8851,0.9303) | 0.834434 | 8 | CPC8 |
| 9 | SA4 | (0.7151,0.8151,0.8827,0.9274) | 0.832728 | 9 | CPC9 |
| CPC | SPFI | Judgement 1 | IFS | FN | Prior Probability | ||||||
|---|---|---|---|---|---|---|---|---|---|---|---|
| E1 | E2 | E3 | … | E137 | Ad (1) | Ac (0) | In (−1) | ||||
| CPC1 | SP4 | Ad | Ac | In | … | Ac | (0.1942,0.5629,0.5962,0.8942) | 0.5565 | 0.14125 | 0.85875 | 0 |
| CPC2 | SP3 | Ad | Ac | Ac | … | Ac | (0.2011,0.5501,0.5913,0.8775) | 0.5504 | 0.126 | 0.874 | 0 |
| CPC3 | SC1 | Ac | Ac | Ac | … | Ac | (0.1593,0.5125,0.5420,0.8709) | 0.5193 | 0.04825 | 0.95175 | 0 |
| CPC4 | SC2 | Ac | Ad | In | … | Ad | (0.1551,0.4988,0.5302,0.8610) | 0.5103 | 0.02575 | 0.97425 | 0 |
| CPC5 | ST1 | Ac | Ac | Ac | … | Ac | (0.1608,0.4934,0.5297,0.8521) | 0.5082 | 0.0205 | 0.9795 | 0 |
| CPC6 | ST2 | Ac | Ac | Ac | … | Ac | (0.1295,0.4130,0.4568,0.7982) | 0.4536 | 0 | 0.884 | 0.116 |
| CPC7 | SP1 | Ac | Ad | Ac | … | Ac | (0.1882,0.5432,0.5793,0.8799) | 0.5436 | 0.109 | 0.891 | 0 |
| CPC8 | SP2 | Ac | Ad | In | … | Ac | (0.1425,0.4497,0.4894,0.8236) | 0.4783 | 0 | 0.94575 | 0.05425 |
| CPC9 | SA4 | Ad | Ac | Ac | … | Ac | (0.2123,0.5944,0.6281,0.9113) | 0.5790 | 0.1975 | 0.8025 | 0 |
| Control Mode | Probability | FN (Fuzzy Number) | HEP (Human Error Probability) |
|---|---|---|---|
| Strategic | 0.001284 | −2.00696 | 0.009841 |
| Tactical | 0.9987 | ||
| Opportunistic | 0 | ||
| Scrambled | 0 |
| CPC | SPFI | Case 1 | Case 2 | Case 3 | Case 4 | Case 5 | |||||||||||||||
|---|---|---|---|---|---|---|---|---|---|---|---|---|---|---|---|---|---|---|---|---|---|
| Probability | Probability | Probability | Probability | Probability | |||||||||||||||||
| Ad 1 | Ac 2 | In 3 | Ad | Ac | In | Ad | Ac | In | Ad | Ac | In | Ad | Ac | In | |||||||
| CPC1 | SP4 | 0 | 0 | 1 | 0 | 0.2 | 0 | 0.25 | 0.75 | 0.5 | 0 | 1 | 0 | 0.8 | 0.75 | 0.25 | 0 | 1 | 1 | 0 | 0 |
| CPC2 | SP3 | 0 | 0 | 1 | 0 | 0.2 | 0 | 0.25 | 0.75 | 0.5 | 0 | 1 | 0 | 0.8 | 0.75 | 0.25 | 0 | 1 | 1 | 0 | 0 |
| CPC3 | SC1 | 0 | 0 | 1 | 0 | 0.2 | 0 | 0.25 | 0.75 | 0.5 | 0 | 1 | 0 | 0.8 | 0.75 | 0.25 | 0 | 1 | 1 | 0 | 0 |
| CPC4 | SC2 | 0 | 0 | 1 | 0 | 0.2 | 0 | 0.25 | 0.75 | 0.5 | 0 | 1 | 0 | 0.8 | 0.75 | 0.25 | 0 | 1 | 1 | 0 | 0 |
| CPC5 | ST1 | 0 | 0 | 1 | 0 | 0.2 | 0 | 0.25 | 0.75 | 0.5 | 0 | 1 | 0 | 0.8 | 0.75 | 0.25 | 0 | 1 | 1 | 0 | 0 |
| CPC6 | ST2 | 0 | 0 | 1 | 0 | 0.2 | 0 | 0.25 | 0.75 | 0.5 | 0 | 1 | 0 | 0.8 | 0.75 | 0.25 | 0 | 1 | 1 | 0 | 0 |
| CPC7 | SP1 | 0 | 0 | 1 | 0 | 0.2 | 0 | 0.25 | 0.75 | 0.5 | 0 | 1 | 0 | 0.8 | 0.75 | 0.25 | 0 | 1 | 1 | 0 | 0 |
| CPC8 | SP2 | 0 | 0 | 1 | 0 | 0.2 | 0 | 0.25 | 0.75 | 0.5 | 0 | 1 | 0 | 0.8 | 0.75 | 0.25 | 0 | 1 | 1 | 0 | 0 |
| CPC9 | SA4 | 0 | 0 | 1 | 0 | 0.2 | 0 | 0.25 | 0.75 | 0.5 | 0 | 1 | 0 | 0.8 | 0.75 | 0.25 | 0 | 1 | 1 | 0 | 0 |
| COCOM | Case 1 | Case 2 | Case 3 | Case 4 | Case 5 | ||||||||||
|---|---|---|---|---|---|---|---|---|---|---|---|---|---|---|---|
| P 1 | FN | HEP | P | FN | HEP | P | FN | HEP | P | FN | HEP | P | FN | HEP | |
| Strategic | 0 | −0.5 | 0.3162 | 0 | −0.5774 | 0.2646 | 0 | −2 | 0.05 | 0.99 | −2.2883 | 0.005149 | 1 | −3.65 | 0.000224 |
| Tactical | 0 | 0.001343 | 1 | 0.01 | 0 | ||||||||||
| Opportunistic | 0 | 0.1644 | 0 | 0 | 0 | ||||||||||
| Scrambled | 1 | 0.8343 | 0 | 0 | 0 | ||||||||||
Publisher’s Note: MDPI stays neutral with regard to jurisdictional claims in published maps and institutional affiliations. |
© 2022 by the authors. Licensee MDPI, Basel, Switzerland. This article is an open access article distributed under the terms and conditions of the Creative Commons Attribution (CC BY) license (https://creativecommons.org/licenses/by/4.0/).
Share and Cite
Fan, H.; Enshaei, H.; Jayasinghe, S.G. Human Error Probability Assessment for LNG Bunkering Based on Fuzzy Bayesian Network-CREAM Model. J. Mar. Sci. Eng. 2022, 10, 333. https://doi.org/10.3390/jmse10030333
Fan H, Enshaei H, Jayasinghe SG. Human Error Probability Assessment for LNG Bunkering Based on Fuzzy Bayesian Network-CREAM Model. Journal of Marine Science and Engineering. 2022; 10(3):333. https://doi.org/10.3390/jmse10030333
Chicago/Turabian StyleFan, Hongjun, Hossein Enshaei, and Shantha Gamini Jayasinghe. 2022. "Human Error Probability Assessment for LNG Bunkering Based on Fuzzy Bayesian Network-CREAM Model" Journal of Marine Science and Engineering 10, no. 3: 333. https://doi.org/10.3390/jmse10030333
APA StyleFan, H., Enshaei, H., & Jayasinghe, S. G. (2022). Human Error Probability Assessment for LNG Bunkering Based on Fuzzy Bayesian Network-CREAM Model. Journal of Marine Science and Engineering, 10(3), 333. https://doi.org/10.3390/jmse10030333