Article

Seaport Terminals Risks Prioritization Using a Structural Modeling-Based Approach: A Real Case Study

1
OLID Laboratory, Higher Institute of Industrial Management of Sfax, University of Sfax, Technopole of Sfax, P.O. Box 1164, Sfax 3021, Tunisia
2
Department of Industrial Engineering, College of Engineering, Taif University, P.O. Box 11099, Taif 21944, Saudi Arabia
*
Author to whom correspondence should be addressed.
J. Mar. Sci. Eng. 2022, 10(2), 217; https://doi.org/10.3390/jmse10020217
Submission received: 13 January 2022 / Revised: 2 February 2022 / Accepted: 3 February 2022 / Published: 7 February 2022
(This article belongs to the Special Issue Coastal Risk Assessment and Management)

Abstract

:
Port risk management (PRM) during port operations is a current problem that can negatively affect the environment, people, and economic issues. In the literature, there is an enormous amount of research related to supply chain risk management (SCRM) in various areas and with various objectives. However, PRM has not received the same degree of attention. In fact, port terminals are crucial links in most supply chain networks and an important pillar of international trade. Therefore, for better risk mitigation efficiency, a risk assessment and prioritization step are vital. Recently in the literature, researchers have applied prospective methods such as structural analysis methods to risk prioritization in SCRM. The aim of this research is to prioritize various man-made risk variables in PRM using a qualitative structural modeling-based approach, specifically, the MICMAC method (referring to its French acronym: Matrice d’Impacts Croisés Multiplication Appliquée à un Classement). An empirical study was conducted to assesses and prioritize risk variables of the seaport terminals of Sfax (Tunisia). The main contributions of the empirical research are twofold. First, to prioritize the key risk variables to define the most critical ones that require immediate intervention. Second, to analyze the structure of the influences between all identified risk variables. The results for the port terminals of Sfax show that the highest-priority risk variables are the manual handling (Ph3), disregard for safety aspects (Ph4), unsafe storage of goods (Inc1), absence of a prevention system and a rescue organization (Inc2), neglect of the regulatory aspects of handling equipment (M1), ignorance of good handling practices during the operation of loading and unloading (Cho2), and inadequate lifting accessories (Cho3). These risk variables must be the subject of urgent risk reduction strategies.

1. Introduction

The performance of the supply network can be influenced by numerous disturbing risks that affect all items, administrations, and data between stakeholders. Management of these risks is known as supply chain risk management (SCRM) [1]. There are many classifications of SCRM proposed in the literature. The comment and recent one is about classifying risk sources into three groups: (i) internal to the firm, (ii) external to the firm but internal to the supply chain, and (iii) external to the supply chain. Risks can also be categorized into many types under these three groups, such as demand side, process side, supply side, etc. [2].
Therefore, in the literature, there is an enormous amount of research related to SCRM in various areas and with various objectives. However, port risk management (PRM) has not received the same degree of attention [3]. However, port terminals and seaports are vital links in supply chain networks. Seaports are positioned as an important pillar of international trade. In seaport terminals, many sources of risk can be triggered by various threats. It is better to classify them into two main risk groups: natural and man-made risk groups [4]. In this manuscript, only man-made risk is considered. In fact, man-made risks occur mainly as a consequence of one or more intentional or negligent human actions. Moreover, risks can be classified into different groups, including operational, technical and technological, organizational, and environmental [5].
SCRM can be studied differently and more specifically to identify the most critical risk is the use of the prospective methods such as structural analysis methods such as the Interpretive Structural Modelling (ISM) method, Matrice d’impacts croisés multiplication appliquée à un classement (which refers to its French acronym, MICMAC) method [6,7,8], the MACTOR (Matrix of Alliances and Conflicts: Tactics, Objectives, and Recommendations) method [9], the morphological approach [10], etc. For example, Hachicha and Elmsalmi [6] proposed an integrated approach based on structural modeling for risk prioritization in the supply network management of the food industry.
Jha and Devaya [7] present the international construction chance elements of the attitude of Indian production experts in a comprehensive format to enable them to prioritize efforts to manage the hazard elements. Additionally, Pfohl et al. [8] classify the risks of the supply chain and validation of the approach through two case studies. Pandey and Sharma [11] present an interpretive structural modelling approach based on FMEA to model the automotive supply chain risk.
In fact, structural analysis is a method that allows one to identify key variables in a studied system. This method gives an exhaustive representation of the system and makes it possible to reduce its complexity to essential variables. According to Godet et al. [12], structural analysis is ‘a method of structuring a collective reflection, the chosen project of which can be considered as a system and can be defined as a set of elements in interaction’. In this vein, Maruster and Gijsenberg [13] consider that the structural analysis is made by a working group made up of participants and experts in the field concerned, but this does not exclude the intervention of an external “board”. The previous results that mention the influence and dependence of each variable can be represented on a plane (the x axis corresponding to the dependence and the y axis to the influence). Besides identifying the most influential variables of the system studied, we can thus focus on the different roles of the variables in the system, of which the following plan presents a typology.

1.1. Literature Review

Port cities are hazardous areas because of the diversity and intensity of the activities carried out and the amount of dangerous goods that transit through the ports. Port disasters, although not common, are part of the reality of port cities. For example, we can cite the explosion of the Sembla silos in the Port Autonome of Bordeaux on 20 August 1997, which caused 11 deaths and 1 serious injury. On 26 August 1972, the Greek oil tanker “Princess Irene” was the subject of a disaster. The explosion occurred in the port of Sri Lanka, killing 6 people [5]. Further examples include SEVESO in Italy 1976 [14], Chernobyl in Ukraine 1986 [15], and the recent Beirut port terminal disaster in 2020 [16], etc. It should be noted that, recently, many dangerous goods terminals have been moved outside cities as a solution to eliminate some risk variables. It seems that is not a sustainable solution. The port situation can return to the same with urban extension.
Therefore, some of the work has studied the problem of PRM. Smari and Noumen [17] compiled a comprehensive list of possible risks for PRM in container terminals and compared them with the risks identified in the Tunisian context. Their method of risk identification is based on qualitative interviews with practitioners and the existing literature and port data. Pallis [18] presented a review of different approaches to specifically quantify risk in the container terminal. Wiegel et al. [19] described a method of global mapping of seaport operability risk indicators using open-source ocean weather data. John et al. [20] proposed a novel fuzzy chance evaluation approach to facilitate the remedy of uncertainties in seaport operations and to optimize its overall performance effectiveness. Nagi et al. [4] detected communities of stakeholders at the port of Hamburg regarding their communication intensity in activities related to risk management. Pileggi et al. [21] proposed an ontology (CoRiMaS) that implements a developed reference model for risk management explicitly aimed at seaports with a cooperative approach to risk management. Ding and Tseng [22] evaluated safety operations in exclusive container terminals at the Kaohsiung port in Taiwan using a fuzziness-based method. Wan et al. [23] identified the main risk factors that influence the safety and security of maritime container supply chains (MCSCs) using the risk classification framework, which incorporates a Delphi survey and a risk matrix approach. The risk elements in [23] are quantitatively evaluated with respect to their probability of occurrence and severity of the effect and include five points of view: society, natural environment, management, infrastructure and technology, and operations. Bellsolà et al. [24] proposed a new methodology to assess nautical risks in ports based on the knowledge of navigators and risk experts. They have quantified the risk in different areas of any port using a proposed nautical port risk index.
Loh and Thai [25] introduced a port-centric supply chain disruption (PSCD) model that incorporates the application of risk management, business continuity management, and quality management theories with the objective of increasing port resilience to improve supply chain continuity. Loh et al. [26] studied the role of ports in supply chain disruptions through the establishment of the portfolio of each PSCD threat based on data collected from port operators and port users worldwide. John et al. [27] presented a risk assessment approach to improve the resilience of a seaport system using Bayesian networks.
Based on this review of the literature, two main statements have been concluded. First, PRM research has a huge scope and covers numerous extraordinary elements, including risk factors, hazard assessment, disaster response planning, empirical information, and frameworks. However, in a few cases, the contributing authors expand very specific methods relevant to particular ports. Second, the previously proposed methods do not take into account the complexity, dynamics, and unpredictability of risk management problems and are limited to the case of arrivals of containers intended exclusively for import or export. There is a lack of experimental studies on the case of risk reduction after the departure and arrival of containers. Most of the works related to ports in the world do not significantly address the problem of risk management during port operations. The use of structural analysis methods in PRM is rarely addressed. However, these methods have been widely studied in SCRM, especially during risk assessment and prioritization.

1.2. Objective of the Study

In the literature, there is an enormous amount of research related to supply chain risk management (SCRM) in various areas and with various objectives. However, PRM have not received the same degree of attention. However, port terminals are crucial links in most supply chain networks and are an important pillar of international trade. Therefore, for better risk mitigation efficiency, a risk identification and prioritization step are vital. The main research question discussed in this study is about how to prioritize various man-made risk variables in PRM using a qualitative structural modeling-based approach and precisely the MICMAC method. An empirical study was conducted to identify, evaluate, and prioritize risk variables of the Sfax port terminals (Tunisia). This port studied is a medium-sized one. The types of vessels that regularly call in this port are general cargo, bulk carrier, container ship, oil/chemical tanker, fishing, etc.
Input data of the study are collected based on the literature review and experts’ opinions in the field. After that, the MICMAC method is applied to understand the direct and indirect relationships between these identified risk variables and to determine the most prioritized and fundamental risk variables of them.

2. Materials and Methods
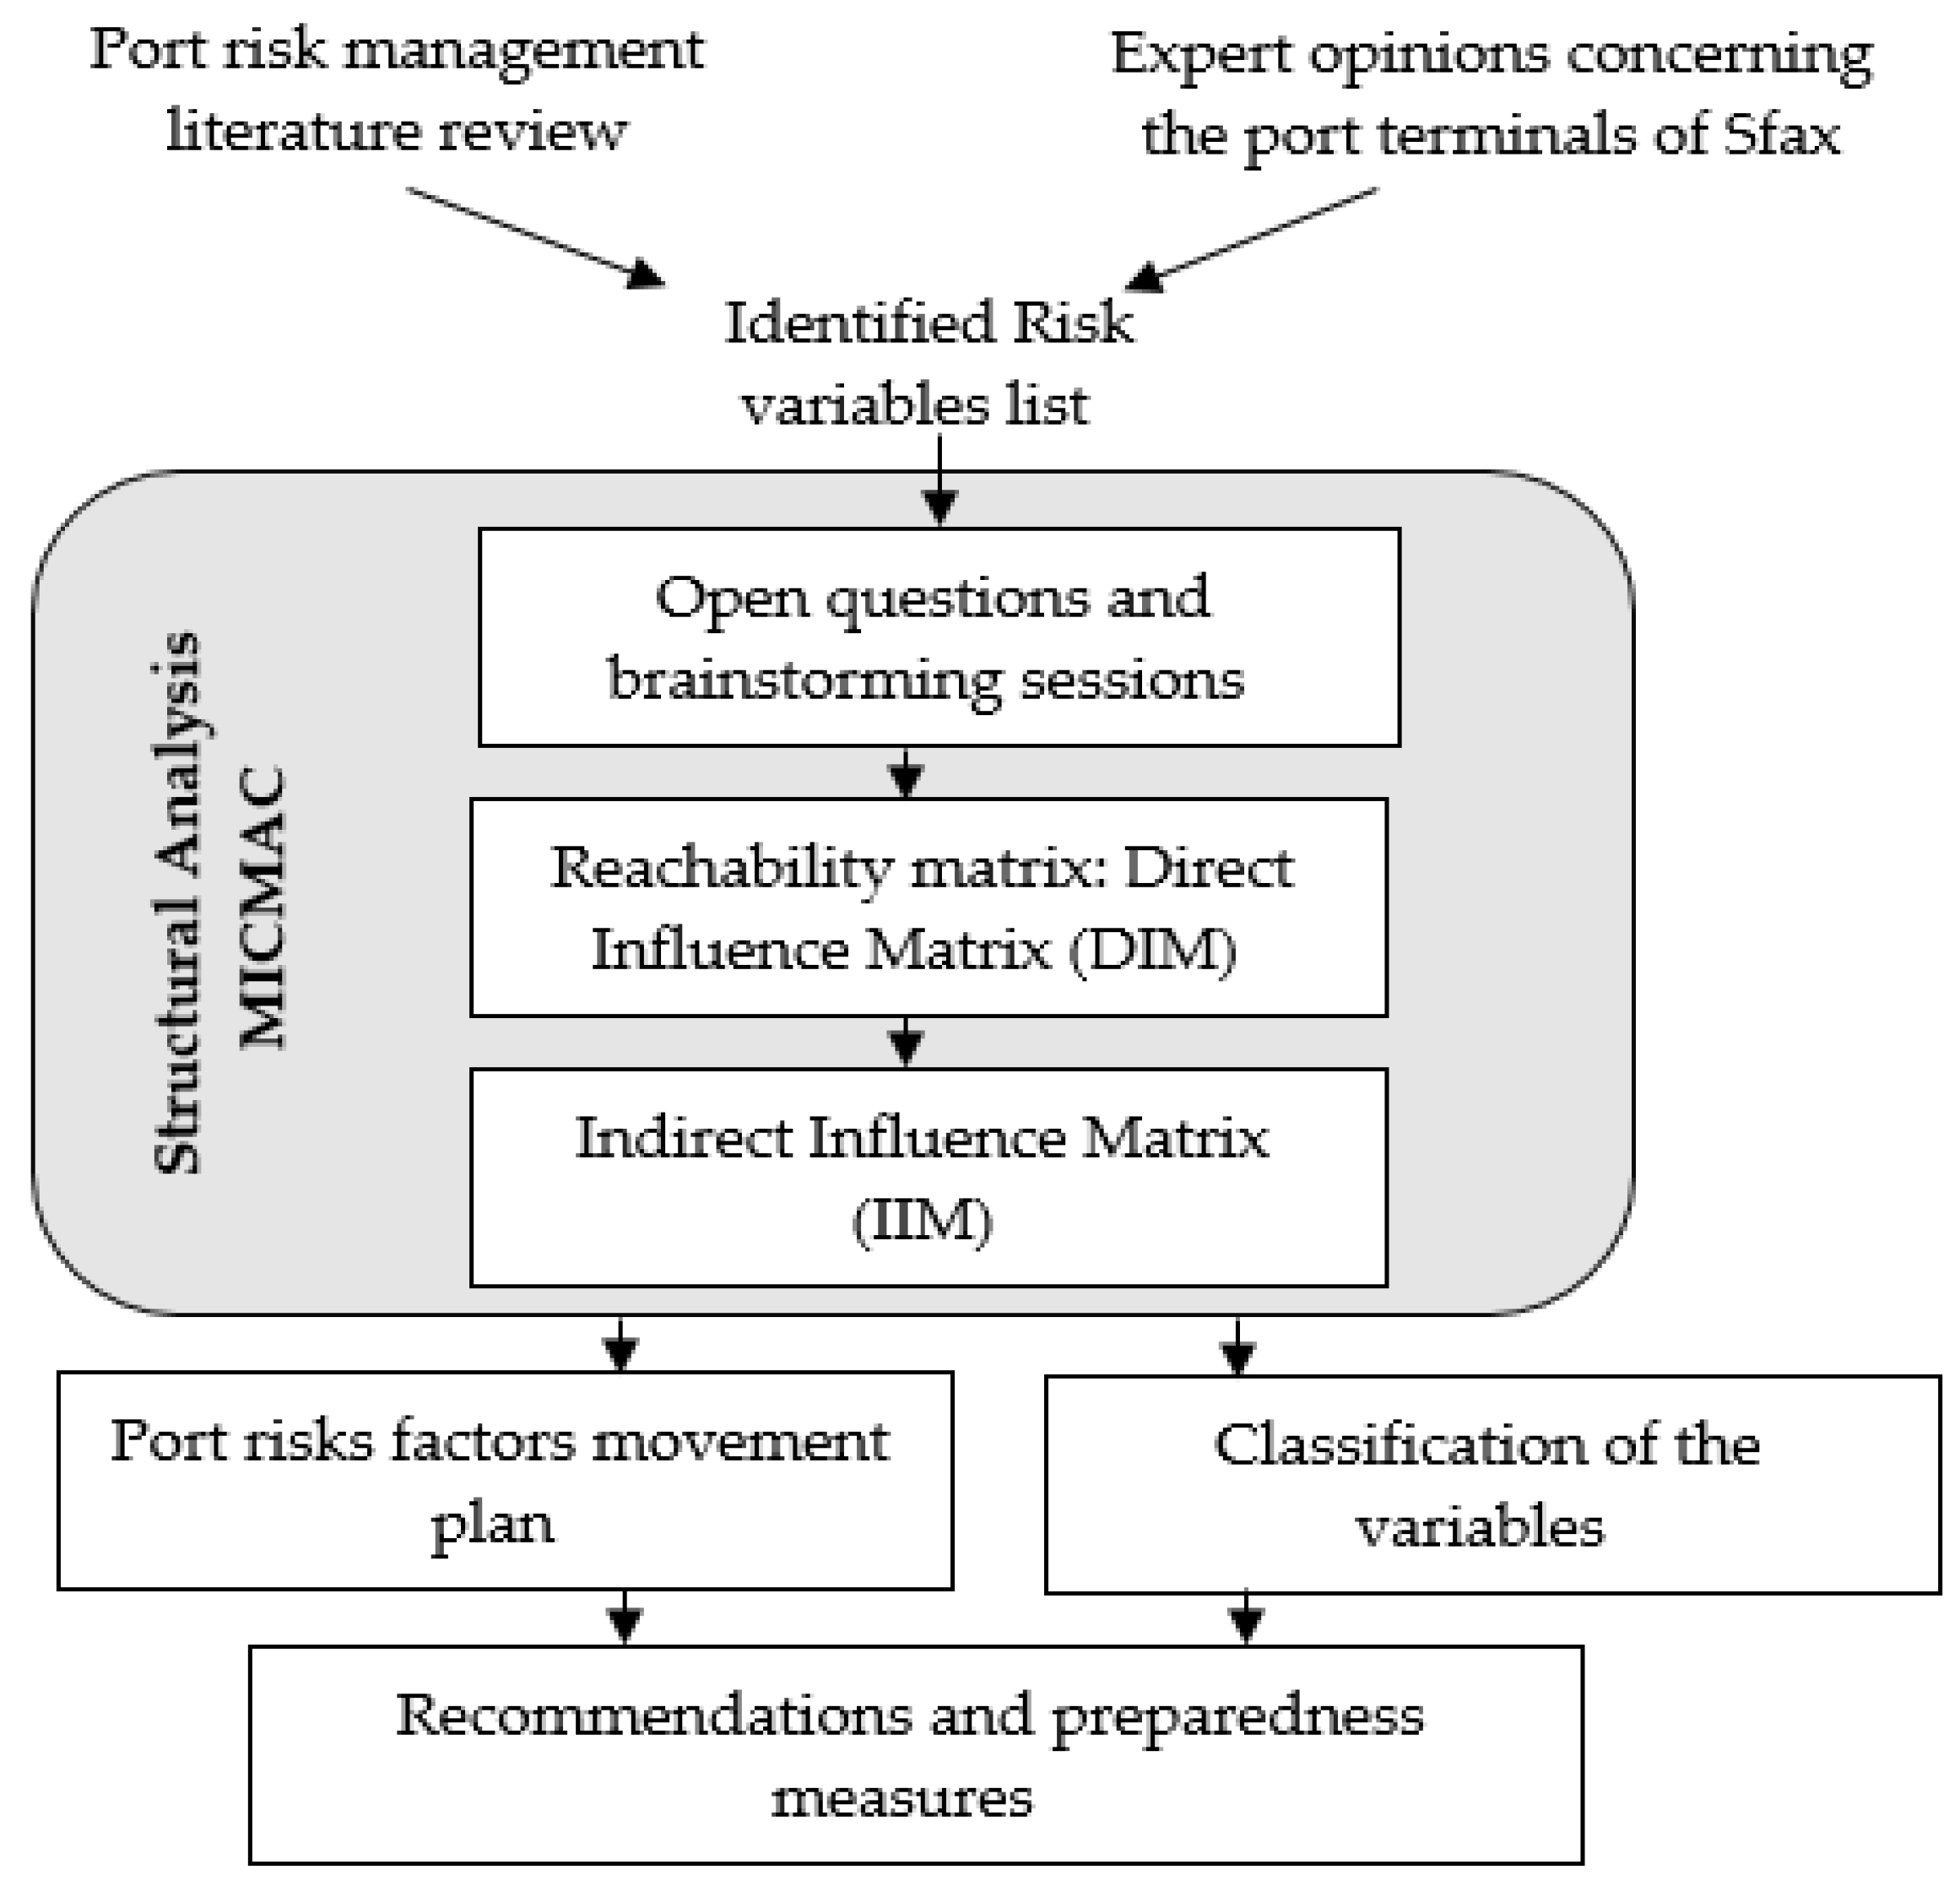
2.1. MICMAC Method

The MICMAC method was developed in 1971 by Michel Godet [12]. The application of this method was made on the Micmac software. This software is developed by the French Institute of Computer Innovation for the Enterprise. Ocampo et al. [28] define MICMAC as a matrix multiplication program applied to the structural matrix, which allows us to study the propagation effect of the reaction paths and circuits, so that the variables are consistent: by influence order prioritize the variables. The MICMAC method allows to prioritize all the possible factors according to their influence, dependence and indirectness. It is based on the properties of matrix calculation.
There are three steps in MICMAC analysis: (1) all possible variables that characterize the studied system (internal and external variables) are listed. (2) a description of the relationships between each pair of variables is made. For each pair of variables, the following question is posed. Is there a direct influence relationship between variable i and variable j? The response is a score of 0 to 3. The value 0 indicates the absence of influence; 1: Low influence; 2: medium influence; 3: High influence. (3) the identification of the most important variables which are essential to the evolution of the system. The classification is based on the direct and indirect influence of each variable. The indirect classification is obtained after increasing the power of the matrix. The comparison of the hierarchy of variables within the exclusive classifications (direct, indirect) is instructive. It makes it viable to confirm the importance of certain variables [29].
All identified variables are categorized into four different quadrants: quadrant of autonomous variables, quadrant of influent variables, quadrant of dependent variables, and quadrant relay variables. First, autonomous variables are characterized by both weak dependence and week influence. All autonomous variables are excluded from the risk analysis. Second, influent variables are characterized by a high influence and low dependence. They considered them as input variables of the system studied. Third, dependent variables are characterized by a low influence and high dependence. They considered them as output variables of the system studied. Finally, the relay variables are characterized by high influence and high dependence. They considered at the same time as the input and output variables of the studied system. These variables are the most critical variables of the studied system.
The objective of the MICMAC method includes the following: (1) systematically analyze the influence of each risk variable on the others; (2) identify the indirect relationships between the risk variables; and (3) then rank these variables according to their degree of influence and dependence.
The MICMAC method has been applied in various area to study the most important factors of a complex systems. Very recent applications in the literature have been noted, such as in civil engineering [29], risk management [1,10,30], etc., supply chain management [31], manufacturing management [32,33], etc.

2.2. The Proposed Approach

The purpose of this research is to prioritize various man-made risk variables in PRM using a qualitative structural modeling-based approach and precisely the MICMAC method. An empirical study was conducted to assesses and prioritize risk variables of the seaport terminals of Sfax (Tunisia).
The studied port was established in 1894 and is one of the main pillars of the Tunisian economy, thanks to its openness to international trade. The Sfax port is a medium-sized one. The types of vessels that frequent this port are general cargo, bulk carrier, container ship, oil/chemical tanker, fishing, etc. With its multipurpose mooring, the port has 13 stations and can actually accommodate 11 ships simultaneously, depending on the size of the vessel.
The flow chart of the proposed approach is presented in Figure 1. First, The MICMAC method requires a taxonomy of risk factors related to port operations in order to identify port risk variables according to their influence and dependence and to highlight key risk variables. Second, the reachability matrix is introduced as an input to the MICMAC method. Third, the indirect influence matrix and the direct and indirect displacement map are obtained as an output of the MICMAC method.
The main contributions of the empirical research are twofold. First, prioritize the key risk variables to define the most critical ones that require immediate intervention. Second, to analyze the structure of the influences between all identified risk variables.

3. Results

3.1. Identification of Risk Variables

The taxonomy of risk variables was carried out with the help of experts involved in the port. The main objective of the interviews and group work at the Sfax port terminals is to identify all risk variables. The 26 risk-adjusted variables are presented in Table 1. These experts have been chosen according to their experiences in the port of Sfax.

3.2. MICMAC Matrix

The direct influence matrix describes the direct influence relationships between the risk variables that define the risk management system (PRM) (see Figure 2), as this matrix is filled in by the experts involved in the port with intensities rated from 0 to 3. The value 0 indicates the absence of influence; 1: low influence; 2: medium influence; 3: high influence.
All values in Figure 2 are assigned after a compromise between the three experts during brainstorming sessions. It should be noted that all values of the diagonal of the matrix of Figure 2 are equal to zero because it assumed that there is no influence between a risk variable with itself. For the first example, experts determined that poor workplace design (CI1) has a low influence on the (CI2) lack of signage for the circulation of various flows. For a second example, a lack of training (Ph2), disregard for safety aspects (Ph4), and lack of supervision (M3) have the highest influence (a weight of 3 is assigned) on all other risk variables except with itself.
It should be noted that the sum of each row of the matrix (Figure 2) corresponds to the direct influence of each variable, and the sum of each column corresponds to the direct dependence.

3.3. MICMAC results

The analysis of the direct/indirect displacement map (Figure 3) shows a certain number of changes in the classification of the variables, both at the level of dependence and at the level of motor skills. The classification change of the variables represents the variation in positions of the variables between their initial ones (Plan of Direct Influences/Dependencies) and final ones (released from the Plan of Influences/Indirect Dependencies). This implies the advantage of highlighting the appreciation of hidden risk variables by considering their indirect influences.
The displacement map of direct and indirect influences/dependencies shown in Figure 3 is an output of the MICMAC software and presents the risk variables on a dependence plan influenced by the dependence on the X-axis and the influence on the Y-axis. The factors are plotted on the plan according to the strength of their influence and dependence on the indirect influence matrix (IIM). The IIM is the matrix that resulted from incorporating all the transitivity from the original direct influence matrix (DIM) that comprised the input data for the program (Figure 2) also named the reachability matrix. The projection of the risk variables into the direct/indirect movement plan shows that:
  • The input or influential variables, located to the northwest are: M3 (lack of supervision), EL4 (neglect of regulatory aspects (periodic inspection)), EL2 (lack of work equipment and individual protection equipment (EPI)), M2 (lack of lighting (visual management)), Ph1 (bad arrangement of the stations), Ph2 (lack of training) and EL3 (faulty electrical installation). These are highly influential variables and are less dependent than the other variables in the PRM system. They are also explanatory variables of the system under study and are the most crucial elements. These variables cannot be controlled.
  • The relay variables are highly influential and highly dependent variables: Inc3 (neglect of regulatory aspects: the requirements of safety code and prevention against fire, explosion, and panic risks), Ph3 (manual handling), Ph4 (disregard of safety aspects (lack of procedures, instructions, supervision, roles and responsibilities, job description), Inc1 (unsafe storage of the goods (non-respect of thermal flows, domino rule, bow tie, etc.), CI3 (neglect of the EPI (gloves, mask, etc.) by the workers exposed to the risk (absence of discipline), ChO2 (ignorance of the good practices of handling (slinging of the goods) during the operation of loading and unloading), ChO3 (inadequate lifting accessories (chains, slings, ropes, shackles, hooks, lifting straps) and noncompliance with the regulatory aspects of the Tunisian Decree 62–129 (periodic inspection required)) and M1 (neglect of the regulatory aspects of handling equipment (periodic inspection).
  • The outcome or dependent variables are both weakly influential and highly dependent. The evolution of these variables is explained by the evolution of the input and relay variables. These are the output variables of the PRM system: CI1 (poor layout of the workplaces), M4 (fault from heights (of drivers: forklift operators, crane operators, etc.), ChO1 (instability and bad storage of the goods), C1 (poor handling of chemicals), etc.
  • The autonomous variables are variables with little influence and little dependency. They have little impact on the evolution of the PRM system: CI4 (deficient and irregular ground), C2 (absence of a Safety Data Sheet (SDS) for the goods), C3 (no wearing of the EPI (gloves, mask, etc.) by workers exposed to the risk (absence of discipline).
  • The platoon variables are more influential in the medium than the dependent variables. It is not possible to determine their role in the PRM system: CI2 (lack of signage of the aisles of circulation of various flows (pedestrians, carts, materials, etc.), EL1 (lack of training for electricians), CI3 (absence of plan, instruction, traffic display), Ph5 (poor posture and physical condition).
MICMAC method incorporates all levels of transitivity. If “M” denotes the initial reachability matrix (named also, Direct Influence Matrix) shown in Figure 2, then “M2” provides the second levels of transitivity, “M3” provides the third levels of transitivity, and so on. Each matrix Mk (k > 1) represents an indirect influence matrix of order k, which provides a new hierarchy among variables when certain power convergences are met (generally 5 or 6). That means that the same hierarchy remain unchanged [12,34].
Table 2 presents another output to the MICMAC software, showing the numerical weights of the risk variables for direct and indirect for both influence and dependence. The numerical values in Table 2 allow us to have a classification of the variables according to their influences and their decreasing dependences (direct and indirect). Note that these numerical values are normalized.
For example, the neglect of regulatory aspects (EL4) is ranked as first for direct influence and is ranked twelfth for direct dependency. For indirect score, EL4 remains first for indirect influence, and its rank for indirect dependency becomes thirteenth.
Through the MICMAC analysis, all these variables are important, whether they have strong influences and strong dependencies (relay variables) or they have a very high influence. The highest priority risk variables, Ph3, Ph4, Inc1, Inc3, M1, Cho2, Cho3, are the most critical variables and must urgently be the subject of risk reduction strategies in the port of Sfax. Moreover, managers should not neglect the variables {EL4, Ph2, M3, and Ph1} in view of their higher influences.

4. Discussion

After risk prioritization, the primary work to carry out is to find effective risk mitigation strategies from the identified risks. However, it is important to note that these measures must be taken by all the players in the port logistics chain, who must each collaborate on their own and respect their duties. Adequate preparedness measures are suggested:
  • Respect of general obligations of the competent authority of the flag state:
  • Respect of general obligations and responsibilities of ship owners: The ship owner is primarily responsible for the safety and health of all seafarers on board ships. However, the daily duty rests with the captain who has to adhere to the reporting approaches set through ship owners. These should establish an adequate seafarer health and safety policy, under the law national and international, and provide the means necessary for the execution of these policies. The policy and software must set out the obligations of all parties, such as shore employees and contractors. Ship owners should offer and keep or replace vessels, gadget, units, manuals, and other files, and prepare all coaching and sports in the sort of way that, to the fullest extent possible, seafarers are not exposed to any chance of twist of fate or damage. The planning, preparation, and implementation of activities should take the following requirements: (1) All dangers that may arise on the port must be avoided. (2) Excessively or unnecessarily painful working postures and movements must be avoided. (3) The organization of work must consider the safety and health of the sea worker. (4) The materials and products used must be safe and do not endanger the health of seafarers. (5) The working methods employed must ensure the protection of seafarers against the harmful effects of chemical, physical, and biological agents. (6) Shipowners should take a look at the applicable national and international regulations while setting the level of staffing and thinking about the requirements necessary in phases of bodily fitness, state of health, level of competence, and language skills to ensure the protection and health of seafarers in keeping their obligations onboard the ship.
  • Respect of general obligations and responsibilities of the owner;
  • Respect of general obligations and responsibilities of employees;
  • Respect of the general obligations and responsibilities of the safety and health committee on board which include the following. (1) Ensure that the requirements of the competent authority and the ship owner in the safety and health sector are satisfied. (2) Address, through the captain, complaints and recommendations to the owner on behalf of the crew. (3) Examine matters of concern to the crew in matters of safety and health, and take the necessary measures on this basis to assess the safety and protection, including life-saving devices. (4) Study accident reports.
  • Respect of general duties and responsibilities of the security officer. They include the following: (1) He should educate the crew members on safety issues. (2) Investigate safety lawsuits brought to its attention and seize the safety and fitness committee and individuals if vital.

5. Conclusions

In this paper, the MICMAC method was used to assess and prioritize various man-made risk variables in PRM. An empirical study was conducted on the seaport terminals of Sfax (Tunisia). The results obtained concern the influences and the dependencies of all 26 identified risk variables which are exerted directly and indirectly, which will allow the various risk managers to design, propose, and initiate more effective policies in terms of prevention.
This work shows that risk management at is a strategic, capital, and inescapable process, as it affects all aspects of the professional activity, especially the port. From a regulatory point of view, port risk management is not only solicited but is becoming more and more required by both the supervisory authorities and the customers. In fact, it is part of a management system that now involves all the stakeholders in the port logistics chain.
The MICMAC method applied to the PRM system within the port of Sfax has allowed us to highlight the prioritization of its own risk variables. It positions the understanding of the port organization and its context, staff competence, internal audit, stabilization, and environment for implementing processes as the main input variables. Thus, the analysis of these statements through the MACTOR tool will shows the need for renewed sector governance with institutional organization, informational transparency, and an attractive structure to mitigate risks during port operations. Therefore, the MACTOR analysis is suggested for perspective works to study the power relations between the supply chain actors and to understand the convergences and divergences of objectives and to dissolve disagreements and conflicts between them for an effective SCRM.

Author Contributions

Conceptualization, M.E., M.D. and W.H.; methodology, M.E., W.H. and A.M.A. software, M.D. and M.E.; validation, M.E., W.H. and A.M.A.; formal analysis, M.E. and M.D.; investigation, M.D.; resources, M.D.; data curation, M.D. and W.H.; writing—original draft preparation, M.D. and M.E., writing—review and editing, W.H. and A.M.A.; visualization, W.H. and A.M.A.; supervision, W.H.; project administration, W.H. and A.M.A., funding acquisition, A.M.A. All authors have read and agreed to the published version of the manuscript.

Funding

This research was supported and funded by Taif University Researchers Supporting Project number (TURSP-2020/229), Taif University, Taif, Saudi Arabia. The authors are grateful for this financial support.

Institutional Review Board Statement

Not applicable.

Informed Consent Statement

Not applicable.

Data Availability Statement

Data are contained within the article.

Acknowledgments

This research was supported by the Taif University Researchers who supported Project number (TURSP-2020/229), Taif University, Taif, Saudi Arabia. First, the authors are grateful for this financial support. Second, the authors would like to express their thanks to all the experts for their help and their implication during the brainstorming sessions. Finally, the authors would like to thank the editor and the three anonymous reviewers, whose insightful comments and constructive suggestions helped us to significantly improve the quality of this paper.

Conflicts of Interest

The authors declare no conflict of interest.

References

  1. Elmsalmi, M.; Hachicha, W.; Aljuaid, A.M. Prioritization of the Best Sustainable Supply Chain Risk Management Practices Using a Structural Analysis Based-Approach. Sustainability 2021, 13, 4608. [Google Scholar] [CrossRef]
  2. Shahbaz, M.S.; Sohu, S.; Khaskhelly, F.Z.; Bano, A.; Soomro, M.A. A Novel Classification of Supply Chain Risks: A Review. Eng. Technol. Appl. Sci. Res. 2019, 9, 4301–4305. [Google Scholar] [CrossRef]
  3. Dias, G.C.; Leal Junior, I.C. Rébula de Oliveira, U. Supply chain risk management at seaport container terminals. Gest. Prod. 2019, 26, 1–14. [Google Scholar] [CrossRef] [Green Version]
  4. Nagi, A.; Schroeder, M.; Kersten, W. Risk management in seaports: A community analysis at the port of Hamburg. Sustainability 2021, 13, 8035. [Google Scholar] [CrossRef]
  5. Roux, P. Guide pour la conception et l’exploitation de silos de stockage de produits agro-alimentaires vis-à-vis des risques d’explosion et d’incendie ». Ministère de l’Aménagement du territoire et de L’environnement; Institut National de l’Environnement Industriel et des Risques INERIS: Paris, France, 2000. [Google Scholar]
  6. Hachicha, W.; Elmsalmi, M. An integrated approach based-structural modeling for risk prioritization in supply network management. J. Risk Res. 2014, 17, 1301–1324. [Google Scholar] [CrossRef]
  7. Jha, K.N.; Devaya, M.N. Modelling the risks faced by Indian construction companies assessing international projects. Constr. Manag. Econ. 2008, 26, 337–348. [Google Scholar] [CrossRef]
  8. Pfohl, H.; Gallus, P.; Thomas, D. Interpretive structural modeling of supply chain risks. Int. J. Phys. Distrib. Logist. Manag. 2011, 41, 839–859. [Google Scholar] [CrossRef]
  9. Elmsalmi, M.; Hachicha, W. Risk Mitigation Strategies According to the Supply Actors’ Objectives by Using the MACTOR Method. In Proceedings of the International Conference on Advanced Logistics and Transport (ICALT’2014), Hammamet, Tunisia, 1–3 May 2014; pp. 362–367. [Google Scholar]
  10. Elmsalmi, M.; Hachicha, W.; Aljuaid, A.M. Modeling Sustainable Risks Mitigation Strategies Using a Morphological Analysis-Based Approach: A Real Case Study. Sustainability 2021, 13, 12210. [Google Scholar] [CrossRef]
  11. Pandey, A.K.; Sharma, R.K. FMEA-based interpretive structural modelling approach to model automotive supply chain risk. Int. J. Logist. Syst. Manag. 2017, 27, 395–419. [Google Scholar]
  12. Godet, M.; Durance, P.; Gerber, A. Strategic Foresight la Prospective; Cahiers du LIPSOR: Paris, France, 2008. [Google Scholar]
  13. Maruster, L.; Gijsenberg, M.J. Qualitative Research Methods; Sage Publications Ltd.: New York, NY, USA, 2013; Available online: https://www.amazon.com/Qualitative-Research-Gijsenberg-compilation-Maruster/dp/1446272370/ref=monarch_sidesheet (accessed on 2 February 2022).
  14. Centemeri, L. «Enquêter la mémoire disctréte de desastre de Soveso». Le gouvernement des Catastrophes 2013, 217–249. [Google Scholar] [CrossRef]
  15. Bertazzi, P.A. Future prevention and handling of environmental accidents. Scand. J. Work. Environ. Health 1999, 1999, 580–588. [Google Scholar] [CrossRef] [PubMed] [Green Version]
  16. ElGharbawi, T.; Zarzoura, F. Damage detection using SAR coherence statistical analysis, application to Beirut, Lebanon. ISPRS J. Photogramm. Remote Sens. 2021, 173, 1–9. [Google Scholar] [CrossRef]
  17. Smari, S.; Noumen, R. Port risk assessment in container terminals: The case of Tunisia. Int. J. Transp. Dev. Integr. 2020, 4, 42–50. [Google Scholar]
  18. Pallis, P.L. Port Risk Management in Container Terminals. Transp. Res. Procedia 2017, 25, 4411–4421. [Google Scholar] [CrossRef]
  19. Wiegel, M.; de Boer, W.; van Koningsveld, M.; van der Hout, A.; Reniers, A. Global mapping of seaport operability risk indicators using open-source metocean data. J. Mar. Sci. Eng. 2021, 9, 695. [Google Scholar] [CrossRef]
  20. John, A.; Paraskevadakis, D.; Bury, A.; Yang, Z.; Riahi, R.; Wang, J. An integrated fuzzy risk assessment for seaport operations. Saf. Sci. 2014, 68, 180–194. [Google Scholar] [CrossRef] [Green Version]
  21. Pileggi, S.F.; Indorf, M.; Nagi, A.; Kersten, W. CoRiMaS—An Ontological Approach to Cooperative Risk Management in Seaports. Sustainability 2020, 12, 4767. [Google Scholar] [CrossRef]
  22. Ding, J.F.; Tseng, W.J. Fuzzy risk assessment on safety operations for exclusive container terminals at Kaohsiung port in Taiwan. Proc. Inst. Mech. Eng. Part M J. Eng. Marit. Environ. 2013, 227, 208–220. [Google Scholar] [CrossRef]
  23. Wan, C.; Yan, X.; Zhang, D.; Qu, Z.; Yang, Z. An advanced fuzzy Bayesian-based FMEA approach for assessing maritime supply chain risks. Transp. Res. Part E Logist. Transp. Rev. 2019, 125, 222–240. [Google Scholar] [CrossRef]
  24. Bellsolà Olba, X.; Daamen, W.; Vellinga, T.; Hoogendoorn, S.P. Risk Assessment Methodology for Vessel Traffic in Ports by Defining the Nautical Port Risk Index. J. Mar. Sci. Eng. 2020, 8, 10. [Google Scholar] [CrossRef] [Green Version]
  25. Loh, H.S.; Thai, V.V. Managing port-related supply chain disruptions (PSCDs): A management model and empirical evidence. Marit. Policy Manag. 2016, 43, 436–455. [Google Scholar] [CrossRef]
  26. Loh, H.S.; Thai, V.V.; Wong, Y.D.; Yuen, K.F.; Zhou, Q. Portfolio of port-centric supply chain disruption threats. Int. J. Logist. Manag. 2017, 28, 1368–1386. [Google Scholar] [CrossRef]
  27. John, A.; Yang, Z.; Riahi, R.; Wang, J. A risk assessment approach to improve the resilience of a seaport system using Bayesian networks. Ocean. Eng. 2016, 111, 136–147. [Google Scholar] [CrossRef] [Green Version]
  28. Ocampo, L.A.; Villegas, Z.V.A.; Carvajal, J.A.T.; Apas, C.A.A. Identifying significant drivers for sustainable practices in achieving sustainable food supply chain using modified fuzzy decision-making trial and evaluation laboratory approach. Int. J. Adv. Oper. Manag. 2018, 10, 51–89. [Google Scholar]
  29. Ahmad, M.; Tang, X.-W.; Qiu, J.-N.; Ahmad, F. Interpretive Structural Modeling and MICMAC Analysis for Identifying and Benchmarking Significant Factors of Seismic Soil Liquefaction. Appl. Sci. 2019, 9, 233. [Google Scholar] [CrossRef] [Green Version]
  30. Romano, A.L.; Ferreira, L.M.D.F.; Caeiro, S.S.F.S. Modelling Sustainability Risk in the Brazilian Cosmetics Industry. Sustainability 2021, 13, 13771. [Google Scholar] [CrossRef]
  31. Hassan, A.; Cui-Xia, L.; Ahmad, N.; Iqbal, M.; Hussain, K.; Ishtiaq, M.; Abrar, M. Safety Failure Factors Affecting Dairy Supply Chain: Insights from a Developing Economy. Sustainability 2021, 13, 9500. [Google Scholar] [CrossRef]
  32. Ullah, S.; Ahmad, N.; Khan, F.U.; Badulescu, A.; Badulescu, D. Mapping Interactions among Green Innovations Barriers in Manufacturing Industry Using Hybrid Methodology: Insights from a Developing Country. Int. J. Environ. Res. Public Health 2021, 18, 7885. [Google Scholar] [CrossRef]
  33. Sonar, H.; Khanzode, V.; Akarte, M. Investigating additive manufacturing implementation factors using integrated ISM-MICMAC approach. Rapid Prototyp. J. 2020, 26, 1837–1851. [Google Scholar] [CrossRef]
  34. Godet, M. Manuel de la Prospective Strategiques: Tome 2, l’art de la Method; Dunod: Paris, France, 2007. [Google Scholar]
Figure 1. Flowchart of the proposed approach.
Jmse 10 00217 g001
Figure 2. Reachability matrix (Direct Influence Matrix).
Jmse 10 00217 g002
Figure 3. The direct and indirect displacement map.
Jmse 10 00217 g003
Table 1. The list of risk variables identified in Sfax seaport.
CategoryNum.CodeRisk Variables
Internal organization1(CI1)Poor workplace design.
2(CI2)Lack of signage for the circulation of various flows (pedestrians, carts, materials, etc.).
3(CI3)Absence of plan, instruction, traffic display
4(CI4)Defective and uneven floor.
Chemical hazards5(C1)Improper handling of chemicals.
6(C2)Absence of a Safety Data Sheet (SDS) for the goods.
7(C3)Not wearing the EPI (gloves, mask, …) by the workers exposed to the risk
Failing objects8(Cho1)Instability and poor stowage of goods.
8(Cho2)Ignorance of good handling practices (slinging of the goods) during the operation of loading and unloading.
10(Cho3)Inadequate lifting accessories. (Chains, slings, ropes, shackles, hooks, lifting straps) and non-compliance with the regulatory aspects of Tunisian decree 62-129 (periodic inspection required).
Electrical hazards11(EL1)Lack of training for electricians.
12(EL2)Lack of work equipment and personal protective equipment (PPE).
13(EL3)Faulty electrical installation.
14(EL4)Neglect of regulatory aspects (periodic inspection).
Machine risks15(M1)Neglect of the regulatory aspects of handling equipment (periodic inspection).
16(M2)Lack of lighting (Visual management).
17(M3)Lack of supervision.
18(M4)Falling from heights (of drivers: forklift operators, crane operators, …), lack of instruction (climbing down ladder).
Fire, explosions and paric19(Inc1)Unsafe storage of goods (no-respect of thermal flows, domino rule, bow tie,...).
20(Inc2)Absence of a prevention system and a rescue organization (prevention certificate, first intervention team, emergency exit, assembly point, …).
21(Inc3)Neglect of the regulatory aspects (the requirements of the safety code and prevention of fire, explosion and panic risks).
Physical hazards22(Ph1)Poor layout of workstations.
23(Ph2)Lack of training
24(Ph3)Manual handling.
25(Ph4)Disregard for safety aspects (lack of procedures, instructions, supervision, roles and responsibilities, job description).
26(Ph5)Poor posture and physical condition.
Table 2. Numerical weights of the studied risk variables.
RankLabelDirect InfluenceLabelDirect DependencyLabelIndirect InfluenceLabelIndirect Dependency
1EL4553C1486EL4541Inc1484
2M3553Inc1486M3541C1477
3Ph2553Cho1471Ph2541Cho1467
4Ph4553M4442Ph4541M4436
5Ph1530M1435Ph1523M1433
6Inc3523CI1427Inc3518CI1429
7M1501Ph3427Inc1496Cho3426
8Inc1494Cho2420M1488Ph3424
9M2464Cho3420M2476Cho2419
10Cho2427Inc3420Cho2430Inc3416
11EL3412Ph4405EL2414Ph4401
12EL2398EL4383EL3413Ph5390
13Ph3383Ph5383Ph3395EL4380
14Cho3376Inc2376Cho3388Inc2375
15Inc2368CI2368Inc2368CI2374
16CI2331CI3368EL1337CI3374
17CI3317EL2368CI2319EL2373
18CI1302Ph1346CI3315Ph1351
19Cho1302Ph2346CI1306C2349
20EL1294C2339M4293Ph2344
21C1287M2324Ph5285M2318
22M4287C3317C1283M3318
23Ph5272M3317Cho1275C3317
24C2206CI4309C2219CI4311
25C3206EL3309C3205EL3303
26CI495EL1294CI476EL1297
Publisher’s Note: MDPI stays neutral with regard to jurisdictional claims in published maps and institutional affiliations.

