
Ship Production Planning Using Shipbuilding System Modeling and Discrete Time Process Simulation


Abstract
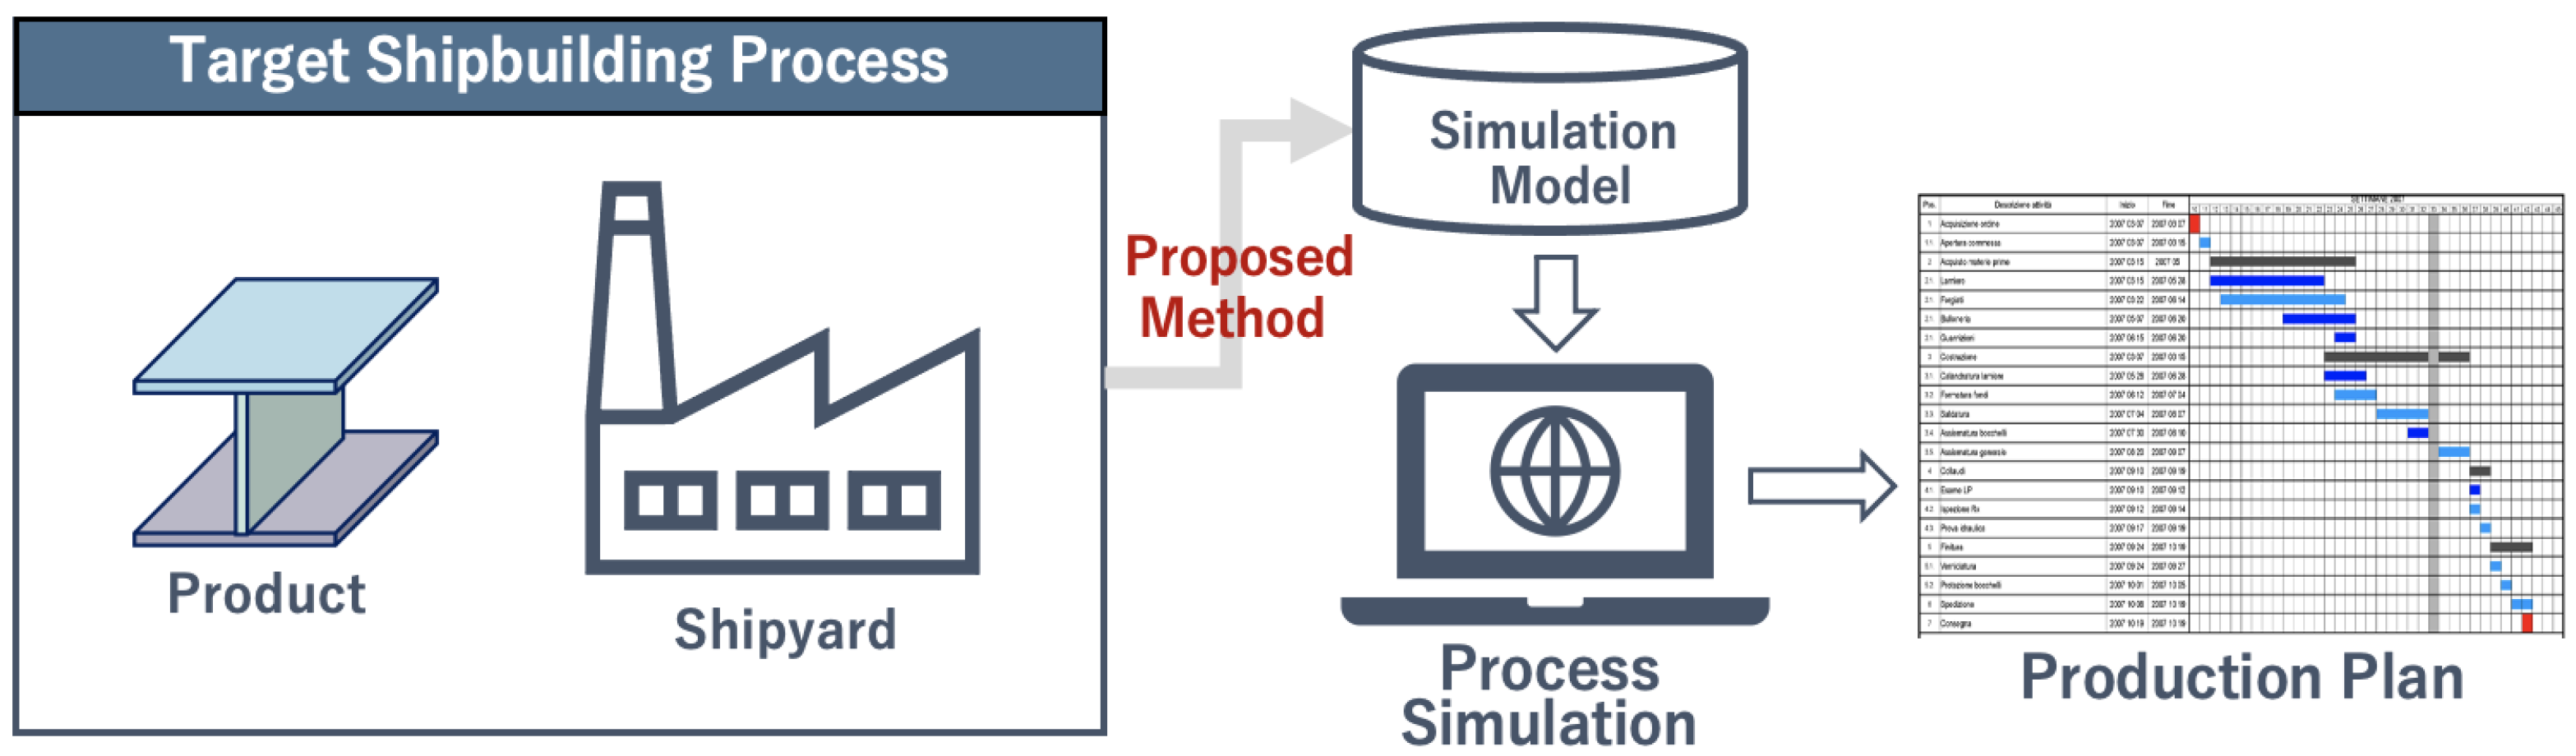
1. Introduction
2. Proposed Methods
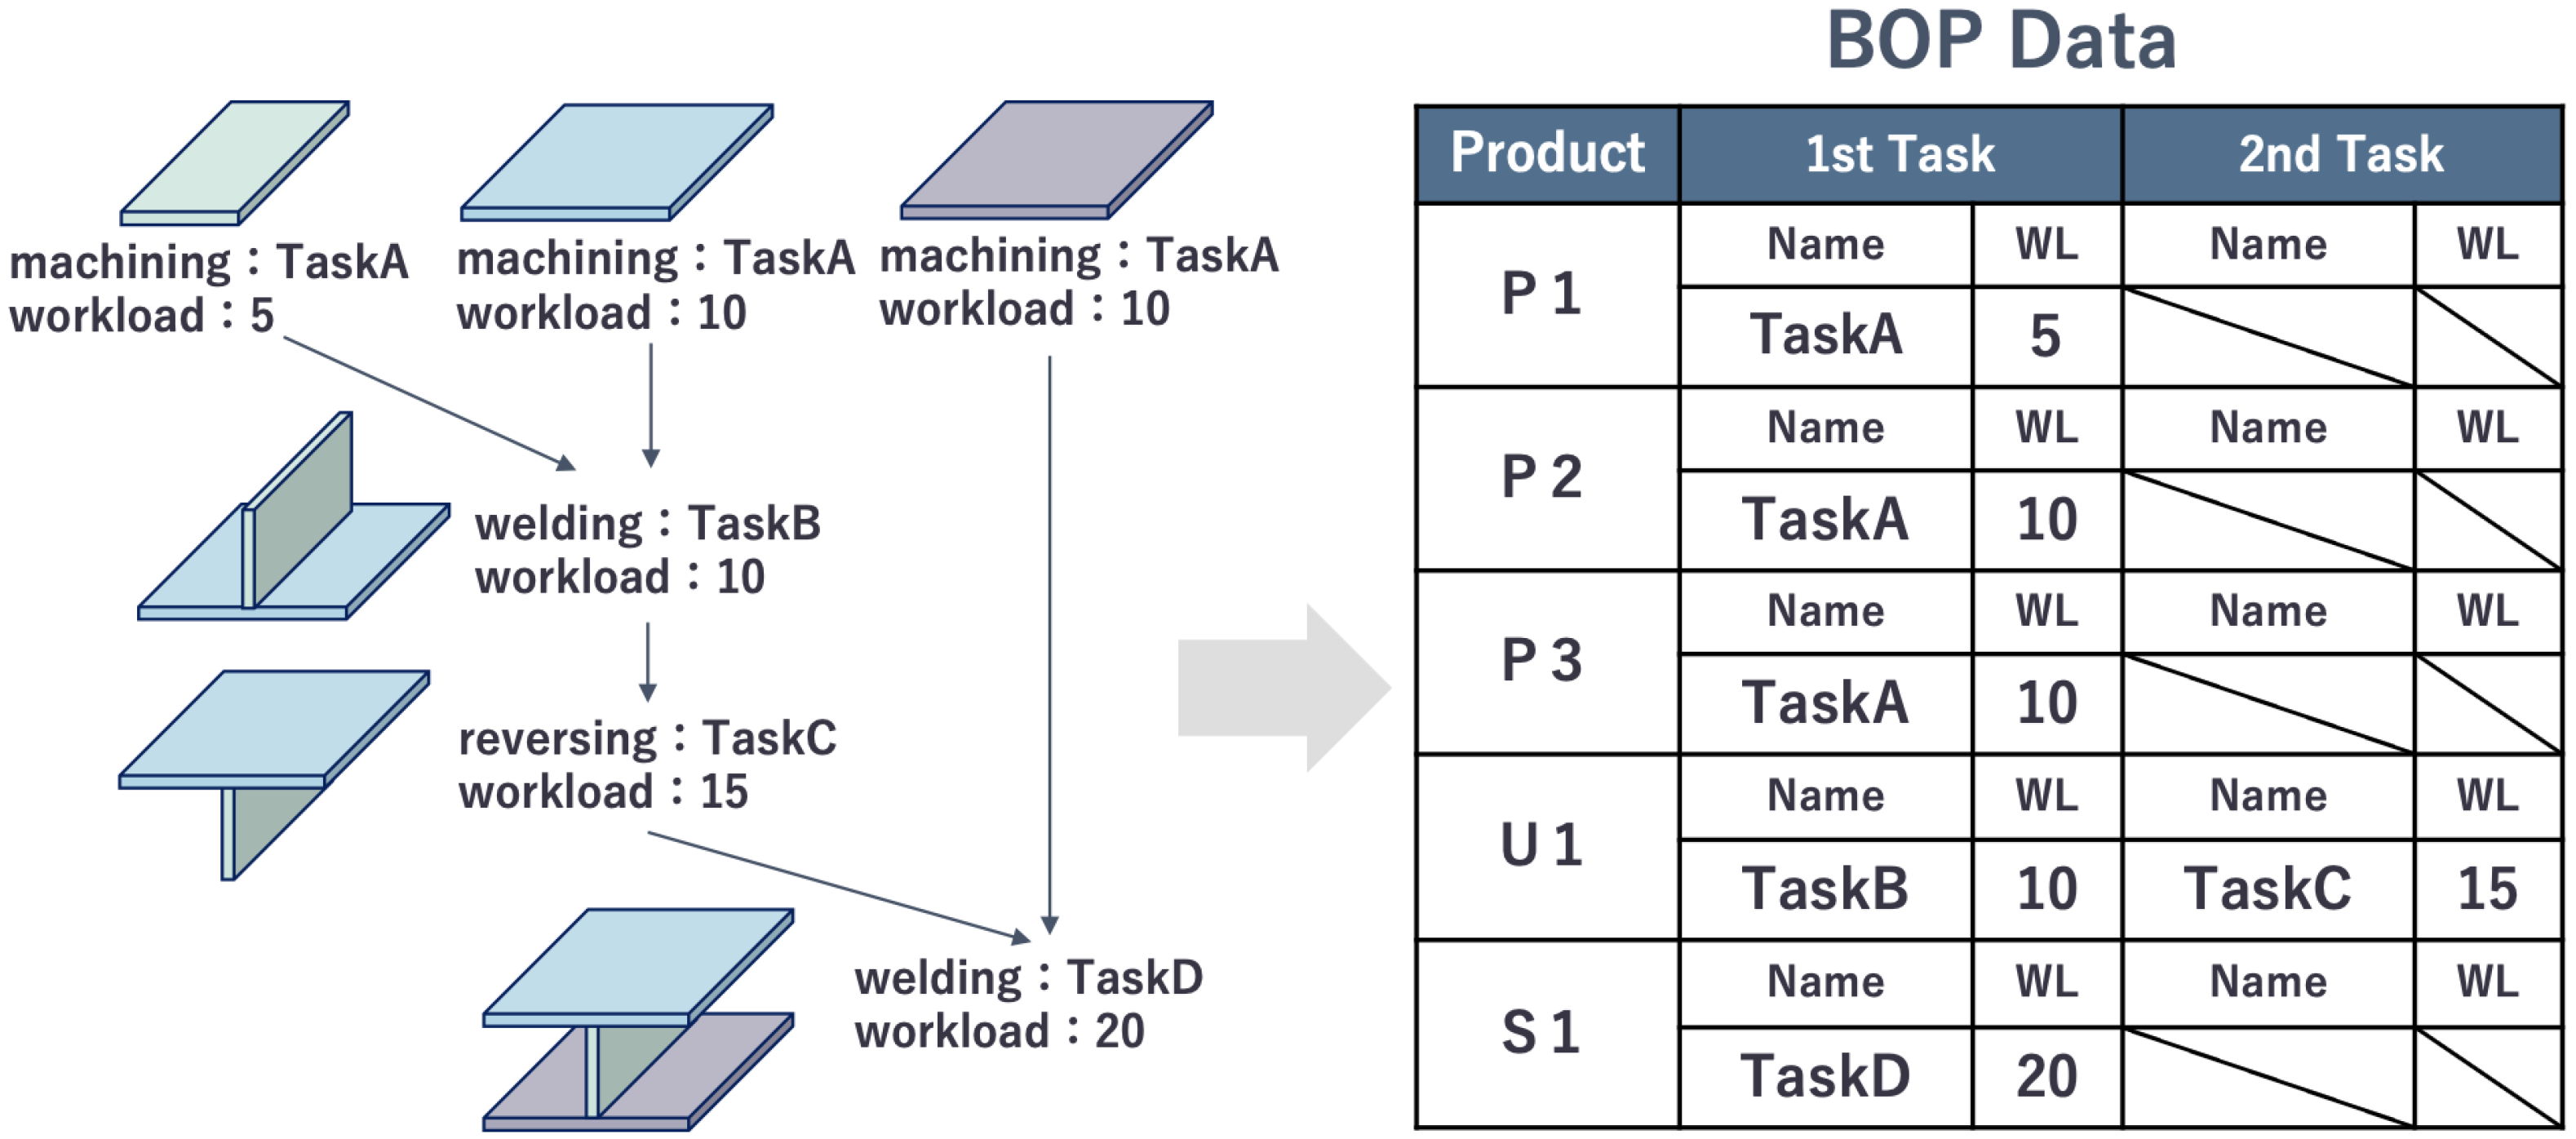
2.1. Required Data
- Structural characteristics in the assembly procedure;
- Facilities constraints;
- Control unit in manufacturing process.
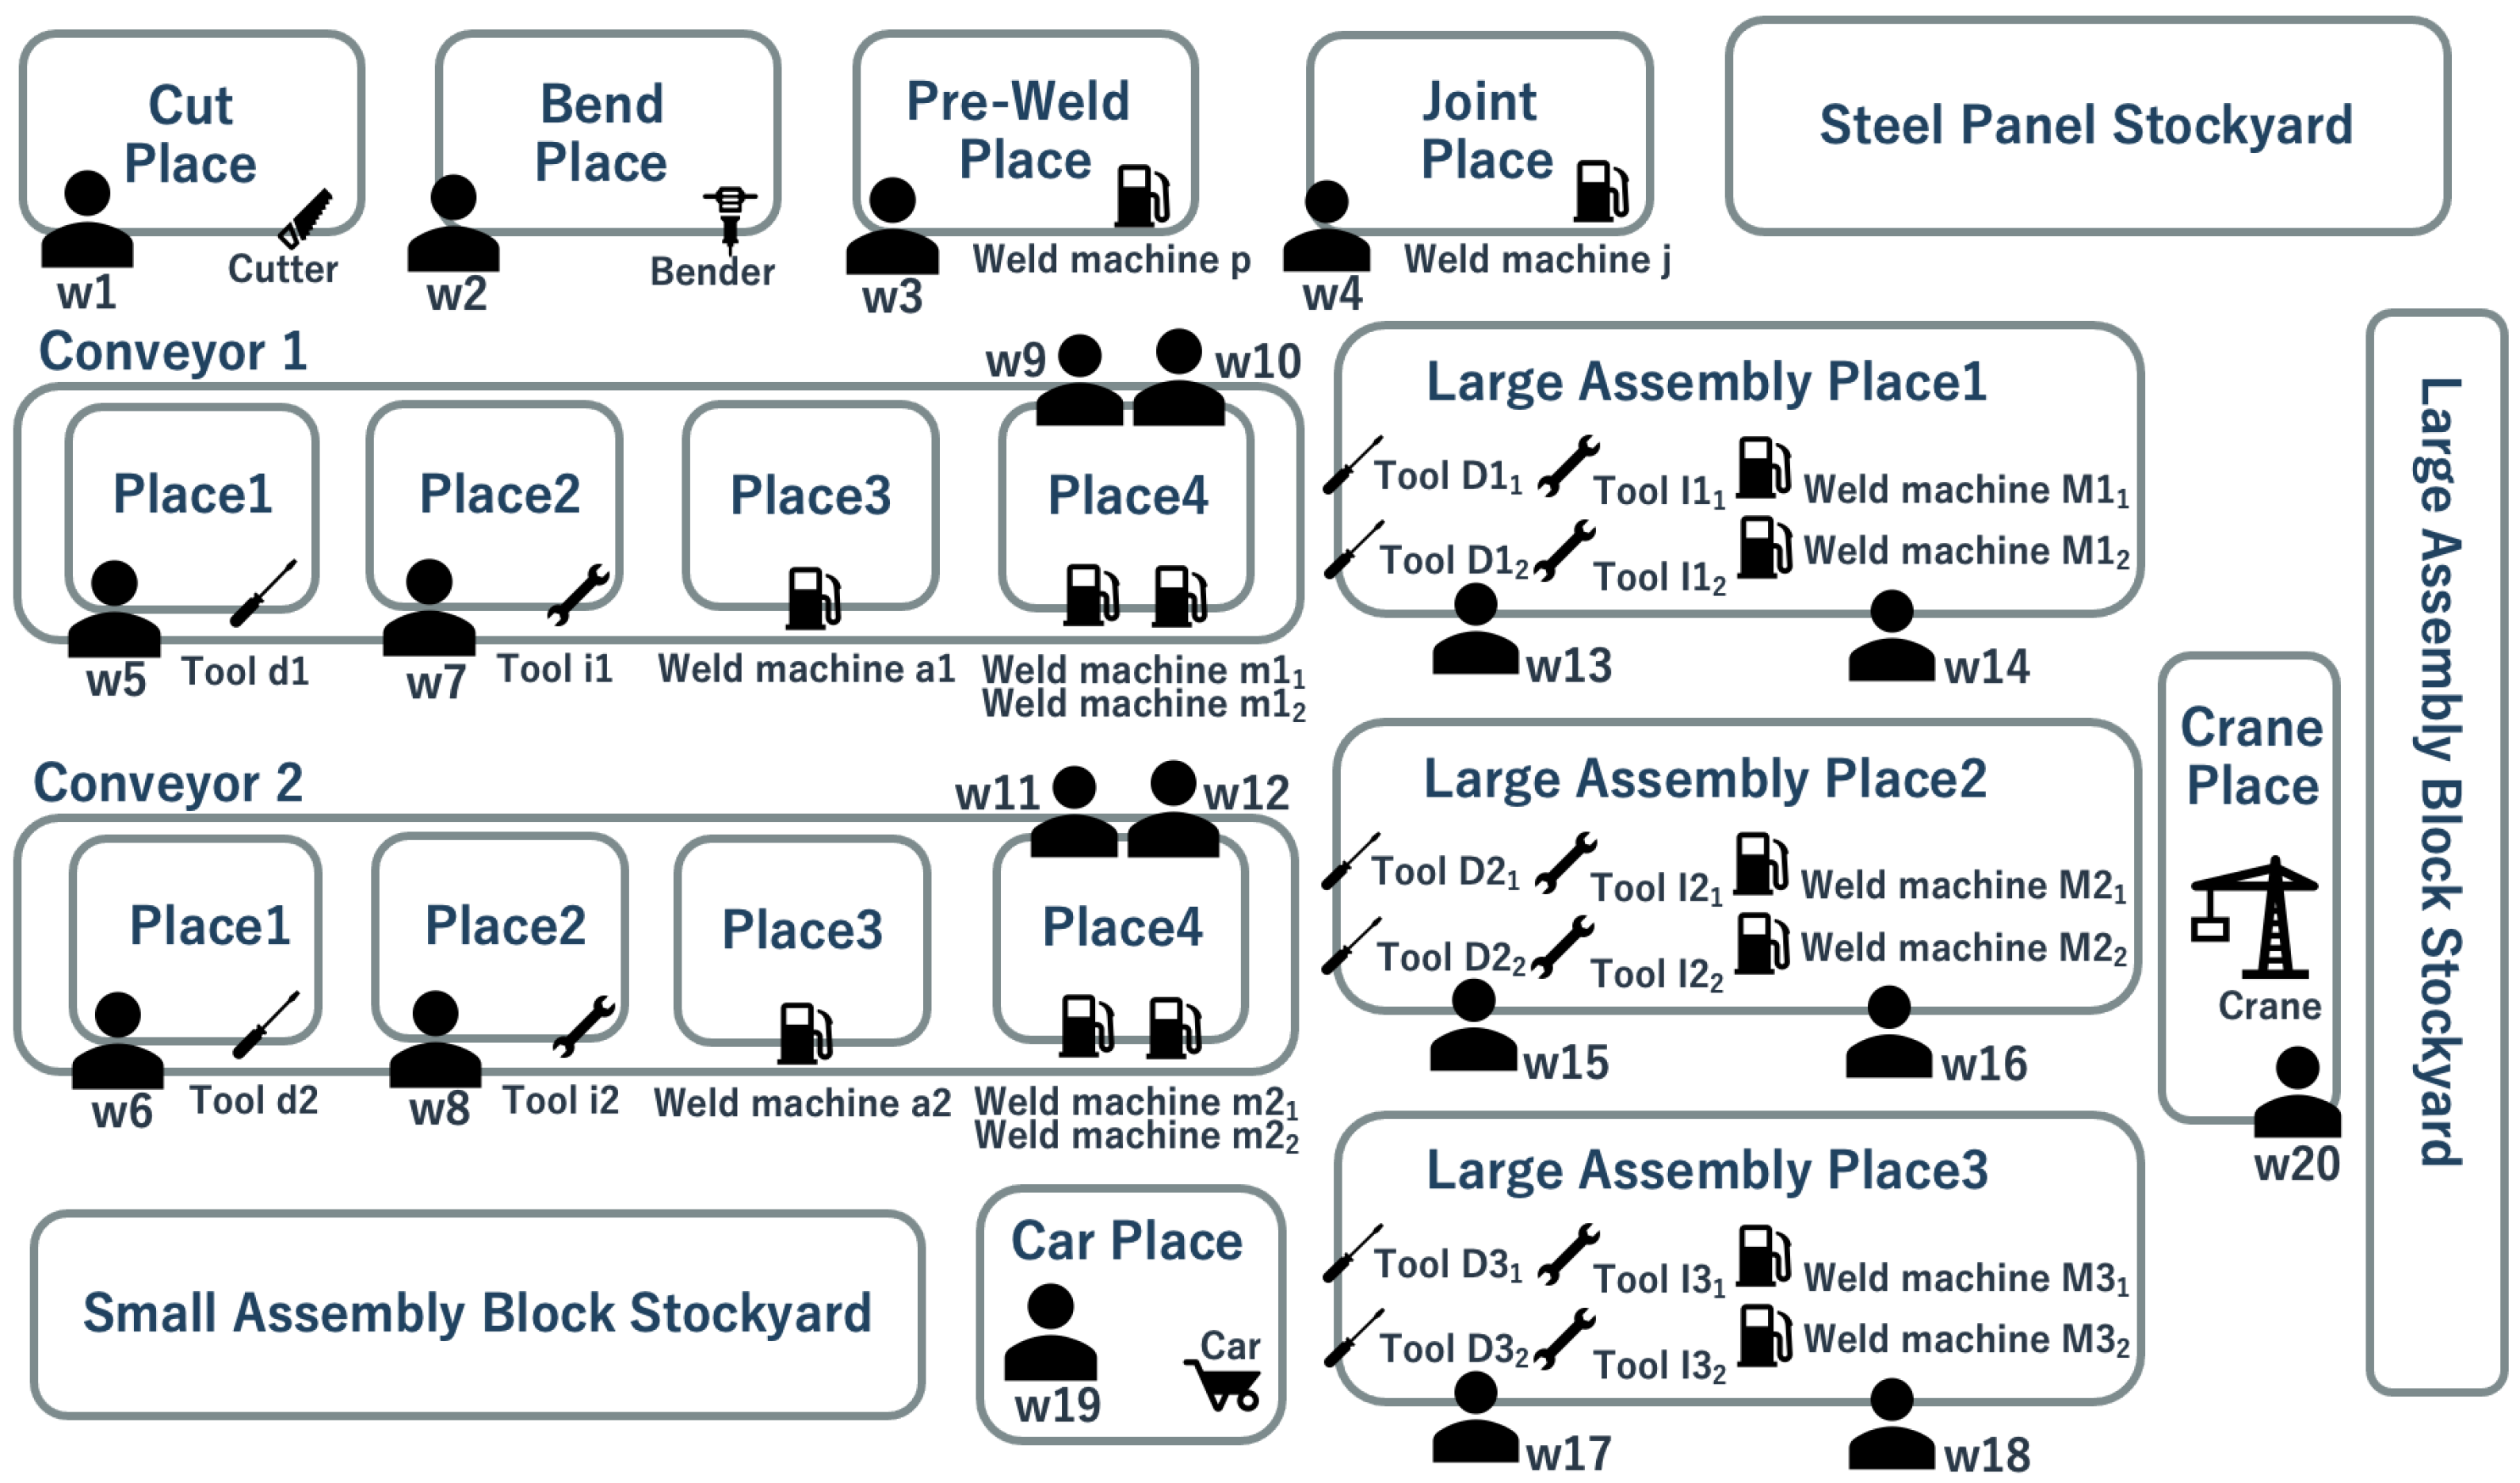
2.2. System Model for Simulation
2.3. Process Simulation
- Extract of tasks in READY or WORKING state;
- Place the products depending on the extracted tasks in the corresponding workplace;
- Extract available workers and facilities;
- Allocate workers and facilities based on task priority;
- Execute the task;
3. Case Study
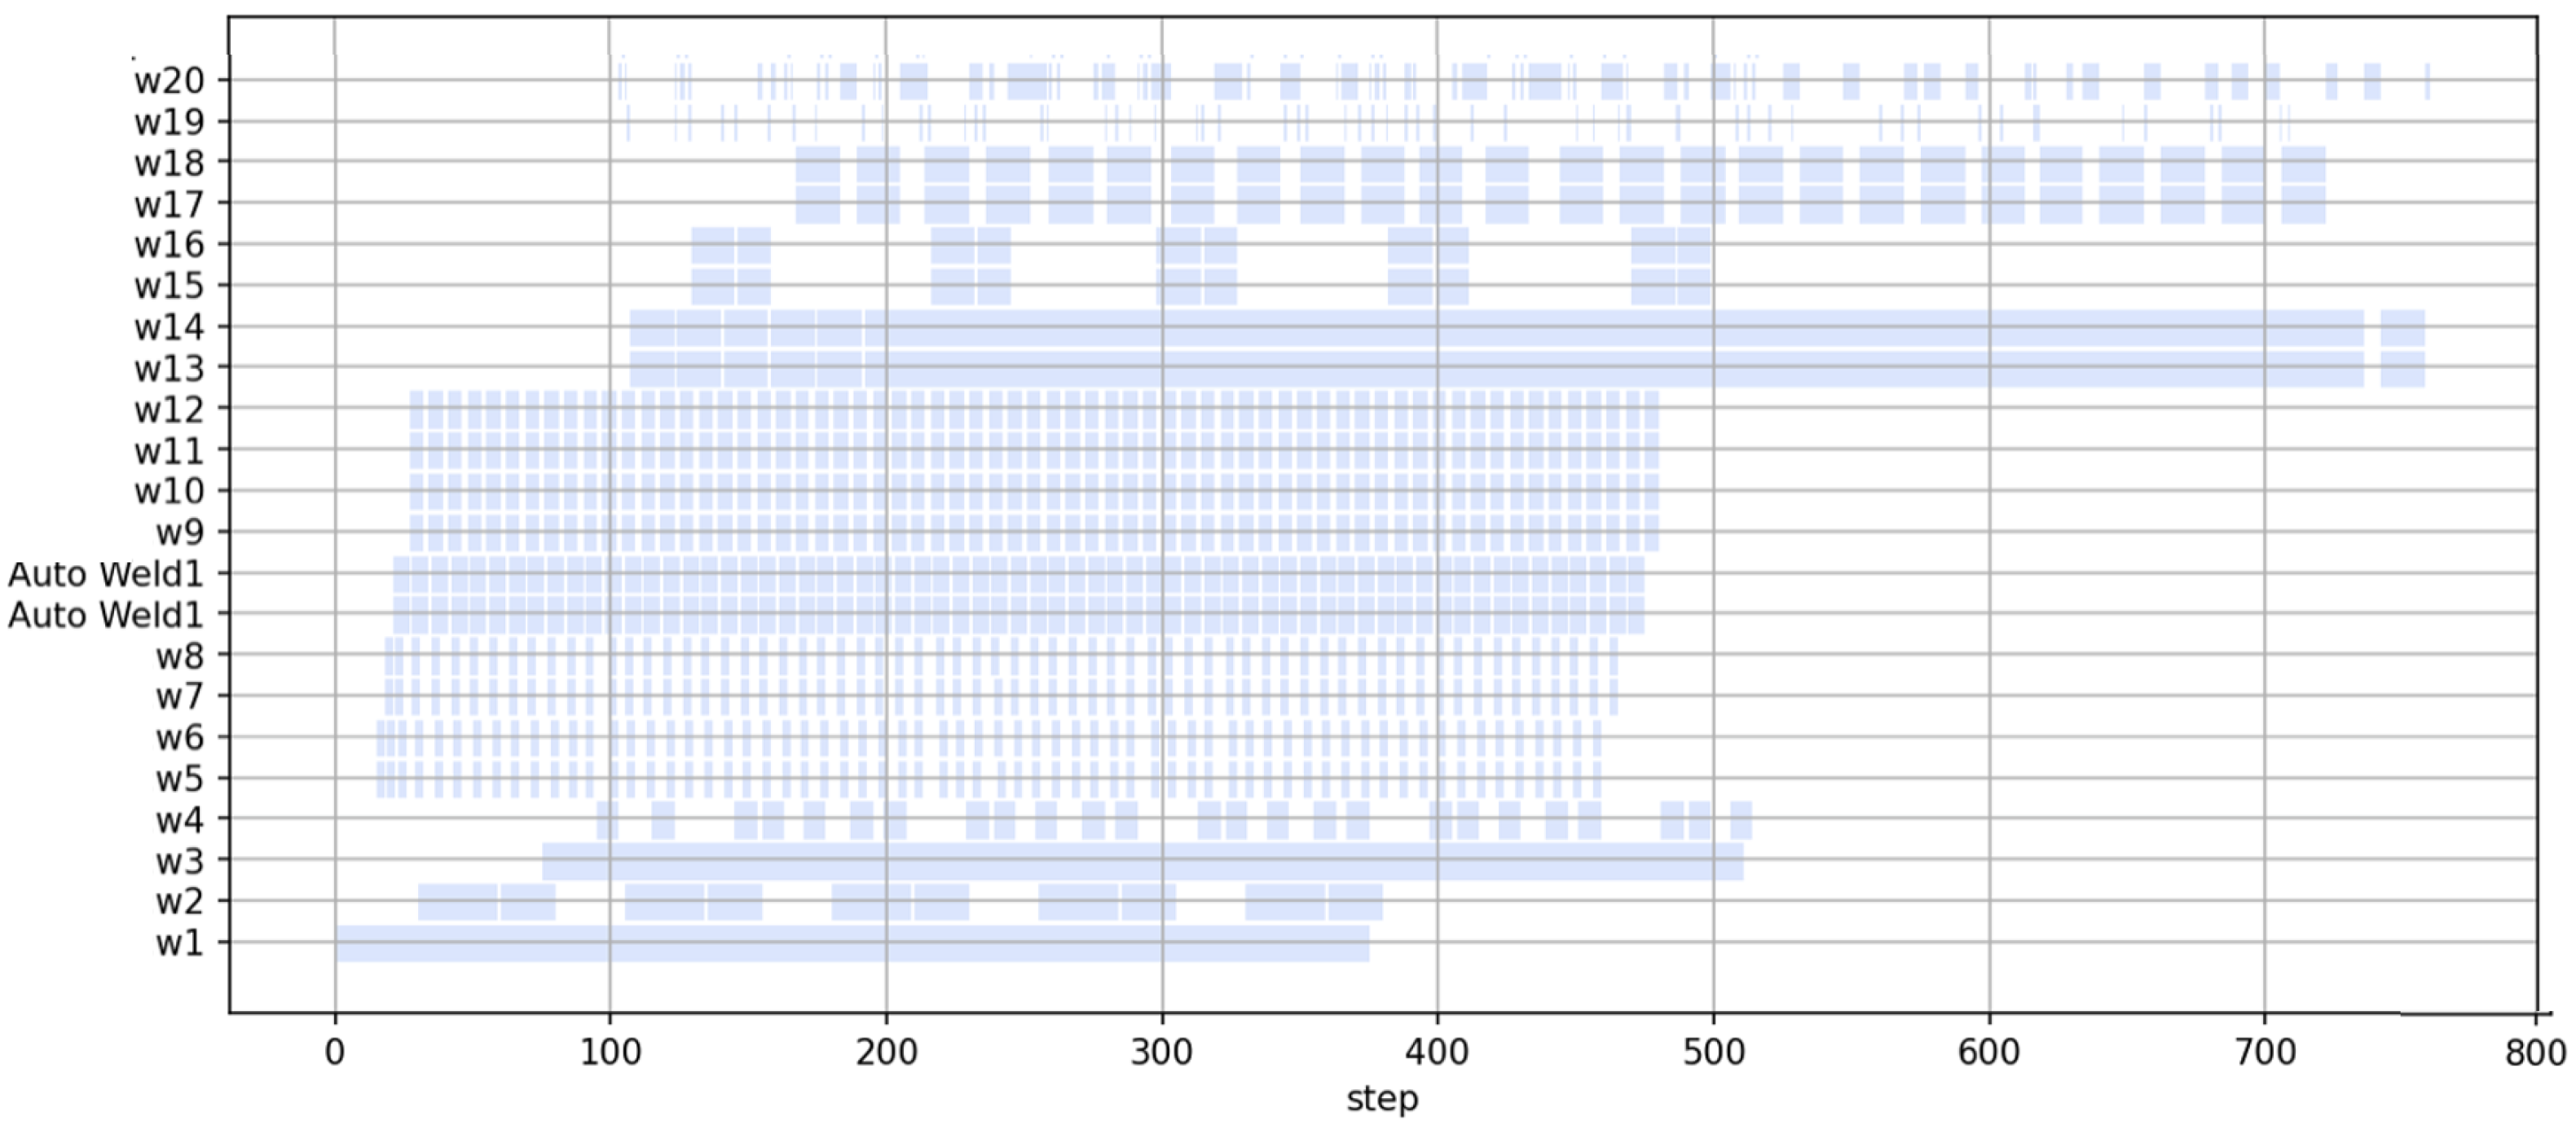
3.1. Simulation of One Block Production
3.2. Simulation of Five Blocks Production
- Evaluating bottlenecks of target shipyard;
- Reviewing the workers’ allocation plan.
3.2.1. Evaluating Bottlenecks of Target Shipyard
3.2.2. Reviewing the Workers’ Allocation Plan
4. Overall Discussion
- Based on the results of the bottleneck analysis, the production manager can identify which workplace’s delay will have the greatest impact on the plan, and notify field workers of bottleneck workplace before starting work to prevent delays in planning and ensure appropriate management;
- By modifying the task qualification of workers, it is possible to create a multiple assignment patterns. Production managers can create optimal assignment plans by trying these patterns and quantitatively evaluating the differences.
5. Conclusions
- The proposed method can be used to create a realistic production plan by system modeling various information of the target shipyard;
- By utilizing created model and process simulation, we can evaluate the bottleneck of the target shipyard and the re-allocation plan for workers quantitatively.
Author Contributions
Funding
Institutional Review Board Statement
Informed Consent Statement
Data Availability Statement
Conflicts of Interest
References
- Molina, A.; Ponce, P.; Miranda, J.; Cortés, D. Enabling Systems for Intelligent Manufacturing in Industry 4.0, 1st ed.; Springer: Berlin/Heidelberg, Germany, 2021; p. 277. [Google Scholar]
- Kjersem, K.; Halse, L.L.; Kiekebos, P.; Emblemsvåg, J. Implementing Lean in Engineer-to-Order Industry: A Case Study. Conf. Pap. Int. Conf. Adv. Prod. Manag. Syst. 2015, 460, 248–255. [Google Scholar]
- Ding, J.; Ni, C. Gird Based Line Segment Detector and Application: Vision System for Autonomous Ship Small Assembly Line. J. Mar. Sci. Eng. 2021, 9, 1313. [Google Scholar] [CrossRef]
- Wu, Q.; Mao, Y.; Chen, J.; Wang, C. Application Research of Digital Twin-Driven Ship Intelligent Manufacturing System: Pipe Machining Production Line. J. Mar. Sci. Eng. 2021, 9, 3. [Google Scholar] [CrossRef]
- Rouco-Couzo, M.; Crespo-Pereira, D.; Garcia-del-Valle, A.; Cebral-Fernandez, M.; Rios-Prado, R. Discrete event simulation to improve cutting-welding workshop in a shipyard. Proc. Eur. Model. Simul. Symp. 2016, 25, 191–196. [Google Scholar]
- Hadjina, M.; Fafandjel, N.; Matulja, T. Shipbuilding production process design methodology using computer simulation. Brodogr. Shipbilding 2015, 66, 77–91. [Google Scholar]
- Lee, Y.G.; Ju, S.; Woo, J.H. Simulation-based planning system for shipbuilding. Int. J. Comput. Integr. Manuf. 2020, 33, 626–641. [Google Scholar] [CrossRef]
- Woo, J.H.; Lee, K.; Jung, H.; Kwon, Y.; Shin, J.G. Method for integrated logistics planning in shipbuilding. J. Soc. Nav. Archit. Korea 2005, 42, 165–174. [Google Scholar]
- Kun, L.D.; Gye, S.J.; Youngmin, K.; Jeong, Y.K. Simulation-Based Work Plan Verification in Shipyards. J. Ship Prod. Des. 2014, 30, 49–57. [Google Scholar]
- Hun, W.J.; Joo, S.Y.; Woo, K.Y.; Shin, J.G. Development of the Decision-Making System for the Ship Block Logistics Based on the Simulation. J. Ship Prod. Des. 2010, 26, 290–300. [Google Scholar]
- Jeong, Y.K.; Woo, J.H.; Oh, D.K.; Shin, J.G. A shipyard simulation system using the process-centric simulation modeling methodology: Case study of the simulation model for the shipyard master plan validation. Korean J. Comput. Des. Eng. 2016, 21, 204–214. [Google Scholar] [CrossRef]
- Nam, S.; Shen, H.; Ryu, C.; Shin, J.G. SCP-Matrix based shipyard APS design: Application to long-term production plan. Int. J. Nav. Archit. Ocean. Eng. 2018, 10, 741–761. [Google Scholar] [CrossRef]
- Hellgren, S.; Maria, H.; Orisis, A.; Kujala, P. Modelling of a Cruise Shipbuilding Process for Analyzing the Effect of Organization on Production Efficiency. J. Ship Prod. Des. 2017, 33, 101–121. [Google Scholar] [CrossRef]
- Sender, J.; Klink, S.; Flügge, W. A framework of plant simulation for a construction of a digital shipyard. In Proceedings of the 13th CIRP Conference on Intelligent Computation in Manufacturing Engineering, Gulf of Naples, Italy, 17–19 July 2019; Volume 88, pp. 122–126. [Google Scholar]
- Wang, C.; Wang, K.; Tao, J.; Zhou, Y. Research on Real-Time Optimal Path Planning Model and Algorithm for Ship Block Transportation in Shipyard. J. Mar. Sci. Eng. 2020, 8, 991. [Google Scholar] [CrossRef]
- Park, J.G.; Kim, H.J.; Woo, J.H. Development of Entering Order and Work-Volume Assignment Algorithms for the Management of Piping Components in Offshore Structure Construction. J. Mar. Sci. Eng. 2020, 8, 894. [Google Scholar] [CrossRef]
- Aoyama, K.; Nomoto, T.; Watanabe, K. Development of Shipyard Simulation System based on Petri Net. J. Soc. Nav. Archit. Jpn. 1997, 182, 795–807. [Google Scholar] [CrossRef]
- Takechi, S.; Aoyama, K.; Kobayashi, M.; Makihara, K. Development of Shipyard Simulation System based on Petri Nets, 3rd Report: Factory Simulator introduced the concept of the Job-Shop Floor. J. Soc. Nav. Archit. Jpn. 2001, 190, 449–458. [Google Scholar] [CrossRef]
- Mitsuyuki, T.; Hiekata, K. Study on Installation of Production Facilities Using Shipbuilding Process Simulation. J. Soc. Nav. Archit. Jpn. 2016, 24, 291–298. [Google Scholar]
- Steinhauer, D.; Sikorra, J.N.; Haux, M.A.; Friedewald, A.; Lödding, H. A framework of plant simulation for a construction of a digital shipyard. J. Soc. Nav. Archit. Korea 2005, 42, 165–174. [Google Scholar]
- Choi, W.-S.; Kim, D.-H.; Nam, J.-H.; Kim, M.-J.; Son, Y.-B. Estimating Production Metric for Ship Assembly Based on Geometric and Production Information of Ship Block Model. J. Mar. Sci. Eng. 2021, 9, 39. [Google Scholar] [CrossRef]
- Yao, S.; Sun, H.; Shen, P.; Lian, C. Research on bom mapping transformation for ship construction process. Manag. Sci. Eng. Can. Res. Dev. Cent. Sci. Cult. 2009, 3, 54–68. [Google Scholar]
- Boton, C.; Rivest, L.; Forgues, D.; Julie, R.J. Comparison of shipbuilding and construction industries from the product structure standpoint. Int. J. Prod. Lifecycle Manag. 2018, 11, 191–220. [Google Scholar] [CrossRef]
- Amemiya, T. Process Planning System for CIM in Shipbuilding. J. Soc. Nav. Archit. Jpn. 1990, 1990, 629–638. [Google Scholar] [CrossRef]
- Roh, M.-I.; Lee, K.-Y. Generation of production material information for a building block and simulation of block erection for process planning and scheduling in shipbuilding. Int. J. Prod. Res. 2007, 45, 4653–4683. [Google Scholar] [CrossRef]
- Sasaki, Y.; Sonda, M.; Ito, K. Development of computer aided process planning system based on knowledge base. Soc. Nav. Archit. Jpn. 2002, 868, 309–315. [Google Scholar]
- Takezawa, M.; Taniguchi, T.; Matsuo, K.; Hirakata, M. Fundamental Study on Highly Precise Production Simulation for Shipbuilding. Conf. Proc. Jpn. Soc. Nav. Archit. Ocean. Eng. 2020, 31, 177–183. [Google Scholar]
- Shimokawa, T. Graph Theory. Jpn. J. Neuropsychol. 2018, 3, 34, 200–208. [Google Scholar]
- Robin, J. Wilson Introduction to Graph Theory, 5th ed.; Pearson: London, UK, 2010. [Google Scholar]
- Mitsuyuki, T.; Hiekata, K.; Yamato, H. Design of production strategy considering the cutting peak demand of electricity in the shipbuilding industry. J. Mar. Sci. Technol. 2014, 19, 425–437. [Google Scholar] [CrossRef]
- pDESy. Available online: https://github.com/pDESy/pDESy (accessed on 31 December 2021).
- Van Rossum, G.; Drake, F.L. Python 3 Reference Manual; CreateSpace: Scotts Valley, CA, USA, 2009. [Google Scholar]
- Muto, M.; Miyata, T. Three dimensional block method in ship’s hull construction program. Conf. Proc. Jpn. Soc. Nav. Archit. Ocean. Eng. 1964, 169–183. [Google Scholar] [CrossRef]
- Nomoto, T.; Aoyama, K. Computer Aided Information Acquisition System of Design and Manufacturing in Shipbuilding. J. Soc. Nav. Archit. Jpn. 1989, 166, 425–433. [Google Scholar] [CrossRef][Green Version]


| Cut Material | Bending Part | Single Plate | Steel Panel | |||||
|---|---|---|---|---|---|---|---|---|
| Name | Workload | Name | Workload | Name | Workload | Name | Workload | |
| 1st Task | Cut | 15 | Bend | 2 | Pre-Weld | 3 | Joint | 3 |
| 2nd Task | Crane Transport | 1 | ||||||
| 3rd Task | Panel Stock | 0 | ||||||
| 4th Task | ||||||||
| 5th Task | ||||||||
| 6th Task | ||||||||
| Small Assembly Block | Intermediate Product | Large Assembly Block | ||||||
| Name | Workload | Name | Workload | Name | Workload | |||
| 1st Task | Small Distribute | 3 | Car Transport | 1 | Car Transport | 1 | ||
| 2nd Task | Small Install | 3 | Large Distribute | 8 | Large Distribute | 8 | ||
| 3rd Task | Small Auto Weld | 6 | Large Install | 8 | Large Install | 8 | ||
| 4th Task | Small Manual Weld | 10 | Large Weld | 15 | Large Weld | 15 | ||
| 5th Task | Small Stock | 0 | (Transverse) | 5 | Crane Transport | 1 | ||
| 6th Task | Large Stock | 0 | ||||||
| Workplace | Facility | Target Task |
|---|---|---|
| Cut place | Cutter | Cut |
| Bend place | Bender | Bend |
| Pre-weld place | Weld machine p | Pre-weld |
| Joint place | Weld machine j | Joint |
| Steel Panel Stockyard | - | Panel Stock |
| Conveyor1 place1 | Tool d1 | Small Distribute |
| Conveyor1 place2 | Tool i1 | Small Install |
| Conveyor1 place3 | Weld machine a1 | Small Auto Weld |
| Conveyor1 place4 | Weld machine m | Small Manual Weld |
| Weld machine m | ||
| Conveyor2 place1 | Tool d2 | Small Distribute |
| Conveyor2 place2 | Tool i2 | Small Install |
| Conveyor2 place3 | Weld machine a2 | Small Auto Weld |
| Conveyor2 place4 | Weld machine m | Small Manual Weld |
| Weld machine m | ||
| Small Assembly Block Stockyard | - | Small Stock |
| Large Assembly place1 | Tool D | Large Distribute |
| Tool D | ||
| Tool I | Large Install | |
| Tool I | ||
| Weld machine L | Large Weld | |
| Tool machine L | ||
| Large Assembly place2 | Tool D | Large Distribute |
| Tool D | ||
| Tool I | Large Install | |
| Tool I | ||
| Weld machine L | Large Weld | |
| Tool machine L | ||
| Large Assembly place3 | Tool D | Large Distribute |
| Tool D | ||
| Tool I | Large Install | |
| Tool I | ||
| Weld machine L | Large Weld | |
| Tool machine L | ||
| Large Assembly Block Stockyard | - | Large Stock |
| Car place | car | Car Transport |
| Crane place | crane | Crane Transport Transverse |
| Worker | Target Task | Available Facility |
|---|---|---|
| w1 | Cut | Cutter |
| w2 | Bend | Bender |
| w3 | Pre-weld | Weld machine p |
| w4 | Joint | Weld machine j |
| w5 | Small Distribute | Tool d1 |
| w6 | Small Distribute | Tool d2 |
| w7 | Small Install | Tool i1 |
| w8 | Small Install | Tool i2 |
| w9 | Small Manual Weld | Weld machine m, Weld machine m |
| w10 | Small Manual Weld | Weld machine m, Weld machine m |
| w11 | Small Manual Weld | Weld machine m, Weld machine m |
| w12 | Small Manual Weld | Weld machine m, Weld machine m |
| w13 | Large Distribute | Tool D, Tool D |
| Large Install | Tool I, Tool I | |
| Large Weld | Weld machine L, Weld machine L | |
| w14 | Large Distribute | Tool D, Tool D |
| Large Install | Tool I, Tool I | |
| Large Weld | Weld machine L, Weld machine L | |
| w15 | Large Distribute | Tool D, Tool D |
| Large Install | Tool I, Tool I | |
| Large Weld | Weld machine L, Weld machine L | |
| w16 | Large Distribute | Tool D, Tool D |
| Large Install | Tool I, Tool I | |
| Large Weld | Weld machine L, Weld machine L | |
| w17 | Large Distribute | Tool D, Tool D |
| Large Install | Tool I, Tool I | |
| Large Weld | Weld machine L, Weld machine L | |
| w18 | Large Distribute | Tool D, Tool D |
| Large Install | Tool I, Tool I | |
| Large Weld | Weld machine L, Weld machine L | |
| w19 | Car Transport | Car |
| w20 | Crane Transport Transverse | Crane |
| Case | Project Lead Time | Small Block Stock Time | Steel Panel Stock Time | Conveyor Waiting Time |
|---|---|---|---|---|
| Original Plan | 761 | 146 | 646 | 717 |
| BS Cut Place | 819 | 187 | 721 | 717 |
| BS Bend Place | 761 | 147 | 646 | 717 |
| BS Pre-Weld Place | 868 | 146 | 220 | 717 |
| BS Joint Place | 766 | 146 | 634 | 717 |
| BS Conveyor1 Place1 | 761 | 146 | 646 | 513 |
| BS Conveyor1 Place2 | 761 | 146 | 646 | 441 |
| BS Conveyor1 Place3 | 768 | 113 | 680 | 982 |
| BS Large Assembly Place1 (Distribute) | 880 | 146 | 688 | 717 |
| BS Large Assembly Place1 (Install) | 880 | 146 | 688 | 717 |
| BS Large Assembly Place1 (Weld) | 920 | 146 | 710 | 717 |
| BS Large Assembly Place2 (Distribute) | 761 | 146 | 656 | 717 |
| BS Large Assembly Place2 (Install) | 761 | 146 | 656 | 717 |
| BS Large Assembly Place2 (Weld) | 761 | 146 | 646 | 717 |
| BS Large Assembly Place3 (Distribute) | 797 | 146 | 712 | 717 |
| BS Large Assembly Place3 (Install) | 797 | 146 | 712 | 717 |
| BS Large Assembly Place3 (Weld) | 823 | 146 | 729 | 717 |
| BS Car Place | 769 | 146 | 676 | 717 |
| BS Crane Place | 836 | 146 | 749 | 717 |
| Project Lead Time | Small Block Stock Time | Steel Panel Stock Time | Conveyor Waiting Time | |
|---|---|---|---|---|
| Original Plan | 761 | 146 | 646 | 717 |
| Re-allocation Plan | 767 | 146 | 663 | 717 |
Publisher’s Note: MDPI stays neutral with regard to jurisdictional claims in published maps and institutional affiliations. |
© 2022 by the authors. Licensee MDPI, Basel, Switzerland. This article is an open access article distributed under the terms and conditions of the Creative Commons Attribution (CC BY) license (https://creativecommons.org/licenses/by/4.0/).
Share and Cite
Okubo, Y.; Mitsuyuki, T. Ship Production Planning Using Shipbuilding System Modeling and Discrete Time Process Simulation. J. Mar. Sci. Eng. 2022, 10, 176. https://doi.org/10.3390/jmse10020176
Okubo Y, Mitsuyuki T. Ship Production Planning Using Shipbuilding System Modeling and Discrete Time Process Simulation. Journal of Marine Science and Engineering. 2022; 10(2):176. https://doi.org/10.3390/jmse10020176
Chicago/Turabian StyleOkubo, Yui, and Taiga Mitsuyuki. 2022. "Ship Production Planning Using Shipbuilding System Modeling and Discrete Time Process Simulation" Journal of Marine Science and Engineering 10, no. 2: 176. https://doi.org/10.3390/jmse10020176
APA StyleOkubo, Y., & Mitsuyuki, T. (2022). Ship Production Planning Using Shipbuilding System Modeling and Discrete Time Process Simulation. Journal of Marine Science and Engineering, 10(2), 176. https://doi.org/10.3390/jmse10020176