1. Introduction
Coastal areas are inherently dynamic, driven by meteorological, oceanographic, geological, and anthropogenic factors [
1]. Sandy beaches occupy more than one-third of the world’s coastline, with one-quarter under erosion [
2], and this trend may be aggravated due to climate change effects, namely, sea level rise [
3,
4,
5] and changes in frequency and duration of storminess [
6,
7]. Historical and ongoing development of the coastal area has induced coastal squeeze, leading to the loss of scenic values, recreational beach areas and habitats, and increasing hazards to people, built environments, and infrastructures, especially in densely populated and developed coastlines [
8]. Management of these areas is particularly challenging, and can only be adequately addressed if grounded upon comprehensive knowledge of coastal changes and driving processes based on the existence of coastal monitoring data.
Beach nourishment (also referred to as sand replenishment or beach fill) comprises the addition of good quality sand to increase the width or volume of a specific beach or coastal stretch [
9]. It is a coastal management technique used in risk reduction and adaptation to climate change worldwide [
10]. Beach nourishment has been undertaken in emergency contexts, as a local and short-term remedy solution (e.g., in the aftermath of storm-induced erosion [
11]) and as a regional and long-term management strategy to counteract erosive trends and reduce coastal vulnerability [
10,
11,
12,
13,
14].
The nourishment type depends, among other factors, on coastal management objectives and on sand availability. Sediment is either placed above mean sea level (over the beach berm or foredune), or in the inner (upper) shoreface. While the former is typically called beach nourishment, the latter is often designated as shoreface nourishment. Borrow sediments are typically obtained from maintenance dredging of inlets or navigation channels associated with nearby harbours/fishing ports/recreational marinas. In addition, the outer (lower) shoreface may also provide excellent borrow areas [
14,
15,
16,
17,
18].
In mainland Portugal, beach nourishment started in 1950, with up to 170 interventions concluded until 2020 (data updated from [
14]). Altogether, they comprised placement of approximately 42 M m
3, over the inner shoreface (thus landward of the depth of closure—DoC) and over the beach/berm and foredune. Only 8% of these interventions may be considered of high magnitude (i.e., volume > 1 × 10
6 m
3 [
14]). To date, nourishments carried out have essentially resorted to sediment dredged from inlets and channels associated with port activities (commercial/fishing/recreation) (about 90% of all operations and of total volume involved). Dredged material was used to minimize erosion caused by port infrastructures, such as sand starvation downdrift of jetties, and enhanced accumulation updrift of jetties and in inlets and channels.
Extensive monitoring of sand redistribution following beach nourishments is crucial to assess project performance and impacts, in addition to improving understanding of the associated coastal dynamics [
10,
13]. In opposition to subaerial beach nourishment, behaviour of shoreface nourishment is still not well-understood [
13]. This contrasts with the increasing importance of the latter worldwide, mostly due to its cost-effectiveness [
13]. For example, 43% of nourishment operations carried out in mainland Portugal were of the shoreface type, and comprised 50% of the total placement volume [
14].
So far, most data associated with shoreface nourishments have been acquired in a limited suite of environmental settings (e.g., The Netherlands [
10,
12,
13] and USA [
19]) with poor representation of high-energy wave dominated coasts, where tides and storm surge are secondary drivers.
The objective of this work is to provide new insights on the morphological evolution, behaviour, and efficiency of a high-magnitude volume shoreface nourishment, undertaken in a high-energy wave-dominated coast, downdrift of a stabilized tidal inlet (Aveiro, Portugal).
The study relies upon high resolution monitoring following the largest shoreface nourishment undertaken in Portugal, encompassing the downdrift domain potentially affected by short-term sediment redistribution. This work extends and complements previous study on the same field area [
20], but it differs by introducing a sediment budget approach that allowed the understanding of post-nourishment sediment dispersion. In addition, we investigate the time scale required for the beach to acquire a condition of equilibrium replicating the equilibrium beach profile of Bruun’s, following the imposition of a significant sand volume.
3. Methods
3.1. Shoreface Nourishment
Shoreface nourishment intervention comprised the dumping of ≈ 2.375 M m
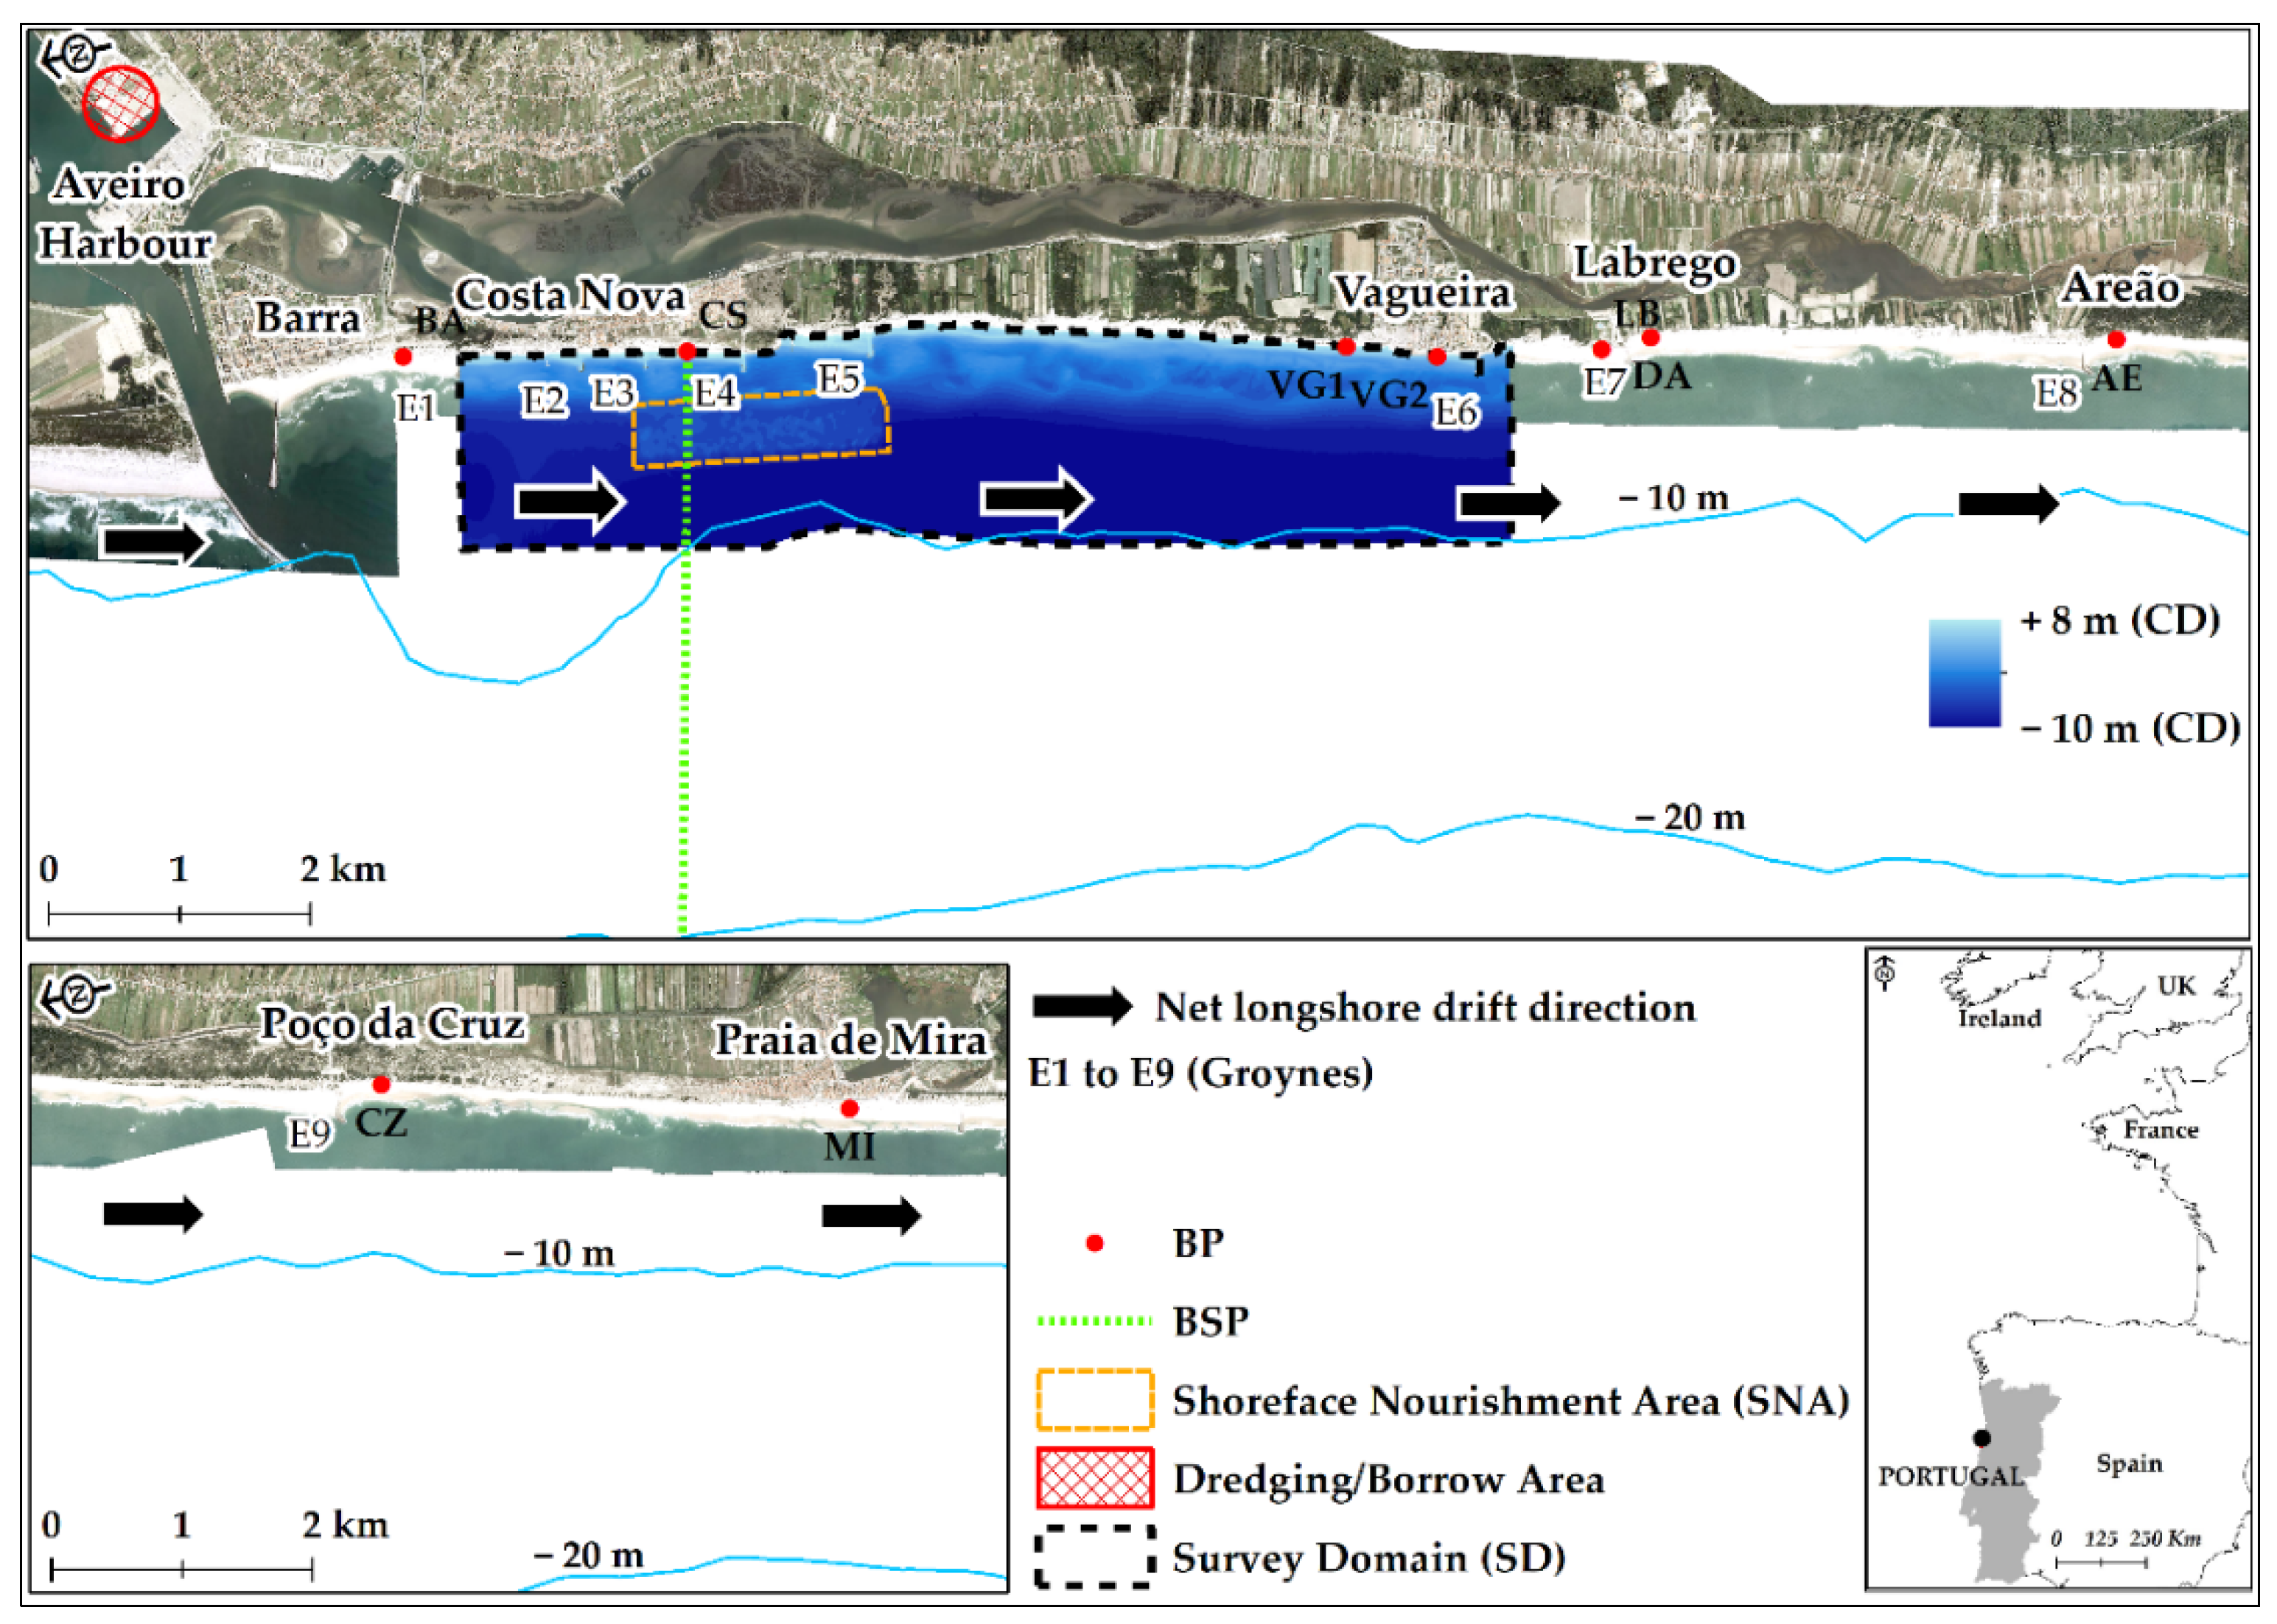
3 of sediment in May to early September 2020. Sand was dumped in front of Costa Nova beach (
Figure 1 and
Figure 2a), between 4 and 8 m below Chart Datum (CD—chart datum lies 2.0 m below mean sea level—MSL). The sand mound acquired a broadly trapezoidal shape with a flat summit at −4 m CD, and extended over 0.95 km
2 (length = 1.9 km; width = 0.5 km). Sediments were dredged from a nearby borrow area (≈6.5 km) and consist of dredge spoil stored within the Aveiro harbour (
Figure 3).
Borrow materials are essentially made of quartz and consist of moderately well sorted, coarse and medium sand (mean grain size of 0.92 mm) [
33], the mean size spanning over a wider size-spectrum than the beach. Coarser sand (about 1/3 of the samples analysed) is somewhat less well sorted than medium sand. All samples analysed (
n = 36) for textural characterization of borrow materials yielded less than 1% mud (particles < 63 μm) contents. However, about 20% of the samples revealed non-negligible (higher than 5%) amounts of particles finer than 0.250 mm, in one case reaching up to 14% of the whole sample. Assuming that the sampling scheme correctly represents the total volume of borrow materials, and that fine and very fine sand particles are especially prone to be readily removed from the dump site to the offshore, we estimate that up to 8% of the sand volume dumped in the nourishment area could have been lost during (or shortly after) the nourishment operations, slightly reducing the sediment volume in the dump area.
An additional volume of ≈320,000 m3 (≈295,000 m3 after the above-mentioned textural correction) of sand was deposited between September 2020 and March 2021, adjacent to the seaward slope of the main dump, outside the pre-defined SNA of the main intervention, but within the SD. Finally, more 212,000 m3 were deposited between March 2021 and Aug 2021, at the location of the main dump, but that were excluded from sediment budget calculations within the SD, given that last Topo-Bathymetric Surveys (TBS) dates from March 2021.
3.2. Data Collection
Topographic and hydrographic data used for this study were provided by the COSMO Program [
34] containing three types of datasets: Beach Profiles (BP), Beach-Shoreface Profiles (BSP), and Topo-Bathymetric Surveys (TBS), performed during the monitoring period, from July 2018 to September 2021 between Praia da Barra and Praia de Mira beaches (
Figure 1). An additional Multi-Beam Hydrographic Survey (MBHS) was made by the Aveiro Port Administration in early September 2020, immediately after the main dump, covering only the deposition area (survey boundaries indicated in
Figure 1).
BP consist of cross-shore transects at several coastal locations (
Figure 1) that were repeatedly surveyed using a GPS/RTK between a fixed reference onshore and extending at least to the +1 m (CD) contour line. Horizontal resolution was better than 1 m and vertical accuracy better than 0.05 m.
BSP incorporate and extend BP into the shoreface down −20 m (CD) contour line, using a jet sky equipped with a GPS/RTK coupled with a single beam echo sounder, with planimetric and vertical accuracy similar to BP.
TBS results from the combination of topographic and hydrographic data. Topography was acquired using aerial photogrammetry techniques over stereoscopic imagery captured by a high-resolution camera mounted on a fixed wing UAV, equipped with GPS/RTK, supported by several ground control points. RMS error in planimetry and altimetry were better than 0.05 m. Hydrography extends into the beach submarine domain down to ca. −10 m (CD) and data were obtained using a single-beam (transect spacing of 30 m in the depth range of +1 to −3 m CD) and multi-beam echo sounders, the latter with vertical accuracy of 0.05 m, the same as the MBHS.
3.3. Data Processing and Analysis
Wave data were used to characterize deep water wave regime over the monitoring period and to estimate potential longshore drift in the survey domain. Wave parameters at breaking were computed using Airy wave theory and Snell’s Law. Longshore drift estimates were obtained by the energy flux method, using the CERC formula [
35]. In agreement with the findings of [
36], which reported an overestimation of 7.85 × regarding the CERC formula when spectral effects are not considered in computations of longshore drift, the formula was parametrized with a smaller empirical factor (
k′= 0.39/7.85). Bathymetric data were processed with QIMERA (multi-beam) and HYPACK software (single-beam) by ATLANTICLAND (a consortium member of the COSMO Program). The obtained XYZ point cloud was interpolated to produce DEM with 0.03 m pixel resolution. For the topographic surveys it was used the AGISOFT software, with a processed point cloud of 100 points/m
2, generating a DEM with a 0.01 m resolution (data processed by GEOGLOBAL, a consortium member of the COSMO Program).
In order to analyse the morphological development and behaviour of the shoreface nourishment, including spreading and diffusion processes over the survey domain (SD), a volumetric, cut-fill, and bed level changes analysis was performed over the TBS using ArcGIS and Globalmapper softwares. To analyse sediment budget exchanges in terms of cross-shore/longshore processes and evaluate feeder efficiency of the nourishment, the SD was divided in different areas, here designated as Multi-Monitoring Cells. Shoreface and subaerial beach response through time in relation to the nourishment, was based on the comparison of selected contour lines extracted from the TBS.
Shoreface and subaerial beach variability (i.e., volume and width) and its response to the nourishment was analysed through the available BP and BSP. For the BP, volume was calculated above + 1 m (CD) up to a fixed height, where no variations occur; in turn, beach width variation was estimated measuring the horizontal displacement of the +2 m (CD). Shoreface morphological variability was addressed using BSP and evaluated through the assessment of horizontal displacement of selected contour lines down to the closure depth. To highlight the potential effect of the shoreface nourishment (SN), width and volume values obtained from BP and BSP were normalized by subtraction from the pre-nourishment time-averaged values, July 2018 to July 2020 and August 2018 to July 2020, respectively.
The depth of closure, seaward of which no significant morphological changes occur, according to the original definition proposed by [
37] was estimated from statistics of bed-level variability, as proposed by [
36]. The value of 0.15 m was set as the threshold on the standard deviation (s) of the bed level. This is slightly higher than the vertical accuracy reported for the Jet Ski Single-Beam acquisition platform (0.10 m) and allows for some additional uncertainty due to wave conditions and water depth as suggested by [
38].
A Multiple Monitoring Cell (MMC) approach was used to evaluate local and feeder efficiency of the SN and to assess post-nourishment pathways of sediment dispersion within survey domain (SD). This was applied to the SD by splitting this area into twenty rectangular cells, organized in four cross-shore rows and five longshore columns.
To quantify shoreline evolution, namely, comparison of contour lines of TBS), the Digital Shoreline Analyses System [
39] was used, an extension in ArcGIS (ESRI) software that allowed for net shoreline movement and retreat rates calculations.
4. Results
4.1. Wave Forcing and Longshore Drift in the Monitoring Period
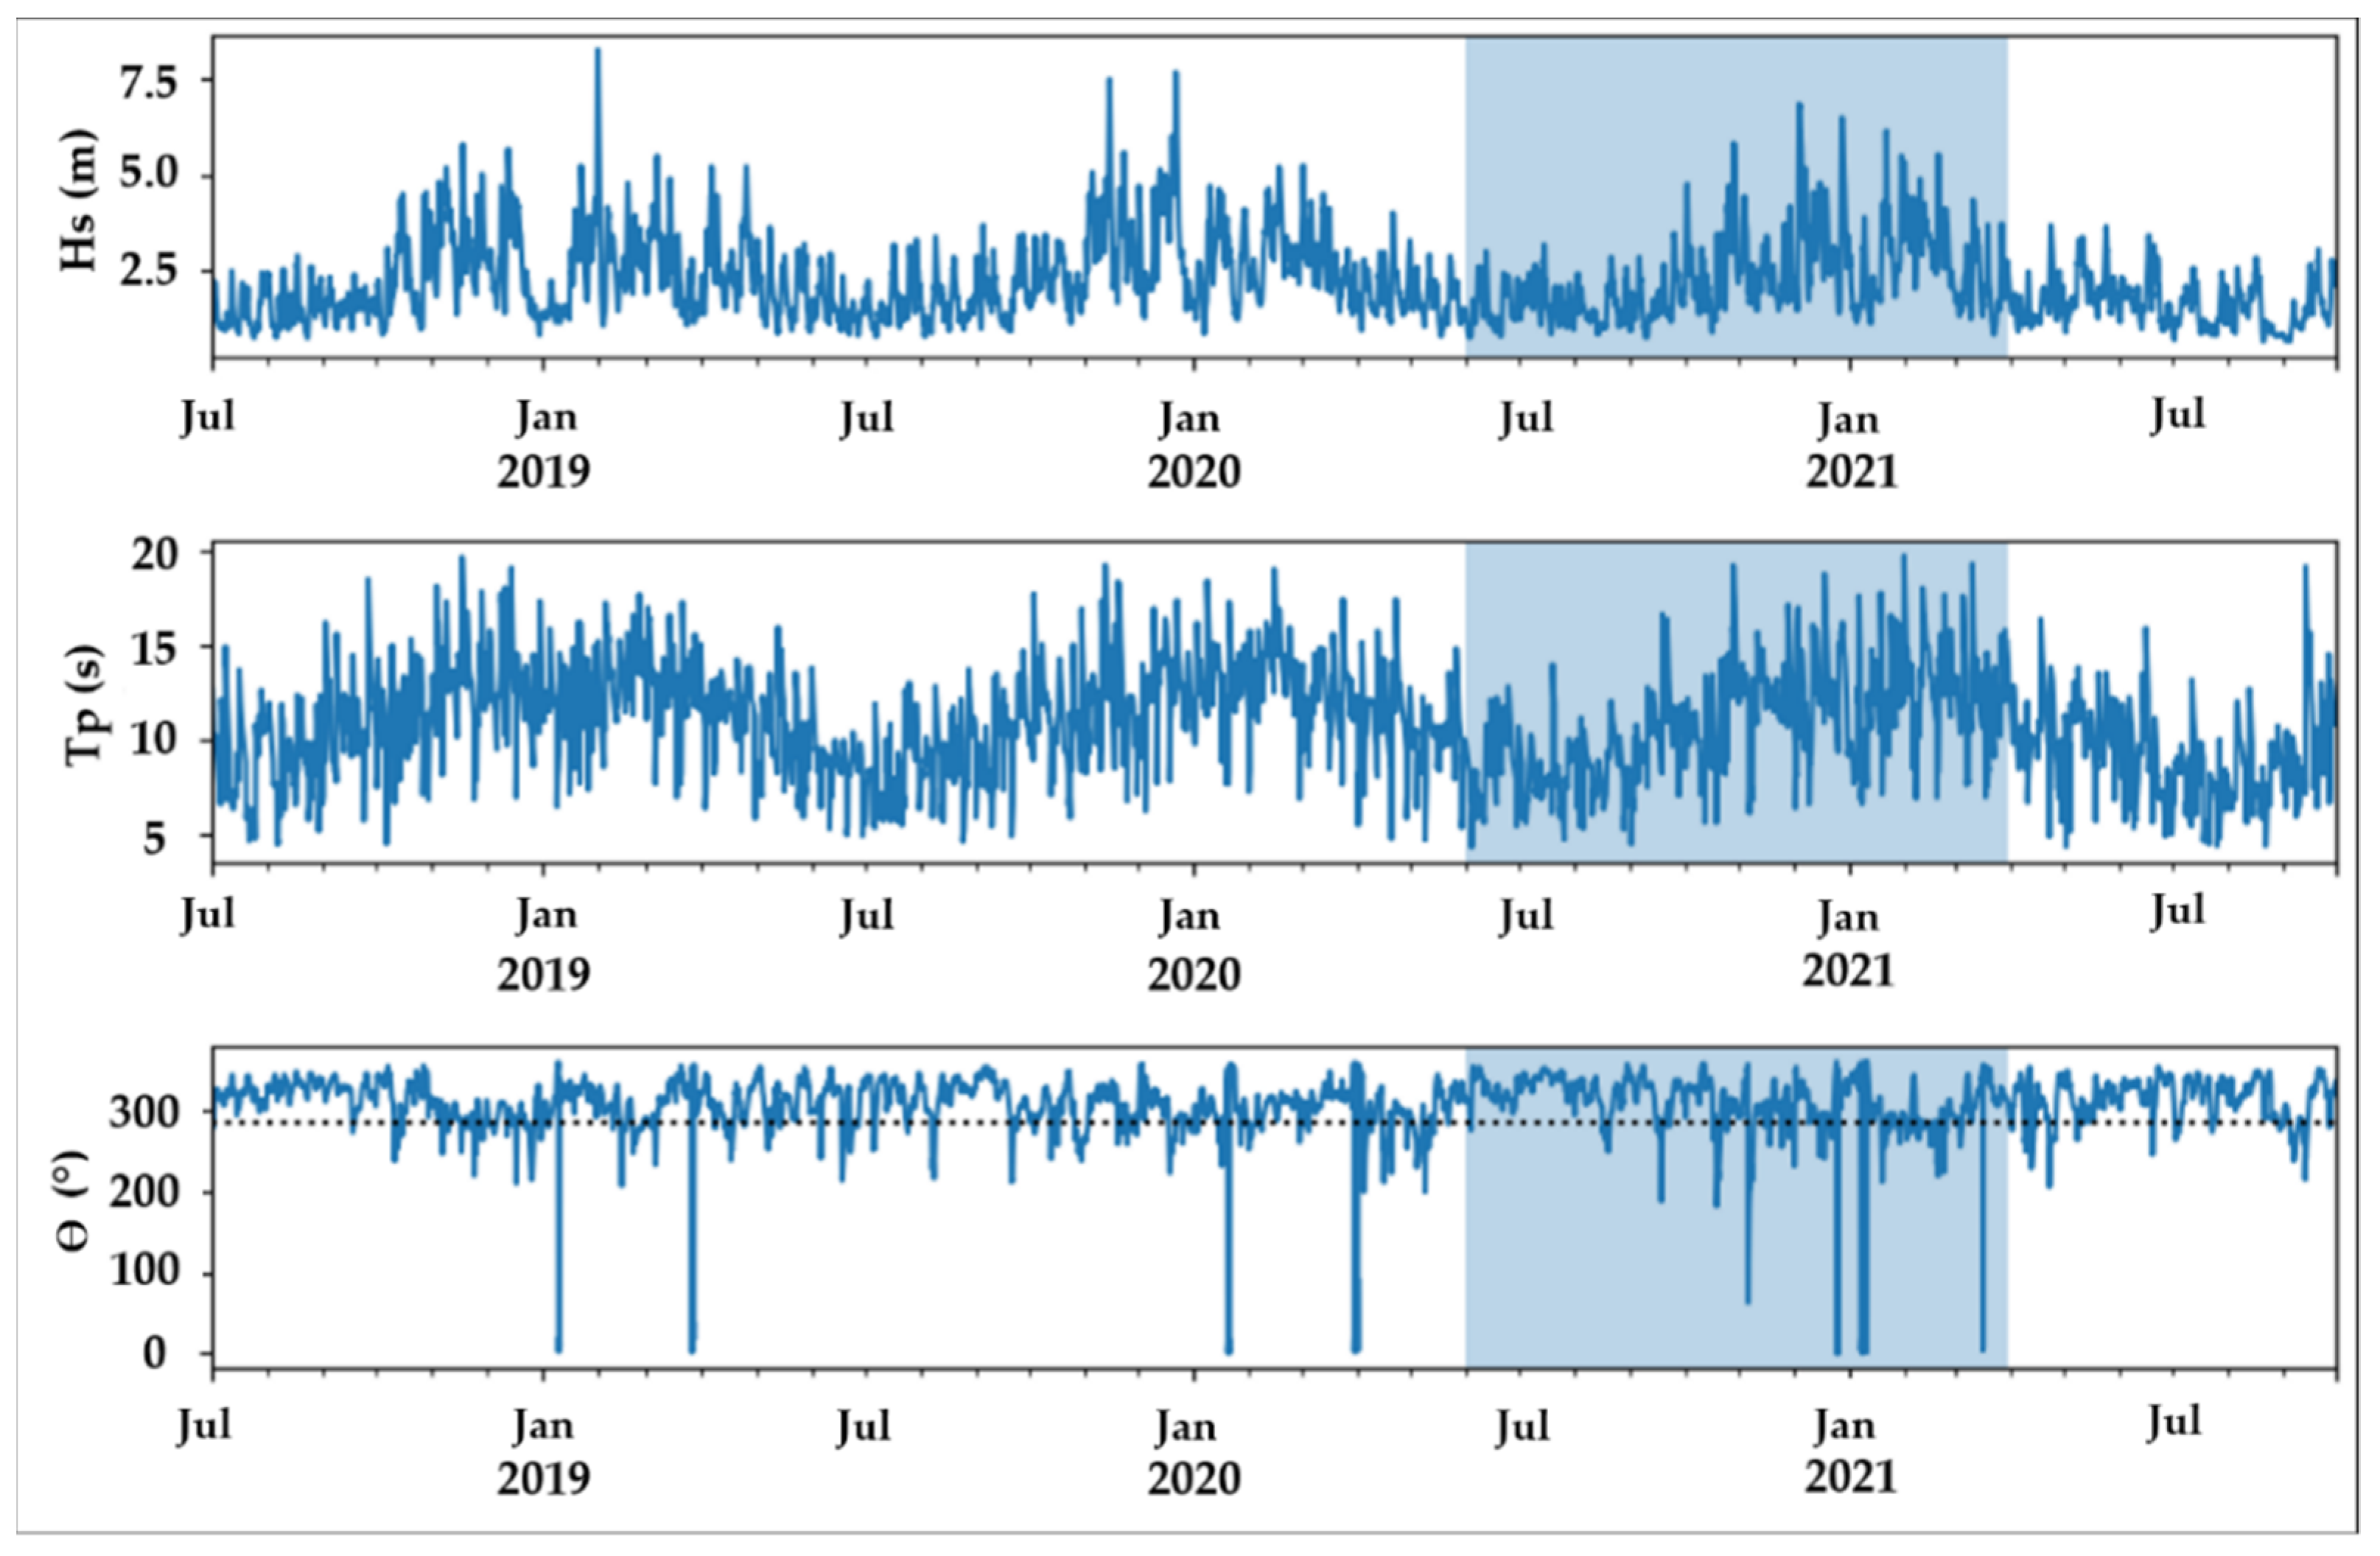
Figure 4 shows the time distribution of deep-water wave parameters over the monitoring period, highlighting the seasonality of wave forcing. Mean wave conditions (Hs = 2.23 m; Tp = 10.9 s) are in close agreement with long-term estimates indicated in
Section 2.1. High-energy events essentially cluster in winter/autumn months with high directional variability in drift currents. In contrast, during summer/spring, wave height and period are lower and drift currents are more consistently directed southward.
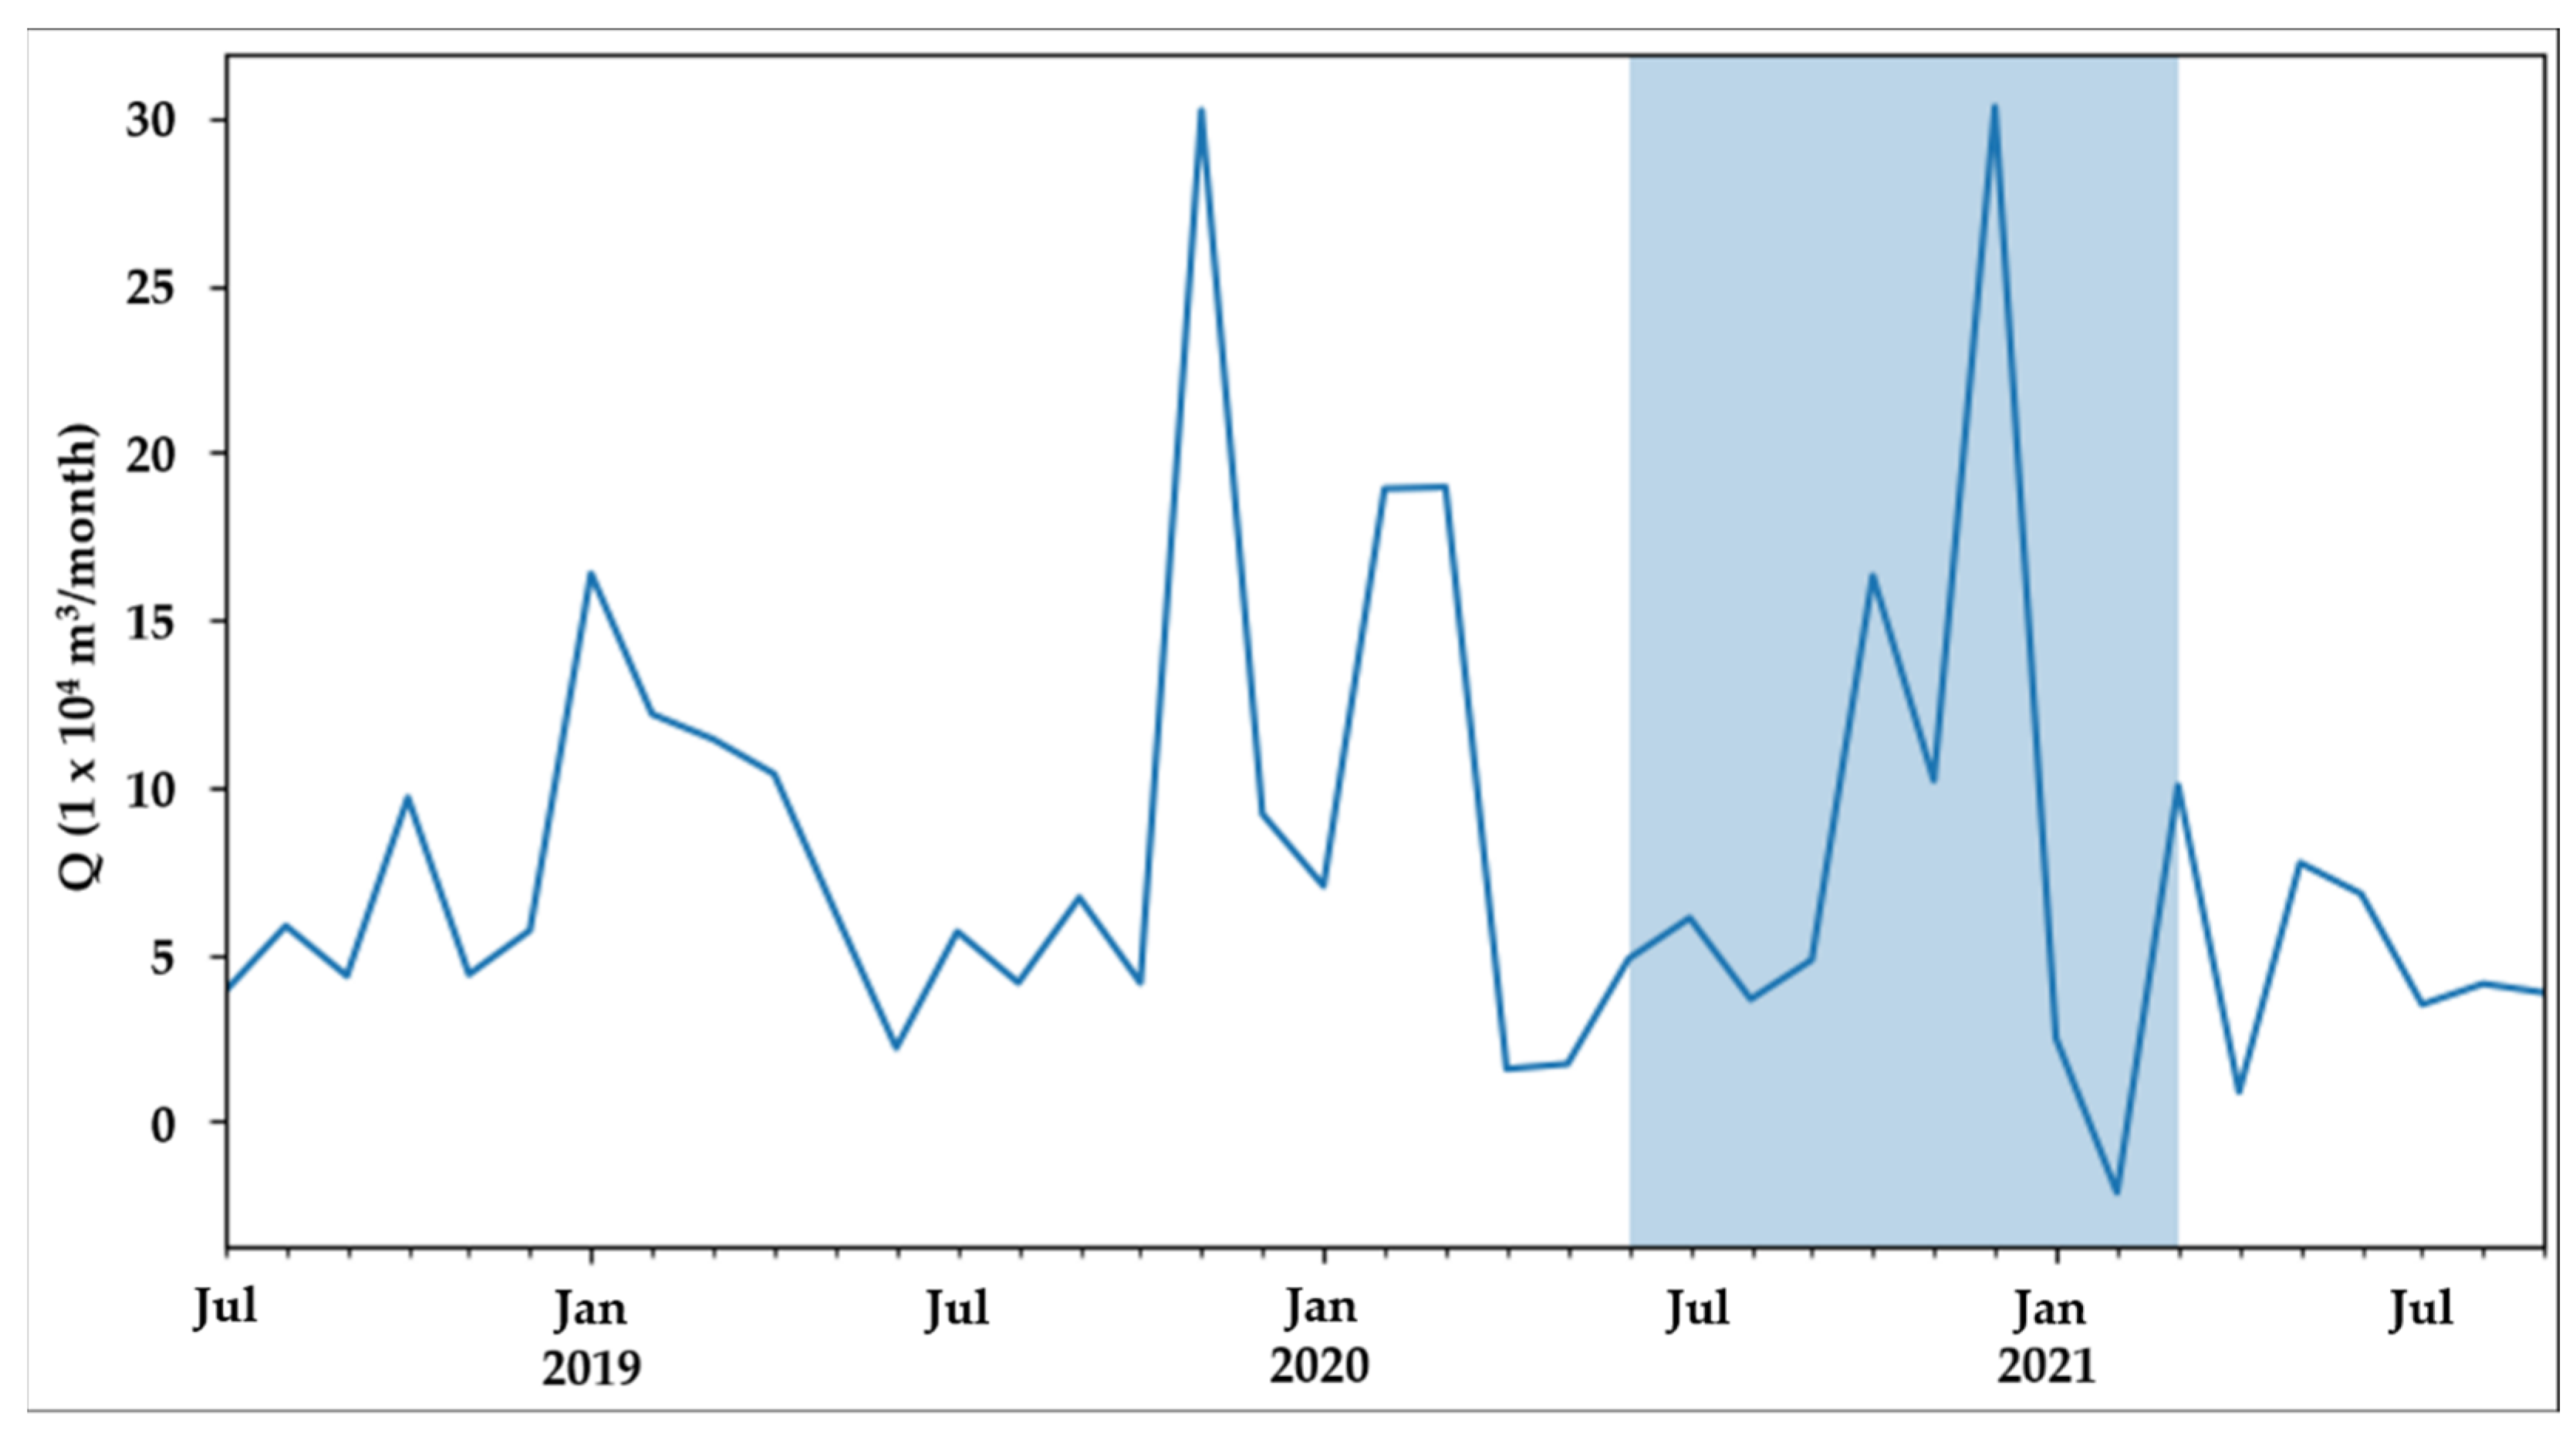
During the monitoring period, monthly longshore drift was almost exclusively directed towards south (
Figure 5), with a grand total of 3.15 × 10
6 m
3. This corresponds to a yearly average of 0.97 × 10
6 m
3/year, which is remarkably similar to longer term estimates of mean annual longshore drift reported by [
22,
23,
24].
In the period covered by the pre- and post-nourishment TBS (June 2020 to March 2021) (highlighted blue region in
Figure 5) the only reversal on longshore drift direction is observed in February 2021 in correspondence with persistency of westerly waves. Notwithstanding this singularity, the net drift was directed southward with a magnitude of 0.87 × 10
6 m
3, strongly influenced by high-energy winter waves (
Figure 4 and
Figure 5).
4.2. Beach Profiles (BP)
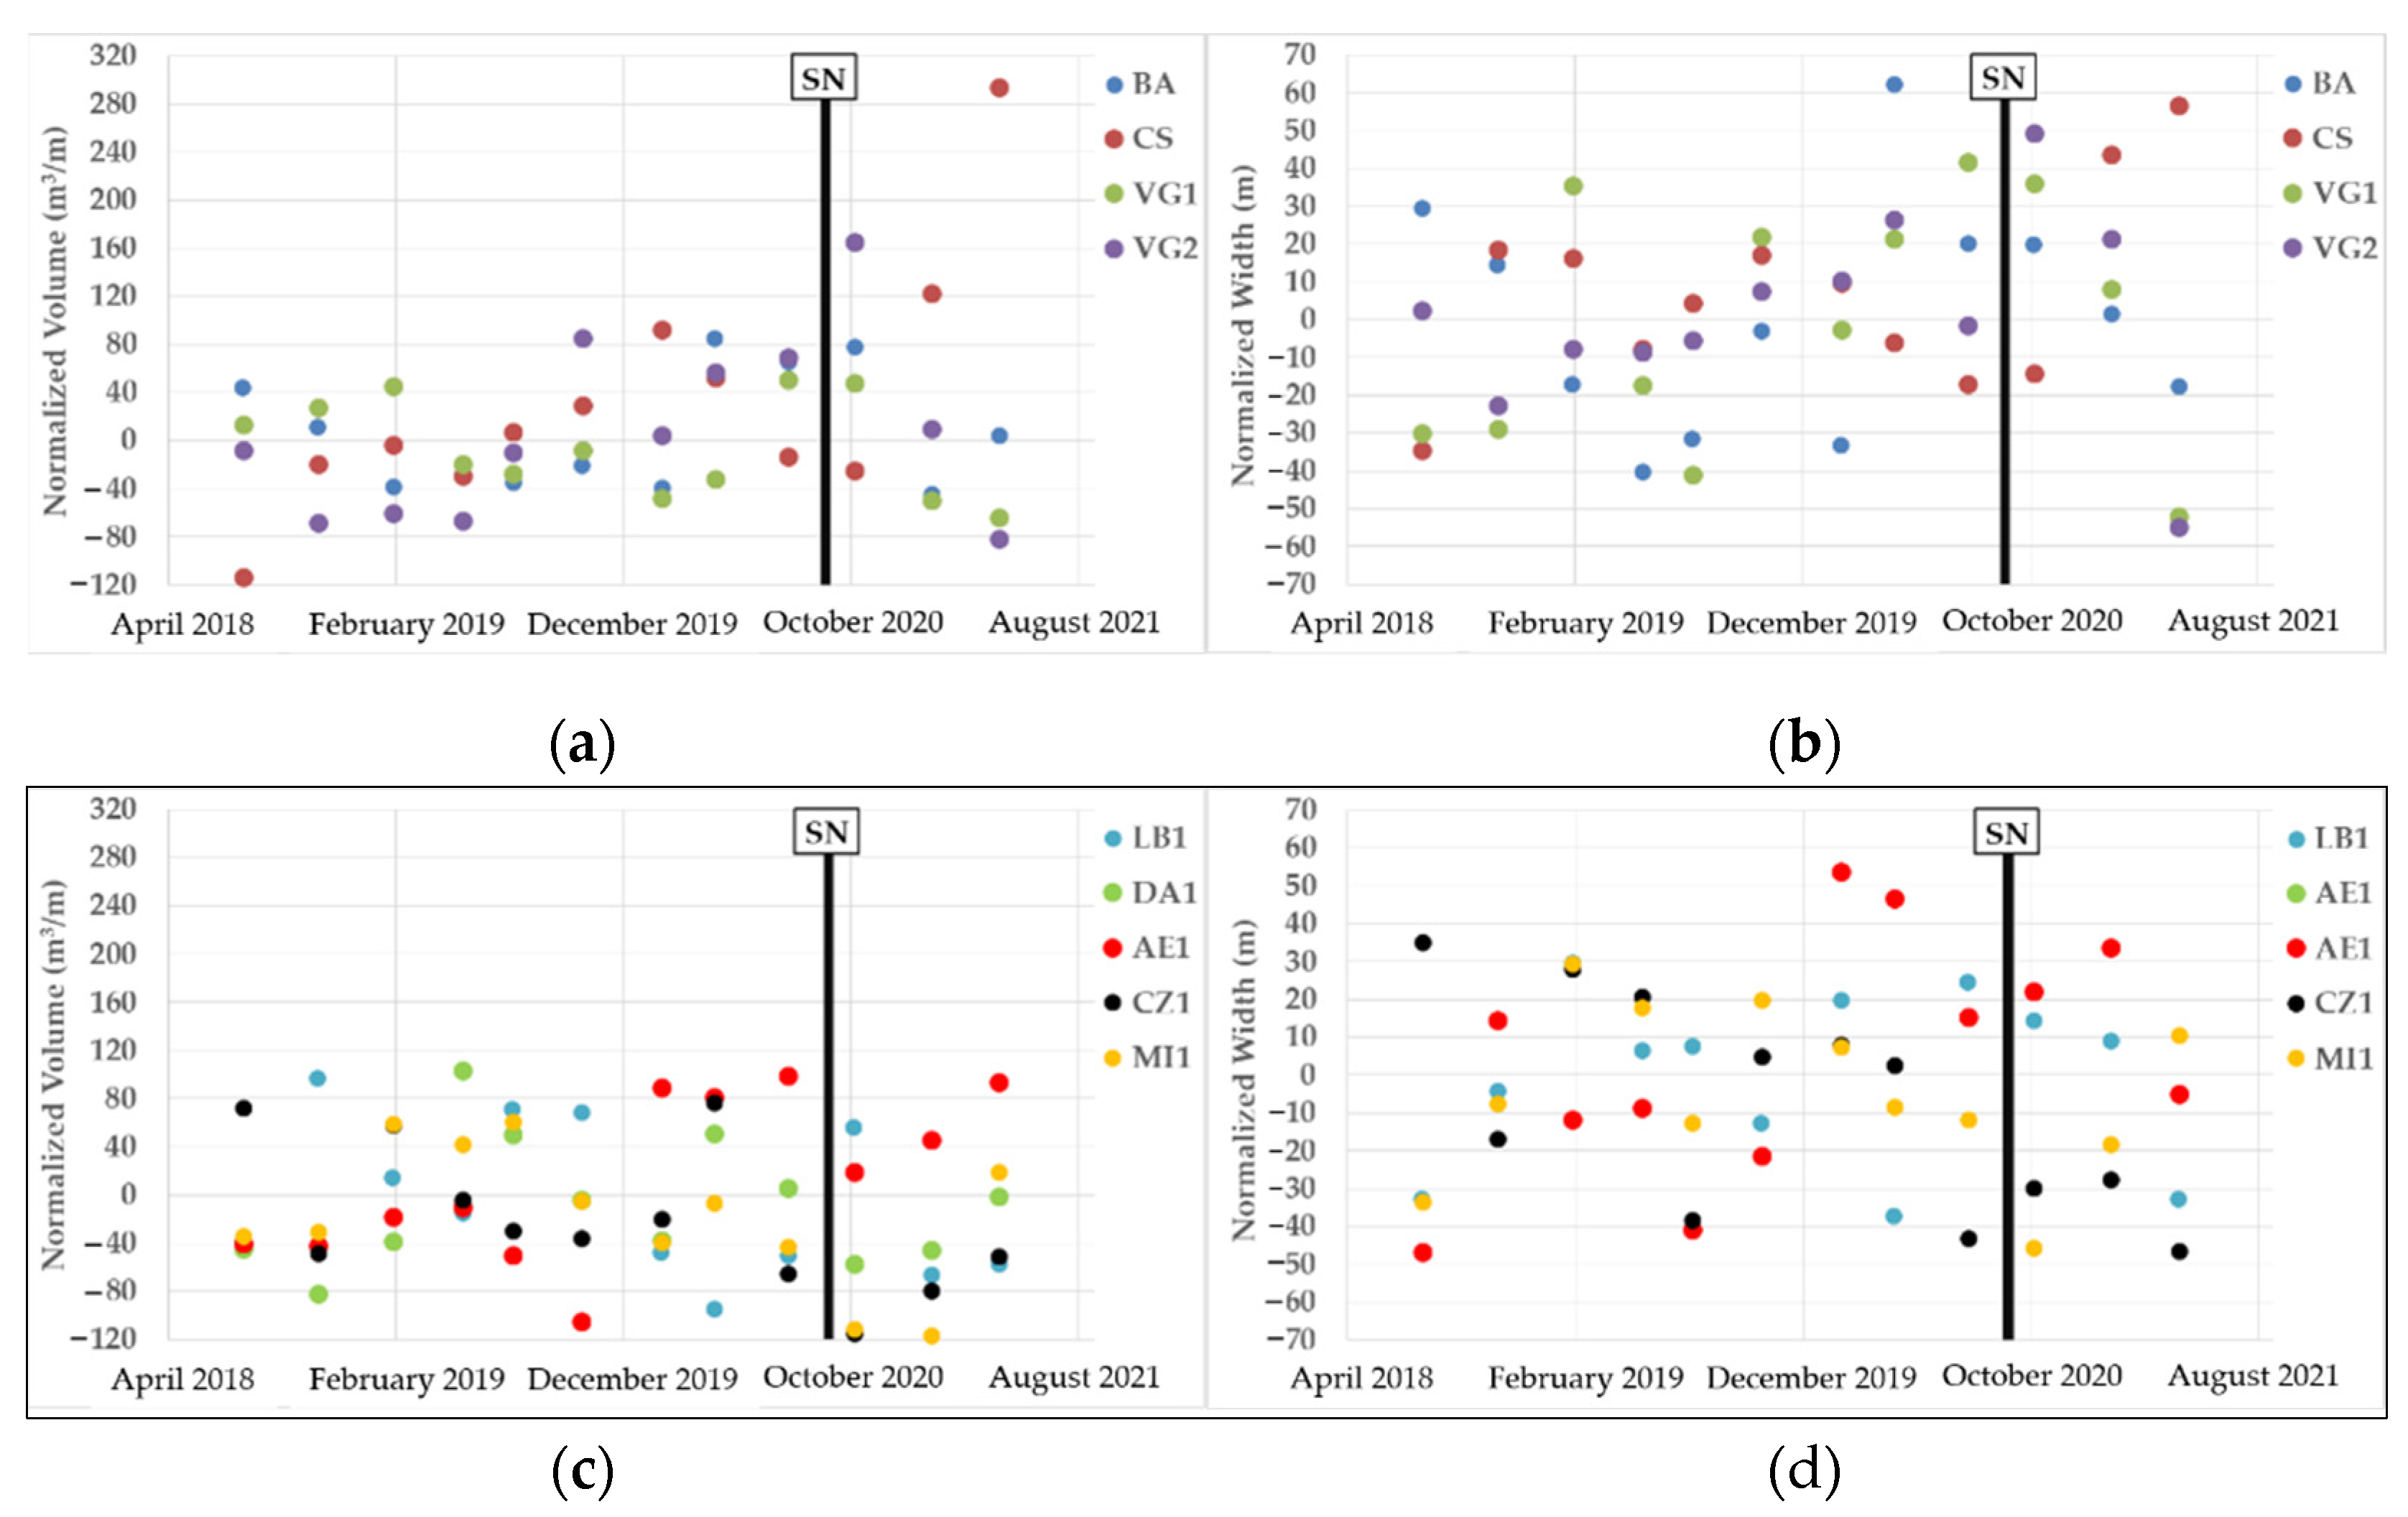
Results (
Figure 6) show the variability of subaerial beach volume and width related to short term (seasonal) wave forcing. Significant changes following the nourishment were only observed in (CS) (the profile closest to, and aligned with the SNA), with a consistent increase in width and volume of the subaerial beach over time. In this case, magnitude of changes clearly exceeds the range of seasonal variability over the monitoring period. All the remaining profiles, both updrift and downdrift, do not appear to have been substantially influenced by the nourishment.
4.3. Beach Shoreface Profiles (BSP)
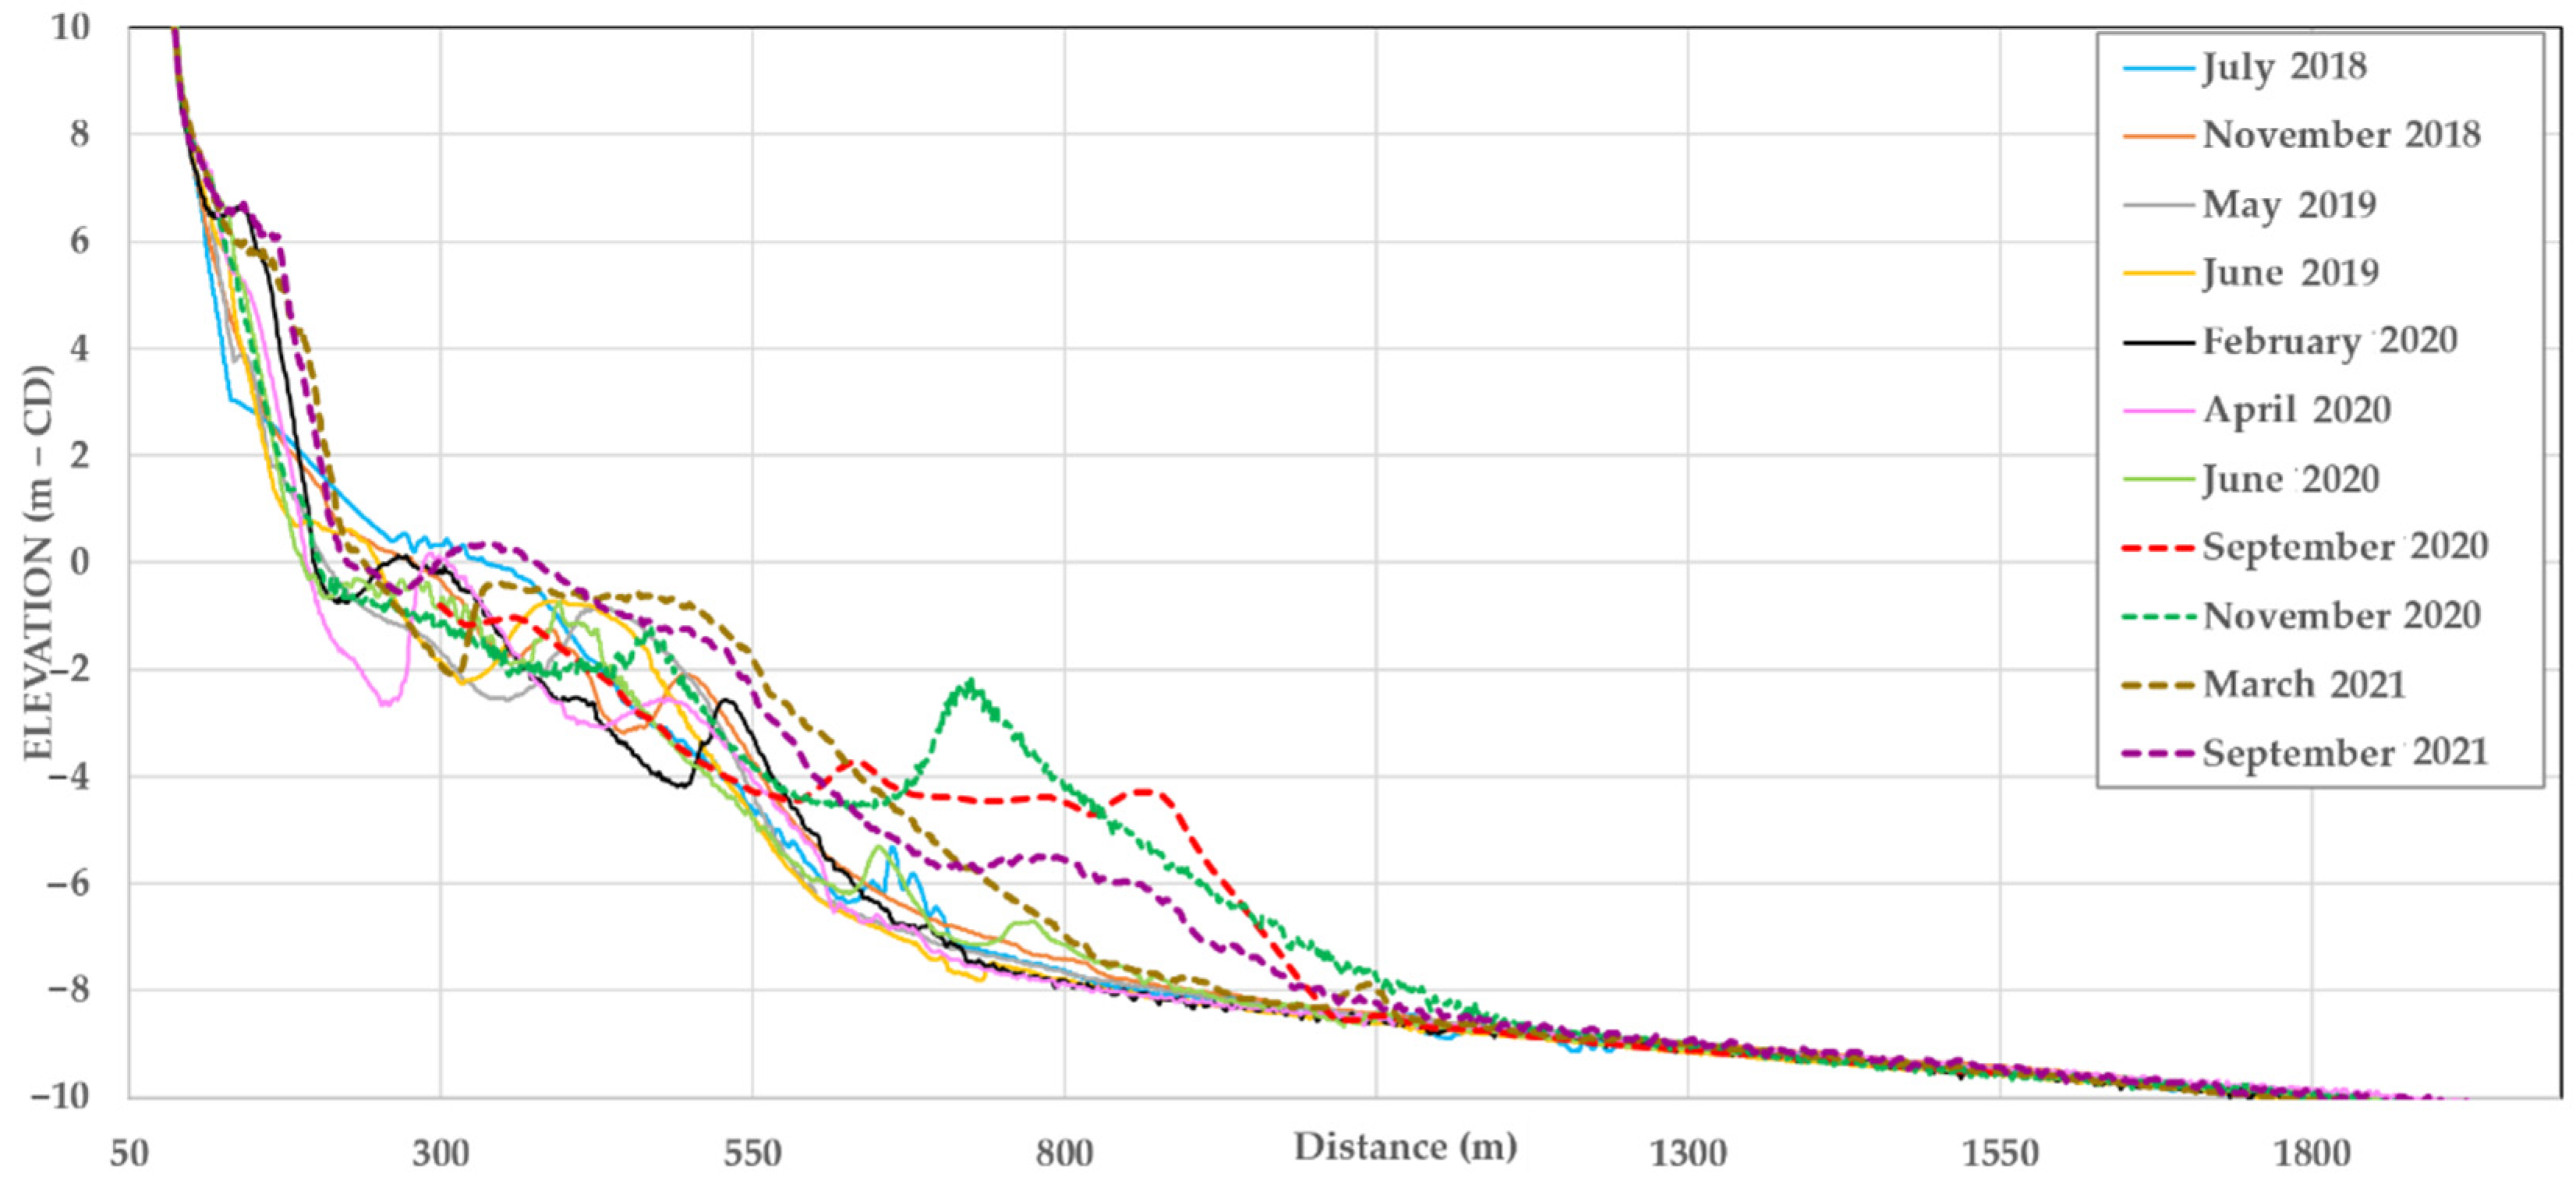
Figure 7 illustrates changes in cross-shore profiles extending from the foredune until −10 m (CD) over the monitoring period at the location where the shoreface nourishment was dumped, complementing data on subaerial beach changes mentioned above.
Depth of closure (DoC) used in this study was estimated from profile convergence (s < 0.15 m) and is—9.3 m (CD) (
Figure 7). This depth is lower than previous wave-based empirical estimates of DoC for the same area, which can vary from −8.5 m CD to −17 m CD [
28,
40,
41]. Discrepancies are mostly related to the different approaches (empirical versus morphological) and time scale of the analyses [
42].
A complex longshore bar system dominates inner shoreface morphology and morphological changes. Inner bars (single or multiple), extend up to 500 m offshore, and develop between—4 m (CD) and 0 m (CD), the elevation offset between bar crest and trough reaching up to 2 m. After the SN, a plateau is evident in September 2020, from which a prominent bar is evident in November 2020 (800 m offshore). The inland migration of this bar is highlighted in Mar (500 m offshore) and September 2021 (350 m offshore).
The shoreface nourishment (illustrated by BSP September 2020 in
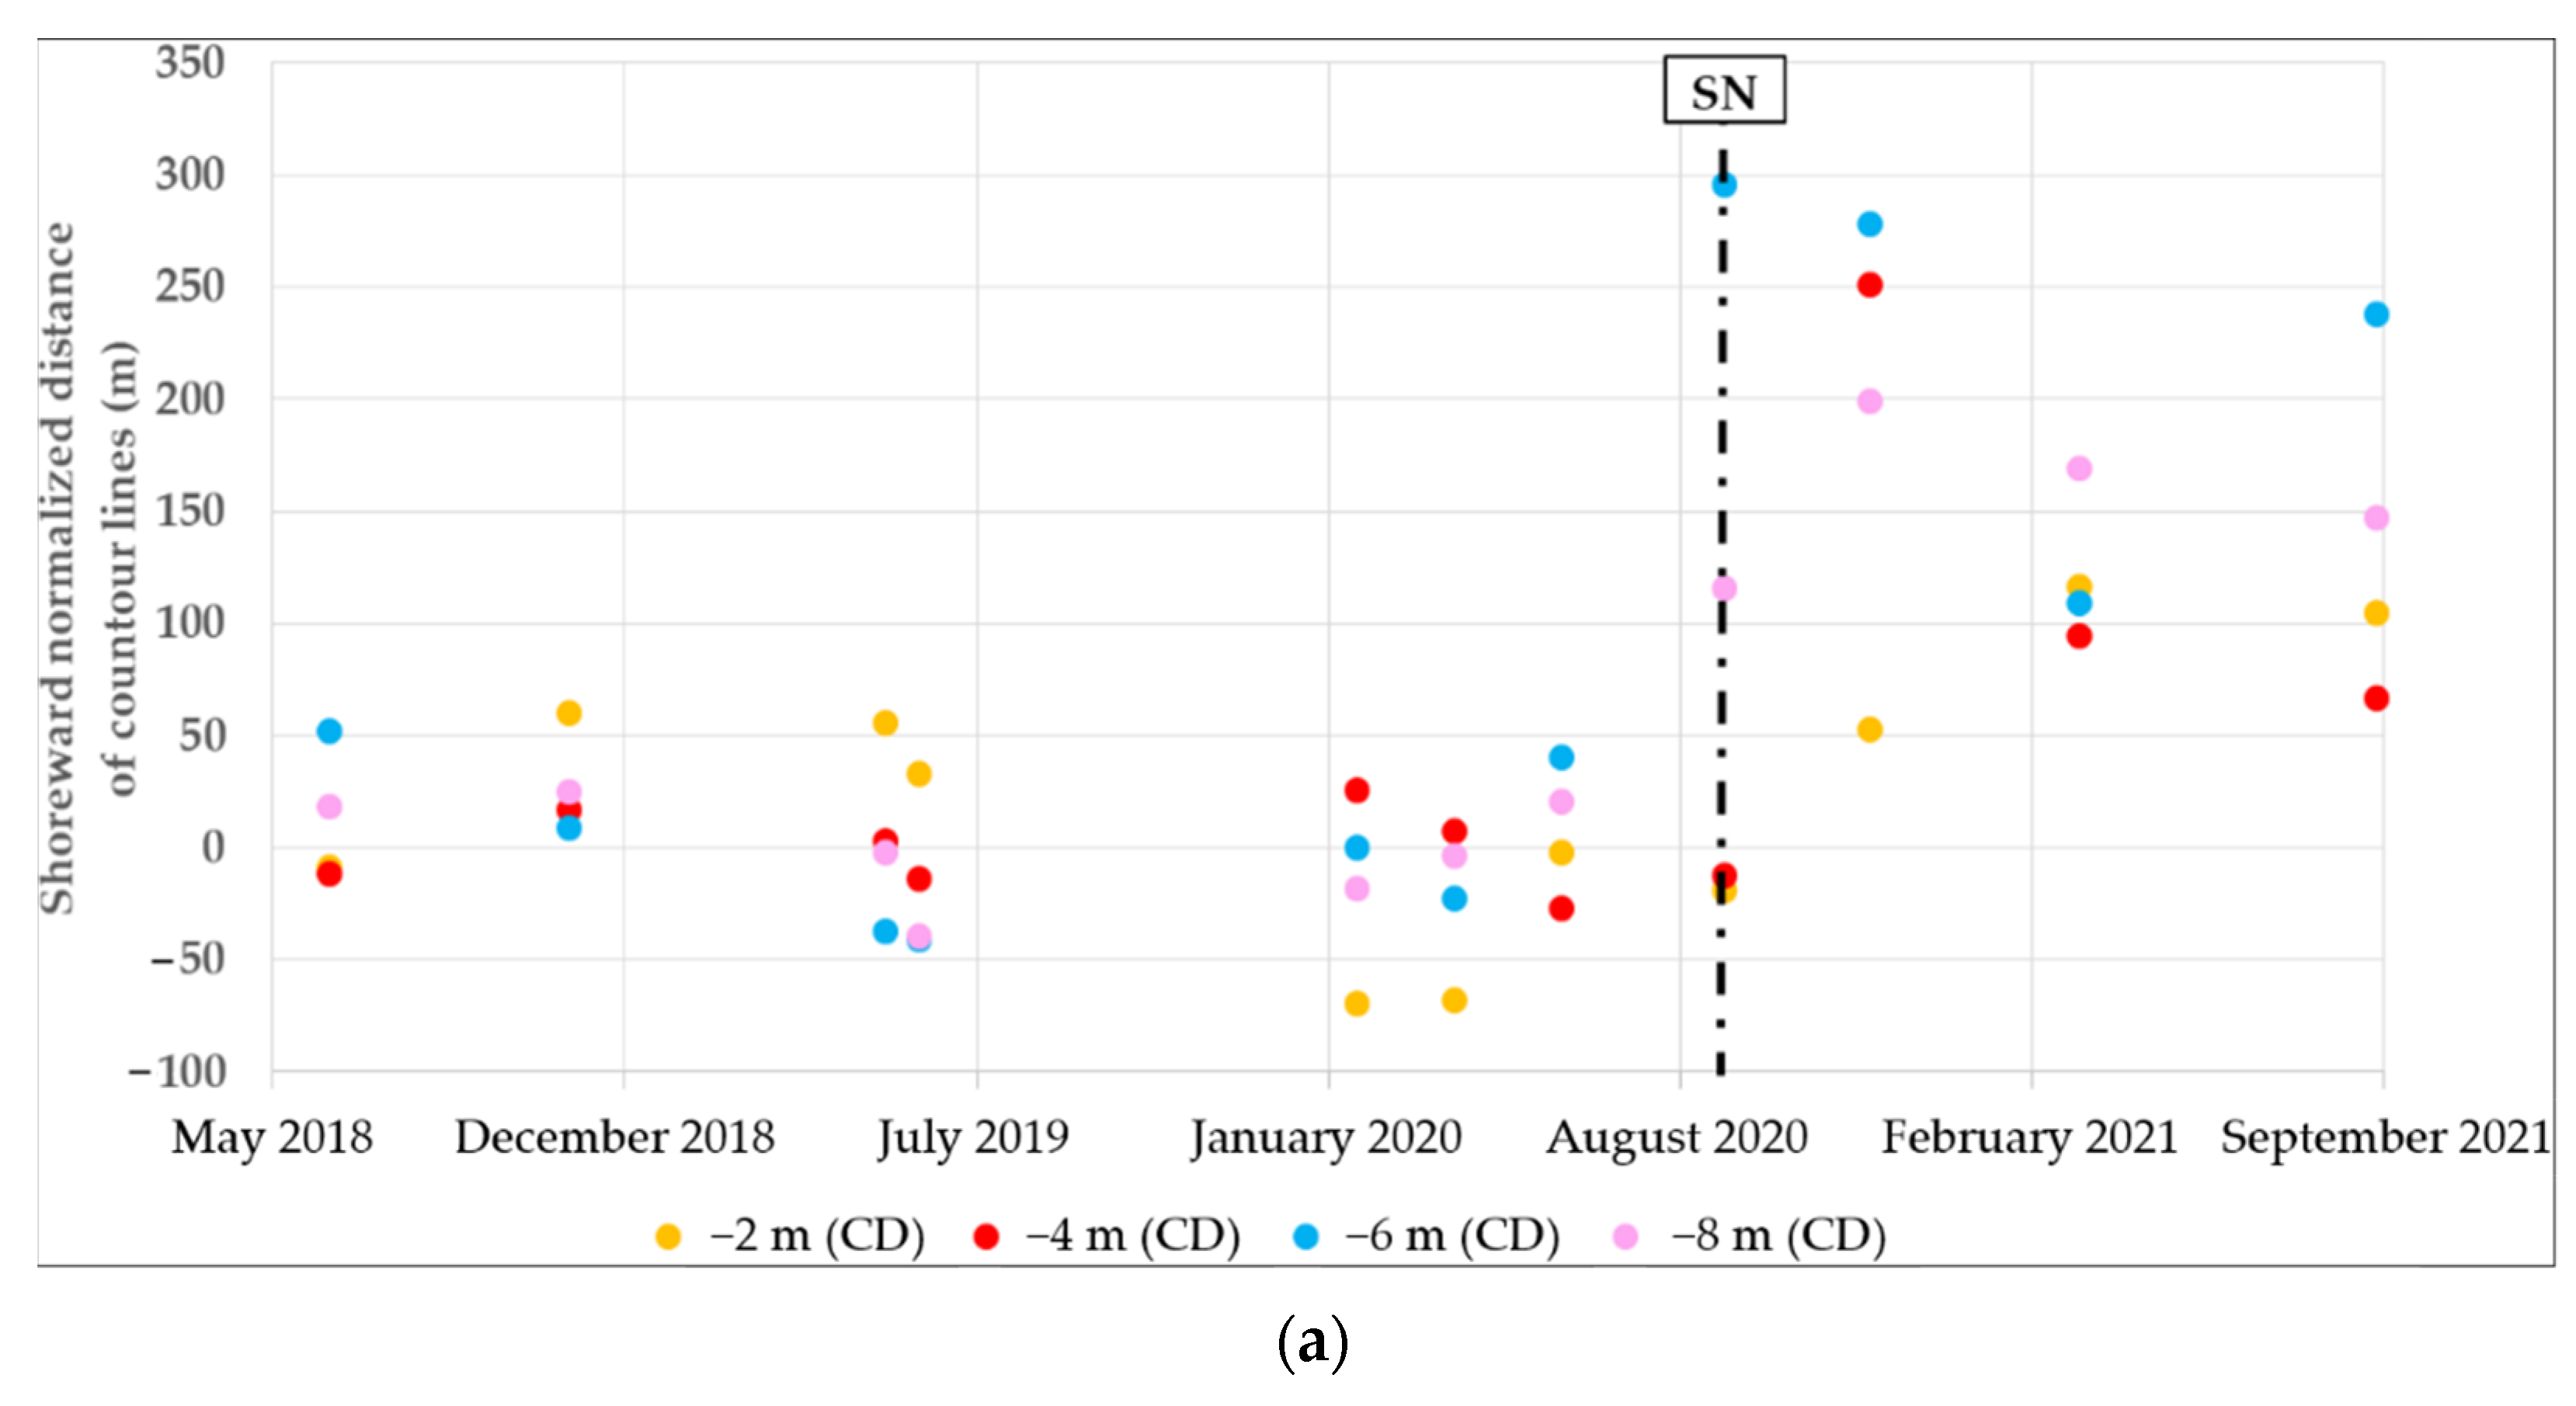
Figure 7) created a 500 m wide, flat summited sand mound, with a broadly trapezoidal shape between −4 m CD and −8 m CD. This resulted in seaward displacement of 100 m and 300 m of the −8 m CD and −6 m CD contour lines, respectively (
Figure 8a).
About two months later (November 2020) (
Figure 7) the cross-section profiles show a landward translation and significant reshaping of the fill, with the development of two asymmetrical bars: a larger one atop the artificial sand mound and a smaller one merging with the pre-existing bar system. The seaward slope of the mound became milder, mimicking the pre-nourishment shape, and extended further seaward of the post-construction profile until the DoC. This slope adjustment is manifested by additional 80 m seaward displacement of the −8 m CD, and limited opposite (landward) translation of 20 m at −6 m CD.
Seven months after the SN, almost all sand in the artificial mound moved landward, feeding and building a wider and shallower nearshore bar system. This behaviour is mirrored by a landward displacement of depth contour lines−8 m CD, −6 m CD, and −4 m CD (
Figure 8a). Simultaneously, it was observed significant subaerial beach accretion by ca. 40 m seaward advance of the beach face (cf. contour lines + 2 m CD and + 4 m CD) (
Figure 8b).
Profile changes between March 2021 and September 2021 (
Figure 7) are less pronounced landward of −1 m CD, where limited landward displacement of the nearshore bar and beach face retreat occurred. Seaward of −1 m CD, lowering of the profile was observed, whereas sand accumulated between −5 m CD and −8 m CD.
Profile changes in BSP may be taken as representative of sediment and morphological cross-shore dynamics in the area influenced by the SN. They suggest that SN at Costa Nova evolved rapidly, and essentially consisted of reshaping and landward translation of placed sand mound over the shoreface, the nourishment effects eventually affecting the subaerial beach in about seven months.
4.4. Topo-Bathymetric Surveys (TBS) and Multi-Beam Hydrographic Survey (MBHS)
Analyses of TBS and MBHS allowed for the evaluation of volume changes and sediment budget within the SNA and SD. Moreover, it provides additional insights on sediment dispersion driven by both longshore and cross-shore process.
Comparison of TBS June 2020 (pre-nourishment survey) and MBHS September 2020 (post-construction final survey) in the SNA indicate a volume increase of 2.087 × 10⁶ m3. This is 12% less than the volume of material dredged from the borrow area, as reported by the Port Authority (2.375 × 10⁶ m3). This difference may be explained by: (i) permanent loss (8%) to the offshore of the finer size fractions of sediment (<0.125 mm); and (ii) sediment transfer (4%) from SNA to the SD, caused by waves and currents over four months, during which numerous dumps added to produce the post nourishment measured volume. In agreement, a volume of 2.185 × 10⁶ m3 is considered a fair estimate of the amount of compatible sand placed at the SNA. Sediment budget calculations for the entire SD includes an additional amount of 295,000 m3.
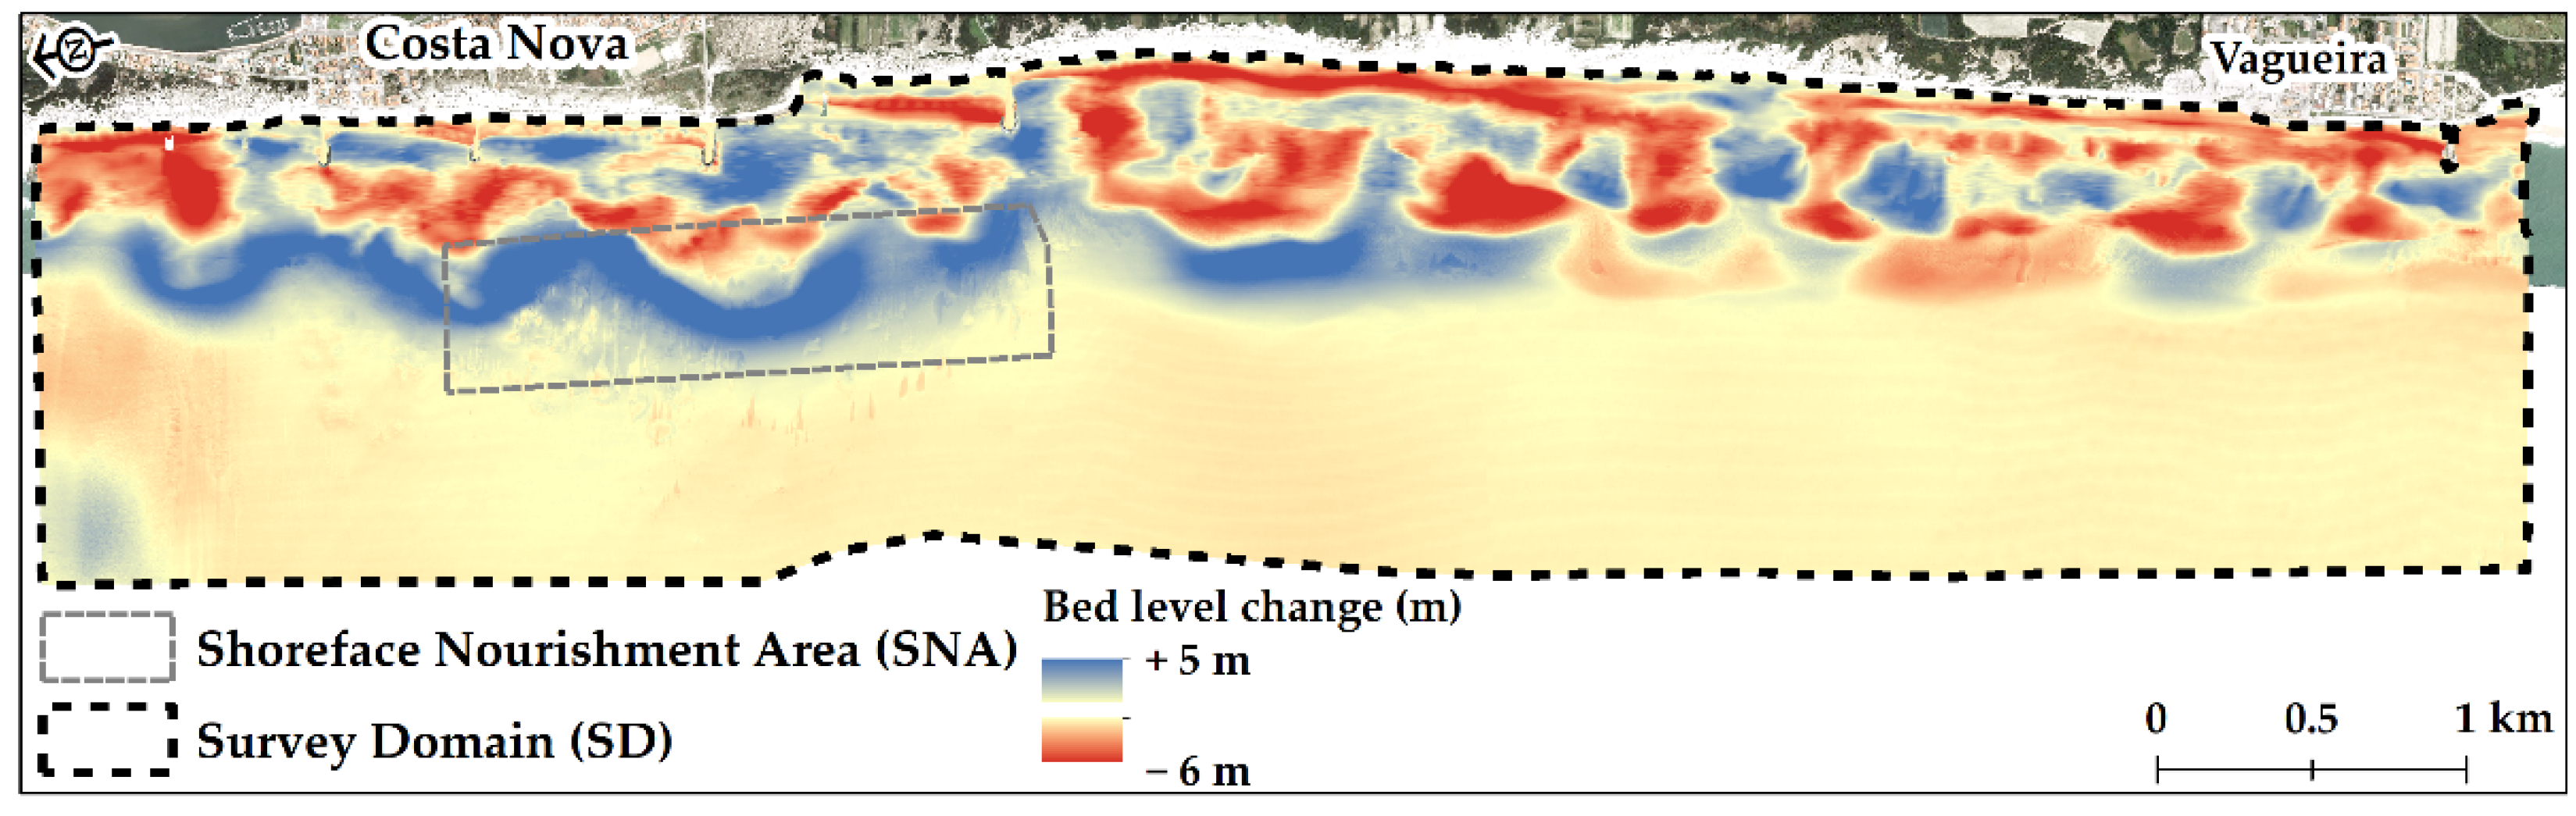
Morphological changes from pre- to post-nourishment (June 2020 to March 2021) reveal a heterogeneous spatial pattern, with alternating accumulation and erosion patches (
Figure 9), showing larger longshore continuity. Bed level changes range from −6 m to +5 m, with the largest changes occurring in the bar system and subaerial beach. The SNA, together with updrift and downdrift adjacent regions, show higher accumulation and increased spatial continuity, in contrast with the southern half of the SD where patches of accumulation and erosion are smaller and more fragmented.
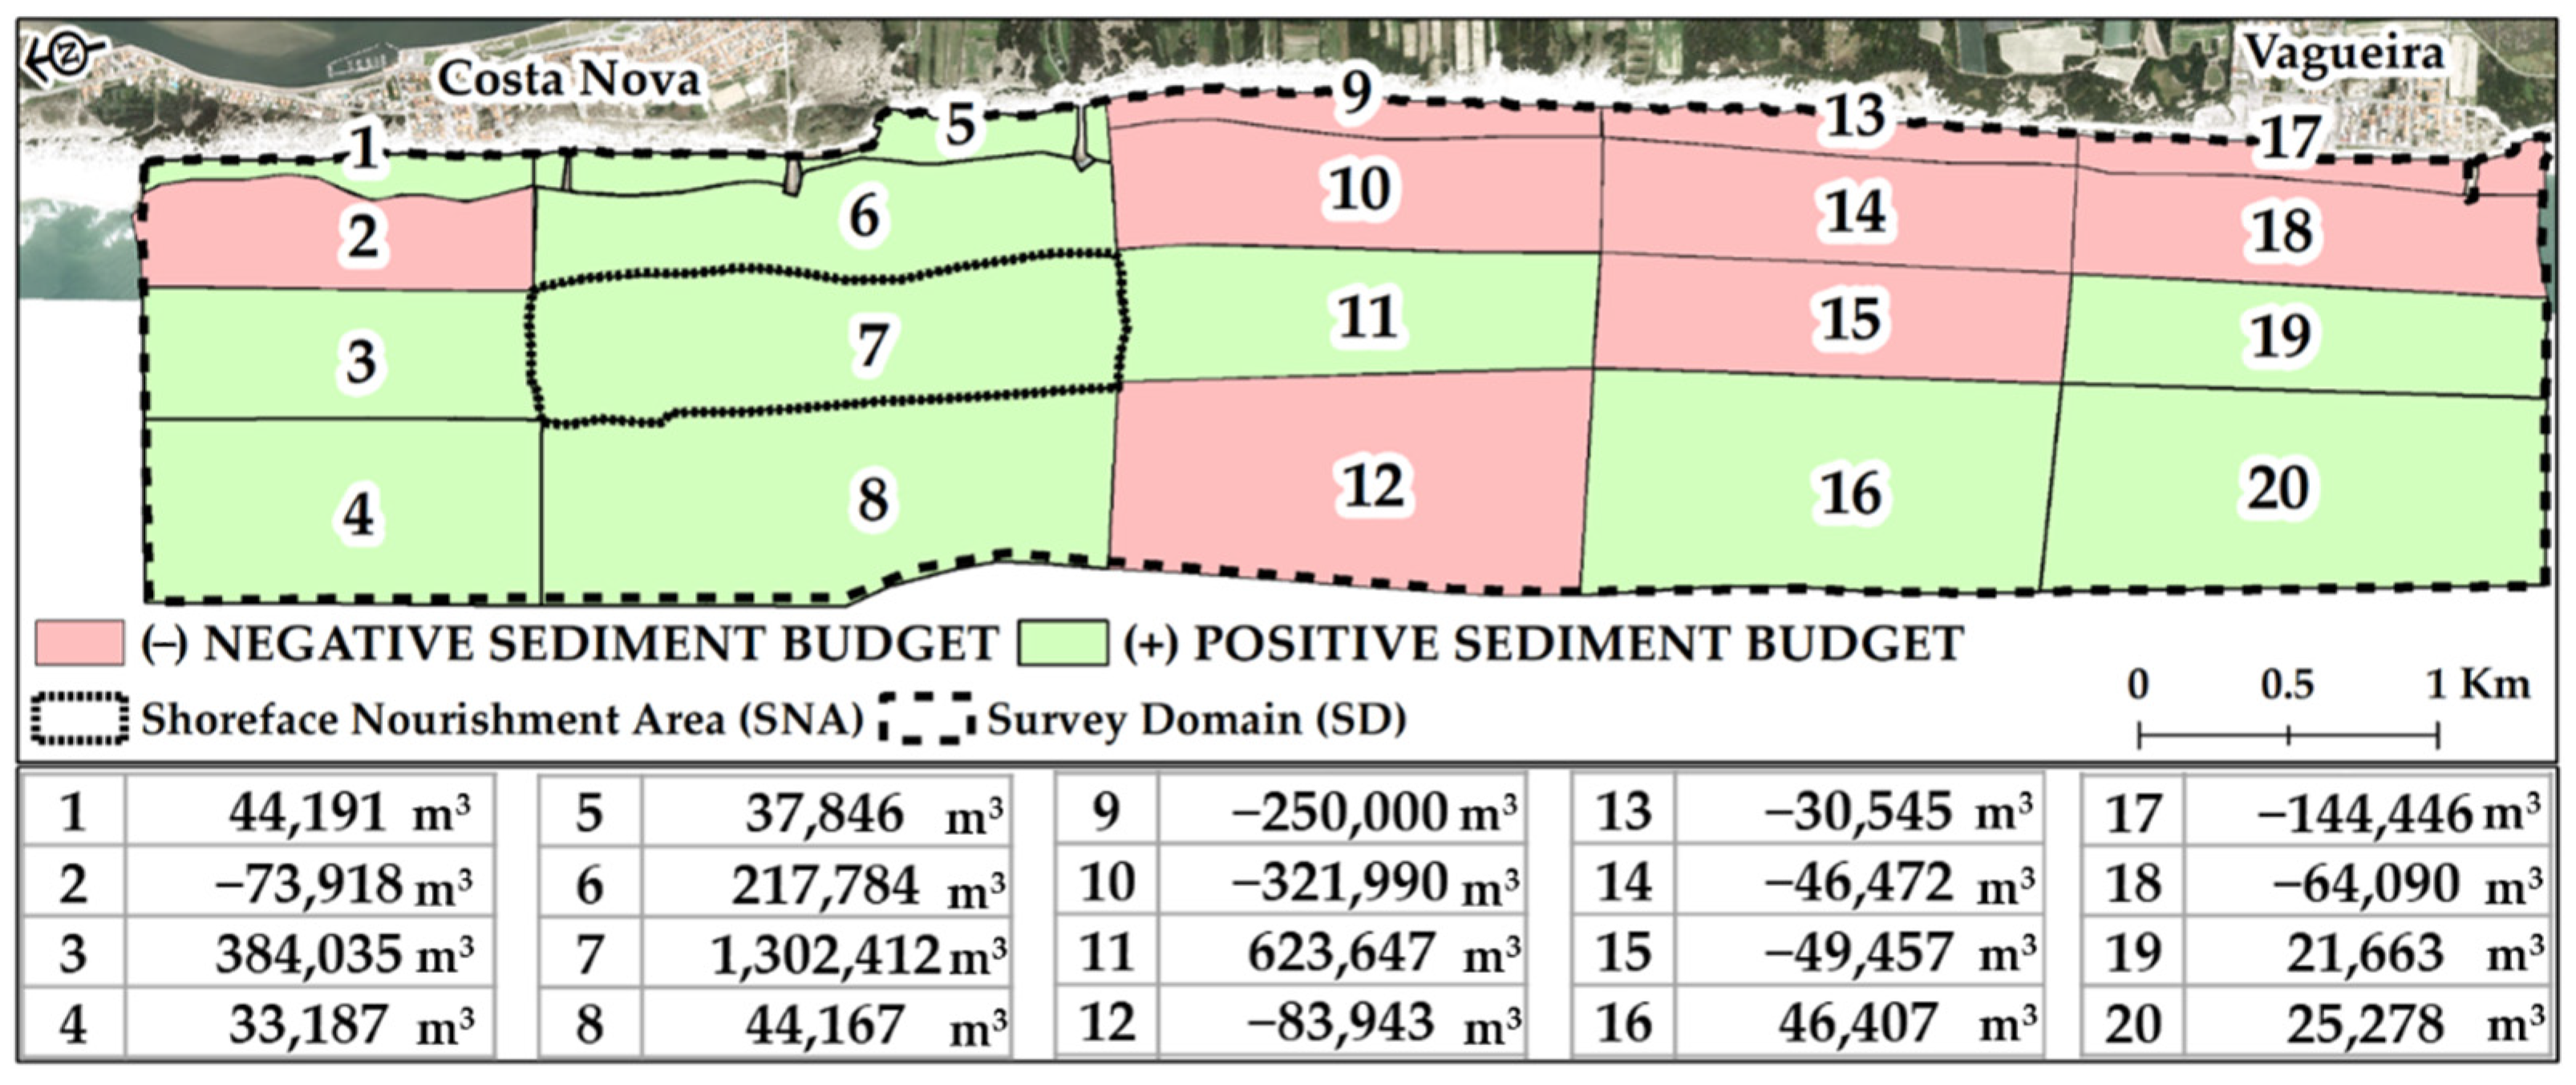
The Multiple Monitoring Cell (MMC) approach was applied to SD by splitting this area in twenty rectangular cells, organized in four cross-shore rows and five longshore columns, as illustrated in
Figure 10. Cross shore rows broadly correspond to the following domains: (i) subaerial beach; (ii) bar system; (iii) depth range of SNA; (iv) depth range between seaward boundary of SNA and offshore limit of SD.
Results shown in
Figure 10 indicate that seven months after the nourishment, the SNA (cell 7) retained 1.3 × 10
6 m
3 (60% of the dumped volume).
Cells 5, 6, 7, and 8 present a positive sediment budget in the entire beach domain, comprising the dry-beach and nearshore up to −10 m CD. South of SNA, namely, in cells 9, 10, 13, 14, 17, and 18, concentrated landward of −4 m CD (in the inner surfzone), they all have a negative sediment budget.
Within the survey domain (SD), the June 2020 to March 2021 sediment budget is positive, and of 1.73 × 10 6 m3. Considering that an additional volume of 295,000 m3 (September 2020 to March 2021) was added to the initial measured volume of 2.185 × 10 6 m3 (deposited between June 2020 and September 2020), a loss of 750,000 m3 (30 %) was observed in this period.
Regarding subaerial beach response to the nourishment in the adjacent beaches (i.e., Costa Nova) in front of the SNA and further south until Vagueira Beach,
Figure 11 shows the horizontal displacement of the + 1 m (CD) contour line, and its variation in terms of advance or retreat between June 2020 and March 2021.
Results presented in
Figure 11 confirm the above mentioned regarding subaerial beach variation, with a global positive net shoreline movement up to + 90 m within 0.5 km to the north and in front of the SNA. This trend changes further south, with a retreat of the +1 m contour line position, in average between −30 m to−60 m. The entire SD this contour line has an average displacement of + 9 m ± 44.5 m, which illustrates well the spatial variability of subaerial beach in response to the SN, because the standard deviation is much larger than the mean value.
5. Discussion
Herein, we describe the impacts of a high-magnitude shoreface nourishment in the morphological evolution and behaviour of a wave-dominated, high-energy beach–dune system. We add a sediment budget approach to previous work targeting the same area [
20]. This has improved the understanding of the processes governing post-nourishment sediment dispersion within the survey domain. In addition, we provide a more detailed description of cross-shore changes along the nourished profile and evaluate the time scale required for the beach to acquire a new equilibrium profile following the placement of a significant sand volume.
5.1. Cross-Shore Processes
Coastal monitoring data show that cross-shore changes occur rapidly, with short-term landward migration of the shoreface nourishment. Right after the intervention, the cross-shore shape of the sand mound skewed in onshore direction, by decreasing its seaward slope and increasing crest elevation, together with the formation of two bars that eventually merged with the pre-existing ones. Seven months after the intervention, the seaward slope of the SN is milder, more similar to the pre-construction native profile. This is interpreted as resulting from the dominance of onshore transport accompanied by progressive depletion of the sediment source at the seaward toe of the nourishment. This in agreement with observed post-nourishment profile responses in the Netherlands [
13] that required two to four years to replicate the native configuration, whereas the timescale inferred in this study is much smaller (up to seven months). Concomitantly, cross-shore processes induced rapid subaerial increase in beach volume and width in front of the placement area (Costa Nova beach), while the dune profile remained unchanged (
Figure 6 and
Figure 7).
The observed rate of morphological responses is interpreted as mirroring the energetic wave conditions offshore Costa Nova, which are higher than the ones verified in the Netherlands [
15] and California [
19], where similar changes occur at larger timescales.
The magnitude of beachface seaward translation, represented by changes in beach width (
Figure 6) measured between July 2020 and April 2021 is 76 m; the same estimate using October 2020 and January 2021 surveys is 60 m. These figures are in close agreement with the maximum seaward displacement (60 m) of the +3.05 m CD contour line observed between June 2020 and January 2021 in a nearby profile [
20]. Moreover, our data suggest that beachface progradation slowed down or ceased after March 2021 (cf.
Figure 7 for changes between March 2021 and September 2021). The magnitude of these changes is in close agreement with those yielded by solving Bruun’s Rule (ca. 67 m), under the assumption that dumped sediment has been redistributed solely by cross-shore processes, aiming at restoring the equilibrium profile (replicating Bruun’s equilibrium beach profile) up to the DoC. This similarity adds arguments to interpret earlier stages of post-nourishment morphodynamics as dominated by cross-shore processes. Following a convergence to the condition of equilibrium, additional increase in subaerial beach width is not expected.
5.2. Longshore Processes
The patterns of morphological changes illustrated in
Figure 7 and
Figure 8 indicate that a significant volume of sediment (≈ 600,000 m
3) accumulated immediately southward of the SNA (cell 11 in
Figure 10), suggesting that longshore currents over the shoreface nourishment fed the seaward slope of the pre-existing bar system. Feeding tends to fade out further southward (see
Figure 9 and
Figure 10), due to the combined effects of diffusion and low rate of advection characterizing longshore sediment transport.
The bar system and subaerial beach downdrift of the SNA show a spatially consistent pattern of erosion, with remarkably high values immediately south and landward of SNA (cells 9 and 10 in
Figure 10). This behaviour is interpreted by blockage or decrease in longshore drift landward of the SNA, induced by the “reef effect” of the dumped sand mound, as suggested by [
43]. Lower wave heights shoreward of the SNA due to wave dissipation reduces longshore sediment supply to the domain located immediately downdrift. Thus, a longshore drift gradient is created shortly after the intervention, leading to downdrift erosion. Smoothening of the morphological disturbance imposed by the nourishment will lead to the fading out of the “reef effect” and related erosive signal. These results suggest that subaerial domain of beaches facing and located downdrift the SNA are out of phase: while the former experience rapid accretion, the latter experience temporary enhanced erosion; this trend can only be reversed at larger time scales in tune with increasing importance of the longshore processes.
5.3. Sediment Budget and Nourishment Lifetime
Sediment budget calculations from June 2020 to March 2021 within the SD were based on the following assumptions:
- (i)
The seaward boundary was set seaward of the DoC and considered closed to sediment transport;
- (ii)
The landward boundary was set at the foredune toe in March 2021 and beach–dune sediment exchanges, as well as variations in coastline position, were considered negligible;
- (iii)
The northern boundary was located 1.5 km southward of the Aveiro inlet southern jetty. Sediment input through this boundary is unknown, but expected to be of smaller magnitude, in agreement with: (i) retention efficiency of the northern Aveiro jetty [
23] and outer shoals of the Aveiro inlet; (ii) local reversal of longshore drift direction over the domain between the northern boundary of SD and the southern jetty due to wave diffraction induced by the north jetty and refraction over the outer inlet shoals;
- (vi)
The southern boundary is coincident with the southern limit of SD and was considered open to sediment transport.
Data collected in this study indicate that between June 2020 and March 2021 the sediment budget of the SD was positive and of about1.73 × 10
6 m
3. Considering that the shoreface nourishment was the main sediment source to the SD, corresponding to 2.48 × 10
6 m
3, a loss of 0.75 × 10
6 m
3 can be inferred. As the southern SD limit is the only open boundary this figure should correspond to a rough estimate of net longshore drift at that location. This conclusion is further supported by the independent assessments of potential net longshore drift performed in the scope of this work and by [
22]. The former points to a value of 0.87 × 10
6 m
3 (cf.
Section 4.1 and
Figure 5) and the latter provides an estimate of 0.85 × 10
6 m
3, which was obtained by adding up June to March monthly averages of longshore drift magnitude over a twenty-year period. The agreement between the computed losses and the potential longshore drift provides confidence in the results of the sediment budget.
Linear extrapolation into the future of the mean annual net longshore drift indicates that, despite the large magnitude of this intervention, the permanence of placed sand within the SD is of 2–3 years.
High magnitude of littoral drift suggests that large scale and frequent (e.g., every other year) renourishment operations may be required if updrift sand placement is to be maintained as single adaptation strategy regarding beach erosion along the sediment cell, which extends for 50 km south of the Aveiro inlet. However, large uncertainties remain regarding the optimal design of shoreface nourishments, including not only magnitude and frequency, but also plan and cross-section shape of the sand mound. Altogether, these parameters govern morphodynamic feedback of the construction over wave forcing and potential impacts on the adjacent coast.
6. Conclusions
This work addresses the impacts of a high-magnitude shoreface nourishment in the morphological evolution and behaviour of a wave-dominated, high-energy beach–dune system. Results show that cross-shore processes dominate the early stages of morphological evolution with significant onshore sand transport. The beach aligned with the sand mound rapidly (in about seven months) acquires a condition of equilibrium, replicating Bruun’s equilibrium beach profile that corresponds to an increase in subaerial beach width.
Longshore transport of sediment sourced in the placement explains the intense growth of the downdrift adjacent bar system, which diffuses and fades out southward. At the subaerial beach southward of the SNA, longshore drift was temporarily influenced by the “reef effect” of the sand mound, enhancing the previous erosive trend. This trend is expected to reverse in time, as longshore processes gain relevance in net sediment transfers over the SD.
Observed rates of change at Costa Nova are significantly higher than the ones reported for similar interventions undertaken in lower wave energy coasts of the Netherlands and California. This highlights the importance of wave energy in regulating the timescale of coastal readjustment to large magnitude shoreface nourishments. In consequence, great caution should be exercised when extrapolating behaviour-based models to predict morphological evolution under conditions other than those for which they were developed.
Current coastal protection strategies define beach and shoreface nourishment as a standard procedure to mitigate coastal erosion in critical areas. This is considered as an adaptation measure under present climate change scenario, including sea level rise. New insights provided by this work are expected to support decision-making regarding similar high-magnitude interventions foreseen in other areas along the high-wave energy Portuguese western coast and elsewhere. This gains relevance considering that shoreface nourishments are much more cost-effective in replenishment of large sand volumes than traditional beach nourishments (≈half-price per m3).
Additionally, results of this study highlight the importance of nourishment design to optimize mitigation of beach erosion in high-magnitude drift-dominated coasts. Further investigation of morphodynamic feedback of shoreface nourishments over wave forcing and assessment of potential impacts on the adjacent coast is required.
Accurate and repeatable coastal monitoring data have proven to be essential to perform this evidence-based analysis, highlighting the need to maintain systematic coastal monitoring programmes through time, like the current Portuguese COaStal MOnitoring Program (COSMO).


 ,
, 


