Article

Estimation of LNG Dolphin Capacity: Dolphins of Different Size in Republic of Korea

1
Department of Distribution & Logistics, Tongmyong University, Busan 48520, Republic of Korea
2
Department of Global Business, Tongmyong University, Busan 48520, Republic of Korea
*
Author to whom correspondence should be addressed.
J. Mar. Sci. Eng. 2022, 10(12), 2031; https://doi.org/10.3390/jmse10122031
Submission received: 14 November 2022 / Revised: 12 December 2022 / Accepted: 13 December 2022 / Published: 19 December 2022
(This article belongs to the Special Issue Advances in Maritime Economics and Logistics)

Abstract

:
The LNG terminals are characterized by a large number of ships entering the port during the winter season due to the seasonality of rapidly increasing demand for heating. In winter, there is a shortage of dolphin jetty wharf (dolphins), which increases the waiting rate for ships. Therefore, there is a practical argument that dolphins should be additionally built to solve the ship standby problem. This study proposes the proper LNG handling capacity of a terminal with multiple dolphins of different size. Studies on calculating the LNG handling capacity of LNG terminal dolphins have been proposed by UNCTAD and Ministry of Transport of China (MTC). The formula-based calculation of LNG handling capacity has the advantage of being simple, but it has the disadvantage of not reflecting the actual operation. In this study, the proper LNG handling capacity is measured using a simulation method to overcome the limitations of formula-based calculation for Incheon port in South Korea. In order to check whether the method by simulation is justified, it is compared with the unloading capacity by the calculation formula. This study finds that the proper (or optimal) LNG handling capacity of Incheon port is determined by a dolphin occupancy of 49%, where the dolphin’s profits are maximized. As the results of simulation model, the proper (or optimal) loading capacity is 38.5 million m3 when dolphin occupancy is 49%. The capacity of individual dolphin is estimated at 17.0 million m3 for 70,000 DWT dolphin and 21.2 million m3 for 120,000 DWT dolphin, respectively. The main points of this study to use simulation model are as follows: First, the number of non-working days should be considered. Second, the optimal dolphin occupancy should be determined by finding the maximum profit point of using the pier. Third, if the size of the dolphin is different, an appropriate simulation will be implemented. Fourth, the data of the peak season should be analyzed. Finally, it should be checked whether the ship waiting rate is acceptable level or not.

1. Introduction

As liquefied natural gas (hereinafter referred to as LNG) is an eco-friendly fuel that can minimize global warming [1] by reducing emissions of 99% of sulfur oxides, 90% of nitrogen oxides, and 30% of carbon dioxide compared to conventional chemical fuels, its demand is rapidly increasing worldwide. The International Maritime Organization (IMO) also announces the carbon neutral policy for maritime sectors [2]. Following the IMO policy, global shipping companies are trying to switch traditional marine fuel for ships to LNG [3]. The rapid increase in population and economic growth in the Asian region led to a huge expansion in the amount of energy consumption. Specifically, China addresses the energy transition policy from coal to LNG [4]. Moreover, the improved LNG energy efficiency has increased its attractiveness compared to conventional petroleum fuels, and thus LNG demand is rapidly increasing worldwide [5].
Most of the LNG demands is high in the winter season because LNG is mainly used for heating. Thus, the number of incoming LNG ships increases during the winter season, so it feels like there is not enough LNG dolphin jetty wharf (hereinafter dolphin). In particular, when there is a difference in the size of dolphins, it is often perceived as a shortage due to inefficient allocation.
There are two ways to measure the LNG handling capacity. The first method is the formula-based calculation proposed by UNCTAD [6] and the Ministry of Transport of China (hereinafter MTC) [7]. This method has a problem in that the handling capacity is easily changed according to the value of the input variable. The method of applying a random value gives a significant error to the LNG handling capacity. The second method is the simulation using software program such as ARENA or GPSS. This method is being evaluated as a more practical method because it reflects the operation situation of the LNG terminal as mirroring [8]. Since LNG terminals are complex systems that are discrete, stochastic and dynamic, simulation methods are appropriate methods to find the optimal capacity [9].
This study proposes the proper LNG handling capacity by applying simulation method according to two different size dolphins in Incheon Port, South Korea. As of 2022, LNG import volumes of Republic of Korea are the third largest in the world, and Incheon Port handles the largest amount of Korean LNG import volumes. Thus, Incheon port is suitable for evaluating LNG dolphin capacity. In this study, a simulation model is used to overcome the limitations of the formula, and a method for calculating the proper LNG handling capacity is proposed. In addition, this study addresses the proper dolphin occupancy that maximizes dolphin profit by considering the proper waiting time.

2. Precedent Studies

The most widely used LNG capacity calculation formula is proposed by the MTC in 2016 [7]. This method is an extension of the UNCTAD standard [6] for calculating berth capacity, i.e., multiplying the number of ship turnover at terminal and average discharging value). This formula is a method of multiplying the annual turnover of a ship by the amount of cargo per ship. The turnover rate is calculated by multiplying the dolphin occupancy by 365 days as the annual dolphin available time. Here, the dolphin occupancy is 55–70%, which is arbitrarily determined in consideration of the situation. However, the formal model is applied under the assumption that the variables used in the formula are the same, thereby the expected capacity may be significantly different from the actual capacity.
The simulation method has been widely used to test unloading capacity of the port. Port optimization using simulation has great potential for port resource reservation and allocation [10]. Cimpeanu et al. (2017) argue that the simulation platform and underlying algorithms are adaptable to different conditions, allowing these progresses to be transferred into the wider context of optimizing, planning and investing in port activities [11]. The simulation model calculates the capacity by applying the variable values derived from the appropriate parameters reflecting the terminal characteristics based on the existing formula method [12]. Dragovic et al., (2016) indicate that the most popular simulation model in port operation is discrete-event simulation [13] and predict an actual terminal situation with high precision [14,15]. For a container terminal simulation study, Zhou et al. (2020) develop a simulation to optimize the yard allocation problem of the container terminal [16]. Sha et al. (2021) also presents a generic simulation model to determine the equipment mix for a container terminal [17].
LNG demands and terminal capacity are affected by government policy, port throughput and fuel consumption [18,19]. Thus, it is very important to calculate and evaluate the handling capacity of an LNG terminal. This capacity is related to the configuration of terminal equipment and the comprehensive production advantages of the terminal. Specifically, the handling capacity of an LNG terminal is related to the capacity of existing facilities and equipment and the operation and management strategy of the terminal. Therefore, it is complicated to accurately calculate the throughput of the terminal. As an LNG receiving terminal can be described as an example of a discrete, stochastic, dynamic and complex system, capacity evaluation can be explored through simulation methods to find the optimal capacity.
The prediction of LNG demands and handling capacity are mainly based on mathematical formula method [20,21]. Yu et al. (2021) propose LNG bunkering infrastructure optimization model based on geometric aggregation score calculation in line with mathematical formula method [22]. To simulate an LNG terminal, it is necessary to isolate the most important functions and create a conceptual (structural) model. In this regard, it is necessary to select an annual import target and install an LNG terminal to perform the basic tasks of the LNG terminal. A computer model must then be created to simulate the process in the LNG terminal model. Simulations can be performed for estimated and increased traffic and various terminal settings [8]. Park and Park (2019) simulated the capacity of LNG bunkering infrastructure based on demand in the future using ARENA simulation program [23]. They suggest that simulation modeling is useful for logically approaching complex ports that are difficult to calculate mathematically due to various variables and scenarios occurring in these ports and calculating proper capacity in terms of port logistics. Chae et al. (2021) predict LNG bunkering demands using artificial intelligence simulation that improves the accuracy of estimation [24]. Some LNG simulation studies focused on evaluating risk assessment [25,26] and filling process of storage tank [27].

3. Material and Methods

3.1. Formula

The formula for calculating unloading capacity of an LNG terminal is divided into two types depending on the difference in calculation method. The first is the UNCTAD calculation formula [6], and the second is the calculation formula presented by the MTC [28].
The elements that make up the UNCTAD formula are composed of the number of berths, effective berth occupancy ratio, annual terminal operating hours, and average throughput of ships per hour, presented in Equation (1).
Annual   berth   capacity   of   UNCTAD         = the   number   of   berths   ×   effective   berth   occupancy   ratio   ×   ( n u m b e r   o f   d a y s   p e r   y e a r         non   working   days ) × working   hours   per   day × annual   LNG   volume berthing   time   ( m 3 h )
In contrast, the MTC formula proposed in Equation (2) consists of the number of berths, berth occupancy ratio, number of days per year, working hours per day, total berthing time and LNG volume per ship.
Annual   berth   capacity   of   MTC         = the   number   of   berths   ×   effective   berth   occupancy   ratio   ×         × ( n u m b e r   o f   d a y s   p e r   y e a r × w o r k i n g   h o u r s   p e r   d a y ) ( uloading   time + unloading   assistance   time ( h ) + extra   time ( h ) )         × LNG   volume   per   ship   ( m 3 )
To summarize the comparison between the two methods, the UNCTAD method is obtained by multiplying the annual working hours considering the effective berth occupancy rate by the unloading amount per hour, while the MTC method is calculated by multiplying the average cargo volume per ship by the number of ships entering the port per year.
In order to develop the simulation model, it is necessary to understand the elements constituting the simulation first. Deriving a more realistic method from the above two methods, an equation that divides the annual working hours considering the effective berth occupancy by the sum of the unloading time, and then the unloading auxiliary time and multiplies the average unloading amount per ship considering the seasonal peak is proposed [29].
Referring to peak factor, LNG cargo has a distinct seasonality. In the winter season, from December to February, the demand of LNG is concentrated on the season. Therefore, it is necessary to consider the peak season to calculate the exact capacity of the LNG dolphin. Accordingly, the target period of the parameters shown through data analysis, such as the number of annual unloading days, unloading time per ship, unloading assistance time, non-working days, and average cargo volume per ship, should be based on the peak months.
There is an issue regarding the application of the number of dolphins when calculating the cargo handling capacity. Generally, if two dolphins are applied when calculating the cargo handling capacity, it is assumed that the size of the dolphins is the same. However, in this case, the formula needs to be modified to consider the different sizes of 75,000-ton dolphins and 127,000-ton dolphins in each terminal (Equation (3)).
C t = ( T m 1 T n w 1 ) × A ρ 1 × t d 1 ( t s 1 + t f 1 ) × F × G 1 + ( T m 2 T n w 2 ) × A ρ 2 × t d 2 ( t s 2 + t f 2 ) × F × G 2   ( T m n T n w n ) × A ρ n × t d n ( t s n + t f n ) × F × G n   t s = G P
The Equation (3) is applied to verify the capability by simulation. The input variable values to be applied to the formula are shown in Table 1 below.
In the above Equation (3), T m is applied for 365 days, but the number of non-working days ( T n w ) depends on the circumstances of the terminal. Non-working time due to typhoon, heavy rain, heavy snow, fog, etc. is derived from past data and applied by subtracting it from the annual working time. t f is time required unloading assistance. It is defined as the sum of times that occurs after the ship enters port and before the unloading operation, and the time that occurs after the completion of unloading and until the pilot transfers. The unloading assistance time is divided into pre-processing time and post-processing time. The pre-processing time consists of piloting time—mooring time—CIQ inspection time—arm connection time—arm cooling time. The post-processing time consists of unloading end—arm separation—CIQ time—departure pilot time.
According to LNG terminal regulation by Korea Gas Corporation (hereinafter KOGAS), ship’s Master shall [30], in principle, refrain from berthing under the following weather condition. ① During night, but night berthing or unberthing are permitted in case of emergency ② wind velocity in the port exceeds 15 m/s. ③ wave height in the port exceeds 1.2 m ④ when visibility is less than one nautical mile ⑤ When warning of strong winds and/ or high waves or thunderstorm warnings are issued or wind velocity at berth exceeds 30 knots (15 m/s), a shore responsible person (Dock Master) shall consult with Ship’s Master about continuation of the discharge. In practice of Incheon Port, there are 53 days a year when work is impossible due to wind speed, tidal currents and bad weather. [30].

3.2. Simulation Process

A simulation-based optimization approach is able to solve an integrated handling problem for unloading operations [9]. Using ARENA simulation program, a simulation model in this study carried out in 5 steps similar to previous studies [23,31]. The first is to analyze the unloading process of the ship in the dolphin, and the second is to define input and output variables. The detailed process defined in the simulation model is as follows.
Step 1: Arrival of ship (create ship): Create a ship according to the distribution of the ship arrival time interval. The ship arrival time interval is the difference in arrival time of two consecutive ships in the order of call. Ship arrival time is recorded in notice of readiness (NOR) which is kept by LNG terminal operation company.
Step 2: Setting the ship’s properties, that is the cargo carrying capacity for each ship. The LNG capacity of each ship is set according to the volume of LNG volume, because the ship carries full capacity. The ratio of the number of ships in the class of ship size is used as the probability of selecting the size of the ship. Therefore, the amount of cargo for each ship is determined according to probability density function (PDF) in the class of ship size.
Step 3: Dolphin allocation and ship waiting. Arriving ship selects a dolphin where it is empty. If there is no empty dolphin, she waits until an available dolphin occurs. In a result, waiting queue occurs. The dolphin may be restricted from loading and unloading depending on the size of the ship. If a ship of 75,000 DWT or less enters the port, dock in an empty small dolphin. If this dolphin is in use, dock it with a 127,000-ton dolphin. Here, of course, the 127,000-ton dolphin must be empty. If a ship of 75,000 DWT or larger enters the port, dock in an empty 127,000-ton dolphin.
Step 4: Preparation of unloading, unloading and preparation for departure. We need to calculate the time for which the ship occupies the dolphin. The dolphin occupancy time is divided into unloading preparation, unloading, and preparation for departure after unloading. In addition, unloading work is further divided into time for rate-up, time for full speed, and time for rate-down. In the case of full speed, it is proportional to the amount of unloading.
Step 5: Departure of the ship upon completion of the work. Ships that have been serviced are to depart, and the ship process is completed. Finally, calculate the key performance indicators (KPI) for ships that have completed the simulation.

3.3. LNG Terminal Simulation Model

By entering the current operation situation and implementing the simulation, the occupancy rate, the number of waiting ships, and the waiting time of the ship can be obtained. That is, When the dolphin occupancy increases, the ship’s waiting rate increases in proportion to the increase whereas the ship’s waiting rate decreases when the ship’s occupancy decreases. This study uses a method for selecting dolphin occupancy that maximizes the dolphin’s profit. Dolphin revenue is the amount obtained by subtracting demurrage from facility rental revenue. The simulation model development process proceeds in five stages as follows: (1) process analysis, (2) probability distribution estimation through data analysis, (3) simulation model implementation, (4) model accuracy verification and (5) simulation performance.
The simulation model of the LNG terminal follows the basic procedure of ship entry—unloading—departure. If a ship enters port and there are no empty dolphins, it waits at the dolphin and docks when the dolphin is empty. Here, there is a variant of the procedure under the premise that there are dolphins with a scale of 75,000 DWT and with a scale of 127,000 DWT. The density of LNG is 450 kg per m3. When converted into volume, it becomes 166,667 m3.
When a ship of 75,000 DWT or less enters a port, the first thing is to find out if the small dolphin is empty. If the 75,000 DWT dolphin is empty, dock it, otherwise look for a 127,000-ton dolphin. If it is empty, it docks, and if it is working, it waits at the anchorage.
When a ship of 75,000 DWT or more enters the port, the ship immediately checks whether the 125,000-tons class dolphin is empty. If the 127,000 DWT dolphin is empty, it docks, otherwise it waits. In this case, there is only one soluble dolphin in a large ship. A procedures of simulation model for LNG dolphin is shown in Figure 1.

3.4. Input and Output Variables for Simulation

The simulation model consists of input variables and output variables. The input variable is expressed as a probability density function shown in Table 2. These are simulation period, terminal operating hours, the distribution of ship arrival time intervals, the distribution of cargo volume per ship according to ship size, and the classification ratio of ship size, dolphin service time and cargo handling productivity.
Output variables are indicators of simulation operation results, such as ship waiting rate, dolphin occupancy, number of ships entering port, and cargo throughput. Details of output variables are presented in Table 3.

4. Simulation Modeling and Results

4.1. Distribution of Ship Arrival Time Interval

Ship arrival time interval means the time elapsed from the arrival of a ship until the arrival of the next ship. The analysis data is based on the Notice of Readiness (NOR) data, which is most closely related to the arrival time of the ship among the calling schedule data [32,33]. In the case of Incheon port base, the arrival time interval of the ships should be calculated by considering the total ships that entered the two terminals together.
Arrival time intervals are based on peak months in winter when the number of incoming ships is high. Based on the performance data, the peak month is set as the number of ships increases or decreases during the winter season. Based on the data from 2019 to 2021, December to February are selected as peak months.
The inter-arrival time distribution of ships in Incheon terminal was plotted in Figure 2. In this study, the distribution with the lowest square error value is derived by using the ARENA Input Analyzer to estimate the probability distribution. The distribution of time-to-arrival is found to fit very well with the Erlang distribution, ERLA (26.8, 2). This is because the least square error among other distributions is 0.036. Reviewing the statistics of inter arrival time, the mean value of sample is 53.6 h with standard deviation 40.8 h. Maximum data value is 286 h while minimum data value is 0.1 h. The number of data points are 652 per 3 years.

4.2. Distribution of LNG Volume of Calling Ship

For the simulation, it is necessary to estimate the distribution of the ship’s unloading capacity that affects to allocate dolphin and the service time. Figure 3 shows the probability distribution function of unloading volume by 6 size classes. The reason for classifying LNG volume into detailed distributions is to allocate dolphin to be berthed according to the size of the cargo volume. The second reason is to reflect the unloading speed according to the size of the quantity.
The cargo volume of a ship entering port is determined by the size of the ship. In the case of Incheon Port, the LNG volume can be divided into 6 sections. This section is divided by the subject of the researcher based on the actual cargo volume.
Table 4 shows the distribution of the LNG capacity of the Incheon LNG Terminal port using the ARENA Input Analyzer. The smallest cargo volume is under 120,000 m3 and the largest is over 250,000 m3. The probability density function of the cargo volume for each section appears in various ways, such as Normal, Weibull, and Beta presented in Table 4.

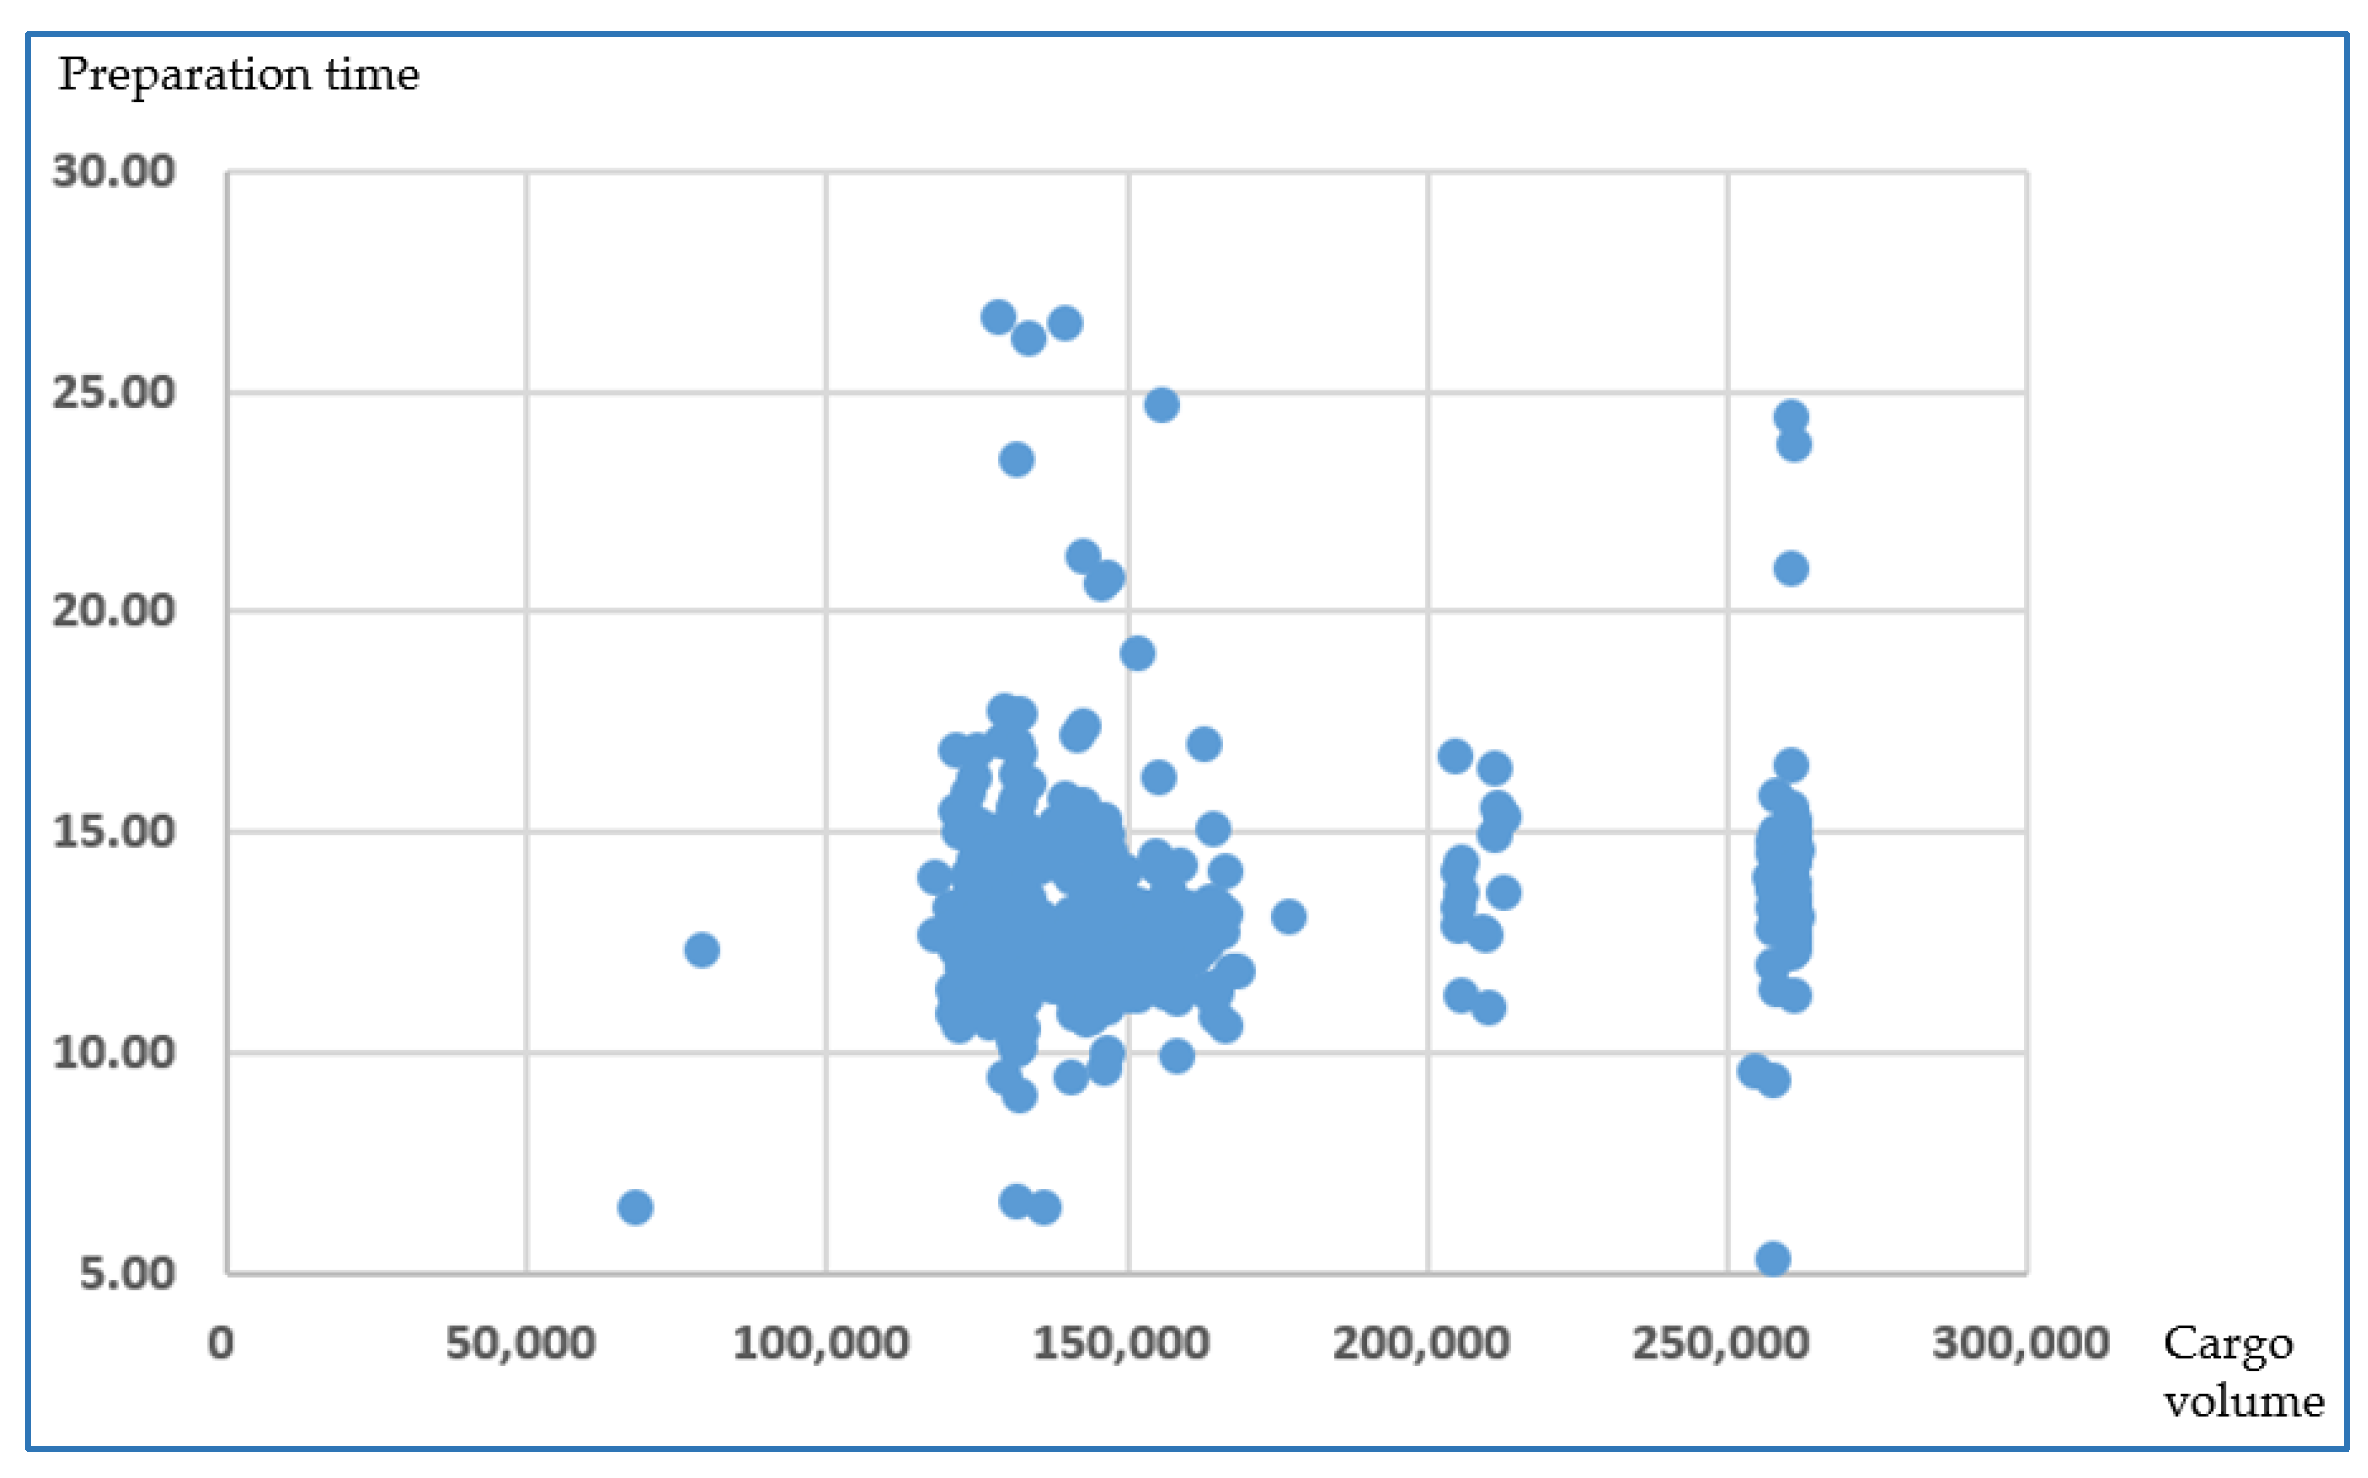
4.3. Distribution of Service Time of LNG Ship

Ship service time refers to the time required for a ship to prepare for unloading, during the unloading process, and in the process after completing the loading and unloading work. Estimating the required time for each process based on the ship schedule data is as follows:
  • Preparation time for unloading is calculated by subtracting start time of unloading from notice of readiness.
  • Unloading work time (full rate time) is calculated by subtracting end time of unloading from start time of unloading
  • Preparation time of ship departure is calculated by subtracting departure time of ship from end time of unloading
The full rate time during the unloading operation time is proportional to the loaded cargo volume as shown in Figure 4. As a result of analyzing 661 data for 3 years, the correlation coefficient between the cargo volume and the full rate time was found to be 72.7%.
As a result of analyzing 661 data for 3 years, the correlation coefficient between the cargo volume and the preparation time for unloading and for ship departure was found to be −0.1% as shown in Figure 5.

5. Standard Dolphin Occupancy in Incheon Port

5.1. The Relationship between Dolphin Occupancy and Ship Waiting Rate

The core of the model is to understand the relationship between dolphin occupancy and ship waiting rate. In general, when there are two dolphins, it is desirable to maintain the occupancy of the ships at 50% [8]. In the to-be model, the proper percentage of occupancy is determined by the ship waiting ratio. The issue here is to establish an acceptable ship waiting rate.
The relationship between the dolphin occupancy and the ship waiting rate by simulation is shown in Table 5. Since the demurrage cost of a ship is calculated by the waiting time, the number of waiting ships and the waiting time according to the dolphin occupancy should be calculated at the same time.
Figure 6 shows the graph of the ship waiting rate and the dolphin occupancy. Here, the ship waiting rate is the waiting rate based on the simulation, so it is necessary to supplement it. Finding the trend line gives the following formula y = 0.0002x2 + 0.001x + 0.163. Based on this, the method of finding the new ship waiting rate is used.

5.2. The Formula for Maximum Profit

The higher the waiting rate of the ship, the higher the demurrage fee paid by the shipper to the shipping company. The demurrage fee is set as a daily amount according to the charter contract between the shipper and the shipping company. This is calculated by multiplying the number of waiting ships, average ship waiting ship and daily demurrage (Equation (4)). Sensitivity analysis is displayed when daily demurrage rates change with market conditions.
On the other hand, the income for the dolphin usage fee is derived. This consists of a dolphin usage fee and a wharafge. According to the Korean government regulation [34], dolphin usage fee is calculated by multiplying the number of waiting ships and ship deadweight divided by 10. If the berthing time is less than 12 h, a berthing fee of USD 0.26 per ship is applied.
If berthing time is over 12 h, the berth excess usage fee of USD 0.021 per unit should be paid (Equation (5)). In Equation (6), Wharfage fee should be paid in barrel unit (USD 0.08 per unit) following the Korean government regulation [35].
By comparing their sum with the demurrage, the maximum profit is calculated by the difference between dolphin revenue and demurrage fee (Equation (7)). The formula for calculating the demurrage fee and wharfage is as follows:
D e m u r r a g e   f e e ( US )         = the   number   of   waiting   ships   ×   average   ship   waiting   time   ( hour )         × daily   demurrage   ( US $ ) 24 hours
Dolphin   usage   fee ( US $ ) = ( the   number   of   waiting   ships × DWT 10 × berth   usage   fee   ( US $ ) + ( the   number   of   waiting   ships × DWT 10 × ( ship   dolphining   time 12 hours ) × berth   excess   usage   fee ( US $ ) )
W h a r f a g e   f e e ( US )         = the   number   of   waiting   ships 0.45 ( conversion   ratio   between   DWT   and   kilo   litters ) 0.159 ( = kilo   litters   to   barrel ) × US wharfage   per   LNG   in   barrel
Dolphin   Profit ( USD   )         = Dolphin   revenue ( USD ) ( i . e . ,   dolphin   usage   fee + wharfage   fee ) demurrage   fee ( USD )

5.3. The Sensitivity Analysis for the Maximum Profit Considering Changing Demurrage

In this section, this study calculates the share with the maximum profit while changing the demurrage fee. Table 6 shows the relationship between dolphin occupancy and dolphin profit with demurrage of USD 40,000 per day using Equation (7). As dolphin occupancy increases, demurrage costs occur while the ship is waiting, and the shipper also pays demurrage costs to shipping company because the ship is tied to the berth. If the dolphin occupancy exceeds the proper level, it will cause a bottleneck of unloading, resulting in a sharp increase in demurrage.
When the dolphin occupancy exceeds 49% in the case, demurrage increases rapidly while dolphin revenue increases constantly. Figure 7 shows reverse U-shape between dolphin profit and dolphin occupancy. According to the analysis, the maximum profit of the dolphin is determined by the dolphin occupancy of about 49%. Terminal capacity considering an appropriate service level means terminal capacity when total service costs, such as ship/cargo waiting costs, are minimal [36,37]. Therefore, it can be suggested that dolphin occupancy of 49%, which maximizes dolphin profit, is the proper (or optimal) LNG handling capacity.
Table 7 and Figure 8 show the relationship between dolphin occupancy and dolphin profit with demurrage of USD 20,000 per day. If demurrage rates were lowered by 50%, Dolphin’s maximum profit would be a berth occupancy of 56%. Therefore, it suggests that the share of the berth that realizes the maximum profit changes as the demurrage fee changes.

5.4. The Dolphin Capacity by the Simulation

When the simulation program is completed, its reliability verification is required. Reliability verification compares actual operational data with simulation data. The ultimate goal of simulation is to represent phenomena as they are. The way to check whether the simulation accurately depicts the current situation is to compare the results of the simulation with the real data. In other words, it is to compare whether the number of incoming ships, cargo volume, and service time calculated as a result of the simulation are similar to the actual data.
The result of accuracy shows in Table 8 that the number of ships is 100% and the cargo volume is 99% for working days.
After the reliability verification of the simulation is completed, the input value of model is to be fixed. The model has the task of setting the proper berth occupancy to 50% which is proved in the previous section. Under current conditions, the berth’s occupancy averages 34%. In order to set 50% dolphin occupancy ratio, it is necessary to run the simulation on the premise that more ships arbitrarily enter the port. As a result, as the ship waiting ratio increases from 18% to 37%, the proper (optimal) loading capacity becomes 38.5 million m3.
The capacity of individual dolphins is estimated at 17.0 million m3 for 70,000 DWT dolphins and 21.2 million m3 for 120,000 DWT dolphins. Total capacity of two dolphins is 39 million m3. The occupancy ratio and ship waiting rate is 32% and 18.3%, respectively, for small dolphins and 37% and 18.5%, respectively, for large dolphins.

6. Conclusions

Due to the global trend of pursuing sustainable development and eco-friendly energy sources, LNG is considered the most ideal fuel as a ‘bridge energy’. In line with this international trend, major port authorities are promoting the construction of LNG-only ports, but the proper methods and standards for estimating LNG capacity are unclear. This study presents a generic simulation model to estimate and determine the proper LNG capacity. Korea is the world’s third largest LNG importer as of 2022, and is suitable as a simulation target for this study. In particular, the Incheon port handles most of the LNG imports, thus the generalization of the simulation model can be justified.
Methods for measuring the LNG handling capacity are a formula and a simulation method. The formula method has a problem that the processing capacity is easily changed according to the value of the input variable, whereas the simulation method can accurately calculate the handling capacity by depicting the terminal operation as in reality.
This study addresses that the following five points should be considered when defining simulation input variables. First, the number of non-working days should be considered. Second, the optimal dolphin occupancy should be determined by finding the maximum profit point of using the dolphin. Third, if the size of the dolphin is different, an appropriate simulation will be implemented. Fourth, the data of the peak season should be used for input variable. Finally, it should be checked whether the ship waiting rate is at an acceptable level.
Using input variable of simulation, this study finds that the proper (or optimal) LNG handling capacity is determined by a dolphin occupancy of 49% in applying USD 40,000 demurrage per day, where the dolphin’s profits are maximized. As the results of simulation model, the proper (optimal) loading capacity is 38.5 million m3 when dolphin occupancy is 49%. The capacity of individual dolphin is estimated at 17.0 million m3 for 70,000 DWT dolphin and 21.2 million m3 for 120,000 DWT dolphin, respectively. However, the share of berths that realize maximum profit changes according to fluctuate in demurrage.
This study contributes to the estimation of proper LNG handling capacity in several ways. First, extant studies focus on container terminal operation and optimization as well as LNG bunkering with only a limited number of studies addressing LNG terminal. This study proposes a rational method for estimating the cargo handling capacity of an LNG terminal. Second, the formula for calculating the LNG handling capacity is the most widely used by the MTC. However, the formula has a limitation in that the LNG handling capacity is calculated by applying a simple variable value. Therefore, it is necessary to apply a simulation model for more accurate calculation of the LNG handling capacity.
Although the unloading process of LNG dolphin is a typical queuing system, probability distribution or basic assumptions may violate the existing queuing assumptions. This study proposes the proper LNG unloading capacity by applying the LNG terminal operation to reality through a simulation method. This is an application of our techniques to a specific problem without making the acquisition too grandiose. Therefore, the results obtained in this study are statistical and analysis allows selection of the optimal settings for the LNG terminal capacity.

Author Contributions

All authors equally contributed to the empirical analysis and writing. N.K.P. contributed to the overall idea, data collecting, and analyzing of this study. Y.A. contributed to analyzing, writing, and reviewing of this study. All authors have read and agreed to the published version of the manuscript.

Funding

This research received no external funding.

Institutional Review Board Statement

Not applicable.

Informed Consent Statement

Not applicable.

Data Availability Statement

Not applicable.

Conflicts of Interest

The authors declare no conflict of interest.

References

  1. Lindstad, E.; Eskeland, G.S.; Rialland, A.; Valland, A. Decarbonizing maritime transport: The importance of engine technology and regulations for LNG to serve as a transition fuel. Sustainability 2020, 12, 8793. [Google Scholar] [CrossRef]
  2. IMO. Studies on the Feasibility & Use of LNG as a Fuel for Shipping. 2016. Available online: https://greenvoyage2050.imo.org/wp-content/uploads/2021/01/STUDIES-ON-THE-FEASIBILITY-AND-USE-OF-LNG-AS-A-FUEL-FOR-SHIPPING-.pdf (accessed on 11 November 2022).
  3. Hüffmeier, J.; Johanson, M. State-of-the-Art Methods to Improve Energy Efficiency of Ships. J. Mar. Sci. Eng. 2021, 9, 447. [Google Scholar] [CrossRef]
  4. Ahad, A.-E.; Eric, C.O.; Yusuf, B.; Tareq, A.-A. A review of cleaner alternative fuels for maritime transportation. Energy Rep. 2021, 7, 1962. [Google Scholar]
  5. Wan, C.P.; Yan, X.P.; Zhang, D.; Yang, Z.L. A novel policy making aid model for the development of LNG fueled ships. Transp. Res. A Policy Pract. 2019, 119, 29. [Google Scholar] [CrossRef]
  6. UNCTAD. Port Development: A Handbook for Planners in Developing Countries; UN (United Nations): New York, NY, USA, 1985. [Google Scholar]
  7. KOGAS. The 13th Long-Term Natural Gas Supply and Demand Plan and the Review of LNG Handling Capacity; KOGAS (Korea Gas Coroporation): Daegu, Republic of Korea, 2018. [Google Scholar]
  8. Park, S.K.; Park, N.K. A study on the estimation model of the proper cargo handling capacity based on simulation in port-port cargo exclusive pier example. J. Korea Inst. Inf. Commun. Eng. 2013, 17, 2454. [Google Scholar]
  9. Dundović, Č.; Basch, D.; Dobrota, Đ. Simulation method for evaluation of LNG receiving terminal capacity. Promet-Traffic Transp. 2009, 21, 103. [Google Scholar] [CrossRef]
  10. Arango, C.; Cortés, P.; Muñuzuri, J.; Onieva, L. Berth allocation planning in Seville inland port by simulation and optimisation. Adv. Eng. Inform. 2011, 25, 452. [Google Scholar] [CrossRef]
  11. Cimpeanu, R.; Devine, M.T.; O’Brien, C. A simulation model for the management and expansion of extended port terminal operations. Trans. Res. Part E Log. Trans. Rev. 2017, 98, 105. [Google Scholar] [CrossRef] [Green Version]
  12. Zeng, Q.C.; Yang, Z.Z. Integrating simulation and optimization to schedule loading operations in container terminals. Comp. Oper. Res. 2009, 36, 1935. [Google Scholar] [CrossRef]
  13. Dragović, B.; Tzannatos, E.; Park, N.K. Simulation modelling in ports and container terminals: Literature overview and analysis by research field, application area and tool. Flex. Serv. Manuf. J. 2017, 29, 4. [Google Scholar] [CrossRef]
  14. Legato, P.; Mazza, R.M. Berth planning and resources optimisation at a container terminal via discrete event simulation. Eurp. J. Oper. Res. 2001, 133, 537. [Google Scholar] [CrossRef]
  15. Canonaco, P.; Legato, P.; Mazza, R.M.; Musmanno, R. A queuing network model for the management of berth crane operations. Comp. Oper. Res. 2008, 35, 2432. [Google Scholar] [CrossRef]
  16. Zhou, C.; Qitong, Z.; Haobin, L. Simulation optimization iteration approach on traffic integrated yard allocation problem in transshipment terminals. Flex. Serv. Manuf. J. 2021, 33, 663. [Google Scholar] [CrossRef]
  17. Sha, M.; Notteboom, T.; Zhang, T.; Zhou, X.; Qin, T. Simulation model to determine ratios between quay, yard and intra-terminal transfer equipment in an integrated container handling system. J. Int. Log. Trade 2021, 19, 1–8. [Google Scholar] [CrossRef]
  18. Wang, H. Research on LNG Refueling Station Site Selection Direction; Dalian Maritime University: Dalian, China, 2014. [Google Scholar]
  19. Wang, L. Research on the Development Forecast of Chongqing Marine LNG Bunkering Terminal Layout Planning. China Water Transp. 2014, 14, 279. [Google Scholar]
  20. Liu, Z. Research on Market Forecast of waterborne LNG Bunkering Station. Gas Heat 2020, 40, 24. [Google Scholar]
  21. Yang, Y. Planning Site Selection and Evaluation for Coastal Port LNG Fuel Power Ship Filling Station; Harbin Institute of Technology: Harbin, China, 2016. [Google Scholar]
  22. Yu, Y.-U.; Ahn, Y.-J.; Kim, J.-K. Determination of the LNG Bunkering Optimization Method for Ports Based on Geometric Aggregation Score Calculation. J. Mar. Sci. Eng. 2021, 9, 1116. [Google Scholar] [CrossRef]
  23. Park, N.K.; Park, S.K. A Study on the Estimation of Facilities in LNG Bunkering Terminal by Simulation—Busan Port Case. J. Mar. Sci. Eng. 2019, 7, 354. [Google Scholar] [CrossRef] [Green Version]
  24. Chae, G.-Y.; An, S.-H.; Lee, C.-Y. Demand Forecasting for Liquified Natural Gas Bunkering by Country and Region Using Meta-Analysis and Artificial Intelligence. Sustainability 2021, 13, 9058. [Google Scholar] [CrossRef]
  25. Vidmar, P.; Perkovič, M.; Gucma, L.; Lazuga, K. Risk assessment of moored and passing ships. Appl. Sci. 2020, 10, 6825. [Google Scholar] [CrossRef]
  26. Lee, H.; Choi, J.; Jung, I.; Lee, S.; Yoon, S.; Ryu, B.; Kang, H. Effect of parameters on vapor generation in ship-to-ship liquefied natural gas bunkering. Appl. Sci. 2020, 10, 6861. [Google Scholar] [CrossRef]
  27. Wei, G.; Zhang, J. Numerical study of the filling process of a liquid hydrogen storage tank under different sloshing conditions. Processes 2020, 8, 1020. [Google Scholar] [CrossRef]
  28. Ministry of Transport. Design Code for LNG Terminals; Ministry of Transportation of P.R.C.: Beijing, China, 2016. [Google Scholar]
  29. Park, N.K. The Establishment of Standards for Calculating the Scale of Cargo Handling Facilities in LNG Terminal; KOGAS (Korea Gas Coroporation): Daegu, Republic of Korea, 2020. [Google Scholar]
  30. KOGAS. The Port Information and Terminal Regulations of Incheon LNG Terminal; KOGAS (Korea Gas Coroporation): Daegu, Republic of Korea, 2022. [Google Scholar]
  31. Park, N.K.; Suh, S. The Analysis of Ship Waiting in Oil Terminal by Simulation: The Case of Gwangyang Port. J. Fish. Mar. Sci. Edu. 2018, 30, 1891. [Google Scholar] [CrossRef]
  32. Park, N.K. Ship-berth link performance evaluation: Simulation and analytical approaches. Marit. Policy Manag. 2006, 33, 281. [Google Scholar]
  33. Kia, M.; Shayan, E.; Ghotb, F. Investigation of port capacity under a new approach by computer simulation. Comput. Ind. Eng. 2002, 42, 533. [Google Scholar] [CrossRef]
  34. Ministry of Oceans and Fisheries. A Standard Construction Criteria for Port; MOF (Ministry of Ocean an Fisheries): Seoul, Republic of Korea, 2005. [Google Scholar]
  35. Ministry of Oceans and Fisheries. A Study on Recalculation of Proper Port Loading Capacity; MOF (Ministry of Ocean an Fisheries): Sejong, Republic of Korea, 2020. [Google Scholar]
  36. Park, N.K.; An, Y. Financial Analysis of Automated Container Terminal Capacity from the Perspective of Terminal Operating Company. J. Mar. Sci. Eng. 2020, 8, 954. [Google Scholar] [CrossRef]
  37. An, Y.; Park, N. Economic Analysis for Investment of Public Sector’s Automated Container Terminal: Korean Case Study. J. Mar. Sci. Eng. 2021, 9, 459. [Google Scholar] [CrossRef]
Figure 1. Simulation Model for LNG Dolphin.
Jmse 10 02031 g001
Figure 2. Distribution of ship arrival time interval of Incheon terminal.
Jmse 10 02031 g002
Figure 3. Distribution of LNG volume of calling ships.
Jmse 10 02031 g003
Figure 4. Regression analysis of cargo volume and full rate time.
Jmse 10 02031 g004
Figure 5. Regression analysis of cargo volume and preparation time.
Jmse 10 02031 g005
Figure 6. Dolphin occupancy and ship waiting ratio.
Jmse 10 02031 g006
Figure 7. Dolphin profit and occupancy with USD 40,000 demurrage per day.
Jmse 10 02031 g007
Figure 8. Dolphin profit and occupancy with USD 20,000 demurrage per day.
Jmse 10 02031 g008
Table 1. Dolphin occupancy and ship waiting ratio.
NotationDescriptionValue in the Case
T m Number of operating days per year365 days
T n w Number of non-working days per month53
A ρ Proper dolphin occupancy in consideration of dolphin cost and dolphin revenue50%
t d Number of day and night hours24 h
t s Time required to unload cargo per shipSmall dolphin 14.1 h. Large dolphin 16.6 h
t f Time (h) for unloading assistance operationsSmall dolphin 10.1 h. Large dolphin 9.8 h
G Unloading volume per ship (m3)Small dolphin 132,632 m3, Large dolphin 167,056 m3
N 1 .. n Number of dolphinsOne small dolphin and
One large dolphin in the case
F Peak factor for winter season1.13
C t Annual proper capacitySmall dolphin 18,174,000 m3, Large dolphin 20,958,000 m3, Total capacity 39.0 million m3
Table 2. Input variables for the simulation model.
VariableDescriptionUnit
Simulation Period:
Working Days
Working days per year
(=365 days-non-working days)
days
Ship ArriveShip arrival time intervalProbability distribution
TPC RatioProbability of generating cargo volumeRatio
TPCUnloading volume by ship size (classified into 6 groups from 130 K to 260 K)Probability distribution
Dolphin Service TimeUnloading work time + Unloading auxiliary timeProbability distribution
Standard—Dolphin OccupancyProper dolphin occupancy for calculating capacityRatio
Table 3. Output variables for the simulation model.
VariableDescriptionUnit
Ship Waiting Ratio S W R = Number   of   waiting   ships Number   of   calling   ships Ratio
Dolphin Occupancy D O = Occupied   tim   in   dolphin Available   time   in   dolphin Ratio
Dolphin ThroughputAnnual dolphin throughputm3
Dolphin Calling ShipsNumber of calling ship per dolphin-
Dolphin CapacityAnnual unloading capacity per dolphinm3
Table 4. Distribution of LNG volume of calling ship.
LNG Volume (m3)RatioProbability Density Function
Under 130,0000.17NORM (1.25 × 10⁵, 2.48 × 10³)
~135,0000.341.31 × 105 + WEIB (1.12 × 10⁵, 1.71)
~150,0000.181.35 × 105 + 1.48 × 10⁵ * BETA (1.71, 1.39)
~200,0000.121.5 × 105 + 1.8 × 10⁴ * BETA (1.12, 1.25)
~250,0000.032.05 × 105 + 8.08 × 10³ * BETA (0.34, 0.37)
Over 250,0000.162.54 × 105 + 7.35 × 10³ * BETA (2.06, 0.698)
Table 5. Dolphin occupancy and ship waiting ratio.
Dolphin OccupancyNumber of Berthed
Ships
Ship Waiting Time (Hours)The Number of Waiting ShipsShip Waiting Rate
30%1699.22515%
31%1739.62615%
32%18211.93318%
33%18812.33418%
34%19112.13619%
35%20013.23819%
36%20313.23819%
37%20512.73417%
38%21414.14119%
39%22413.05123%
40%22413.84520%
41%23114.04519%
42%23614.34720%
43%23814.64720%
44%24514.55020%
45%24714.05522%
46%25614.46726%
47%26115.76625%
48%26715.67227%
49%27715.97627%
50%27916.08330%
51%28715.08730%
52%28815.19031%
53%29417.09332%
54%29816.29532%
55%30114.410033%
56%31015.310333%
57%31317.811737%
58%31717.111436%
59%32416.312037%
60%32718.014243%
Table 6. Dolphin profit and occupancy with USD 40,000 demurrage per day.
Dolphin OccupancyDemurrage
(1)
Dolphin Usage Fee
(2)
Wharfage Fee
(3)
Dolphin Revenue
(4) = (2) + (3)
Dolphin Profit
(5) = (4) − (1)
30%383,333946,8421,891,4442,838,2852,454,952
31%416,000969,2521,936,2112,905,4642,489,464
32%654,5001,019,6762,036,9393,056,6152,402,115
33%697,0001,053,2912,104,0913,157,3832,460,383
34%726,0001,070,0992,137,6673,207,7662,481,766
35%836,0001,120,5232,238,3953,358,9182,522,918
36%836,0001,137,3312,271,9713,409,3012,573,301
37%846,6671,148,5362,294,3553,442,8912,596,224
38%963,5001,198,9592,395,0823,594,0422,630,542
39%1,147,5001,254,9862,507,0023,761,9882,614,488
40%1,196,0001,254,9862,507,0023,761,9882,565,988
41%1,236,6671,294,2042,585,3463,879,5502,642,883
42%1,287,0001,322,2172,641,3063,963,5232,676,523
43%1,338,3331,333,4222,663,6903,997,1122,658,779
44%1,522,5001,372,6412,742,0344,114,6742,592,174
45%1,516,6671,383,8462,764,4174,148,2632,631,597
46%1,608,0001,434,2692,865,1454,299,4152,691,415
47%1,727,0001,462,2822,921,1054,383,3872,656,387
48%1,872,0001,495,8982,988,2574,484,1552,612,155
49%1,908,0001,551,9243,100,1774,652,1012,744,101
50%2,053,3331,563,1293,122,5614,685,6902,632,357
51%2,175,0001,607,9503,212,0964,820,0472,645,047
52%2,265,0001,613,5533,223,2884,836,8412,571,841
53%2,635,0001,647,1693,290,4404,937,6092,302,609
54%2,565,0001,669,5793,335,2085,004,7872,439,787
55%2,400,0001,686,3873,368,7845,055,1712,655,171
56%2,626,5001,736,8103,469,5125,206,3222,579,822
57%3,471,0001,753,6183,503,0885,256,7061,785,706
58%3,249,0001,776,0293,547,8565,323,8842,074,884
59%3,260,0001,815,2473,626,1995,441,4462,181,446
60%4,260,0001,832,0553,659,7755,491,8301,231,830
Table 7. Dolphin profit and occupancy with USD 20,000 demurrage per day.
Dolphin OccupancyDemurrage
(1)
Dolphin Usage Fee
(2)
Wharfage Fee
(3)
Dolphin Revenue
(4) = (2) + (3)
Dolphin Profit
(5) = (4) − (1)
30%191,667 946,8421,891,4442,838,2852,646,619
31%208,000 969,2521,936,2112,905,4642,697,464
32%327,250 1,019,6762,036,9393,056,6152,729,365
33%348,500 1,053,2912,104,0913,157,3832,808,883
34%363,000 1,070,0992,137,6673,207,7662,844,766
35%418,000 1,120,5232,238,3953,358,9182,940,918
36%418,000 1,137,3312,271,9713,409,3012,991,301
37%423,333 1,148,5362,294,3553,442,8913,019,557
38%481,750 1,198,9592,395,0823,594,0423,112,292
39%573,750 1,254,9862,507,0023,761,9883,188,238
40%598,000 1,254,9862,507,0023,761,9883,163,988
41%618,333 1,294,2042,585,3463,879,5503,261,216
42%643,500 1,322,2172,641,3063,963,5233,320,023
43%669,167 1,333,4222,663,6903,997,1123,327,945
44%761,250 1,372,6412,742,0344,114,6743,353,424
45%758,333 1,383,8462,764,4174,148,2633,389,930
46%804,000 1,434,2692,865,1454,299,4153,495,415
47%863,500 1,462,2822,921,1054,383,3873,519,887
48%936,000 1,495,8982,988,2574,484,1553,548,155
49%954,0001,551,9243,100,1774,652,1013,698,101
50%1,026,667 1,563,1293,122,5614,685,6903,659,023
51%1,087,500 1,607,9503,212,0964,820,0473,732,547
52%1,132,500 1,613,5533,223,2884,836,8413,704,341
53%1,317,500 1,647,1693,290,4404,937,6093,620,109
54%1,282,500 1,669,5793,335,2085,004,7873,722,287
55%1,200,000 1,686,3873,368,7845,055,1713,855,171
56%1,313,2501,736,8103,469,5125,206,3223,893,072
57%1,735,500 1,753,6183,503,0885,256,7063,521,206
58%1,624,500 1,776,0293,547,8565,323,8843,699,384
59%1,630,000 1,815,2473,626,1995,441,4463,811,446
60%2,130,000 1,832,0553,659,7755,491,8303,361,830
Table 8. The accuracy of simulation system.
ItemCurrent StatusSimulation ResultAccuracy
Number of calling ships per year165165100%
Throughput per year (m3)26,890,00026,503,96099%
Average service time (hours)25.325.898%
Publisher’s Note: MDPI stays neutral with regard to jurisdictional claims in published maps and institutional affiliations.

