Article

An Integrated Approach to Assessing the Wave Potential for the Energy Supply of Ports: A Case Study

by
Victor Ramos
1,2,*,
Gianmaria Giannini
1,2,
Tomás Calheiros-Cabral
1,2,
Paulo Rosa-Santos
1,2 and
Francisco Taveira-Pinto
1,2
1
Department of Civil Engineering (FEUP), Faculty of Engineering, University of Porto, Rua Dr. Roberto Frias, s/n, 4200-465 Porto, Portugal
2
Interdisciplinary Centre of Marine and Environmental Research (CIIMAR), University of Porto, Avenida General Norton de Matos, s/n, 4450-208 Matosinhos, Portugal
*
Author to whom correspondence should be addressed.
J. Mar. Sci. Eng. 2022, 10(12), 1989; https://doi.org/10.3390/jmse10121989
Submission received: 4 November 2022 / Revised: 5 December 2022 / Accepted: 7 December 2022 / Published: 14 December 2022
(This article belongs to the Special Issue Wave, Tidal and Offshore Wind Energy Site Assessment and Monitoring)

Abstract

:
In recent years, seaports have faced increasing pressure to transition towards a low-carbon and more sustainable energy model. In this context, the exploitation of the local wave energy resource may appear as a promising alternative. Therefore, the objective of this work is to present a methodology to select the best WEC-site combination to supply the energy demands of ports. To illustrate this methodology, the Port of Leixões (Portugal) is used as a case study. For the selection of wave energy sites in port areas, the methodology proposes a detailed spatial characterisation of both the wave resource and marine uses. For the area of study, having considered the main marine uses (sediment disposal, biodiversity, aquaculture, recreational and navigation), two exploitable wave energy sites (Areas I and II) with average annual energy resources of 24 and 17 kWm 1 , respectively, were found. Next, the methodology proposes a techno-economic optimisation of WECs, based on the local wave conditions of Areas I and II, to minimise their associated Levelised Cost of Energy (LCoE). The results obtained confirm the effectiveness of the methodology, with the novel oCECO device, appearing as the most feasible option (with an LCoE of EUR 387.6/MWh) to exploit the wave potential in the surrounding areas of the port.

1. Introduction

Over the last decade, growing concerns regarding environmental pollution, climate change, and long-term sustainability of the fossil fuel-based energy model have prompted different climate and energy policies (e.g., Paris Agreement [1], 2030 Agenda for Sustainable Development [2] and EU’s Green Deal [3]), whose main goals are to foment a fair transition towards a sustainable and carbon-neutral economy.
As a consequence of these policies, seaports are subject to increasing pressure to reduce their environmental footprint and transition towards a low-carbon energy model while increasing their competitiveness [4]. Seaports are essential for global trade and economic growth since more than 80% of the world’s goods are transported by cargo vessels [5]. In addition to cargo handling, seaports may also house a large number of activities among which, passenger transportation, fishing, aquaculture and shipbuilding, stand out. As a result, seaports present high-energy demands, which as of to date are mainly fulfilled by means of fossil-fuel energy sources [6]. All these factors have turned seaports into significant sources of pollution, mainly in terms of noise, air/water contaminants [7] and greenhouse gas (GHG) emissions [8,9].
Therefore, port authorities are developing ambitious plans to reduce carbon emissions and environmental pollution (e.g., World Ports Sustainability Program [10]). In this sense, relevant ports such as Helsinki (Finland) [11], Busan (Korea) [12] and Houston (USA) [13] have already presented their action plans to achieve carbon neutrality in the 2035−2050 horizon. For this purpose, efficient energy use and electrification of port equipment and activities, including onshore power supply of vessels, become essential [6,14]. However, port electrification together with the expected growth of maritime transport will result in a significant increase in the energy requirements of ports [6,15], which must be fulfilled by renewable and/or low-carbon energy sources to achieve the above-mentioned sustainability and emission targets.
On these grounds, considering the convergence of marine resources, infrastructures and facilities available at seaports, Marine Renewable Energy (MRE) appears as a promising energy solution [16]. Among the different types of MRE sources, wave energy, which presents a large and globally diverse resource of roughly 2 TW [17], has attracted the greatest deal of interest from the port managing authorities [18]. Despite its large energy potential, wave energy has yet to reach commercial viability [19]. This fact is closely related to the low conversion efficiencies of most of Wave Energy Converter (WEC) technologies [20]. In addition, WECs commonly operate under very harsh marine conditions, jeopardising their structural integrity and increasing the difficulty in terms of logistics, deployment, operation and maintenance tasks [21]. As a result, wave energy presents values of Levelised Costs of Energy (LCoE) that can be up to ten times higher than other traditional renewable sources such as onshore wind and solar PV [22].
Nonetheless, for the specific case of seaports, the integration of certain types of WECs (e.g., Oscillating Water Columns (OWCs), Overtopping Devices (OTDs) and some Wave Activated Devices (WADs) [23]) within seaport structures (e.g., breakwaters, piers and jetties) could help those WEC concepts to increase their cost-competitiveness and, consequently, progress more rapidly towards commercialisation [18]. This approach presents several advantages. First of all, capital and construction expenditure could be shared between the breakwater and WEC [24]. Secondly, the breakwater could serve as a foundation and shelter for the WEC, improving as a result its reliability and operating life span [18]. Thirdly, the complexity and costs in terms of accessibility and maintenance are significantly lower than in the case of offshore wave farms [24]. Similarly, the difficulty and costs of the WEC-grid connection are highly reduced [25]. However, WEC-breakwater integration is not without downsides. On the one hand, not all breakwaters are suitable for WEC integration, which depends mainly on their location, orientation and typology [26]. On the other hand, the nearshore wave transformation processes could reduce significantly the available wave energy resource, in comparison with offshore locations [27]. Furthermore, the functionality of breakwaters, sheltering port areas from the action of the waves, cannot be compromised by the presence of WECs. Full-scale examples of WEC-breakwater integration are the OWCs of ports of Mutriku (Spain) [28] and Civitavecchia (Italy) [29], the overtopping device OBREC in the port of Naples (Italy) [30] and the Eco Wave Power hinged arm point absorber in Gibraltar [31]. In addition, extensive research has dealt with WEC-breakwater integration in different ports worldwide, addressing in detail relevant issues such as hydrodynamic and hydraulic performance enhancement of OWCs [32,33] and OTDs [34,35], respectively; PTO optimisation [36,37,38], wave loading distribution and structural integrity [39,40,41], economic and life-cycle environmental impact assessment [42,43] and hybridisation of OWC and OTD concepts [26,44].
Alternatively, WEC concepts such as attenuators, point absorbers and oscillating wave surge devices, which are not compatible for breakwater integration, could also increase their cost-competitiveness if they were to be deployed in the surrounding marine areas of seaports, to fulfil part of their energy demands. This approach also presents important advantages in comparison with traditional offshore wave energy farms. Among them, the vicinity between the generation and consumption points stands out [6]. Therefore, lower energy losses and costs of installation, operation and maintenance are expected, due to the reduced length of electric export cables and the simpler requirements in terms of mooring systems and farm accessibility [45]. Additionally, the presence of nearshore wave farms in the vicinity of seaports could help to mitigate damaging effects on coastal structures [46] and hazards such as erosion [47] and flooding [48]. Another possible positive outcome, which lies beyond the scope of this work and still requires extensive research, relates to the potential impacts of wave farm operation on harbour oscillations (induced by infragravity waves) that can create significant problems to ships moored inside the harbour [49,50,51] and cargo operations [52,53]. On the other hand, the main disadvantage of this approach are the potential disruptions with the large amount of maritime uses (navigation, fishing, aquaculture and recreational activities) that are concentrated in the vicinity of seaports, which could limit the sea-space availability for the installation of WECs [54]. Furthermore, nearshore processes such as wave breaking and seabed dynamics may jeopardise WEC’s operating lifespan [55]. Finally, it is worth mentioning that this approach could be also suitable for naturally sheltered ports, whose defence structures are not subject to intense wave action.
In this context, it becomes apparent that selecting the most appropriate WEC technology (e.g., OWC vs. OTD) and location of installation (breakwater-integrated vs. nearshore) to supply the energy demands of a particular port, depends on multiple factors, which include: (i) main port characteristics, considering its location, typology and orientation of coastal defence structures, energy consumption patterns and maritime activities in its jurisdiction and surrounding areas; (ii) available wave energy resource in the port and its vicinity areas [56]; (iii) WEC typology and performance in terms of energy production, capacity factor and capture width ratio [57]; and finally, (iv) WEC associated energy costs [42]. Previous research dealing with WEC integration in ports has mainly focused on selecting and optimising WEC technologies according to specific breakwater characteristics [24,58] and assessing the resulting annual energy production [59,60]. However, an integrated decision-making approach, which takes into account all the aforementioned factors, must be considered when planning the optimum WEC-site combination within seaports areas.
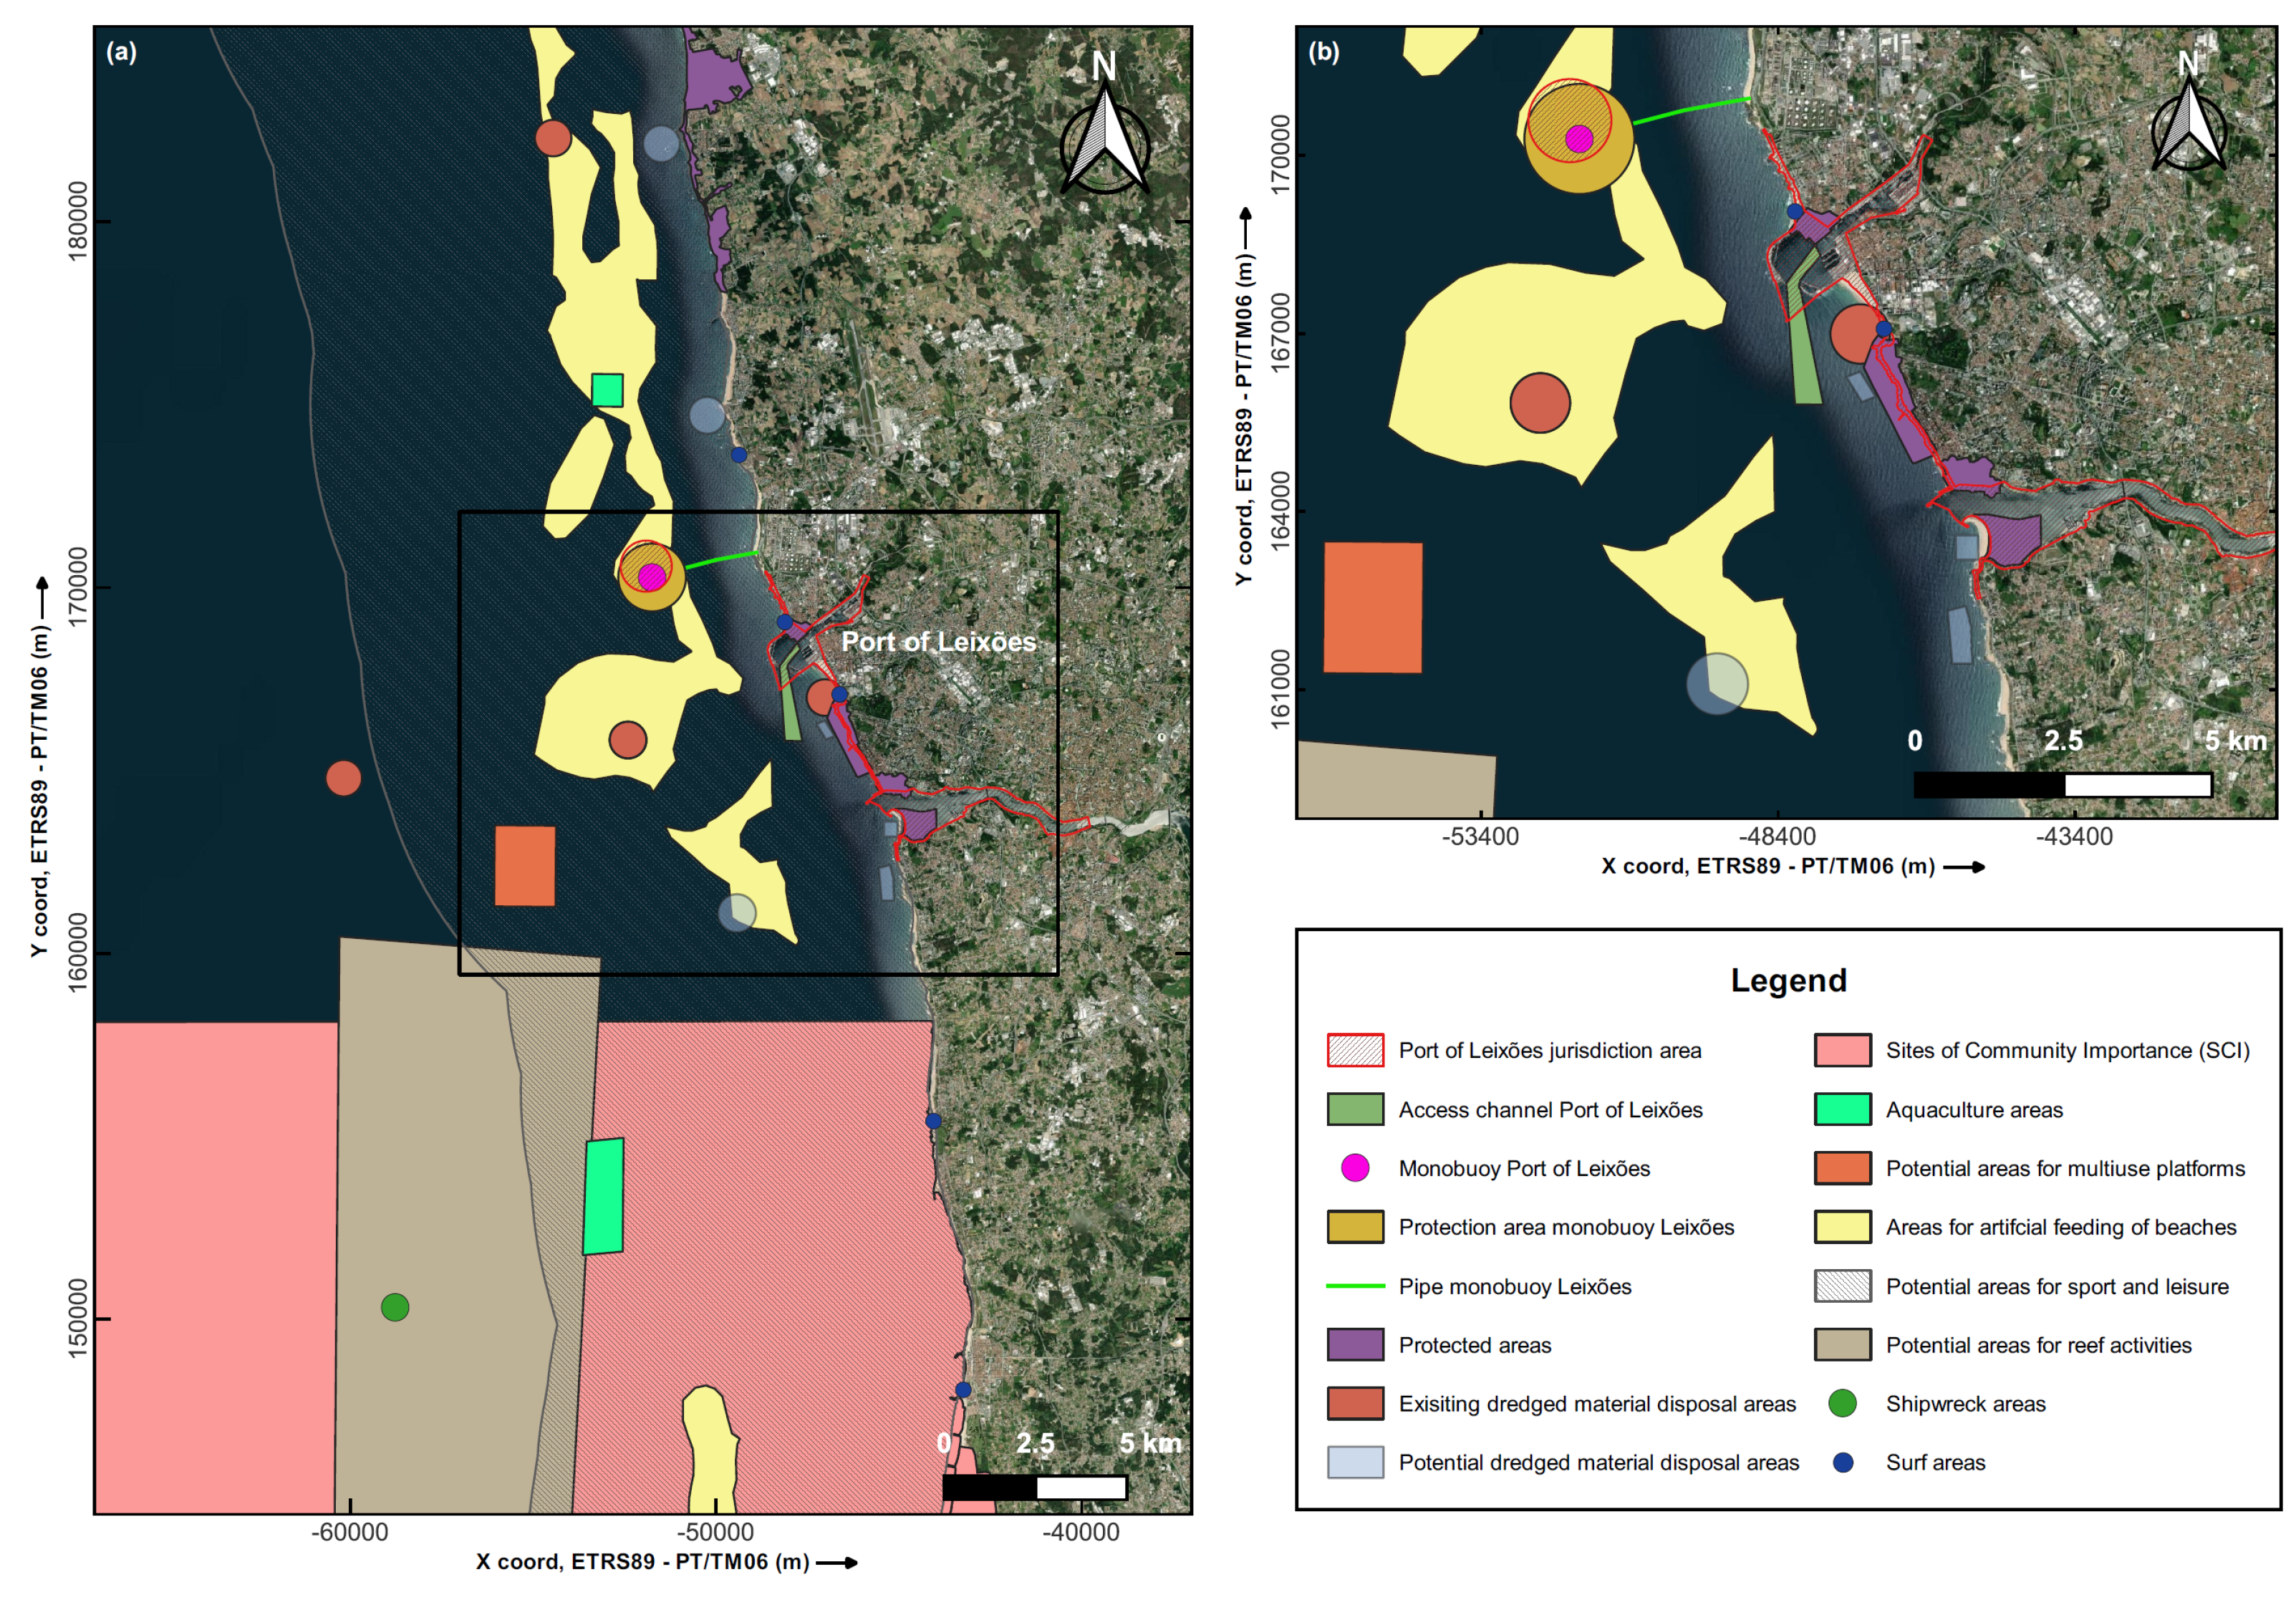
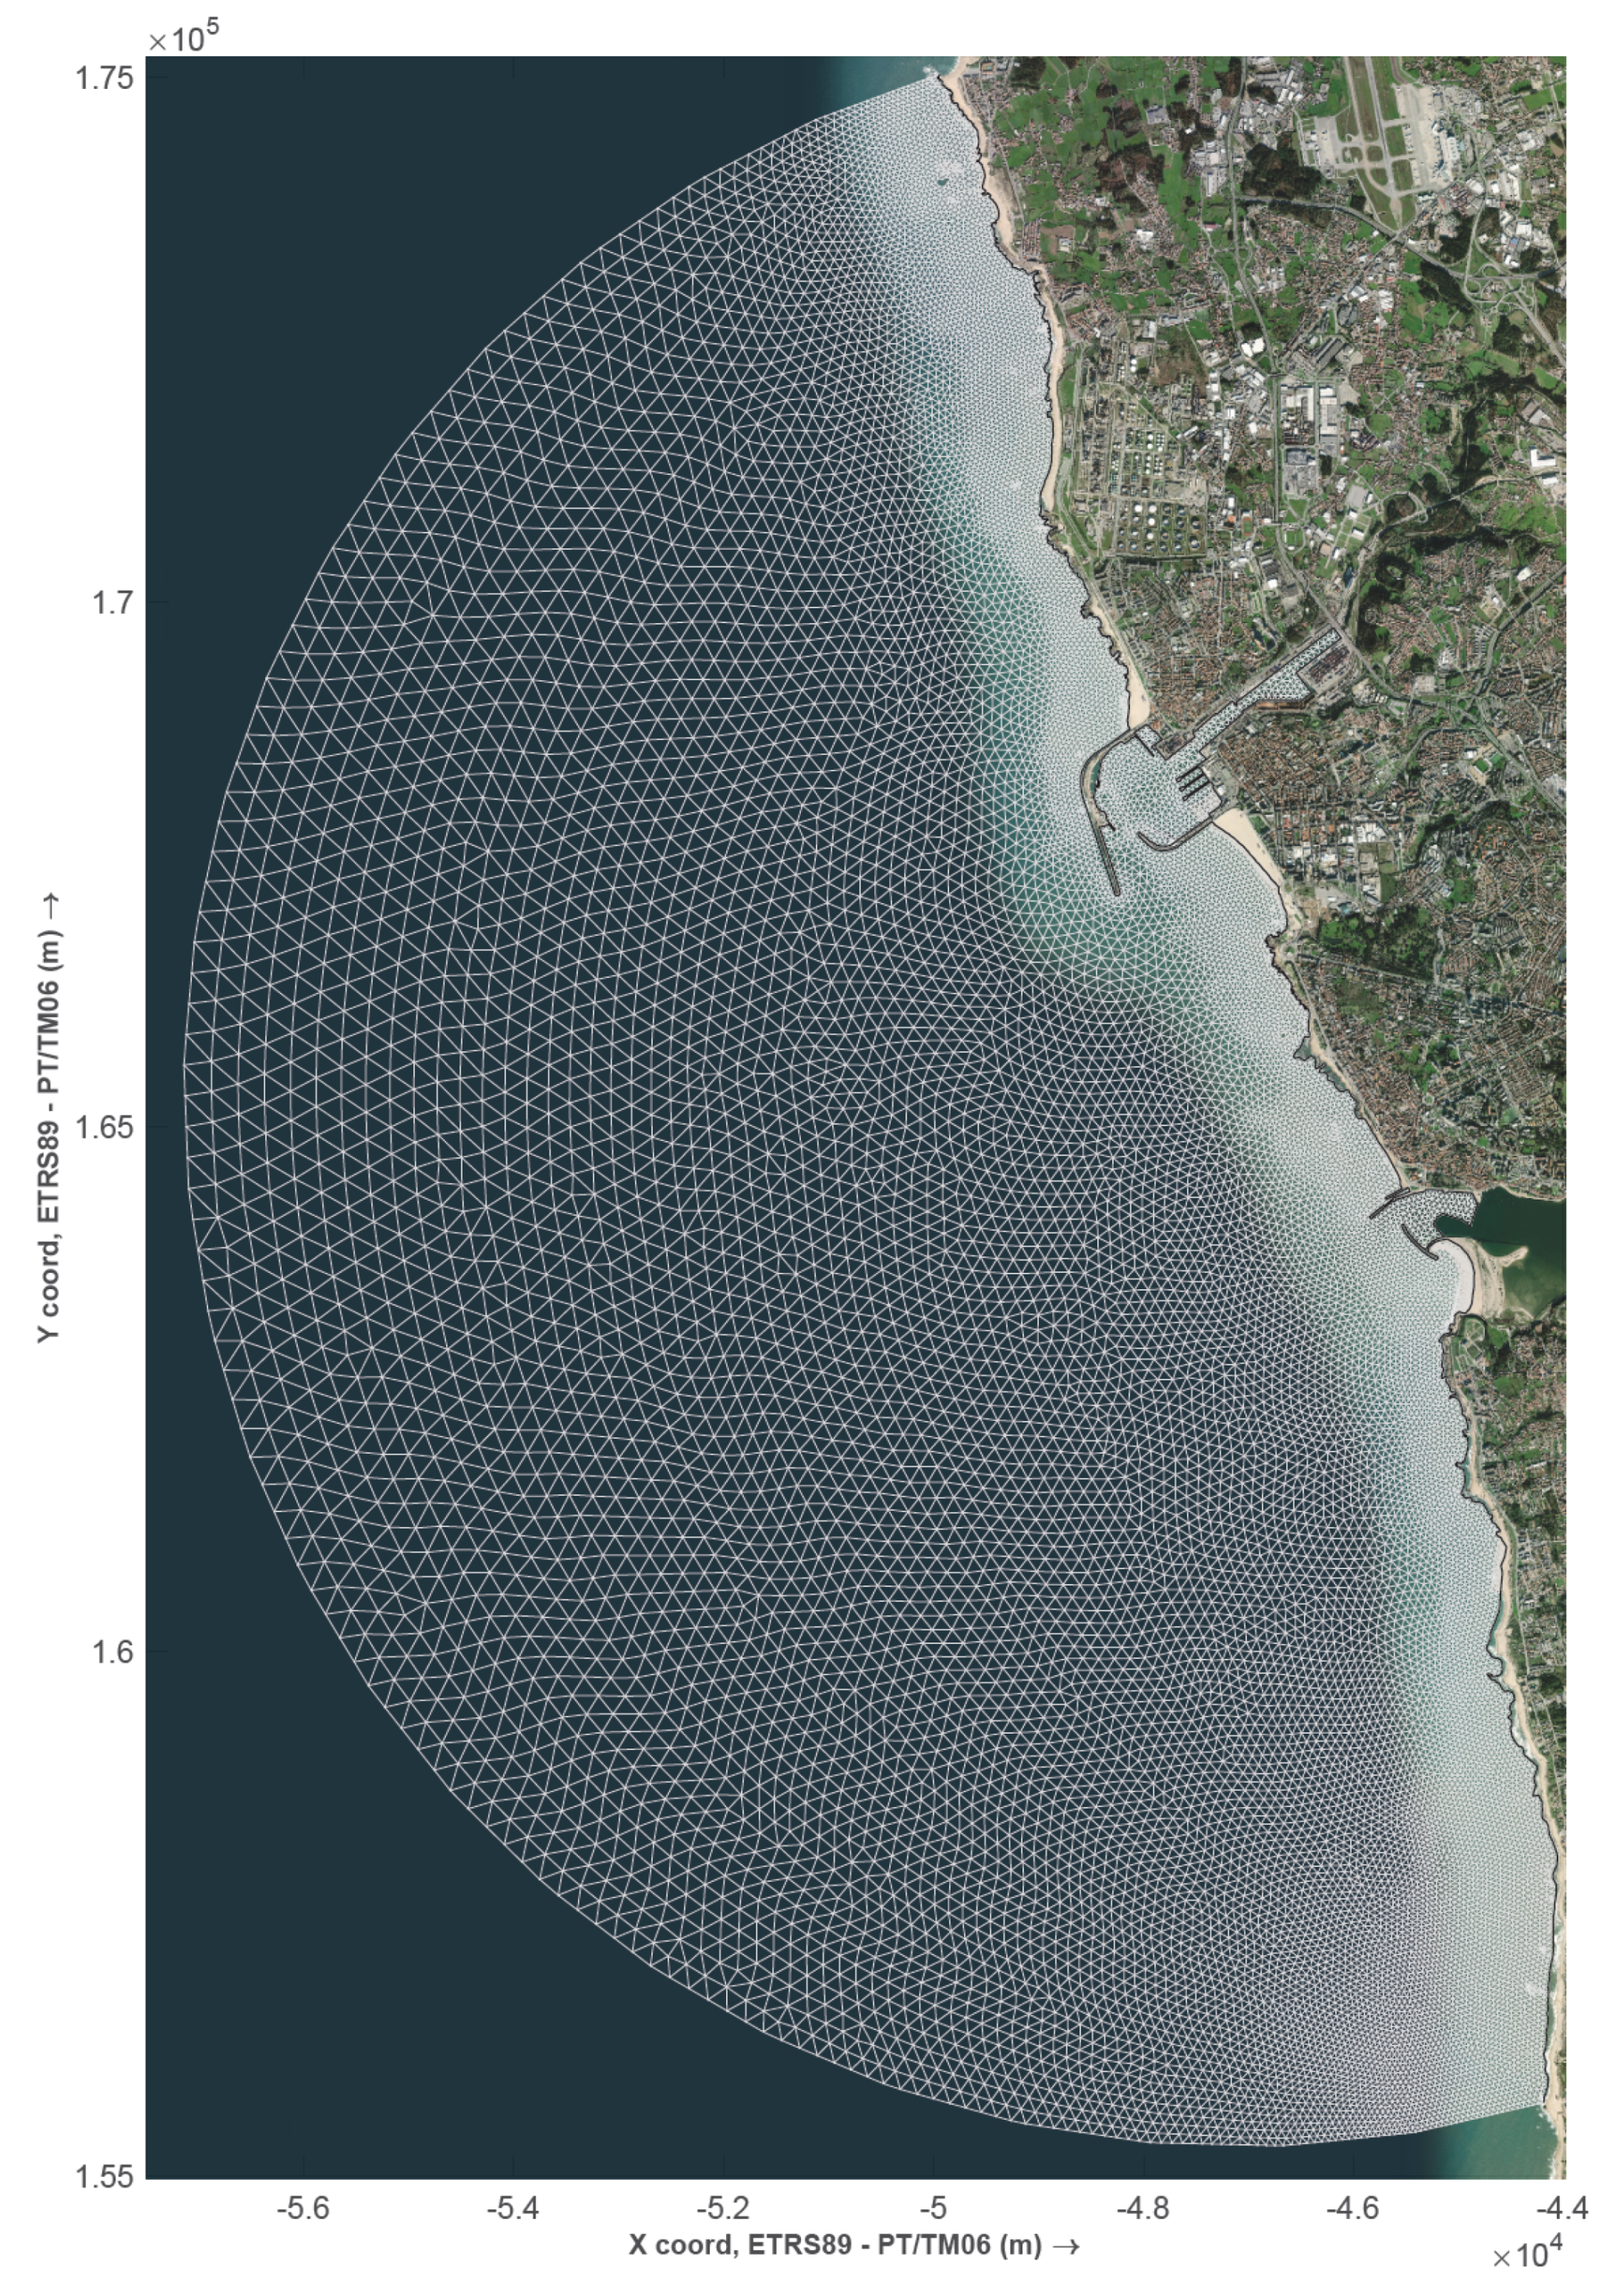
Against the foregoing backdrop, the objective of this paper is to propose an integrated approach to assess the feasibility of exploiting the wave potential to fulfil the energy demands of ports. To this end, a methodology that takes into account the key characteristics of ports (i.e., location, breakwater typology and available wave resource) and WECs (site−specific performance and techno-economic optimisation) is developed to find the optimum WEC−site combination within seaport areas. To illustrate this methodology, the Port of Leixões is used as a case study (
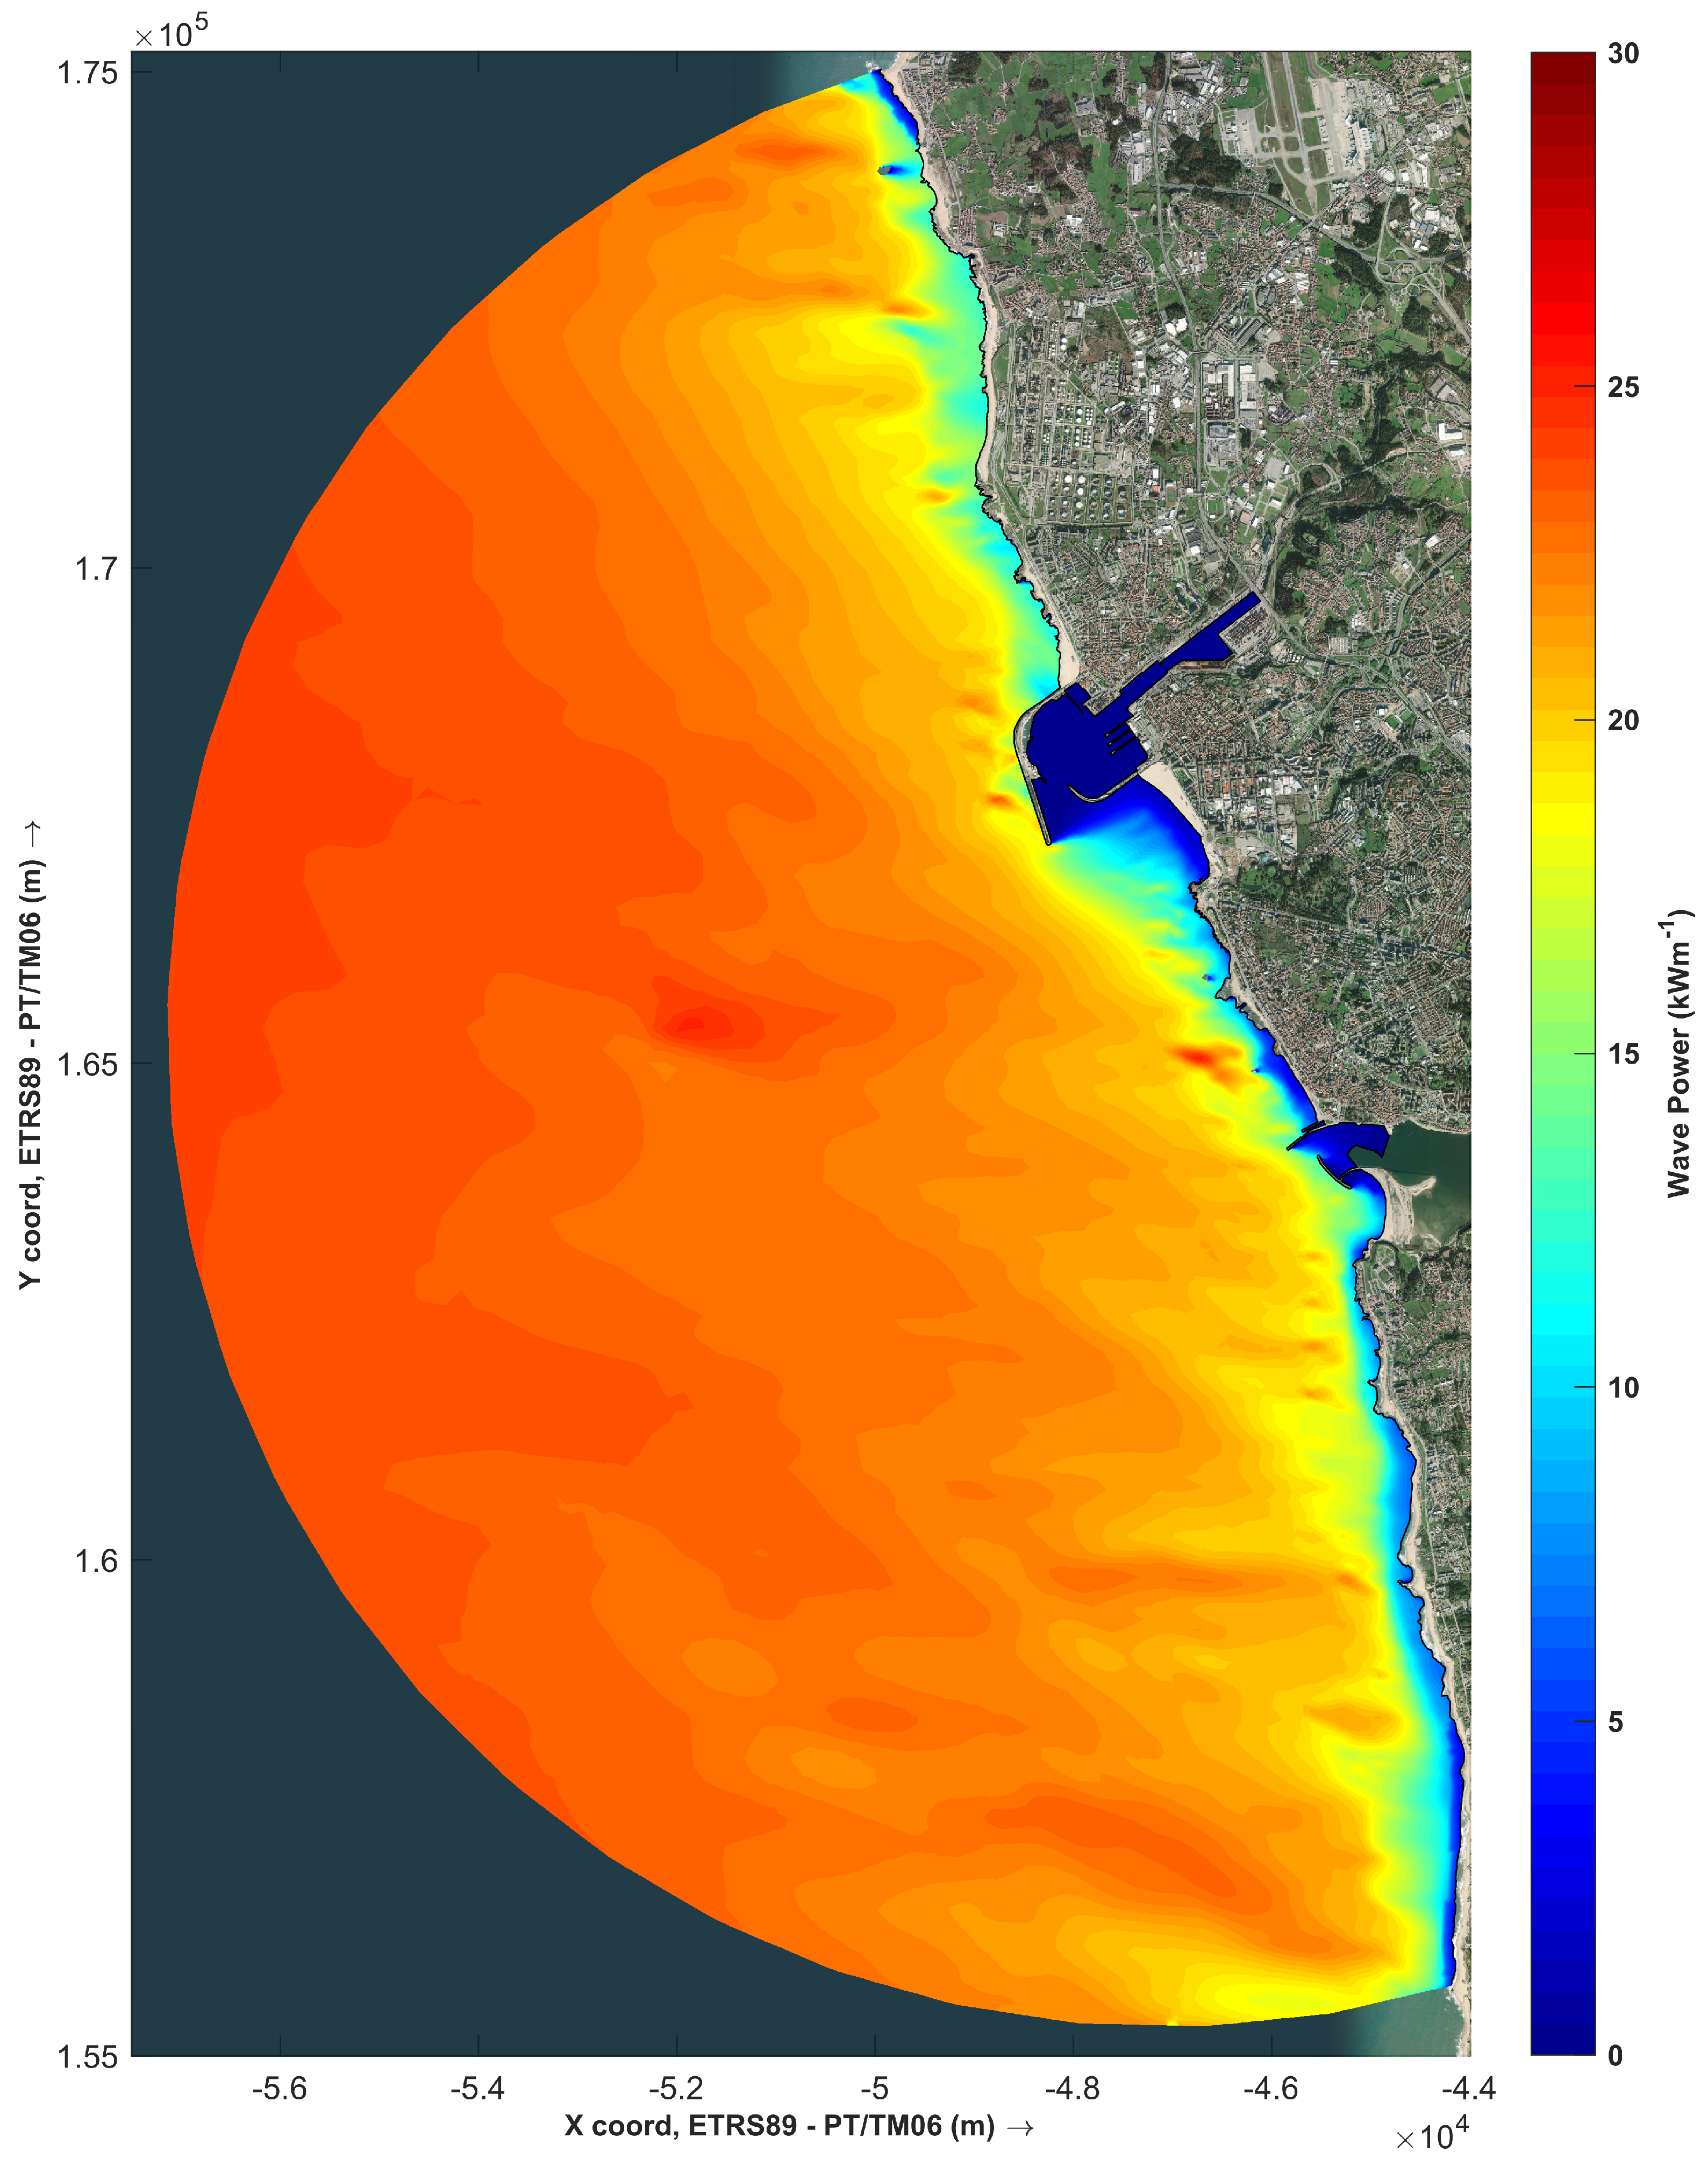
Section 3). Located on the Northern coast of Portugal facing the North Atlantic (Figure 1), the Port of Leixões is subject to one of the most energetic wave regimes in continental Europe [56] and, therefore, appears as a compelling case study to exploit the wave energy resource to fulfil its energy needs.
The remainder of this paper is structured as follows. Section 2 presents the methodology developed to find the best WEC-site combination for seaport areas. Section 3 and Section 4 describe in detail the main characteristics of the Port of Leixões and the case-study WECs considered for this work. Section 5 and Section 6 show the results obtained for the present case study and discuss the main aspects of the proposed methodology, respectively. Finally, conclusions are drawn in Section 7.

2. An Integrated Approach for Optimum WEC-Site Selection in Port Areas

In this section, an integrated methodology is proposed to determine the optimum WEC-site combination for port energy supply. To this end, the proposed methodology is composed of four different stages, namely: (i) detailed analysis of main port characteristics (Section 2.1); (ii) selection of wave energy exploitation sites and WEC technologies (Section 2.2); (iii) site-specific WEC performance (Section 2.3); (iv) and techno-economic WEC optimisation (Section 2.4). Figure 2 presents a holistic view of the methodology, highlighting the main characteristics of the proposed stages and the linkages between them.

2.1. Analysis of Port Characteristics

As expected, the main port characteristics are going to influence which type of WEC integration (breakwater-integrated vs. nearshore farms) is potentially feasible. Among them, local wave conditions, breakwater orientation and typology, energy consumption trends, availability of electrical infrastructures, and supply chains should be considered. On these grounds, the level of exposure to wave action and the orientation and typology of breakwaters are of crucial importance [23].
On the one hand, for ports subject to intense wave action (e.g., outer ports) and whose main breakwaters are aligned with the predominant wave direction, the use of breakwater-integrated WECs appears as the most viable and preferred option for many authors [18,23]. In this case, the suitable WEC typology is mainly limited to some WAD, OWC, OTD and hybrid OWC-OTD concepts [18]. Concerning breakwater typology, ports adopt two main approaches (vertical vs. rubble mound), which diverge on their wave energy dissipation principles. However, no criteria or recommendations for the integration of specific WEC technologies and breakwater typologies are yet defined in the literature. As a result, examples of integration of OWCs and OTDs can be found for both rubble mound (Mutriku’s OWC [28] and OBREC [30]) and vertical (REWEC3 [29] and SSG [61]) breakwaters. Therefore, as long as the hydraulic performance and stability of the breakwater are not compromised, the selection of the WEC typology to be integrated into a breakwater will be governed by its site-specific performance, installation and construction limitations, and associated costs.
On the other hand, for ports naturally sheltered from intense wave climates or whose breakwater sections, susceptible to WEC integration, are not aligned with the main wave direction, the use of offshore wave energy farms (from approximately 10 to 40 m of water depth [18]) stands out as the only viable option to harvest the local wave energy resource. In this case, the limitations in terms of WEC concept selection are mainly governed by water depth availability. Nonetheless, the variety of WEC concepts available for this approach is significantly larger (e.g., point absorbers, attenuators, oscillating surge devices and floating OWCs and OTDs) in comparison with the WEC-breakwater integration approach. Again, the selection of the most appropriate technology will require an exhaustive site-specific performance assessment (Section 2.3). Furthermore, a detailed analysis is needed, considering the potential interactions of the wave farm with the maritime uses and activities present in the surrounding areas of the port. On these grounds, special attention must be paid to marine navigation routes (ensuring port accessibility), fishing, aquaculture, recreational activities and, biodiversity and environmentally protected areas.
In addition, marine climate conditions in the port area, such as tidal ranges and the occurrence of extreme sea events are also noteworthy. In this context, previous research has found that the tidal range could significantly impact the performance of breakwater-integrated WECs. For the case of OTDs, it becomes apparent that large tidal ranges may have a resounding impact on the volume of water that reaches the OTD’s reservoirs, reducing as a result its overall hydraulic efficiency [62]. For OWCs, even though the resonant period shifts with the water level variations, the efficiency is more stable and less affected than the OTDs [60]. Conversely, water level variations are expected to have considerably fewer effects on the performance of nearshore WEC deployments (i.e., between 10 and 40 m of water depth). On the other hand, a high frequency of extreme sea events could jeopardise the operating life of both nearshore and breakwater-integrated WECs. For example, the OWC of Port of Mutriku suffered important structural damages in the walls and roof of four chambers during intense storm conditions [63]. Consequently, a detailed characterisation of the magnitude and frequency of occurrence of extreme sea events must be considered in the decision making for the selection of the most appropriate WEC-site combination within the port area.

2.2. Site Selection for WEC Installation

In order to select the optimum WEC installation location, a detailed spatial and temporal characterisation of the wave energy resource in the port area is required [57]. For this purpose, the present methodology proposes the use of high-resolution spectral wave modelling combined with the recommendations of the technical standard IEC-62600-101 [64], which according to previous research offers an accurate estimation of the wave energy resource [65,66]. The IEC-62600-101 standard divides wave resource assessment in three distinct classes, namely: reconnaissance (Class 1), feasibility (Class 2) and design (Class 3). For the specific case of seaports, Class 3 assessments are recommended, since they are focused on relatively small coastal areas (<25 km of shoreline), offering a detailed characterisation of the spatial distribution of the wave energy resource, with a low degree of uncertainty. For further details on the IEC-62600-101 standard and the implementation procedure of Class 3 wave resource assessments, the readers are referred to Ref. [64]. However, the estimation of the spatial distribution of the wave energy resource does not suffice to determine the optimum deployment location of WECs. In addition, spatial analysis, using Geographical Information System (GIS) techniques, is required for the identification of port areas housing maritime activities and uses that are not compatible with WEC operation. It is worth noting that GIS spatial analysis has been successfully applied for coastal site selection of wave [54] and other marine renewable deployments [67,68].

2.3. Site-Specific WEC Performance Assessment

With the aim of assessing WEC performance at specific port areas, the parametric approach proposed by Carballo et al. [57] is adopted. This methodology computes different key performance indicators of WECs, including energy production, capacity factor and capture width ratio.
Therefore, the energy output produced by a WEC for a specific location, E t , can be calculated according to:
E t = i = 1 n P i O i ,
where n is the total number of sea states considered, P i is the power generated by the WEC for the i-th sea state (Figure 5), and O i is the occurrence (number of hours) for a certain reference period (year or month) of the i-th sea state.
The capacity factor, C f , which represents the percentage of time over a reference period, T (year or month), that the WEC operates as its rated power, P R , can be computed as:
C f = E t T P R ,
Finally, the capture width ratio, C W R , measures the hydrodynamic efficiency of the WEC, representing the fraction of available wave energy captured by the WEC [69], and can be computed as:
C W R = P o u t J B ,
where P o u t is the power output of the device, J is the available wave power per meter of wave front and B is the characteristic capture dimension of the device.

2.4. Techno-Economic WEC Optimisation

The final step of the proposed methodology (Figure 2), consists of optimising the main WEC characteristics (dimensions, mass and power absorption) according to the local wave conditions, with the aim of reducing the associated Levelised Cost of Energy (LCoE) for all the considered WEC-site combinations. This techno-economic optimisation is necessary since most WEC concepts are developed for specific applications and wave climates and, consequently, present operating windows that may not be suited for the wave conditions of seaport areas. Therefore, the present methodology proposes to scale the considered WEC technologies using the well-known Froude similarity criterion, for which wave heights scale linearly with the geometric scale λ , wave periods with λ 1 2 , mass with λ 3 and absorbed power with λ 7 2 [70]. Therefore, the devices are upscaled or downscaled for values of λ lower or higher than 1, respectively. Furthermore, to ensure that the original and scaled WECs present an equivalent hydrodynamic behaviour, the variation of the geometric scale ( λ ) is restricted to a maximum value of 30% [71]. In consequence, a constrained optimisation problem, which aims to find the value of the geometric scale ( λ ) that minimises the LCoE for each WEC-site combination is solved.
However, owing to the lack of techno-economic information shared by WEC developers, an accurate estimation of the LCoE of wave energy deployments is not straightforward [45]. As a result, several authors have proposed different models to estimate the costs during the life cycle of wave farms [72,73,74]. For the present work, an in-depth literature review has been carried out to adopt the cost estimations, which are most suited for wave energy deployments within port areas. In consequence, the LCoE model proposed in this work stands as a first approximation and should be revisited in the future, when new information coming from the wave energy industry is made available.
Therefore, the proposed model computes the LCoE using a life-cycle cost approach [72]:
L C o E = t = 0 T l C A P E X t + O P E X t + A B E X t ( 1 + r ) t t = 0 T E t ( 1 + r ) t ,
where T l is the lifespan of the project in years, the C A P E X t , O P E X t and A B E X t stand for the capital, operational and abandonment expenditures for the t-th year of the project, respectively; E t is the energy output for the t-th year of the project (Equation (1)), and r is the discount rate, which is obtained as:
r = r l + r i 1 r i ,
where r l and r i are, respectively, the loan and inflation rates. Based on previous studies, a 10% loan rate [72] and a 2% inflation rate [71] were considered.
Regarding costs, the CAPEX accounts for all the expenditure required prior to the operating stage of the project, and can be estimated as:
C A P E X = C W E C s + C b a s e + C a l l o w + C c o n t ,
where C W E C s represents the cost of design, engineering and manufacturing of WECs and can be computed according to Equation (7); C b a s e are the base costs of the project, which are estimated as indicated in Equation (9); and finally, C a l l o w and C c o n t g stand for the allowance and contingency costs, with each of them representing up to 10% of the base cost ( C b a s e ) according to the work of Oliveira-Pinto et al. [71].
The cost of the WECs ( C W E C s ) can be estimated as:
C W E C s = C P T O + C d e s i g + C s t r u c t ,
where C P T O account for the expenses related to the Power Take-Off (PTO) systems, which according to Oliveira-Pinto et al. [71] represent 25% of the base costs ( C b a s e ); C d e s i g stands for the engineering and design costs of the WECs, for which Pecher and Kofoed [73] proposed a unitary cost of EUR 68,945 per MW; and finally, C s t r u c t is the structural cost of WECs, whose unitary value can be computed as:
C s t r u c t = f C m m W E C ,
where f is the complexity factor in WEC manufacturing, which was introduced by Oliveira-Pinto et al. [71] and ranges between 1 and 1.20 depending on the structural design of the WEC (Table 2). C m is the unitary cost of the structural material. For the case of reinforced concrete, the price per ton ranges between EUR 100 and 150 [75,76], while for the case of steel, several authors have indicated that the price could range between EUR 1000 and 1400 per ton [71,75]. Finally, m W E C represents the structural mass of the WEC.
The base costs ( C b a s e ) can be computed as:
C b a s e = C s i g n a l + C g r i d + C m & f + C i n s t + C p m a n ,
where C s i g n a l represents the wave farm signalling costs, which according to Pecher and Kofoed [73], present a unitary cost of EUR 15,000 per MW; C g r i d are the grid connection costs, which can be computed as indicated in Equation (10); C m & f stands for the mooring and foundation costs, whose unitary costs are summarised in Table 1; C i n s t are the installation costs, which are obtained by means of Equation (11); and finally, C p m a n represents the project management costs, which can be estimated as 5% of the combined costs of WECs ( C W E C s ) and installation ( C i n s t ).
The grid connection costs ( C g r i d ) can be computed as:
C g r i d = C a r r a y - c a b + C e x p o r t - c a b + C l a n d - c a b + C s u b s t ,
where C a r r a y c a b and C e x p o r t c a b are the costs of the inter-array and export submarine electrical cables, which according to Pecher and Kofoed [73] present a unitary cost of EUR 62,860 and 184,222 per MW, respectively; C l a n d c a b represents the costs of terrestrial electrical cables, which based on the work of Astariz and Iglesias [45] are in the order of EUR 70 per meter; and finally, C s u b s t is the cost of the electrical substation, which according to Oliveira-Pinto et al. [71] is in the order of EUR 1.1 M.
The installation costs ( C i n s t ) can be estimated as:
C i n s t = C W E C - i n s t + C s u b s t - i n s t + C a r r a y - c a b - i n s t + C e x p o r t - c a b - i n s t + C m & f - i n s t ,
where, C W E C - i n s t and C s u b s t - i n s t are respectively the WEC and substation installation costs, whose unitary costs, according to Pecher and Kofoed [73], can be estimated as EUR 101,339 and 31,389 per installed MW, respectively; C a r r a y - c a b - i n s t and C e x p o r t - c a b - i n s t stand for the installation costs of inter-array and export cables, which for offshore deployments can be assumed as EUR 281,000 and 443,000 per km [77], respectively; and, C m & f - i n s t represents the mooring and foundation installation costs, which according to Oliveira-Pinto et al. [71] can be estimated in EUR 78,125 per day of work.
On the other hand, the OPEX accounts for all the operating and maintenance costs during the lifespan of the project. However, the estimation of the OPEX for wave energy projects appears as a challenging task due to the lack of long-term data from wave farms in operation [71]. In consequence, the OPEX is usually obtained as a percentage of the CAPEX. For example, Astariz and Iglesias [45] estimated that the OPEX ranges between 1.5% and 5.0% of the CAPEX. In this work, a conservative approach was adopted and, therefore, the OPEX was considered 5% of the CAPEX. Similarly, the ABEX is usually estimated as a percentage of the CAPEX, which according to Astariz and Iglesias [45], ranges between 0.5% and 1%. For the present work, the ABEX was set at 1% of the CAPEX.
The effect of economies of scale was also considered in the model, since the unitary costs of fabrication and installation of WECs would decrease with the number of units. For this purpose, the methodology proposed by O’Connor et al. [78] to estimate the cumulative cost of fabrication and installation of multiple WECs was used:
C t = i = 1 n N ln χ ln 2 I C n ,
where N is the total number of WECs, I C n is the unitary cost, C t is the cumulative cost and χ is the bulk discount factor, which usually varies from 0.85 and 0.95. Based on the work of Oliveira-Pinto et al. [71], χ was set to 0.90.
Finally, it is worth mentioning that the effects of external factors such as the fluctuations in the price of raw materials and inflation rates are beyond the scope of this work and were not considered for the cost model proposed.

3. Port of Leixões

The Port of Leixões is located in the district of Porto (Northern Portugal) with direct access to the Atlantic Ocean (Figure 1a). This privileged location makes the Port of Leixões the second largest port in Portugal in traffic of goods, supplying commodities to a hinterland of more than 14 million inhabitants [79]. As a result of its economic and strategic importance, the port authority is developing ambitious plans to ensure its long-term competitiveness and sustainability. Consequently, with the purpose of providing better berthing and mooring conditions as well as facilitating access to the port, a 300 m extension (with a 20° rotation to the West) of the outer breakwater is planned (Figure 1b) [60]. As a result, the proposed extension could offer the possibility of integrating different WEC technologies into the breakwater and, therefore, harnessing the local wave energy resource [60]. On the other hand, the managing authority of the port has recently announced the intention of achieving carbon neutrality and energy self-sufficiency by 2035 [80]. In this context, wave energy is expected to play a significant role in achieving the aforementioned goals as shown by the concession agreement granted to Eco Wave Power for the installation and exploitation of a 1 MW wave power plant integrated within the jurisdiction area of the port [81].

3.1. Energy Consumption Patterns

Based on the latest available information (years 2017 and 2018), the average annual energy consumption of the Port of Leixões is approximately 24.6 GWh per year, comprising three main energy sources, natural gas (0.52%), diesel (37%) and electricity (62.48%) [82]. In addition, the intra-annual energy consumption is presented in Figure 3. Overall, it can be observed that the energy consumption varies from 1.8 (June) to 2.3 (December) GWh per month, with the second part of the year presenting higher energy demands (above 2 GWh per month). Regarding each individual energy source, it can be observed that diesel consumption spikes in the last part of the year (from September to December), while the electricity demands are higher at the beginning of the year (from January to March). Lastly, it is worth mentioning that the energy consumption patterns reported in this section only include the facilities (administrative buildings, port and terminal lighting) and activities (tow boating and container and bulk cargo handling) that are managed by the port authority.

3.2. Main Maritime Uses and Activities

In Portugal, marine spatial planning follows an adaptative approach, favouring a seamless coexistence of multiple maritime uses in the same sea-space while avoiding any potential disruptions to the marine environment [83]. As a result, a planning instrument, the so-called Situation Plan, was created to identify the temporal and spatial distribution of present and potential maritime uses [84]. For the case of the Port of Leixões and its surroundings, the areas contemplated by the Situation Plan are highlighted in Figure 4. Overall, it can be observed that the vicinity of the port presents priority areas for different marine activities, among which artificial feeding of beaches, disposal of dredged material, aquaculture, marine navigation and surf stand out (Figure 4a). Regarding the presence of biodiversity, conservation and cultural heritage regions, four coastal protected areas, which span a total surface of approximately 200 ha, are found within the jurisdiction area of the port (Figure 4b), while the southern approach to the port is marked as a Site of Community Importance (Figure 4a). Finally, it is worth mentioning that potential areas for future uses such as multi-use platforms and reef, sport and leisure activities are also considered.

4. Case-Study WECs

As mentioned in Section 2.1, the exploitation of the wave potential to supply the energy needs of ports can be achieved using either breakwater-integrated or offshore WECs. Owing to its privileged location and layout (Figure 1), both possibilities are suitable for the Port of Leixões. However, for the present work, the use of breakwater-integrated WECs was discarded, owing to the lack of information to accurately estimate the different costs (manufacturing, installation and decommissioning) and LCoE of these types of devices. Therefore, only offshore WEC concepts that have reached a relevant level of technology readiness (TRL ≥ 4) were considered [
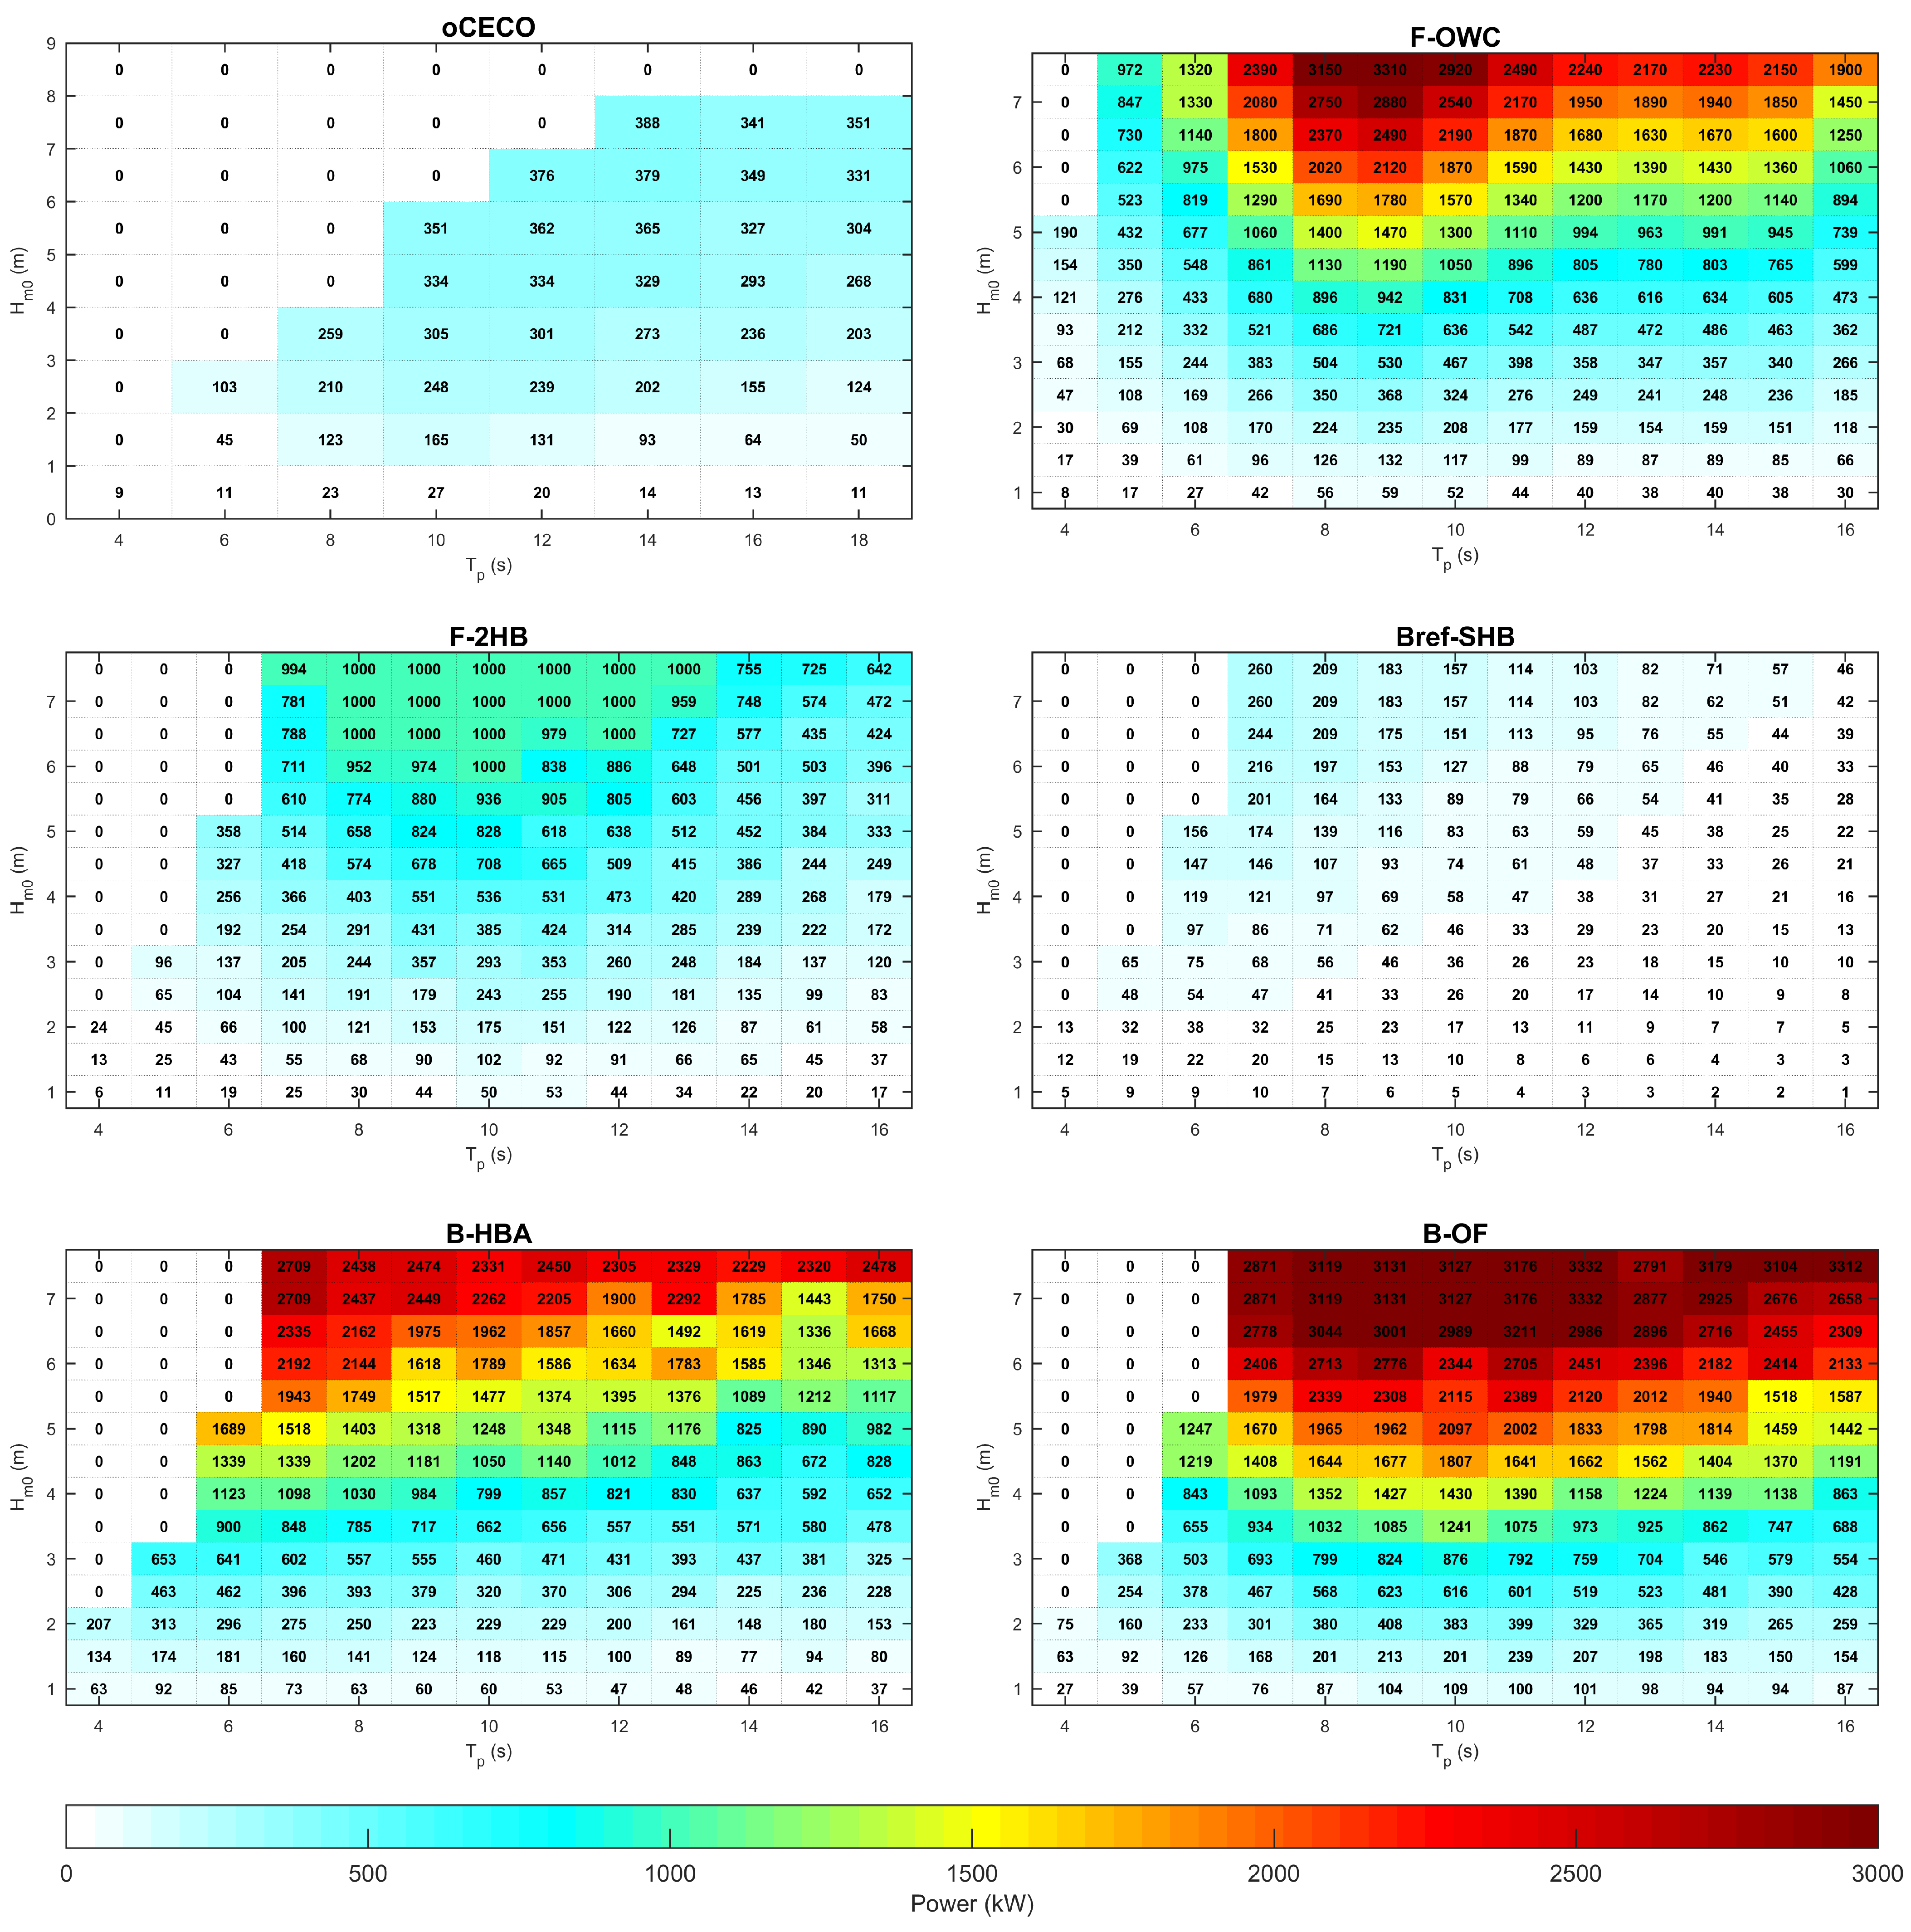
71], namely, F-OWC, F-2HB, Bref-SHB, B-HBA, B-OF and oCECO. The main characteristics of those devices are summarised in Table 2, while their corresponding power matrices are shown in Figure 5.
F-OWC, as its name indicates, is a floating OWC [85], which is inspired by the OE-Buoy device [86]. It consists of a partially submerged structure with an opening aligned with the incoming wave direction connected to a single air chamber. As the water column oscillates, the air is forced to flow through an air turbine, which drives an electric generator.
F-2HB is a floating two-body heaving converter [85], which is based on the WaveBob device [87]. Its operating principle consists of a heaving point absorber with a hydraulic PTO that is driven by the relative motion of a torus sliding along a vertical float.
Bref-SHB is a bottom-referenced submerged heave-buoy [85], which takes inspiration from the CETO device [88]. It is formed by a submerged axi-symmetric buoy, which is forced to heave as a result of the pressure difference caused by wave motions. The heaving motions are captured by a hydraulic PTO, which drives an electric generator located inside the buoy.
B-OF is a bottom oscillating flap device [85], which is derived from the Oyster device [89]. It consists of a pitching flap fixed to the seabed, whose oscillations are converted into hydraulic energy, which is then used to drive an electric generator.
B-HBA is a bottom-heaving buoy array [85], which is based on the Wavestar device [90]. B-HBA is formed by several semi-spherical floaters connected to a jack-up structure by means of hinged arms. The motions of the floaters are captured by a hydraulic PTO, which drives an electric generator housed in the jack-up structure.
Finally, oCECO is a novel WEC composed of two floating modules joined by a frame, which present their motions restrained to an inclined direction to capture the vertical and horizontal force components of the waves [91]. The longitudinal motions of the floating modules are transformed by a rack pinion system to drive a rotatory electric generator, which is housed in the floating supporting structure. It is important to point out that oCECO was developed and optimised for the wave conditions of the area of study (Northern coast of Portugal) [92,93]. Consequently, for the present work, oCECO was also used as a benchmark to verify the validity of the techno-economic optimisation model proposed in Section 2.4.

5. Results

5.1. Wave Energy Resource Characterisation and Site Selection

As indicated in Section 2.2, for the characterisation of the wave energy resource in port areas, the use of high-resolution numerical modelling is recommended. Consequently, in the present study, a wave model spanning the jurisdiction and surrounding areas of Port of Leixões was implemented following the recommendations of the IEC-62600-101 (Class 3 assessment). For this purpose, the open−source spectral wave model SWAN (Simulating WAves Nearshore) [94] was used. Further details on the physics and the implementation procedure of the wave model can be found in Appendix A.
Upon implementation, the wave model was run for a period of 31 years (from 1990 to 2020) to capture the seasonal variations of the wave resource. Then, the results obtained were processed to determine the spatial distribution of the wave energy resource in the port area and its surroundings. Figure 6 shows the results obtained for the annual scenario. Overall, for the more offshore regions (i.e., around 40 m of water depth) the wave resource is homogeneously distributed, with average values ranging between 23 and 25 kWm 1 . In the nearshore regions, due to their associated wave dissipation processes, the available resource progressively reduces. As a result, the available resource in the surrounding areas of the port is in the order of 15 to 18 kWm 1 .
Next, following the methodology presented in Section 2.2, the site selection for wave energy exploitation was performed by combining the spatial distribution of both the wave energy resource (Figure 6) and marine uses in the port area (Figure 4). As indicated in Section 3.2, Portugal’s marine spatial planning follows an adaptative approach (i.e., several marine uses can coexist in the same sea space as long as the priority use of the area is not compromised); however, for the present work, a conservative approach was used and, therefore, all marine priority areas were discarded for wave energy exploitation to avoid potential disruptions (Figure 7). As a result, Areas I and II, highlighted in Figure 7, were considered potential candidates for the exploitation of the wave resource. Area I, located 5.5 km offshore from the port at a water depth of approximately 40 m, exemplifies the use of offshore floating wave farms for the energy supply of ports. Conversely, Area II, located in the vicinity of the port, illustrates the exploitation of the wave resource by means of nearshore wave farms.
Once the potential wave energy sites were identified, the hourly records of wave data (spanning from 1 January 1990 to 31 December 2020) computed by the wave model were used to assess the distribution of the energy resource among the most recurrent sea states. For this purpose, the omni-directional wave energy matrices (Figure 8) were constructed in terms of significant wave height ( H m 0 ), peak period ( T P ) and annual number of hours of occurrence ( O i ). For Area I, the most recurrent sea states are concentrated in the range of 1–3 m of H m 0 and 8–14 s of T P . Nonetheless, the bulk of wave energy is displaced towards the region ranging between 1–5 m of H m 0 and 10–16 s of T P , with some sea states exceeding mean annual values of 20 MWhm 1 . For Area II, owing to the nearshore wave dissipation processes, the most recurrent sea states are concentrated in the region of 1–3 m of H m 0 and 6–12 s of T P , which results in a significant reduction of the available resource, with only a limited number of sea states exceeding 10 MWhm 1 .
Therefore, taking into account the main characteristics (water depth and energy resource) of the potential wave energy sites and the case-study WECs (operating range) presented in Section 4 (Table 2), an initial WEC-site combination is proposed. As a consequence, for Area I, only floating devices are suitable and, therefore, oCECO, F-OWC, F-2HB and Bref-SHB were considered, while the characteristics of B-HBA and B-OF make them appropriate for Area II.

5.2. Techno-Economic Optimisation of Case-Study WECs

The techno-economic optimisation of the case-study WECs was performed following the methodology presented in Section 2.4. For this purpose, an algorithm was developed to compute the geometric scale ( λ ) of Froude’s similarity criterion, which minimises the associated LCoE for each WEC-site combination. As a result, the main WEC characteristics (dimensions, mass and power production), as well as the number of devices required to meet a certain energy target were optimised for each deployment location. For the present case study, owing to the limited space of Area II for WEC installation (Figure 7), the energy target was set at 50% of the annual energy demand of the port (i.e., approximately 12 GWh per year). In addition, Table 3 summarises the main input values used for the LCoE model proposed in Section 2.4. It is worth noting that for the WEC deployments, the length of the inter-array electric cable was determined assuming a separation among WECs of 5 times their characteristic capture dimension [71].
The results of the techno-economic model for the considered WEC-site combinations are presented in Table 4. Overall, the λ value, which minimises the associated LCoE, varies significantly for each WEC-site combination. For instance, F-OWC, F-2HB, B-HBA and B-OF present λ values exceeding 1, highlighting that a downscaling of the devices was required. As a result, the power capacity of the device is reduced and shifted towards the most recurrent and lower values of H m 0 and T P present in Areas I and II (Figure 8). Conversely, Bref-SHB had to be significantly upscaled ( λ = 0.76 ), increasing and shifting its rated power capacity towards higher values of H m 0 and T P . Finally, for the case of oCECO, the optimal λ value of 0.99 indicates that the optimised device has almost the same characteristics as the reference one. As indicated in Section 4, this behaviour was expected since oCECO was developed and optimised around the wave conditions present in the area of study. In consequence, the results obtained seem to ratify the validity of the techno-economic optimisation proposed in this work.
Regarding the LCoE values obtained for each WEC-site combination (Table 4), those range between EUR 387.6 (oCECO) and 714.9 (B-OF)/MWh, being in good accordance with the values found in the literature for wave energy deployments [45]. In addition, with the aim of assessing the performance of the techno-economic optimisation, a comparison between the LCoE for the optimised and reference WECs is presented in Table 5. Overall, it can be observed that the techno-economic optimisation of the WECs results in significant reductions of their associated LCoE values. This is especially noticeable for the case of F-OWC, Bref-SHB, B-HBA and B-OF, for which LCoE reductions ranging from EUR 25 to 130/MWh were found. As expected, for the case of oCECO, the variations of LCoE between the reference and optimised device are negligible. Again, these results confirm that the techno-economic optimisation model proposed performs well, reducing the LCoE for different WEC-site combinations.
On the other hand, Table 6 presents the results of the annual energy production ( E t ), capacity factor ( C f ) and capture width ratio ( C W R ) for the optimised devices. As expected, oCECO presents the best performance indicators, especially in terms of annual energy production (1.33 GWh) and C W R (49%), which are in good agreement with the results obtained in previous works [93,95]. For the remaining WECs, F-2HB and F-OWC perform relatively well in Area I with the annual energy production and C W R exceeding 0.8 GWh and 22%, respectively. However, the low values of C f highlight that the rated capacity of the electric generator is still too high for the available resource of Area I. Finally, for the case of B-HBA and B-OF, despite presenting annual energy productions in the order of 1 GWh, the values of C f are lower than 10%, which indicates again that the capacity of the generator is still oversized for the wave regime of Area II.
All in all, the results obtained show that the most viable WEC-site combination to fulfil 50% of the energy needs of Port of Leixões is the deployment of oCECO in Area I. This fact is underpinned by the results of oCECO both in terms of LCoE (EUR 387.6/MWh) and device performance (i.e., oCECO presents the largest annual energy production, capacity factor and capture width ratio). Nonetheless, it is worth pointing out that the results obtained are site-specific (i.e., oCECO was optimised for the wave conditions of the area of study) and, therefore, under different wave conditions, the relative performance of the case-study WECs could differ completely.

6. Discussion

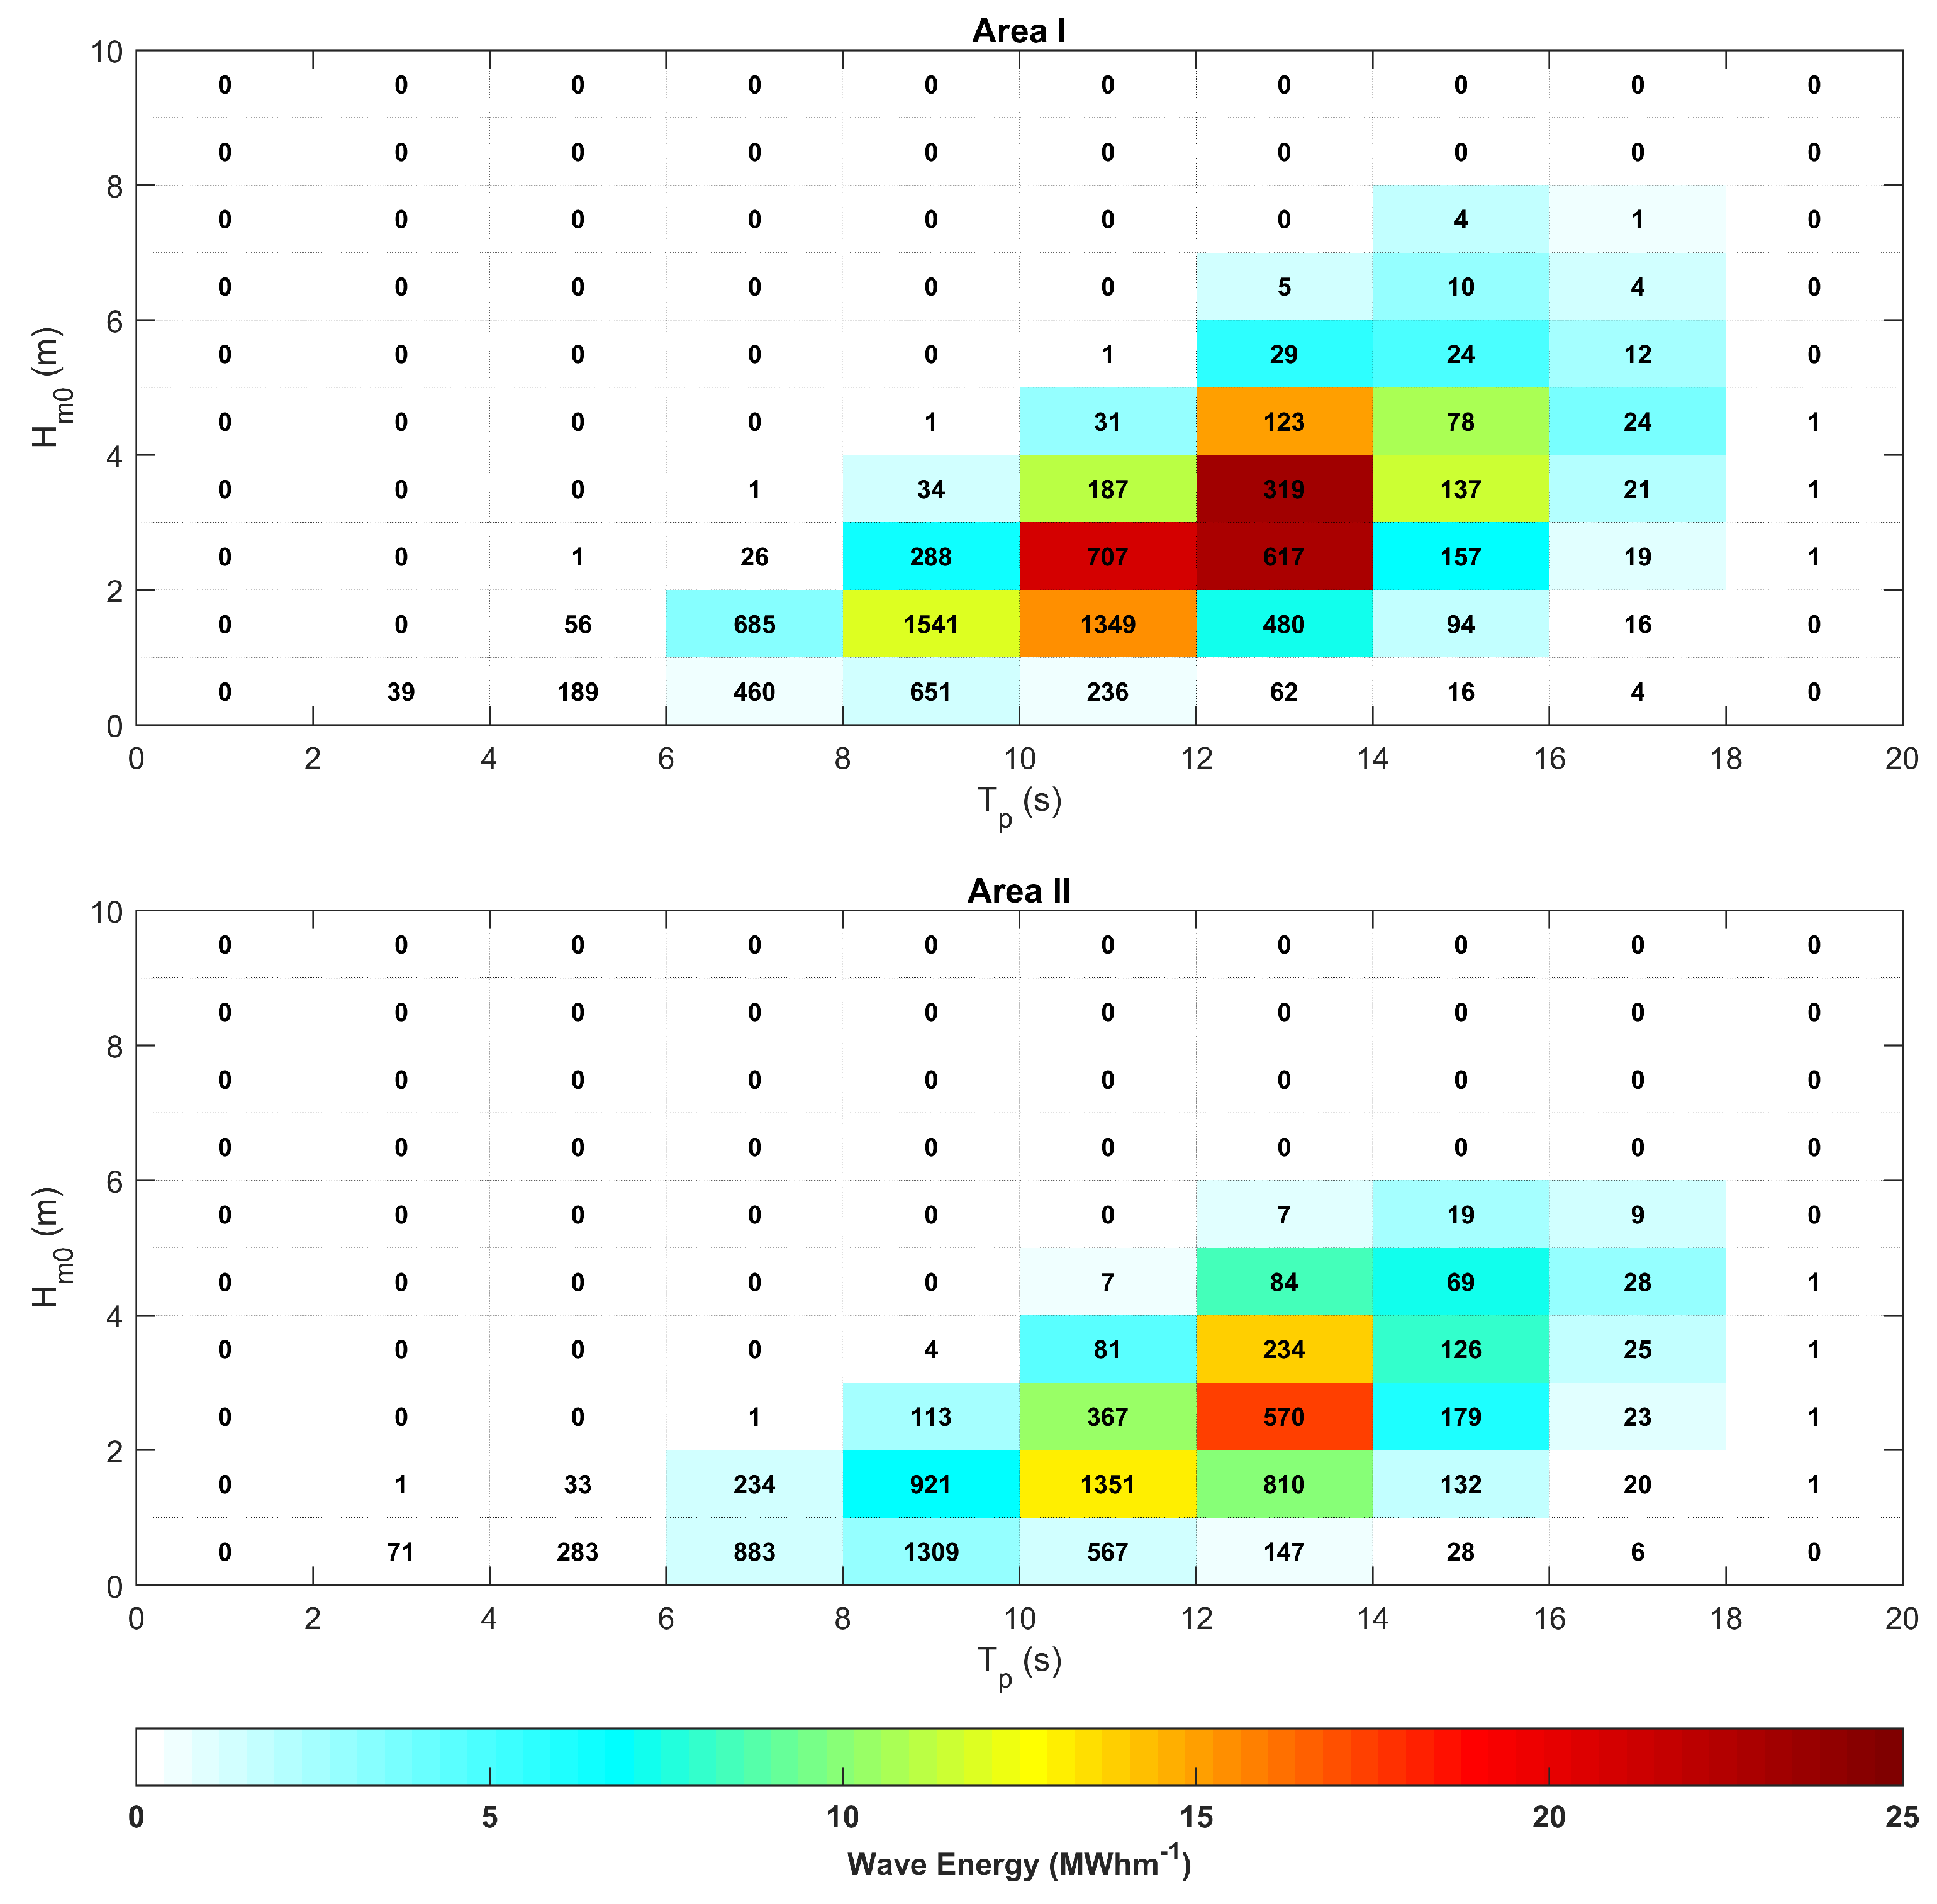
This section presents a discussion on the main aspects of the methodology proposed to find an optimal WEC-site combination to supply the energy needs of seaports. First of all, the results obtained in Section 5.1 highlight that the selection of the areas to exploit the wave energy resource in the vicinity and/or port areas should be studied from a holistic perspective, considering not only the available wave energy resource but the main port characteristics, including energy consumption patterns, typology and orientation of coastal defence structures, as well as the socio-economic constrains imposed by the different maritime uses and biodiversity protected areas present in the surroundings of the port. For the case of Port of Leixões, this fact becomes apparent, with a significant amount of sea space discarded for WEC deployment due to the presence of maritime priority areas (marine navigation, disposal of dredged material and activities such as aquaculture and surf) and biodiversity areas (SCIs). As a result, the available sea surface will determine the size and capacity of the wave farm. For the present case study, due to the space limitations of Area II and the considered separation between WECs (5 times the characteristic capture width), the capacity of the farm was set to supply 50% of the annual energy demands of Port of Leixões (approx. 12 GWh). It is noteworthy to point out that despite not being considered for the present study, the proposed methodology is flexible enough to include a wave farm layout optimisation. In consequence, the size and capacity of the wave farm could be adapted even better to the port characteristics.
On the other hand, the results obtained in Section 5.2 confirm the need of conducting a techno-economic optimisation of WECs based on the characteristics of the local wave conditions, since most WEC technologies are usually designed for specific applications and/or wave climates. In consequence, most of the case-study WECs had to be upscaled or downscaled (according to Froude’s similarity criterion, Section 2.4) to be better suited to the wave characteristics nearby the Port of Leixões and, therefore, reduce their associated values of LCoE (from 5 to 15% as indicated in Table 5). The only exception was the case of oCECO, for which negligible differences were found between the optimised and reference device. The latter confirms the validity of the techno-economic optimisation model proposed, since oCECO was developed and optimised for the wave conditions present in the area of study. However, it is worth noting that the LCoE model proposed in the present work is based on a deep literature review of cost estimations of the different stages of a wave energy project (manufacturing, installation, operation, maintenance and decommissioning). In addition, the cost model proposed does not take into account external factors such as spikes in the price of raw materials or inflation rates. Therefore, the proposed LCoE model should be considered as a first approximation and must be revisited when new information coming from the wave energy industry becomes available. Consequently, a conservative approach was taken for the estimation of the different costs. For example, the OPEX was estimated as 5% of the CAPEX, which corresponds to the maximum limit proposed in the literature [45]. As a result, the model may overestimate the LCoE, especially for the nearshore WECs (B-HBA and B-OF in Area II), where the operation and maintenance costs are expected to be lower. Nonetheless, the methodology proposed is flexible enough to adjust the cost estimation according to the characteristics of the considered WEC-site combination. Finally, another aspect that may have an influence on the results obtained for the LCoE is that the wave farm layout was not optimised, which could also contribute to the overestimations of the LCoE.

7. Conclusions

In recent years, regulatory and social pressure have forced port authorities to reduce their environmental footprint and transition towards a low-carbon and more sustainable energy model. For this purpose, the inclusion of renewable sources in the energy mix of ports becomes essential. In this context, due to the availability and proximity of the resource, wave energy appears as a promising option. Therefore, exploiting the wave energy resource to supply the energy demands of ports requires an appropriate selection of WEC technologies and installation locations. However, this selection is not straightforward as depends on multiple factors, which include, among others, port exposure to wave action, typology and orientation of port sheltering structures, potential interactions with other maritime uses and associated energy costs. On these grounds, the objective of this paper is to propose an integrated methodology to select the most appropriate WEC-site combination to supply the energy demands of ports. To illustrate this methodology, the Port of Leixões, located on the Northern coast of Portugal, was used as a case study.
For the present case study, the methodology proposed has proven to be robust and coherent, being capable of identifying the optimal WEC-site combination to fulfil the energy needs of the port. Regarding the identification of wave energy sites, it was found that in addition to an accurate estimation of the wave resource, a detailed spatial characterisation of the different maritime uses in the port area is essential to avoid potential disruptions between them. For this purpose, the use of marine spatial planning instruments is highly recommended. Another key aspect of the methodology is the techno-economic optimisation proposed to adapt the WECs to the local wave conditions of ports. This stage of the methodology has proven to be highly effective, with most of the case study WECs presenting noticeable reductions (ranging from 5 to 15%) in their associated LCoE values. However, the cost estimations proposed for the LCoE model must be considered as a first approximation and should be revisited when more accurate cost information is shared by the wave energy industry. Finally, it is important to note that the methodology proposed can be applied elsewhere, using different case-study WECs.
In summary, the results obtained confirm that the methodology proposed performs well, identifying the most suitable locations for wave farm installation and optimising the devices to minimise their associated LCoE, according to the site-specific wave conditions. Nonetheless, additional aspects relevant to WEC-site selection, such as wave farm layout optimisation and seabed geology, are not considered in this work and will be addressed in detail in future research.

Author Contributions

Conceptualisation, V.R., G.G., T.C.-C., P.R.-S. and F.T.-P.; methodology, V.R., G.G., T.C.-C., P.R.-S. and F.T.-P.; software, V.R.; resources, V.R.; writing—original draft preparation, V.R.; writing—review and editing, V.R., G.G., T.C.-C., P.R.-S. and F.T.-P.; funding acquisition, V.R., P.R.-S. and F.T.-P. All authors have read and agreed to the published version of the manuscript.

Funding

This research was partially funded by the Ports Towards Energy Self-Sufficiency (PORTOS) project co-financed by the Interreg Atlantic Area Programme through the European Regional Development Fund, grant number EAPA-784/2018. Furthermore, during this research, Victor Ramos has been supported by the program of Stimulus of Scientific Employment Individual Support (CEECIND/03665/2018) from the Portuguese Foundation of Science and Technology (FCT).

Institutional Review Board Statement

Not applicable.

Informed Consent Statement

Not applicable.

Data Availability Statement

Not applicable.

Conflicts of Interest

The authors declare no conflict of interest.

Abbreviations

The following abbreviations are used in this manuscript:
MREMarine Renewable Energy
GHGGreen House Gas Emissions
WECWave Energy Converter
PTOPower Take-Off
OWCOscillating Water Column
OTDOvertopping Device
WADWave Activated Device
GISGeographic Information System
LCoELevelised Cost of Energy
CAPEXCapital Expenditure
OPEXOperational Expenditure
ABEXAbandonment Expenditure
F-OWCFloating Oscillating Water Column
F-2HBFloating two-body Heaving Converter
BRef-SHBBottom referenced Submerged Heave-Buoy
B-OFBottom Oscillating Flap
B-HBABottom Heaving Buoy Array
SCISites of Community Importance

Appendix A. SWAN Numerical Model

Appendix A.1. SWAN Physics

SWAN is an open-source third-generation spectral wave model, which accounts for the different wave transformation processes by solving the wave action balance equation:
N t + · C N + c σ N σ + c θ N θ = S t o t σ ,
where C stands for the propagation velocity in the geographical space, σ and θ represent the relative frequency and direction of waves, respectively; c σ and c θ stand for the propagation velocities in spectral σ and θ space, respectively; and finally, N is the wave action density, which is defined as the variance density spectrum E ( σ , θ ) divided by the relative frequency:
N σ , θ = E σ , θ σ .
On the other hand, S t o t represents the source and sink terms, which take into account the physical processes of generation, dissipation and non-linear wave-wave interactions:
S t o t = S i n + S n l 3 + S n l 4 + S d s , w + S d s , b + S d s , b r ,
where S i n denotes the wave growth by wind; S n l 3 and S n l 4 refer to the non-linear transfer of wave energy through three-wave (triads) and four-wave (quadruplets) interactions, respectively; and lastly, S d s , w , S d s , b and S d s , b r represent the wave decay due to whitecapping [94], bottom friction [96] and depth-induced wave breaking [97], respectively.
SWAN computes the components of wave power per meter of wave front, J x and J y from the full wave spectrum E ( σ , θ ) , according to the following expressions:
J x = ρ g 0 2 π 0 c g ( σ , d ) E ( σ , θ ) cos ( θ ) d σ d θ ,
J y = ρ g 0 2 π 0 c g ( σ , d ) E ( σ , θ ) sin ( θ ) d σ d θ ,
where c g represents the group velocity, g is the acceleration due to gravity, ρ is the water density, and x, y are the grid coordinate directions. As a result, the wave power per meter of wave front, J, is calculated as:
J = J x 2 + J y 2 .

Appendix A.2. SWAN Model Implementation

As mentioned in Section 2.2, the wave numerical model implementation was performed following the recommendations of the IEC-62600-101 technical standard. Therefore, a regional model, which was implemented and successfully validated in [98], was used to generate high-resolution space-varying 2D wave spectrum boundary conditions for a local (Class 3) model. The local model spans the surrounding area of the Port of Leixões (Figure A1) and was implemented onto an unstructured grid, with a varying grid size, ranging from 5 to 265 m. This allows for an accurate representation of the bathymetry and coastlines (including the breakwaters of the port) of the area of study. In order to capture the seasonal variations of the wave resource, the model was run for a period of 30 years (from 1990 to 2020) with a frequency interval of 1 h, which translates into 263,000 sea states analysed. In addition, the local model was set to account for the tidal variations and, therefore, the values recorded by the tidal gauge of the port were fed into the model with a 3 h frequency. Finally, Table A1 summarises the main implementation characteristics of the local wave model.
Table A1. Input parameters for the LCoE model.
ParameterValue
IEC ClassClass 3 (Feasibility)
Grid typeUnstructured (Triangular shape)
Grid resolution5−265 m
Boundary conditions2D spectral. Spatially varying
Forcing factorsWind and water level variations
Run period1990−2020
Time resolution1 h
Figure A1. SWAN computational grid.
Jmse 10 01989 g0a1

References

  1. United Nations. Adoption of the Paris Agreement. United Nations Framework Convention on Climate Change (UNFCCC). 2015. Available online: https://unfccc.int/resource/docs/2015/cop21/eng/l09r01.pdf (accessed on 19 October 2019).
  2. United Nations. Transforming Our World, the 2030 Agenda for Sustainable Development. 2015. Available online: https://sdgs.un.org/2030agenda (accessed on 21 October 2019).
  3. European Commission. The European Green Deal. 2020. Available online: https://ec.europa.eu/info/sites/info/files/european-green-deal-communication_en.pdf (accessed on 4 October 2020).
  4. Alzahrani, A.; Petri, I.; Rezgui, Y.; Ghoroghi, A. Decarbonisation of seaports: A review and directions for future research. Energy Strateg. Rev. 2021, 38, 100727. [Google Scholar] [CrossRef]
  5. United Nations Conference on Trade and Development, UNCTAD. Review of Maritime Transport 2021; UNCTAD: Geneva, Switzerland, 2021; Available online: https://unctad.org/system/files/official-document/rmt2021_en_0.pdf (accessed on 14 November 2022).
  6. Cascajo, R.; García, E.; Quiles, E.; Correcher, A.; Morant, F. Integration of Marine Wave Energy Converters into Seaports: A Case Study in the Port of Valencia. Energies 2019, 12, 787. [Google Scholar] [CrossRef] [Green Version]
  7. Bachvarova, E.; Spasova, T.; Marinski, J. Air Pollution and Specific Meteorological Conditions at the Adjacent Areas of Sea Ports. IFAC-PapersOnLine 2018, 51, 378–383. [Google Scholar] [CrossRef]
  8. Hiranandani, V. Sustainable development in seaports: A multi-case study. WMU J. Marit. Aff. 2014, 13, 127–172. [Google Scholar] [CrossRef]
  9. Winnes, H.; Styhre, L.; Fridell, E. Reducing GHG emissions from ships in port areas. Res. Transp. Bus. Manag. 2015, 17, 73–82. [Google Scholar] [CrossRef] [Green Version]
  10. International Association of Ports and Harbours. World Ports Sustainability Program. 2020. Available online: https://sustainableworldports.org/ (accessed on 2 April 2022).
  11. World Ports Sustainability Program—International Association of Ports and Harbours. Port of Helsinki—Carbon Neutral Port 2035. 2019. Available online: https://sustainableworldports.org/project/port-of-helsinki-carbon-neutral-port-2035/ (accessed on 2 April 2022).
  12. Ajsa Habibic—Offshore Energy. Busan Port Outlines Roadmap to CARBON neutrality by 2050. 2022. Available online: https://www.offshore-energy.biz/busan-port-outlines-roadmap-to-carbon-neutrality-by-2050/ (accessed on 2 June 2022).
  13. Port Houston. Port Houston Commits to Carbon Neutrality by 2050. 2022. Available online: https://porthouston.com/wp-content/uploads/Port-Houston-commits-to-Carbon-Neutrality-by-2050.pdf (accessed on 10 June 2022).
  14. Spengler, T.; Tovar, B. Potential of cold-ironing for the reduction of externalities from in-port shipping emissions: The state-owned Spanish port system case. J. Environ. Manag. 2021, 279, 111807. [Google Scholar] [CrossRef]
  15. Wilmsmeier, G.; Spengler, T. Energy Consumption and Container Terminal Efficiency; Economic Commission for Latin America and the Caribbean—UN: Santiago, Chile, 2016. [Google Scholar]
  16. Ramos, V.; Carballo, R.; Alvarez, M.; Sanchez, M.; Iglesias, G. A port towards energy self-sufficiency using tidal stream power. Energy 2014, 71, 432–444. [Google Scholar] [CrossRef]
  17. Gunn, K.; Stock-Williams, C. Quantifying the global wave power resource. Renew. Energy 2012, 44, 296–304. [Google Scholar] [CrossRef]
  18. Mustapa, M.; Yaakob, O.; Ahmed, Y.M.; Rheem, C.K.; Koh, K.; Adnan, F.A. Wave energy device and breakwater integration: A review. Renew. Sustain. Energy Rev. 2017, 77, 43–58. [Google Scholar] [CrossRef]
  19. Aderinto, T.; Li, H. Ocean Wave Energy Converters: Status and Challenges. Energies 2018, 11, 1250. [Google Scholar] [CrossRef]
  20. López, I.; Andreu, J.; Ceballos, S.; de Alegría, I.M.; Kortabarria, I. Review of wave energy technologies and the necessary power-equipment. Renew. Sustain. Energy Rev. 2013, 27, 413–434. [Google Scholar] [CrossRef]
  21. Choupin, O.; Pinheiro Andutta, F.; Etemad-Shahidi, A.; Tomlinson, R. A decision-making process for wave energy converter and location pairing. Renew. Sustain. Energy Rev. 2021, 147, 111225. [Google Scholar] [CrossRef]
  22. European Commission. Working Group Ocean Energy. SET-Plan Ocean Energy Implementation Plan. 2018. Available online: https://setis.ec.europa.eu/system/files/set_plan_ocean_implementation_plan.pdf (accessed on 12 September 2019).
  23. Vicinanza, D.; Lauro, E.D.; Contestabile, P.; Gisonni, C.; Lara, J.L.; Losada, I.J. Review of innovative harbor breakwaters for wave-energy conversion. J. Waterw. Port Coastal Ocean Eng. 2019, 145, 03119001. [Google Scholar] [CrossRef]
  24. Vicinanza, D.; Contestabile, P.; Quvang Harck Nørgaard, J.; Lykke Andersen, T. Innovative rubble mound breakwaters for overtopping wave energy conversion. Coast. Eng. 2014, 88, 154–170. [Google Scholar] [CrossRef]
  25. Falcão, A.F.; Henriques, J.C. Oscillating-water-column wave energy converters and air turbines: A review. Renew. Energy 2016, 85, 1391–1424. [Google Scholar] [CrossRef]
  26. Koutrouveli, T.I.; Di Lauro, E.; das Neves, L.; Calheiros-Cabral, T.; Rosa-Santos, P.; Taveira-Pinto, F. Proof of Concept of a Breakwater-Integrated Hybrid Wave Energy Converter Using a Composite Modelling Approach. J. Mar. Sci. Eng. 2021, 9, 226. [Google Scholar] [CrossRef]
  27. Folley, M.; Whittaker, T. Analysis of the nearshore wave energy resource. Renew. Energy 2009, 34, 1709–1715. [Google Scholar] [CrossRef]
  28. Torre-Enciso, Y.; Ortubia, I.; De Aguileta, L.L.; Marqués, J. Mutriku wave power plant: From the thinking out to the reality. In Proceedings of the 8th European Wave and Tidal Energy Conference, Uppsala, Sweden, 7–10 September 2009; Volume 710, pp. 319–329. [Google Scholar]
  29. Arena, F.; Romolo, A.; Malara, G.; Fiamma, V.; Laface, V. The first full operative U-OWC plants in the port of Civitavecchia. In Proceedings of the International Conference on Offshore Mechanics and Arctic Engineering, Trondheim, Norway, 25–30 June 2017; American Society of Mechanical Engineers: New York, NY, USA, 2017; Volume 57786, p. V010T09A022. [Google Scholar]
  30. Contestabile, P.; Crispino, G.; Di Lauro, E.; Ferrante, V.; Gisonni, C.; Vicinanza, D. Overtopping breakwater for wave Energy Conversion: Review of state of art, recent advancements and what lies ahead. Renew. Energy 2020, 147, 705–718. [Google Scholar] [CrossRef]
  31. Eco Wave Power. Eco Wave Power Gibraltar Project. 2016. Available online: https://www.ecowavepower.com/gibraltar/ (accessed on 10 June 2022).
  32. Daniel Raj, D.; Sundar, V.; Sannasiraj, S. Enhancement of hydrodynamic performance of an Oscillating Water Column with harbour walls. Renew. Energy 2019, 132, 142–156. [Google Scholar] [CrossRef]
  33. Rezanejad, K.; Gadelho, J.; Guedes Soares, C. Hydrodynamic analysis of an oscillating water column wave energy converter in the stepped bottom condition using CFD. Renew. Energy 2019, 135, 1241–1259. [Google Scholar] [CrossRef]
  34. Bruce, T.; van der Meer, J.; Franco, L.; Pearson, J. Overtopping performance of different armour units for rubble mound breakwaters. Coast. Eng. 2009, 56, 166–179. [Google Scholar] [CrossRef]
  35. Palma, G.; Mizar Formentin, S.; Zanuttigh, B.; Contestabile, P.; Vicinanza, D. Numerical Simulations of the Hydraulic Performance of a Breakwater-Integrated Overtopping Wave Energy Converter. J. Mar. Sci. Eng. 2019, 7, 38. [Google Scholar] [CrossRef] [Green Version]
  36. López, I.; Pereiras, B.; Castro, F.; Iglesias, G. Optimisation of turbine-induced damping for an OWC wave energy converter using a RANS-VOF numerical model. Appl. Energy 2014, 127, 105–114. [Google Scholar] [CrossRef]
  37. Henriques, J.; Sheng, W.; Falcão, A.; Gato, L. A comparison of biradial and wells air turbines on the Mutriku breakwater OWC wave power plant. In Proceedings of the International Conference on Offshore Mechanics and Arctic Engineering, Trondheim, Norway, 25–30 June 2017; American Society of Mechanical Engineers: New York, NY, USA, 2017; Volume 57786. [Google Scholar]
  38. Mariani, A.; Crispino, G.; Contestabile, P.; Cascetta, F.; Gisonni, C.; Vicinanza, D.; Unich, A. Optimization of Low Head Axial-Flow Turbines for an Overtopping BReakwater for Energy Conversion: A Case Study. Energies 2021, 14, 4618. [Google Scholar] [CrossRef]
  39. Thiruvenkatasamy, K.; Neelamani, S.; Sato, M. Nonbreaking wave forces on multiresonant oscillating water column wave power caisson breakwater. J. Waterw. Port Coast. Ocean Eng. 2005, 131, 77–84. [Google Scholar] [CrossRef]
  40. Kuo, Y.S.; Lin, C.S.; Chung, C.Y.; Wang, Y.K. Wave loading distribution of oscillating water column caisson breakwaters under non-breaking wave forces. J. Mar. Sci. Technol. 2015, 23, 10. [Google Scholar]
  41. Di Lauro, E.; Lara, J.L.; Maza, M.; Losada, I.J.; Contestabile, P.; Vicinanza, D. Stability analysis of a non-conventional breakwater for wave energy conversion. Coast. Eng. 2019, 145, 36–52. [Google Scholar] [CrossRef]
  42. Contestabile, P.; Di Lauro, E.; Buccino, M.; Vicinanza, D. Economic Assessment of Overtopping BReakwater for Energy Conversion (OBREC): A Case Study in Western Australia. Sustainability 2017, 9, 51. [Google Scholar] [CrossRef]
  43. Patrizi, N.; Pulselli, R.M.; Neri, E.; Niccolucci, V.; Vicinanza, D.; Contestabile, P.; Bastianoni, S. Lifecycle Environmental Impact Assessment of an Overtopping Wave Energy Converter Embedded in Breakwater Systems. Front. Energy Res. 2019, 7, 32. [Google Scholar] [CrossRef] [Green Version]
  44. Rosa-Santos, P.; Taveira-Pinto, F.; Clemente, D.; Cabral, T.; Fiorentin, F.; Belga, F.; Morais, T. Experimental Study of a Hybrid Wave Energy Converter Integrated in a Harbor Breakwater. J. Mar. Sci. Eng. 2019, 7, 33. [Google Scholar] [CrossRef] [Green Version]
  45. Astariz, S.; Iglesias, G. The economics of wave energy: A review. Renew. Sustain. Energy Rev. 2015, 45, 397–408. [Google Scholar] [CrossRef]
  46. Abanades, J.; Greaves, D.; Iglesias, G. Coastal defence through wave farms. Coast. Eng. 2014, 91, 299–307. [Google Scholar] [CrossRef] [Green Version]
  47. Rodriguez-Delgado, C.; Bergillos, R.J.; Ortega-Sánchez, M.; Iglesias, G. Protection of gravel-dominated coasts through wave farms: Layout and shoreline evolution. Sci. Total Environ. 2018, 636, 1541–1552. [Google Scholar] [CrossRef]
  48. Rodriguez-Delgado, C.; Bergillos, R.J.; Iglesias, G. Dual wave farms for energy production and coastal protection under sea level rise. J. Clean. Prod. 2019, 222, 364–372. [Google Scholar] [CrossRef]
  49. Costas, R.; Figuero, A.; Peña, E.; Sande, J.; Rosa-Santos, P. Integrated approach to assess resonance between basin eigenmodes and moored ship motions with wavelet transform analysis and proposal of operational thresholds. Ocean Eng. 2022, 247, 110678. [Google Scholar] [CrossRef]
  50. Zheng, Z.; Ma, X.; Huang, X.; Ma, Y.; Dong, G. Wave forecasting within a port using WAVEWATCH III and artificial neural networks. Ocean Eng. 2022, 255, 111475. [Google Scholar] [CrossRef]
  51. Dong, G.; Zheng, Z.; Ma, X.; Huang, X. Characteristics of low-frequency oscillations in the Hambantota Port during the southwest monsoon. Ocean Eng. 2020, 208, 107408. [Google Scholar] [CrossRef]
  52. López, I.; López, M.; Iglesias, G. Artificial neural networks applied to port operability assessment. Ocean Eng. 2015, 109, 298–308. [Google Scholar] [CrossRef]
  53. Zheng, Z.; Ma, X.; Ma, Y.; Dong, G. Wave estimation within a port using a fully nonlinear Boussinesq wave model and artificial neural networks. Ocean Eng. 2020, 216, 108073. [Google Scholar] [CrossRef]
  54. Arean, N.; Carballo, R.; Iglesias, G. An integrated approach for the installation of a wave farm. Energy 2017, 138, 910–919. [Google Scholar] [CrossRef]
  55. Foteinis, S.; Tsoutsos, T. Strategies to improve sustainability and offset the initial high capital expenditure of wave energy converters (WECs). Renew. Sustain. Energy Rev. 2017, 70, 775–785. [Google Scholar] [CrossRef]
  56. Ramos, V.; López, M.; Taveira-Pinto, F.; Rosa-Santos, P. Influence of the wave climate seasonality on the performance of a wave energy converter: A case study. Energy 2017, 135, 303–316. [Google Scholar] [CrossRef]
  57. Carballo, R.; Arean, N.; Álvarez, M.; López, I.; Castro, A.; López, M.; Iglesias, G. Wave farm planning through high-resolution resource and performance characterization. Renew. Energy 2019, 135, 1097–1107. [Google Scholar] [CrossRef]
  58. Zhao, X.; Ning, D.; Zou, Q.; Qiao, D.; Cai, S. Hybrid floating breakwater-WEC system: A review. Ocean Eng. 2019, 186, 106126. [Google Scholar] [CrossRef]
  59. Cabral, T.; Clemente, D.; Rosa-Santos, P.; Taveira-Pinto, F.; Morais, T.; Belga, F.; Cestaro, H. Performance Assessment of a Hybrid Wave Energy Converter Integrated into a Harbor Breakwater. Energies 2020, 13, 236. [Google Scholar] [CrossRef] [Green Version]
  60. Calheiros-Cabral, T.; Clemente, D.; Rosa-Santos, P.; Taveira-Pinto, F.; Ramos, V.; Morais, T.; Cestaro, H. Evaluation of the annual electricity production of a hybrid breakwater-integrated wave energy converter. Energy 2020, 213, 118845. [Google Scholar] [CrossRef]
  61. Vicinanza, D.; Margheritini, L.; Kofoed, J.P.; Buccino, M. The SSG Wave Energy Converter: Performance, Status and Recent Developments. Energies 2012, 5, 193–226. [Google Scholar] [CrossRef] [Green Version]
  62. Margheritini, L.; Vicinanza, D.; Kofoed, J.P. Overtopping performance of Sea wave Slot cone Generator. In Coasts, Marine Structures and Breakwaters: Adapting to Change: Proceedings of the 9th International Conference Organised by the Institution of Civil Engineers and Held in Edinburgh on 16 to 18 September 2009; Thomas Telford Ltd.: London, UK, 2010; pp. 750–761. [Google Scholar]
  63. Medina-López, E.; Allsop, W.; Dimakopoulos, A.; Bruce, T. Damage to the Mutriku OWC breakwater—Some lessons from further analysis. In Coasts, Marine Structures and Breakwaters 2017; Thomas Telford Ltd.: London, UK, 2018; pp. 957–967. [Google Scholar] [CrossRef]
  64. IEC-TS 62600-101; Marine Energy Wave, Tidal and Other Water Current Converters—Part 101: Wave Energy Resource Assessment and Characterisation. IEC: Geneva, Switzerland, 2014.
  65. Ramos, V.; Ringwood, J.V. Exploring the utility and effectiveness of the IEC (International Electrotechnical Commission) wave energy resource assessment and characterisation standard: A case study. Energy 2016, 107, 668–682. [Google Scholar] [CrossRef] [Green Version]
  66. Cornett, A.; Baker, S.; Toupin, M.; Piche, S.; Nistor, I. Appraisal of IEC Standards for Wave and Tidal Energy Resource Assessment. In Proceedings of the International Conference on Ocean Energy (ICOE), Halifax, NS, Canada, 4–6 November 2014. [Google Scholar]
  67. Álvarez, M.; Ramos, V.; Carballo, R.; López, I.; Fouz, D.; Iglesias, G. Application of Marine Spatial Planning tools for tidal stream farm micro-siting. Ocean Coast. Manag. 2022, 220, 106063. [Google Scholar] [CrossRef]
  68. Castro-Santos, L.; Lamas-Galdo, M.I.; Filgueira-Vizoso, A. Managing the oceans: Site selection of a floating offshore wind farm based on GIS spatial analysis. Mar. Policy 2020, 113, 103803. [Google Scholar] [CrossRef]
  69. Babarit, A. A database of capture width ratio of wave energy converters. Renew. Energy 2015, 80, 610–628. [Google Scholar] [CrossRef] [Green Version]
  70. Bozzi, S.; Besio, G.; Passoni, G. Wave power technologies for the Mediterranean offshore: Scaling and performance analysis. Coast. Eng. 2018, 136, 130–146. [Google Scholar] [CrossRef]
  71. Oliveira-Pinto, S.; Rosa-Santos, P.; Taveira-Pinto, F. Electricity supply to offshore oil and gas platforms from renewable ocean wave energy: Overview and case study analysis. Energy Convers. Manag. 2019, 186, 556–569. [Google Scholar] [CrossRef]
  72. Clark, C.E.; Miller, A.; DuPont, B. An analytical cost model for co-located floating wind-wave energy arrays. Renew. Energy 2019, 132, 885–897. [Google Scholar] [CrossRef]
  73. Pecher, A.; Kofoed, J.P. Handbook of Ocean Wave Energy; Springer Nature: Berlin/Heidelberg, Germany, 2017. [Google Scholar] [CrossRef] [Green Version]
  74. De Andres, A.; Medina-Lopez, E.; Crooks, D.; Roberts, O.; Jeffrey, H. On the reversed LCOE calculation: Design constraints for wave energy commercialization. Int. J. Mar. Energy 2017, 18, 88–108. [Google Scholar] [CrossRef]
  75. Guanche, R.; de Andrés, A.; Simal, P.; Vidal, C.; Losada, I. Uncertainty analysis of wave energy farms financial indicators. Renew. Energy 2014, 68, 570–580. [Google Scholar] [CrossRef]
  76. Giannini, G.; Rosa-Santos, P.; Ramos, V.; Taveira-Pinto, F. Wave energy converters design combining hydrodynamic performance and structural assessment. Energy 2022, 249, 123641. [Google Scholar] [CrossRef]
  77. Myhr, A.; Bjerkseter, C.; Ågotnes, A.; Nygaard, T.A. Levelised cost of energy for offshore floating wind turbines in a life cycle perspective. Renew. Energy 2014, 66, 714–728. [Google Scholar] [CrossRef] [Green Version]
  78. O’Connor, M.; Lewis, T.; Dalton, G. Operational expenditure costs for wave energy projects and impacts on financial returns. Renew. Energy 2013, 50, 1119–1131. [Google Scholar] [CrossRef]
  79. Ramos, V.; Calheiros-Cabral, T.; Rosa-Santos, P.; Taveira-Pinto, F. Multiparameter Characterisation of the Port of Leixões. Deliverable 5.1 PORTOS Project; Technical Report; Faculdade de Engenharia da Universidade do Porto: Porto, Portugal, 2019. [Google Scholar]
  80. Port of Lexiões. APDL. 2035 Port of Leixões Will Be the First Port with Zero Emissions by 2035. 2022. Available online: http://www.apdl.pt/en_US/web/apdl/header (accessed on 11 March 2022).
  81. International Water Power and Dam Construction. Eco Wave Power in Agreement with APDL for Wave Power Development in Portugal. 2020. Available online: https://www.waterpowermagazine.com/news/eco-wave-power-in-agreement-with-apdl-for-wave-power-development-in-portugal (accessed on 21 September 2020).
  82. Magalhães, A.; Barbosa, R.; Ferreira, V.; Cardoso, J. Energy Consumption Characterisation—Port of Leixões. Deliverable 5.3 PORTOS Project; Technical Report; Faculdade de Engenharia da Universidade do Porto: Porto, Portugal, 2019. [Google Scholar]
  83. Ramos, V.; Giannini, G.; Calheiros-Cabral, T.; Rosa-Santos, P.; Taveira-Pinto, F. Legal framework of marine renewable energy: A review for the Atlantic region of Europe. Renew. Sustain. Energy Rev. 2021, 137, 110608. [Google Scholar] [CrossRef]
  84. General Directorate for Natural Resources, Safety and Marine Services. Situation Plan. Portugal Maritime Spatial Plan. 2022. Available online: https://www.psoem.pt/geoportal_psoem/ (accessed on 10 July 2022).
  85. Babarit, A.; Hals, J.; Muliawan, M.; Kurniawan, A.; Moan, T.; Krokstad, J. Numerical benchmarking study of a selection of wave energy converters. Renew. Energy 2012, 41, 44–63. [Google Scholar] [CrossRef]
  86. Ocean Energy Limited. OE Buoy. 2008. Available online: https://oceanenergy.ie/oe-buoy/ (accessed on 21 May 2022).
  87. Weber, J.; Mouwen, F.; Parish, A.; Robertson, D. Wavebob-research & development network and tools in the context of systems engineering. In Proceedings of the Eighth European Wave and Tidal Energy Conference, Uppsala, Sweden, 7–10 September 2009; Volume 8, pp. 416–420. [Google Scholar]
  88. Carnegie Clean Energy. CETO Technology. Available online: https://www.carnegiece.com/ceto-technology/ (accessed on 22 January 2020).
  89. Whittaker, T.; Collier, D.; Folley, M.; Osterried, M.; Henry, A.; Crowley, M. The development of Oyster: A shallow water surging wave energy converter. In Proceedings of the 7th European Wave and Tidal Energy Conference, Porto, Portugal, 11–14 September 2007; pp. 11–14. [Google Scholar]
  90. WAVESTAR Energy. WAVESTAR Concept. 2011. Available online: http://wavestarenergy.com/concept (accessed on 12 June 2022).
  91. Giannini, G.; López, M.; Ramos, V.; Rodríguez, C.A.; Rosa-Santos, P.; Taveira-Pinto, F. Geometry assessment of a sloped type wave energy converter. Renew. Energy 2021, 171, 672–686. [Google Scholar] [CrossRef]
  92. Rodríguez, C.A.; Rosa-Santos, P.; Taveira-Pinto, F. Hydrodynamic optimization of the geometry of a sloped-motion wave energy converter. Ocean Eng. 2020, 199, 107046. [Google Scholar] [CrossRef]
  93. Giannini, G.; Rosa-Santos, P.; Ramos, V.; Taveira-Pinto, F. On the Development of an Offshore Version of the CECO Wave Energy Converter. Energies 2020, 13, 1036. [Google Scholar] [CrossRef] [Green Version]
  94. Delft University of Techonology. SWAN User Manual; Delft University of Techonology: Delft, The Netherlands, 1993. [Google Scholar]
  95. Ramos, V.; Giannini, G.; Calheiros-Cabral, T.; López, M.; Rosa-Santos, P.; Taveira-Pinto, F. Assessing the Effectiveness of a Novel WEC Concept as a Co-Located Solution for Offshore Wind Farms. J. Mar. Sci. Eng. 2022, 10, 267. [Google Scholar] [CrossRef]
  96. Van der Westhuysen, A.J. The Application of the Numerical Wind-Wave Model SWAN to a Selected Field Case on the South African Coast. Master’s Thesis, University of Stellenbosch, Stellenbosch, South Africa, 2002; pp. 123–145. [Google Scholar]
  97. Booij, N.; Ris, R.C.; Holthuijsen, L.H. A third-generation wave model for coastal regions I. Model description and validation. J. Geophys. Res. C Oceans 1999, 104, 7649–7666. [Google Scholar] [CrossRef] [Green Version]
  98. Ramos, V.; López, M.; Taveira-Pinto, F.; Rosa-Santos, P. Performance assessment of the CECO wave energy converter: Water depth influence. Renew. Energy 2018, 117, 341–356. [Google Scholar] [CrossRef]
Figure 1. Location (a) and main terminals (b) of Port of Leixões.
Jmse 10 01989 g001
Figure 2. General overview of the integrated methodology to select the optimal WEC-site combination for the energy supply of seaports.
Jmse 10 01989 g002
Figure 3. Energy consumption patterns of Port of Leixões.
Jmse 10 01989 g003
Figure 4. Marine uses in the surrounding areas of Port of Leixões [84].
Jmse 10 01989 g004
Figure 5. Wave power matrices of the case-study WECs (Numbers represent the mean power production for each sea-state bin. Colourmap represents the power produced for the different sea states).
Jmse 10 01989 g005
Figure 6. Spatial distribution of the wave annual energy resource.
Jmse 10 01989 g006
Figure 7. Example of suitable areas for the exploitation of the wave energy resource in the vicinity of Port of Leixões.
Jmse 10 01989 g007
Figure 8. Wave energy resource matrices for the potential wave energy sites (Colourmap represents the annual energy per meter of wave front and the numbers represent the occurrence in annual hours for each sea state ( O i )).
Jmse 10 01989 g008
Table 1. Summary of unitary mooring and foundation costs.
ParameterCostReference
MooringsCatenary Steel WireEUR 22.5/m[71,77]
Vertical Steel WireEUR 67.0/m[71,77]
TetherEUR 440.0/m[71,77]
FoundationsSuction pileEUR 51,227/unit[71,77]
Concrete Mounting PlateEUR 75,000/unit[71,77]
Embedded anchorEUR 165,000/unit[71,77]
Table 2. Main characteristics of case-study WECs.
F-OWCF-2HBBref-SHBB-OFB-HBAoCECO
Rated Power (kW)2880100026033302710500
Capture width, B (m)242072610012
Mass (ton)15657183538001600358
FoundationSuction pileSuction pileSuction pileSteel frameJack-up structureSuction pile
MooringCatenaryCatenaryTether--Tether
Mooring lines331--3
Manufacturing1.051.051.101.201.201.10
complexity factor, f
Table 3. Input parameters for the LCoE model.
ParameterValue
Lifespan (years)20
Inflation rate, r i ( % ) 2
Loan rate, r l ( % ) 10
O P E X (% C A P E X )5
Discount factor ( χ )0.9
Table 4. Techno-economic optimisation of case-study WECs.
LocationWEC λ B (m)Mass (ton)Rated Power (kW)LCoE (EUR/MWh)
Area IoCECO0.9912.05362.2507387.6
F-OWC1.2619.05782.51283594.2
F-2HB1.0918.43561.5751470.6
Bref-SHB0.759.2681.7699555.2
Area IIB-HBA1.1686.211025.21612621.8
B-OF1.2620.711920.11503714.9
Table 5. Input parameters for the LCoE model.
LocationWEC LCoE ref (EUR/MWh) LCoE opt (EUR/MWh)
Area IoCECO389.3387.6
F-OWC704.5594.2
F-2HB495.6470.6
Bref-SHB603.6555.2
Area IIB-HBA705.4621.8
B-OF843.3714.9
Table 6. Performance assessment of the optimised WECs.
LocationWEC E t (GWh/year) C f (%) CWR (%)
Area IoCECO1.3330.1449.41
F-OWC0.928.1523.34
F-2HB0.8613.1022.66
Bref-SHB0.243.9312.59
Area IIB-HBA0.936.566.87
B-OF1.199.0344.20
Publisher’s Note: MDPI stays neutral with regard to jurisdictional claims in published maps and institutional affiliations.

