Abstract
The condition of an offshore wind turbine (OWT) should be monitored to assure its reliability against various environmental loads and affections. The modal parameters of the OWT can be used as an indicator of its condition. This paper combines the Kalman filter, the random decrement technique (RDT), and the stochastic subspace identification (SSI) methods and proposes an RDT-SSI method to estimate the operational frequency of an OWT subjected to ambient excitation. This method imposes no requirement on the input/loads; therefore, it is relatively easy for field application. An experimental study with a small-scale OWT was conducted to verify the accuracy of the proposed RDT-SSI method. The test results implied that the frequency estimated by the RDT-SSI method is close to that estimated by an impact hammer test. Moreover, the small-scale OWT was buried at different embedment depths to simulate the influence of the scouring phenomenon, and the frequency of the OWT decreased with decreasing embedment depth. Additionally, the bolts at the root of the turbine blades were also loosened to investigate their influence on the frequency. As more blades were loosened, the identified frequency of the OWT also decreased, indicating that the proposed RDT-SSI method can be employed for the health monitoring of an OWT.
1. Introduction
With the rapid-growing demand for green energy, the first decade of the 21st century has witnessed a massive construction of wind farms, especially offshore wind farms [1,2]. In 2021, a 94 GW capacity was newly connected to the power grid around the world. The cumulative installed wind power capacity reached 837 GW, equivalent to reducing 1.2 billion tons of CO2 per year [3].
Along with the rapid development of offshore wind farms, the damage or destruction of offshore wind turbines (OWTs) has been reported recently. In 2003, Typhoon Maemi hit Miyakojima Island with a peak speed of 74.1 m/s, causing two turbines to buckle and one turbine to be blown over. The blades and other components of another three turbines were also severely damaged [4]. In 2013, super typhoon Usagi destroyed a coastal wind farm in Shanwei, China. Eight turbines were blown over by the strong winds, and all other turbines were significantly damaged [5]. In 2015, Typhoon Soudelor attacked the island of Taiwan, causing a 2.0 MW wind turbine to collapse [6]. Floating ice is another major hazard facing OWTs located in cold regions. Lou investigated the fatigue damage of OWTs in the Bohai Sea of China and found that the effect of the wind loads and the floating ice were equivalent [7]. Ye et al. employed the Matlock model and the Määttänen model to simulate ice-induced vibration (IIV) and the self-excited ice-induced vibration of the NREL 5 MW OWT. The numerical results indicated that the IIV strongly affects a specific frequency range [8].
Besides the collapse caused by extreme dynamic excitations, continuous loading and other environmental factors also result in degradation during the service life of an OWT. Liu et al. investigated the foundation of an OWT subjected to cyclic lateral loadings. The test results demonstrated that the lateral stiffness and the bearing capacity decrease after repetitive loading, and the severe disturbance range of the soil around the pile is two to three times the pile diameter [9]. Ernst and Seume [10] studied the fatigue of a 5 MW wind turbine based on on-site wind field parameters. The results showed that the IEC (the International Electrotechnical Commission) standard is very conservative for the design of the blades, and consequently, the geometry of the blades can be further optimized considering the influence of wind shear exponent and turbulence intensity. Márquez-Domínguez and Sørensen [11] used a reliability-based approach to analyze the fatigue failure of an OWT and suggested that inspections be conducted in order to extend and maintain a given target safety level.
Simultaneously with the construction of OWTs, researchers and engineers have also paid more attention to the structural health monitoring (SHM) of OWTs [12,13] for the following purposes: (1) to reduce malfunction duration; (2) to obtain more data on loads and environmental affections; (3) to optimize the maintenance process. Sinha and Steel [14] proposed a risk-based failure analysis tool for SHM of the wind turbine gearbox. Schubel et al. [15] summarized the state-of-the-art SHM system of the blades. Yang and Sun [16] reviewed the methods regarding mechanical property testing, non-destructive testing, full-scale testing, and conditioning monitoring of wind turbine blades. Similar reviews can also be found in [17,18,19]. Besides the condition monitoring systems (CMSs) and supervisory control and data acquisition (SCADA) systems already imbedded for evaluation and operation of the electromechanical components of OWTs, additional SHM systems have also been installed to obtain other variants, including but not limited to vibration signals [12,20], strains [21], acoustic emissions [22], and ultrasonic signals [23,24].
Vibration-based health monitoring, particularly operational modal analysis (OMA) techniques, can provide modal parameters of a large-scale structure subjected to environmental loads. Zheng et al. introduced the cross-correlation function to conventional modal parameter estimation, by which modal characteristics can be estimated with response-only data [25]. Peeters and De Roeck reviewed the stochastic system identification methods used for vibrating structures in operational conditions [26]. Brincker and Ventura established a stochastic frame for OMA [27]. Zahid et al. [28] summarized the widely accepted techniques for OMA, including peak picking, frequency domain decomposition (FDD), natural excitation technique (NExT), auto-regressive moving average (ARMA), etc. The shortcoming of the traditional OMA was discussed, and the synchronous modal analysis method was proposed as an improvement. Rainieri and Fabbrocino [29] organized the literature within the scope of output-only modal testing and provided a fundamental framework for OMA based on programmable hardware. Researchers have introduced OMA methods to the SHM of OWTs. Hu et al. [30] proposed a strain-based automated operational modal analysis algorithm to evaluate the status of an OWT during operation. Dolinski and Krawczuk [31] proposed a modal information-based diagnostic method to identify damage to OWT blades. Pacheco et al. [32] installed an SHM system on a Senvion MM82 wind turbine to estimate its modal properties. The influence of the sensor layout and sensor noise was discussed in detail. Kim et al. [33] composed a time-domain turbine-floater-mooring fully coupled dynamic program and used the obtained numerical-sensor signal to perform damage detection.
The random decrement technique (RDT) is one commonly accepted method for OMA. It can pick up the free-time-decaying signal of a structure under unknown excitation. This method can date back to 1968 when Cole [34] proposed to translate the random vibration of a single-degree-of-freedom system into a sum of autocorrelation functions. Afterward, Ibrahim [35] conducted an experimental study on a generalized payload model and a space shuttle model to verify the feasibility of RDT in picking up the free vibration response of structures subjected to random excitation. Vandiver et al. explained the mathematical basis for the RDT [36]. Asmussen [37] systematically presented the theoretical details of the RDT and applied this method to existing bridges. Brincker and Amador [38] reviewed the development of the RDT and explained that the RD function turns out to be a linear combination of the cross-correlation function and its derivative. Recently, Vesterholm et al. [39,40] applied the RDT for the OMA of nonlinear systems by introducing a set of triggering points.
Stochastic subspace identification (SSI) is another method commonly accepted for system identification. It can estimate the modal properties of large-scale structures with a high level of noise. The RDT and the SSI have also been combined for the identification of modal parameters. Silva et al. [41] proposed the use of random decrement functions as bootstrap resampling blocks in SSI. Both numerical and experimental results demonstrated the robustness and accuracy of this method. Rodrigues [42] combined the RDT method with the covariance-driven SSI (SSI-COV) method to estimate the frequency of a railway bridge. This method was also compared with an RDT-FDD method.
Apart from the structural health monitoring systems and associated algorithms applied for full-size OWTs, experimental studies have also been performed to replicate the damages of OWTs. Siebel et al. [43] installed a wind turbine model on the roof of a building. The artificial damage was achieved by assembling and disassembling a bar of the pedestal. The modal strain energy method and the gapped smoothing technique were applied to detect the damage to the wind turbine model. Mieloszyk and Ostachowicz [44] established a fiber Bragg grating sensor-based health monitoring system on a tripod-type OWT. The OWT model was fixed in a water basin and was subjected to an artificial wave load. A flange was utilized to simulate a circumferential crack in the leg. The experimental results confirmed the feasibility of the FDD (frequency domain decomposition) method in detecting and localizing structural damage. Ou et al. [45] established a benchmark case study based on a small-scale wind turbine. Two groups of damages were considered. One group aimed to simulate the icing accretion on the blades. The other group focused on the cracks of varying characteristics. The experimental results were also made available via an open-access repository. Di Lorenzo et al. [46] used the OMA tool to identify the cracks in a wind turbine blade. The experimental results suggested that the natural frequency of the blade shifted after buckling [47].
This paper proposes the combination of the Kalman filter with the RDT method and the SSI method to estimate the first-order frequency of an OWT model while it is rotating. The estimated parameter will be used as an indicator of early-stage damage. In this study, a damage condition was achieved by manually loosening the screws at the root of the blades and removing the sand to simulate scouring. The experimental results suggested that: (1) the natural frequency of the OWT can be estimated by the proposed RDT-SSI method during operation, and (2) the looseness of the bolts causes variation in the natural frequency, and this can be used as an indicator of the condition of the OWT. The rest of this paper is organized as follows: Section 2.1, Section 2.2 and Section 2.3 present the theory of the Kalman filter, the RDT method, and the SSI method. In Section 3, the proposed RDT-SSI method is verified by an experiment with a scaled OWT model. In Section 3.2 and Section 3.3, the influence of the embedment and the loosening of turbine blades are investigated. In the end, the major findings and limitations of this study are summarized to conclude this paper.
2. Modal Parameter Identification from Ambient Vibration
This paper proposes the combination of the Kalman filter and RDT and SSI methods to estimate the modal parameters of an OWT under ambient vibration. Suppose the OWT is a structure with n degrees of freedom (DOF), then its equation of motion is as follows:
in which , , and are the mass matrix, the damping matrix, and the stiffness matrix, respectively; , , and are the acceleration, velocity, and displacement vector; denotes the external excitation. This equation can also be expressed in the state-space form:
where and are the state and output vectors, respectively. Assuming that the time interval is , then Equation (2) can be written in the discrete form:
where and are the discrete-time vector and the measured response. A denotes the state (or system) matrix; B is the input matrix; C is the output matrix; D is the feedthrough (or feedforward) matrix.
2.1. Kalman Filter
All recorded signals are mixed with some certain level of noise. Consequently, various types of filters have been proposed to separate the signal from the noisy data. The commonly used digital filters include the Butterworth filter, the Chebyshev filter, the Chebyshev II filter, the Bessel filter, and the Kalman filter. The Kalman filter can estimate the quantity of a system based on its dynamic model and recorded data from previous steps. The property of the noise is not needed for filtering. Therefore, it has been widely accepted for structural health monitoring, prediction, and vibration control. In this paper, the recorded response of the OWT was filtered before using the RDT-SSI method.
Considering the noise and the errors in establishing the dynamic model, Equation (3) can be changed into:
where represents the measurement result; represents the process noise; is the measurement noise; , , and in subscript indicate a time unit. is the state variable of the measurement conversion matrix. Assuming that the noises obey a normal distribution yields
where is the covariance matrix of the process noise; is the covariance matrix of the measurement noise. The prior and posterior estimates of the Kalman filter can be written as:
in which denotes the a priori state estimate at the time ; is the posterior estimate; is the posteriori state estimate at the time ; is the measurement, which is also the input to the filter; is the state variable to the measurement conversion matrix. computes the measurement innovation or the residual. is the Kalman filter gain, which can be determined by minimizing the posteriori estimate error .
Similarly, a priori estimate error is defined as
Then, the priori estimate error covariance and posteriori estimate error covariance are defined as:
According to the literature [42,48], , , and can be determined by the minimization of :
The aforementioned equations can be used in the following process to obtain the response of the OWT, as illustrated in Figure 1. The Kalman filter is composed of two functions: the predict function and the update function. The predict function can calculate the state and error covariance of the next moment based on the previous moment (Equations (7) and (13)). Then, in the update function, the Kalman gain is calculated using Equation (14); the posterior estimate is calculated based on the measured data using Equation (8).
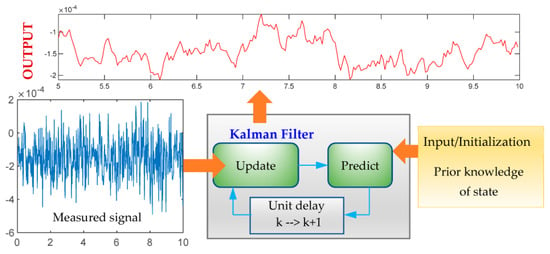
Figure 1.
Kalman filtering.
2.2. Random Decrement Technique
Even though the free vibration signal of a small-scale structure can be easily recorded by an impact hammer, that of mega structures, such as long-span bridges and high-rise buildings, can hardly be obtained. To address this issue, the RDT method is proposed to separate the free vibration signal from the random response of a structure under ambient excitations. The RDT method is based on the linear superposition principle. For a linear time-invariant system, for which the motion equation is:
The response can be expressed as:
where and are the initial displacement and initial velocity, respectively; is the free vibration response of the displacement with an initial displacement of 1 and initial velocity of 0; is the free vibration response of velocity.
In Equation (17), the integral part represents the response of the system caused by random vibration; is the unit impulse response function; is the external excitation function.
By choosing a constant and making a line with , a series of different intersections corresponding to the moment’s can be obtained. The response after time is a combination of three parts: the free vibration response caused by the initial displacement , the free vibration caused by the initial velocity , and the response of forced vibration:
Because the excitation is stationary, the starting point of time does not affect the stochastic properties of the structure. Moving the starting point from to 0 yields:
The average of is
Because the excitation u(t) is a steady random vibration with a mean value of 0, the vibration response q(t) can be expressed as:
The whole process of the RDT is shown in Figure 2.
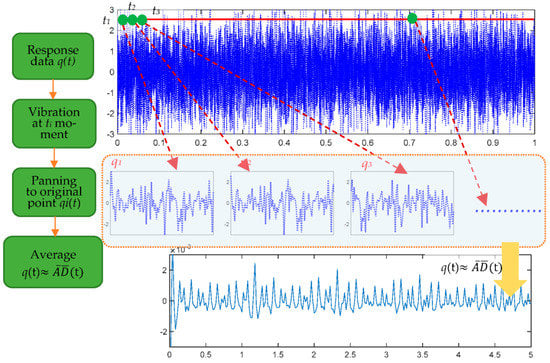
Figure 2.
The RDT process.
2.3. Stochastic Subspace Identification
The SSI method is another time-domain method for the modal parameter identification of structures subjected to ambient excitation. It consists of two major types of methods: the covariance-driven stochastic subspace identification (COV-SSI) and the data-driven stochastic subspace identification (DATA-SSI). This paper uses the latter to obtain the modal frequency of the OWT structure. The basic theorem is as follows [49,50,51]:
The discrete state-space equations for a multi-degree-of-freedom system can be rewritten as:
where is the error generated in the modeling process; is the error caused in the measurement. Both and are assumed to be white noise with a mean of zero. Furthermore, the environmental excitation is also assumed to be a random excitation. Its intensity is difficult to measure, and its impact is similar to noise. Therefore, the input term and the noise terms and are combined and rewritten as the following discrete state-space equations:
in which A and C denote the n × n order state matrix and m × n order output matrix, respectively. The system’s dynamic characteristics are represented by the eigenvalues and eigenvectors of the matrix A. Construct the 2mi × j dimension Hankel matrix the output data of the system:
Here, denotes all response data at the moment; is the number of sampled points. is the first rows of the Hankel matrix, . is the to rows of . Therefore, it can be considered that is delayed by to + 1 steps (i.e., steps). Normally, is regarded as the “past” part, and is regarded as the “future” part. The next step is the QR decomposition of the Hankel matrix, :
According to projection theory, the orthogonal projection of row space is obtained by projecting the “future” output row space onto the “past” output row space [32,33]:
The SVD decomposition of is
where is a diagonal matrix. is decomposed as the production of the observability matrix and the Kalman filter state sequence .
Here, ()+ is Moore–Penrose pseudo-inverse. Similarly, of the next time step can be defined as ([31,32]):
Therefore,
The state space equation can be described as:
The system matrix A and the output matrix C can be obtained:
Using the eigenvalue decomposition method to decompose A yields
where is the diagonal matrix. is the ith eigenvalue; is the system eigenvector matrix. The cyclic frequency and the mode shapes can be obtained:
The basic flow of the random subspace is shown in Figure 3:
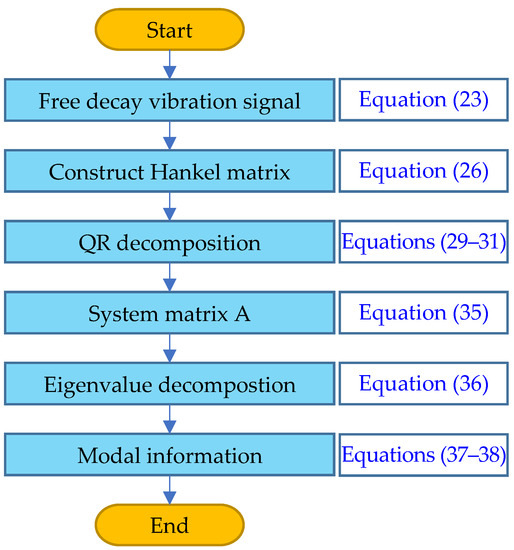
Figure 3.
The SSI process.
3. Experimental Investigation
In this study, an experimental test was conducted based on a small-scale wind turbine to verify the proposed RDT-SSI method. The first-order frequency estimated by the RDT-SSI method was close to that estimated by the impact test. Moreover, two damage conditions (the changing of the embedment depth and the loosening of blade bolts) were performed. The RDT-SSI method can identify the variation in the first-order frequency of the OWT caused by the two damage conditions.
3.1. Experimental Setup
The experimental facility was mainly composed of two parts. One part was the model OWT and its control system. The other part was the data acquisition system. As shown in Figure 4, the model OWT was composed of a 2 m high tower, a nacelle, and three 60 cm long blades. The blades were made of polymethyl methacrylate (PMMA). Its geometry can be found in Figure 4b. The blades were fixed to the nacelle with screws, as shown in Figure 4c. In the experimental study, those crews were manually loosened to simulate damage to the blade connection. Other facilities inside a real nacelle, such as the gearbox, the generator, and the brake, were not installed in the OWT model due to the limited space of the nacelle.
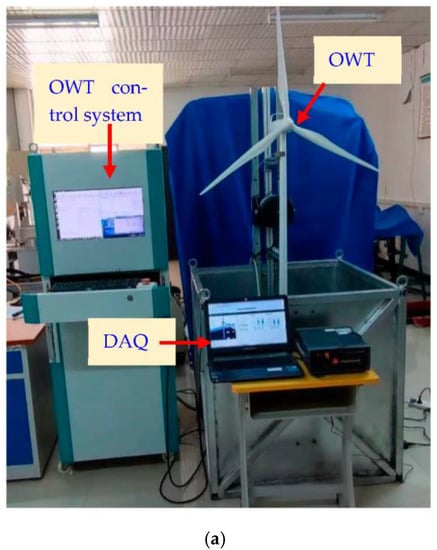
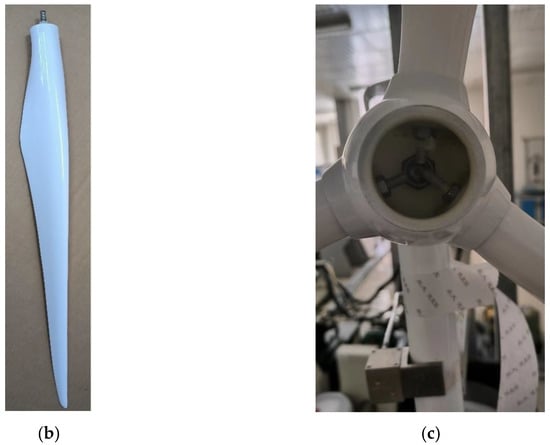
Figure 4.
The OWT model: (a) the OWT model and the control system; (b) the geometry of the blades; and (c) the nacelle.
The OWT was supported by a monopile buried in a 1 m × 1 m × 1 m sand tank to simulate the foundation and the surrounding soil. The monopile was made of a 5 cm diameter stainless steel pipe with a wall thickness of 2 mm. According to Nogami and Novak [52], the influence of boundary conditions can be neglected when the distance between the model and the container is larger than three times that of the model’s diameter. In order to assure the uniformity of the sand bed, the sand was poured from the same height at a fixed speed. Moreover, the sand bed was compressed every 5 cm according to the sand bed preparation procedure reported by Yu et al. [47].
The blades were driven by a motor connected to a power amplifier and an upper PC. The control software was composed to adjust the rotating speed of the blades. The rotation speed of the OWT was set to 75 r/min if nothing else was mentioned.
The data acquisition system mainly consisted of four acceleration sensors and a data acquisition unit. The specific parameters of the acceleration sensors are listed in Table 1. Those acceleration sensors were evenly distributed along the height of the OWT. The data acquisition unit was an 8-channel multi-signal collector developed on the basis of an STM32 chip. Its parameters are listed in Table 2. The data acquisition unit was connected to the upper PC via an ethernet cable. The aforementioned RDT-SSI algorithm was composed using Python language. The sampling frequency in this study was set to 50 Hz.

Table 1.
Parameters of the acceleration sensor.

Table 2.
Parameters of the DAQ device.
3.2. Verification of the RDT-SSI Method
In order to verify the proposed RDT-SSI method, an impact hammer test was conducted with the experimental apparatus shown in Figure 4 and Figure 5. This test was conducted by tapping the OWT tower with an impact hammer, then transferring the recorded data to the frequency domain using a fast Fourier transform (FFT). In Figure 6, the experimental results of the impact test in the time domain and frequency domain were displayed in the red line. The estimated free vibration response using the RDT-SSI method was also plotted in a blue dashed line. It can be observed that the free response of RDT-SSI was very small compared with the impact response. In Figure 6b, therefore the curve corresponding to the RDT-SSI result was lower than the impact test result. However, the estimated first-order frequency was close. The first-order frequency identified by the impact test was 7.42 Hz. That of the RDT-SSI result was 7.38 Hz. In terms of the second-order frequency, the value estimated by the RDT-SSI method was 21.28 Hz, which is about 5.5% higher than that of the impact test results (20.11 Hz).
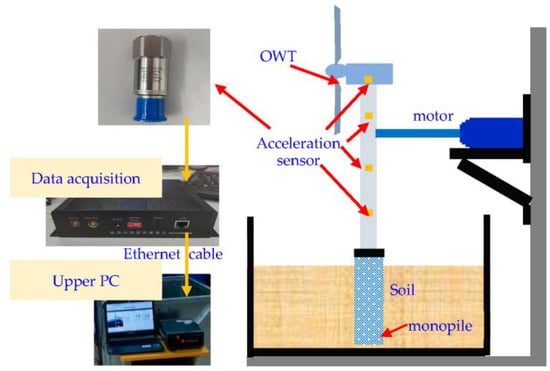
Figure 5.
Experimental setup.
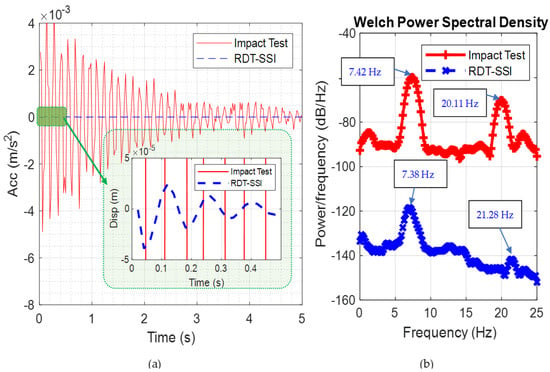
Figure 6.
Comparison of impact test and RDT result: (a) time-domain result and (b) frequency-domain result.
In the experimental study, the RDT-SSI program was kept running for one hour. The average value of the first-order frequency is 7.61 Hz, which was very close to the result of the impact test, demonstrating the accuracy of the proposed RDT-SSI method, thereby demonstrating the satisfying accuracy of the proposed method.
The experimental results shown in Figure 7 were recorded while the OWT was stopped. The first-order frequency was also estimated when the blades were rotating at different speeds. The experimental results suggested that the frequency varied little when at those speeds. This can be attributed to the fact that those speeds (0~100 round/min) were far away from the first-order frequency. Therefore, in the following study, the rotating speed was kept at 75 rounds/min.
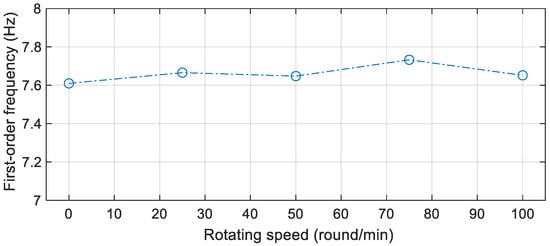
Figure 7.
Modal frequency identified by RDT-SSI method.
3.3. Influence of Embedment Depth
Monopiles used to support the OWT are designed to be buried below a certain depth beneath the mud line. However, due to the scouring induced by the sea current, the sand particles around the foundation are stirred and taken out, reducing the embedment depth of the monopile.
In this study, the OWT was buried at different depths (55, 65, and 75 cm) to simulate the scouring phenomenon. For each embedment depth, the OWT was operated for one hour, and its frequency was reported by the proposed method every 20 s. Figure 8 shows the frequencies between 100 s and 300 s. As can be observed in the figure, the average frequencies of the three embedment depths are 7.61, 8.41, and 11.33 Hz, respectively. The experimental results indicated that the frequency of the OWT increases with the increment of the embedment depth. This can be attributed to the additional restraint of the surrounding soil. Therefore, the proposed RDT-SSI can be used to preliminarily monitor the status of the OWT foundation.
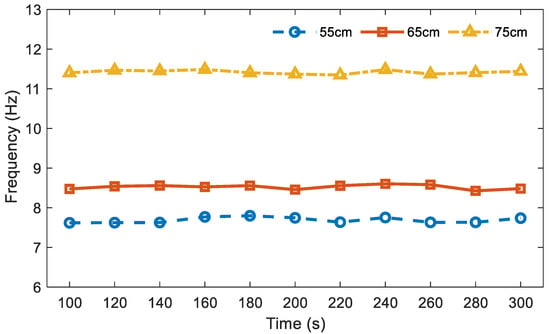
Figure 8.
Frequency of the OWT with different embedment depths.
3.4. Influence of Blade Bolt Loosening
The blades of an OWT are subjected to strong wind during the OWT’s service life. The bolt at the root of the blades becomes loosened after continuous wind loads. In this study, the bolts of the blades were loosened from 450 Nm to 270 Nm (a decrement of 40%) to investigate the influence on the dynamic property of the OWT. Table 3 and Figure 9 summarize the identified frequency of the OWT with varied embedment depth and numbers of loosened blades. It can be observed from the figure that the frequency of the OWTs decreased when the blades were loosened. This trend can be explained: after a certain time of working, the looseness of the bolts weakens the restraint of the blades, thus, reducing the stiffness of the whole structure. It can also be observed in Table 3 that, when more blades were loosened, the variance of the estimated first-order frequency tends to increase. This trend can be further investigated in the future with additional devices.

Table 3.
Frequency of the OWT with loosened blades.
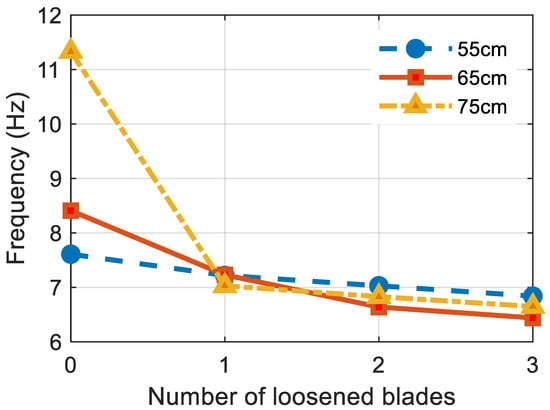
Figure 9.
Frequency of the OWT with loosened blades.
4. Concluding Remarks
This paper proposed an RDT-SSI method to identify the operational modal parameters of OWTs. This method first recorded the response of an OWT subjected to ambient excitation, removing the noise signal using the Kalman filter. Then, the free vibration signal was estimated using the RDT method with the filtered data. Afterward, the modal information was obtained using the SSI method. The proposed RDT-SSI method was verified by tests with a small-scale OWT buried at varying depths of embedment. The bolts at the root of the turbine blades were also loosened to simulate damage conditions. The major findings are as follows:
- (1)
- The proposed RDT-SSI method can effectively identify the first-order modal parameters of the OWT subjected to unknown ambient excitation.
- (2)
- The operational modal parameters are sensitive to damage to the structure. The frequency decreased when the blades of the turbine were loosened due to long-term functioning. Therefore, the first-order frequency can be employed as an early-stage warning of structural damage.
- (3)
- The experimental results confirmed that when the embedment depth of the foundation was reduced due to the scouring phenomenon, the frequency of the OWT decreased. This is because the scouring weakens the constraint of the structure and, thus, increases the flexibility of the structure. Therefore, the first-order frequency can also be used as a reference for the scouring intensity.
Moreover, the OWT model tested in this paper was only a small-scale model. More tests shall be made on full-scale OWTs to further verify the effectiveness of the RDT-SSI methods and to provide useful advice for the operation of OWTs.
Author Contributions
Conceptualization, P.Z. and Z.H.; methodology, P.Z., R.Y. and Z.H.; software, Z.H., R.Y. and L.R.; validation, C.C., Z.H. and P.Z.; formal analysis, P.Z. and C.C.; investigation, Z.H. and P.Z.; resources, P.Z. and L.R.; data curation, Z.H. and P.Z.; writing—original draft preparation, Z.H., P.Z. and L.R.; writing—review and editing, P.Z. and C.C.; visualization, Z.H. and R.Y.; supervision, C.C.; project administration, C.C.; funding acquisition, P.Z. and C.C. All authors have read and agreed to the published version of the manuscript.
Funding
This research was funded by the National Key Research and Development Program of China (2021YFB2601102); the National Natural Science Foundation of China (NSFC), grant number 51808092 and 52178315; the United Navigation Foundation of Liaoning Province, grant number 2020-HYLH-48; and the open fund of State Key Laboratory of Coastal and Offshore Engineering (DUT-LP2122).
Institutional Review Board Statement
Not applicable.
Informed Consent Statement
Not applicable.
Data Availability Statement
The data used to support the findings of this study are available from the corresponding author upon request.
Conflicts of Interest
The authors declare no conflict of interest.
Nomenclature
| Parameter | Description |
| Mass matrix | |
| Damping matrix | |
| Stiffness matrix | |
| External excitation | |
| Displacement vector | |
| Velocity | |
| Acceleration | |
| State vectors | |
| Output vectors | |
| State matrix | |
| Gating matrix | |
| Output matrix | |
| Transfer matrix | |
| Kalman Filtering | |
| Measurement result | |
| Process noise | |
| Measurement noise | |
| , , | A time unit |
| State variable to measurement conversion matrix | |
| The covariance matrix of the process noise | |
| The covariance matrix of the measurement noise | |
| Priori state estimate at time K | |
| Posterior estimate | |
| Posteriori state estimate at time K | |
| Kalman filter gain | |
| Posteriori estimate error | |
| Priori estimate error | |
| Priori estimate error covariance | |
| Posteriori estimate error covariance | |
| Mathematic expectation | |
| RDT | |
| Initial displacement | |
| Unit impulse response function | |
| Initial velocity | |
| The free vibration response of the displacement with an initial displacement of 1 and initial velocity of 0 | |
| The free vibration response of velocity | |
| The self-vibration frequency of damping system | |
| Damping ratio | |
| Phase angle | |
| Constant | |
| SSI | |
| Hankel matrix | |
| Discrete collection points | |
| The response of measurement point at the time i | |
| The output of the past | |
| The output of the past | |
| The output of the “future” | |
| The output of the “future” | |
| QR decomposition | |
| Projection matrix | |
| SVD decomposition result | |
| Observability matrix | |
| Kalman filter state sequence | |
| Mode shapes | |
| Diagonal matrix | |
| System eigenvector matrix | |
| Eigenvalue | |
| System frequency | |
References
- Lian, J.; Cai, O.; Dong, X.; Jiang, Q.; Zhao, Y. Health Monitoring and Safety Evaluation of the Offshore Wind Turbine Structure: A Review and Discussion of Future Development. Sustainability 2019, 11, 494. [Google Scholar] [CrossRef]
- Park, G.; You, D.; Oh, K.; Nam, W. Natural Frequency Degradation Prediction for Offshore Wind Turbine Structures. Machines 2022, 10, 356. [Google Scholar] [CrossRef]
- Global Wind Energy Council. Global Wind Statistics 2021. Global Statistics. Available online: https://gwec.net/global-wind-report-2022/ (accessed on 1 June 2022).
- Ishihara, T.; Yamaguchi, A.; Takahara, K.; Mekaru, T.; Matsuura, S. An Analysis of Damaged Wind Turbines by Typhoon Maemi in 2003. Proceeding of APCWE VI 2005; pp. 1413–1428. Available online: http://windeng.t.u-tokyo.ac.jp/ishihara/e/proceedings/2005-7_paper.pdf (accessed on 1 April 2022).
- Chen, X.; Xu, J.Z. Structural failure analysis of wind turbines impacted by super typhoon Usagi. Eng. Fail. Anal. 2016, 60, 391–404. [Google Scholar] [CrossRef]
- Chou, J.; Ou, Y.; Lin, K.; Wang, Z. Structural failure simulation of onshore wind turbines impacted by strong winds. Eng. Struct. 2018, 162, 257–269. [Google Scholar] [CrossRef]
- Lou, C. Study on the Design of Simple Offshore Wind Turbine Foundation. Master’s Thesis, Dalian University of Technology, Dalian, China, 2017. [Google Scholar]
- Ye, K.; Li, C.; Yang, Y.; Zhang, W.; Xu, Z. Research on influence of ice-induced vibration on offshore wind turbines. J. Renew. Sustain. Energy 2019, 11, 33301. [Google Scholar] [CrossRef]
- Liu, J.; Guo, Z.; Zhu, N.; Zhao, H.; Garg, A.; Xu, L.; Liu, T.; Fu, C. Dynamic Response of Offshore Open-Ended Pile under Lateral Cyclic Loadings. J. Mar. Sci. Eng. 2019, 7, 128. [Google Scholar] [CrossRef]
- Ernst, B.; Seume, J.R. Investigation of Site-Specific Wind Field Parameters and Their Effect on Loads of Offshore Wind Turbines. Energies 2012, 5, 3835–3855. [Google Scholar] [CrossRef]
- Márquez-Domínguez, S.; Sørensen, J.D. Fatigue Reliability and Calibration of Fatigue Design Factors for Offshore Wind Turbines. Energies 2012, 5, 1816–1834. [Google Scholar] [CrossRef]
- Tchakoua, P.; Wamkeue, R.; Ouhrouche, M.; Slaoui-Hasnaoui, F.; Tameghe, T.; Ekemb, G. Wind Turbine Condition Monitoring: State-of-the-Art Review, New Trends, and Future Challenges. Energies 2014, 7, 2595–2630. [Google Scholar] [CrossRef]
- Yang, W.; Tavner, P.J.; Crabtree, C.J.; Feng, Y.; Qiu, Y. Wind turbine condition monitoring: Technical and commercial challenges. Wind Energy 2014, 17, 673–693. [Google Scholar] [CrossRef]
- Sinha, Y.; Steel, J.A. A progressive study into offshore wind farm maintenance optimisation using risk based failure analysis. Renew. Sustain. Energy Rev. 2015, 42, 735–742. [Google Scholar] [CrossRef]
- Schubel, P.J.; Crossley, R.J.; Boateng, E.; Hutchinson, J.R. Review of structural health and cure monitoring techniques for large wind turbine blades. Renew. Energy 2013, 51, 113–123. [Google Scholar] [CrossRef]
- Yang, B.; Sun, D. Testing, inspecting and monitoring technologies for wind turbine blades: A survey. Renew. Sustain. Energy Rev. 2013, 22, 515–526. [Google Scholar] [CrossRef]
- Wymore, M.L.; Van Dam, J.E.; Ceylan, H.; Qiao, D. A survey of health monitoring systems for wind turbines. Renew. Sustain. Energy Rev. 2015, 52, 976–990. [Google Scholar] [CrossRef]
- Martinez-Luengo, M.; Kolios, A.; Wang, L. Structural health monitoring of offshore wind turbines: A review through the Statistical Pattern Recognition Paradigm. Renew. Sustain. Energy Rev. 2016, 64, 91–105. [Google Scholar] [CrossRef]
- Salameh, J.P.; Cauet, S.; Etien, E.; Sakout, A.; Rambault, L. Gearbox condition monitoring in wind turbines: A review. Mech. Syst. Signal Process. 2018, 111, 251–264. [Google Scholar] [CrossRef]
- Hameed, Z.; Hong, Y.S.; Cho, Y.M.; Ahn, S.H.; Song, C.K. Condition monitoring and fault detection of wind turbines and related algorithms: A review. Renew. Sustain. Energy Rev. 2009, 13, 1–39. [Google Scholar] [CrossRef]
- Bang, H.J.; Kim, H.I.; Lee, K.S. Measurement of Strain and Bending Deflection of a Wind Turbine Tower Using Arrayed FBG Sensors. Int. J. Precis. Eng. Manuf. 2012, 13, 2121–2126. [Google Scholar] [CrossRef]
- Tang, J.; Soua, S.; Mares, C.; Gan, T. A Pattern Recognition Approach to Acoustic Emission Data Originating from Fatigue of Wind Turbine Blades. Sensors 2017, 17, 2507. [Google Scholar] [CrossRef]
- Li, Y.; Shen, H.; Guo, W. Simulation and Experimental Study on the Ultrasonic Micro-Vibration De-Icing Method for Wind Turbine Blades. Energies 2021, 14, 8246. [Google Scholar] [CrossRef]
- Raišutis, R.; Tiwari, K.A.; Žukauskas, E.; Tumšys, O.; Draudvilienė, L. A Novel Defect Estimation Approach in Wind Turbine Blades Based on Phase Velocity Variation of Ultrasonic Guided Waves. Sensors 2021, 21, 4879. [Google Scholar] [CrossRef]
- Zheng, M.; Shen, F.; Chen, H. Operational modal analysis schemes using correlation technique. Acta Mech. Solida Sin. 2005, 18, 88–94. [Google Scholar]
- Peeters, B.; De Roeck, G. Stochastic System Identification for Operational Modal Analysis: A Review. J. Dyn. Syst. Meas. Control. 2001, 123, 659–667. [Google Scholar] [CrossRef]
- Brincker, R.; Ventura, C. Introduction to Operational Modal Analysis; John Wiley & Sons: Hoboken, NJ, USA, 2015. [Google Scholar]
- Bin Zahid, F.; Ong, Z.C.; Khoo, S.Y. A review of operational modal analysis techniques for in-service modal identification. J. Braz. Soc. Mech. Sci. Eng. 2020, 42, 398. [Google Scholar] [CrossRef]
- Rainieri, C.; Fabbrocino, G. Operational Modal Analysis of Civil Engineering Structures; Springer: New York, NY, USA, 2014. [Google Scholar]
- Hu, W.; Tang, D.; Wang, M.; Liu, J.; Li, Z.; Lu, W.; Teng, J.; Said, S.; Rohrmann, R.G. Resonance Monitoring of a Horizontal Wind Turbine by Strain-Based Automated Operational Modal Analysis. Energies 2020, 13, 579. [Google Scholar] [CrossRef]
- Dolinski, L.; Krawczuk, M. Analysis of Modal Parameters Using a Statistical Approach for Condition Monitoring of the Wind Turbine Blade. Appl. Sci. 2020, 10, 5878. [Google Scholar] [CrossRef]
- Pacheco, J.; Oliveira, G.; Magalhães, F.; Moutinho, C.; Cunha, Á. Vibration-Based Monitoring of Wind Turbines: Influence of Layout and Noise of Sensors. Energies 2021, 14, 441. [Google Scholar] [CrossRef]
- Kim, H.C.; Kim, M.H.; Choe, D.E. Structural health monitoring of towers and blades for floating offshore wind turbines using operational modal analysis and modal properties with numerical-sensor signals. Ocean. Eng. 2019, 188, 106226. [Google Scholar] [CrossRef]
- Cole, J.H. On-the-line analysis of random vibration. In Proceedings of the 9th Structural Dynamics and Materials Conference, Palm Springs, CA, USA, 1–3 April 1968. [Google Scholar]
- Ibrahim, S. The use of random decrement technique for identification of structural modes of vibration. In Proceedings of the 18th Structural Dynamics and Materials Conference, San Diego, CA, USA, 21–23 March 1977. [Google Scholar]
- Vandiver, J.K.; Dunwoody, A.B.; Campbell, R.B.; Cook, M.F. A mathematical basis for the random decrement vibration signature analysis technique. J. Mech. Des. 1982, 104, 307–313. [Google Scholar] [CrossRef]
- Asmussen, J.C. Modal Analysis Based on the Random Decrement Technique; Department of Mechanical Engineering, Aalborg University: Aalborg, Denmark, 1997. [Google Scholar]
- Brincker, R.; Amador, S. On the theory of random decrement. Mech. Syst. Signal Process. 2022, 173, 109060. [Google Scholar] [CrossRef]
- Vesterholm, K.K.; Brincker, R.; Brandt, A. Random decrement technique for detection and characterization of nonlinear behavior. Mech. Syst. Signal Process. 2020, 143, 106841. [Google Scholar] [CrossRef]
- Vesterholm, K.K.; Brincker, R.; Brandt, A. Some Aspects of Using the Random Decrement Technique for Nonlinear Systems. Nonlinear Struct. Syst. 2022, 1, 39–41. [Google Scholar]
- Silva, E.; Magluta, C.; Roitman, N.; Filho, L.A. Development of a structural identification methodology with uncertainty quantification through the SSI and bootstrap techniques. Mech. Syst. Signal Process. 2022, 165, 108290. [Google Scholar] [CrossRef]
- Rodrigues, J.; Brincker, R. Application of the Random Decrement Technique in Operational Modal Analysis. Biomed. Eng. Online 2005. Available online: https://vbn.aau.dk/ws/files/12812147/Application_of_the_Random_Decrement_Technique_in_Operational_Modal_Analysis (accessed on 1 June 2022).
- Siebel, T.; Friedmann, A.; Koch, M.; Mayer, D. Assessment of mode shape-based damage detection methods under real operational conditions. In Proceedings of the Proceedings of the 6th European Workshop on Structural Health Monitoring, Dresden, Germany, 3–6 July 2012. [Google Scholar]
- Mieloszyk, M.; Ostachowicz, W. An application of Structural Health Monitoring system based on FBG sensors to offshore wind turbine support structure model. Mar. Struct. 2017, 51, 65–86. [Google Scholar] [CrossRef]
- Ou, Y.; Tatsis, K.E.; Dertimanis, V.K.; Spiridonakos, M.D.; Chatzi, E.N. Vibration-based monitoring of a small-scale wind turbine blade under varying climate conditions. Part I: An experimental benchmark. Struct. Control. Health Monit. 2021, 28, e2660. [Google Scholar] [CrossRef]
- Lorenzo, E.D.; Wang, L.-Z.; Guo, Z.; Bhattacharya, S.; Nikitas, G.; Li, L.-L.; Xing, Y.-L. Damage detection in wind turbine blades by using operational modal analysis. Struct. Health Monit. 2016, 15, 289–301. [Google Scholar] [CrossRef]
- Yu, L.Q.; Wang, L.Z.; Guo, Z.; Bhattacharya, S.; Nikitas, G.; Li, L.L.; Xing, Y.L. Long-term dynamic behavior of monopile supported offshore wind turbines in sand. Theor. Appl. Mech. Lett. 2015, 5, 80–84. [Google Scholar] [CrossRef]
- Maybeck, P.S. Stochastic Models, Estimation, and Control; Academic Press: Cambridge, MA, USA, 1982. [Google Scholar]
- Dong, X.; Lian, J.; Yang, M.; Wang, H. Operational modal identification of offshore wind turbine structure based on modified stochastic subspace identification method considering harmonic interference. J. Renew. Sustain. Energy 2014, 6, 033128. [Google Scholar] [CrossRef]
- Zarbaf, S.E.H.A.M.; Norouzi, M.; Allemang, R.J.; Hunt, V.J.; Helmicki, A.; Nims, D.K. Stay Force Estimation in Cable-Stayed Bridges Using Stochastic Subspace Identification Methods; American Society of Civil Engineers: New York, NY, USA, 2017. [Google Scholar]
- Zhou, X.; Cao, L.; Khan, I.; Li, Q. Data inspecting and denoising method for data-driven stochastic subspace identification. Shock Vib. 2018, 2018, 3926817. [Google Scholar] [CrossRef]
- Novak, M.; Nogami, T. Soil-pile interaction in horizontal vibration. Earthq. Eng. Struct. Dyn. 1977, 5, 263–281. [Google Scholar] [CrossRef]
Publisher’s Note: MDPI stays neutral with regard to jurisdictional claims in published maps and institutional affiliations. |
© 2022 by the authors. Licensee MDPI, Basel, Switzerland. This article is an open access article distributed under the terms and conditions of the Creative Commons Attribution (CC BY) license (https://creativecommons.org/licenses/by/4.0/).