Article

Hydrodynamic Analysis of the WIND-Bos Spar Floating Offshore Wind Turbine

1
Centre for Marine Technology and Ocean Engineering (CENTEC), Instituto Superior Técnico, Universidade de Lisboa, 1049-001 Lisboa, Portugal
2
Bluenewables, Guia de Isora, 38689 Tenerife, Spain
*
Author to whom correspondence should be addressed.
J. Mar. Sci. Eng. 2022, 10(12), 1824; https://doi.org/10.3390/jmse10121824
Submission received: 3 October 2022 / Revised: 16 November 2022 / Accepted: 22 November 2022 / Published: 28 November 2022
(This article belongs to the Special Issue Offshore Wind Energy)

Abstract

:
The WIND-bos spar Floating Offshore Wind Turbine is studied both experimentally and numerically. The experimental model of the moored WIND-bos platform is presented, and the different numerical models that have been developed to analyze the hydrodynamics of the platform are described. The results provide a detailed comparison of numerical and experimental motion responses of the floating structure in regular and irregular waves. The numerical study includes frequency domain results from spectral analysis, weakly nonlinear time-domain results from a validated in-house code, and coupled time-domain results from commercial software. The importance of damping calibration is put in evidence, whereas damping ratios are calculated iteratively in the coupled time-domain simulations, and nonlinear damping force is considered within the developed numerical scheme. The results compare well and also show that the novel concept has a good motion performance in general.

1. Introduction

Floating Offshore Wind Turbines (FOWTs) are floating structures that enable wind power absorption in locations offshore where fixed wind turbines are not feasible, mainly due to the considerably great water depths in such locations. Although most of the present wind farms are in shallow water with fixed platforms, the present trend is to move away from the coast using FOWTs [1]. Prospective operation sites for FOWTs are, for instance, the coasts of North Atlantic European countries, such as Portugal, Norway, Ireland, and Scotland, as well as the USA, China, and Japan, among others [2].
Even though the majority of the installed wind power capacity still lies onshore, the offshore wind energy sector is currently undergoing greater expansion: as of 2020, the global installed power capacity of offshore wind was 35.3 GW, more than ten times what was ten years before. However, around 80% of this had been installed in only three countries, namely the UK, China, and Germany, which accounted for, respectively, 10.2 GW, 9.9 GW, and 7.8 GW of installed capacity offshore by the end of 2020 [3]. In 2021, the increase in wind power capacity offshore was led by China: around 17 GW of offshore wind was installed in 2021 only in that country, which accounts for 80% of the new installations in that year, followed by the UK with 11% and Vietnam with 4%. All of that took the global installations of offshore wind to a full power capacity of 57.2 GW [4], meaning that almost 40% of the installations offshore were accomplished last year. Remarkably, the parcel of floating wind is also rather small, for less than 200 MW of the offshore wind turbines are mounted on FOWTs, which indicates enormous amounts of wind resources that are yet to be exploited in deeper waters [5].
Historically, the technology for FOWTs also benefited from the knowledge previously acquired by the Oil & Gas (O&G) industry. However, as pointed out in [6], transferring the offshore O&G technology directly to the offshore wind industry would not have been economical and, in some cases, inappropriate, as happens with the moorings, which for wind and other renewable energy converters need to be designed for much smaller water depths [7]. The main technological challenges have been addressed, and different conceptual designs emerged seeking to develop cost-effective solutions for the offshore wind industry. The current trend of such concepts is toward bigger turbines and greater output to reduce overall CAPEX and OPEX and the commissioning of floating structures leading to an expansion of wind energy farms based on FOWTs [1].
The qualitative valuation of three floating concepts—barge, Tension Leg Platform (TLP), and spar, was introduced in [8] in relative terms of stability, motions, costs, and others. Then, ref. [9] analyzed three designs representing the same concepts (the ITI Energy barge, the MIT/NREL TLP, and the OC3-Hywind spar) using the tool FAST [10]. Those comparative studies did not include semi-submersible platforms, which is unfortunate. It was identified that barge platforms may not be suitable for FOWTs mainly due to the considerably high fatigue loads observed in the barge-supported turbine. These loads include, for instance, side-by-side and fore-aft tower base bending moments and may also compromise the nacelle with high inertial loads. On the other hand, the MIT/NREL TLP and the OC3-Hywind showed similar and relatively improved fatigue responses. Even though no Tension Leg Platform (TLP) has been through real-scale prototype testing, the single column with four spikes TLP has been considered in various studies, e.g., [11,12]. More recently, the CENTEC TLP platform is an example of an innovative concept currently under development that allows significant cost reduction in installation costs for TLPs [13,14,15]. The concept is designed to accommodate the DTU 10.0 MW Reference Wind Turbine [16].
Two of the types, however, can be illustrated with concepts that went through prototype testing at sea, namely the Hywind spar platform and the WindFloat semi-submersible platform. The development of these concepts led to the commissioning of the first two wind farms ever, in 2017 and 2019, respectively. The Hywind and WindFloat wind farms operate in Scotland at 30.0 MW and in Portugal at 25.0 MW, respectively. The development of the Hywind technology can be followed in [17,18,19,20], while the development of the WindFloat system can be consulted in [21,22].
Because semi-submersible platforms have relatively low installation costs and good site adaptability, they are often the FOWT solution considered in the full-scale analysis [23]. Two examples of semi-submersible FOWT concepts that have been thoroughly analyzed and deserve some detail are the OC5-DeepCWind platform and the braceless CSC semi-submersible platform. Both of them were designed to accommodate the NREL 5.0 MW wind turbine [24]. The CSC platform has been tested in wave basins [25,26] and later studied by different authors to develop and calibrate a fully coupled model of the oceanic system, as provided by [27,28,29]. The latest contributions offered accurate global motion prediction in various load cases and proved that the concept has good motion performance in general. The DeepCWind platform is an object of study for authors of various institutions because necessary data are available open-source.
Model uncertainty analysis of the DeepCWind platform was performed in [30], which presented hydrodynamic calculations by different codes, which in turn have been used in a validation study by [31]. Then, ref. [32] assessed the experimental uncertainty of the DeepCWind also in a test campaign, this time under hydrodynamic loading. The effect of wave nonlinearity on extreme responses and fatigue of the DeepCWind platform was studied in [33]. It was concluded that fatigue damage at the tower base is dominated by wind effects, as well as mooring lines fatigue; the surge motion, on the other hand, is dominated by wave effects when extreme responses are observed. The coupling of the DeepCWind platform with conical point-absorbers Wave Energy Converters (WECs) was studied by [34]. The results show an increase in initial stability and power absorption, but the motion response in irregular waves is worsened due to the mechanical coupling, which affects especially for the pitch motion. The results are presented for three different WEC diameters, also showing that the greater the WECs diameter, the stronger those trends. A similar concept was later studied by [35], which obtained similar results even though the conclusions drawn were mainly qualitative.
While several of the mentioned studies have been made for 5.0 MW wind turbines, recent efforts of adaptation or development have addressed 10.0 MW wind turbines, such as in [36,37,38,39].
Hybrid wind-wave floating solutions, such as the ones discussed above, are examples of Multi-Use Platforms (MUPs). These concepts have been reviewed by [40,41], with structure classifications and design challenges described. The DeepCWind platform is one among various configurations of FOWT that have been considered in MUP studies, such as the Mermaid semi-submersible with Oscillating Water Columns (OWCs) [42]. More recent conceptual designs are the spar platform with surge flaps and a tidal current converter [43], the concentric WEC-array adapted to semi-submersible wind platforms [44], and the FOWT proposed with a desalination plant and a solar deck [45], cite a few.
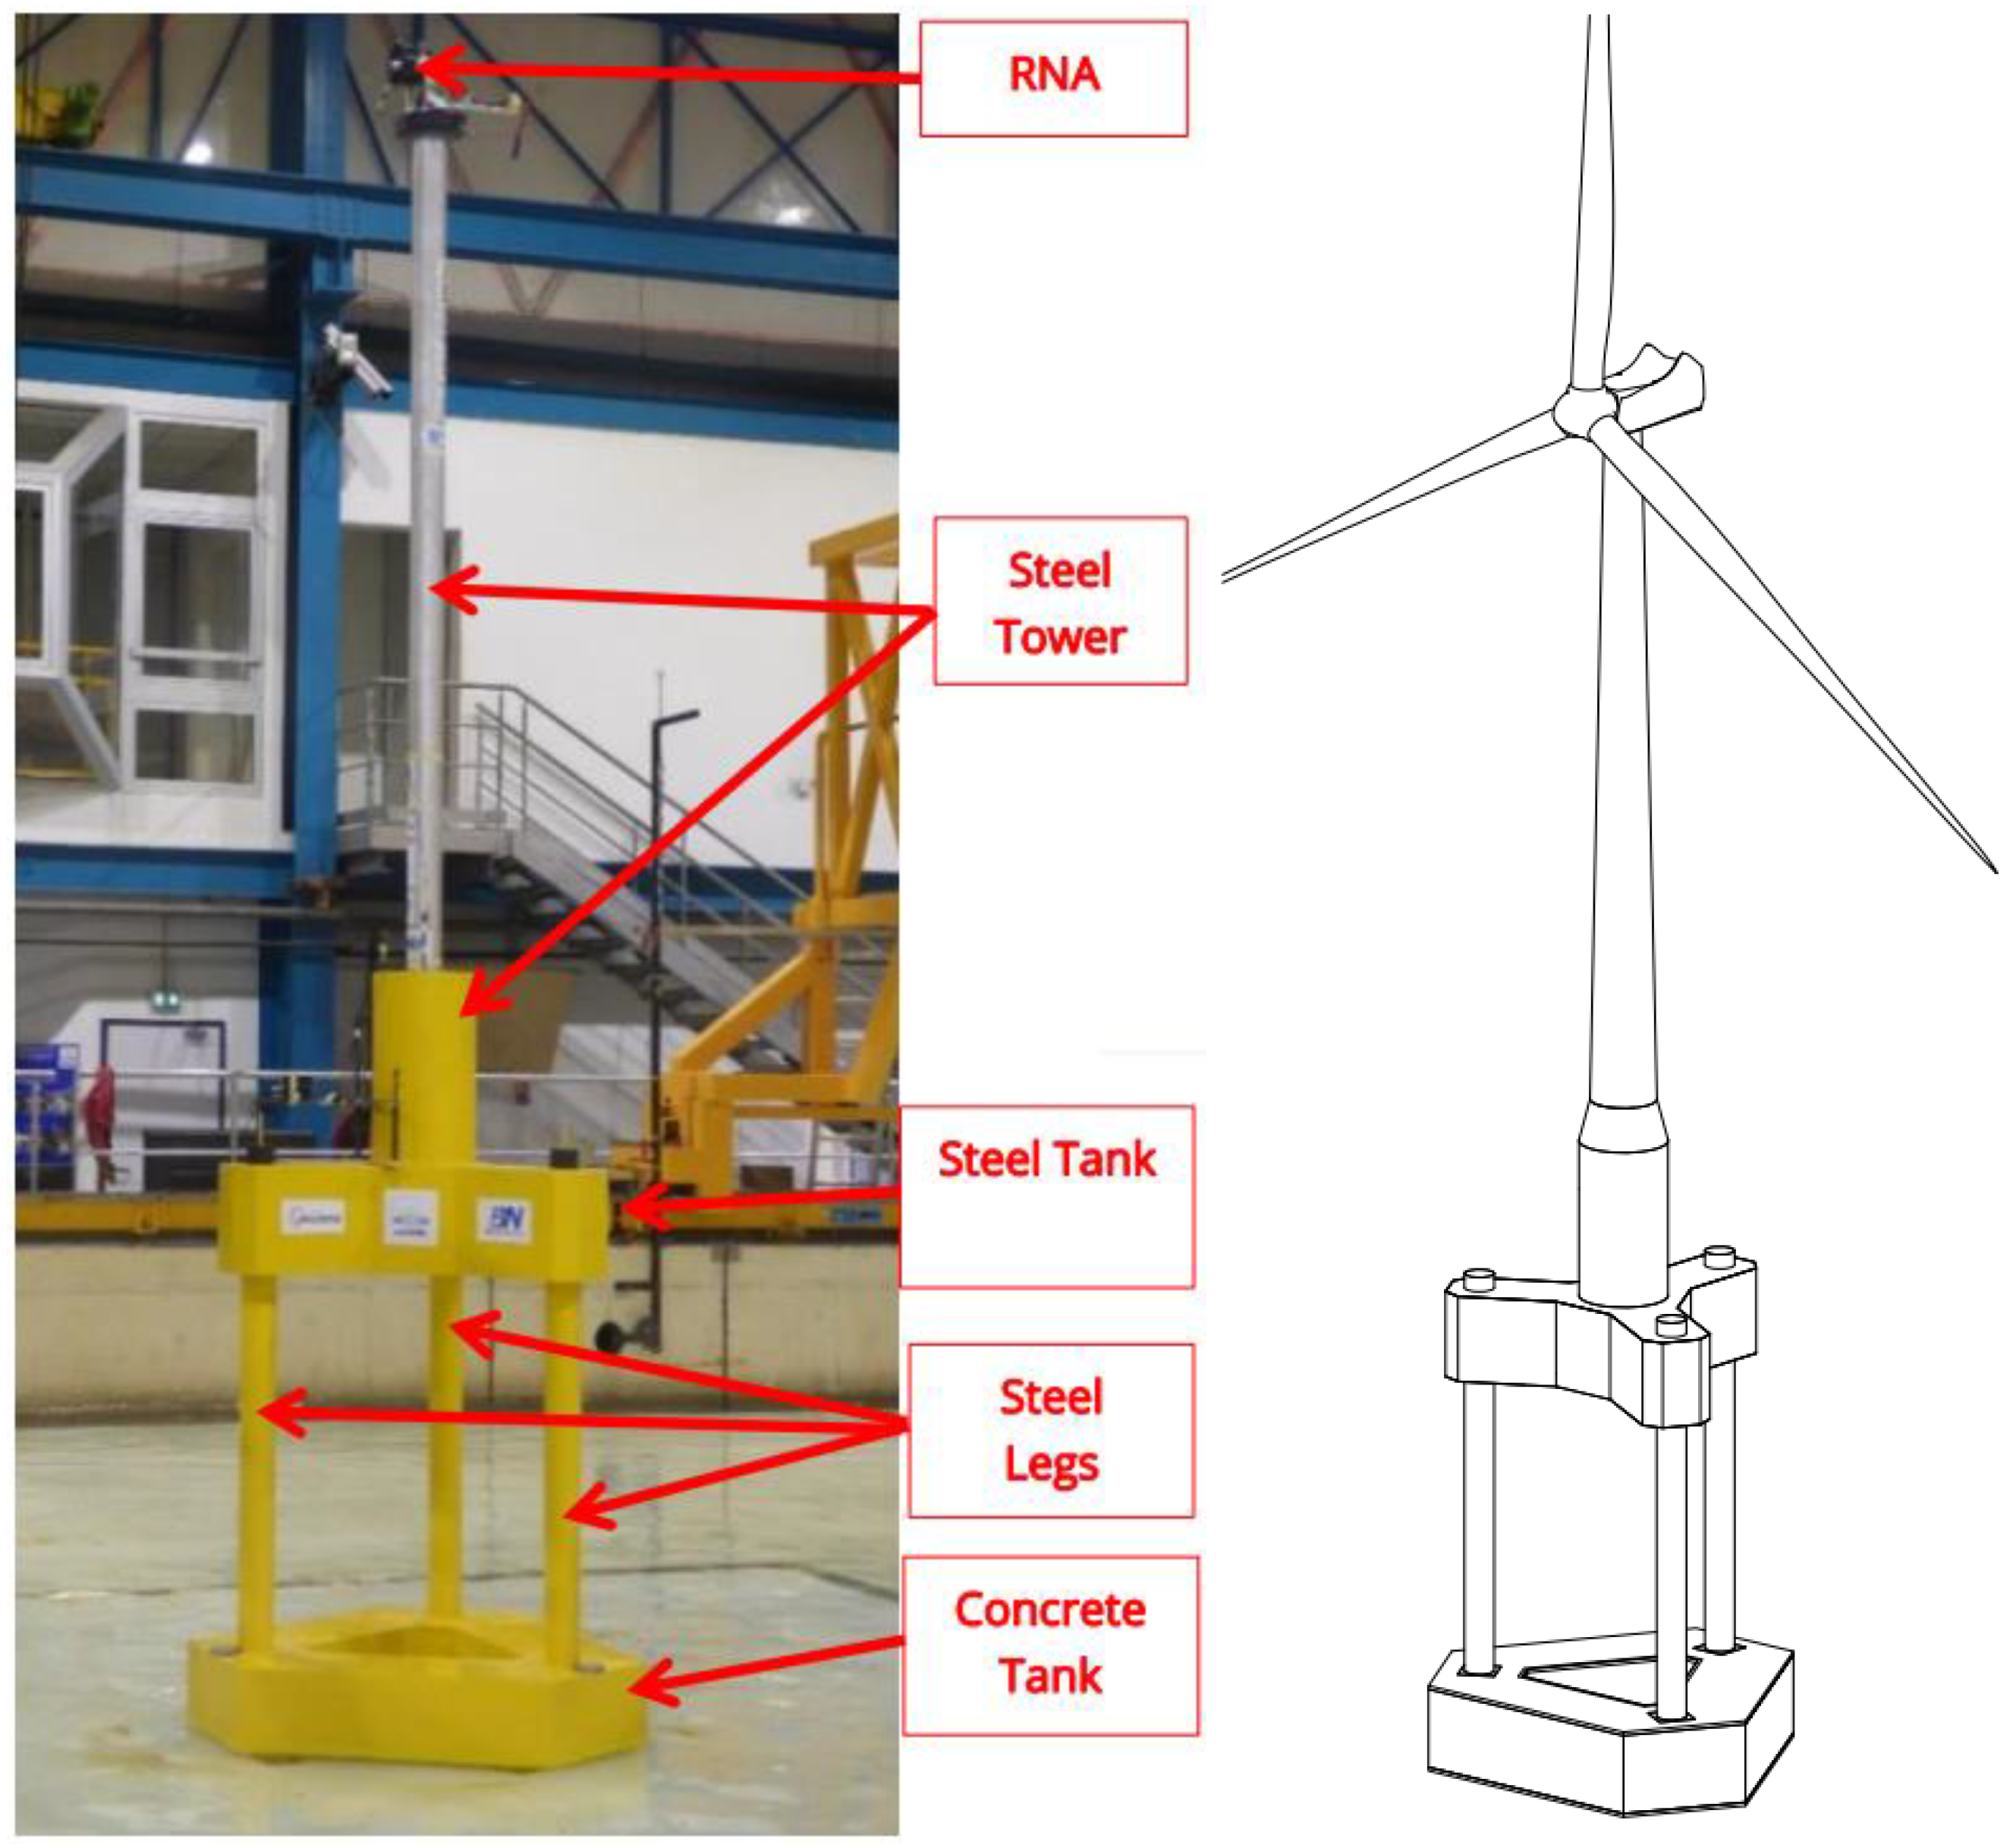
The design considered in the present paper is a novel spar FOWT: the WIND-bos platform. Spars, in general, have a considerably small waterplane area and a considerably large draft. Moreover, ballast weight is included deep down in the platform. Thus, due to these two reasons, the natural periods in the heave, roll, and pitch of spars are usually much higher in comparison to common sea wave periods. Because of the ballast weight, spar platforms also tend to be very stable. However, the WIND-bos platform has a particular geometry, which is different from the conventional spars, such as the Hywind concept, which is also a spar. The hull of the WIND-bos platform is composed of two main bodies built of steel and concrete, which has several advantages that allow significant cost reduction and also allow smooth, safe, and cost-efficient transport and installation processes. These two bodies are interconnected by means of three vertical steel legs, as shown in Figure 1. The platform is designed to accommodate the DTU 10.0 MW Reference Wind Turbine.
The hydrodynamic behavior of the WIND-bos platform is studied in detail. First, the scaled model of the platform is analyzed based on the tests performed in the experimental campaign conducted under the scope of the MaRINET2 program. Then, numerical models are used to simulate the dynamic behavior of the platform according to three different methods, namely, frequency domain, weakly nonlinear time domain, and coupled time-domain models. The weakly nonlinear time-domain solver is developed in-house and predicts the 6 degrees of freedom (DoF) motion responses of the platform in the time domain under regular and irregular waves. Because of the many models developed, the study provides a deep numerical-experimental comparison for the hydrodynamic analysis of the novel FOWT concept.

2. Experimental Campaign

The experimental campaign was accomplished in the BGO First Facility operated by Oceanide, in La Seyne-sur-mer, France. The 1/40 scale model of the WIND-bos platform tested in the wave basin is shown in Figure 1, when outside of the tank, besides a perspective view of the platform accommodating the wind turbine. In Table 1, the environmental conditions tested are presented and include both regular and irregular wave scenarios, whereas the latter are generated based on JONSWAP spectra. Regular and irregular waves are considered, but the results are presented for head wave incidence only. The environmental parameters result from the Froude scaling of real sea conditions, e.g., H = α H and T = α T , where α = 1 / 40 is the scale parameter, and the apostrophe stands for values in the model scale.
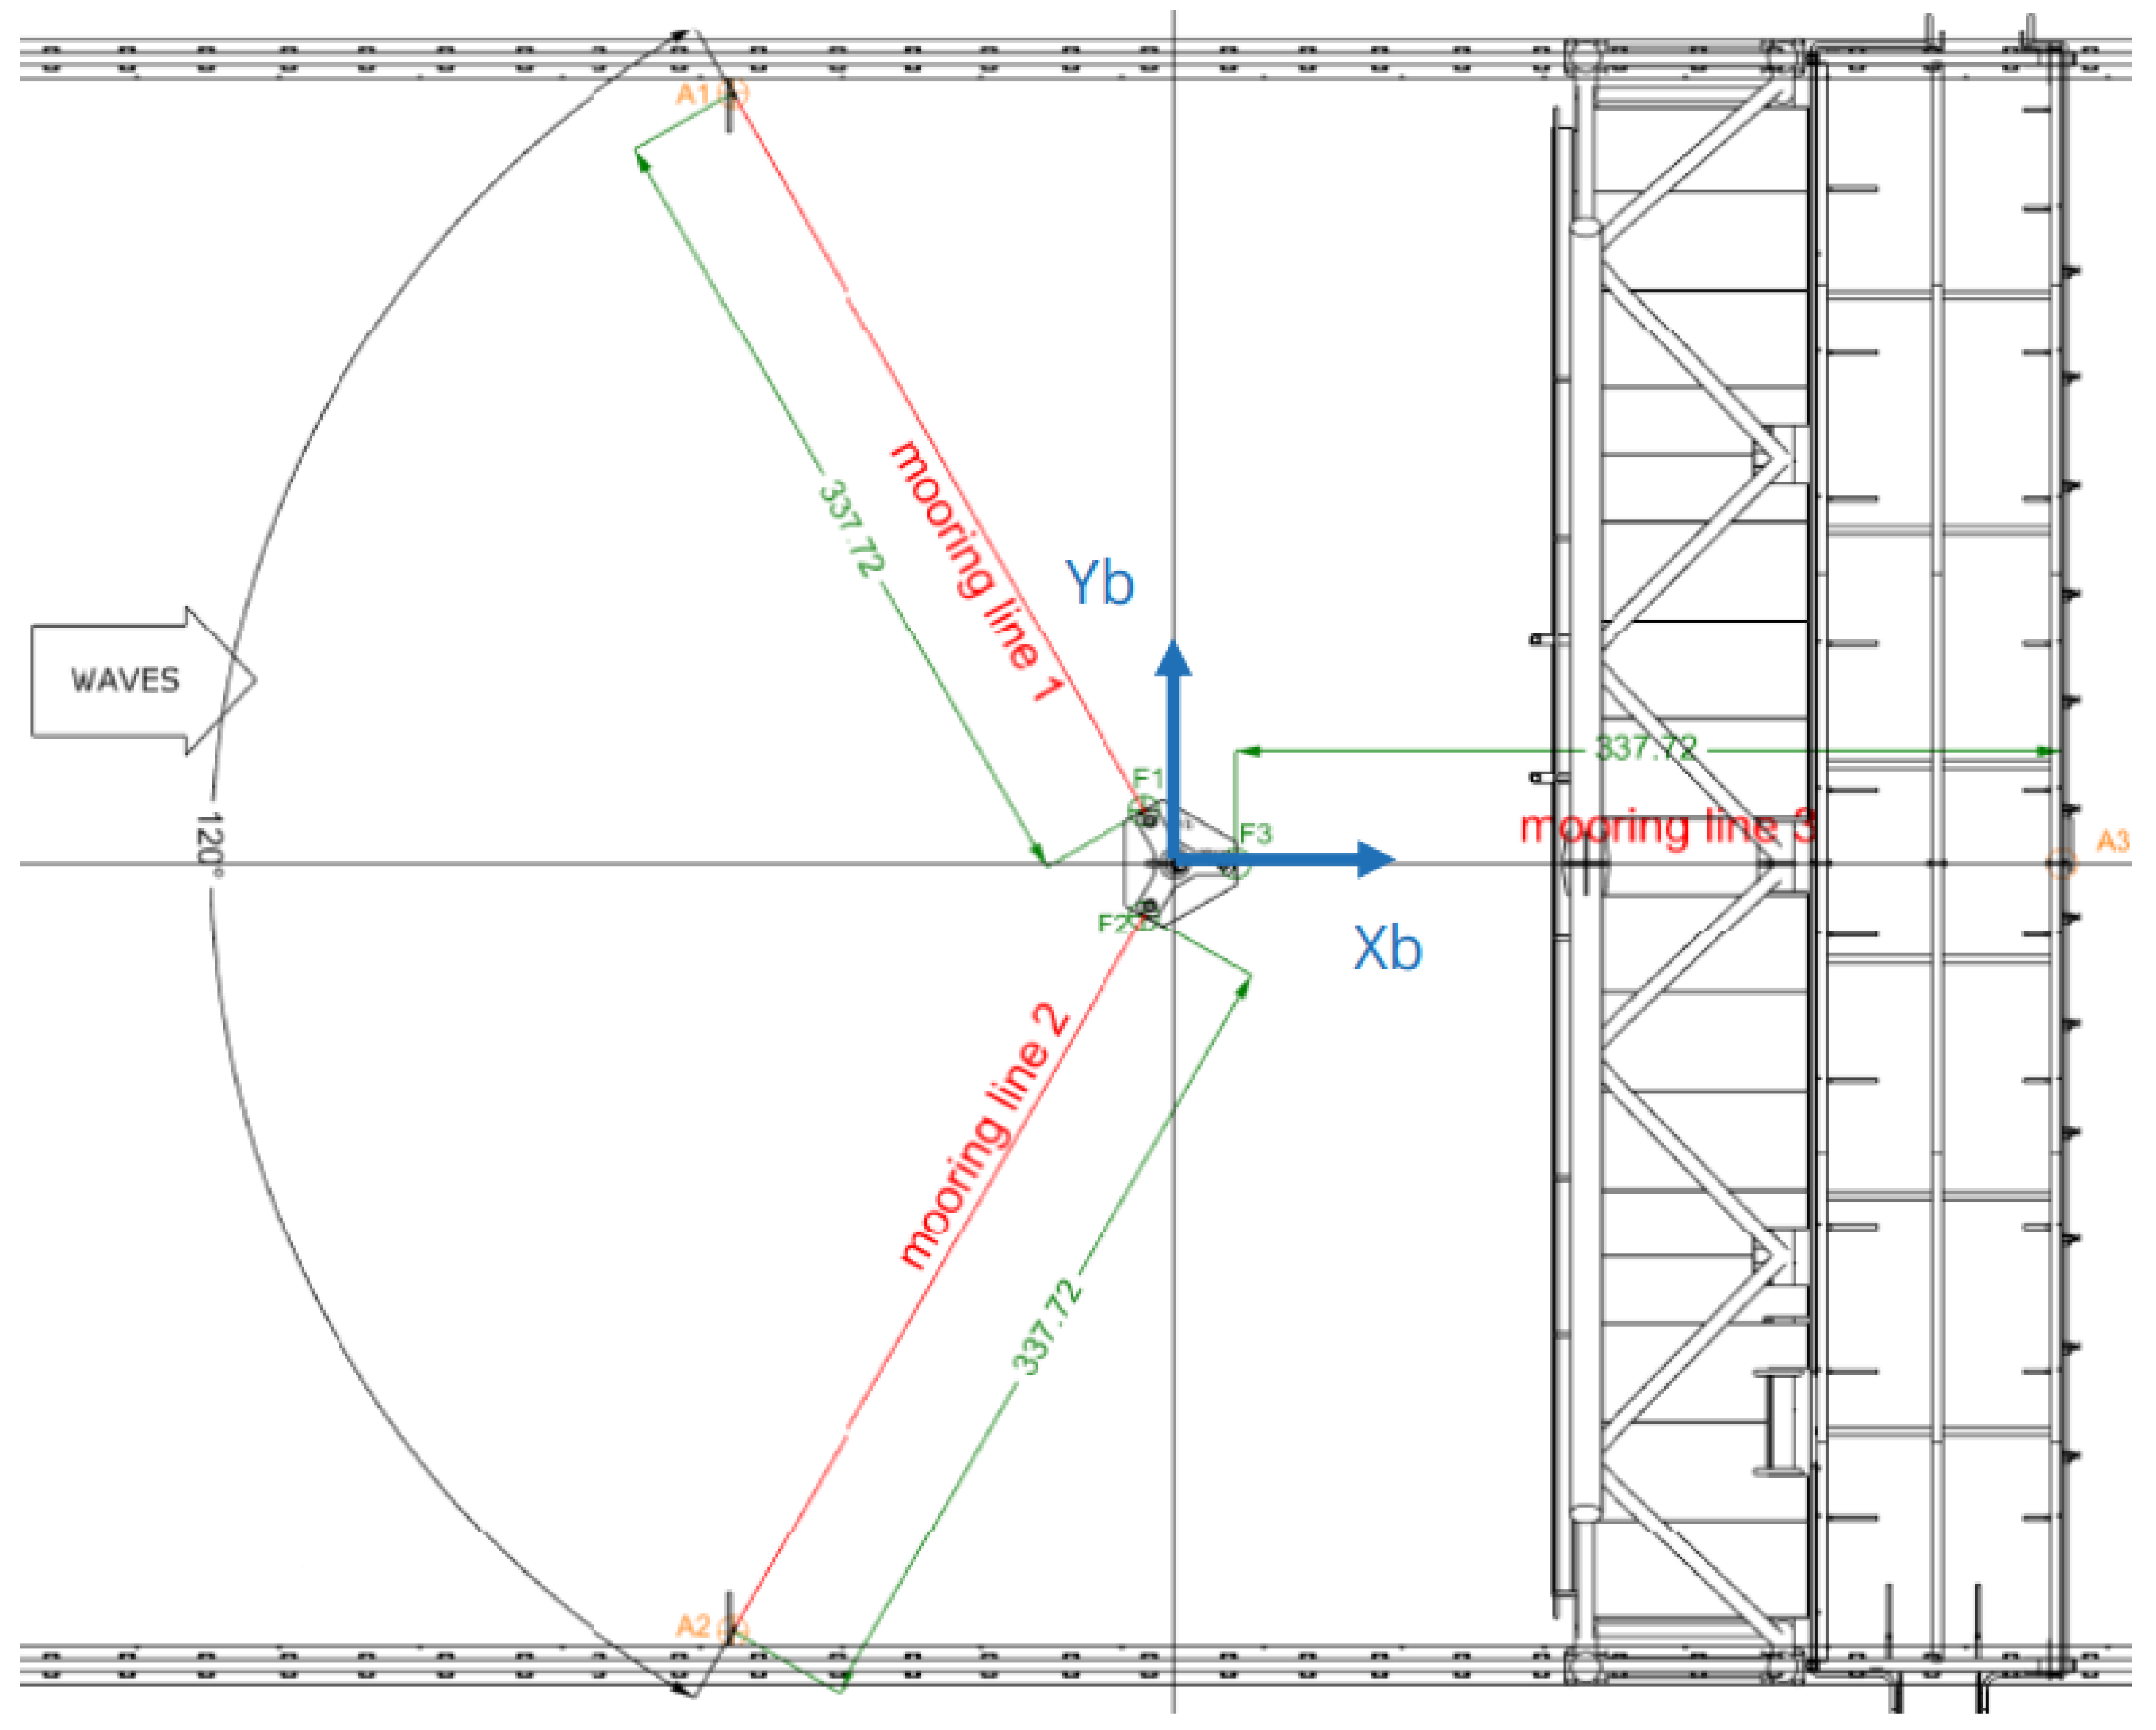
A linear mooring system consisting of three horizontal dry steel wires is used to keep the model heading and to provide station-keeping. The mooring lines’ diameter is only 40 mm (or 1 mm in the model scale), whereas the length of the lines is 337.72 m. The mooring is much lighter in comparison to the catenary mooring that is usually considered in real-scale prototypes (not detailed in this paper); also, a set of springs was used to reach the target pretension values; thus, the restoring forces related to the mooring do play an important role in the dynamic behavior of the system and should essentially behave as linear springs. The mooring lines parameters are presented in Table 2, whereas the configuration of the lines is shown in detail in Figure 2, and the fairleads and anchors positions are presented in Table 3.
The sampling frequency was set at 15.8 Hz (or 100 Hz in the model scale) for the instrumentation. A low-pass filter [0.0; 0.5 Hz] has been applied to remove the high-frequency noise, and a band-pass filter [0.029; 0.5 Hz] has been applied on motion time series to extract wave frequency signals during regular wave tests. The Response Amplitude Operators (RAOs) are evaluated considering the wave amplitudes at the basin center, i.e., future model location, during wave calibration. Waves were also calibrated by 20 runs for regular waves and 10 runs for irregular waves. These runs were performed without the scale model in the basin. Free decay tests of the free-floating platform were performed in the vertical and X and Y rotation modes of motion and in 6 DoF for the moored platform. Pulling tests were also performed to obtain the initial restoring coefficients in surge and sway due to the effects of mooring lines. Tilt tests were also performed in roll and pitch to obtain the metacentric heights. The following values were measured: GMT = 11.97 m and GML = 11.89 m.
Additionally, in this tank test campaign, several combined wave and wind runs were launched using an equivalent thrust force at the hub height using a drone. The combined wave and wind results are not included in this paper.

3. Numerical Modelling

3.1. Frequency Domain

An in-house code is written in Matlab® to obtain results in the frequency domain. The code considers the hydrodynamic coefficients of the platform, namely, the wave radiation (added mass and potential damping) and wave excitation force coefficients and phases, also the hydrostatic coefficients, the rigid body mass matrix, and an added damping matrix that calibrates the damping forces with the damping ratios observed in the tank test campaign. The numerical evaluation generates the linear system in complex variables and evaluates the complex Response Amplitude Operators (RAOs) in 6 DoF for each frequency. Basic spectral analysis techniques are then considered to obtain the statistics of motion for each sea state.

3.2. Weakly Nonlinear Time Domain

The weakly nonlinear time-domain model is written in Matlab® and solves the hydrodynamic problem by performing time integration. The code is under development and has already been validated in regular waves [46]. Nonlinear hydrodynamic force models may be accounted for in time-domain codes rather straightforwardly [47,48,49]. To simulate structures with tubular elements, such as the WIND-bos, nonlinear Morison models are usually required to account for viscous forces. That same approach is considered in this paper to validate the in-house time-domain code with new irregular wave results.
The vertical tubular elements of the WIND-bos and previous analysis of motion responses for the same wave scenarios pointed to the surge drag as the only strong nonlinear hydrodynamic force in action, and so it is the only nonlinear force added to the code. The code is, therefore, said to be a weakly nonlinear time-domain code.
The equation of motion in 6 DoF of the platform may be written in the form of Newton’s 2nd law:
M · x ¨ t = F e t + F r t + F m t + F h y d s t + F a d d t ,
where M is the mass matrix of the rigid body; x ¨ is the acceleration vector; F e is the wave excitation force; F r a d is the wave radiation force; F m is the mooring force; F h y d s is the hydrostatic force; and F a d d is the added force. The force formulation is based on [46,50], whereas the wave radiation force is evaluated according to the Cummins Equation [51]:
F h y d s t = C hyds · x t ,
F m t = C m · x t ,
F r t = M A · x ¨ t 0 κ τ · x ˙ t     τ d τ ,
where:
κ ij τ = 2 π 0 B ij ω cos ω τ d ω .
In the weakly nonlinear time-domain model, the added force term is added to the system to account for viscous effects in 6 DoF. The evaluation is performed taking into account the expected damping ratios as observed in the wave tank test campaign in 6 DoF and also includes a nonlinear force term that represents the surge drag force acting in the three long vertical steel legs of the platform and the two main underwater bodies:
F a d d t = B add · x ˙ t 1 2 ρ C D A X x ˙ 1 t x ˙ 1 t i ^ ,
where ρ is the water density; C D is the weighted drag force coefficients of the underwater bodies; and A X is the total projected area of the underwater bodies in the x direction. Substituting Equations (2)–(6) back into Equation (1):
M + M A · x ¨ t + 0 κ τ · x ˙ t     τ d τ + B add · x ˙ t + 1 2 ρ C D A X x ˙ 1 t x ˙ 1 t i ^ + C m + C hyds · x t = F e t .
Remarkably, it is possible to consider any input force on the right-hand side. In this paper, the wave excitation force in irregular waves is evaluated by the code together with the wave elevation series, whereas this calculation is based on an arbitrarily large number of Airy components. For each one out of the I frequency bands, the code considers N Airy waves distributed within, such that the energy balance is satisfied, and the phases are random. The code also considers the 1.0 min ramp duration for the wave elevation and wave force series:
ψ i , j   ~   U 0   ,   2 π ,
ω i , j   ~   U ω i d ω i 2   ,   ω i + d ω i 2 ,
A i , j   ~   N 0   , 2 S ω i d ω i N ,
ζ w t = j = 1 N i = i I A i , j sin ω i , j t + ψ i , j ,
F e t = j = 1 N i = i I f e ω i A i , j sin ω i , j t + ψ i , j + ξ ω i ,
where i , j is the index of the j -th wave within the i -th frequency band; ψ is the phase of the wave; ω is the frequency of the wave; A is the amplitude of the wave; f e are the 6 DoF wave excitation force coefficients with correspondent phase ξ ; S ω is the sea spectrum; U is the uniform distribution; and N μ ,   σ 2 is the normal distribution with mean μ , and variance σ 2 . Note that Equation 9 applied to an even discretization of frequency bands d ω i leads to an exact amount of N × I Airy waves uniformly distributed within the interval ω 1 d ω 2 ,   ω N + d ω 2 . It is also important to remark that Equations 11 and 12 hold true for an arbitrarily large N ; however, the discretization of waves cannot be overcounted, for the amplitude of each individual wave must be represented by the numerical tolerance of the processing machine.
Last but not least, time integration is performed using the Runge–Kutta 4th-Order Method in 6 DoF, with the forces and motions being evaluated every 0.04 s. The computational time required for each 3.0 h sea state is around a few hours in a regular computer.

3.3. Coupled Time Domain

The coupled time-domain simulations are performed by SESAM DeepC® and include a model of the coupling between the platform and mooring system. The mooring forces arise from diverse physical phenomena, for instance, due to the elasticity of the lines, the inertia of the lines, hydrodynamic damping acting on the lines, and wave excitation forces acting on the lines, just to cite some of the phenomena that may have indeed affect somehow the dynamics of the system in the basin. The software allows the user to input all relevant parameters ruling the dynamic of mooring lines; however, attention must also be paid to the measurement of values in the basin, as this can only be performed during the period of the wave tank test campaign. That said, Figure 3 presents the coupled model in SESAM DeepC®, with the lines modeled just as measured in the basin. Moreover, the coupled time-domain simulations are performed with a linear added damping matrix to match the significant amplitude of motion of simulations with the expected significant amplitude of motion as observed in the tank test campaign.
By now, the numerical approaches do not include second-order effects such as wave mean drift and difference-of-frequency wave excitation forces. However, this should now be required to assess the first-order motions of the present platform, as measured in the experimental program.

4. Results

4.1. Free Decay and Iterative Damping Results

Free decay tests are performed to obtain basic characteristics of the platform, such as the natural periods at the different modes of motion, as well as the damping ratios. The WIND-bos platform is a spar FOWT, i.e., it has a small waterplane area in regard to its underwater sections. Thus, it is expected that most of the damping acting on the platform comes from viscous damping on the submerged elements but not from the potential damping related to wave radiation on the free surface. Viscous forces deviate significantly from linearity.
For the coupled time-domain simulations, to simulate the platform with a coherent damping matrix, an iterative method was applied: for each wave scenario, an added damping matrix was evaluated iteratively and added to the linear system till the numerical damping ratios correspond to the experimental damping ratios at the particular amplitudes of motion. There is a significant increase in computational time when doing so; however, the simulations are performed considering from 1.0 to 12.0 m significant wave height sea states, showing that the results might indeed be undermined if a single damping matrix is considered.
For underdamped oscillations, the damping ratio may be evaluated based on the rule of logarithmic decrement:
δ = 1 k ln X i X i + k ,
where δ is the damping ratio; k is the number of full oscillations considered when performing the evaluation; and X i is the i -th peak value. When using Equation 13, it is important to check that the motion is centered around the x -axis, i.e., X i 0 as i + .
The damping ratios obtained from experiments are presented in 
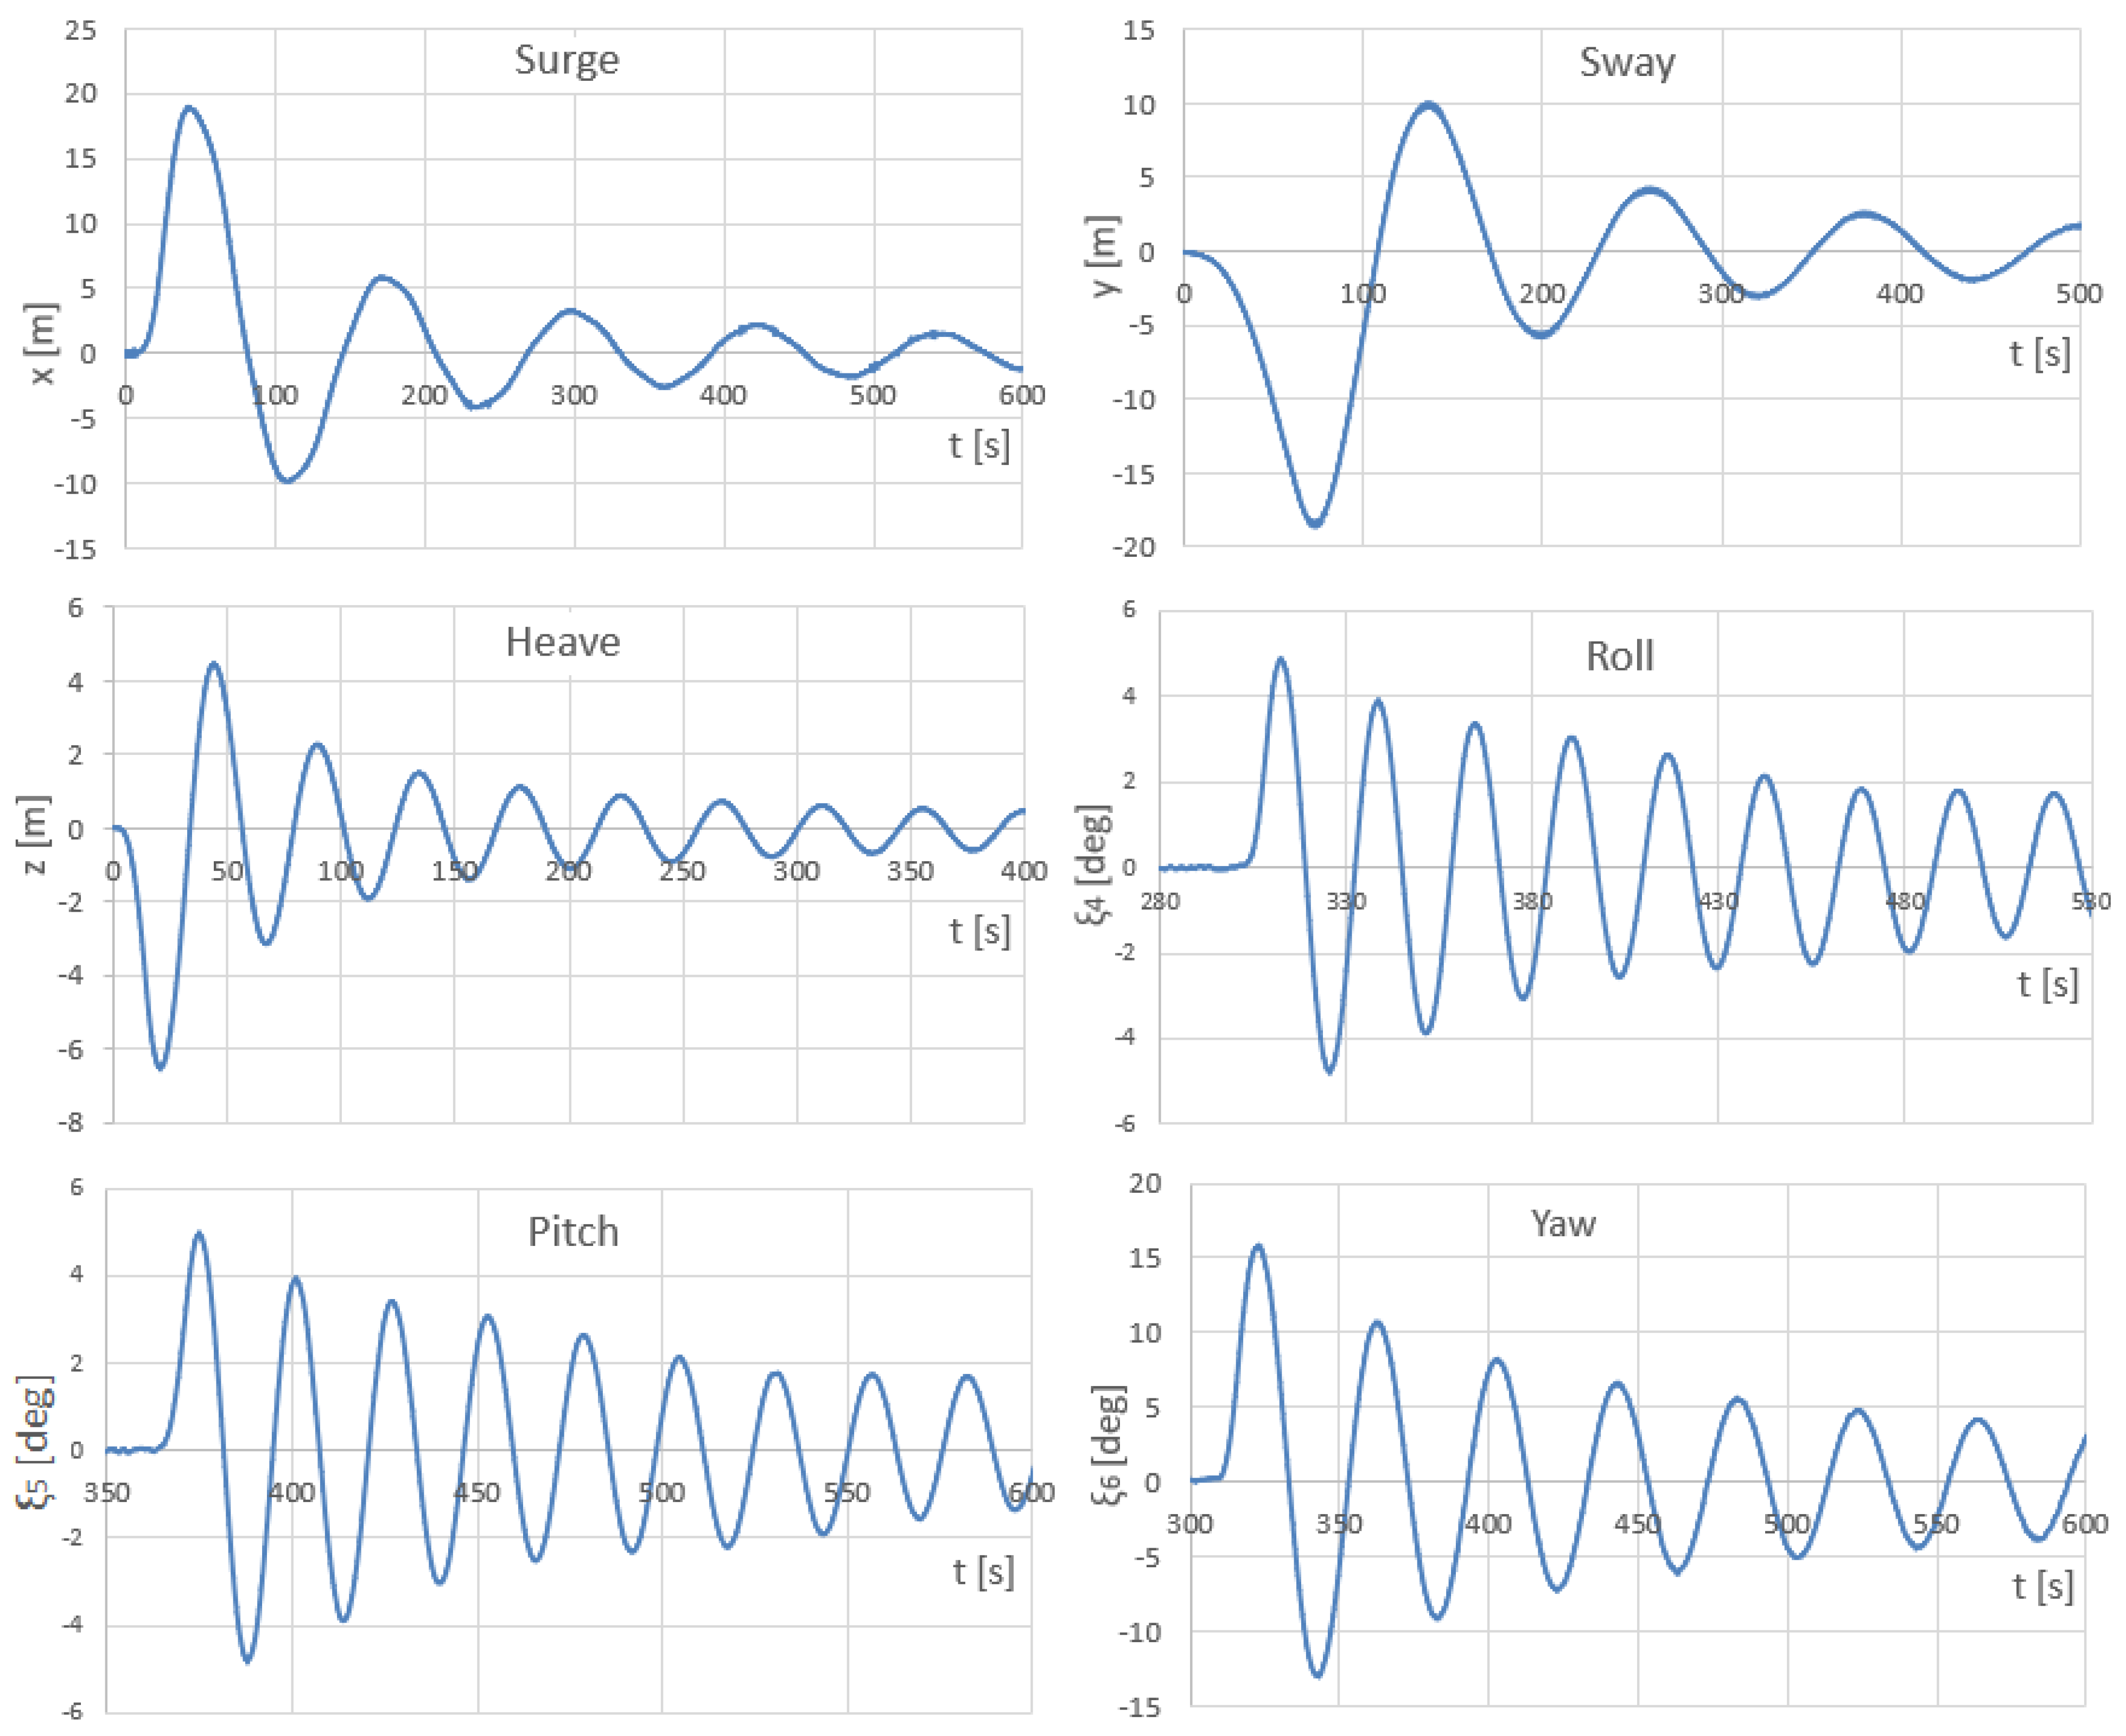
Table 4 for various amplitude ranges, illustrating that the damping ratios vary considerably according to the motion amplitudes of the platform. Based on the experimental free decay time series, the natural periods for heave, roll, and pitch read, respectively, 44.71, 27.33, and 27.35 s for the free-floating platform. Then, for the moored platform, the same natural periods read 44.38, 25.93, and 25.95 s for heave, roll, and pitch, respectively. Moreover, for the moored platform, the natural periods in surge, sway, and yaw read 123.54, 120.48, and 40.14 s, respectively. The free decay tests are presented in Figure 4 for the moored platform.
The results presented in Table 4 show that the platform has considerably high damping, especially on the surge mode, whereas the damping on the pitch is fairly lower, considering that the pitch angle platform must be kept small, and so will be the damping ratio. Thus, it is reasonable to consider a constant damping ratio for pitch and heave in the small regular wave scenarios, and the values compute 16% in heave and 8.0% pitch. A similar trend to Table 4 is observed when plotting the final damping ratios obtained iteratively during the coupled time-domain simulations, as shown in Table 5.
Because the surge response is affected by drift, a constant damping ratio was considered in the surge mode for the coupled time-domain simulations. When comparing the results between the free-floating and the moored platform, it is observed that the damping ratios are rather slightly affected; thus, the damping forces acting on the lines may be neglected in practice, which was expected from the type of mooring used, whereas the major effect of mooring is indeed stiffness.
By comparing the natural period results, it is observed that the heave natural period is decreased by only 1.0% after the inclusion of mooring lines. In the case of roll and pitch, the natural periods are decreased more considerably, by around 5.0%, most likely due to the elasticity of the lines. Because the natural periods of horizontal motions (surge, sway, and yaw) can only be evaluated for moored platforms, it is not possible to compare the results with a free-floating platform.

4.2. Regular Waves Results

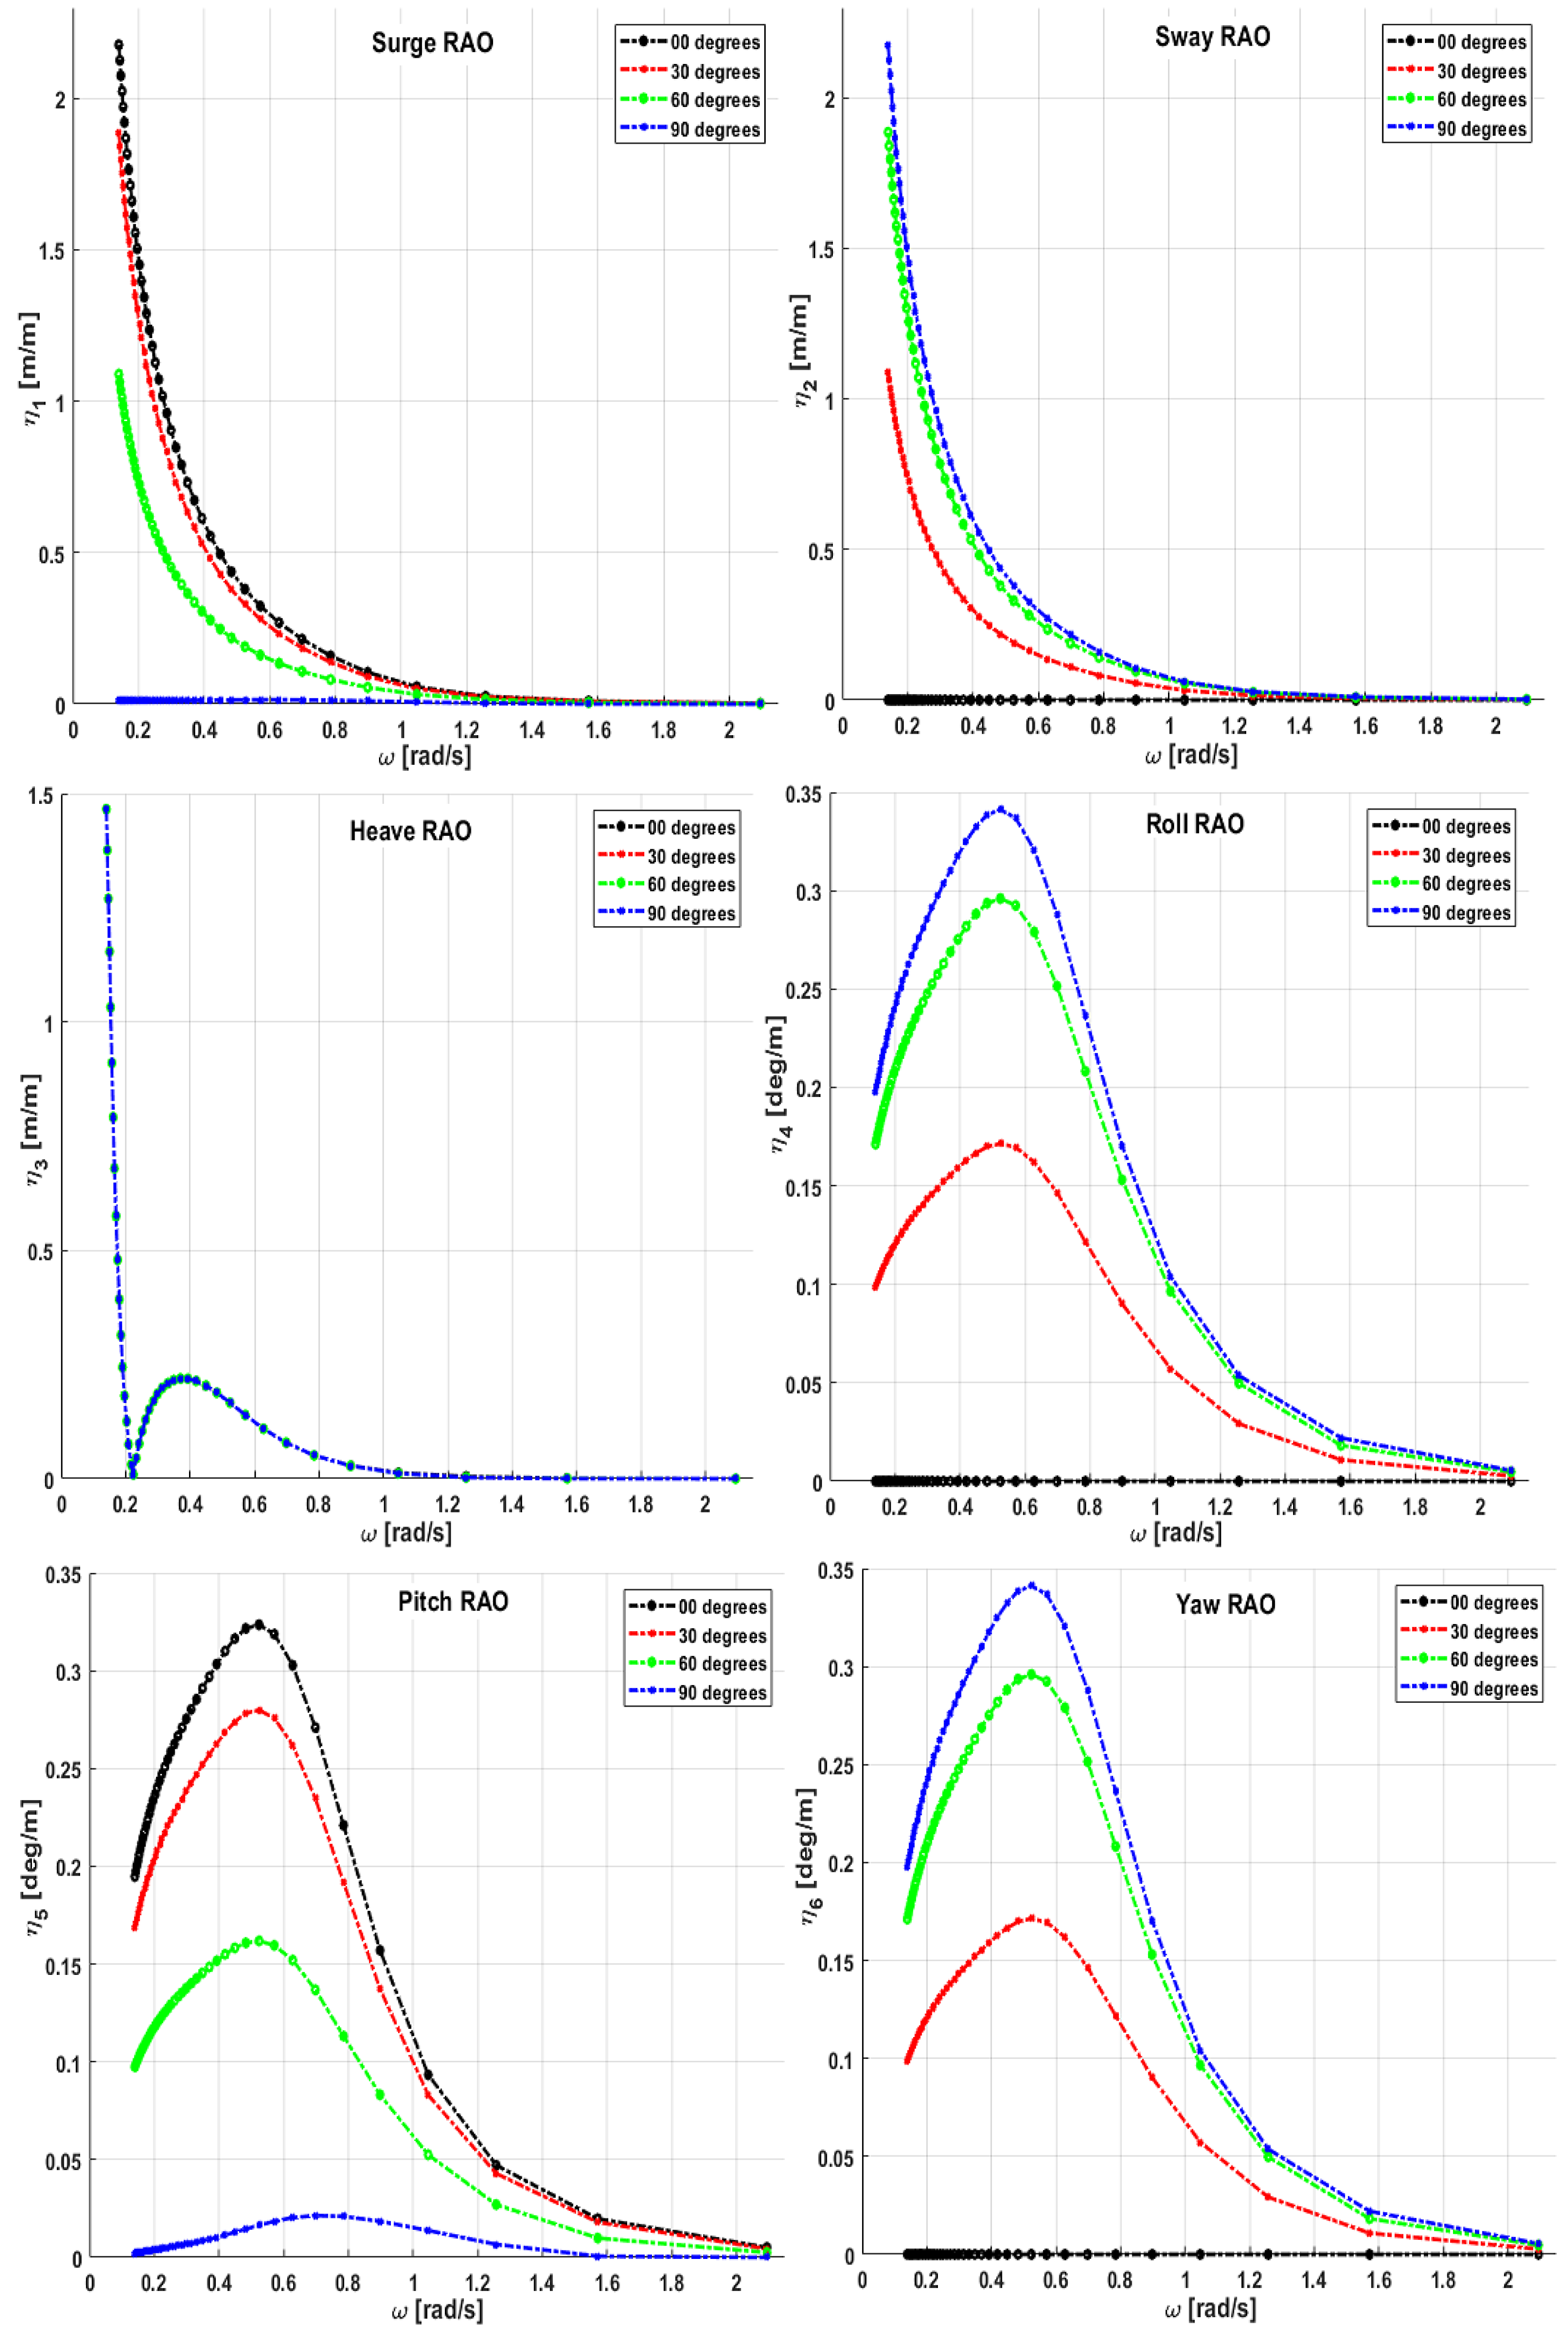
The post-processed RAOs are plotted for different wave incidences in Figure 5.
In Figure 5, it is observed that the platform has a symmetric behavior when responding to sea waves, for the heave motion does not depend on the wave direction, and the roll and pitch motions compensate for each other. The natural frequency of heave is around 0.14 rad/s, where a peak is observed in Figure 5. The heave amplitude of motion reaches almost 1.5 m per meter of wave for long waves. However, the heave natural frequency is outside the range of common sea waves. In the case of roll and pitch, the peak of response is observed at 0.50 rad/s (~12.5 s), which is actually about half of the natural periods of those modes.
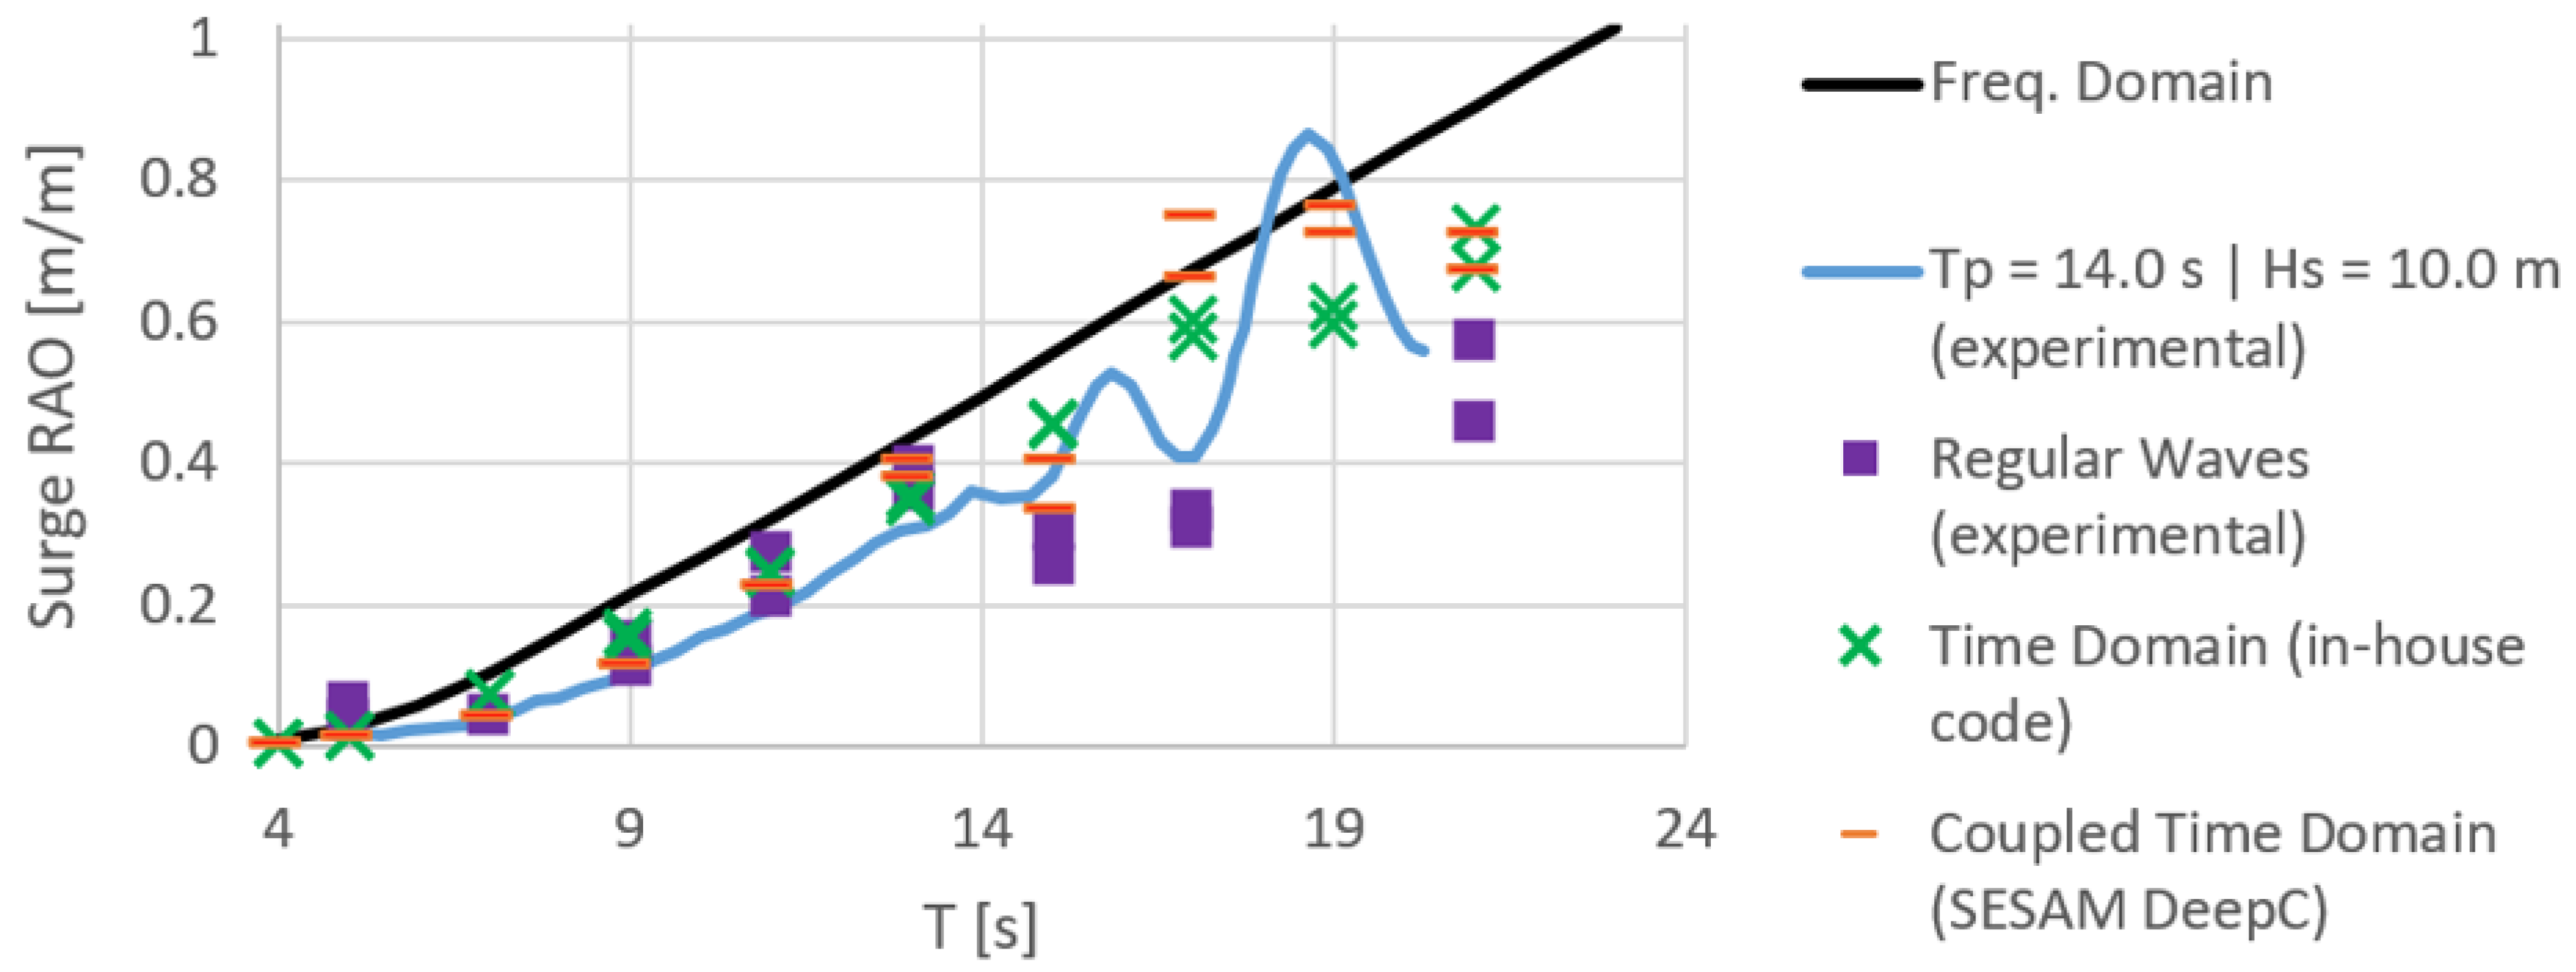
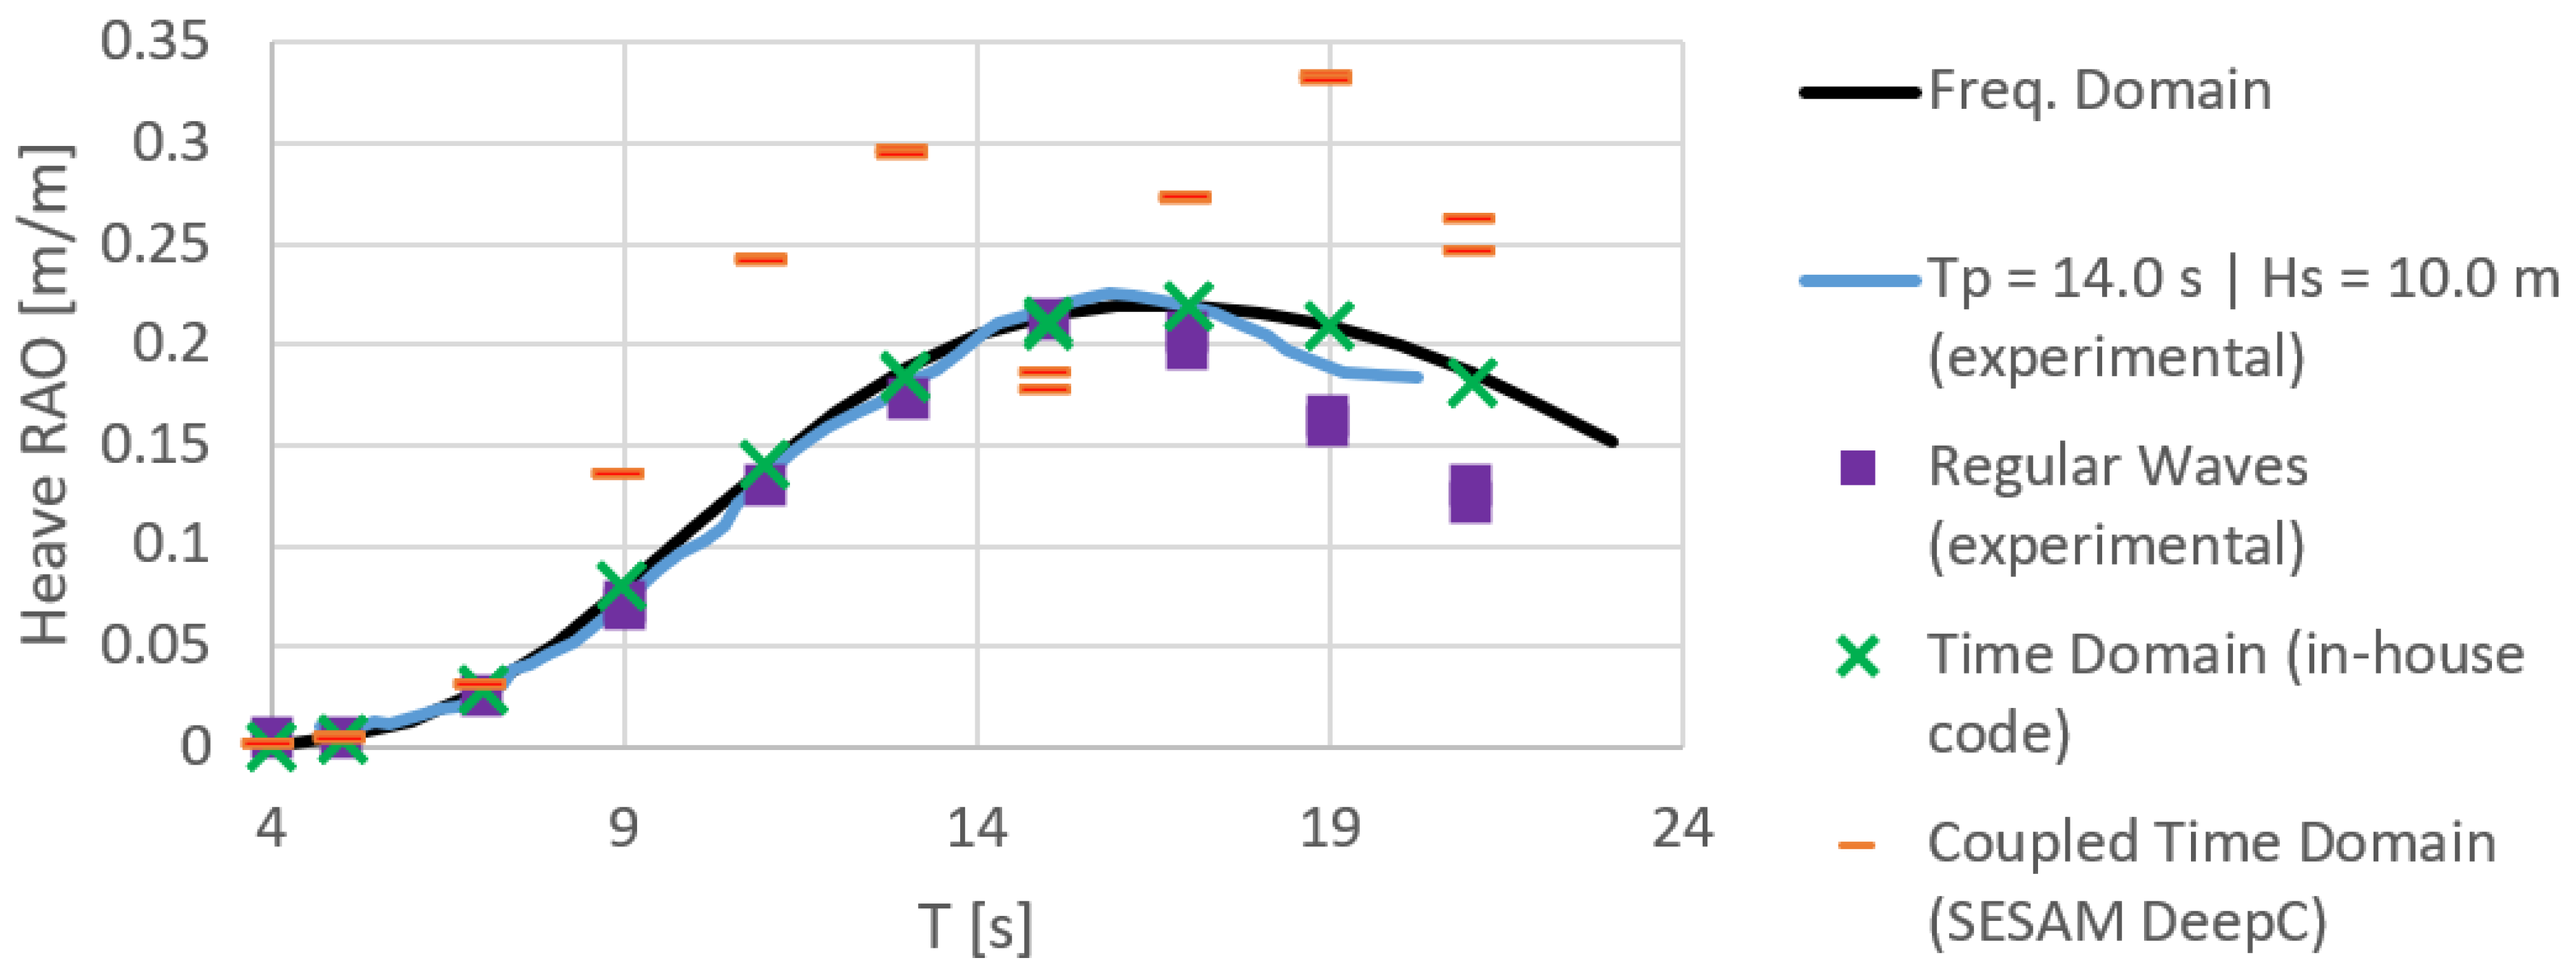
Figure 6, Figure 7 and Figure 8 present the RAOs according to the different methods, mostly obtained from the regular wave scenarios, both experimentally and numerically. The amplitudes of motion are obtained based on the averaged distance between maxima and minima after the stationary regime has been achieved. Clearly, in those figures, the weakly nonlinear time-domain code is the method that achieves results that are closer to the experimental values, whereas the frequency domain results and the coupled time-domain results deviate in some cases and for different particular reasons. Still, the results obtained by all methods compare well.
The coupled time-domain model is the only one that predicts an increase in surge motion in wave periods between 17.0 and 21.0 s, for instance, whereas this increase in motion response has indeed been observed in the basin in RW17 and RW18 (19.0 s wave period), and may be related with mooring effects. On the other hand, the coupled time-domain model fails to predict the heave motion with accuracy. The comparison between different methods shows that the heave of the platform in regular waves is ruled mainly by first-order forces. Thus, the coupled time-domain simulations are probably failing to predict the heave mode because the addition of nonlinear mooring effects is not the ideal approach to increase the accuracy of the heave motion prediction.
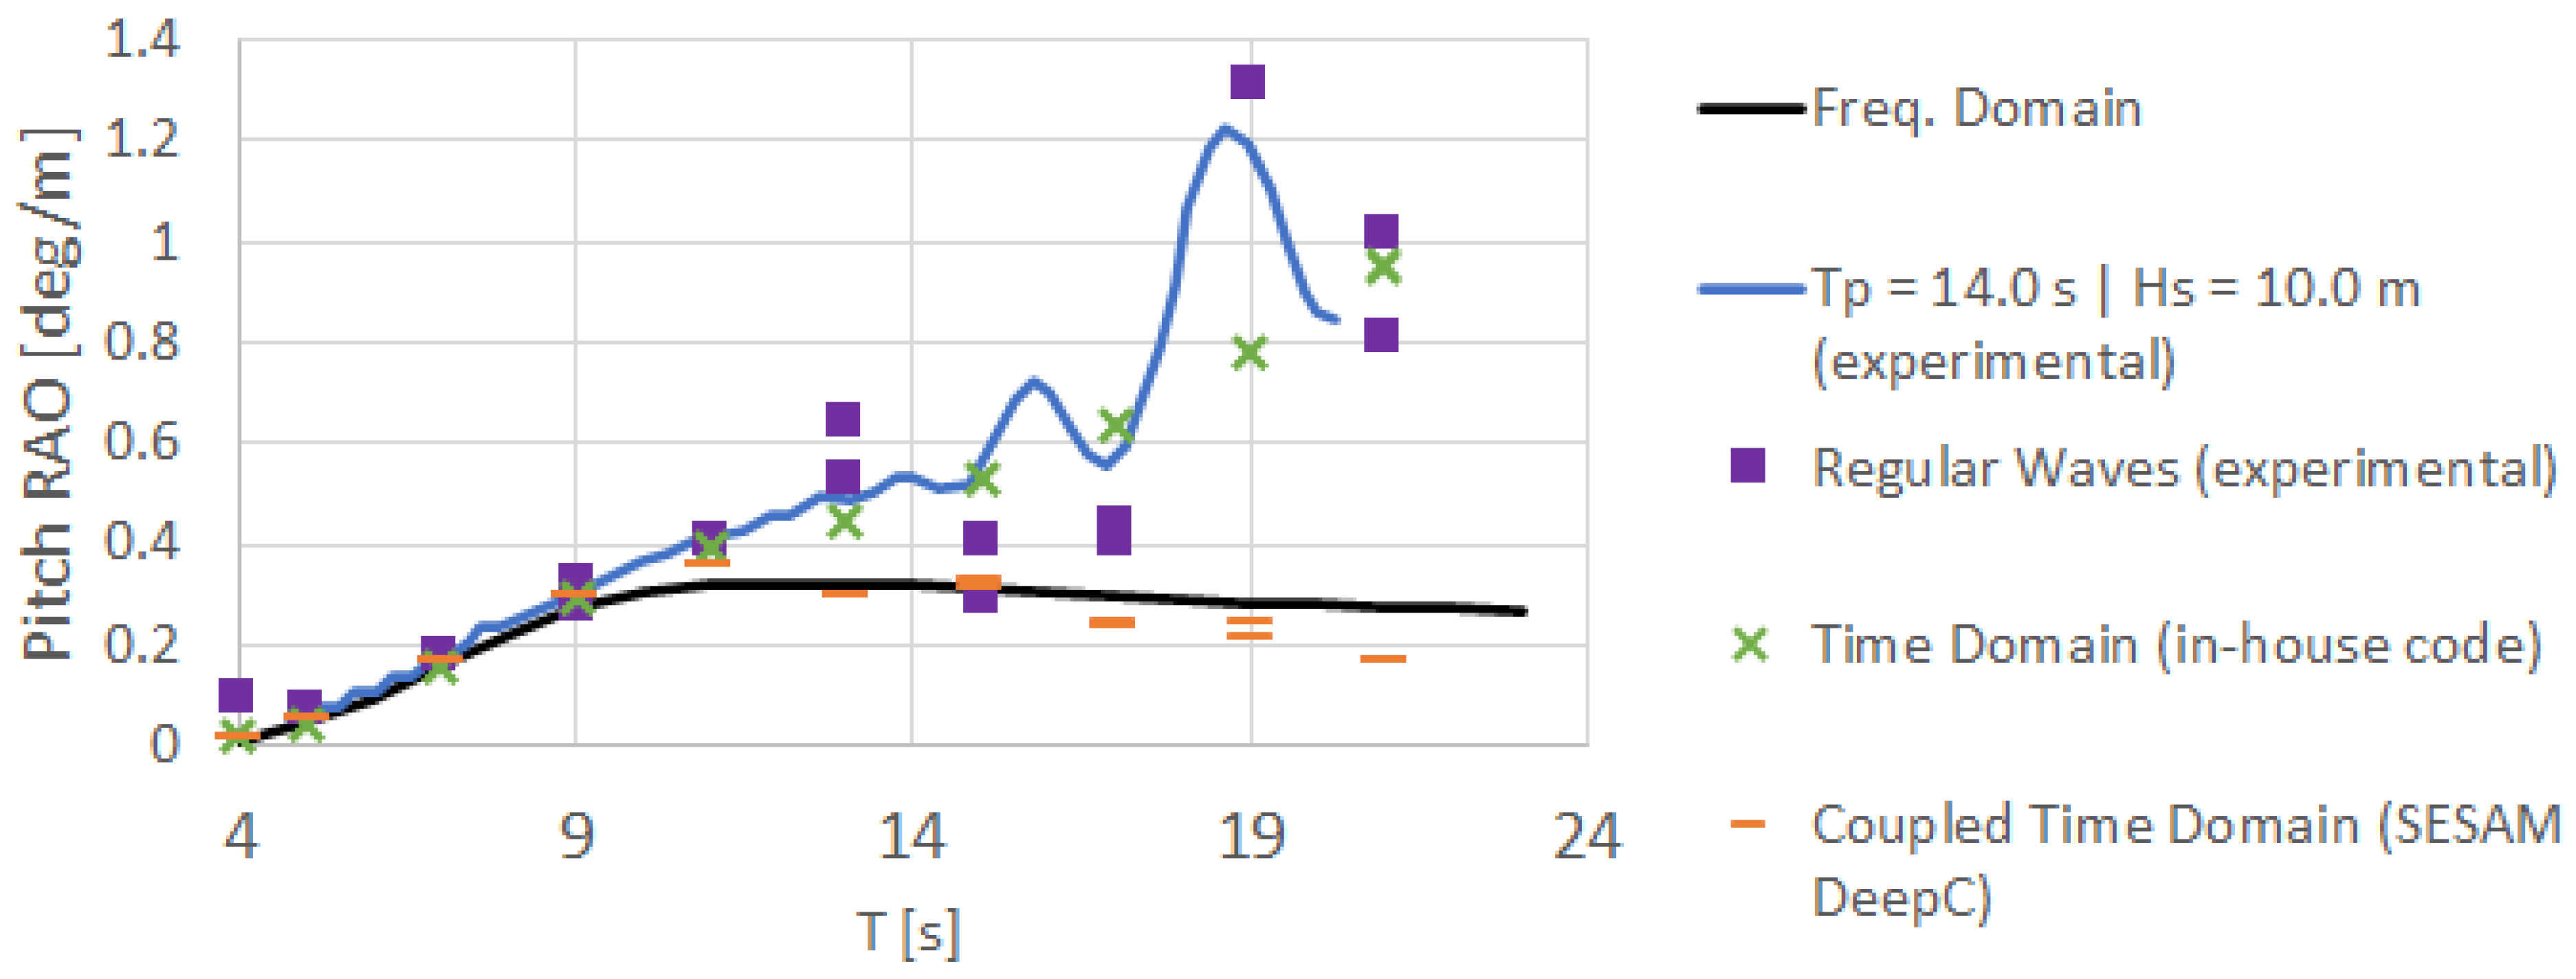
In the case of pitch motion, the coupled time-domain simulations show that this mode is very sensitive to the pitch damping ratio assigned, especially at high wave periods, and therefore calibration is required to match values. In Figure 8, the coupled time-domain results are obtained after the significant amplitudes of motion matched with the expected ones for the same damping ratio. Because of this, an underestimation of response is being observed, for the damping ratio is calibrated with values obtained around the resonant frequency. The frequency domain model also fails to predict the pitch response to irregular waves, whereas the weakly nonlinear time-domain model is fairly good, capturing the trend of pitch response, especially when compared with the experimental RAOs obtained in the high energy scenario IW8.

4.3. Irregular Waves Results

The primary results obtained from the irregular wave simulations are the full-time series of motion, from which several parameters regarding hydrodynamic performance may be further evaluated.
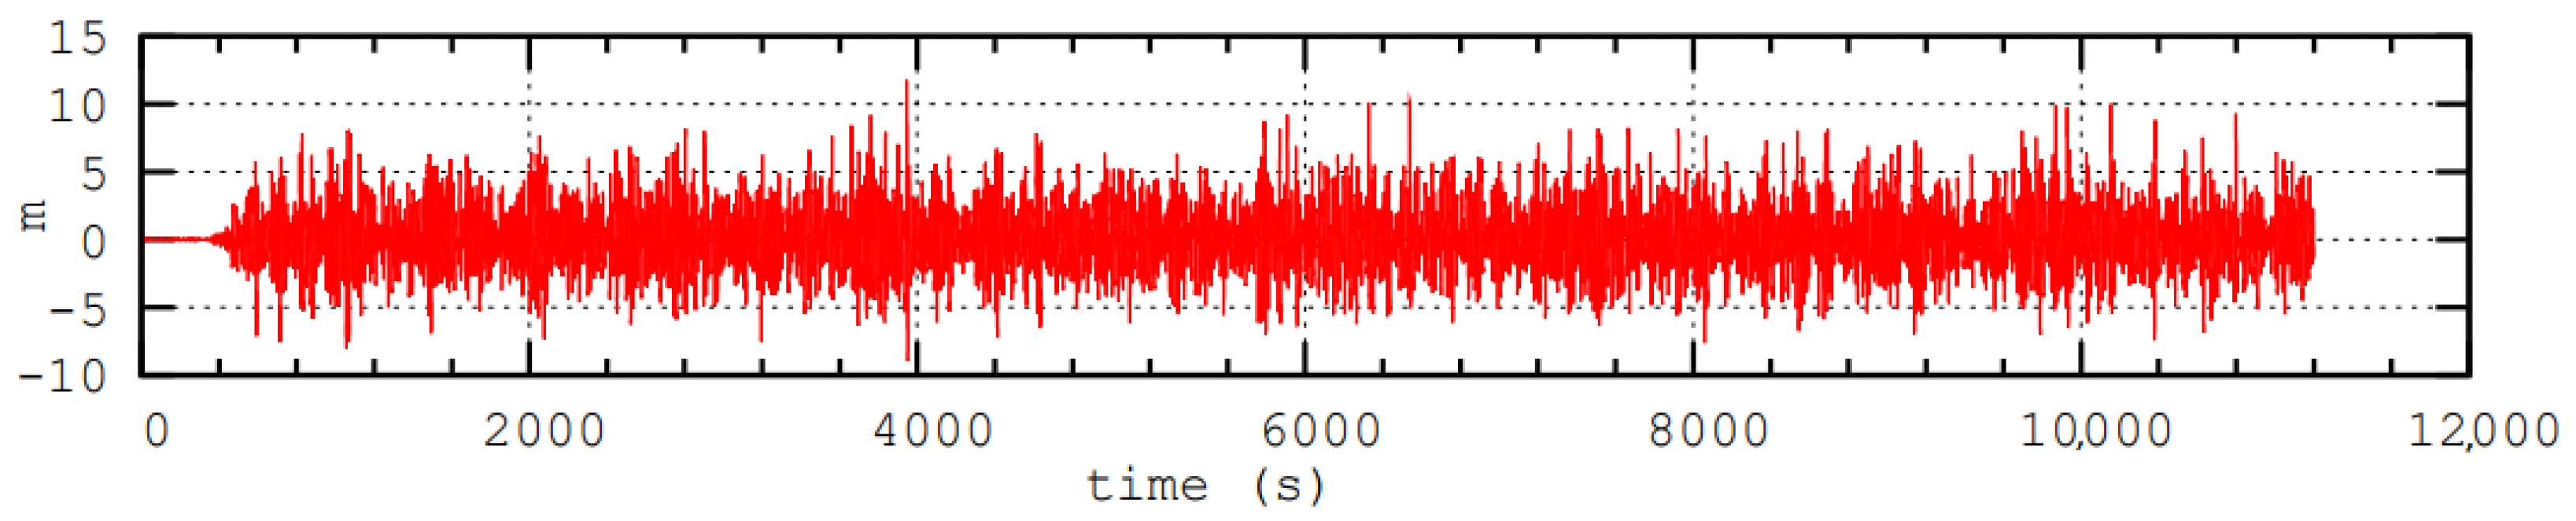
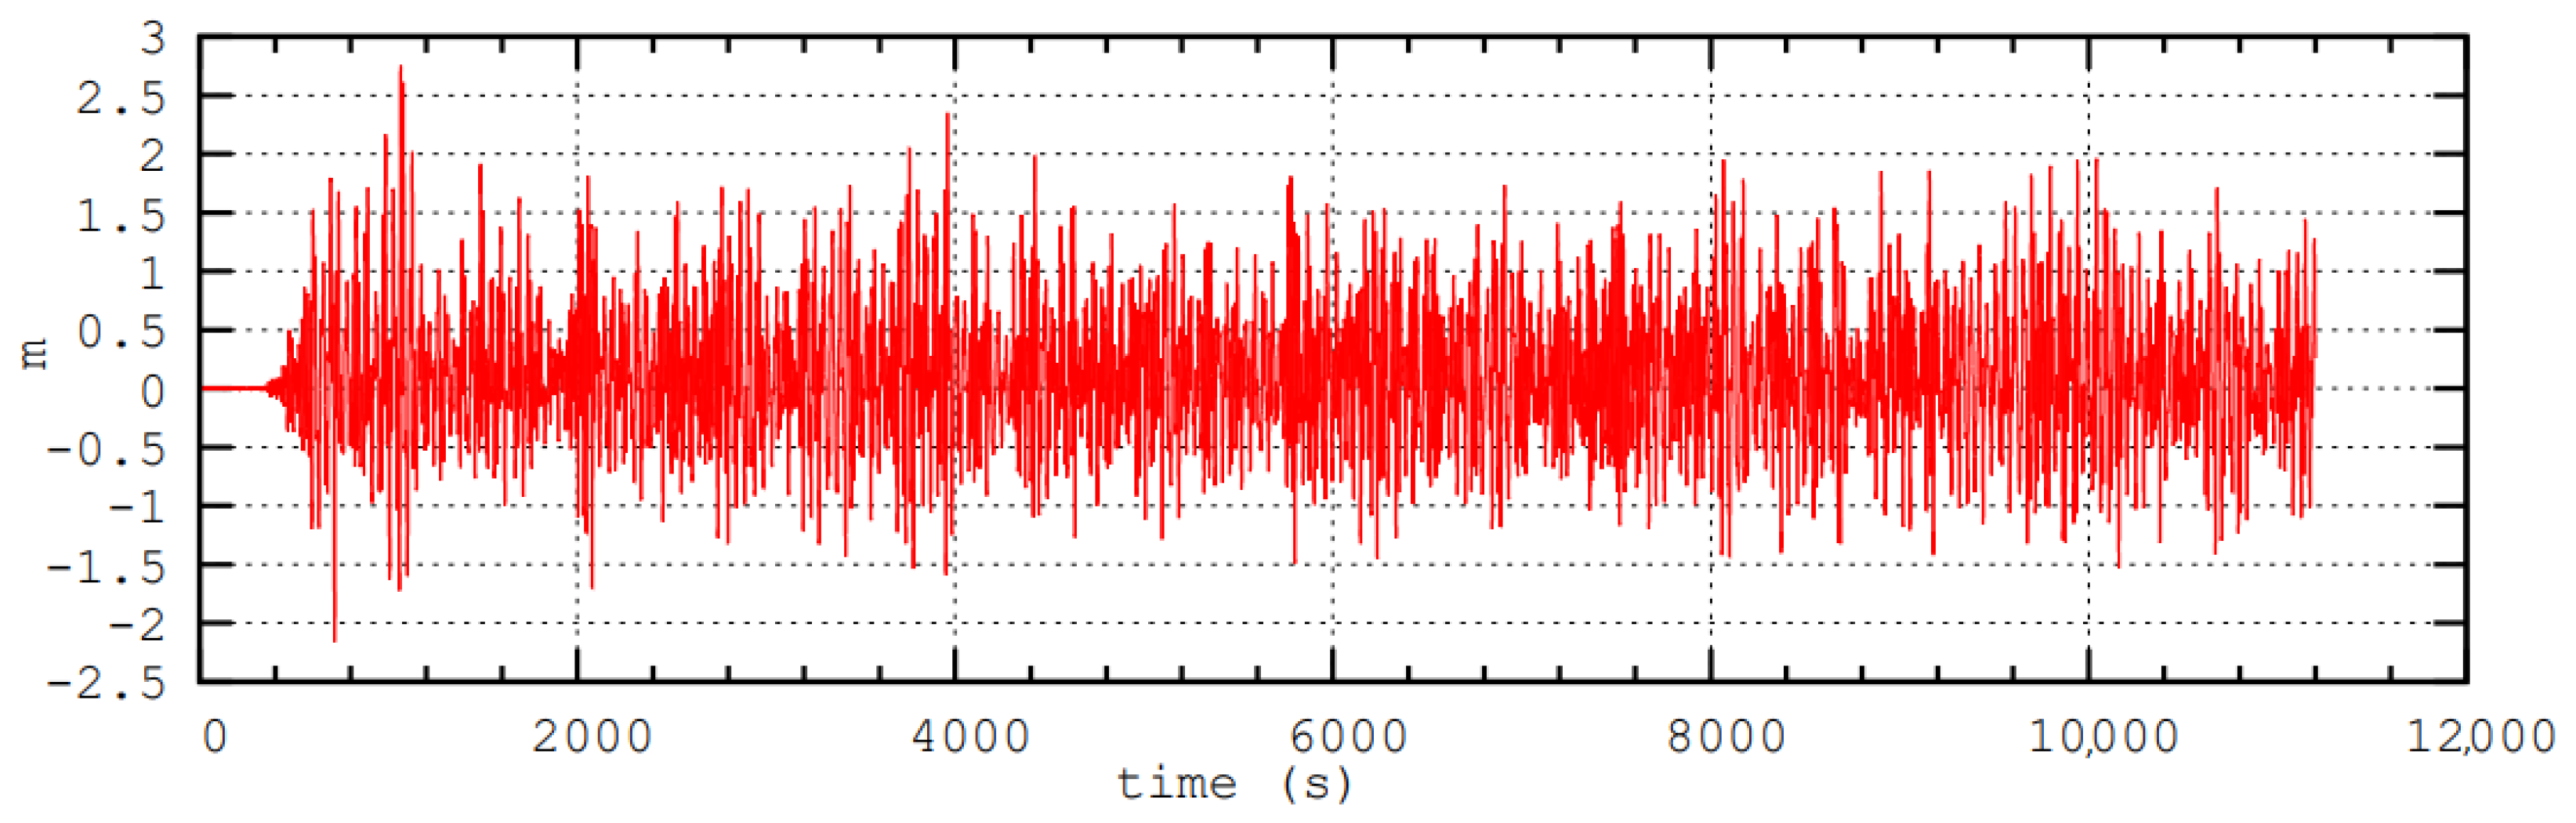
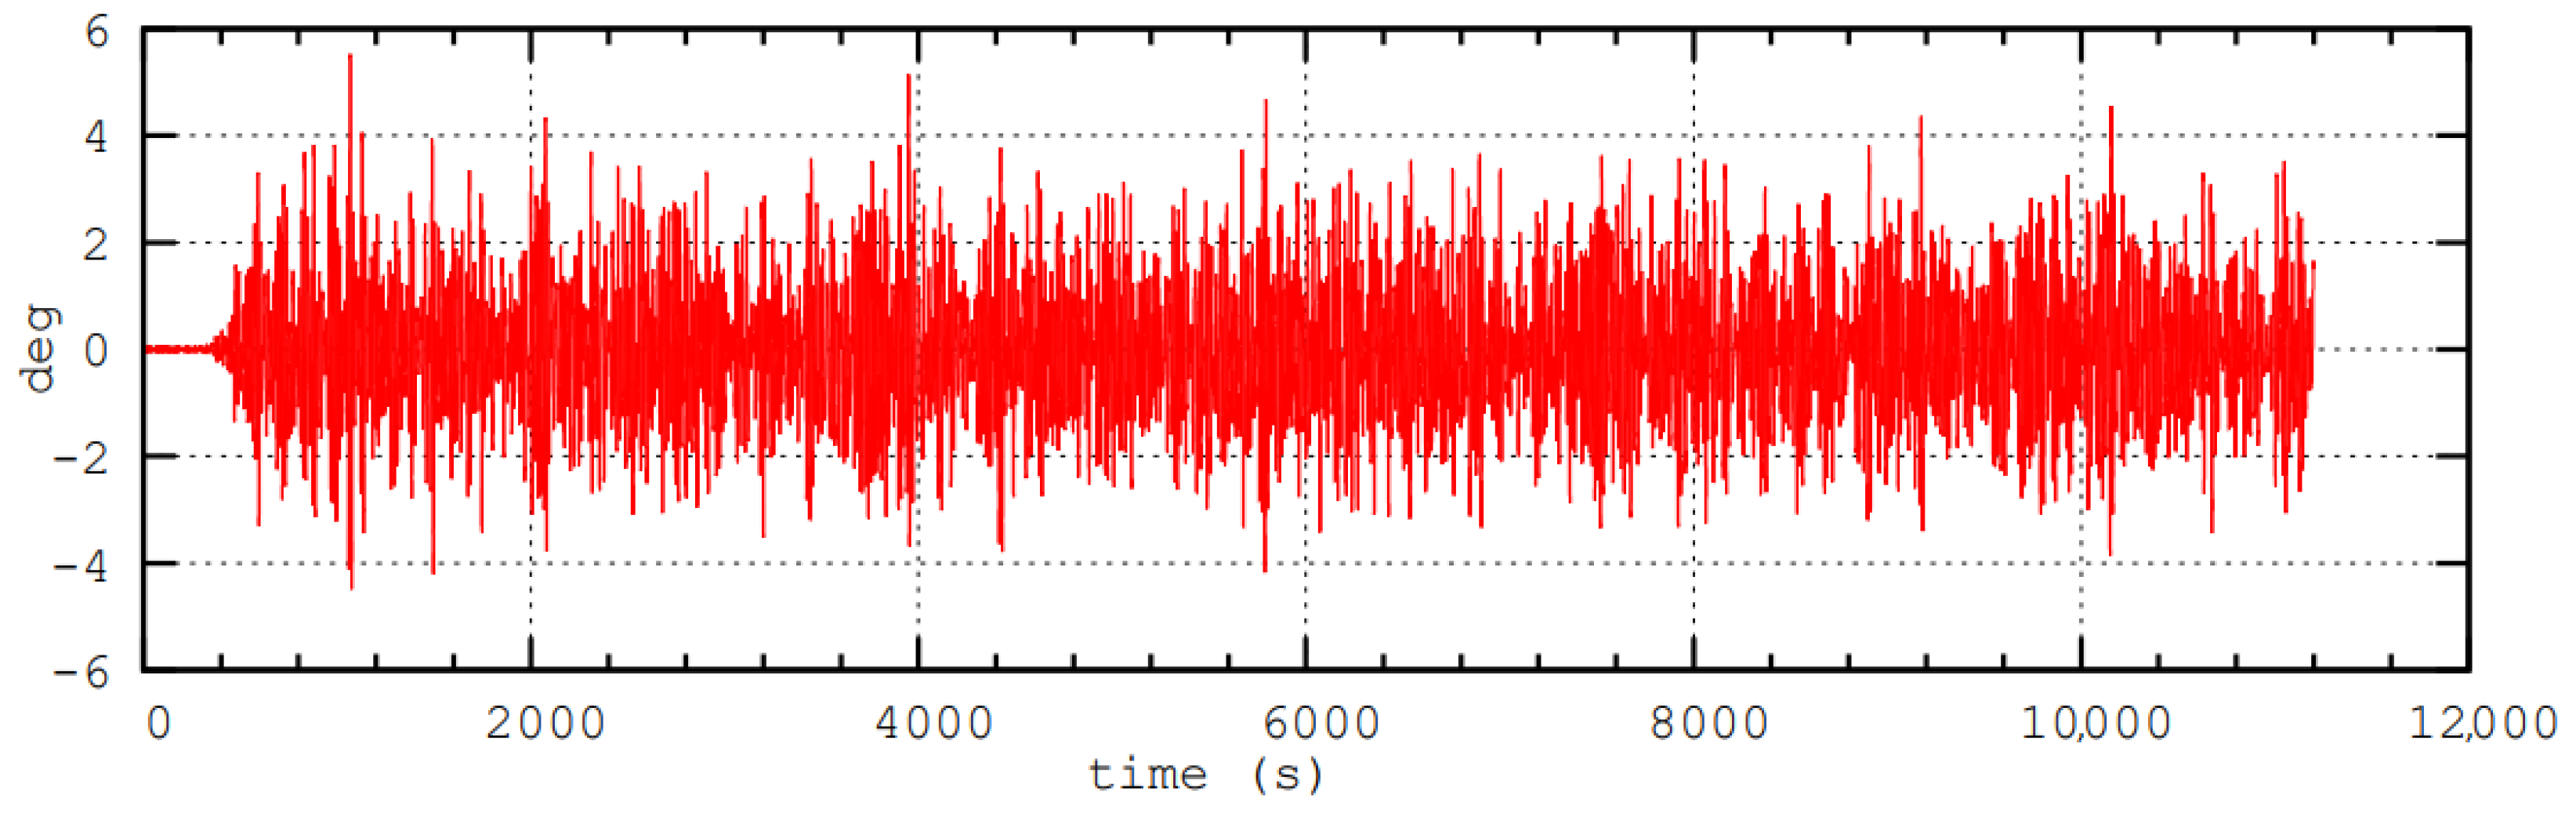
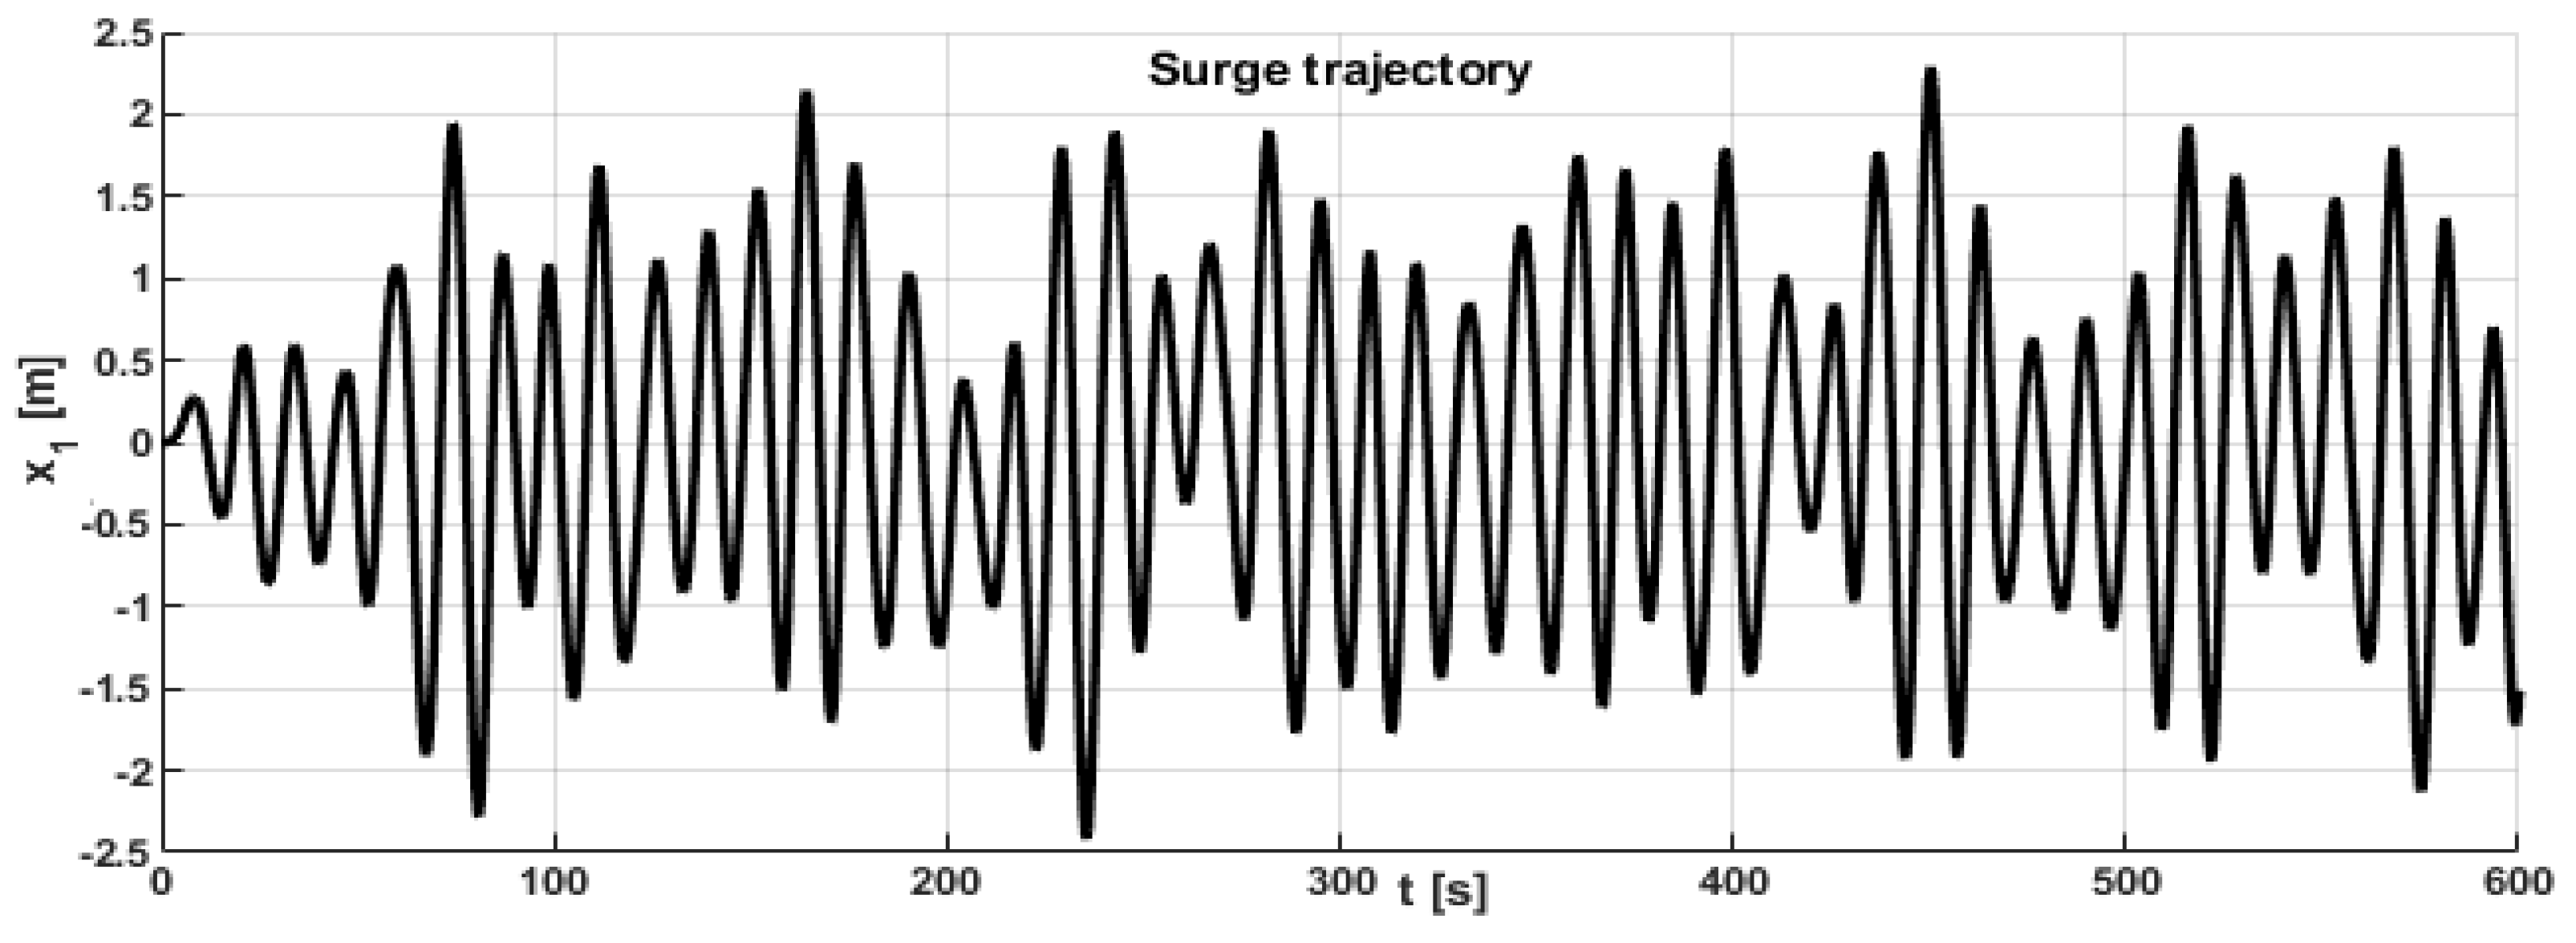
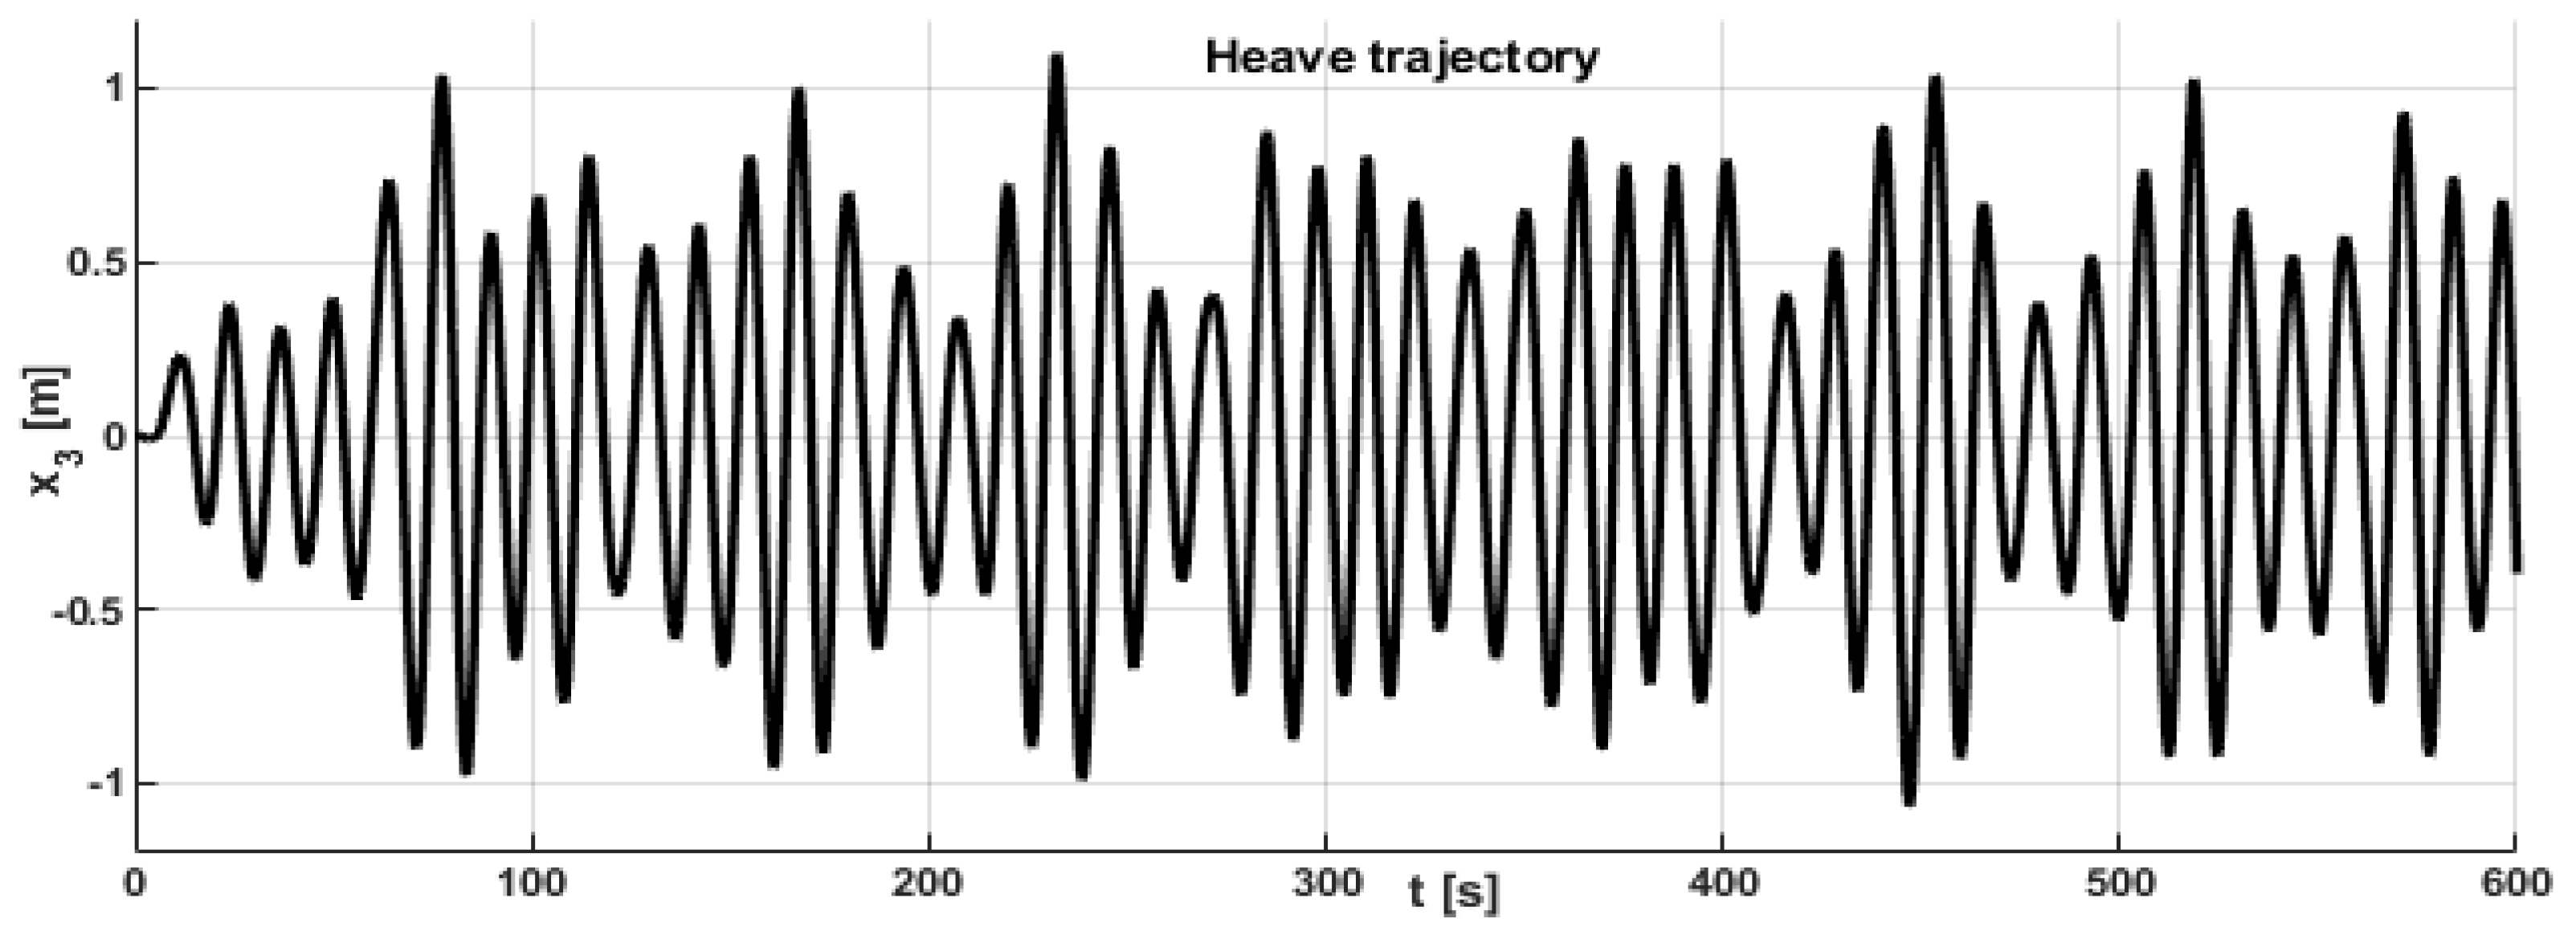
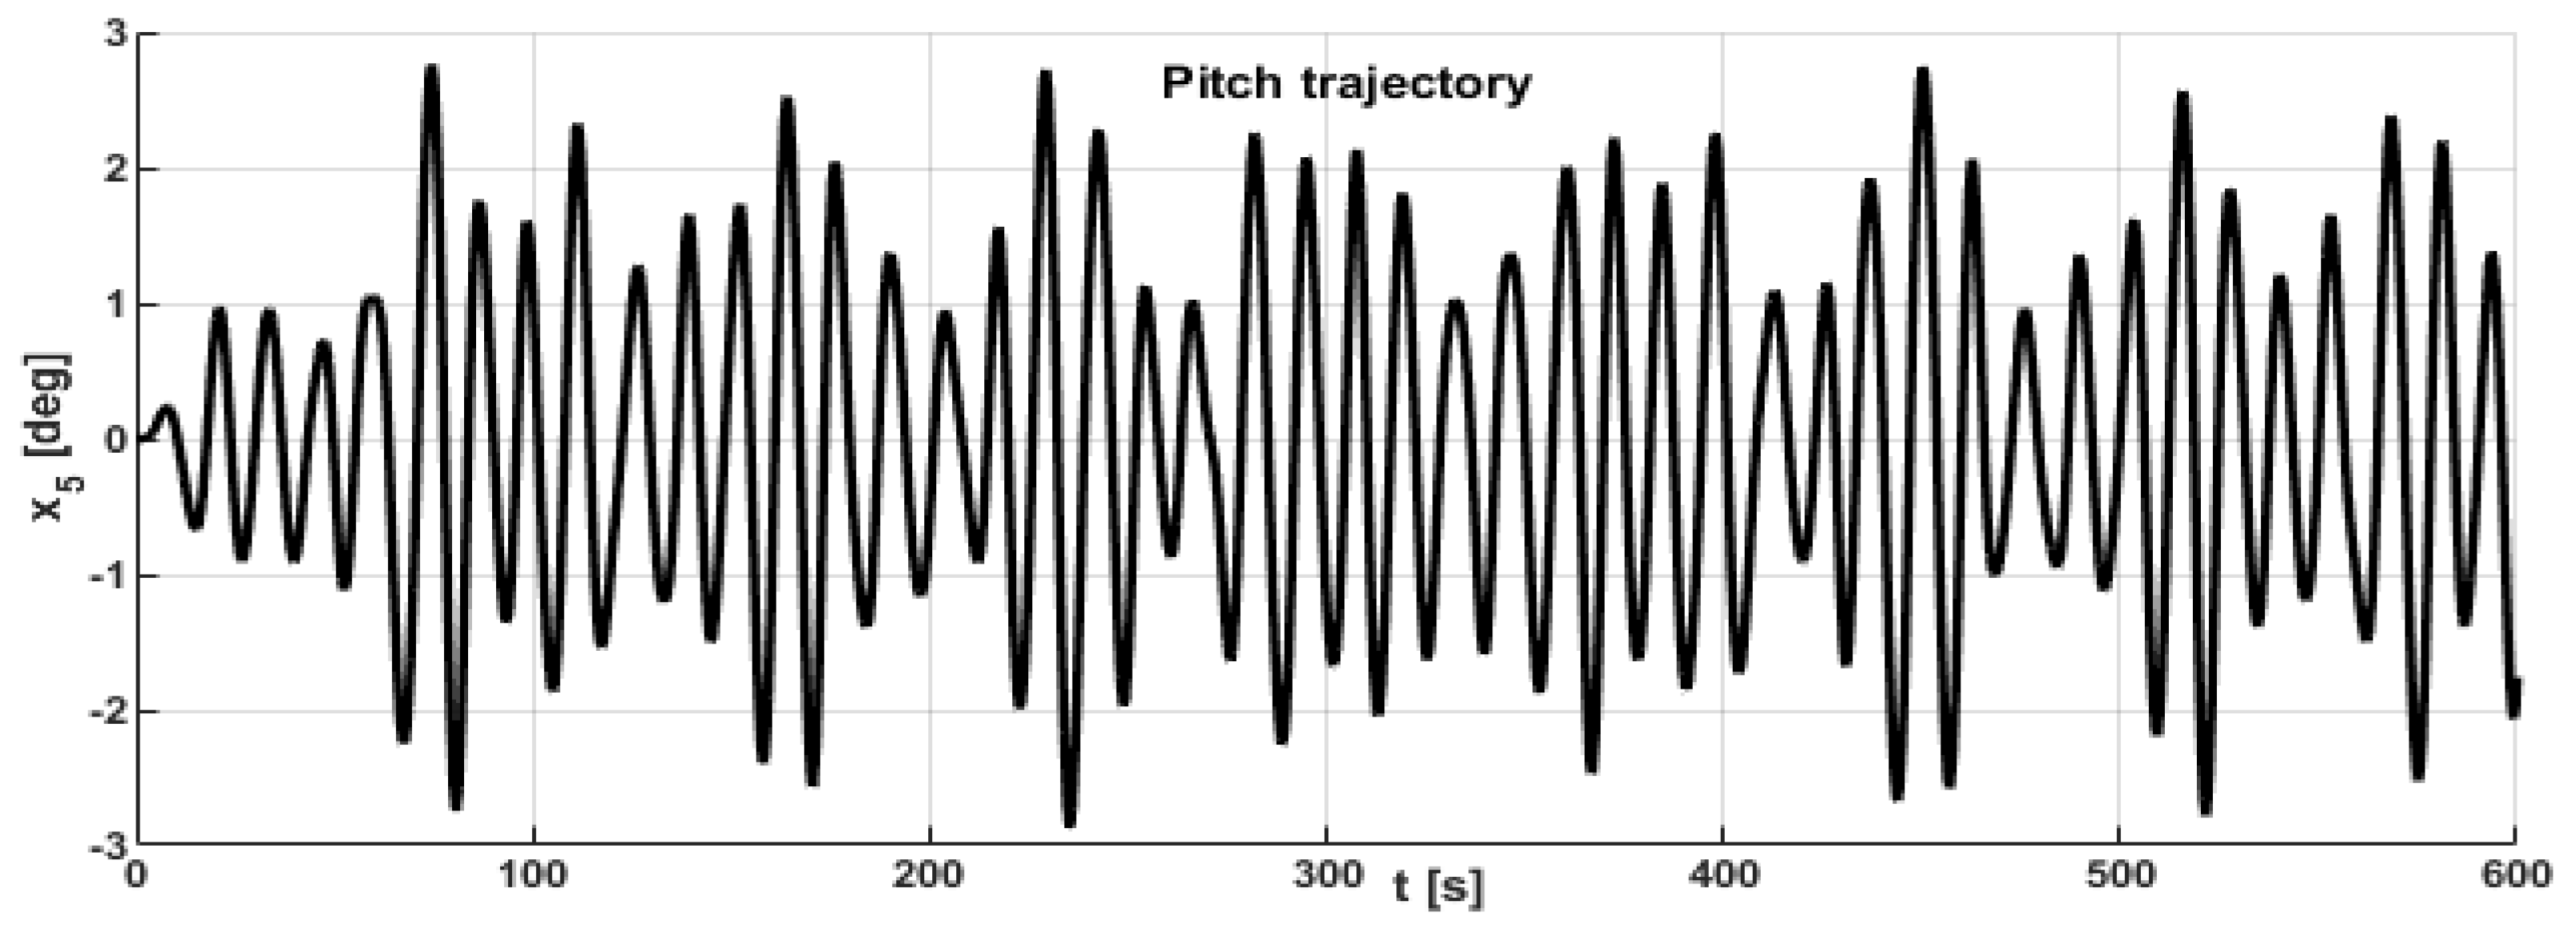
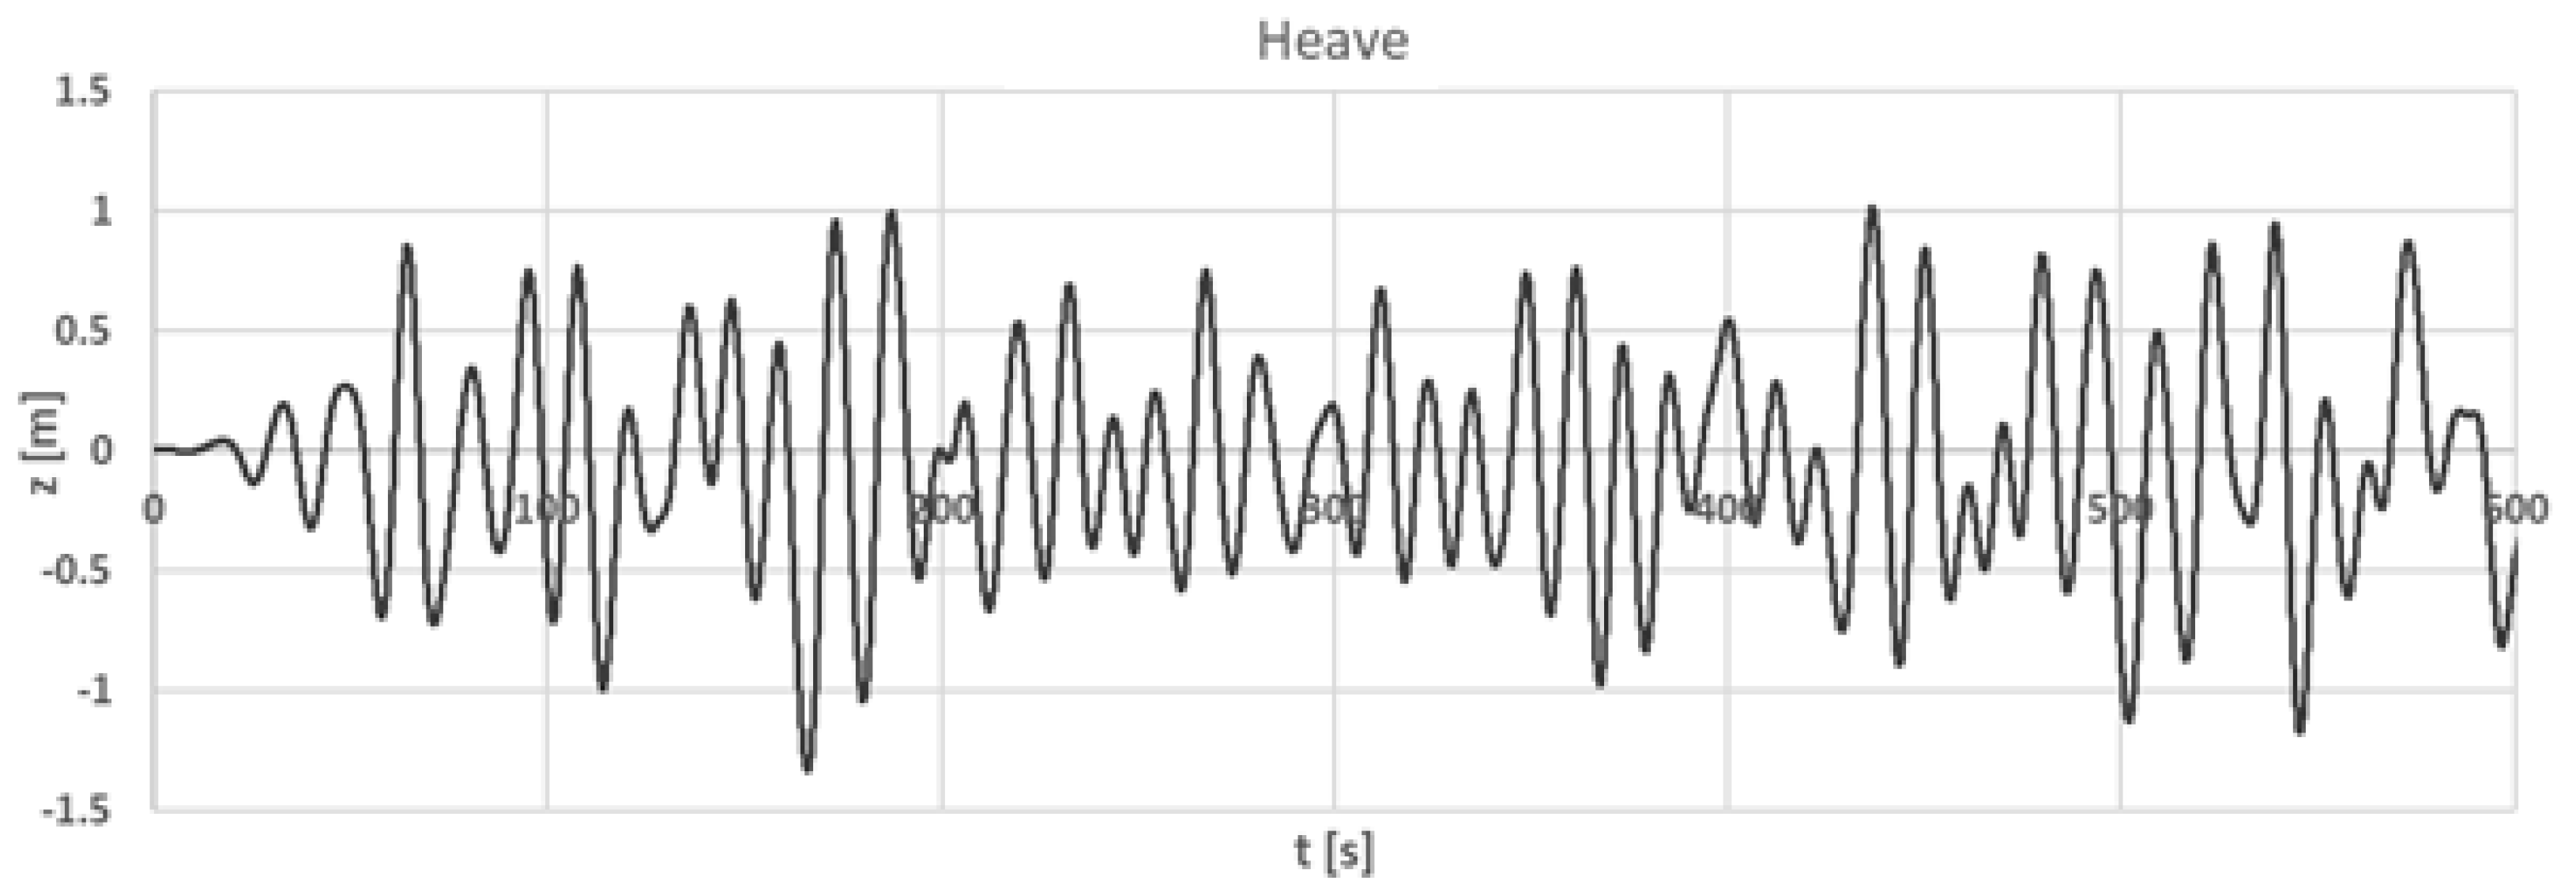
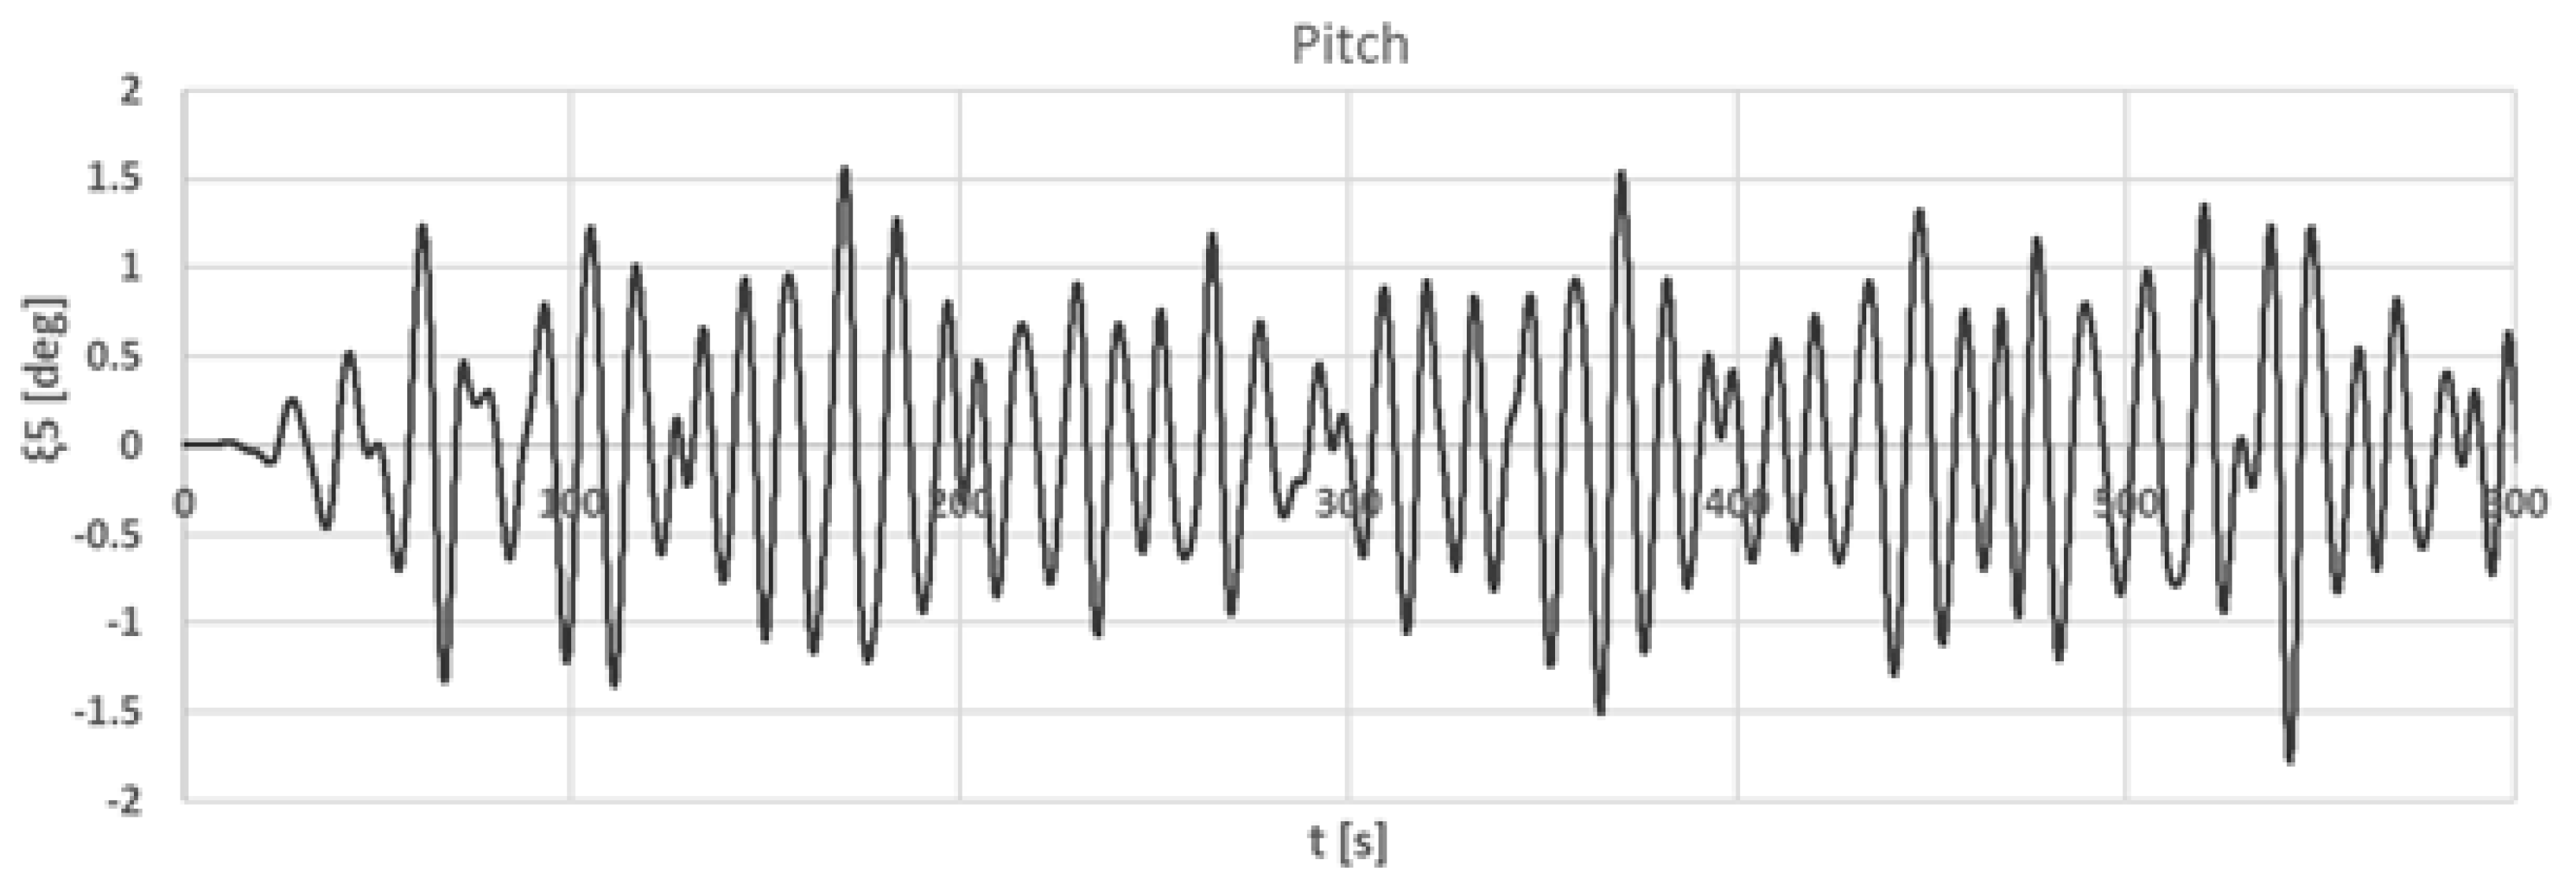
 Figure 9, Figure 10, Figure 11 and Figure 12 present the wave elevation, surge motion, heave motion, and pitch motion, respectively, in test IW8 as measured in the wave basin. These plots illustrate the response of the platform for an environmental scenario of interest, whereas it would be unpractical to present the whole set of time series obtained. In
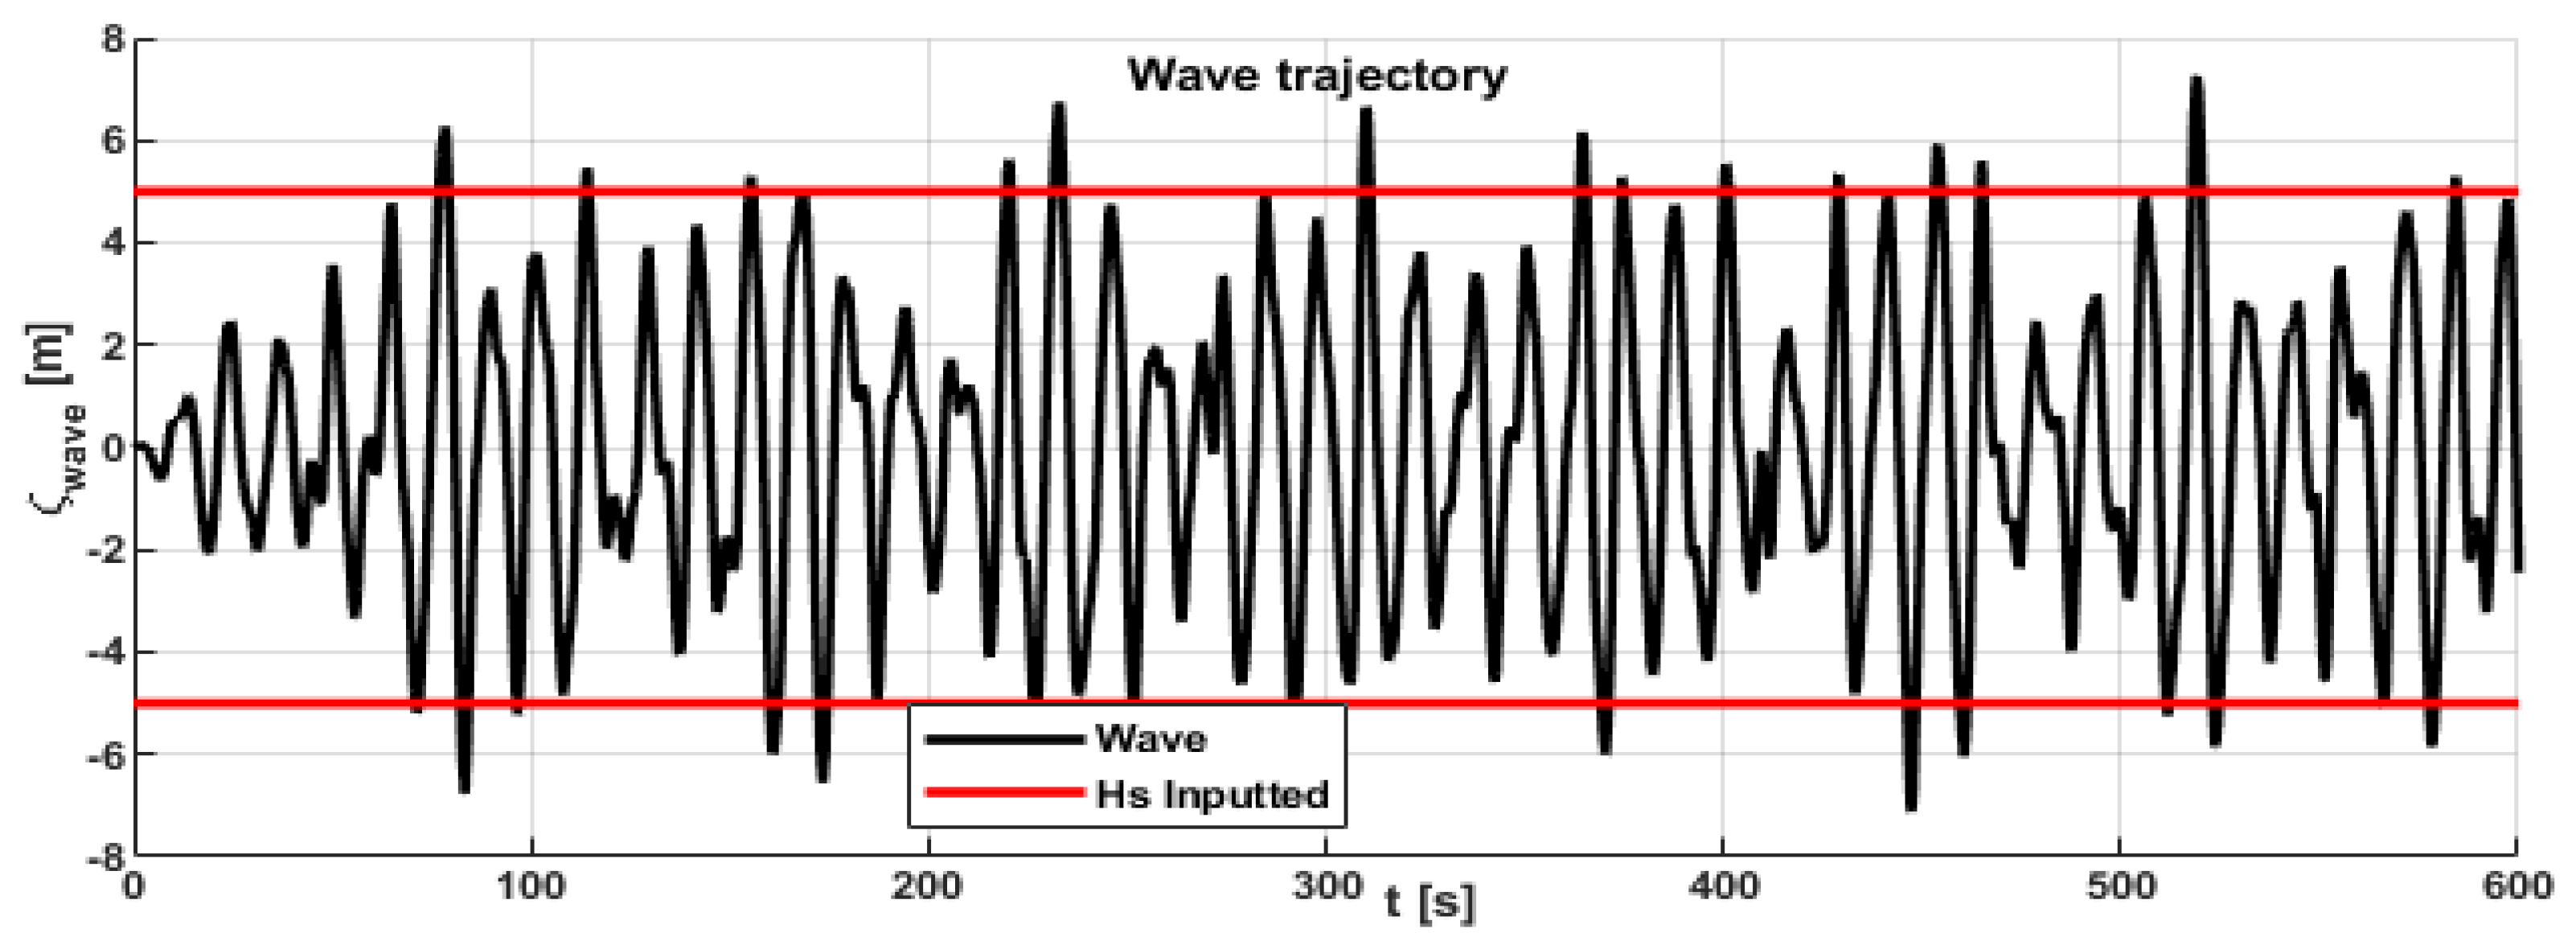
 Figure 13, Figure 14, Figure 15 and 
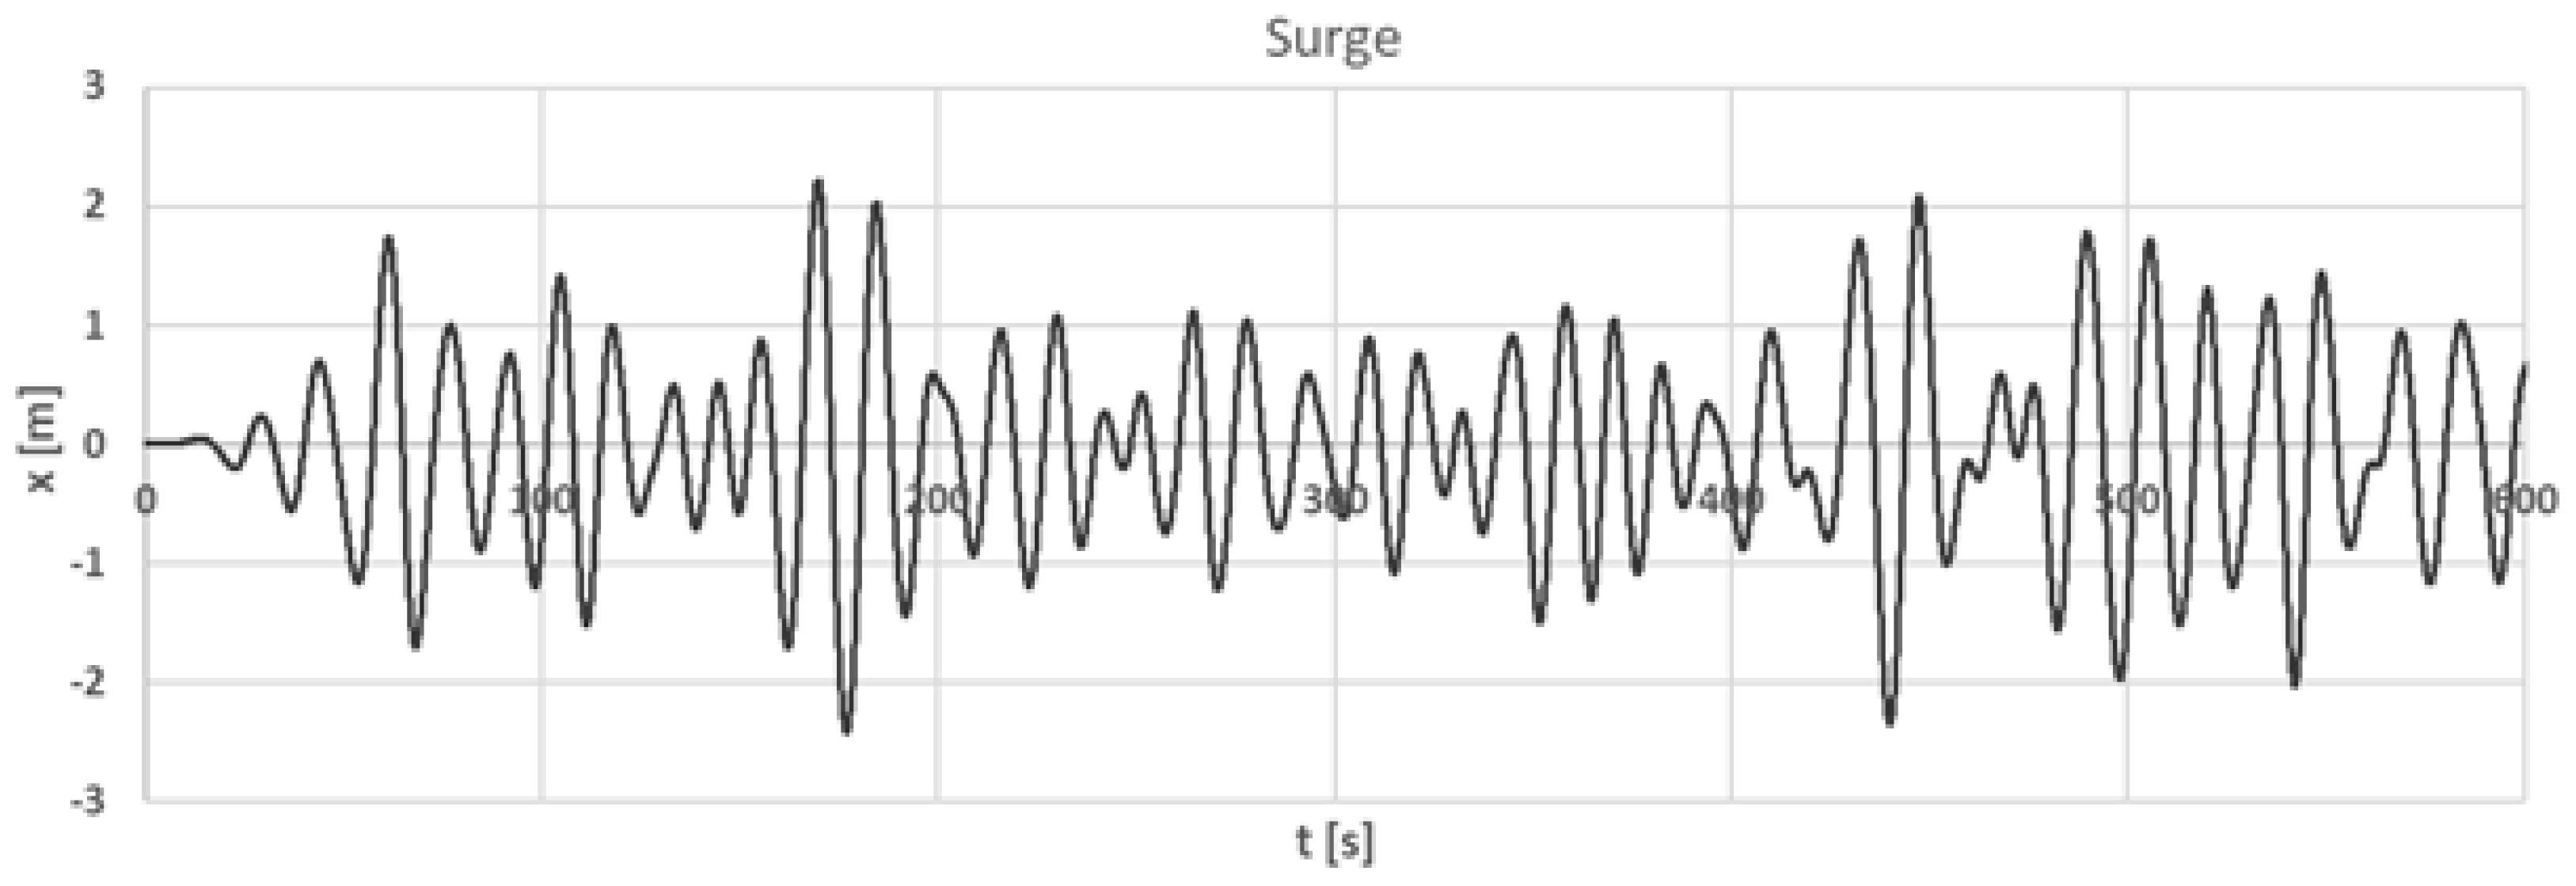
Figure 16, the wave elevation and motion response are plotted for the first 10.0 min of simulation during the weakly nonlinear time-domain simulation. Then, in Figure 17, Figure 18 and Figure 19, the motion response of the platform is plotted for comparison regarding sea state IW8 and according to the coupled time-domain solver.
The comparison provided by the time series points out that experimental responses tend to have more accentuated maxima and minima in comparison to the numerical predictions. That may be further proven with the measures of motion statistics. For instance, in IW8, the platform heaved up to 2.0–2.5 m and reached more than 5.0 deg in pitch. The weakly nonlinear code shows responses with a considerably regular zero-crossing wave period.
Table 6, Table 7 and Table 8 present the wave and motion statistics results obtained during the irregular wave scenarios both numerically and experimentally. The results show that, between the three distinct numerical models considered, the coupled time-domain code is the one that predicts significant amplitudes of response closer to the experimental values, as can be observed from the standard deviation values. The absolute maxima and minima, however, tend to be lower in comparison to the experimental data, especially for the most energetic sea states. The frequency domain results, on the other hand, do not have a good agreement with the experimental data—the significant amplitude of motion is considerably overestimated in sea states IW5, IW6, and IW7, especially for the pitch motion, whereas in the less energetic sea states the trend is of underestimation. The in-house code also shows good agreement with the data, especially regarding the surge and pitch motions that were effectively calibrated in terms of nonlinear surge drag force.
The comparison between zero-crossing periods provided by Table 6, Table 7 and Table 8 shows that the different methods tend to estimate similar values, with two exceptions. First, the heave motion in the less energetic sea states, and second, the surge motion for the most energetic sea states. Both conditions point out that some strong second-order difference-of-frequency excitation forces may be affecting the heaving and surging of the platform, depending upon the wave conditions. This happens because both the heave and surge natural periods are much higher than the sea waves periods. This is further confirmed by the significant amplitude of motion evaluated in the basin, which is not captured by any of the numerical methods when heave motion is observed in IW1 and IW5, for instance. The coupled time-domain model is also not able to predict the heave zero-crossing period, pointing out that this issue must not be related to mooring effects.
The mean values presented in Table 6, Table 7 and Table 8 show that both the frequency domain and weakly nonlinear time codes predict responses that are zero-averaged. That is expected due to the underlying hypotheses of these methods, whereas the same statement should never hold true regarding experimental data. In the case of coupled time-domain simulations, the nonlinear mooring effects also induce the platform to move around a different position other than the free-floating static equilibrium position. The mean values of the experimental data sometimes lie far from that position, so attention must be paid when comparing the maxima and minima values observed in the basin.
The motion response statistics presented in Table 6, Table 7 and Table 8 show that the platform has, in general, a good hydrodynamic performance in irregular waves. The pitch angle is kept small for sea states up to Hs = 4.0 m, at least, considering only the dynamics of the platform and simple mooring system. The inclusion of aerodynamic and wind turbine effects will add damping to the pitch mode of the platform; thus, it can be expected that, in reality, the platform will behave well even in more energetic sea states. However, to achieve that, the design of the real mooring system, not analyzed so far, must also be smart in order to not add mooring effects that worsen the pitch response of the FOWT.
In regular waves, the only case where the pitch response may be severe is for a 19.0 s period regular wave; thus, ideally, the mooring system should also be designed in order to mitigate the response at this particular frequency. The motion performance in heave and pitch in both regular and irregular waves is within reasonable limits for a FOWT.
Last but not least, the values of skewness and kurtosis of the motion time series have been calculated during the numerical schemes. The values are not presented in Table 6, Table 7 and Table 8 because the observed skewness is, as a matter of fact, always around 0, and the observed kurtosis is always around 3, meaning that, within the numerical models developed, the predicted responses can be considered Gaussian processes.

5. Conclusions

In this paper, the hydrodynamic performance of the WIND-bos platform is studied in detail, both experimentally and numerically. The structure under development is a novel concept of spar-type FOWT, which presents good motion performance, for the significant amplitudes of motion are kept small for sea states of interest. Within the numerical models developed, the predicted motion responses can be considered zero-mean Gaussian processes. The further addition of aerodynamics and wind turbine effects shall lead to an even better pitch response. The design of the real mooring system has not been analyzed so far and must be smart in order to not add coupling effects that could worsen pitch response.
The results provided by the in-house weakly nonlinear time-domain code offer good prediction capabilities both in regular and irregular waves. In regular waves, the results match with the experiments in heave, in pitch (with the exception of a single frequency) and, basically, underestimate the surge response slightly. In irregular waves, the results are mostly underestimated because second-order effects have not been considered so far. The next step within the research lines is to consider QTFs, especially the difference-of-frequency second-order excitation forces, that are known to affect the dynamics of many FOWTs and ocean systems consisting of different underwater bodies, for instance, transmitting wave energy to the resonant modes of the platform, which usually lie in the low-frequency range of sea waves.
The results provided by the coupled time-domain solver in regular waves deviate from experiments in some cases, even though the prediction of surge amplitude of motion is fairly good. On the other hand, the in-house solver agrees with most of the experimental data in regular waves. However, in irregular waves, the simulations performed by the coupled time-domain solver presented results that compare well with the experiments and are relatively better than the weakly nonlinear solver, mainly because the coupling with the mooring system is simulated at each time step. The coupled time-domain code is also the only one that is reliable among the models considered to perform, for instance, mooring fatigue analysis, which shall be considered in the future when the real design of the mooring system is accounted for.

Author Contributions

Conceptualization: T.S.H., C.G.S.; software T.S.H.; formal analysis, T.S.H.; experiments: O.S., S.H. and A.A.; data curation: O.S., S.H. and A.A.; validation: T.S.H.; visualization, T.S.H.; supervision: C.G.S.; writing—original draft T.S.H.; writing—review and editing: C.G.S., O.S., S.H. and A.A. All authors have read and agreed to the published version of the manuscript.

Funding

The Experiments have been done within the MARINET2 project, funded by the EU.

Institutional Review Board Statement

Not applicable.

Informed Consent Statement

Not applicable.

Data Availability Statement

Not applicable.

Acknowledgments

The first author has a Ph.D. Scholarship by the Portuguese Foundation for Science and Technology (Fundação para a Ciência e Tecnologia—FCT), under contract No. SFRH/BD/145602/2019. This work contributes to the Strategic Research Plan of the Centre for Marine Technology and Ocean Engineering (CENTEC), which is financed by the Portuguese Foundation for Science and Technology (Fundação para a Ciência e Tecnologia—FCT) under contract UIDB/UIDP/00134/2020.

Conflicts of Interest

The authors declare no conflict of interest.

References

  1. Diaz, H.M.; Guedes Soares, C. Review of the current status, technology and future trends of offshore wind farms. Ocean Eng. 2020, 209, 107381. [Google Scholar] [CrossRef]
  2. ESMAP (Energy Sector Management Assistance Programme). Offshore Wind Technical Potential by Country. Available online: https://esmap.org/publications (accessed on 29 April 2022).
  3. GWEC (Global Wind Energy Council). Global Wind Report 2021. Available online: https://gwec.net/global-wind-report-2021/ (accessed on 29 April 2022).
  4. GWEC (Global Wind Energy Council). Global Wind Report 2022. Available online: https://gwec.net/global-wind-report-2022/ (accessed on 29 April 2022).
  5. Diaz, H.M.; Serna, J.; Nieto, J.; Guedes Soares, C. Market needs, opportunities and barriers for the floating wind industry. J. Mar. Sci. Eng. 2022, 10, 934. [Google Scholar] [CrossRef]
  6. Jonkman, J.M. Dynamics of offshore floating wind turbines–model development and verification. Wind Energy 2009, 12, 459–492. [Google Scholar] [CrossRef]
  7. Xu, S.; Wang, S.; Guedes Soares, C. Review of the mooring design for floating wave energy converters. Ren. Sust. Energy Rev. 2019, 111, 595–621. [Google Scholar] [CrossRef]
  8. Butterfield, S.; Musial, W.; Jonkman, J.M.; Sclavounos, P.; Wayman, L. Engineering challenges for floating offshore wind turbines. In Proceedings of the Copenhagen Offshore Wind 2005 Conference and Expedition, Copenhagen, Denmark, 26–28 October 2005. [Google Scholar]
  9. Jonkman, J.M.; Matha, D. Dynamics of offshore floating wind turbines–analysis of three concepts. Wind Energy 2011, 14, 557–569. [Google Scholar] [CrossRef]
  10. Jonkman, J.M.; Buhl, M.L., Jr. FAST User’s Guide; NREL/EL-500-38230; National Renewable Energy Laboratory (NREL): Golden, CO, USA, 2005. [Google Scholar]
  11. Ren, N.; Li, Y.; Ou, J. The effect of additional mooring chains on the motion performance of a floating offshore wind turbine with a tension leg platform. Energies 2012, 5, 1135–1149. [Google Scholar] [CrossRef] [Green Version]
  12. Bahramiasl, S.; Abbaspour, M.; Karimirad, M. Experimental study on gyroscopic effect of rotating rotor and wind heading angle on floating wind turbine responses. Int. J. Environ. Sci. Technol. 2018, 15, 2531–2544. [Google Scholar] [CrossRef] [Green Version]
  13. Uzunoglu, E.; Guedes Soares, C. Hydrodynamic design of a free-float capable tension leg platform for a 10.0 MW wind turbine. Ocean Eng. 2020, 197, 106888. [Google Scholar] [CrossRef]
  14. Mas-Soler, J.; Uzunoglu, E.; Bulian, G.; Guedes Soares, C.; Souto-Iglesias, A. An experimental study on transporting a free-float capable tension leg platform for a 10 MW wind turbine in waves. Renew. Energy 2021, 179, 2158–2173. [Google Scholar] [CrossRef]
  15. Filgueira-Vizoso, A.; Castro-Santos, L.; Iglesias, D.C.; Puime-Guillén, F.; Lamas-Galdo, I.; Garcia-Diez, A.I.; Uzunoglu, E.; Diaz, H.M.; Guedes Soares, C. The technological and economic feasibility of the CENTEC floating offshore wind turbine. J. Mar. Sci. Eng. 2022, 10, 1344. [Google Scholar] [CrossRef]
  16. Bak, C.; Zahle, F.; Bitsche, R.; Taesong, K.; Yde, A.; Henriksen, L.C.; Natarajan, A.; Hansen, M.H. Description of the DTU 10.0 MW Reference Wind Turbine; Report-I-0092; Denmark Technical University: Copenhagen, Denmark, 2013. [Google Scholar]
  17. Hanson, T.D.; Skaare, B.; Yttervik, R.; Nielsen, F.G.; Havmøller, O. Comparison of measured and simulated responses at the first full scale floating wind turbine Hywind. In Proceedings of the EWEA 2011, Brussels, Belgium, 14–17 March 2011. [Google Scholar]
  18. Skaare, B.; Hanson, T.D.; Yttervik, R.; Nielsen, F.G. Dynamic response and control of the Hywind Demo floating wind turbine. In Proceedings of the EWEA 2011, Brussels, Belgium, 14–17 March 2011. [Google Scholar]
  19. Skaare, B.; Nielsen, F.G.; Hanson, T.D.; Yttervik, R.; Havmøller, O.; Rekdal, A. Analysis of measurements and simulations from the Hywind Demo floating wind turbine. Wind Energy 2015, 18, 1105–1122. [Google Scholar] [CrossRef]
  20. Skaare, B. Development of the Hywind concept. In Proceedings of the 36th International Conference on Ocean Offshore and Arctic Engineering, OMAE2017-62710, Trondheim, Norway, 25–30 June 2017. [Google Scholar] [CrossRef]
  21. Cermelli, C.; Roddier, D.; Aubault, A. WindFloat: A floating foundation for offshore wind turbines—Part II: Hydrodynamic analysis. In Proceedings of the 28th International Conference on Ocean Offshore and Arctic Engineering, OMAE2009-79231, Honolulu, HI, USA, 31 May–5 June 2009. [Google Scholar] [CrossRef]
  22. Roddier, D.; Cermelli, C.; Aubault, A.; Weinstein, A. WindFloat: A floating foundation for offshore wind turbines. J. Renew. Sustain. Energy 2010, 2, 033104. [Google Scholar] [CrossRef]
  23. Li, C.; Zhou, S.; Shan, B.; Hu, G.; Song, X.; Liu, Y.; Hu, Y.; Yiqing, X. Dynamics of a Y-shaped semi-submersible floating wind turbine: A comparison of concrete and steel support structures. Ships Offshore Struct. 2022, 17, 1663–1683. [Google Scholar] [CrossRef]
  24. Jonkman, J.M.; Butterfield, S.; Musial, W.; Scott, G. Definition of a 5 MW Reference Wind Turbine for Offshore System Development; NREL (National Renewable Energy Laboratory): Golden, CO, USA, 2005. [Google Scholar]
  25. Sauder, T.; Chabaud, V.; Thys, M.; Bachynski, E.E.; Saether, L.O. Real-time hybrid model testing of a braceless semi-submersible wind turbine. Part I: The hybrid approach. In Proceedings of the 35th International Conference on Ocean Offshore and Arctic Engineering, OMAE2016-54435, Busan, Republic of Korea, 19–24 June 2016. [Google Scholar] [CrossRef] [Green Version]
  26. Bachynski, E.E.; Thys, M.; Sauder, T.; Chabaud, V.; Saether, L.O. Real-time hybrid model testing of a braceless semi-submersible wind turbine. Part II: Experimental results. In Proceedings of the 35th International Conference on Ocean Offshore and Arctic Engineering, OMAE2016-54437, Busan, Republic of Korea, 19–24 June 2016. [Google Scholar] [CrossRef] [Green Version]
  27. Berthelsen, P.A.; Bachynski, E.E.; Saether, L.O. Real-time hybrid model testing of a braceless semi-submersible wind turbine. Part III: Calibration of a numerical model. In Proceedings of the 35th International Conference on Ocean Offshore and Arctic Engineering, OMAE2016-54640, Busan, Republic of Korea, 19–24 June 2016. [Google Scholar] [CrossRef]
  28. Karimirad, M.; Bachynski, E.E.; Berthelsen, P.A.; Ormberg, H. Comparison of real-time hybrid model testing of a braceless semi-submersible wind turbine and numerical simulations. In Proceedings of the 36th International Conference on Ocean Offshore and Arctic Engineering, OMAE2017-61121, Trondheim, Norway, 25–30 June 2017. [Google Scholar] [CrossRef]
  29. Hegseth, J.M.; Bachynski, E.E.; Karimirad, M. Comparison and validation of hydrodynamic load models for a semi-submersible floating wind turbine. In Proceedings of the 37th International Conference on Ocean Offshore and Arctic Engineering, OMAE2018-77676, Madrid, Spain, 17–22 June 2018. [Google Scholar] [CrossRef]
  30. Uzunoglu, E.; Guedes Soares, C. On the model uncertainty of wave induced platform motions and mooring loads of a semi-submersible based wind turbine. Ocean Eng. 2018, 148, 277–285. [Google Scholar] [CrossRef]
  31. Robertson, A.N.; Wendt, F.; Jonkman, J.M.; Popko, W.; Dagher, H.; Gueydon, S.; Qvist, J.; Vittori, F.; Azcona, J.; Uzunoglu, E.; et al. OC5 Project Phase II: Validation of global loads of the DeepCWind floating semisubmersible wind turbine. Energy Procedia 2017, 137, 38–57. [Google Scholar] [CrossRef]
  32. Robertson, A.N.; Bachynski, E.E.; Gueydon, S.; Wendt, F.; Schünemann, P.; Jonkman, J.M. Assessment of experimental uncertainty for a floating wind semisubmersible under hydrodynamic loading. In Proceedings of the 37th International Conference on Ocean Offshore and Arctic Engineering, OMAE2018-77703, Madrid, Spain, 17–22 June 2018. [Google Scholar] [CrossRef]
  33. Xu, K.; Zhang, M.; Shao, Y.; Gao, Z.; Moan, T. Effect of wave nonlinearity on fatigue damage and extreme response of a semi-submersible floating wind turbine. Appl. Ocean Res. 2019, 91, 101879. [Google Scholar] [CrossRef]
  34. Hallak, T.S.; Karmakar, D.; Guedes Soares, C. Hydrodynamic performance of semi-submersible FOWT combined with point-absorber WECs. In Developments in Maritime Technology and Engineering; Guedes Soares, C., Santos, T.A., Eds.; Taylor & Francis Group: London, UK, 2021; Volume 2, pp. 577–585. [Google Scholar] [CrossRef]
  35. Da Silva, L.S.P.; Sergiienko, N.Y.; Cazzolato, B.; Ding, B. Dynamics of hybrid offshore renewable energies platforms: Heaving point-absorbers connected to a semi-submersible floating offshore wind turbine. Renew. Energy 2022, 199, 1424–1439. [Google Scholar] [CrossRef]
  36. Armesto, J.A.; Jurado, A.; Guanche, R.; Couñago, B.; Urbano, J.; Serna, J. Telwind: Numerical analysis of a floating wind turbine supported by a two bodies platform. In Proceedings of the 37th International Conference on Ocean Offshore and Arctic Engineering, OMAE2018-77587, Madrid, Spain, 17–22 June 2018. [Google Scholar] [CrossRef]
  37. Baita-Saavedra, A.; Cordal-Iglesias, D.; Filgueira-Vizoso, A.; Morató, À.; Lamas-Galdo, I.; Álvarez-Feal, C.; Carral, L.; Castro-Santos, L. An economic analysis of an innovative floating offshore wind platform built in concrete: The SATH platform. Appl. Sci. 2020, 10, 3678. [Google Scholar] [CrossRef]
  38. Yang, Y.; Bashir, M.; Michailides, C.; Mei, X.; Wang, J.; Li, C. Coupled analysis of a 10 MW multi-body floating offshore wind turbine subjected to tendon failures. Renew. Energy 2021, 176, 89–105. [Google Scholar] [CrossRef]
  39. Guo, X.; Zhang, Y.; Yan, J.; Zhou, Y.; Yan, S.; Shi, W.; Li, X. Integrated dynamic response analysis for IEA 10-MW spar floating offshore wind turbine. J. Mar. Sci. Eng. 2022, 10, 542. [Google Scholar] [CrossRef]
  40. Karmakar, D.; Guedes Soares, C. Review of the present concepts of multi-use offshore platforms. In Renewable Energies Offshore; Guedes Soares, C., Ed.; Taylor & Francis Group: London, UK, 2015; pp. 867–875. [Google Scholar]
  41. Nassar, W.M.; Anay-Lara, O.; Ahmed, K.H.; Campos-Gaona, D.; Elgenedy, M. Assessment of multi-use offshore platforms: Structure classification and design challenges. Sustainability 2020, 12, 1860. [Google Scholar] [CrossRef] [Green Version]
  42. Armesto, J.A.; Sarmiento, J.; Ayllón, V.; Iturrioz, A.; Jurado, A.; Guanche, R.; Losada, I.J. Numerical and experimental study of a multi-use platform. In Proceedings of the 35th International Conference on Ocean Offshore and Arctic Engineering, OMAE2016-54427, Busan, Republic of Korea, 19–24 June 2016. [Google Scholar] [CrossRef]
  43. Li, L.; Gao, Y.; Yuan, Z.; Day, S.; Hu, Z. Dynamic response and power production of a floating integrated wind, wave and tidal energy system. Renew. Energy 2018, 116, 412–422. [Google Scholar] [CrossRef] [Green Version]
  44. Kamarlouei, M.; Gaspar, J.F.; Calvário, M.; Hallak, T.S.; Mendes, M.J.G.C.; Thiebaut, F.; Guedes Soares, C. Experimental study of wave energy converter arrays adapted to a semi-submersible wind platform. Renew. Energy 2022, 188, 145–163. [Google Scholar] [CrossRef]
  45. Amin, I.; Dai, S.; Day, S.; Ali, M.E.A.; Balah, A.; Shawky, H.; Oterkus, S.; Oterkus, E. Experimental study on the motion response of an integrated floating desalination and offshore wind turbine on a non-ship platform. Ocean Eng. 2021, 234, 109275. [Google Scholar] [CrossRef]
  46. Hallak, T.S.; Guedes Soares, C.; Sainz, O.; Hernández, S.; Arévalo, A. Time Domain Analysis of the WIND-Bos Spar in Regular Waves. Trends in Renewable Energies Offshore; Taylor & Francis Group: London, UK, 2022; pp. 559–566. [Google Scholar] [CrossRef]
  47. Eliassen, L.; Bachynski, E.E. The effect of turbulence model on the response of a large floating wind turbine. In Proceedings of the 36th International Conference on Ocean Offshore and Arctic Engineering, OMAE2017-61179, Trondheim, Norway, 25–30 June 2017. [Google Scholar] [CrossRef]
  48. Rivera-Arreba, I.; Bruinsma, N.; Bachynski, E.E.; Viré, A.; Paulsen, B.T.; Jacobsen, N.G. Modeling of a semisubmersible floating wind platform in severe waves. In Proceedings of the 37th International Conference on Ocean Offshore and Arctic Engineering, OMAE2018-77680, Madrid, Spain, 17–22 June 2018. [Google Scholar] [CrossRef] [Green Version]
  49. Han, K.; Vada, T.; Wang, Q.Q. Time domain coupled analysis and load transfer for floating wind turbine structures. In Proceedings of the 37th International Conference on Ocean Offshore and Arctic Engineering, OMAE2018-77880, Madrid, Spain, 17–22 June 2018. [Google Scholar] [CrossRef]
  50. Hallak, T.S.; Kamarlouei, M.; Gaspar, J.F.; Guedes Soares, C. Time domain analysis of a conical point-absorber moving around a hinge. In Trends in Maritime Technology and Engineering; Guedes Soares, C., Santos, T.A., Eds.; Taylor & Francis Group: London, UK, 2022; Volume 2, pp. 401–409. [Google Scholar] [CrossRef]
  51. Cummins, W.E. The impulse response function and ship motions. Schiffstechnik 1962, 47, 101–109. [Google Scholar]
Figure 1. Experimental model of the WIND-bos platform (left) and its view in perspective (right).
Jmse 10 01824 g001
Figure 2. Scheme of the experimental facilities with the mooring lines configuration.
Jmse 10 01824 g002
Figure 3. Coupled model in SESAM DeepC®.
Jmse 10 01824 g003
Figure 4. Free decay tests of the moored WIND-bos platform (experimental).
Jmse 10 01824 g004
Figure 5. Frequency domain RAOs for several wave incidences.
Jmse 10 01824 g005
Figure 6. Surge RAOs according to different methods.
Jmse 10 01824 g006
Figure 7. Heave RAOs according to different methods.
Jmse 10 01824 g007
Figure 8. Pitch RAOs according to different methods.
Jmse 10 01824 g008
Figure 9. IW8 wave series according to experiments (Hs = 10.0 m, Tp = 14.0 s).
Jmse 10 01824 g009
Figure 10. Surge response to IW8 according to experiments.
Jmse 10 01824 g010
Figure 11. Heave response to IW8 according to experiments.
Jmse 10 01824 g011
Figure 12. Pitch response to IW8 according to experiments.
Jmse 10 01824 g012
Figure 13. IW8 wave series according to weakly nonlinear time−domain solver (Hs = 10.0 m, Tp = 14.0 s).
Jmse 10 01824 g013
Figure 14. Surge response to IW8 according to weakly nonlinear time−domain solver.
Jmse 10 01824 g014
Figure 15. Heave response to IW8 according to weakly nonlinear time−domain solver.
Jmse 10 01824 g015
Figure 16. Pitch response to IW8 according to weakly nonlinear time−domain solver.
Jmse 10 01824 g016
Figure 17. Surge response to IW8 according to the coupled time−domain solver SESAM DeepC®.
Jmse 10 01824 g017
Figure 18. Heave response to IW8 according to the coupled time−domain solver SESAM DeepC®.
Jmse 10 01824 g018
Figure 19. Pitch response to IW8 according to the coupled time−domain solver SESAM DeepC®.
Jmse 10 01824 g019
Table 1. Wave conditions (real scale).
Regular Wave Conditions
Sea StateT [s]H [m]Sea StateT [s]H [m]
RW014.01.0RW1113.02.0
RW024.02.0RW1213.04.0
RW035.02.0RW1315.02.0
RW045.04.0RW1415.04.0
RW057.02.0RW1517.02.0
RW067.04.0RW1617.04.0
RW079.02.0RW1719.02.0
RW089.04.0RW1819.04.0
RW0911.02.0RW1921.02.0
RW1011.04.0RW2021.04.0
Irregular Wave Conditions
Sea StateTp [s]Hs [m]γ [-]
IW16.02.03.3
IW29.04.03.3
IW311.06.03.3
IW412.010.03.3
IW58.02.03.3
IW611.04.03.3
IW713.06.03.3
IW814.010.03.3
Table 2. Mooring parameters.
ParameterDescriptionValueUnit
NNumber of lines3[-]
αAngle between lines120[deg]
LLine length337.72[m]
WDDry weight9.86[kg/m]
EAStiffness78.9[kN/m]
Г0Pre-tension34.21[kN]
Table 3. Fairleads and anchors positions.
Fairleads
Linex [m]y [m]z [m]
1−12.3421.37−17.04
2−12.3421.37−17.04
324.680.00−17.04
Anchors
Linex [m]y [m]z [m]
1−180.59314.2015.00
2−180.59314.2015.00
3362.420.0015.00
Table 4. Damping ratios obtained from experimental free decay tests.
ModeInitial Peak# of CyclesAvg. amp. [m]Damping Ratio
Surge113.36267.5%
122.73954.7%
161.59933.3%
340.89422.5%
550.55115.6%
730.45513.5%
ModeInitial Peak# of cyclesAvg. amp. [m]Damping Ratio
Heave114.36922.2%
124.03418.3%
163.00416.3%
342.45815.3%
551.81610.8%
731.6065.7%
ModeInitial Peak# of CyclesAvg. amp. [°]Damping Ratio
Pitch114.44823.4%
124.10618.6%
163.02417.1%
342.45416.4%
551.77711.5%
731.5596.0%
Table 5. Damping ratios obtained iteratively for the coupled time-domain simulations.
IW1, IW5IW2, IW6
Heave10.0%Heave16.0%
Roll/Pitch6.0%Roll/Pitch8.0%
IW3, IW78.0 m Height IWs
Heave20.0%Heave24.0%
Roll/Pitch8.5%Roll/Pitch9.5%
IW4, IW812.0 m Height IWs
Heave31.0%Heave33.0%
Roll/Pitch12.%Roll/Pitch14.0%
Table 6. Surge motion statistics in irregular wave conditions according to different methods.
Surge Motion
Sea StateModel 1Mean [m]Stdd [m]Tz [s]Tc [s]Max [m]Min [m]
IW1FD0.0000.0185.9255.6930.043−0.043
WNTD0.0000.0236.3115.8030.057−0.056
CTD−0.0210.01910.103-0.043−0.086
Exp.0.1280.1888.015-0.916−0.751
IW2FD0.0000.0628.5487.1730.169−0.176
WNTD−0.0010.1258.1298.4250.329−0.343
CTD−0.0220.1069.782-0.419−0.440
Exp.0.1300.30415.369-1.171−1.066
IW3FD0.0000.47010.99310.9401.176−1.162
WNTD0.0000.35213.31110.1570.947−0.957
CTD−0.0280.28311.701-0.887−1.040
Exp.0.0420.46915.388-1.518−2.196
IW4FD0.0001.00711.89011.0532.512−2.530
WNTD0.0050.50213.0758.7521.390−1.311
CTD−0.0570.61912.949-2.264−2.696
Exp.0.3201.04021.902-3.569−3.928
IW5FD0.0001.01811.89911.0532.550−2.564
WNTD0.0000.0558.3758.5850.128−0.133
CTD−0.0200.0409.326-0.141−0.166
Exp.−0.1030.1165.744-0.398−0.668
IW6FD0.0001.12011.98311.0302.757−2.832
WNTD0.0000.16610.94710.2680.435−0.405
CTD−0.0220.18711.638-0.688−0.810
Exp.−0.0910.27913.024-0.803−1.383
IW7FD0.0001.05811.88012.0732.826−2.744
WNTD0.0020.63011.77812.2072.158−2.285
CTD−0.0260.43913.399-1.849−1.891
Exp.0.0000.59716.519-2.232−2.488
IW8FD0.0001.10011.94412.0042.667−2.660
WNTD−0.0051.01711.79411.9052.985−3.188
CTD−0.0500.88714.734-3.178−3.445
Exp.0.1621.17020.010-3.922−3.987
1 Model abbreviations: Frequency domain (FD), weakly nonlinear time domain (WNTD), coupled time domain (CTD), and experimental (Exp.).
Table 7. Heave motion statistics in irregular wave conditions according to different methods.
Heave Motion
Sea StateModel 1Mean [m]Stdd [m]Tz [s]Tc [s]Max [m]Min [m]
IW1FD0.0000.0076.0335.6770.018−0.017
WNTD0.0000.0086.0986.0200.018−0.019
CTD0.0010.0098.257-0.033−0.033
Exp.−0.0120.10334.066-0.329−0.335
IW2FD0.0000.0328.4768.5200.087−0.090
WNTD0.0000.0628.3678.3930.150−0.158
CTD−0.0040.09812.329-0.352−0.438
Exp.0.0210.22328.776-0.778−0.760
IW3FD0.0000.26311.01611.0000.063−0.647
WNTD0.0000.1779.98410.0460.429−0.443
CTD−0.0140.32317.822-1.031−1.297
Exp.0.0520.34422.191-1.287−1.245
IW4FD0.0000.53312.00610.9231.353−1.354
WNTD0.0000.24710.02310.1450.691−0.673
CTD−0.0460.71922.268-2.101−2.641
Exp.0.1560.59119.687-2.487−1.838
IW5FD0.0000.54012.01610.9271.381−1.382
WNTD0.0000.0278.4018.4850.055−0.057
CTD0.2040.03110.475-0.114−0.107
Exp.0.0090.08827.642-0.303−0.279
IW6FD0.0000.59511.98611.8721.478−1.485
WNTD0.0000.0909.97010.2060.339−0.214
CTD−0.0060.15113.602-0.216−0.205
Exp.0.0400.20118.318-0.822−0.712
IW7FD0.0000.55311.98511.8801.381−1.438
WNTD0.0000.30611.80812.0800.984−1.060
CTD−0.0170.37919.285-1.445−1.782
Exp.0.0550.32117.674-1.396−1.273
IW8FD0.0000.58111.86111.0281.363−1.354
WNTD0.0000.50812.14211.8761.431−1.428
CTD−0.0500.93527.135-2.619−3.279
Exp.0.1330.57917.419-2.752−2.163
1 Model abbreviations: Frequency domain (FD), weakly nonlinear time domain (WNTD), coupled time domain (CTD), and experimental (Exp.).
Table 8. Pitch motion statistics in irregular wave conditions according to different methods.
Pitch Motion
Sea StateModel 1Mean [°]Stdd [°]Tz [s]Tc [s]Max [m]Min [m]
IW1FD0.0000.0465.6855.6980.104−0.110
WNTD0.0000.0526.0335.8020.122−0.125
CTD−0.0030.0466.345-0.163−0.170
Exp.−0.0140.1226.315-0.535−0.528
IW2FD0.0000.1227.1786.4800.331−0.353
WNTD0.0000.2388.3657.9270.608−0.627
CTD−0.0030.2178.874-0.824−0.811
Exp.−0.0090.2879.053-1.111−0.980
IW3FD0.0000.68910.99710.1141.717−1.695
WNTD0.0000.49210.89910.1431.268−1.302
CTD−0.0020.39010.455-1.386−1.522
Exp.0.0440.54310.687-2.313−1.857
IW4FD0.0001.35810.94011.0773.565−3.600
WNTD0.0000.70310.1678.2501.966−1.830
CTD−0.0020.67111.157-2.423−2.429
Exp.−0.0341.03912.162-3.750−3.712
IW5FD0.0001.38310.95311.0773.597−3.608
WNTD0.0000.1058.4188.6250.220−0.234
CTD−0.0020.0928.096-0.356−0.362
Exp.0.1150.1266.207-0.744−0.359
IW6FD0.0001.49911.88011.0573.846−3.952
WNTD0.0000.25110.22310.2400.632−0.606
CTD−0.0020.25910.335-1.074−1.076
Exp.0.1170.36610.073-1.559−1.212
IW7FD0.0001.40911.87410.2343.835−3.725
WNTD0.0000.77812.00012.1022.719−2.834
CTD−0.0020.40211.613-1.658−1.569
Exp.0.0600.68513.088-2.661−2.495
IW8FD0.0001.46711.94411.0403.642−3.688
WNTD0.0001.28512.33411.9533.829−3.879
CTD−0.0010.65412.148-2.522−2.322
Exp.0.0211.29314.023-5.524−4.488
1 Model abbreviations: Frequency domain (FD), weakly nonlinear time domain (WNTD), coupled time domain (CTD), and experimental (Exp.).
Publisher’s Note: MDPI stays neutral with regard to jurisdictional claims in published maps and institutional affiliations.

