Article

Feasibility Study of a Novel Open Ocean Aquaculture Ship Integrating with a Wind Turbine and an Internal Turret Mooring System

1
Key Laboratory of High Performance Ship Technology (Wuhan University of Technology), Ministry of Education, Wuhan 430063, China
2
School of Naval Architecture, Ocean and Energy Power Engineering, Wuhan University of Technology, Wuhan 430063, China
3
Sanya Science and Education Innovation Park of Wuhan University of Technology, Sanya 572025, China
4
School of Naval Architecture, Ocean and Civil Engineering, Shanghai Jiao Tong University, Shanghai 200240, China
5
Department of Mechanical and Structural Engineering and Materials Science, University of Stavanger, 4036 Stavanger, Norway
*
Author to whom correspondence should be addressed.
J. Mar. Sci. Eng. 2022, 10(11), 1729; https://doi.org/10.3390/jmse10111729
Submission received: 8 October 2022 / Revised: 7 November 2022 / Accepted: 8 November 2022 / Published: 11 November 2022
(This article belongs to the Topic Wind, Wave and Tidal Energy Technologies in China)

Abstract

:
Marine aquaculture has been expanded into more remote areas due to the increasing demand for high value-added fish products, bringing more challenges in fuel supply and mooring safety to open ocean aquaculture farms. Therefore, the idea of integrating aquaculture farms with offshore renewable energy has attracted tremendous interest. This study proposes a novel open ocean aquaculture ship integrated with a NREL 5 MW wind turbine. In addition, an internal turret mooring system is installed at the bow of the aquaculture ship, making the wind turbine always face the wind blowing direction due to the weathervaning effect. In this study, a preliminary study of the dynamics and wind power generation of the proposed open ocean aquaculture ship was conducted. The aerodynamic and elastic effects of the wind turbine and the effect of nets under the wave and current behavior on the dynamics of the single-point moored aquaculture ship were investigated. Furthermore, the effects of the dynamics of the aquaculture ship on the power generation of the wind turbine were also studied to investigate the feasibility of the idea to integrate an aquaculture ship with a wind turbine.

1. Introduction

To meet the increasing demand for superior quality protein, many coastal countries have paid special attention to trophic marine fish, such as the Salmo salar and rainbow trout. As reported by FAO [1], global fish production reached about 179 million tons in 2018, of which 82 million tons, valued at USD 250 billion, came from aquaculture production. Thus, edible fish play an increasingly important role in human’s food intake. However, the pollution of the marine environment seriously threatens offshore aquaculture production in near shore areas [2]. Hence, open ocean aquaculture has increasing attractiveness.
In recent decades, the development of open ocean aquaculture equipment has gained considerable advancement. In the 1970s, European countries took the lead in the design and construction of aquaculture cages [3]. As a novel method of mariculture, open ocean aquaculture has been investigated in dozens of countries such as the United States and Norway [4]. The early dominating concept is the open cage, which generally consists of floating collars, nets, bottom weights, and a mooring system [5]. Many designs of open cages have been developed and commercialized, with the high-density polyethylene (HDPE) frame gravity floating cage being the most common, with a breeding capacity of up to 20,000 m3 [6]. The capacity of the copper alloy breeding cage can also reach up to about 10,000 m3 [7]. The diameter of the spherical cage can be larger than 25 m, which can withstand waves with a wave height of 5 m [6]. A mature scheme is Ocean Farm 1 operated by SalMar, which is the world’s first offshore fish farm [8]. With a diameter of 110 m and a height of 69 m, Ocean Farm 1 has the capability of breeding 1.5 million salmon at a time [9]. Nevertheless, those multi-point mooring fish cages would generally withstand large loads due to their relatively large dimensions.
By contrast, the vessel-shaped ocean farm, namely the aquaculture ship, can avoid enormous wind, wave, and current loads with the help of the weathervaning effect by adopting a turret mooring system [10]. The weathervaning effect can bring aquaculture ships many benefits. Besides reducing the environmental loads affecting the hull, the spin motion can help spread away fish waste in a timely manner, keeping the aquaculture water always fresh. Aquaculture company Nordlaks has proposed an innovative idea, namely the giant vessel-shaped ocean farm Havfarm 1. With a length of 430 m and width of 54 m, Havfarm 1 will be able to breed 10,000 tons of salmon or about 2 million fish [11].
Besides the environmental loads, the power supply of ocean aquaculture is another challenge. Traditionally, the electricity generation of open ocean facilities is commonly supplied by gas turbines located on the platforms. However, the traditional power supply method may be too expensive to operate if the aquaculture equipment goes to deep sea and would emit significant amounts of CO2 and NOx [12]. Since there are abundant wind and wave energy sources in offshore waters, they can be used to power the open ocean aquaculture equipment, providing an economical and environment-friendly method for open ocean mariculture. As for wind turbines applied to offshore industries, many studies of offshore wind power supply to oil and gas rigs have been conducted [13]. The results show that by connecting five offshore petroleum installations to a 100 MW offshore wind farm, assuming the wind power always has priority to supply the load with two parallel gas turbines, the system can reduce fuel consumption by 21–32% in a full-year simulation. Moreover, the emission tax can be significantly reduced [14]. As for integrating wave energy with aquaculture, a study shows that a wave energy park might have a positive impact on the wave conditions of a fish farm installed downwave because of its shielding effect [15].
The EU MARIBE project has explored many potential combinations. The combination of aquaculture and wind or wave energy has been discussed. Grupo COBRA and BESMAR are planning to install five floating wind turbines near six fusion-type offshore aquaculture cages [16]. According to the description, this method could save operating and managing costs by sharing the multi-purposes vessels. Moreover, the power generated by the wind farm can cover the consumption requirement of the aquaculture farm. Another project carried out by Albatern’s WaveNET and AquaBioTech Group aimed to take advantage of the array arrangement to reduce visual impact and potential conflict with other sea users while making use of the wave energy produced by a wave energy converter [16]. Both projects are favorable methods to integrate clean energy equipment with aquaculture.
Inspired by those positive methods, an innovative idea came to the authors that integrates an offshore wind turbine with a turret mooring vessel-type fish farm. As a rule of thumb, the wave, current, and wind tend to maintain a smaller included angle. By virtue of the weathervaning effect of single-point mooring (SPM), the aquaculture ship can keep the direction of head sea, which can therefore help to reduce the environmental loads applied on the aquaculture ship. Consequently, the ship will have a better sea-keeping performance.
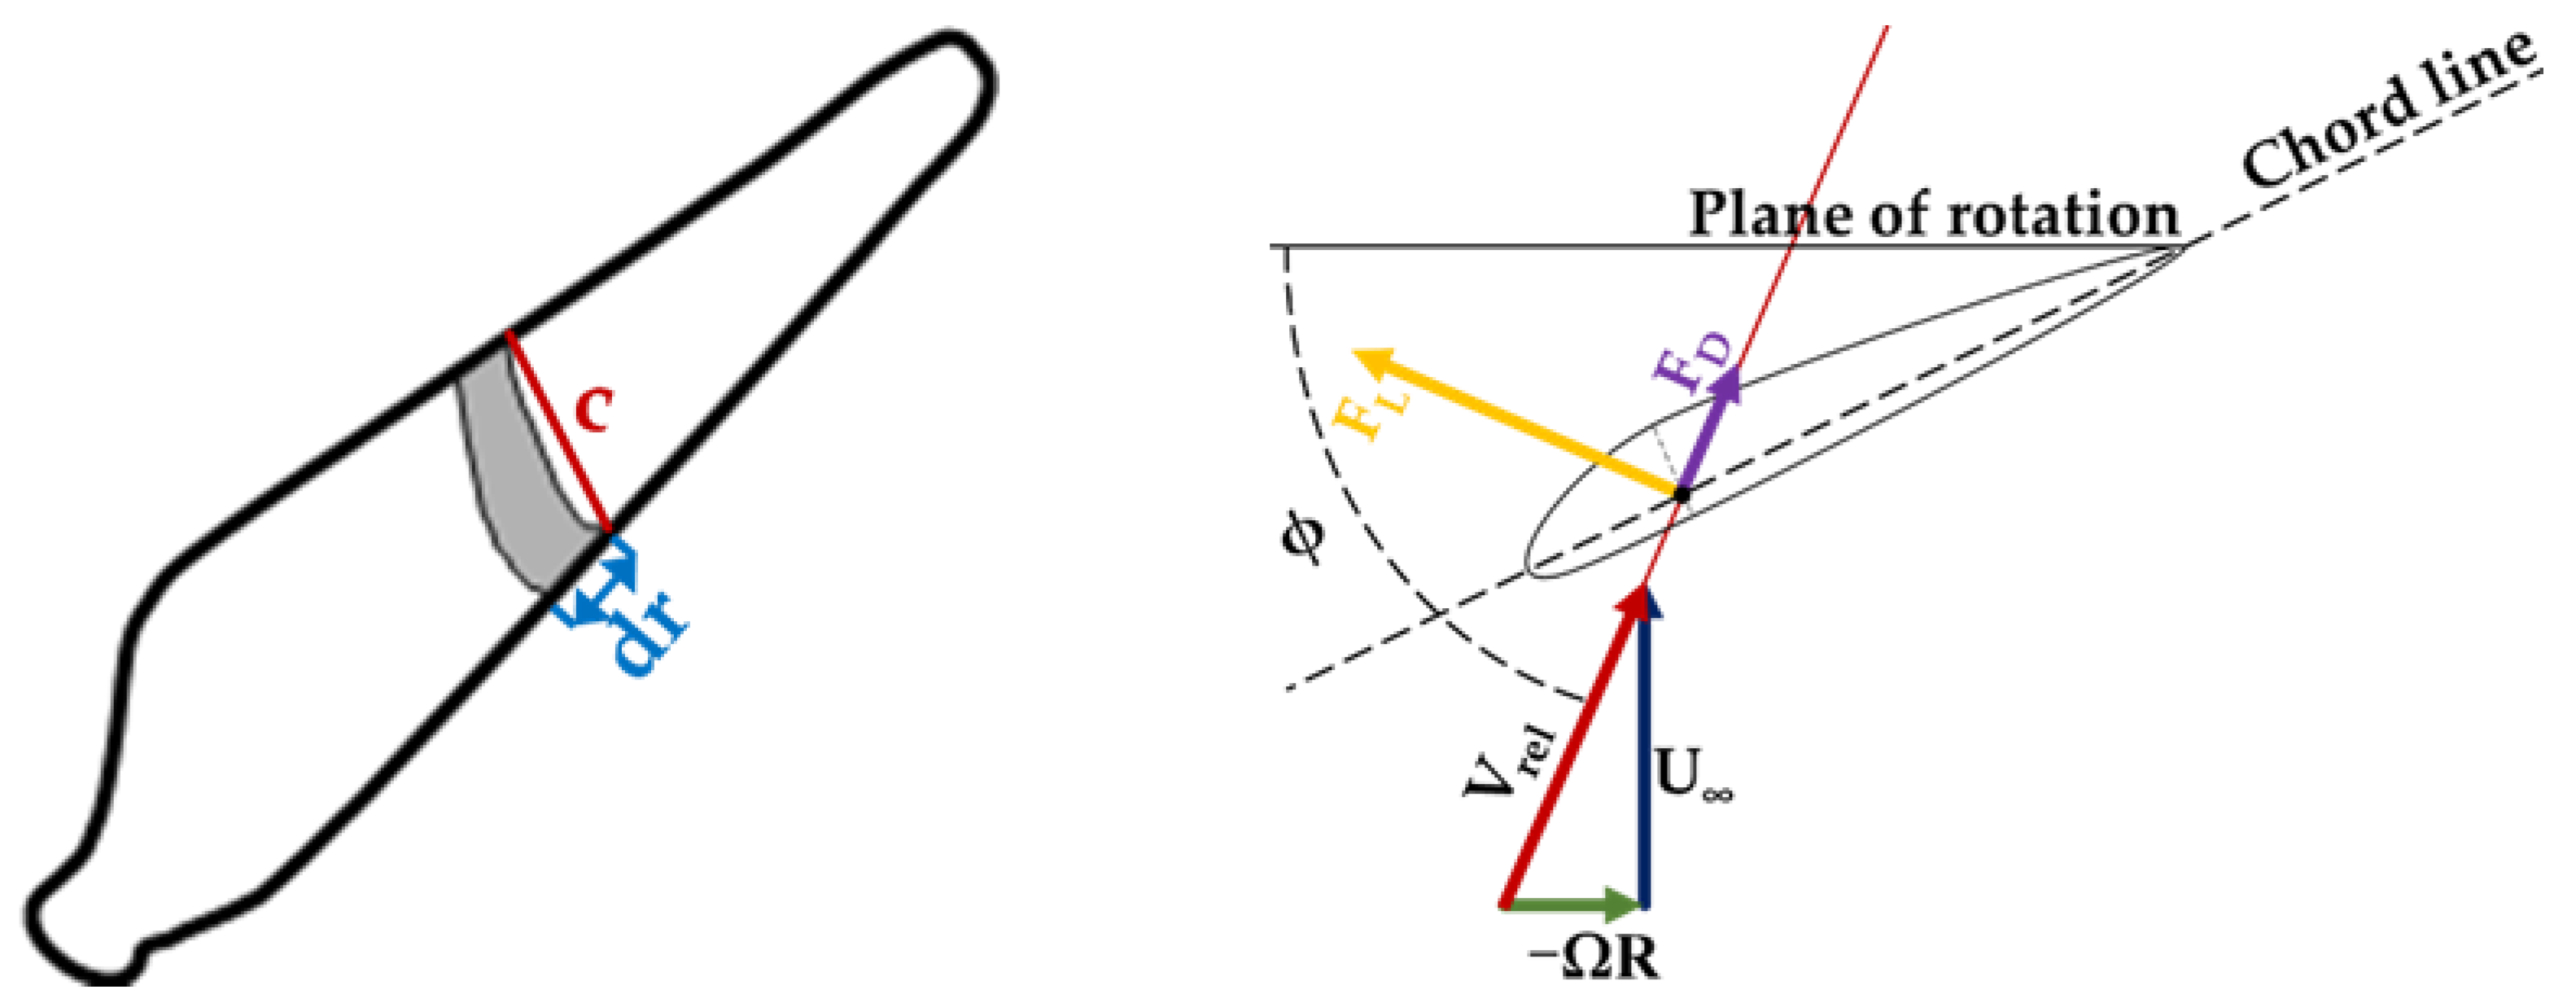
To demonstrate the feasibility of this concept, it is essential to perform numerical analysis. Because both the construction of the floating offshore wind turbine (FOWT) and the integrated aquaculture ship are of a wind turbine installed on a floating structure, the analysis method can borrow from the FOWT. Many numerical analyses have been carried out to determine the effect of the floating wind turbine’s motion on the turbine’s generating capacity. Johlas et al. [16] simulated the time-averaged power generation of a NREL 5 MW wind turbine mounted on the OC3-UMaine spar and OC4-DeepCWind semisubmersible floating platforms with OpenFAST. The results showed that the pitch and surge motions are two main influencing factors for power gains. It is complicated to evaluate the dynamic characteristics because of the interaction between the wind turbine and its floating platform [17]. To analyze the dynamic reaction of the FOWT, aerodynamics are essential because they are inherently tied to FOWT’S generating efficiency [18]. Therefore, many numerical methods have been developed and utilized. Based on blade element momentum (BEM) theory and the generalized dynamic wake (GDW) model, Jonkman et al. [19] developed a fully coupled aero-hydro-servo-elastic code FAST. More recently, Zhang et al. [20] developed a novel framework for modeling floating offshore wind turbines based on the vector form intrinsic finite element (VFIFE) method. Moreover, Yang et al. [21] developed and implemented a coupling framework (F2A) on this basis, which can introduce aero-servo-elastic effects in FAST into the time domain analysis of AQWA. Chen et al. [22] put forward a novel of an integrated floating wind-wave power generation platform and used OpenFAST to prove the accuracy of the combined use of AQWA and F2A, which was satisfactory. Tian et al. [23] developed a novel dynamics analysis method based on the theorem of the moment of momentum and Newton’s second law, whose capability is well proven by comparing it with FAST. Zhai et al. [24] modeled a simplified floating offshore wind turbine with an aquaculture cage (FOWT-AC). Furthermore, a simulation was conducted in AQWA to investigate the new structure. The results show that the FOWT-AC produces a basically lower standard deviation of the motion responses when compared with FOWT, which can prove the improvement in the stability of the idea of installing a wind turbine on some floating structures. Chu et al. [25] presented a frequency domain approach for an integrated offshore fish cage and wind turbine named COSPAR in AQWA. In their study, the wind thrust was estimated based on the pre-defined thrust coefficients. Their results demonstrated that the COSPAR can provide a stable working platform for offshore fish farms from wind, wave, and current loads, and has acceptable pitch angles for a steady wind turbine operation.
Since the dimensions of the platform of FOWT are relatively smaller than the wind turbine tower, the FOWT numerical analysis concentrates more on the wind turbine’s aerodynamic and structural responses than the hydrodynamic responses. However, when compared with the vessel-shaped ocean farm, the wind turbine’s mass is comparatively light. The complicated hydrodynamic response, i.e., nonlinear hydrodynamics, mooring dynamics, and material nonlinearity, is dominating. Moreover, the net load is not negligible; thus, many studies have been conducted focusing on the net load. Yang et al. [26] proposed a one-way fluid-structure coupling model to examine the flow interaction with the pile-net structures, revealing the influence mechanism of net on flow. Ma et al. [27] conducted numerical studies with a coupled scheme that integrates the boundary element method (BEM) and the lumped-mass model to model the frames and the moorings/netting simultaneously. Jin et al. [9] established a numerical model consisting of the frame structure, the nets, and the mooring system by using the potential flow theory, the Morison equation, and the nonlinear FE model. Li et al. [28] performed a numerical analysis about an SPM vessel-type ocean farm. In this study, the hull was simplified to two main longitudinal beams; the bow structures and rigid nets were taken into consideration. The difference between the hydrodynamic response of rigid nets and flexible nets was explored. In order to further explore the calculation method of net load, Cheng et al. [29] carried out detailed research on five Morison models and six screen models, and conducted sensitivity studies on different current velocities, inflow angles, and solidities of the nets.
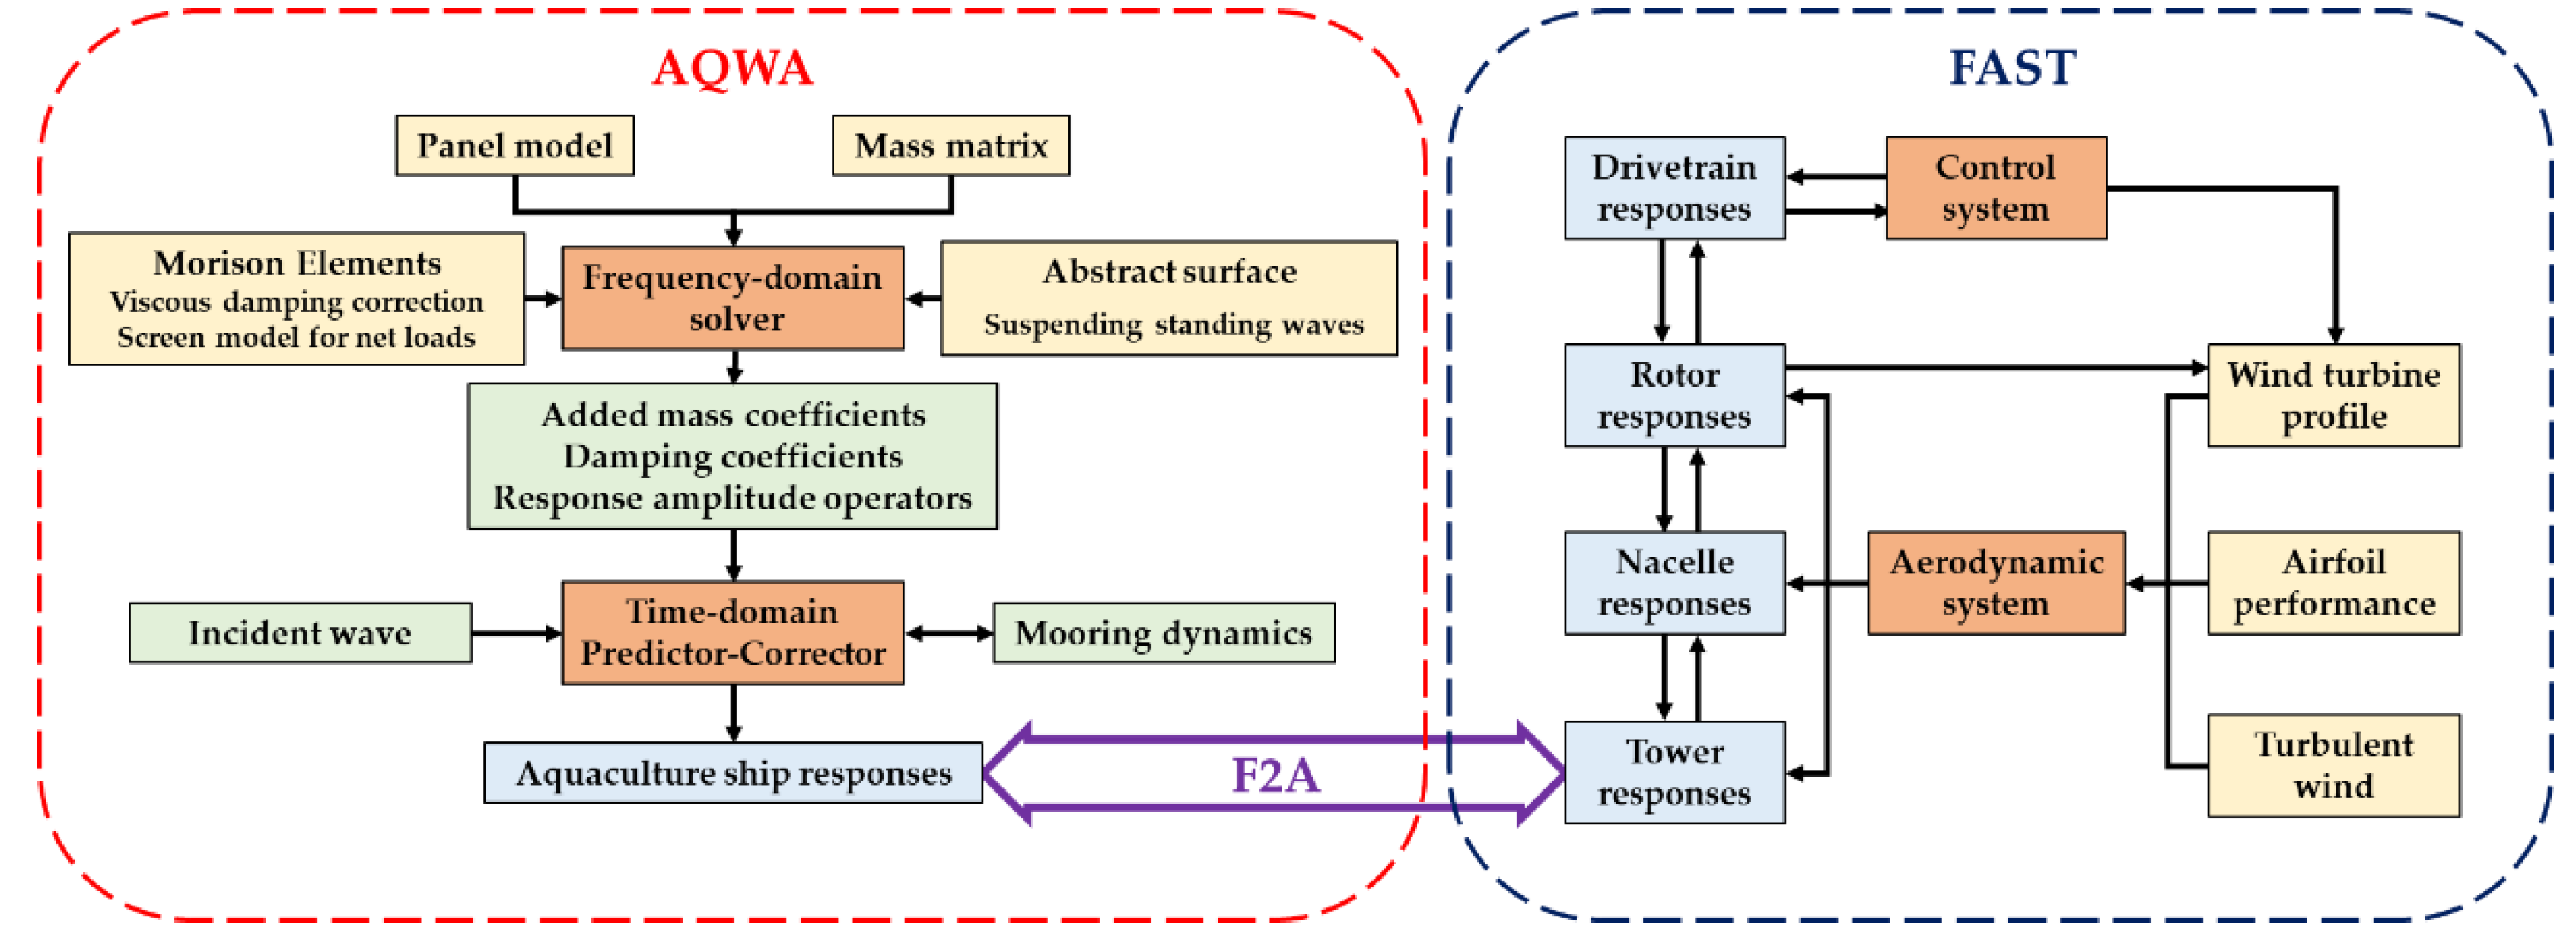
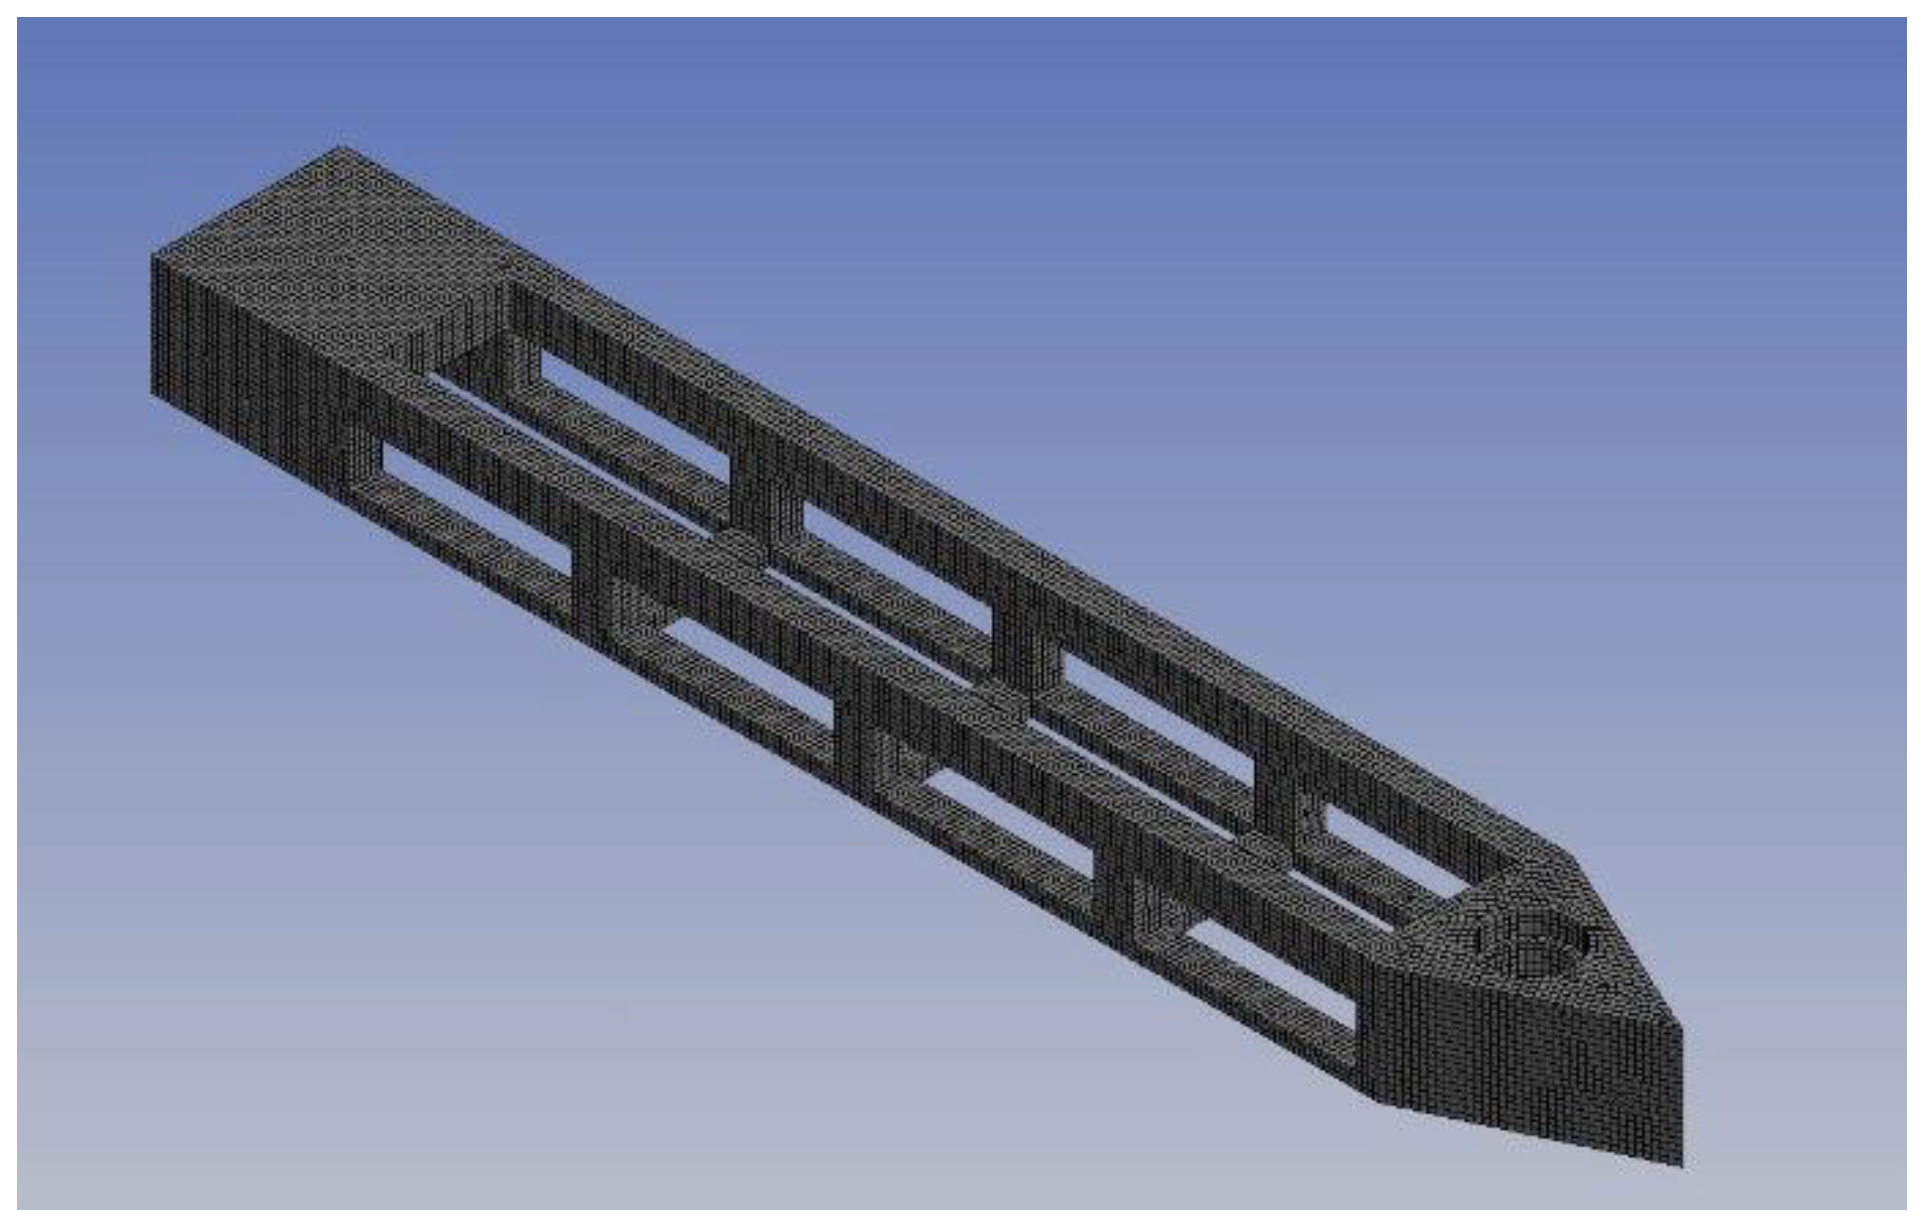
In this study, a novel vessel-type fish farm modified from Havfarm 1 [10] is modeled. A NREL 5 MW (National Renewable Energy Laboratory in America), wind turbine is installed on the stern of the facility to provide energy supply to cover the electrical cost of breeding and other work, as shown in Figure 1. Given that anti-typhoon ability and quick release ability are necessary, an inner turret mooring system is selected. As for net load, the nets are simply modeled as rigid bodies by using Morison elements. The frequency domain analysis is carried out to evaluate the hydrodynamic performance in the well-proven hydrodynamics software AQWA 2020 R2, which is developed by Atkins Inc., England. Then, with the help of the open-source code F2A developed by Yang et al. [21], the fully coupled time domain calculation is conducted in AQWA and the open source code FAST v7 developed by National Renewable Energy Laboratory (NREL) [19] to evaluate the vessel’s motion and the wind turbine’s power generation capacity in nonlinear environment conditions.

2. Modeling Method and Theoretical Background

The fully coupled analysis method is presented in Figure 2. The aerodynamic loads and responses of the upper wind turbine are calculated in FAST, while the hydrodynamic loads and responses of the underwater structure (aquaculture ship in this study) are predicted in AQWA. The theory in detail is represented in Figure 2.

2.1. Physical Model Design

The proposed aquaculture ship with self-wind power generation aims to expand aquaculture to the open ocean where traditional fossil fuel may be too costly and might even cause pollution to the ocean environment. To implement this method, a plan of integrating a 5 MW wind turbine is put forward in this study. The side view and top view of the analyzed aquaculture ship are shown in Figure 3. The parameters of the whole ship are summarized in Table 1. The ship hull is designed to be hollow such that more space can be spared for fish. Several windows are set in a line on both sides of the hull to make sure fresh water can flow into cages without too many barriers. The SPM is set at the stem, while the wind turbine is installed at the stern of the vessel. Because the center of spin motion is the internal turret mooring system, this arrangement makes the COG of the vessel closer to the stern, which can enlarge the moment of inertia in yaw and strengthen the weathervaning effect.
The mooring system, which consists of a moon pool with a diameter of 30 m and a turret with a diameter of 26 m, is selected as the internal turret mooring system. The turret is permanently connected to the seabed by means of a mooring system. Six multicomponent lines with a 60° spreading angle constitute the catenary mooring lines. The internal turret system has the advantage of quick escape when encountering extreme weather conditions. The dimensions and characteristics of the wind turbine are given in Table 2.

2.2. Numerical Modeling in Frequency Domain

The numerical modeling of the vessel is established to verify the feasibility of this concept. When an offshore structure is analyzed, three categories of hydrodynamic loading on marine structures are normally concerned: drag load, wave excitation load, and inertia load [30,31]. Drag loads are induced by viscosity, while the wave exciting load and inertia load are due to the potential flow effect. Both viscous effect and potential flow effect may be important in determining the wave-induced motion and loads on a marine structure. The dimension is a vital index to distinguish viscous effect dominating items from potential flow effect items. A rough method of classification is provided in Figure 4, where H, D, and λ are the height of the incident waves, the characteristic length of offshore structures, and the wavelength of the incident waves, respectively. Those items with characteristic lengths larger than one-fifth of the wavelength, e.g., the hull and columns, should be set as diffracting panels, while those with component lengths less than one-fifth of the wavelength, e.g., the nets, should be set as Morison elements.
AQWA is based on potential flow theory, which means the hull consisting of panel moments will not take the viscous forces into consideration. In this study, to calculate the motion correctly, a hybrid model is established by combining panel elements and Morison elements. The panels are first built for the ship hull to take care of the potential flow effects. Then, additional Morison elements are modeled for the main longitude beams of the aquaculture ship to account for the viscous damping effects. Figure 5 shows a hydrodynamic model in frequency domain analysis. The drag coefficient of the hull is set according to the roughness [25]. For a painted steel surface, the drag coefficient can be set to 0.65.
For a hybrid model structure, the linear motion equation is obtained as:
[ ω 2 ( M S + M M + M a ) i ω ( B S + B M ) + Κ h y s ] X = F w e + F d r a g
where ω represents the wave frequency; Ms and MM represent the mass matrix due to diffracting panels or Morison elements, respectively; Ma is the added mass matrix due to diffracting panels and Morison elements; BS and BM represent the hydrodynamic damping matrix by the diffracting panel elements or Morison elements; Khys is the assembled hydrostatic stiffness matrix; X represents the response amplitude operator (RAO); Fwe, is the total Froude–Krylov and diffracting force and moments; and represents the drag force due to Morison elements. The Morison equation for the fluid forces acting on the cross-section of a slender structural member is:
d F = 1 2 ρ D C d | u f u s | ( u f u s ) + ρ A C m u ˙ f ρ A ( C m 1 ) u ˙ s           = 1 2 ρ D C d | u f u s | ( u f u s ) + ρ A ( 1 + C a ) u ˙ f ρ A C a u ˙ s
where Cd is the drag coefficient, D is the characteristic drag diameter, uf is the transverse directional fluid particle velocity, us is the transverse directional structure velocity, Cm = 1 + Ca is the inertia coefficient, and A is the cross-sectional area.
Equation (1) shows the contribution of the Morison elements on hydrostatic forces, hydrostatic stiffness matrices, added mass, and wave exciting. However, Morison drag forces, which are nonlinear, are not directly calculated in the radiation and diffraction analysis and the frequency domain analysis. Therefore, linearization of drag forces should be carried out. The nonlinear term |uf-us| is replaced by a factor α multiplied by the root mean square of relative velocity to create an equivalent linear term, and the factor is set as π 8 according to the literature [29]. The linearized drag force at a cross-section of a tube is expressed as:
d F d r a g = 1 2 ρ D C d α u r m s ( u f u s )                       = 1 2 ρ D C d α u r m s u f 1 2 ρ D C d α u r m s u s
where urms is the root mean square of transverse directional relative velocity at that location.
When the panel model is modeled, the displacement is equivalent to the buoyancy of the hull. However, the addition of the full-scale Morison elements in the numerical model will cause additional unrealistic displacement to the model since AWQA accounts for the displacement of the submerged element in water automatically based on its given diameter D. From Equation (3), the drag force is directly proportional to the product of D and Cd. To avoid additional displacement and keep the correct drag force, the dimension of the Morison element D is scaled down by 1/1000 while increasing the drag coefficient by 1000 times.
Many adjacent bodies are noticed near the waterplane. Due to the absence of viscous effects in the potential flow diffraction and radiation codes such as AQWA, unrealistic sloshing-type resonant wave oscillation may occur in those gaps. To eliminate this unreasonable phenomenon, an abstract damping surface is created in the gap to implement a new, damped free-surface boundary condition, and the condition is expressed as follows:
ω 2 g ( α d 2 f 1 1 ) φ 2 i ω 2 g α d f 1 φ + φ Z = 0           where   Z = 0
where φ is the velocity potential; αd is a damping factor, set as 0.2 in this study [32]; and f1 is a function which relates to the gap size dgap between adjacent structures:
f 1 = { sin 2 ( π 2 δ )   where   δ < 1 δ 2   where   δ 1 ω 0 = π g   d g a p δ = { ω ω 0   where   ω 0 < 0.1 0.1   where   ω 0 0.1
As the environmental loads on nets account for more than 85% of the total loads on a conventional fish cage, the hydrodynamic response of the nets is a factor to be reckoned with. However, the quantity of the net cells is too large to be modeled in detail. Hence, it is of great significance to establish a simplified model of the net system. Solidity (Sn) is a key parameter for hydrodynamic characteristics of nets, which is defined as the ratio between the projected net area Ap and the total area of the net panel. The solidity can also be simplified as the ratio between two times the twine diameter and half the mesh size, as shown in Equation (6). It has been shown that the deviation between those two expressions is less than 10% when applied to a typical aquaculture net with solidity ranging from 0.1 to 0.4. When an equivalent simplified model is established, as shown in Figure 6, the consistency of solidity can be guaranteed.
S n = A p A 2 d w L
where dw is the twine diameter, and L is the half mesh size.
In this study, the screen model is applied to calculate the net loads. To calculate the Cd of twine, Løland [33] provided an empirical formula:
C d = 0.04 + ( 0.04 + 0.33 S n + 6.54 S n 2 4.88 S n 3 ) cos ( θ )
where θ is the angle between relative inflow direction to the net normal vector.
Assuming the ship is against the flow, the net panels are of three types with different normal vectors. As Figure 7 shows, the nets in yellow are side nets with 90 degrees between the normal vector and the flow direction, the nets in red are the cross-nets with 0 degrees between the normal vector and the flow direction, and the nets in white are the oblique nets with 60.255 degrees between the normal vector and the flow direction. The Cd of each type is shown in Table 3.
As for the detailed nets, the EcoNet developed by AKVA Group and used for Ocean Farm 1 is applied, whose Sn is 0.16.
Following that method, the characteristics of equivalent nets are presented in Table 3.

2.3. The Aerodynamic Loads

The aerodynamic load calculation is conducted in FAST v7 and based on BEM theory. The definitions of character angles, local elemental velocities, and forces are shown in Figure 8. The BEM theory discretizes the blade into blade elements and uses the theorem of momentum to calculate the aerodynamic loads on each element [34]:
d T ( r ) = B 1 2 ρ U r e l 2 ( C L cos ( ϕ ) + C D sin ( ϕ ) ) c d r d Q ( r ) = B 1 2 ρ U r e l 2 ( C L sin ( ϕ ) C D cos ( ϕ ) ) c r d r
where d T is the contribution to the thrust, d Q is the contribution to the torque, ρ is the air density, U r e l is the relative wind speed, and C L and C D are lift and drag coefficients, respectively. ϕ is the inflow angle, c is the chord length of the blade element, r is the radial position of the blade element, and d r is the length of the blade element. Then, the aerodynamic loads of a blade can be obtained by integrating radially.

2.4. The Mooring System

In time domain analysis, the constraint conditions are introduced. A cylinder pontoon is set as the internal turret, which is placed in the moon pool. A 2-meter-wide gap is reserved between the pontoon and the wall of moon pool, and an external lid covers the gap to prevent unrealistic wave elevation. The pontoon is connected to the hull by means of a joint, which limits the turret and the hull to only move relatively to the hull around the common vertical axis. There is no stiffness, but damping of 500 N*m/(°/s) is set about the axis to simulate the dynamic character of the internal turret.
As stated earlier, the pontoon is connected to the seabed with six cables, and each cable consists of chain and wire rope. Different from a conventional aquaculture ship, the analyzed ship has a wind turbine with a capacity of 5 MW mounted on the stern of the ship, which would make the ship experience significant wind loads. Therefore, the mooring design of the analyzed ship may be different from the conventional aquaculture ship. In this study, the mooring system of the analyzed aquaculture ship is loosely based on that of the OC4 floating wind turbine [35]. The properties of each mooring cable are summarized in Table 4.

2.5. Fully Coupled Time Domain Model

In this study, the F2A method proposed by Yang et al. [21] is applied to establish a fully coupled time domain model for the analyzed aquaculture ship, which provides a dynamic link between AQWA’s time domain module and the aero-servo-elastic modules of FAST v7. The fully coupled time domain model is based on the Cummins equation, which has the following form:
( M + A ( ) ) X ¨ ( t ) + 0 t X ˙ ( τ ) K ( t τ ) d τ + B X ˙ ( t ) + C X ( t ) = F e x c ( t ) + F d ( X ˙ ( t ) ) + F m ( X ( t ) ) + F f ( X ( t ) , X ˙ ( t ) , X ¨ ( t ) )
where M is the structural mass matrix, A(∞) is the added mass matrix, K is the impulse response function, B is the additional viscous damping matrix, C is the hydrostatic restoring stiffness matrix, Fexc is the wave exciting force, Fd is the drag force simulating the viscous damping, Fm is the mooring force, and Ff is the force imported from FAST. K(t) can be calculated as follows:
K ( t ) = 2 π 0 S B ( ω ) cos ( ω t ) d ω + 2 π S B a ( ω ) cos ( ω t ) d ω
where S stands for the upper limit wave angular frequency for the frequency domain simulation using a standard panel code.
The current force does play an important role in the floating structure’s motion response, especially for an aquaculture ship with so many nets under the waterplane. For Morison elements, the current force has been calculated in the Morison equation as expressed in Equation (11). For a panel element, the current force can be solved as:
F = 1 2 C D ρ w | u | u A
where CD represents the current drag coefficient, ρD represents the density of water, u represents the current velocity, and A represents the projected area in the vertical plane of the current velocity. The CD usually comes from CFD numerical prediction results, but for a porous structure, such as the aquaculture ship in the study, the current force is relatively less important, so the CD is simply calculated based the on the projected areas.
The open-source code F2A can integrate aero-servo-elastic simulation (conducted in FAST) within AQWA. Since the results produced by AQWA and FAST are based on different coordinate systems, a transformation of the coordinate system is provided by F2A.
Firstly, a transformation matrix Tmat is used to correct the floating structure position vector:
[ x y z ] = [ θ 1 2 1 + s + θ 2 2 + θ 3 2 s 1 + s θ 3 s + θ 1 θ 2 ( 1 + s 1 ) s 1 + s θ 2 s + θ 1 θ 3 ( 1 + s 1 ) s 1 + s θ 3 s + θ 1 θ 2 ( 1 + s 1 ) s 1 + s θ 2 2 1 + s + θ 1 2 + θ 3 2 s 1 + s θ 1 s + θ 2 θ 3 ( 1 + s 1 ) s 1 + s θ 2 s + θ 1 θ 3 ( 1 + s 1 ) s 1 + s θ 1 s + θ 2 θ 3 ( 1 + s 1 ) s 1 + s θ 3 2 1 + s + θ 1 2 + θ 2 2 s 1 + s ] [ X Y Z ]
where [ x , y , z ] T is the corrected position vector that will be imported into FAST. [ X , Y , Z ] T is the position vector obtained in AQWA. θ 1 , θ 2 , and θ 3 are the roll, pitch, and yaw motions of the floating structure, respectively. s is the sum of the squares of the rotations, i.e., θ 1 2 + θ 2 2 + θ 3 2 .
With the help of Tmat, the velocity can also be corrected when the reference point in FAST is (0, 0, 0):
V F = U A T mat   C o G × ω A
where V F is the velocity vector used in FAST; U A and ω A are the translational and rotational velocity vectors of the structure obtained in AQWA, respectively; and C o G is the position vector from the reference point to the center of mass of the platform.
Similarly, the force and moment calculated in FAST can also be converted into AQWA by multiplying the transpose of Tmat:
F A = T mat   1 F F M A = T mat   1 ( M F C o G × F F )

3. Results and Discussion

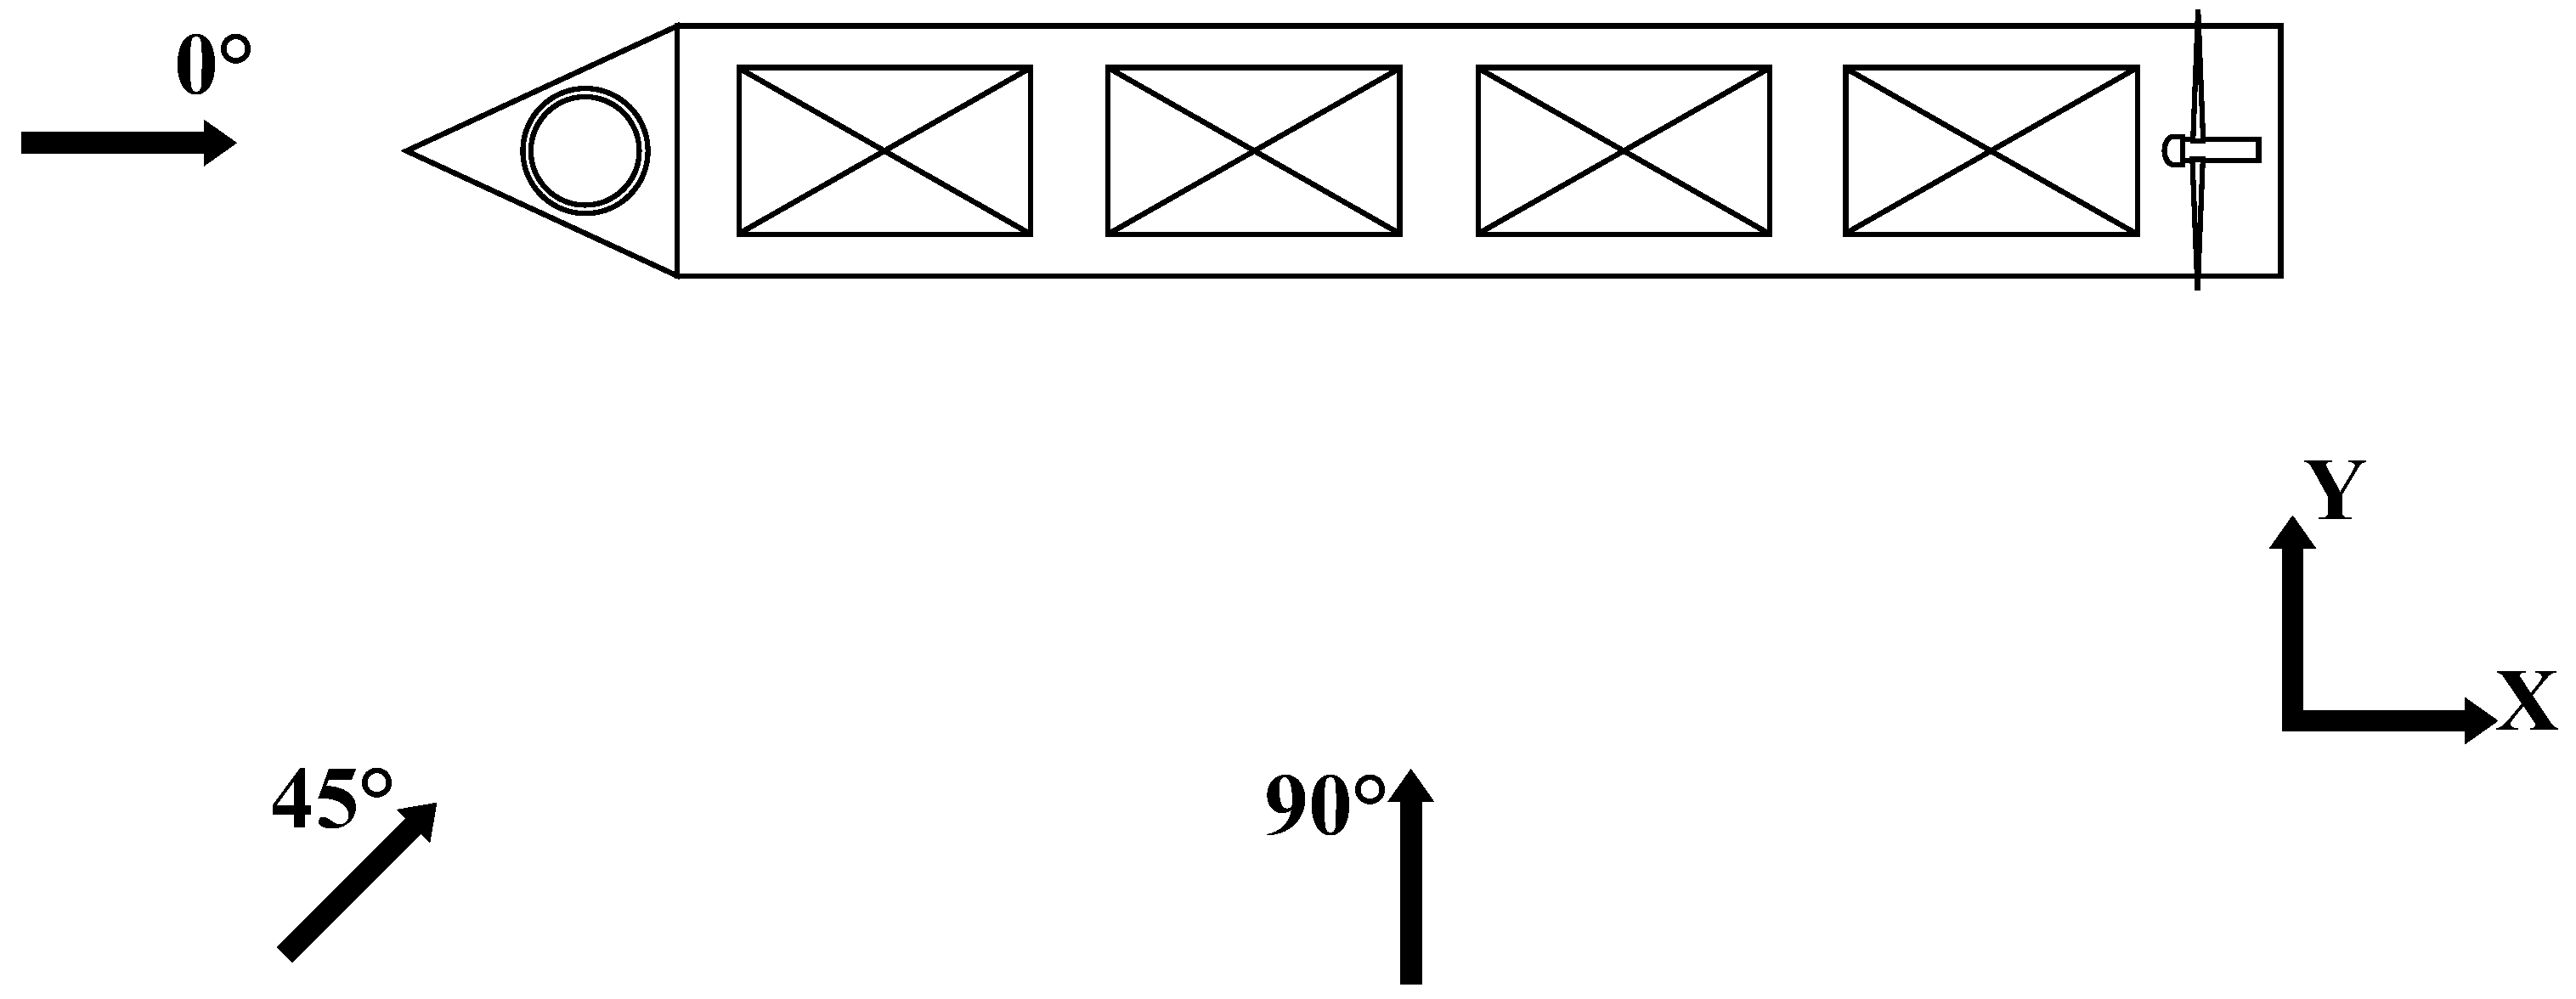
3.1. Definition of Freedom

Before discussing the results, definitions of the freedom and direction of wind, current, and wave should be given, as shown in Figure 9. The angle of wave and current is defined as the angle between the direction of wave (or current) and the positive X direction.

3.2. Frequency Domain Simulation Results

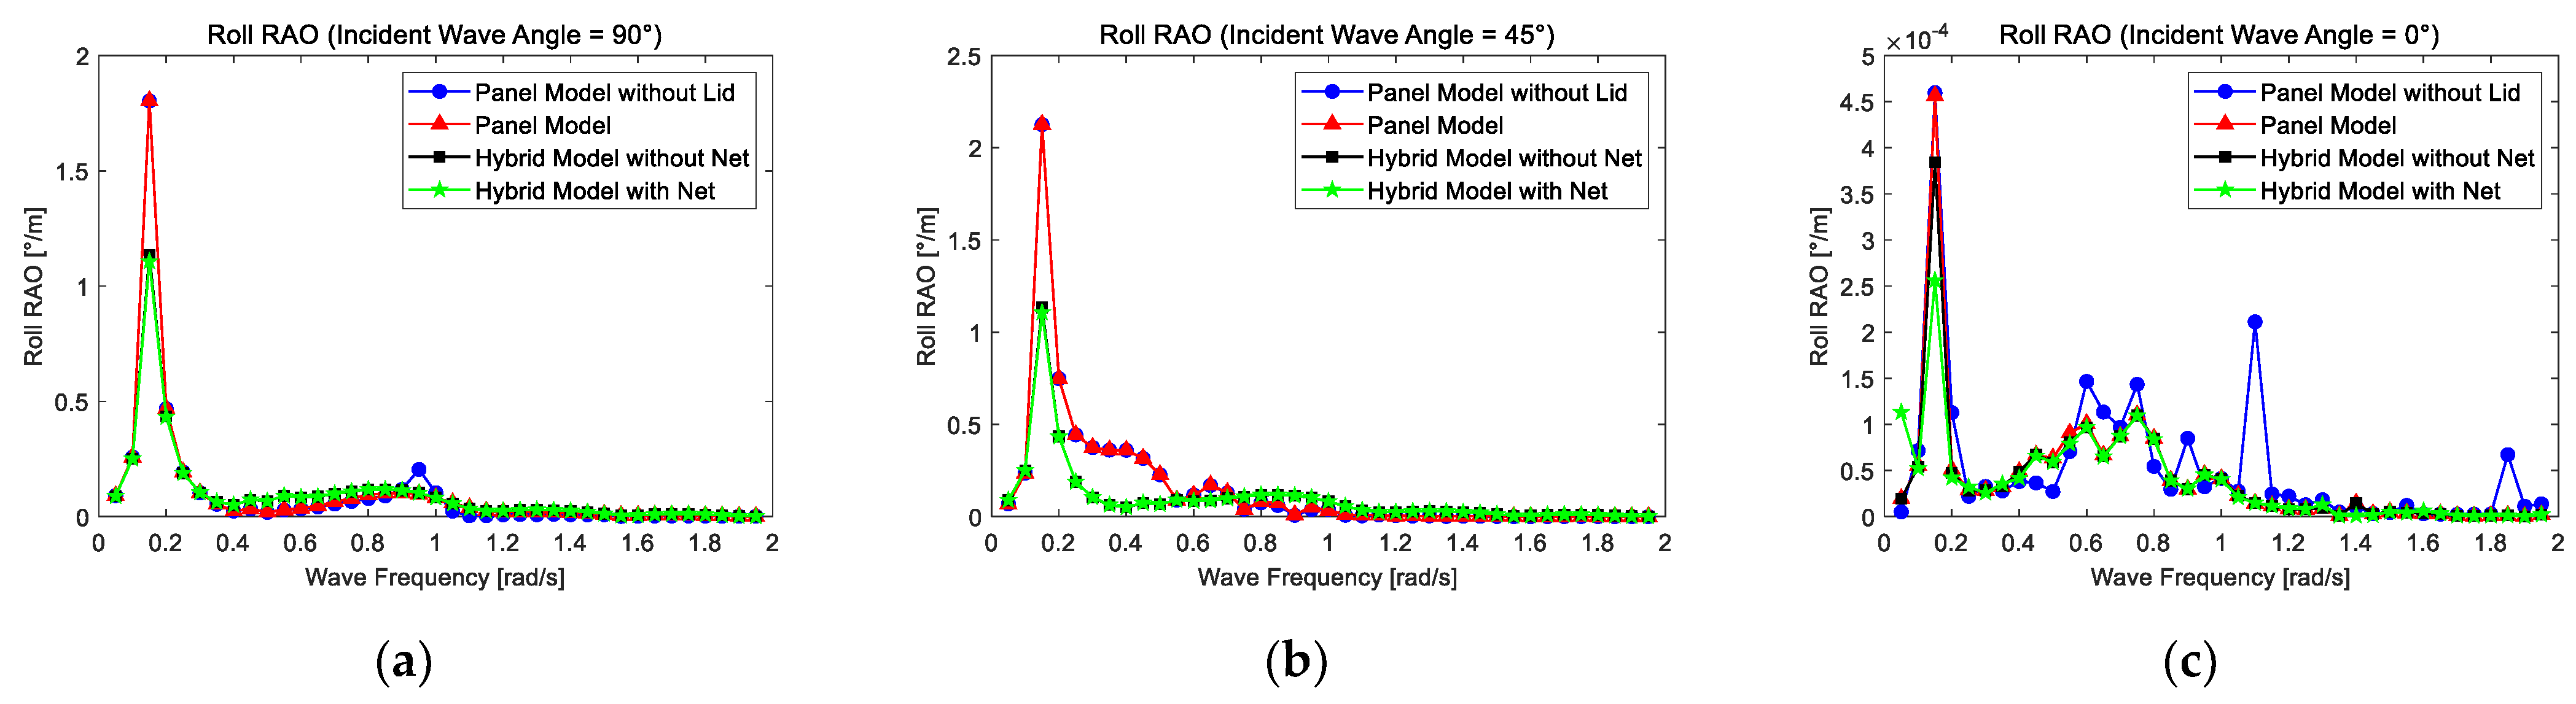
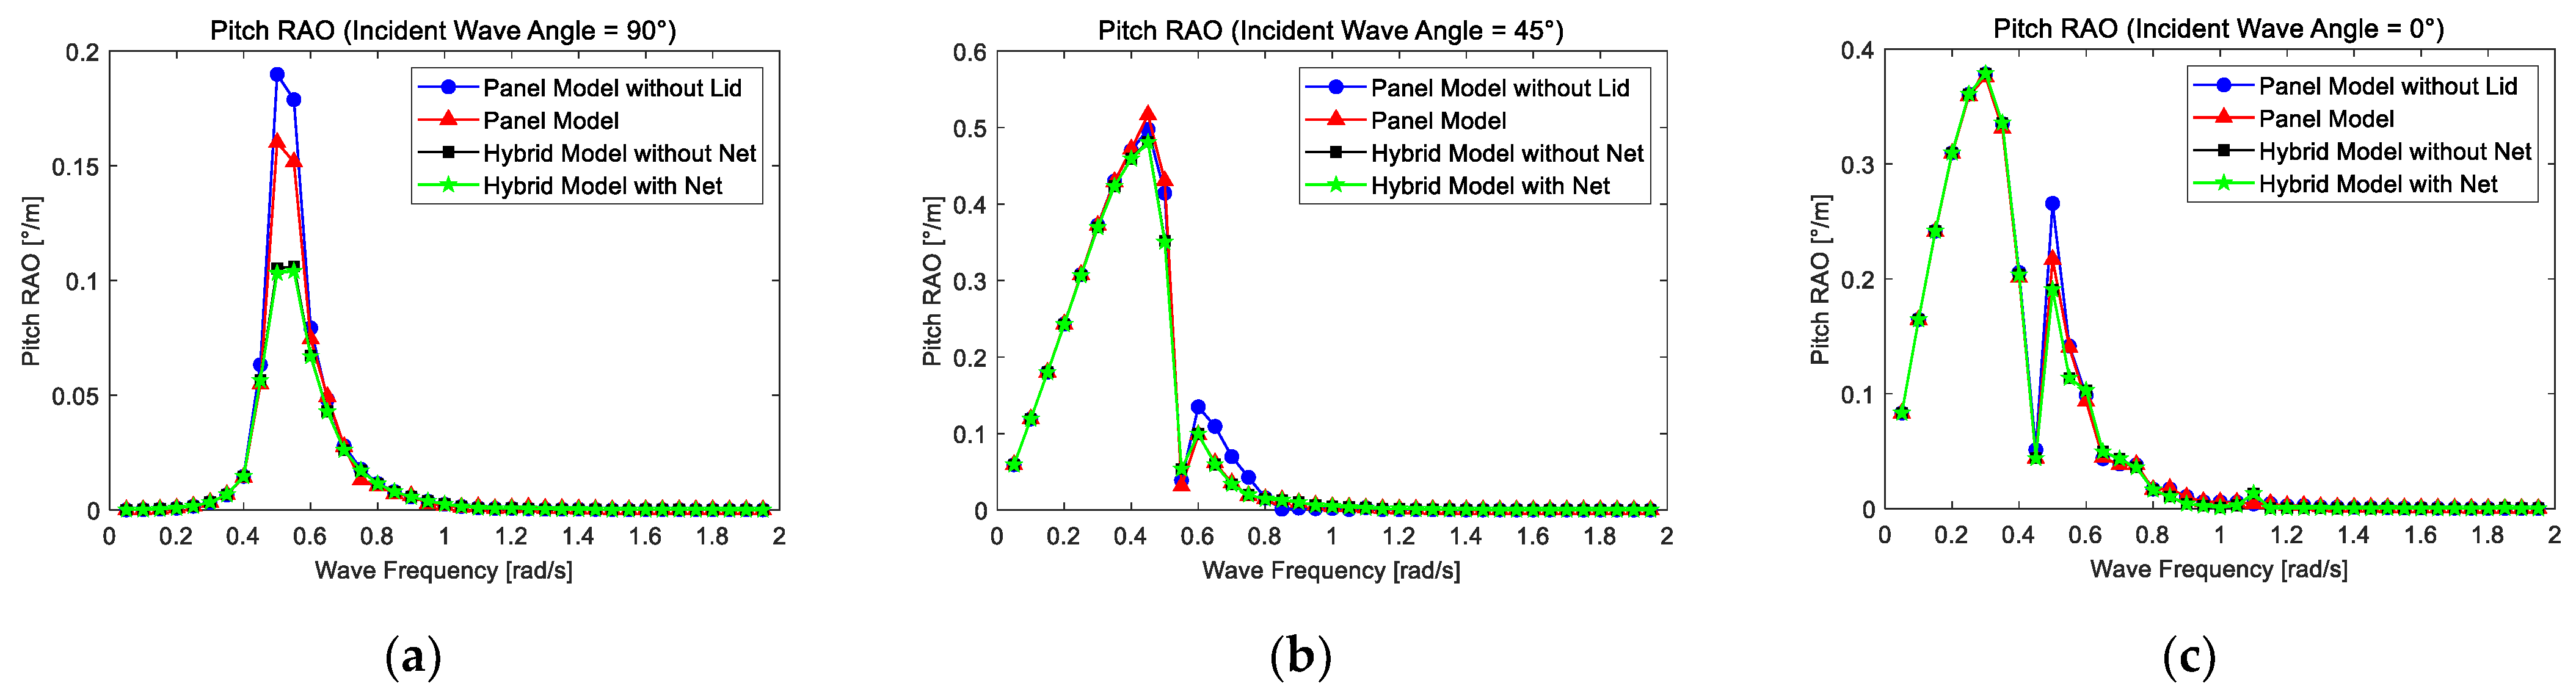
In this study, the frequency domain hydrodynamic analysis was carried out using AQWA. Considering the weathervaning effect, the inner angle between the heading angle and wave direction stays small, so head sea (0°), bow sea (45°), and beam sea (90°) are three typical wave directions focused on in this study.
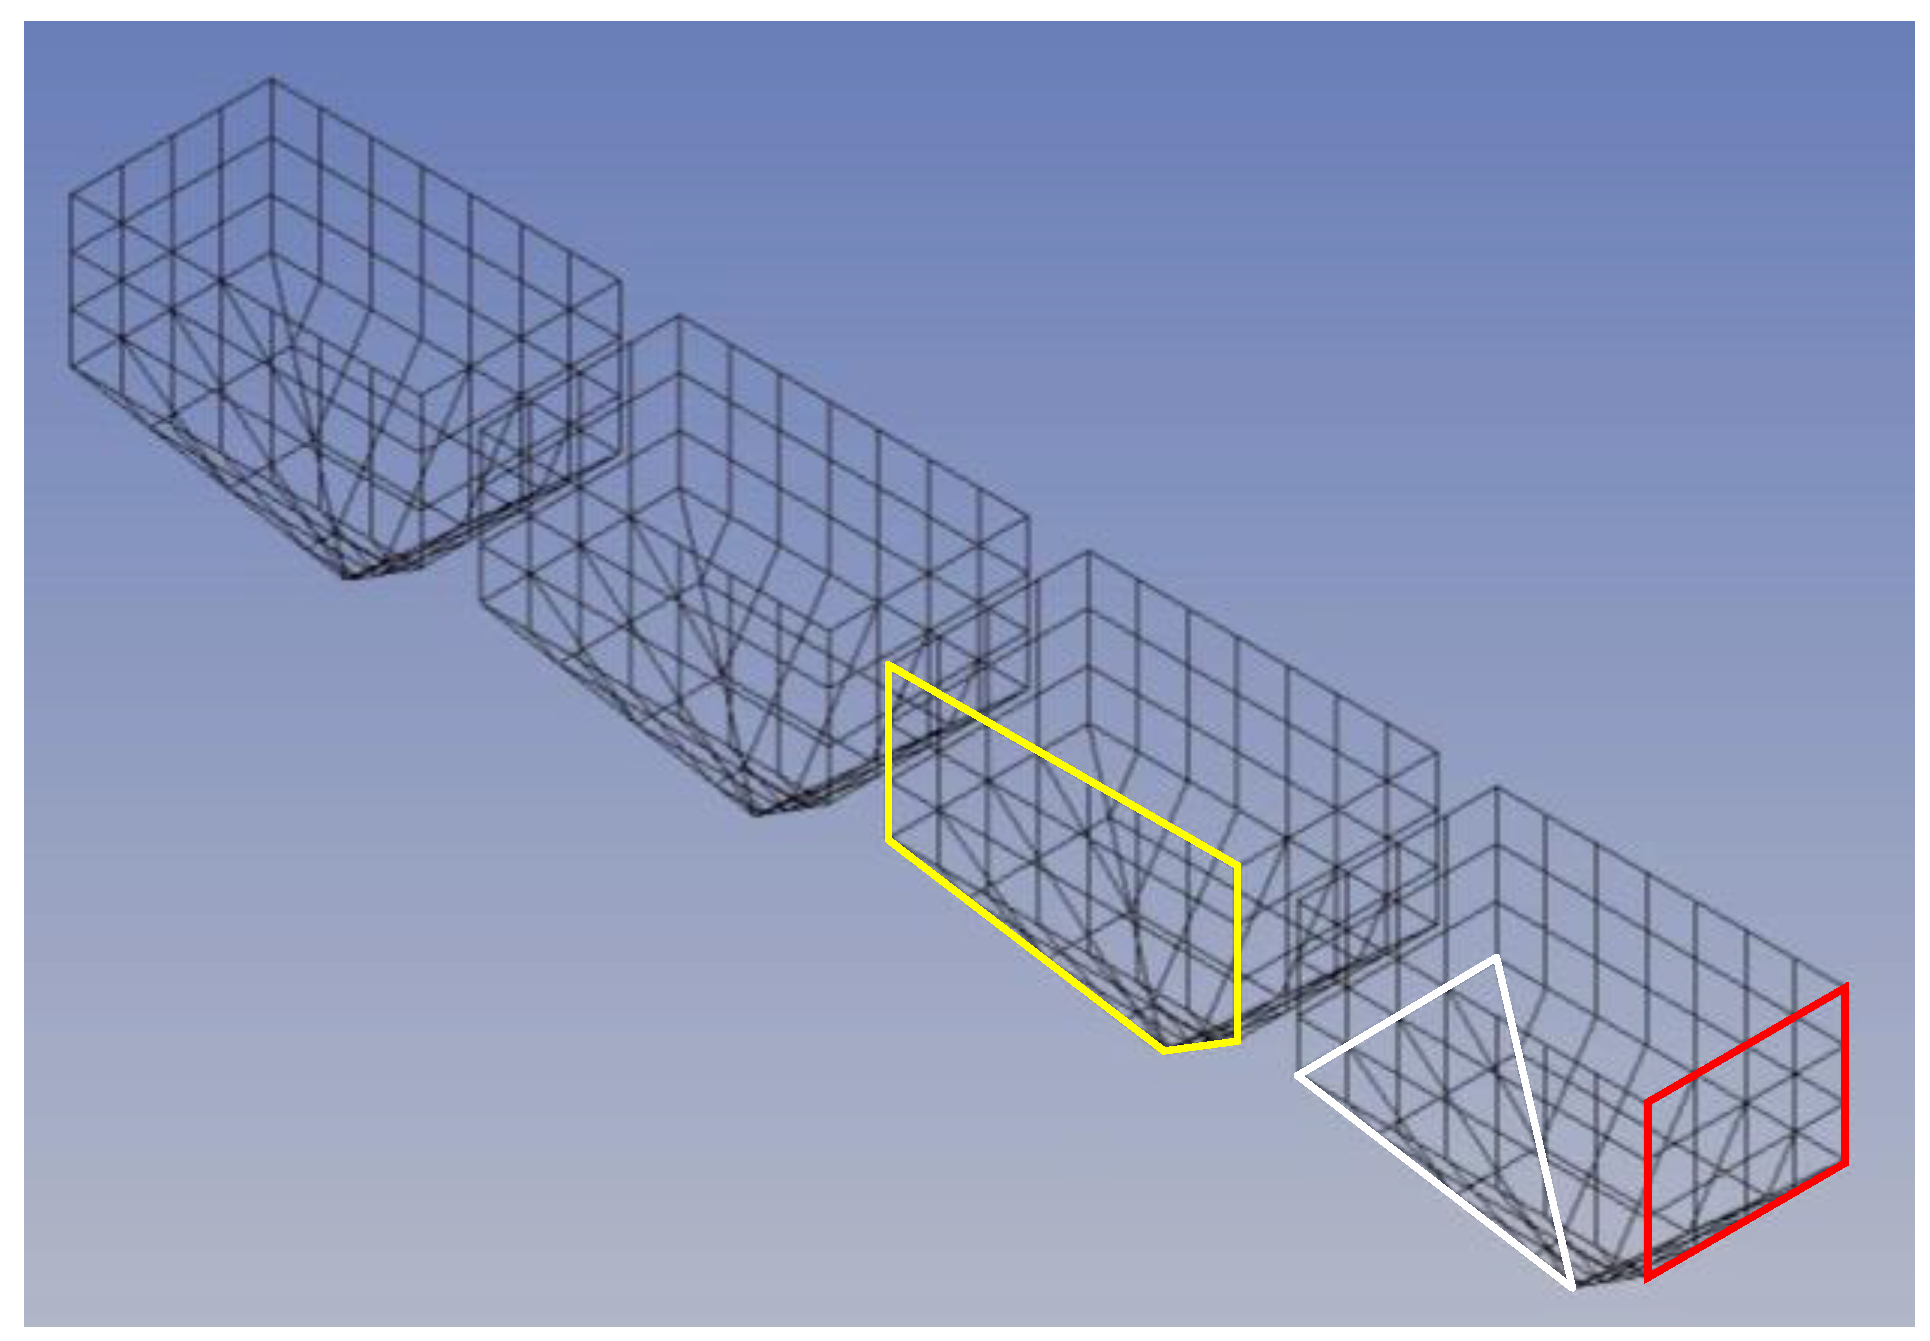
Four different models were established to evaluate different factors’ effect on the aquaculture ship. Model 1 is a pure diffracting panel model without an external lid; Model 2 is also a diffracting panel model, but an abstract damping surface is created in opening water surface in the hull and moon pool to cut down the unreal wave elevation due to the suspending standing waves’ effect; Model 3 is based on Model 2, but additional viscous damping is added on the hull by means of Morison elements; and Model 4 is a model with added equivalent rigid nets on Model 3 to provide the effect of net loads.
A wave condition must be given to calculate the root mean square of relative velocity, which will replace the nonlinear term in the drag forces. In this study, an irregular wave is set, as Table 5 shows.
The surge RAO of aquaculture is presented in Figure 10. As Figure 10 shows, the surge RAO is not greatly affected by the external lid and the nets, but the external lid does cut down the surge RAO at the frequency of around 0.55 rad/s.
As for the heave response, the heave RAO is shown in Figure 11. The amplitude of heave in 90° is the greatest in those three wave directions. The peak amplitude of the panel model is about 2.5 m/m, while the peak amplitude of the hybrid model can be reduced to 2.0 m/m. It can be seen that in heave motion, the effect of viscous damping is more pronounced. As Figure 11a shows, the peak amplitude of the heave RAO using the hybrid model is about 0.5 m/m less than using the panel model. As Figure 11c shows, the hybrid model with nets will have a smaller heave RAO compared with the hybrid model without nets. The amplitude frequency of the model with nets is also lower than the model without nets.
The roll RAO is shown in Figure 12; similar to the heave RAO, the external lid will cut down the amplitude. It was noticed that the roll RAO at 45° is slightly larger than that at 90°, and the hollow structure is the main cause.
The pitch RAO is shown in Figure 13. All three figures show that the aquaculture ship has low response in pitch motion. As Figure 13b,c shows, the heave RAOs have two amplitudes. The four models have close amplitudes in the first frequency, but the second amplitudes show the differences between the four models, with the hybrid model with nets the smallest among them.

3.3. Time Domain Simulation Results

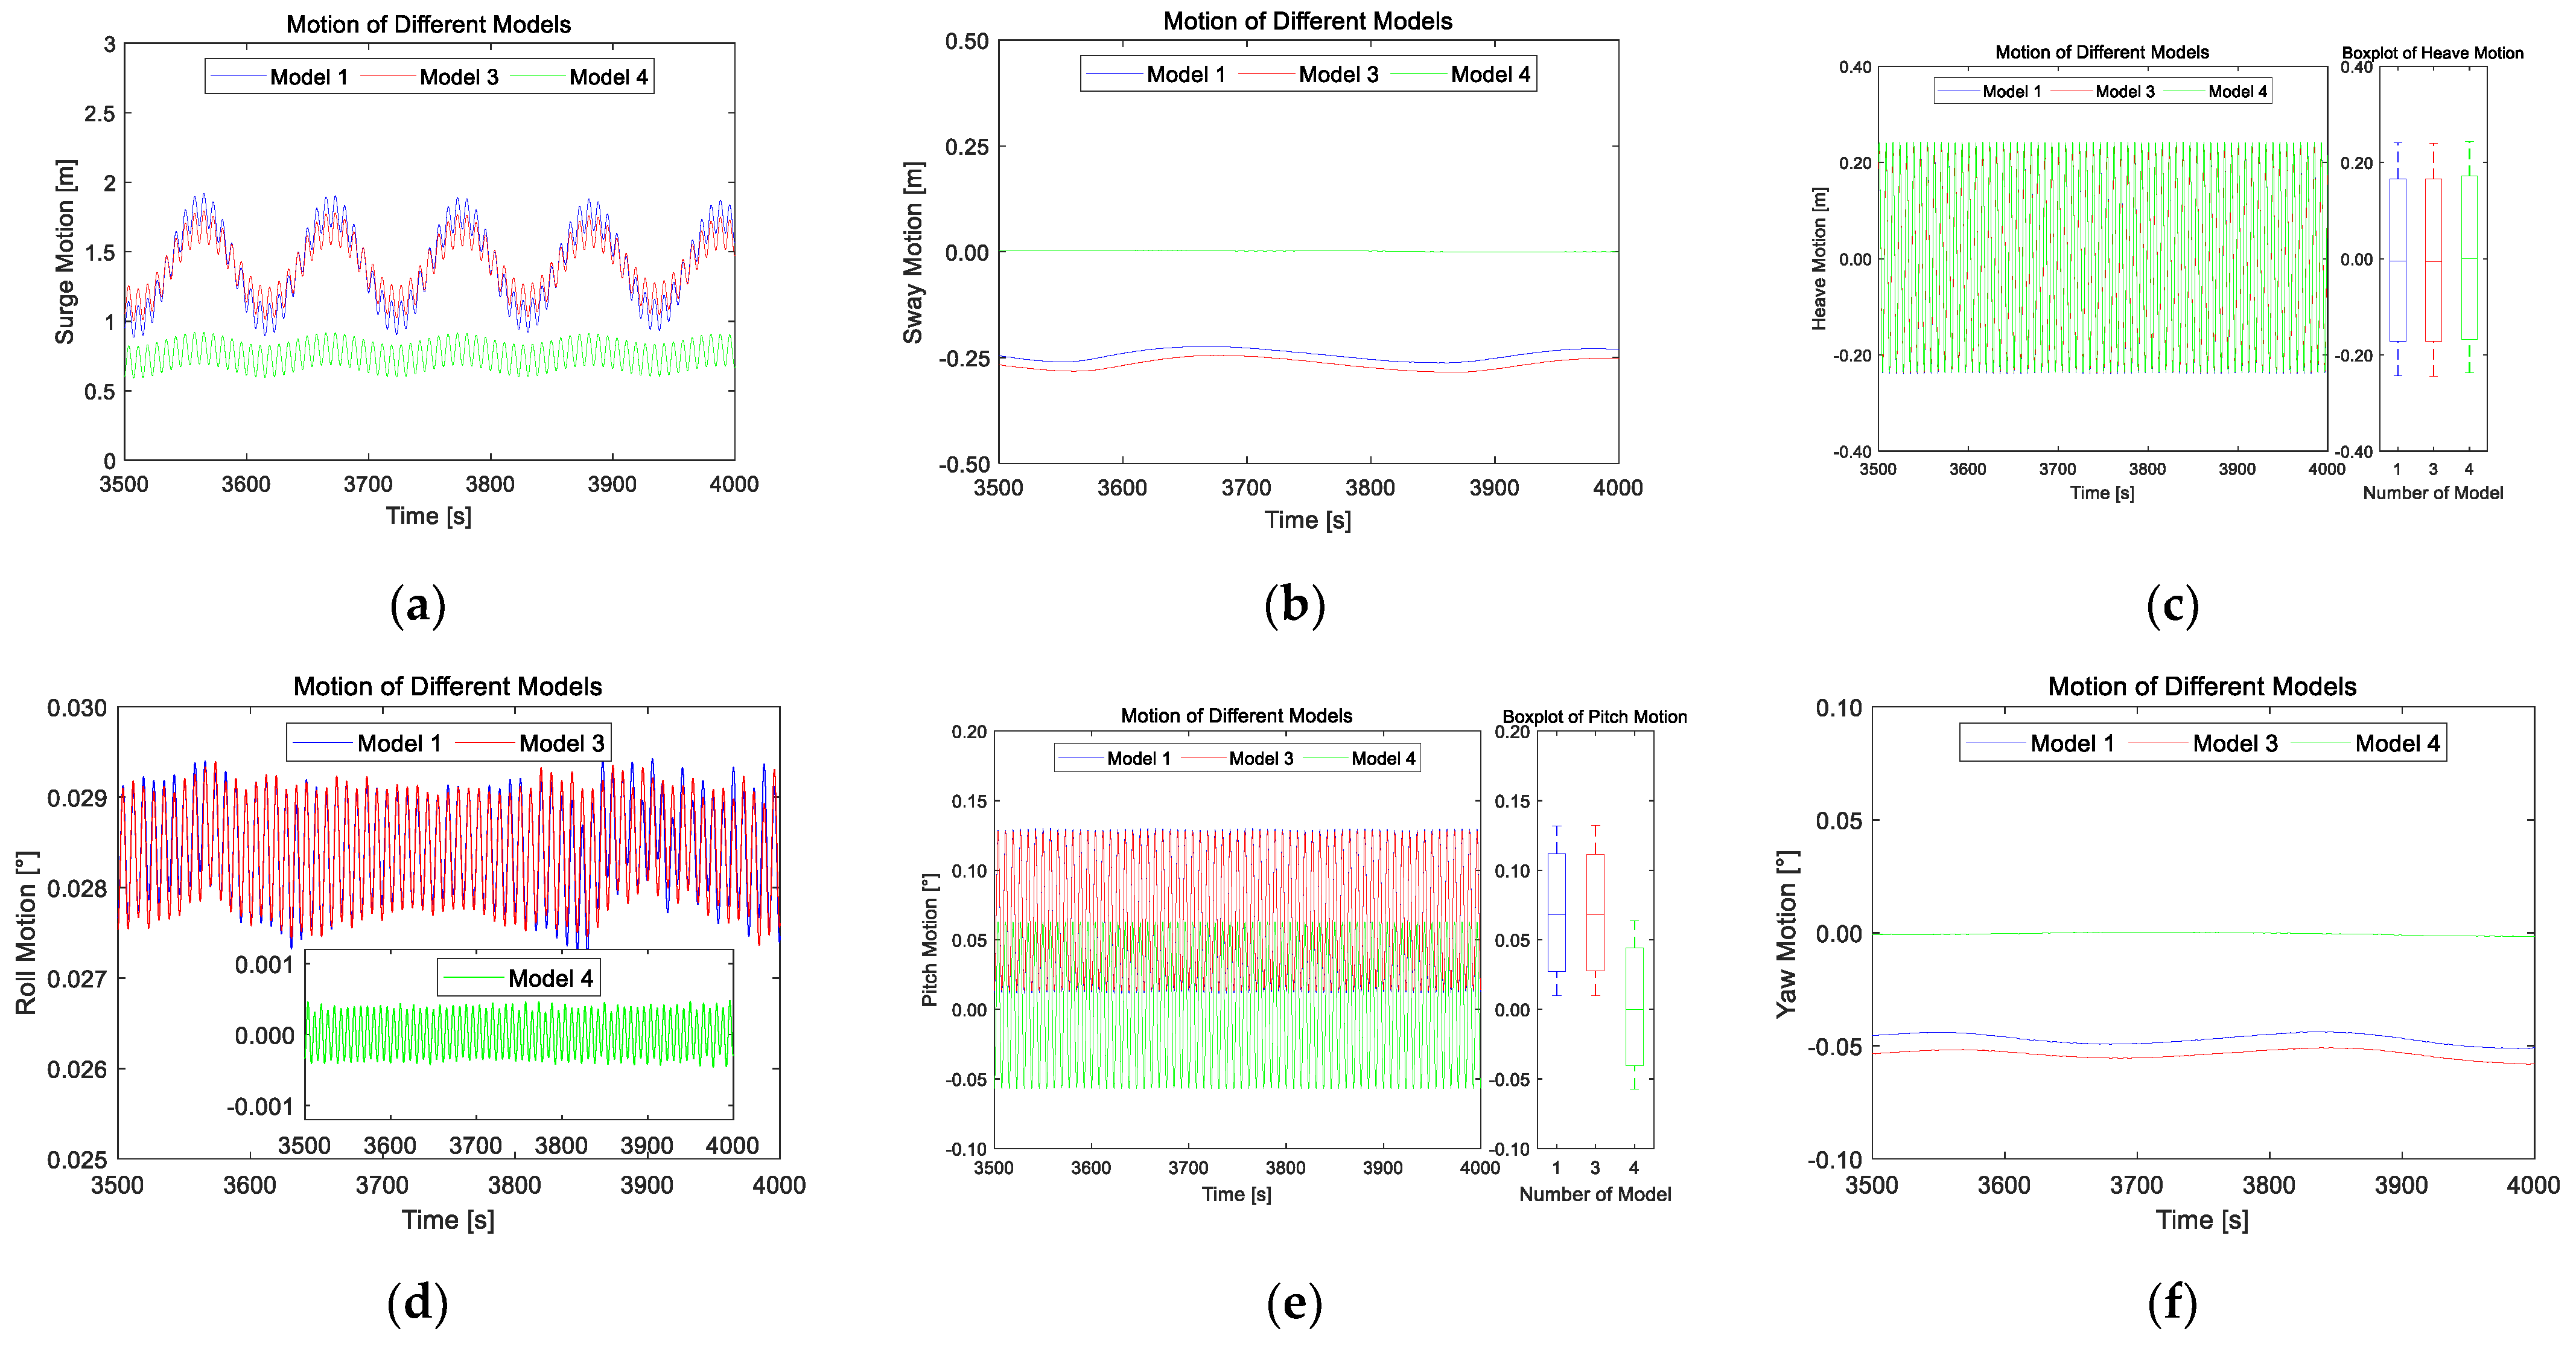
The time domain simulations were carried out based on the hybrid model with nets. Firstly, four different models in regular wave conditions are analyzed. Model 1 is an all-coupled model. All of the hydrodynamic, aerodynamic, servo system, and elastic characteristics are considered. This model aims to simulate the AQWA as realistically as possible. Model 2 is a six-freedom-fixed model, where the aerodynamic, servo system, and elastic characteristics are considered, but all six DOF motions of the aquaculture ship are suppressed; this model aims to simulate a fixed wind turbine. Model 3 is a model based on Model 1, but the strategy of the servo system (control and electrical system) is changed from blade pitch control to variable speed torque control. Model 4 is a model only carried out in AQWA; it is also based on the hybrid model with nets, but the wind turbine is represented by a force vertically downward, equal to the gravity of the turbine. The location of the mass point is also adjusted to maintain the ship in zero trim posture. This model aims to provide a contrast of an aquaculture ship without a working wind turbine. The detailed information of each model is listed in Table 6.
The power generation comparison of Model 1, Model 2, and Model 3 is shown in Figure 14. Model 2 (fixed wind turbine) will generate steady power, and the rated power output is about 5 MW (500 kW). However, when the wind turbine is installed on the aquaculture ship, the curve of power generation is still periodical, but less steady when compared with the fixed one. As for Model 3, the variable speed torque control strategy is applied, which results in the reduction in power generation, but is still periodical. However, the lowest power generation sometimes will cut down to 4.6 MW, 92% of the rated power output. For a more precise comparison of the power generation of different models, the average power generation over 400 s to 4000 s is calculated. The average power generation of Models 1, 2, and 3 is 4.99 MW, 5.00 MW, and 4.97 MW, respectively.
Power generation is the vital evaluation index of the energy supply ability of an aquaculture ship, but the motion and mooring force are the significant evaluation indexes of the stability of the aquaculture ship.
When it comes to the motion of the aquaculture ship in the study, Model 4, only simulated in AQWA by representing the gravity of the wind turbine with a steady downward force, is introduced into the comparison. The motion response, anchor lift, laid length, and cable force are calculated and discussed.
The time histories of motion in six DOF of three different models are presented in Figure 15. It must be clarified that all motions presented here are motions relative to the original location in 0 s. It can be seen that the two different servo strategies not only have a slight effect on power generation, but also make the motion responses highly similar. In surge motion, the amplitude of Models 1 and 2 is about 2 m, and the radius of the swing circle is about 5 m, which can satisfy the allowance of 30 m according to the ABS rules [36]. The existence of a 5 MW turbine leads to sway and yaw deviating from the initial position. The distances of motion interval of heave and pitch are not too affected by the wind turbine, but the pitch motions of Models 1 and 2 are slightly different from the equilibrium position. The roll motions of Models 1 and 2 are also slightly out of the equilibrium position. The differences in roll and pitch motion are caused by the force and moment of the wind turbine.
Besides motion, the cable force, laid length, and anchor lift are also important. The number of cables is set as in Figure 2b. In all six cables, the cable laying in front of the ship will be pulled up, and cable 1 is the cable that bears the largest cable tension, so more attention should be paid to cable 1. The three mooring performances of cable 1 are shown in Figure 16. The three mooring performances have apparent periodicity in regular wave, steady current, and steady wind. The wind turbine in working conditions does cause the aquaculture ship’s horizontal displacement, which results in the periodic increase in cable force and anchor lift, while laid length has a corresponding periodic decrease. The average cable force is 4130 kN for an aquaculture ship with a working wind turbine and 3770 kN with a standby wind turbine. The average laid length is 299.81 m for an aquaculture ship with a working wind turbine and 307.08 m with a standby wind turbine. The average anchor lift is 7.37 N for an aquaculture ship with a working wind turbine and 4.25 N with a standby wind turbine.
For further research, several simulations of the time domain analysis in irregular waves were carried out. Seven environment conditions were set to determine the influence of current speed, significant wave height, and spectral peak period. The details of the environment conditions are described in Table 7.
These seven environment conditions are separated into three groups. Group 1 contains EC1, EC2, and EC3 to inquire about the impact of different current speeds. Group 2 contains EC4, EC1, and EC5 to inquire about the impact of different significant wave heights. Group 3 contains EC6, EC1, and EC7 to inquire about the impact of different spectral peak periods. The following are the motion results and mooring cable 1′s performances of each group. The statistical results of these motions and performances of cable 1 are also attached after the graphs, as Table 8, Table 9 and Table 10 show.
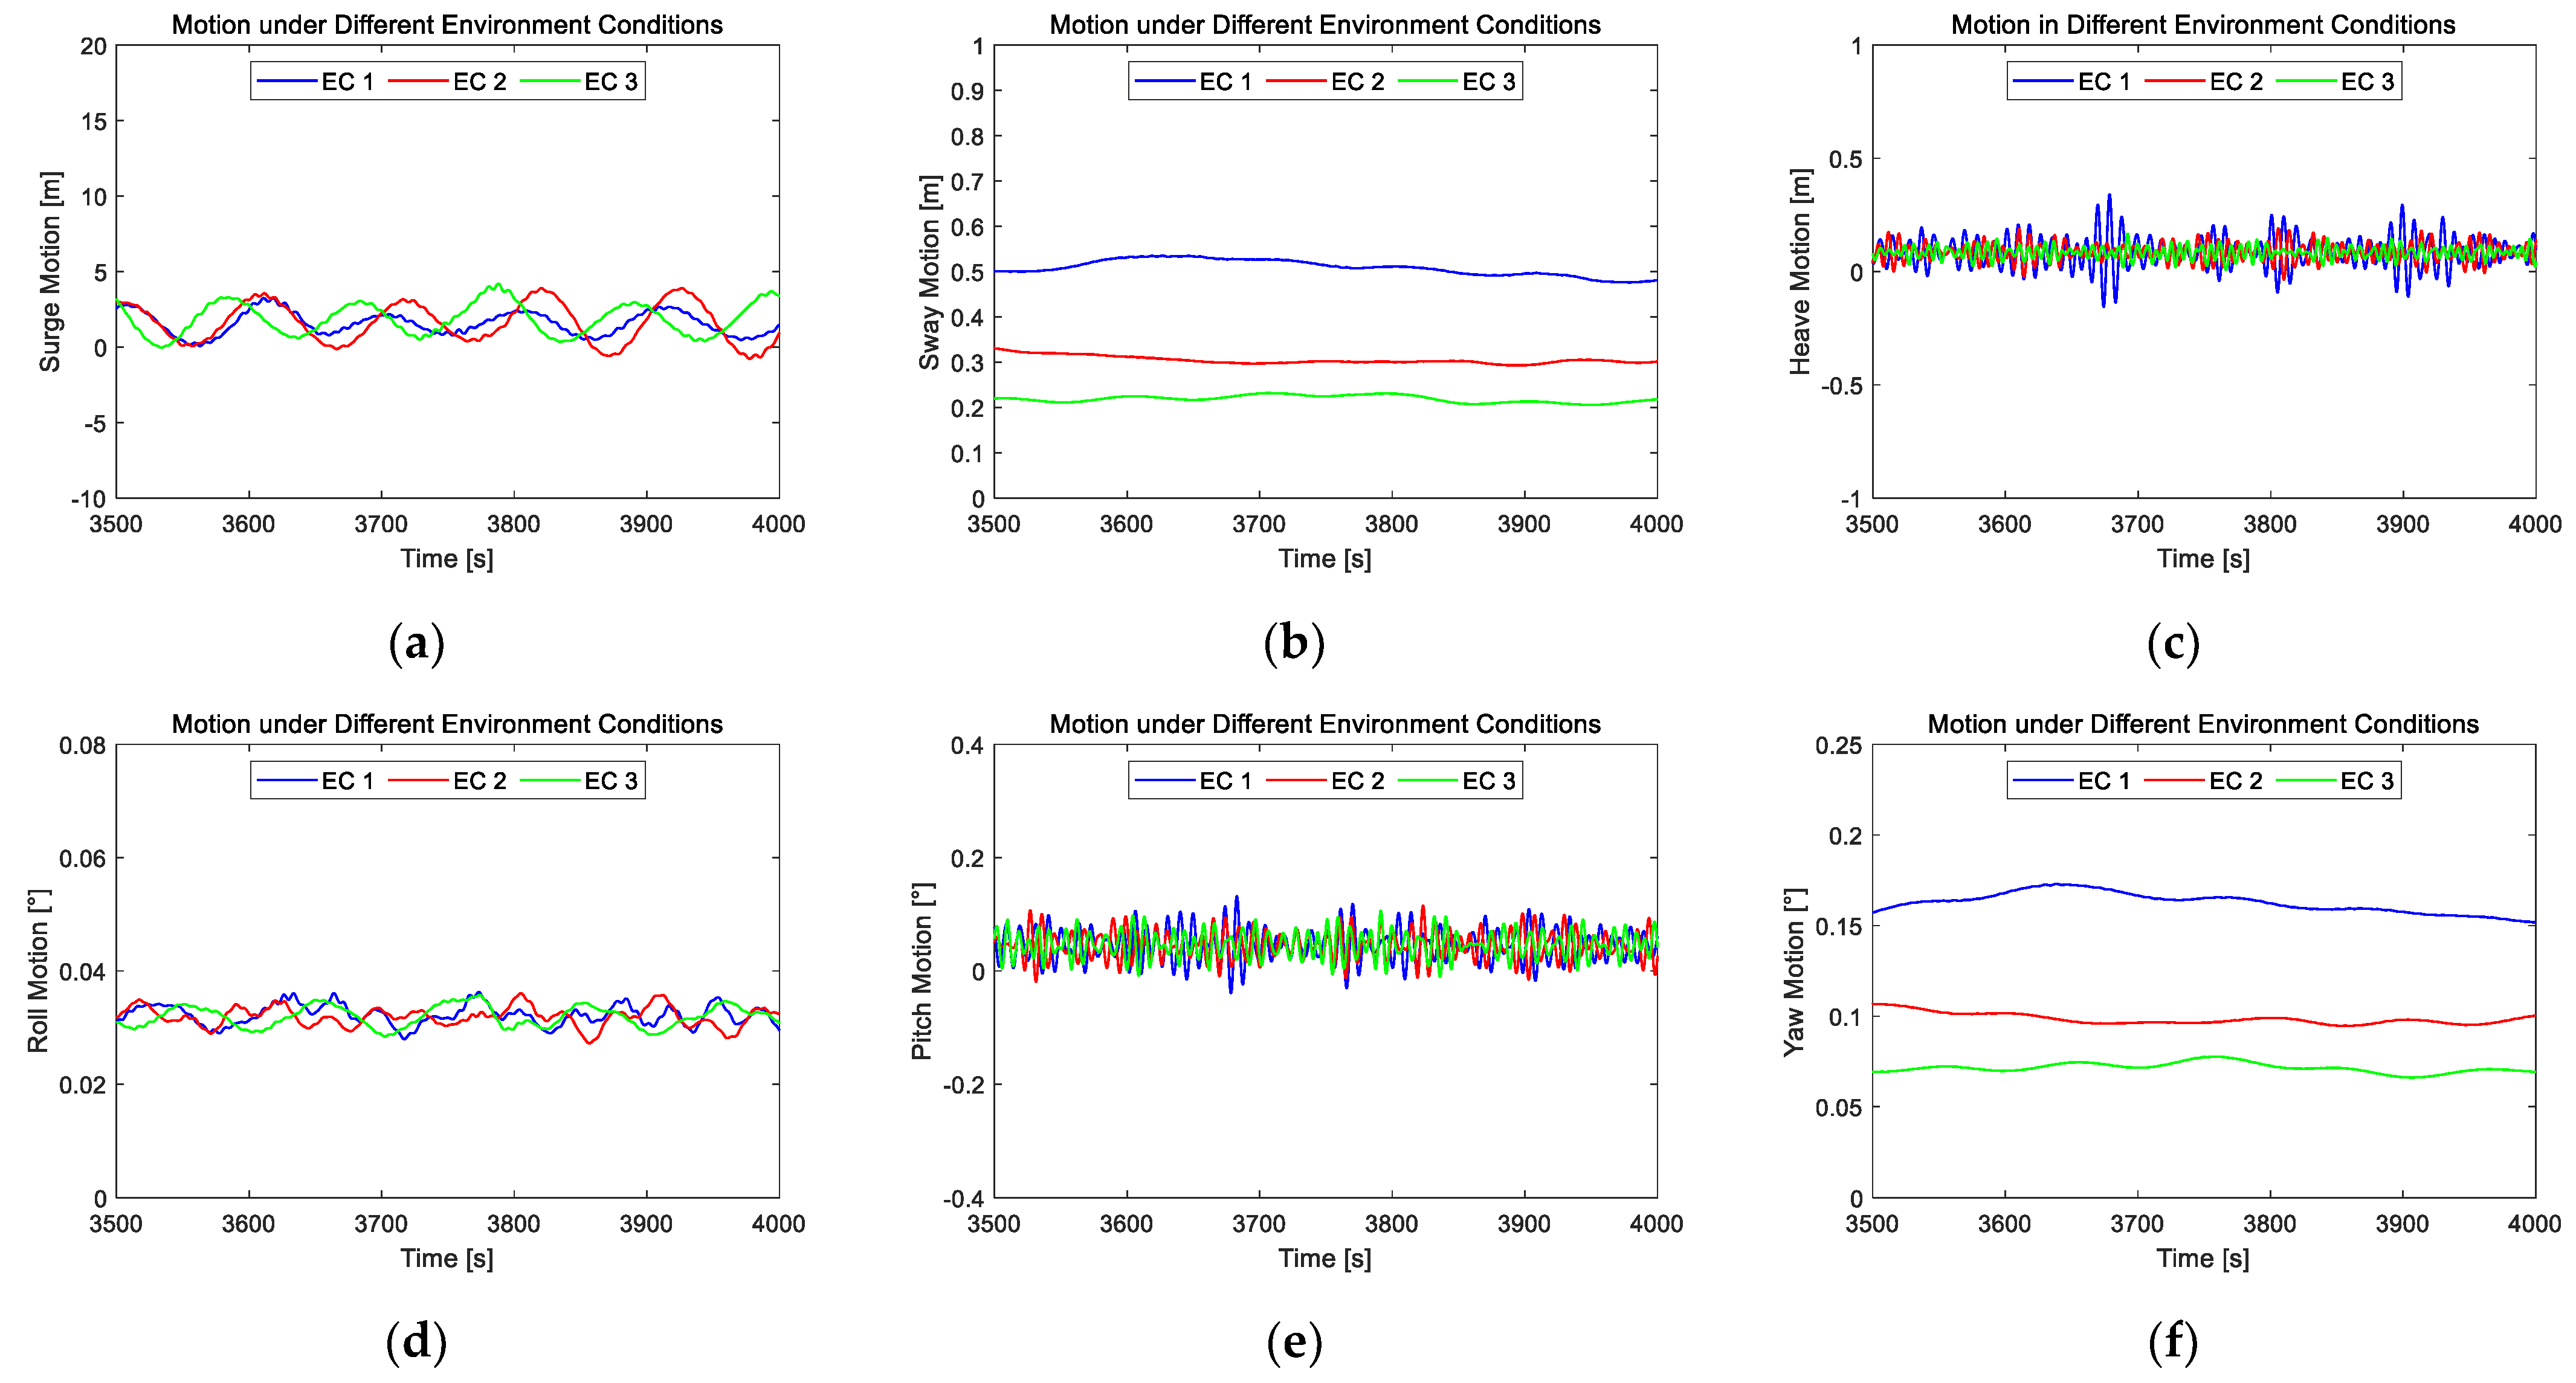
Figure 17 shows the simulation results of Group 1. The surge motions of EC1, 2, and 3 are quite close. As for sway and yaw motion, the three lines almost stay horizontal smoothly. However, the balance positions are different. At 0 current speed, the hull will drift away, but a higher current speed brings large wave excitation force, which results in a reduction in the hull drift. Both the sway and yaw distance will be smaller. When it comes to heave and pitch motion, it is obvious that the higher current speed can lower the local peak amplitude.
From the results of Group 1, we can see that the high current speed has a trivial impact on the amplitude of surge, but the balance position will be farther away from the original position. Because the wind turbine’s lateral force will cause the aquaculture ship’s sway and yaw motion, the high current speed will force the sway motion to be smaller. Furthermore, the high current speed can enlarge the stability in heave and pitch. Moreover, cable 1′s mooring performances are apparently affected by high current speed. With the larger current velocity, the peak value of anchor lift is large, the average laid length is smaller, and the tension force is larger.
Figure 18 shows the simulation results of Group 2. The results of Group 2 show that significant wave height does influence the motion a lot. For a similar reason, the large significant wave height caused large wave excitation force, which leads to large local peak amplitude of surge, heave, and pitch motion, and makes the aquaculture ship nearer to the wave direction, which means a smaller sway drift distance and drift angle in yaw. Nevertheless, the wave height does not impact the roll motion too much.
From the simulation results of Group 2, we can draw the conclusion that the bigger wave height causes bigger wave excitation force, which leads to the significant response in surge, heave, and pitch motion. Moreover, the bigger excitation force will partly resist the wind turbine’s lateral force and make the aquaculture hull’s horizonal drift smaller. As for mooring performances, the anchor lift is greatly impacted by wave height. The amplitude of anchor lift in EC5 can reach 2000 N. Correspondingly, the minimal value of laid length reduces greatly, and the amplitude of cable force increases greatly.
The simulation results of Group 3 are as Figure 19 shows. The periods of surge, heave, and pitch are consistent with the period of wave. The roll motion in the long wave period will show some high-frequency responses. As for sway and yaw motion, the shorter wave period can provide larger wave excitation force and help the aquaculture ship stay in the direction of the facing wave. In addition, the long wave period will cause large volatility in laid length and cable force. The amplitude of anchor lift will also be bigger in the long wave period.

4. Concluding Remarks

This study proposes a novel concept of an open ocean aquaculture ship integrated with a 5 MW wind turbine. This concept can realize the self-supply of energy powered by the wind turbine. In addition to the novel design, this study also presents a new method to simulate the turret mooring system by modeling the hull and turret using the joint connection in AQWA, which can limit the relative axial motion between the hull and turret. Moreover, the loads’ impacts on the nets are also considered by modeling them as Morison elements, so that the current forces applied on the nets can be evaluated by using the screen model.
The simulation process was separated into two parts. Firstly, the RAO with net load and external lid correction was computed based on the frequency domain hydrodynamic analysis. The comparison between the panel model and the hybrid model was conducted to demonstrate the effect of eliminating the unrealistic wave elevation and the effect of load on nets in different wave frequencies. The results show that the external lid will effectively reduce the unrealistic RAO amplitude near the resonant frequencies, while the nets modeled with Morison elements will even deviate the frequency of peak occurrence. Based on the RAO of the hybrid model with nets, simulations in the time domain were carried out. In the time domain simulations, the internal turret mooring system and wind turbine were taken into consideration. The aerodynamic loading of wind turbine was calculated with the help of an open-source code F2A to realize the coupling between AQWA and FAST V7. Two series of time domain calculations were carried out. One compared the power generation of fixed model and floating models with two different servo strategies. The results showed that the average power generation of these three models is quite close, proving the power generation of the novel design of an aquaculture ship integrated with a wind turbine. The other one simulated the aquaculture ship in different environment conditions to evaluate the dynamic performance of the integrated aquaculture ship. Seven environment conditions were separated into three groups to compare the ship’s motion and mooring performances under different current speeds, wave heights, and wave periods. From the results, we may conclude that the proposed concept can maintain a relatively stable floating state under the impacts of aerodynamic loads, current loads, and wave excitation forces. Furthermore, the introduction of a wind turbine onto the aquaculture ship would cause the drift motion of the ship because of its lateral force. Additionally, a high current speed, a higher wave height, and a shorter wave period are found to be helpful for the aquaculture ship to maintain the direction of facing the wind when the wind, wave, and current are assumed to come from the same direction.
From what has been discussed above, the proposed concept may be a reasonable method for the combined utilization of marine aquaculture and renewable energy. However, this study remains in a preliminary stage. Laboratory tests are recommended to be conducted to further verify this concept. Additionally, it is of great significance to investigate the optimal site selection for the combined utilization of offshore wind and marine aquaculture, which is recommended for future studies to promote the engineering application of the proposed concept.

Author Contributions

H.L.: methodology, software, investigation, data curation, writing—original draft. M.C.: supervision, writing—review and editing, and funding acquisition. Z.H.: writing—review and editing. H.Z.: data curation, investigation, and software. L.L.: writing—review and editing. All authors have read and agreed to the published version of the manuscript.

Funding

This research was funded by the National Natural Science Foundation of China, grant number 52171275, and the Natural Science Foundation of Hainan Province, China, grant number 520MS072.

Institutional Review Board Statement

Not applicable.

Informed Consent Statement

Not applicable.

Data Availability Statement

Not applicable.

Conflicts of Interest

The authors declare no conflict of interest.

References

  1. FAO. The State of World Fisheries and Aquaculture 2020; FAO: Rome, Italy, 2020. [Google Scholar]
  2. Gentry, R.R.; Lester, S.E.; Kappel, C.V.; White, C.; Bell, T.W.; Stevens, J.; Gaines, S.D. Offshore aquaculture: Spatial planning principles for sustainable development. Ecol. Evol. 2017, 7, 733–743. [Google Scholar] [CrossRef] [PubMed]
  3. Nordi, G.; Bogstad, B.; Carnegie, R.; Cooper, A.; Eilersen, M.; Grefsrud, E.S.; Mikkelsen, E.I.; O’Beirn, F.; Rust, M.; Skern-Mauritzen, M. Workshop on the Norwegian Sea Aquaculture Overviews (WKNORAO). ICES Sci. Rep. 2021, 3, 116. [Google Scholar]
  4. Gianni, M. High Seas Bottom Trawl Fisheries and Their Impacts on the Biodiversity of Vulnerable Deep-Sea Ecosystems: Options for International Action; IUCN: Gland, Switzerland, 2004. [Google Scholar]
  5. Osienski, M.J. Dynamic and Structural Analyses of a Gravity Fish Cage Employing Copper Alloy Netting. Master’s Thesis, University of New Hampshire, Ann Arbor, MI, USA, 2020. [Google Scholar]
  6. Chen, J.; Guang, C.; Xu, H.; Chen, Z.; Xu, P.; Yan, X.; Wang, Y.; Liu, J. Marine fish cage culture in China. Future Maric. A Reg. Approach Responsible Dev. Asia-Pac. Reg. 2006, 285, 1–22. [Google Scholar]
  7. Lekang, O.-I.; Salas-Bringas, C.; Bostock, J. Challenges and emerging technical solutions in on-growing salmon farming. Aquac. Int. 2016, 24, 757–766. [Google Scholar] [CrossRef] [Green Version]
  8. Zhao, Y.; Guan, C.; Bi, C.; Liu, H.; Cui, Y. Experimental Investigations on Hydrodynamic Responses of a Semi-Submersible Offshore Fish Farm in Waves. J. Mar. Sci. Eng. 2019, 7, 238. [Google Scholar] [CrossRef] [Green Version]
  9. Jin, J.; Su, B.; Dou, R.; Luan, C.; Li, L.; Nygaard, I.; Fonseca, N.; Gao, Z. Numerical modelling of hydrodynamic responses of Ocean Farm 1 in waves and current and validation against model test measurements. Mar. Struct. 2021, 78, 103017. [Google Scholar] [CrossRef]
  10. Li, L.; Jiang, Z.; Ong, M.C. A preliminary study of a vessel-shaped offshore fish farm concept. In Proceedings of the International Conference on Offshore Mechanics and Arctic Engineering, Trondheim, Norway, 25–30 June 2017; p. V006T005A006. [Google Scholar]
  11. Maritime, B. Havfarm 1—Mammoth, Semi-Submersible, Exposed Aquaculture Pen Arrives in Norway. Available online: https://www.bairdmaritime.com/fishing-boat-world/aquaculture-world/vessel-review-havfarm-1-mammoth-semi-submersible-exposed-aquaculture-pen-arrives-in-norway/ (accessed on 24 July 2020).
  12. Aardal, A.R.; Marvik, J.I.; Svendsen, H.; Tande, J.O.G. Study of offshore wind as power supply to oil and gas platforms. In Proceedings of the Offshore Technology Conference, Houston, TX, USA, 30 April–3 May 2012. [Google Scholar]
  13. Freeman, M.C.; Garavelli, L.; Wilson, E.; Hemer, M.; Abundo, M.L.; Travis, L.E. Offshore Aquaculture: A Market for Ocean Renewable Energy; Report for Ocean Energy Systems (OES): Lisbon, Portugal, 2022. [Google Scholar]
  14. Korpås, M.; Warland, L.; He, W.; Tande, J.O.G. A case-study on offshore wind power supply to oil and gas rigs. Energy Procedia 2012, 24, 18–26. [Google Scholar] [CrossRef] [Green Version]
  15. Silva, D.; Rusu, E.; Guedes Soares, C. The effect of a wave energy farm protecting an aquaculture installation. Energies 2018, 11, 2109. [Google Scholar] [CrossRef] [Green Version]
  16. Johnson, K.; Dalton, G. Building Industries at Sea: ‘Blue Growth’ and the New Maritime Economy; River Publishers: Gistrup, Denmark, 2018. [Google Scholar]
  17. Chen, J.; Kim, M.-H. Review of Recent Offshore Wind Turbine Research and Optimization Methodologies in Their Design. J. Mar. Sci. Eng. 2021, 10, 28. [Google Scholar] [CrossRef]
  18. Barthelmie, R.J.; Jensen, L. Evaluation of wind farm efficiency and wind turbine wakes at the Nysted offshore wind farm. Wind Energy 2010, 13, 573–586. [Google Scholar] [CrossRef]
  19. Jonkman, J.M. FAST User’s Guide; National Renewable Energy Laboratory: Golden, CO, USA, 2005; Volume 365. [Google Scholar]
  20. Zhang, Y.; Shi, W.; Li, D.; Li, X.; Duan, Y.; Verma, A.S. A novel framework for modeling floating offshore wind turbines based on the vector form intrinsic finite element (VFIFE) method. Ocean Eng. 2022, 262, 112221. [Google Scholar] [CrossRef]
  21. Yang, Y.; Bashir, M.; Michailides, C.; Li, C.; Wang, J. Development and application of an aero-hydro-servo-elastic coupling framework for analysis of floating offshore wind turbines. Renew. Energy 2020, 161, 606–625. [Google Scholar] [CrossRef]
  22. Chen, M.; Xiao, P.; Zhou, H.; Li, C.B.; Zhang, X. Fully Coupled Analysis of an Integrated Floating Wind-Wave Power Generation Platform in Operational Sea-States. Front. Energy Res. 2022, 10. [Google Scholar] [CrossRef]
  23. Tian, X.-L.; Xiao, J.-R.; Liu, H.-X.; Wen, B.-R.; Peng, Z.-K. A novel dynamics analysis method for Spar-type floating offshore wind turbine. China Ocean Eng. 2020, 34, 99–109. [Google Scholar] [CrossRef]
  24. Zhai, Y.; Zhao, H.; Li, X.; Shi, W. Hydrodynamic Responses of a Barge-Type Floating Offshore Wind Turbine Integrated with an Aquaculture Cage. J. Mar. Sci. Eng. 2022, 10, 854. [Google Scholar] [CrossRef]
  25. Chu, Y.; Wang, C.; Zhang, H. A frequency domain approach for analyzing motion responses of integrated offshore fish cage and wind turbine under wind and wave actions. Aquac. Eng. 2022, 97, 102241. [Google Scholar] [CrossRef]
  26. Yang, H.; Xu, Z.; Bi, C.; Zhao, Y.-P. Numerical modeling of interaction between steady flow and pile-net structures using a one-way coupling model. Ocean Eng. 2022, 254, 111362. [Google Scholar] [CrossRef]
  27. Ma, C.; Bi, C.-W.; Xu, Z.; Zhao, Y.-P. Dynamic behaviors of a hinged multi-body floating aquaculture platform under regular waves. Ocean Eng. 2022, 243, 110278. [Google Scholar] [CrossRef]
  28. Li, L.; Jiang, Z.; Vangdal Høiland, A.; Chen Ong, M. Numerical Analysis of a Vessel-Shaped Offshore Fish Farm. J. Offshore Mech. Arct. Eng. 2018, 140, 041201. [Google Scholar] [CrossRef]
  29. Cheng, H.; Li, L.; Aarsæther, K.G.; Ong, M.C. Typical hydrodynamic models for aquaculture nets: A comparative study under pure current conditions. Aquac. Eng. 2020, 90, 102070. [Google Scholar] [CrossRef]
  30. Barltrop, N. Floating Structures: A Guide for Design and Analysis; Oilfield Publications Limited (OPL): Herefordshire, UK, 1998; Volume 1. [Google Scholar]
  31. Borgman, L.E. Random hydrodynamic forces on objects. Ann. Math. Stat. 1967, 38, 37–51. [Google Scholar] [CrossRef]
  32. Ansys, A. AQWA Theory Manual; AQWA: Canonsburg, PA, USA, 2013. [Google Scholar]
  33. Løland, G. Current Forces on and Flow through Fish Farms. Ph.D. Thesis, NTNU, Trondheim, Norway, 1991. [Google Scholar]
  34. Mourits, J. BEM Theory and CFD for Wind Turbine Aerodynamics; Internship Report; University of Twente: Enschede, The Netherlands; University of Liverpool: Liverpool, UK, 2014; p. 73. [Google Scholar]
  35. Robertson, A.; Jonkman, J.; Masciola, M.; Song, H.; Goupee, A.; Coulling, A.; Luan, C. Definition of the Semisubmersible Floating System for Phase II of OC4; National Renewable Energy Lab. (NREL): Golden, CO, USA, 2014. [Google Scholar]
  36. ABS. Rules for Building and Classing—Single Point Moorings; American Bureau of Shipping: New York, NY, USA, 2021. [Google Scholar]
Figure 1. Rendering of the analyzed aquaculture ship.
Jmse 10 01729 g001
Figure 2. Flowchart of fully coupled analysis method.
Jmse 10 01729 g002
Figure 3. Sketch of the integrated aquaculture ship: (a) side view of the aquaculture ship; (b) top view of the aquaculture ship.
Jmse 10 01729 g003
Figure 4. Relative importance of mass, viscous drag, and diffraction forces on marine structures.
Jmse 10 01729 g004
Figure 5. Hydrodynamic model in frequency domain analysis.
Jmse 10 01729 g005
Figure 6. An ideal knotless net.
Jmse 10 01729 g006
Figure 7. Nets with different normal vectors.
Jmse 10 01729 g007
Figure 8. Definition of character angles, local elemental velocities, and forces.
Jmse 10 01729 g008
Figure 9. Definition of freedom and direction of wind, current, and wave.
Jmse 10 01729 g009
Figure 10. Surge RAOs of the aquaculture ship in the case: (a) wave direction = 90°; (b) wave direction = 45°; (c) wave direction = 0°.
Jmse 10 01729 g010
Figure 11. Heave RAOs of the aquaculture ship in the case: (a) wave direction = 90°; (b) wave direction = 45°; (c) wave direction = 0°.
Jmse 10 01729 g011
Figure 12. Roll RAOs of the aquaculture ship in the case: (a) wave direction = 90°; (b) wave direction = 45°; (c) wave direction = 0°.
Jmse 10 01729 g012
Figure 13. Pitch RAOs of the aquaculture ship in the case: (a) wave direction = 90°; (b) wave direction = 45°; (c) wave direction = 0°.
Jmse 10 01729 g013
Figure 14. Power generation comparison of Model 1, Model 2, and Model 3.
Jmse 10 01729 g014
Figure 15. Time histories of motion in 6 DOF of Model 1, Model 3, and Model 4: (a) surge motion; (b) sway motion; (c) heave motion; (d) roll motion; (e) pitch motion (f) yaw motion.
Jmse 10 01729 g015
Figure 16. Time histories of mooring performances in 6 DOF of Model 1, Model 3, and Model 4: (a) anchor lift; (b) laid length; (c) cable force.
Jmse 10 01729 g016
Figure 17. Time histories of motions and mooring performances in 6 DOF of Group 1: (a) surge motion; (b) sway motion; (c) heave motion; (d) roll motion; (e) pitch motion (f) yaw motion; (g) anchor lift; (h) laid length; (i) cable force.
Jmse 10 01729 g017aJmse 10 01729 g017b
Figure 18. Time histories of motions and mooring performances in 6 DOF of Group 2: (a) surge motion; (b) sway motion; (c) heave motion; (d) roll motion; (e) pitch motion (f) yaw motion; (g) anchor lift; (h) laid length; (i) cable force.
Jmse 10 01729 g018aJmse 10 01729 g018b
Figure 19. Time histories of motions and mooring performances in 6 DOF of Group 3: (a) surge motion; (b) sway motion; (c) heave motion; (d) roll motion; (e) pitch motion (f) yaw motion; (g) anchor lift; (h) laid length; (i) cable force.
Jmse 10 01729 g019
Table 1. Principal dimensions of the vessel.
Principal Dimensions of the VesselValue
Length over all450 m
Beam60 m
Depth37 m
Draft30 m
Displacement206,830.05 tonnes
Volume of net cage102,666.67 m3 × 4
Table 2. Properties of the wind turbine.
Properties of the Wind TurbineValue
Rating5 MW
Rotor Orientation, ConfigurationUpwind, 3 Blades
ControlVariable Speed, Collective Pitch
DrivetrainHigh Speed, Multiple-Stage Gearbox
Rotor, Hub Diameter126 m, 3 m
Hub Height90 m
Cut-In, Rated, Cut-Out Wind Speed3 m/s, 11.4 m/s, 25 m/s
Cut-In, Rated Rotor Speed6.9 rpm, 12.1 rpm
Rated Tip Speed80 m/s
Overhang, Shaft Tilt, Precone5 m, 5°, 2.5°
Rotor Mass110,000 kg
Nacelle Mass240,000 kg
Tower Mass347,460 kg
Coordinate Location of Overall CM(−0.2 m, 0.0 m, 64.0 m)
Table 3. Characteristics of the nets of the analyzed aquaculture ship.
ItemsValues
0.16
dw(m)0.8
L(m)10
Twine density (kg/m3)1140
Cd (θ= 0°)0.20
Cd (θ= 90°)0.04
Cd (θ= 60.255°)0.12
Table 4. Properties of mooring cables of the analyzed aquaculture ship.
ItemsValues
Length of Wire Rope610 m
Submerged Weight of Wire Rope448.82 kg/m
Nominal Diameter of Wire Rope0.13 m
Length of Chain80 m
Submerged Weight of Chain70 kg/m
Nominal Diameter of Chain0.157 m
Initial Distance695 m
Table 5. Characteristics of an irregular wave for linearization of drag force.
Characteristics of Irregular WaveValue
Wave TypeJONSWAP
Start Frequency0.3 rad/s
Finish Frequency2.11 rad/s
Gamma3.3
Significant Wave Height5 m
Peak Frequency0.5236 rad/s
Peak Period12 s
Table 6. Characteristics of irregular waves for linearization of drag force.
Model 1Model 2Model 3Model 4
Simulate ToolFAST + AQWAFAST + AQWAFAST + AQWAAQWA
FixityFree to MoveFixedFree to MoveFree to Move
Servo StrategyBlade PitchBlade PitchVariable SpeedNot Available
Wind TypeSteady WindSteady WindSteady WindNot Available
Wind DirectionNot Available
Wind Speed11.4 m/s11.4 m/s11.4 m/sNot Available
Wave TypeRegular WaveRegular WaveRegular WaveRegular Wave
Wave Height5 m5 m5 m5 m
Wave Period8 s8 s8 s8 s
Current TypeSteady CurrentSteady CurrentSteady CurrentSteady Current
Current Direction
Current Speed0.5 m/s0.5 m/s0.5 m/s0.5 m/s
Table 7. Environment conditions for time domain simulations in irregular waves.
EC No.Current SpeedSignificant Wave HeightSpectral Peak Period
EC10 m/s4 m8 s
EC20.5 m/s4 m8 s
EC31 m/s4 m8 s
EC40 m/s2 m8 s
EC50 m/s8 m8 s
EC60 m/s4 m4 s
EC70 m/s4 m12 s
Table 8. Maximum of anchor lift.
EC No.Maximum of Anchor Lift (N) (in 3500~4000 s)
EC151.809
EC294.681
EC3117.963
EC416.329
EC52664.593
EC622.706
EC7224.344
Table 9. Average value of motions and mooring performances of each environment condition.
EC No.Surge (m)Sway (m)Heave (m)Roll (°)Pitch (°)Yaw (°)Laid Length (m)Tension Force (N)
EC12.1540.4600.0880.0320.0460.147294.6384.25 × 106
EC22.1470.3510.0850.0330.0460.113279.9454.57 × 106
EC32.1650.2670.0860.0320.0460.086246.9445.37 × 106
EC41.5720.9160.9160.0320.0460.290300.2424.11 × 106
EC53.7140.0970.0970.0320.0470.032272.5634.82 × 106
EC61.3950.4590.0900.0340.0450.148293.2664.26 × 106
EC71.5930.5710.0870.0320.0450.182296.0294.22 × 106
Table 10. Significant value of motions and mooring performances of each environment condition.
EC No.Surge (m)Sway (m)Heave (m)Roll (°)Pitch (°)Yaw (°)Laid Length (m)Tension Force (N)
EC13.1320.4760.1760.0330.0740.150325.6474.93 × 106
EC23.1460.3550.1520.0350.0720.114307.1975.19 × 106
EC33.3490.2690.1360.0340.0680.088284.0676.29 × 106
EC42.4370.9810.9810.0330.0600.308313.0434.38 × 106
EC55.3920.0990.0990.0320.1020.032341.4666.49 × 106
EC62.0580.4760.0930.0370.0460.153310.2604.62 × 106
EC72.9060.6050.4900.0340.1490.189329.4884.94 × 106
Publisher’s Note: MDPI stays neutral with regard to jurisdictional claims in published maps and institutional affiliations.

