
Influences of Tidal Effect on Upper Ocean Responses to Typhoon Passages Surrounding Shore Region off Northeast Taiwan
Department of Earth Science, National Taiwan Normal University, No.88, Sec. 4, Tingzhou Rd., Wenshan District, Taipei 11677, Taiwan
*
Author to whom correspondence should be addressed.
J. Mar. Sci. Eng. 2022, 10(10), 1419; https://doi.org/10.3390/jmse10101419
Submission received: 8 August 2022
/
Revised: 23 September 2022
/
Accepted: 25 September 2022
/
Published: 3 October 2022
(This article belongs to the Section Coastal Engineering)
Abstract
:In this study, the Regional Ocean Modelling System (ROMS) with a spatial resolution of 2 km is used to understand the cooling responses in the sea northeast of Taiwan associated with multiple typhoons. Sea level measurements derived from in situ tidal gauges and continuous temperature measured by a moored buoy deployed at Longdong were used to validate the model’s performance. Six far-field typhoons with similar tracks, namely, Utor (2001), Dujuan (2003), Sanvu (2005), Nanmadol (2011), Usagi (2013), and Meranti (2016), were systematically investigated to demonstrate the influences of tidal effect on upper ocean responses to typhoon passages surrounding shore regions. After integrating tidal forcing, model-simulated cold wakes behind typhoon passages were essentially enhanced. Compared with observations, the cold wakes were reproduced more realistically. Tides could promote a cooling response through the following potential mechanisms: (1) tidal mixing destratifies the water column, (2) a stronger northward current leads to a sharper bottom thermocline, (3) tidal residual currents (southward) drive the offshore-ward (downslope) bottom Ekman flow and lead to the overturning of cold bottom water and warm subsurface water, (4) the increase in bottom stress due to the interaction of tidal currents and bottom topography results in the destratification of the bottom water column, and (5) the wind–tide coupled effect. Nevertheless, the exact mechanism dominating the process of a typhoon–tide-induced stronger upper ocean response depends on different typhoon activities, tidal regimes, stratification, and bathymetry and needs further investigations. In this study, we suggest that including tidal effects is essential for the modeling of upper ocean responses to typhoon passages near the shore regions.
1. Introduction
Sea surface temperature (SST) variability responding to tropical cyclone (TC) passages has attracted much attention from the oceanic, atmospheric, metrological, and climatological communities [1,2,3,4,5,6,7,8,9] due to its possible effects on the typhoon’s characteristics, the regional weather system, the regional oceanic/ecological environment, and fisheries. A warm ocean has been regarded as an energy source for TC development [10,11,12,13]. Thus, upper ocean temperature variations in response to TC–ocean interaction ahead or just behind the passage of the eye center play a key role in TC intensity development [7,10,14,15,16].
Marginal seas connecting lands and open oceans cover a large range of the continental shelf region. These regions are hot spot regions for typhoons striking that directly influence people living in the coastal regions [17,18]. In addition to the extensive studies on ocean responses and the corresponding feedback in open oceans, some studies have paid attention to the response of shallow ocean water in coastal regions. However, limited attention has been paid to the influence of tides on the response to typhoons in the shelf regions [17,18,19,20]. In the majority of previous studies modeling upper ocean responses to typhoon passages, tides have mostly been excluded for easy interpretation or computational efficiency, even though the process occurred over continental shelves [15,19,21,22].
However, as noted in previous studies, the influences of stratification and bathymetry on tides/tidal currents are significant. For example, based on observations of a bottom mounted ADCP, Souza et al. [23] indicated that the presence of stratification modifies the vertical structure of the tidal ellipse characteristics. Bravo et al. [24] demonstrated the role of water column stratification and shelf width on baroclinic semidiurnal tidal currents by using current velocity observations from the continental shelves located in central Chile. Using high-frequency radar, Mandal et al. [25] investigated the interaction of tidal currents with bathymetry along the western Bay of Bengal and indicated that in the presence of stratification, the loss of tidal kinetic energy into turbulent processes is reduced. This results in the amplification of M2 tidal currents, consequentially.
The aforementioned studies bring out the urgent need to further study the importance of tide–typhoon interaction during stratification. In addition, at the present stage, influences of the tidal effects on upper ocean responses to typhoon passages can be systematically overlooked. Glenn et al. [15] indicated that wind-driven two-layer circulation in the stratified coastal ocean results in shear-induced mixing and leads to significant and rapid ahead-of-eye-center cooling. Their findings indicate that it is essential to include realistic coastal baroclinic processes in forecasts of storm intensity. Using the ocean model with tides as inputs, this study highlights the importance of tides by isolating high-frequency tidal signals and tide residual components from the mean circulation given in experiments without tidal forcing. Meanwhile, calculations of current and temperature differences between different experiments are used to demonstrate the extra responses resulting from tidal effects relative to mean environmental flows.
The paper is organized as follows: The model descriptions, experimental design, typhoon characteristics, and moored buoy data are introduced in Section 2. Section 3 validates the model simulations based on continuous temperature and sea-level changes. The main results and tidal effects on typhoon-induced cooling are presented in Section 4. Section 5 deals with the discussion of potential mechanisms about how the tide enhances cold wakes. Conclusions and remarks are given in Section 6.
2. Data and Methods
2.1. Typhoons
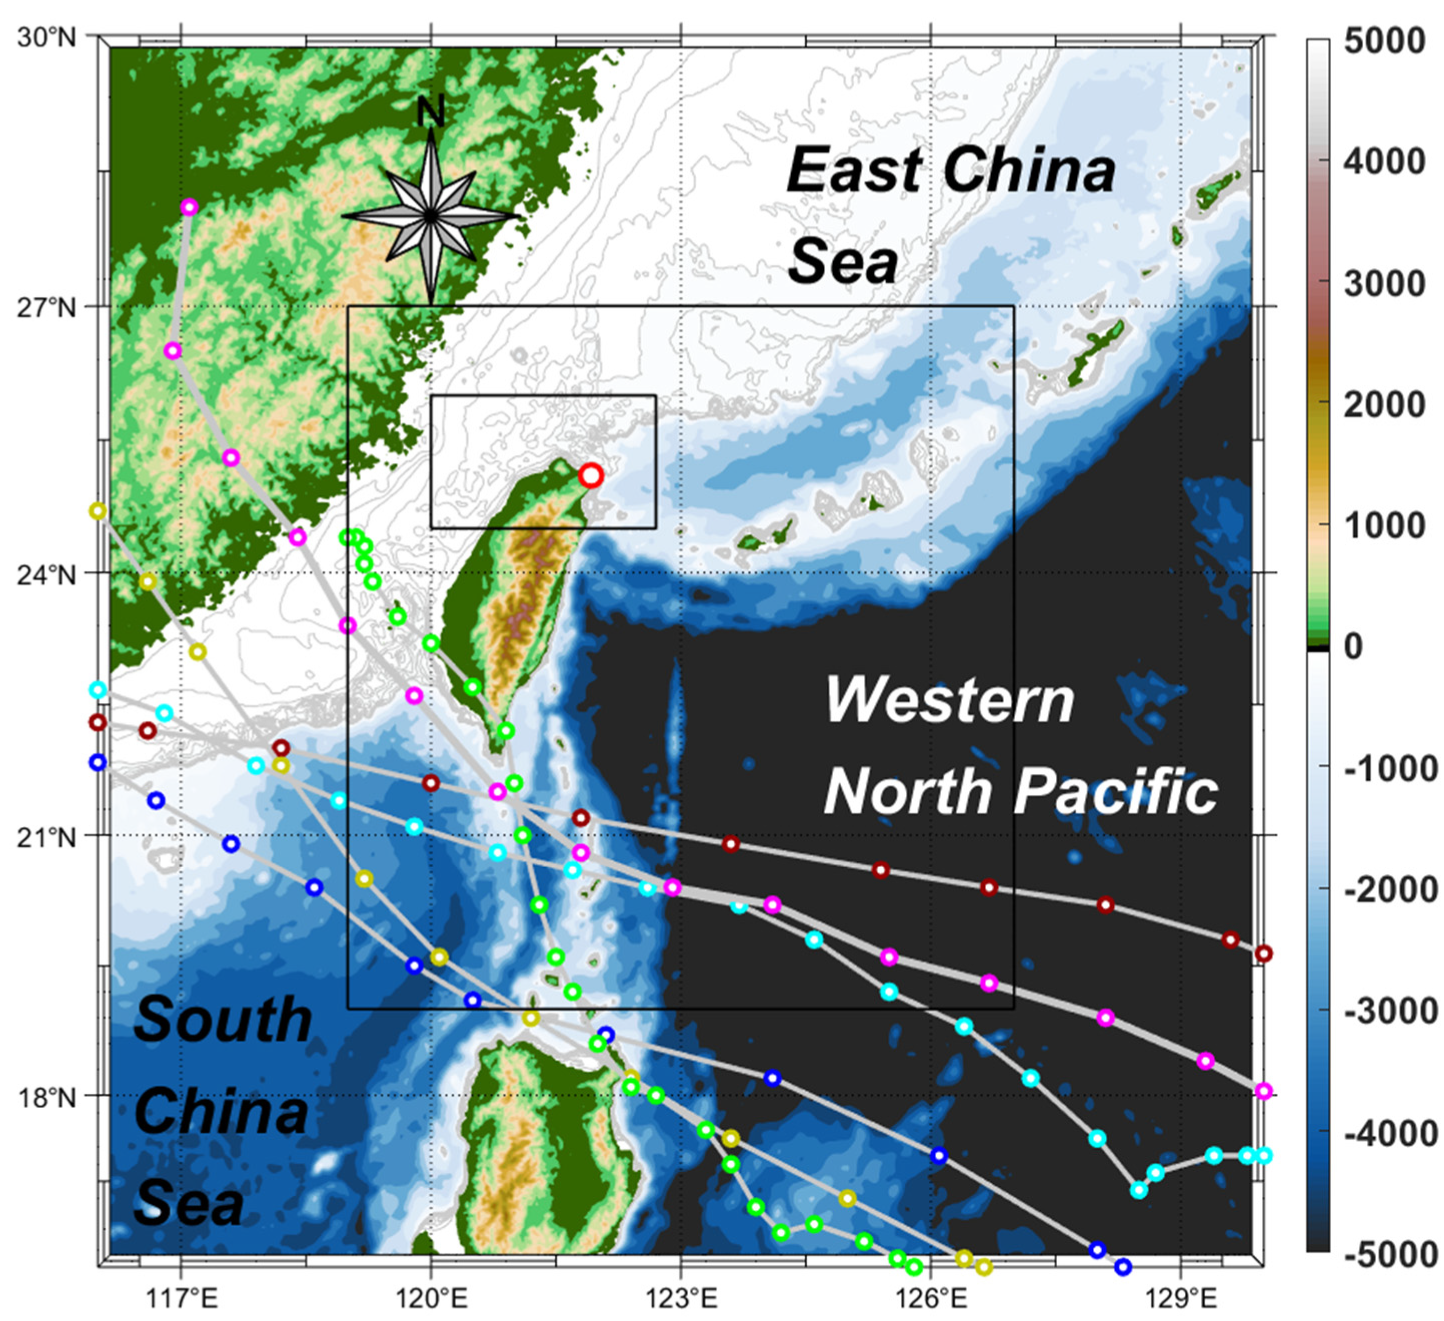
We selected six far-field typhoons that passed over Luzon Strait with similar trajectories from 2001 to 2018 for research. Far-field denotes that the positions of typhoon centers during their whole life periods are at least 300 km from our target cooling area, i.e., Longdong of northeast Taiwan. These typhoons were Utor (2001), Dujuan (2003), Sanvu (2005), Nanmadol (2011), Usagi (2013), and Meranti (2016). The time that they passed over Luzon Strait was mainly from July to September (Table 1). Among them, Meranti and Sanvu had the largest and smallest averaged maximum wind speeds, which were 58 and 20 ms−1, respectively. The moving paths of the six typhoons are shown in Figure 1. Additionally, detailed information about the six typhoons is listed in Table 1. These data are available from the Joint Typhoon Warning Center (JTWC) best track through https://www.metoc.navy.mil/jtwc/jtwc.html. (accessed on 10 March 2022).
2.2. Moored Buoy Data
SST can be measured either by satellite-based remote sensing or in situ measurements from floats, ships, or moored buoys [26,27]. Moored buoys record continuous and long-term time series of the SST at a certain site. Here, the long-term SST measurement record located at Longdong coast was provided by a 2.5-m discus-shaped moored buoy, which has been deployed by the Coastal Ocean Monitoring Center, National Cheng Kung University since 1998 [27]. SST was measured by a platinum resistance temperature detector, installed 0.6 m below sea surface. In addition, the buoy is located in near-coastal region (approximately 0.6 km off the Longdong coast with 23 m depth). The long-term measurement of SSTs by buoy covering the period from 1998 to 2017 can be accessed through https://doi.org/10.1594/PANGAEA.895002 (accessed on 20 May 2021).
2.3. Ocean Model Description and Experiment Design
Model simulation provides continuous and comprehensive understanding of certain physical process, relative to sparse observations provided either by a moored buoy or satellite-based snapshots. To understand the detailed progress of upper ocean variability surrounding Longdong to the passages of six far-field typhoons, regional ocean circulation was simulated using Regional Ocean Modeling System (ROMS). ROMS is a free-surface, primitive equation, curvilinear coordinate oceanic model. In ROMS, barotropic and baroclinic momentum equations are resolved separately. Additionally, a nonlocal, K-profile planetary boundary layer scheme was applied to parameterize subgrid-scale vertical mixing processes [28]. Here, nested-grid ROMS was implemented for keeping high spatial resolution to resolve small-scale circulations surrounding Longdong and complete a domain that can covey dynamical influences from the far-field typhoons simultaneously.
The parent domain covered the region from 19° N to 27° N and from 119° N to 127° E (Figure 1) with a horizontal resolution of approximately 6 km. The nested domain covered the region from 24.5° N to 26° N and from 120° E to 122.7° E, with a horizontal resolution of approximately 2 km. The parent and nested runs have a vertical gridding of 20 s-coordinate levels that were distributed unevenly for improved resolution for upper ocean [29]. Bathymetry was created by merging regional bathymetry of 500 m spatial resolution distributed by Ocean Data Bank, Taiwan, and ETOPO2 global ocean bottom topography. Additionally, momentum forcing was retrieved from hourly Modern-Era Retrospective analysis for Research and Applications version 2 (MERRA-2) winds with a grid resolution of 0.5 degree latitude × 0.625 degree longitude (https://disc.gsfc.nasa.gov/) (accessed on 10 November 2021), which is one of the most up-to-date wind forcing products.
Atmospheric fields, which were also obtained from MERRA-2, were applied for calculating net heat flux across the air–sea interface. They are air temperature, precipitation rate, relative humidity, incoming shortwave radiation, and outgoing longwave radiation with a spatial resolution of 0.5-degree latitude × 0.625-degree longitude. Data-assimilated HYbrid Coordinate Ocean Model (HYCOM) global solutions with 1/12-degree spatial resolution provided initial and lateral boundary conditions for ROMS (https://www.hycom.org/dataserver/gofs-3pt1/reanalysis) (accessed on 5 March 2021) [30]. The periods of model simulations for six different typhoon cases are listed in Table 1. In addition, outputs from the first two days of each experiment are excluded in the following analyses to avoid possible insufficient spin-up time. Detailed description about ROMS can be accessed in Shchepetkin and McWilliams [31,32,33]. Validations for storm simulations using ROMS can be seen in Zheng et al. [6,33], Kuo et al. [16], and Shen et al. [34].
3. Validations
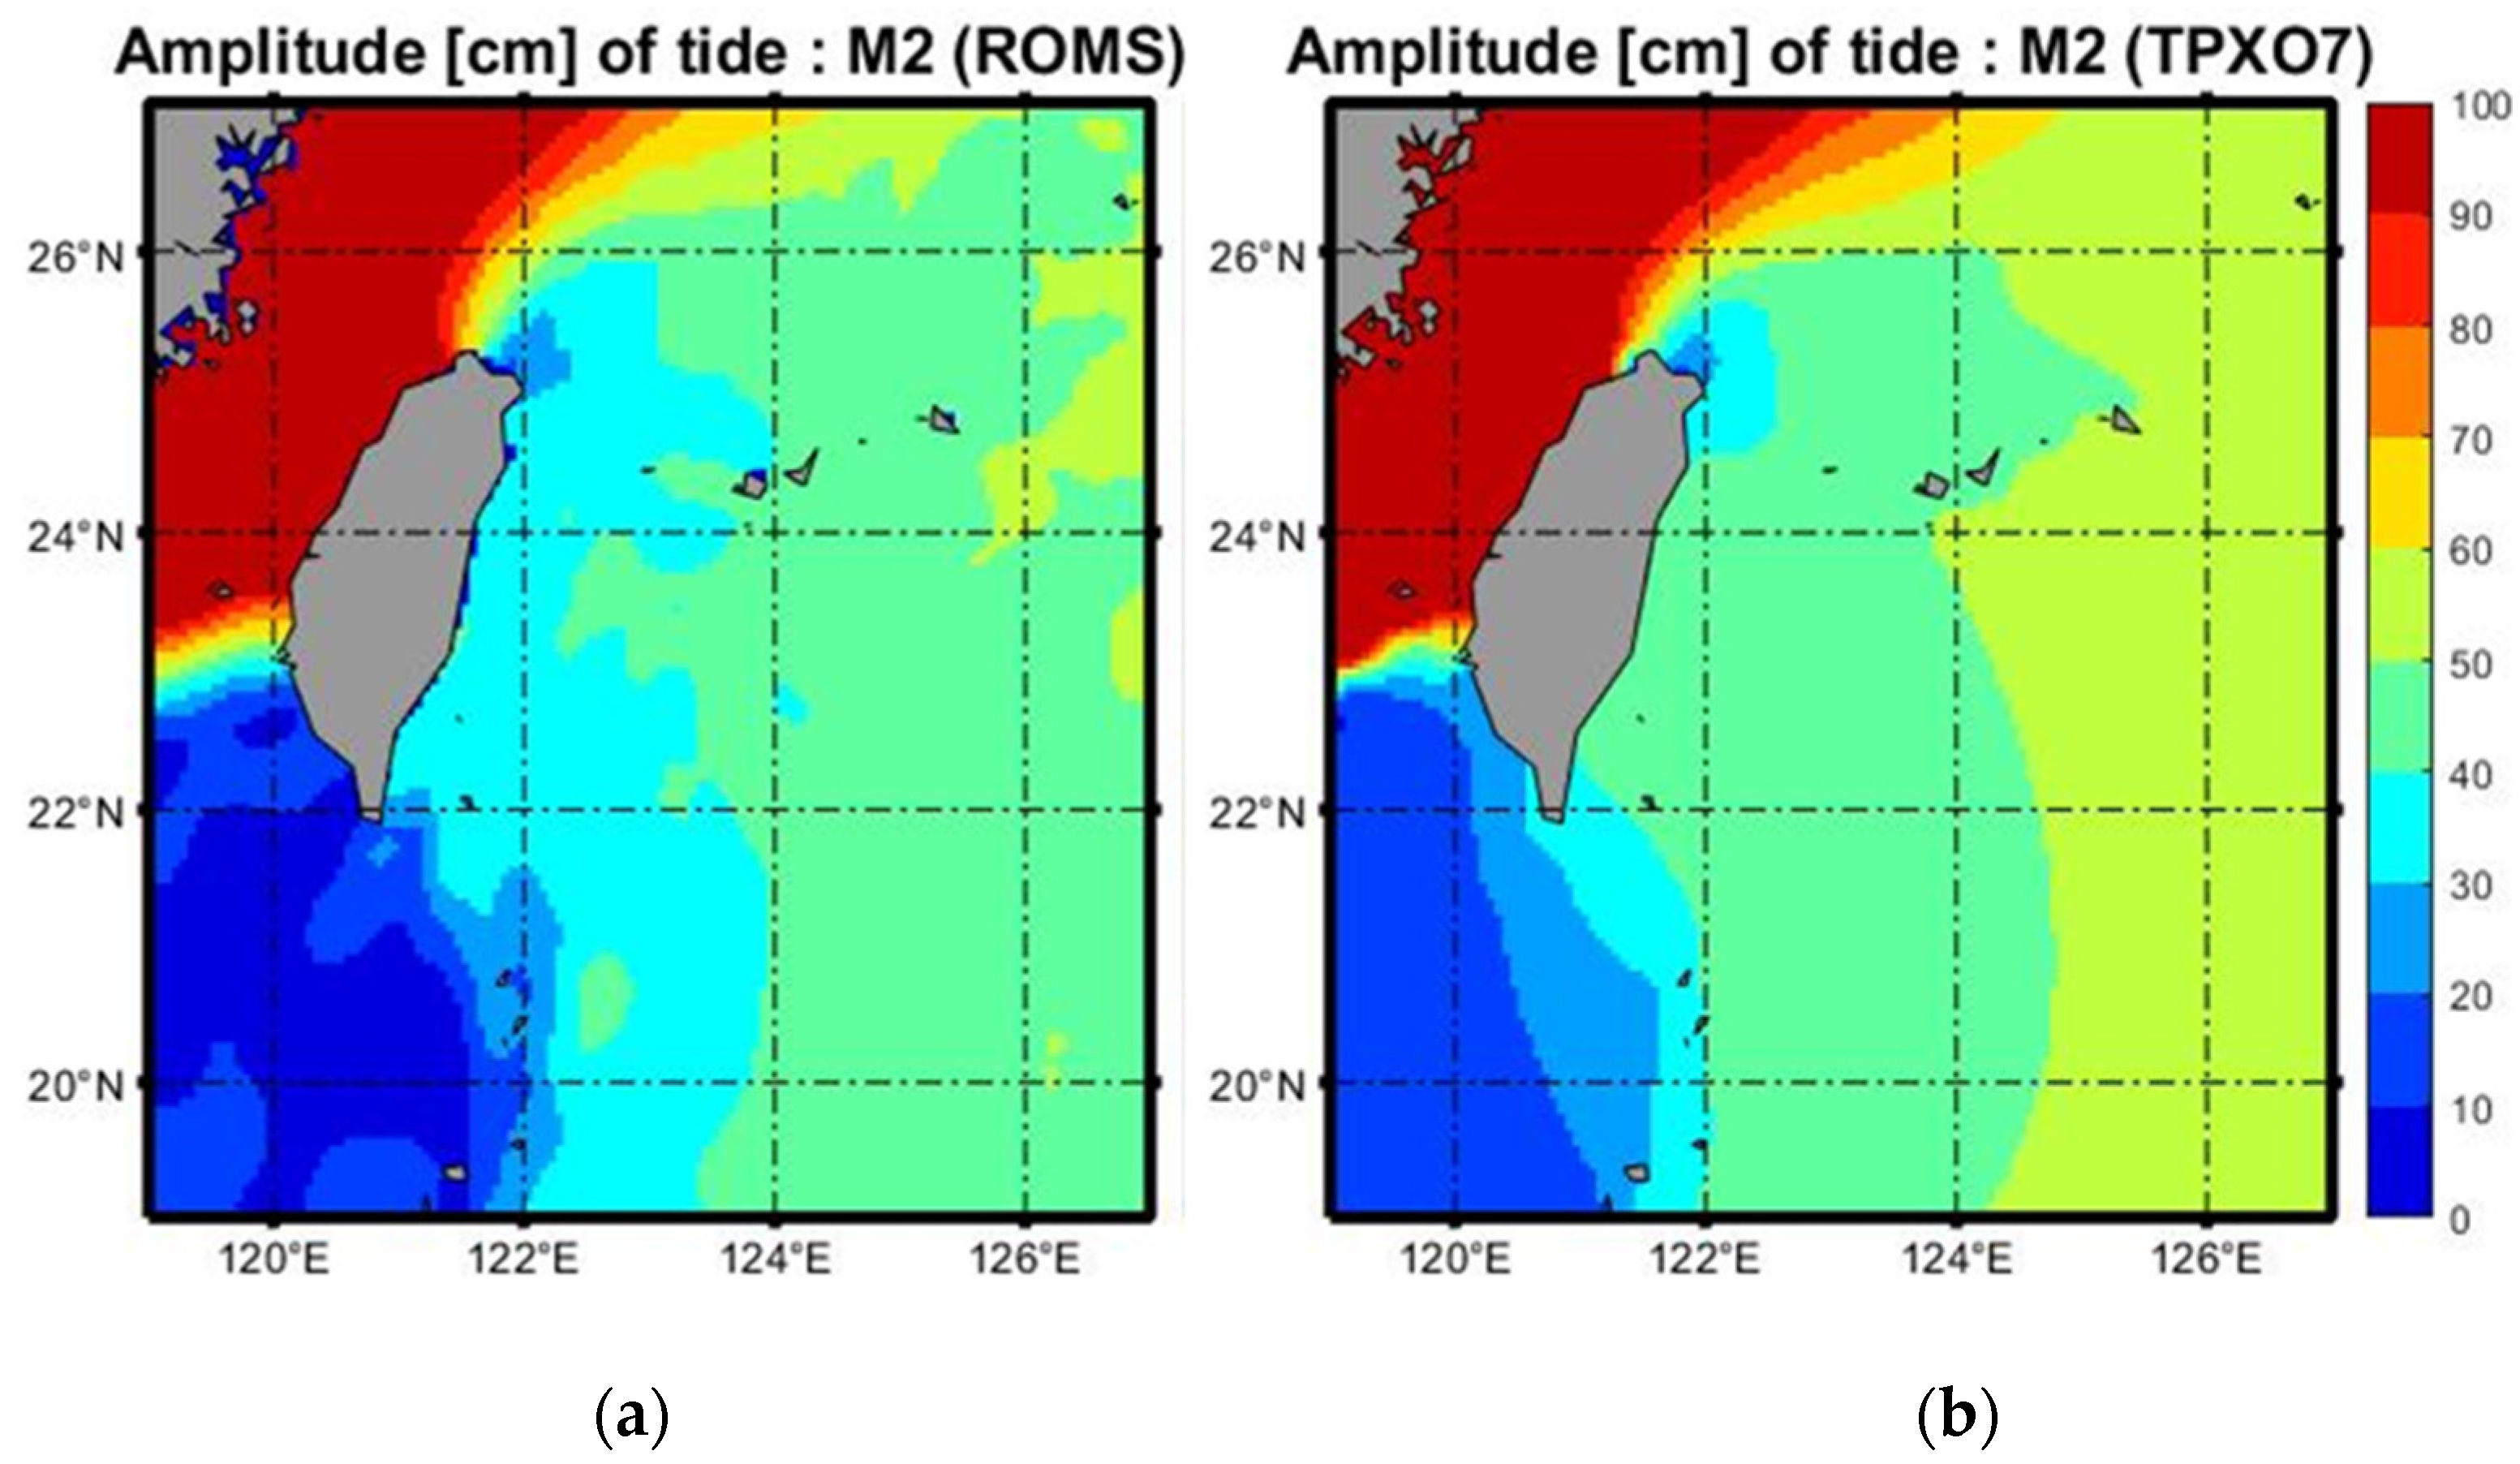
In this study, tidal forcing was considered a key factor dominating the regional oceanic dynamics; thus, on the basis of the method described in previous studies [35,36], different tidal constituents were integrated into ROMS simulations from their lateral boundaries. Tidal constituents, including M2, S2, N2, K2, K1, O1 P1, Q1, Mf, and Mm were provided by the Oregon State University global models of ocean tides TPXO7 [37]. The right panel of Figure 2 shows the amplitude of the most energetic M2 constituent given by TPXO7. The left panel is the amplitude of the M2 tide simulated in ROMS and extracted by program s_tide during the passage of Utor. The same comparisons for the other five typhoon cases show consistent patterns (see Figure S1 in online Supplementary Materials, OSM). Overall, simulations, including tidal forcing, reproduced the key tidal component surrounding the study area, although including the ocean currents in model simulations contributes to a minor modification of the amplitude (see Figure 2a).
Subsequently, model-simulated sea-level changes during six typhoon passages were compared with observed sea-level changes retrieved from the Longdong tidal gauge. Figure 3 shows the comparison of sea-level changes derived from the model simulation (red lines) and tidal gauge measurements (black circle lines) (25.098° N, 121.923° E, https://ocean.cwb.gov.tw/V2/data_interface/datasets) (accessed on 10 November 2020), respectively. The root mean square error (RMSE) among sea-level data sources are 0.12, 0.13, 0.14, 0.10, 0.12, and 0.08 m for Utor (2001), Dujuan (2003), Sanvu (2005), Nanmadol (2011), Usagi (2013), and Meranti (2016), respectively. In addition, the model–data agreement is fairly good with correlation coefficients 0.89, 0.91, 0.85, 0.94, 0.89, and 0.94 for Utor (2001), Dujuan (2003), Sanvu (2005), Nanmadol (2011), Usagi (2013), and Meranti (2016), respectively.
4. Tidal Effect on Typhoon-Induced Cold Wakes with vs. without Tide
Figure 4 shows the directly measured temperature at 0.6 m below sea surface (red lines) by the moored buoy temperature meter deployed at Longdong (121.923° E, 25.098° N, black dot in Figure 1), together with the model-simulated SST (blue lines) during six typhoon passages. The model simulations show systematically weak typhoon-induced cold wakes (TICWs) near the sea surface relative to the moored buoy measurements. Temperatures differences between both data sources in typhoons Utor (2001), Dujuan (2003), Sanvu (2005), Nanmadol (2011), Usagi (2013), and Meranti (2016) were 6.6 °C, 5.0 °C, 6.6 °C, 8.8 °C, 7.0 °C, and 6.8 °C, respectively. The simulations of TICWs with mean circulation dynamics (without tidal forcing) by ROMS interestingly failed to reproduce near-surface TICWs adequately, relative to its previously good ability to simulate upper ocean responses to typhoon passages in open oceans, such as those demonstrated in a series of previous studies [6,16,33,34]. Thus, further analyses are needed to unveil the possible reason(s) therein.
Figure 5 shows the same comparison but for the results derived from model simulations with tidal forcing as inputs (EXPwithTide). Model-simulated TICWs surrounding the sea surface show systematical improvement relative to the results of TICWs simulated in experiments without including tidal forcing (EXPSTD, Figure 4). Temperature differences in the maximum SST drops relative to in situ measurements were largely reduced to 1.3 °C, 0.2 °C, 4.4 °C, 0.3 °C, 0.5 °C, and 0.3 °C for typhoons Utor (2001), Dujuan (2003), Sanvu (2005), Nanmadol (2011), Usagi (2013), and Meranti (2016), respectively. With tide included, the mean temperature differences in the maximum SST drops between the simulations and in situ measurements were largely reduced from 6.80 °C to 1.17 °C. After integrating tidal forcing, model-simulated cold wakes behind typhoon passages were essentially enhanced. In addition, the cold wakes were reproduced more realistically, compared to observations.
Figure 6 shows the maximum TICWs and sea surface currents during six typhoon passages (Figure 6a–f). The high-frequency tidal oscillations in SST and current fields are removed using a 42-h low-pass filter (e.g., de-tided in Ko et al. [21]). Winds are overlapped in white arrows. Simultaneously, to help identify the influences of tide on TICWs in the seas around Taiwan, the corresponding model results without tidal forcing are also shown in the right (Figure 6g–l). Comparisons between Figure 6a–f and Figure 6g–l revealed that all TICWs were largely enhanced by tides. Among all six typhoon cases, the enhancement of the TICW off northeast Taiwan in typhoon case Utor attained more than 5 °C, which is almost two times that of its original cooling in the simulation without tidal forcing. This result is consistent in all six typhoon cases; in other words, including tide seems to play a consistently positive role in the typhoon-induced cooling responses surrounding shore regions. Thus, the question of how tide enhances cold wakes strongly draws our attention. In the next section, potential mechanisms, which might enhance TICWs through tidal effects, are elucidated and discussed.
5. Potential Mechanisms of How Tide Enhances Cold Wakes
Analysis brings out the key question of why EXPwithTide leads to stronger cooling. In general, tidal mixing sourced from either barotropic or baroclinic tidal currents destratifies the entire water column, which aids upwelling by moving up farther along the slope. This process is straightforward and well noted in Ko et al. [21]. Subsequently, stronger upwelling provides a favorable environment for a TC, inducing a stronger cooling response by uplifting more cold water into the subsurface. In addition to this mechanism, other possible mechanisms allowing the further enhancement of TICWs are elucidated in this section.
5.1. Stronger Current Leads to Sharper Bottom Thermocline
Figure 7 shows the transects of differences in temperature (in color shadings) and alongshore (northward) currents (in contours) of experiments EXPSTD and EXPwithTide (EXPwithTide − EXPSTD) corresponding to their maximum coolings to Utor’s passage (e.g., Figure 6a,g). The location of the zonal transect is shown in Figure 6a. Red and green lines denote the positions of the bottom thermocline (denoted by 20 °C isotherms in bold contours) corresponding to EXPwithTide and EXPSTD, respectively.
Current differences (EXPwithTide − EXPSTD) show that an extra (or stronger) northward flow appeared over the continent slope surrounding Longdong in the experiment including tidal forcing relative to the mean flow run. Simultaneously, a sharper bottom thermocline emerged and showed great consistency with the stronger cooling (~3–5 °C) appearing 0–30 km from the coast. The transect of currents and temperature differences demonstrates the possible relationship between the uplift of the bottom thermocline and the stronger northward current passing east of Longdong, as well as the consequential stronger TICWs surrounding the sea surface near by the Longdong site.
The dynamic linkage between the strong alongshore flow and the uplift of subsurface cold water can be explained by the geostrophic adjustment of the temperature field reacting to the presence of a strong current (see Figure 8 and Tomczak and Godfrey [38]). According to Tomczak and Godfrey [38], this upwelling is not related to the wind. Instead, it is a result of the thermocline slope across a current. The oceanic temperature field reacts to the presence of a strong current by adjusting to geostrophic equilibrium. Since isotherm depths on the oceanic side of the current cannot change, this process leads to a steep rise in the thermocline from the ocean towards the coast. At the same time, the uplifted subsurface cold water feeds in the cooling feature revealed in the SST responses (as shown in Figure 6a and Figure 7).
5.2. Stronger Bottom Stress, Ekman Flow Leads to Destratification of Bottom Water Column
Figure 9 shows the model-simulated bottom layer kinetic energy with and without tidal forcing in case Utor (2001). After including tidal forcing, the bottom kinetic energy was essentially enhanced. According to Ko et al. [21], this was attributed to the enhancement of the interior flow in the bottom layer resulting from tidal currents and bottom topography. A similar scenario can be seen in Webb et al. [39], indicating that changes in the barotropic circulation can then alter the turbulent bottom stress. Subsequently, this bottom stress can drive extra bottom Ekman transport, which leads to the destratification of the bottom water column. In brief, tides destratify bottom water columns through orographic lifting over bottom features and enhance bottom stress. Weak bottom stratification allows the strengthening of upwelling, and thus, the strong TICWs respond to consistent typhoon wind forcing. On the contrary, if tidal forcing is excluded, hot spots of bottom kinetic energy diminish markedly; meanwhile, stratification strengthens and TICWs decrease. Similar analysis results on the other five typhoon cases are demonstrated in Figure S3 of OSM.
5.3. Residual Terms
Tidal residuals, an extra and low-frequency component, resulted from high-frequency oscillations due to tides because floods lift and mix cold waters with surface waters in half of an irreversible tidal cycle, but the ebb in another half of the tidal cycle cannot return those waters back to the original position. To clarify the possible influence of tidal residuals on the TICWs, Figure 10 shows depth-averaged tidal residual currents superimposed on tidal residual SST, which were composited from all six typhoons. Here, tidal residuals were derived by subtracting the time average of the complete tidal cycle from the simulation without tidal forcing (EXPSTD) from the same result but derived from simulation with tidal forcing (EXPwithTide) e.g., [21].
Again, all variables are averaged vertically to remove deep ocean features, such as internal tide residuals [21]. Surrounding Longdong is a tidal residual current that is mainly southward, which is attributed to the imbalance of the southward and northward momentum flux carried by the ebb tide and flood tide, respectively, surrounding northeast Taiwan [40]. Variations in sea level during a complete tidal cycle surrounding the Longdong buoy station confirms the aforementioned inference (Figure not shown). By contrast, enhanced cold SST anomalies (residual SST) appeared off northeast Taiwan, accompanied with the occurrence of the southward tidal residual current. The shore-normal transect of tidal residuals (Figure 11) reveals subsurface features and helps the interpretation of possible linkage between the southward residual current and cold residual SST anomalies.
Along the transect, the tidal residual current composite is mainly southward throughout the water column. Meanwhile, a distinct seaward, downslope bottom Ekman flow appears. According to Figure 2 in Webb et al. [39], the anomalous barotropic flow is slowed down by the bottom friction in the effective bottom Ekman layer, inducing an anomalous onshore bottom Ekman flow due to an imbalance between the pressure gradient and Coriolis force. Here, our results show a great consistency but in a different phase (southward (residual) barotropic flow leads to offshore-ward/downslope bottom Ekman flow).
By contrast, above the downslope bottom Ekman flow is a distinct onshore flow aloft appearing at the subsurface (~40 m depth). The synergy of the downslope (seaward) bottom Ekman flow and this aloft landward returning flow forms an anticyclonic convection along the transect over the shelf, overturning the bottom-deep cold water and subsurface warm water. The shoaling of deep-cold water was well documented in the transect of composited tidal residual terms (Figure 11), which provide an efficient and favorable environment for TC, causing strong TICWs through the mechanisms of entrainment or vertical mixing [6,33,41].
5.4. Wind–Tide Coupled Effect
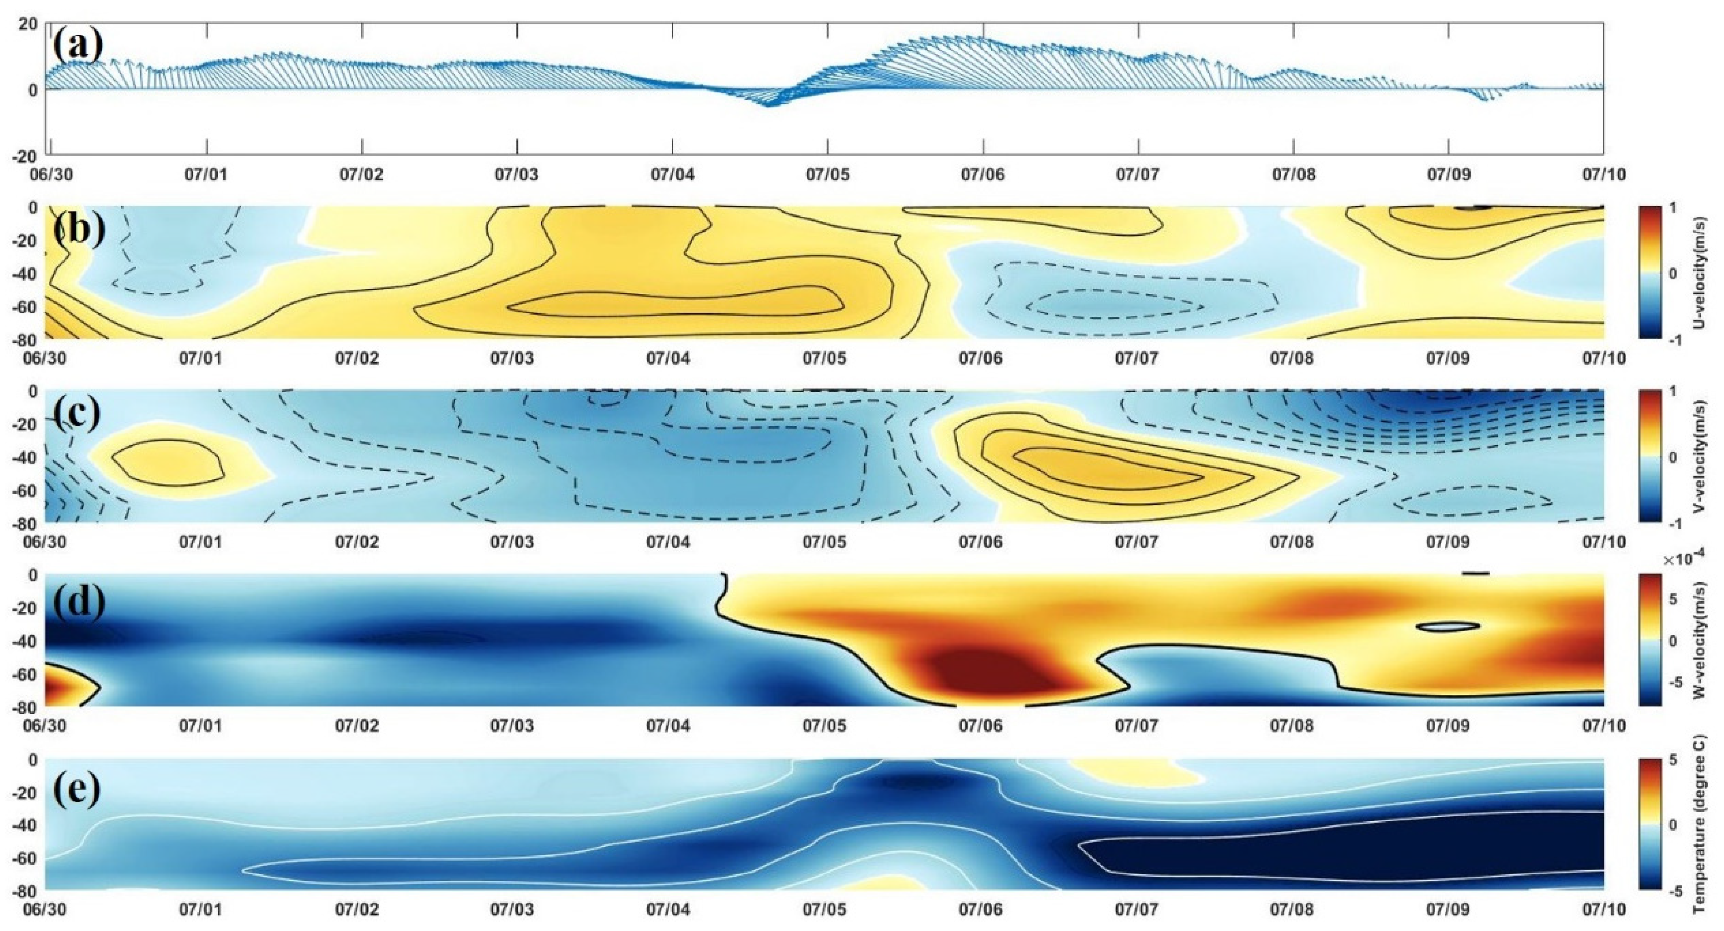
Relative to the aforementioned mechanisms that are relatively straightforward, the effects resulting from wind–tide coupling (WTC) are further differentiated. Here, a series of actions were applied to the model outputs to retrieve the components sourced from WTC. First, the result of EXPSTD was subtracted from the result of EXPwithTide. This subtraction operation essentially removes tidal forcing, the mean current and wind forcing while also removing the influences of the mean current (background current) and typhoon-induced wind forcing on the upper ocean. At the same time, the residual reflects the influences of the pure tidal effect and WTC. Afterward, a 42-h low-pass filter was applied to the residuals to remove high-frequency tidal oscillations. The final residual signal is assumed to mainly reflect the influence of WTC. Figure 12 shows the effect of WTC on the upper ocean in the variations of three-dimensional velocity fields (u, v, w) and temperature during the passage of typhoon Utor at the Longdong site (from upper to bottom panels), as well as the corresponding time-varying local wind forcing (top panel). The same analyses were conducted for the other five typhoon cases, as demonstrated in Figure S4 of OSM.
Although without direct wind forcing and high-frequency tidal oscillation, WTC still leads to essential influence. The effect of WTC leads to a much stronger sea surface cooling (see Figure 12e and Figure S4 in OSM), which also helps explain how tide enhances the TICWs. For case Utor, the enhancement of sea surface cooling resulted from the WTC effect attaining almost 5 °C.
Surprisingly, in addition to the positive influence on TICWs near the sea surface, WTC triggers low-frequency and continuous subsurface cooling (~40–80 m depth) signals (see Figure 12 and Figure S4 in OSM). Subsurface cooling reached up to 7–9 °C, which is almost twice the enhanced cooling at the sea surface and is an important cold-water source entering the subsurface. The possible source and mechanism leading to the strong and continuous subsurface cooling are unveiled here; however, where that low temperature water goes/dissipates and its role in regional oceanic environment changes deserve further explorations in separate studies.
The core position of subsurface cooling (see Figure 12e) shows great consistency with the strong subsurface cooling (shown in Figure 11), which resulted from the overturning of bottom-deep cold water and subsurface warmer water tied to the down-sloping bottom Ekman flow. As shown in Figure 12, in particular for the period before the TC passage, the subsurface cooling appeared, accompanied by a negative (southward) anomalous flow (Figure 12c) and downslope bottom Ekman flow (Figure 12d), which are three key features comprising the complete process of the tidal residual effect demonstrated in Figure 11 and Section 5.3. This result implies that the WTC effect enhances the TICWs by combining a continued tidal residual effect (causing strong subsurface cooling) and transiently strong wind forcing just underlying the TC passage. Meanwhile, it also suggests that the tidal residual effect occurred persistently throughout the TC passages.
In addition to the stronger sea surface cooling and marked subsurface cooling, another distinct feature that appeared consistently in all six typhoon cases is a strong upwelling (see Figure 12d and fourth panels of (a–e) in Figure S4 in OSM), which occurred just behind the typhoon passage. Each time, before the occurrence of this strong upwelling, the northward current was distinctly enhanced (see all v component velocities in Figure 12 and Figure S4). The robust causal relationship between strong northward currents and consequential upwelling brought us back to the mechanism of “strong current leads to strong subsurface upwelling and shoaling of subsurface cold water.” As shown in the transect in Figure 7, the comparison of green and red lines not only documents well the uplift of cold subsurface water due to the strong current (through the mechanism shown in Figure 8), but also shows great consistency with the depth where the strongest upwelling occurred (centered at 40–80 m below the sea surface, see all w component velocities in six typhoon case simulations).
In short, the time-varying velocities in three dimensions and the corresponding temperature changes responding to WTC reveal a continuous progress related to mechanisms of “tidal residuals” before TC passages and “strong current leads to sharp bottom thermocline” just behind TC passages, as well as strong sea surface cooling associated with the transient coupling of strong TC wind forcing and a continuous tidal residual effect. In other words, WTC further enhances the mechanisms documented in Section 5.1 and Section 5.3 and thus provides a conducive environment for a TC triggering strong TICWs (e.g., Figure 12 and Figure S4).
6. Conclusions and Remarks
TCs are extreme storms that affect coastal communities. However, relative to the extensive studies on the ocean responses and corresponding feedbacks in the open oceans, the linkages between TC wind forcing and ocean dynamics in the shore region connecting lands and open oceans remain poorly understood. In the majority of previous studies modeling upper ocean responses to typhoon passages, tides have mostly been excluded for computational efficiency and easy interpretation [15,19,21,22]. Thus, limited attention was paid to the influence of tides on the response to typhoons in the shelf regions [17,18,19,20].
By conducting numerical experiments based on ROMS, this study highlighted the importance of tides on the upper ocean response to TC passages by isolating high-frequency tidal signals and/or tidal residual components from the mean circulation given in the experiments without tidal forcing. Meanwhile, measurements of sea levels derived from in situ tidal gauges and continuous temperature measured by a moored buoy deployed at Longdong were used to validate the model’s performance. After conducting a series of designed experiments and analyses, the influences of tidal effect on upper ocean responses to typhoon passages surrounding shore regions was demonstrated.
By including the tidal force, model-simulated cold wakes behind typhoon passages were enhanced. Meanwhile, compared with observations, the cold wakes were reproduced more realistically. Compared with in situ measurements, averaged differences between simulations and ground truths were largely reduced from 6.80 °C to 1.17 °C after integrating tidal force entering into model simulations, suggesting that the tidal effect is essential for the modeling of upper ocean responses to typhoon passages near the shore regions and should not be neglected in related studies. It is worth nothing that mechanical mixing from waves could be significant. No wave mixing might contribute to the results. However, due to the inadequate treatment of the surface roughness length at the present stage [16,42], the inclusion of wave effects is a topic requiring further research and is beyond the scope of this study.
Our results show that tide could promote TICWs through the following potential mechanisms: (1) tidal mixing destratifies the water column, (2) in-phase of flood or ebb flow and wind-driven northward current leads to a sharp bottom thermocline, (3) tidal residual currents (southward) drive the offshore-ward (downslope) bottom Ekman flow and lead to the overturning of cold bottom water and warm subsurface water, (4) the increase in bottom stress due to the interaction of tidal currents and bottom topography results in the destratification of the bottom water column, and (5) the WTC effect. Nevertheless, the exact mechanism dominating the process of typhoon–tide-induced strong TICWs corresponding to certain TC events depends on the individual typhoon activities, tidal regimes, stratification, and bathymetry and needs further investigations.
In addition to the positive influence of including the tide to TICWs near the sea surface, a continuous and strong subsurface cooling (reaching up to 7–9 °C), which is an important cold water source entering the subsurface, was found in all typhoon cases. The extra subsurface cooling resulting from WTC is a low-frequency, continuous, and strong cold-water source directly affecting the regional oceanic environment. Where the low-temperature water flows and dissipates, as well as its role in regional oceanic environment changes, deserve in-depth investigations in separate studies. On the other hand, the influence of strong near-inertial internal waves observed after the typhoon passage in the continental shelf [43] on the process of typhoon–tide-induced TICWs deserves more attentions since tides play a dominant role in the shelf slope regions.
Supplementary Materials
The following supporting information can be downloaded at: https://www.mdpi.com/article/10.3390/jmse10101419/s1.
Author Contributions
Z.-W.Z. and Y.-R.C. conceived and designed the study. Z.-W.Z. contributed to English editing. Z.-W.Z. contributed to the writing and data interpretation. Data analyses were conducted mainly by Y.-R.C. All authors have read and agreed to the published version of the manuscript.
Funding
This research was funded by Taiwan’s Ministry of Science and Technology (MOST) under 108-2628-M-003-001-MY3.
Data Availability Statement
The data presented in this study are available on request from the corresponding author.
Conflicts of Interest
The authors declare no conflict of interest.
References
- Cione, J.; Uhlhorn, E. Sea surface temperature variability in hurricanes: Implications with respect to intensity change. Mon. Weather Rev. 2003, 131, 1783–1796. [Google Scholar] [CrossRef] [Green Version]
- Lin, I.-I.; Liu, W.T.; Wu, C.-C.; Wong, G.T.F.; Hu, C.; Chen, Z.; Liang, W.-D.; Yang, Y.; Liu, K.-K. New evidence for enhanced ocean primary production triggered by tropical cyclone. Geophys. Res. Lett. 2003, 30, 1718. [Google Scholar] [CrossRef] [Green Version]
- Babin, S.M.; Carton, J.A.; Dickey, T.D.; Wiggert, J.D. Satellite evidence of hurricane-induced phytoplankton blooms in an oceanic desert. J. Geophys. Res. Oceans 2004, 109, C03043. [Google Scholar] [CrossRef] [Green Version]
- Siswanto, E.; Ishizaka, J.; Yokouchi, K.; Tanaka, K.; Tan, C.K. Estimation of interannual and interdecadal variations of typhoon-induced primary production: A case study for the outer shelf of the East China Sea. Geophys. Res. Lett. 2007, 34, L03604. [Google Scholar] [CrossRef]
- Morimoto, A.; Kojima, S.; Jan, S.; Takahashi, D. Movement of the Kuroshio axis to the northeast shelf of Taiwan during typhoon events. Estuar. Coast. Shelf Sci. 2009, 82, 547–552. [Google Scholar] [CrossRef]
- Zheng, Z.-W.; Ho, C.-R.; Zheng, Q.; Lo, Y.-T.; Kuo, N.-J.; Gopalakrishnan, G. Effects of preexisting cyclonic eddies on upper ocean responses to Category 5 typhoons in the western North Pacific. J. Geophys. Res. Oceans 2010, 115, C09013. [Google Scholar] [CrossRef]
- Zheng, Z.-W.; Lin, I.-I.; Wang, B.; Huang, H.-C.; Chen, C.-H. A long neglected damper in the El Nino-typhoon relationship: A Gaia-like process. Sci. Rep. 2015, 5, 11103. [Google Scholar] [CrossRef] [Green Version]
- Kuo, Y.-C.; Zheng, Z.-W.; Zheng, Q.; Gopalakrishnan, G.; Lee, C.-Y.; Chern, S.-W.; Chao, Y.-H. Typhoon induced summer cold shock advected by Kuroshio off eastern Taiwan. Ocean Model. 2017, 109, 1–10. [Google Scholar] [CrossRef]
- Mohanty, S.; Nadimpalli, R.; Osuri, K.K.; Pattanayak, S.; Mohanty, U.C.; Sil, S. Role of sea surface temperature in modulating life cycle of tropical cyclones over bay of Bengal. Trop. Cyclone Res. Rev. 2019, 8, 68–83. [Google Scholar] [CrossRef]
- Schade, L.R.; Emanuel, K.A. The ocean’s effect on the intensity of tropical cyclones: Results from a simple coupled atmosphere ocean model. J. Atmos. Sci. 1999, 56, 642–651. [Google Scholar] [CrossRef]
- Shay, L.K.; Goni, G.J.; Black, P.G. Effects of a warm oceanic feature on Hurricane Opal. Mon. Weather Rev. 2000, 128, 1366–1383. [Google Scholar] [CrossRef]
- Wu, C.-C.; Lee, C.-Y.; Lin, I.-I. The effect of the ocean eddy on tropical cyclone intensity. J. Atmos. Sci. 2007, 64, 3562–3578. [Google Scholar] [CrossRef]
- Lin, I.-I.; Wu, C.-C.; Pun, I.-F.; Ko, D.-S. Upper-ocean thermal structure and the western North Pacific category 5 typhoons. Part I: Ocean features and the category 5 typhoons’ intensification. Mon. Weather Rev. 2008, 136, 3288–3306. [Google Scholar] [CrossRef] [Green Version]
- Lee, C.-Y.; Chen, S.S. Stable boundary layer and its impact on tropical cyclone structure in a coupled atmosphere-ocean model. Mon. Wea. Rev. 2014, 142, 1927–1944. [Google Scholar] [CrossRef]
- Glenn, S.M.; Miles, T.N.; Seroka, G.N.; Xu, Y.; Forney, R.K.; Yu, F.; Roarty, H.; Schofield, O.; Kohut, J. Stratified coastal ocean interactions with tropical cyclones. Nat. Commun. 2016, 7, 10887. [Google Scholar] [CrossRef] [Green Version]
- Kuo, Y.-C.; Zheng, Z.-W.; Zheng, Q.; Gopalakrishnan, G.; Lee, H.-Y. Typhoon-Kuroshio interaction in an air-sea coupled system: Case study of typhoon Nanmadol (2011). Ocean Model. 2018, 132, 130–138. [Google Scholar] [CrossRef]
- Mitchell, D.A.; Teague, W.J.; Jarosz, E.; Wang, W. Observed currents over the outer continental shelf during Hurricane Ivan. Geophys. Res. Lett. 2005, 32, L11610. [Google Scholar] [CrossRef] [Green Version]
- Teague, W.J.; Jarosz, E.; Wang, D.W.; Mitchell, D.A. Observed oceanic response over the upper continental slope and outer shelf during Hurricane Ivan. J. Phys. Oceanogr. 2007, 37, 2181–2206. [Google Scholar] [CrossRef] [Green Version]
- Zhang, Z.; Wang, Y.; Zhang, W.; Xu, J. Coastal ocean response and its feedback to Typhoon Hato (2017) over the South China Sea: A numerical study. J. Geophys. Res. Atmos. 2019, 124, 13731–13749. [Google Scholar] [CrossRef]
- Cheriton, O.M.; Storlazzi, C.D.; Rosenberger, K.J.; Sherman, C.E.; Schmidt, W.E. Rapid observations of ocean dynamics and stratification along a steep island coast during Hurricane María. Sci. Adv. 2021, 7, eabf1552. [Google Scholar] [CrossRef]
- Ko, D.S.; Chao, S.Y.; Wu, C.C.; Lin, I.I.; Jan, S. Impacts of tides and Typhoon Fanapi (2010) on seas around Taiwan. Terr. Atmos. Ocean. Sci. 2016, 27, 261–280. [Google Scholar] [CrossRef] [Green Version]
- Lima, M.M.; Gouveia, C.M.; Trigo, R.M. Upper Ocean Response on the Passage of Tropical Cyclones in the Azores Region. EGUsphere 2022. [Preprint]. [Google Scholar] [CrossRef]
- Souza, A.J.; Simpson, J.H. The modification of tidal ellipses by stratification in the Rhine ROFI. Cont. Shelf Res. 1996, 18, 997–1007. [Google Scholar] [CrossRef] [Green Version]
- Bravo, L.; Ramos, M.; Sobarzo, M.; Pizarro, O.; Valle-Levinson, A. Barotropic and baroclinic semidiurnal tidal currents in two contrasting coastal upwelling zones of Chile. J. Geophys. Res. Ocean. 2013, 118, 1226–1238. [Google Scholar] [CrossRef]
- Mandal, S.; Sil, S.; Gangopadhyay, A. Tide-current-eddy interaction: A seasonal study using high frequency radar observations along the western Bay of Bengal near 16° N. Estuar. Coast. Shelf Sci. 2020, 232, 106523. [Google Scholar] [CrossRef]
- Matthews, J.B.R. Comparing historical and modern methods of sea surface temperature measurement-part 1: Review of methods, field comparisons and dataset adjustments. Ocean Sci. 2013, 9, 683–694. [Google Scholar] [CrossRef] [Green Version]
- Doong, D.-J.; Peng, J.P.; Babanin, A.V. Field investigations of coastal sea surface temperature drop after typhoon passages. Earth Syst. Sci. Data 2019, 11, 323–340. [Google Scholar] [CrossRef] [Green Version]
- Large, W.G.; McWilliams, J.C.; Doney, S.C. Oceanic vertical mixing: A review and a model with a nonlocal boundary layer parameterization. Rev. Geophys. 1994, 32, 363–403. [Google Scholar] [CrossRef] [Green Version]
- Song, Y.; Haidvogel, D.B. A semi-implicit ocean circulation model using a generalized topography-following coordinate system. J. Comput. Phys. 1994, 115, 228–244. [Google Scholar] [CrossRef]
- Cummings, J.A. Operational multivariate ocean data assimilation, Q.J.R. Meteorol. Soc. 2005, 131, 3583–3604. [Google Scholar] [CrossRef]
- Shchepetkin, A.F.; McWilliams, J.C. Method for computing horizontal pressure-gradient force in an oceanic model with a nonaligned vertical coordinate. J. Geophys. Res. 2003, 108, 3090. [Google Scholar] [CrossRef] [Green Version]
- Shchepetkin, A.F.; McWilliams, J.C. The regional oceanic modeling system (ROMS): A split-explicit, free-surface, topography-following-coordinate oceanic model. Ocean Modell. 2005, 9, 347–404. [Google Scholar] [CrossRef]
- Zheng, Z.-W.; Zheng, Q.; Lee, C.-Y.; Gopalakrishnan, G. Transient modulation of Kuroshio upper layer flow by directly impinging typhoon Morakot in east of Taiwan in 2009. J. Geophys. Res. Oceans 2014, 119, 4462–4473. [Google Scholar] [CrossRef]
- Shen, D.; Li, X.; Wang, J.; Bao, S.; Pietrafesa, L.J. Dynamical ocean responses to Typhoon Malakas (2016) in the vicinity of Taiwan. J. Geophys. Res. Oceans 2021, 126, e2020JC016663. [Google Scholar] [CrossRef]
- Flather, R.A. A tidal model of the northwest European continental shelf. Mem. Soc. Roy. Sci. Liege 1976, 10, 141–164. [Google Scholar]
- Lai, Y.-H.; Lu, C.-Y.; Zheng, Z.-W.; Chiang, L.-C.; Ho, C.-R. Numerical Simulation of the Trajectory of Garbage Falling into the Sea at the Coastal Landfill in Northeast Taiwan. Water 2022, 14, 1251. [Google Scholar] [CrossRef]
- Egbert, G.; Erofeeva, S. Efficient inverse modeling of barotropic ocean tides. J. Atmos. Ocean. Technol. 2002, 19, 183–204. [Google Scholar] [CrossRef]
- Tomczak, M.; Godfrey, J.S. Regional Oceanography: An Introduction; Elsevier: Amsterdam, The Netherlands, 1994. [Google Scholar]
- Webb, D.J.; Holmes, R.M.; Spence, P.; England, M.H. Barotropic Kelvin wave-induced bottom boundary layer warming along the West Antarctic Peninsula. J. Geophys. Res. Oceans 2019, 124, 1595–1615. [Google Scholar] [CrossRef]
- Chen, K.Y.; Huang, C.F.; Huang, S.W.; Liu, J.Y.; Guo, J. Mapping coastal circulations using moving vehicle acoustic tomography. J. Acoust. Soc. Am. 2020, 148, EL353–EL358. [Google Scholar] [CrossRef] [PubMed]
- Price, J.F. Upper ocean response to a hurricane. J. Phys. Oceanogr. 1981, 11, 153–175. [Google Scholar] [CrossRef]
- Zambon, J.B.; He, R.; Warner, J.C. Investigation of hurricane Ivan using the coupled ocean–atmosphere–wave–sediment transport (COAWST) model. Ocean Dyn. 2014, 64, 1535–1554. [Google Scholar] [CrossRef]
- Zhang, S.; Xie, L.; Hou, Y.; Zhao, H.; Qi, Y.; Yi, X. Tropical storm-induced turbulent mixing and chlorophyll-a enhancement in the continental shelf southeast of Hainan Island. J. Mar. Syst. 2014, 129, 205–414. [Google Scholar] [CrossRef]
Figure 1.
ROMS model domains with topography (unit: meters). The whole domain demonstrates the bathymetry surrounding main model domain. Small black box is the children domain with higher spatial resolution nested to parent domain (big black box). Typhoon tracks of 6 cases are shown in different color circles in 6-h intervals. Circles in brown, pink, cyan, blue, grass green, and green denote tracks of typhoons Dujuan, Meranti, Usagi, Utor, Sanvu, and Nanmadol, respectively. Big red circle denotes the location of Longdong buoy northeast of Taiwan.

Figure 2.
Comparison of the amplitudes for M2 constituent extracted from (a) ROMS model simulations during the passage of typhoon Utor (2001) with s_tide program and (b) TPXO7. The units are cm.
Figure 2.
Comparison of the amplitudes for M2 constituent extracted from (a) ROMS model simulations during the passage of typhoon Utor (2001) with s_tide program and (b) TPXO7. The units are cm.

Figure 3.
Sea-level changes derived from ROMS model simulations (red lines) and tidal gauge measurements at the Longdong tide station (25.098° N, 121.918° E, https://ocean.cwb.gov.tw/V2/data_interface, black circle lines) (accessed on 20 March 2021). during 6 typhoon passages.
Figure 3.
Sea-level changes derived from ROMS model simulations (red lines) and tidal gauge measurements at the Longdong tide station (25.098° N, 121.918° E, https://ocean.cwb.gov.tw/V2/data_interface, black circle lines) (accessed on 20 March 2021). during 6 typhoon passages.
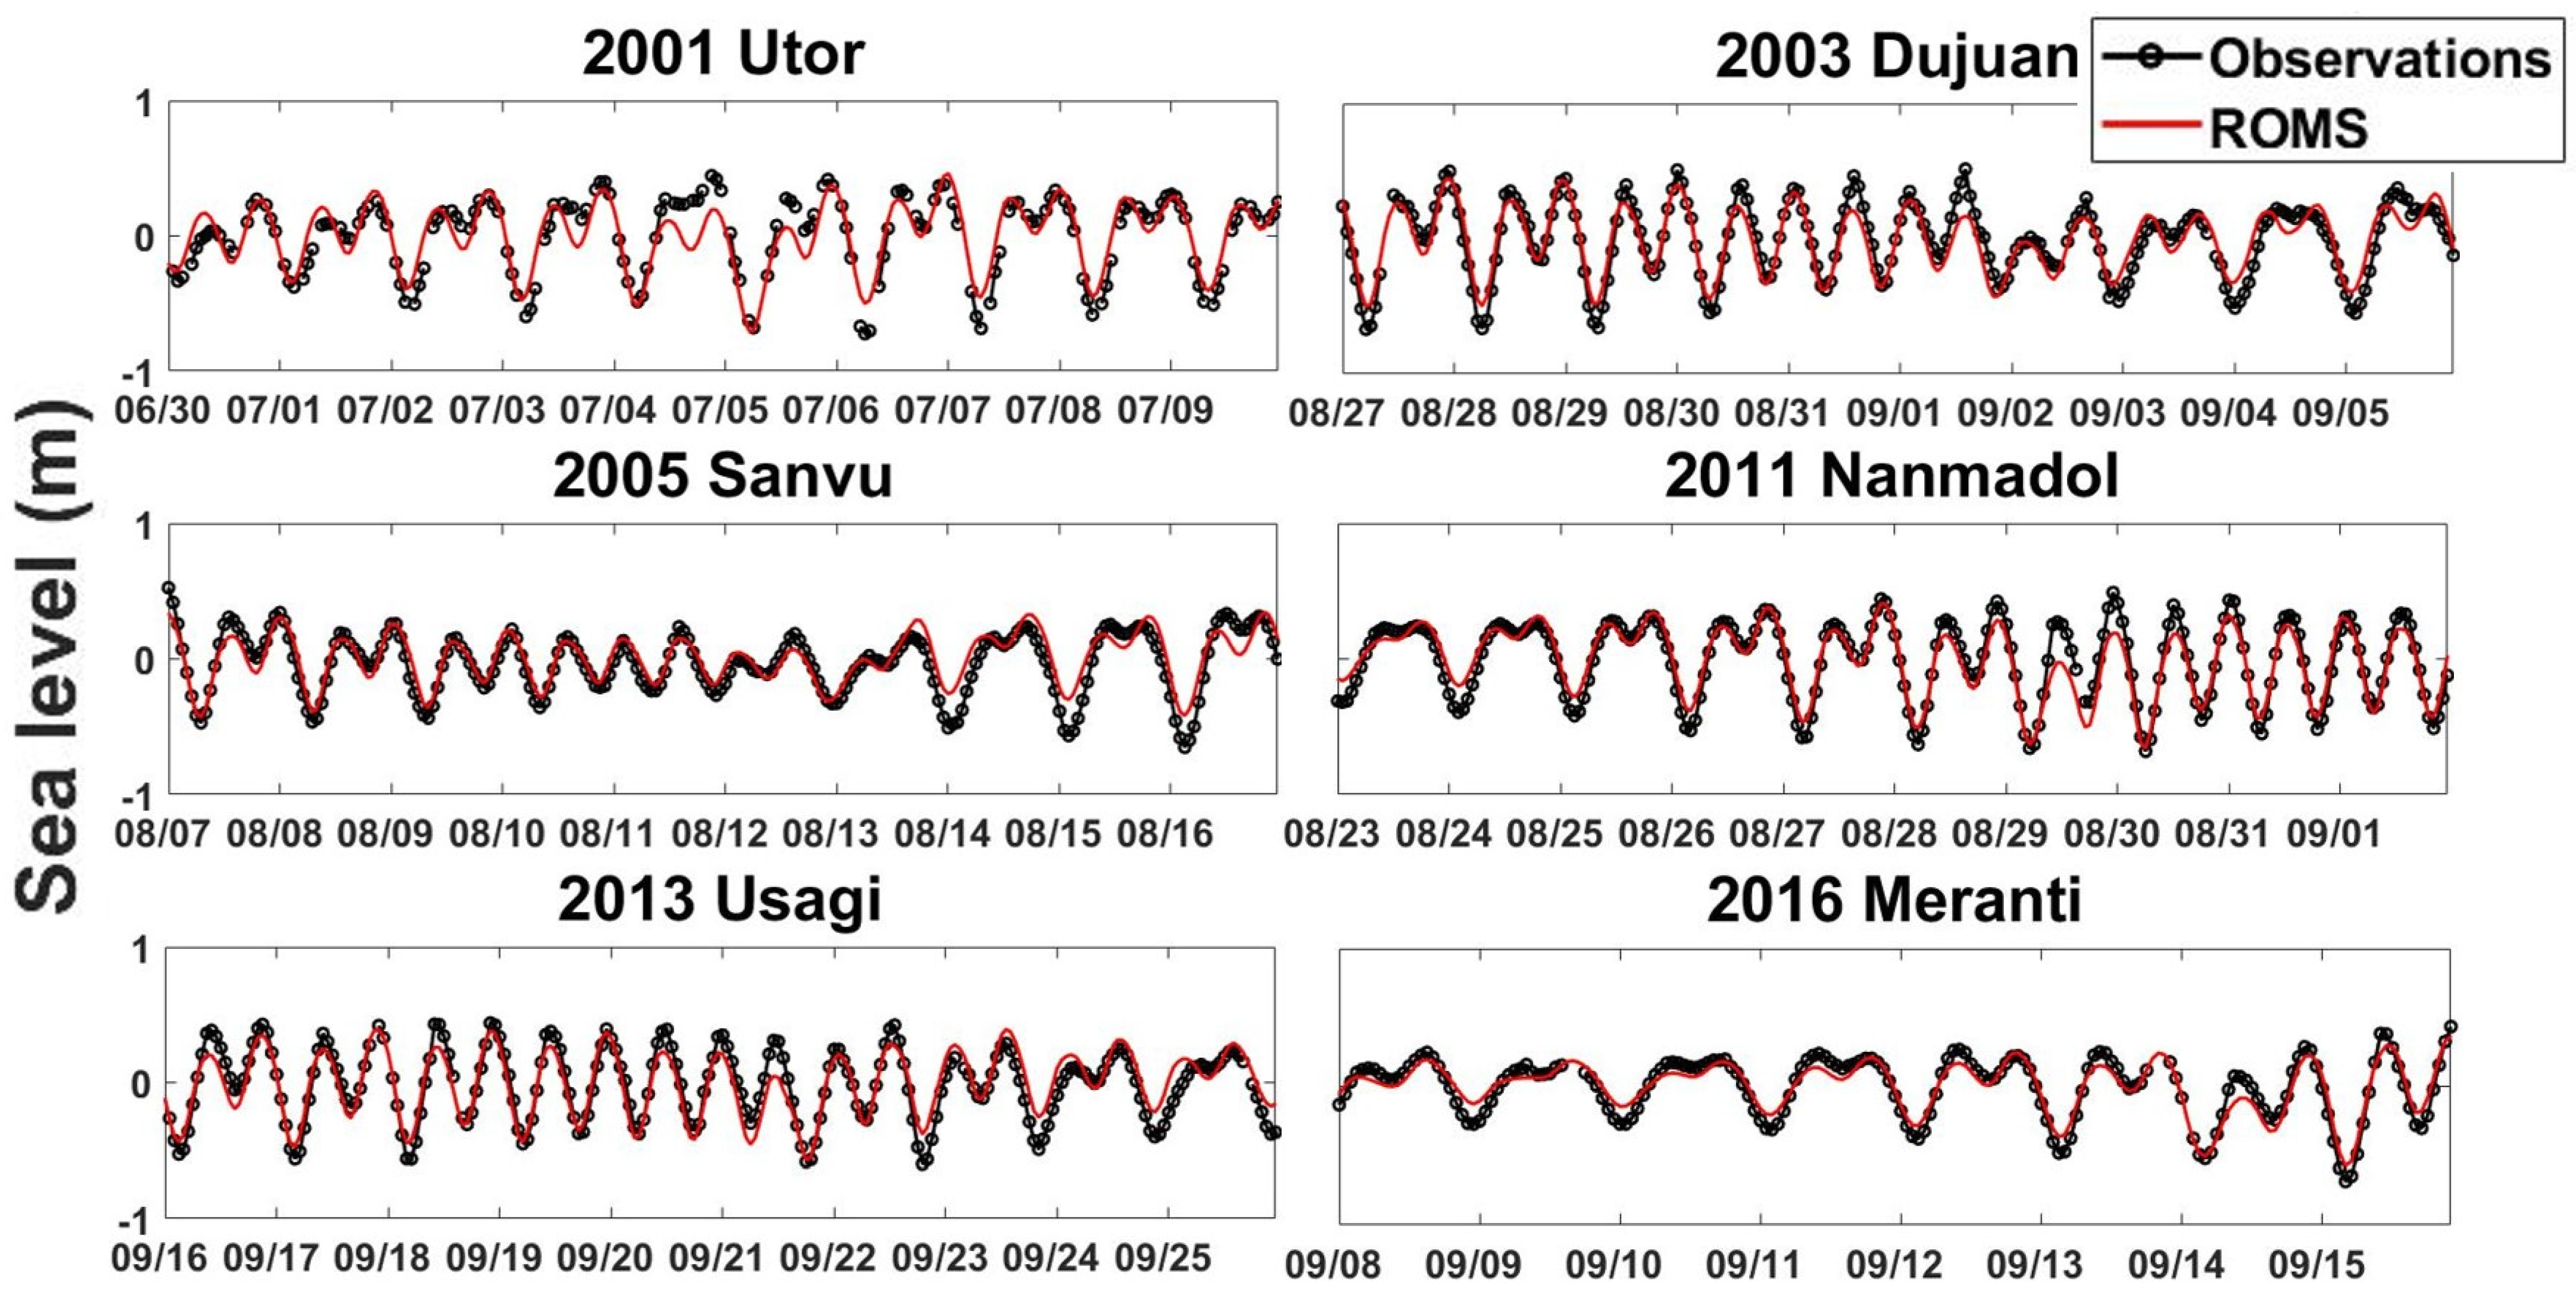
Figure 4.
Significant near-surface temperature drops in response to 6 typhoon passages. Red and blue lines denote the temperature variabilities derived from moored buoy temperature meter (installed at 0.6 m depth) and model-simulated SST (temperature at 0 m depth).
Figure 4.
Significant near-surface temperature drops in response to 6 typhoon passages. Red and blue lines denote the temperature variabilities derived from moored buoy temperature meter (installed at 0.6 m depth) and model-simulated SST (temperature at 0 m depth).
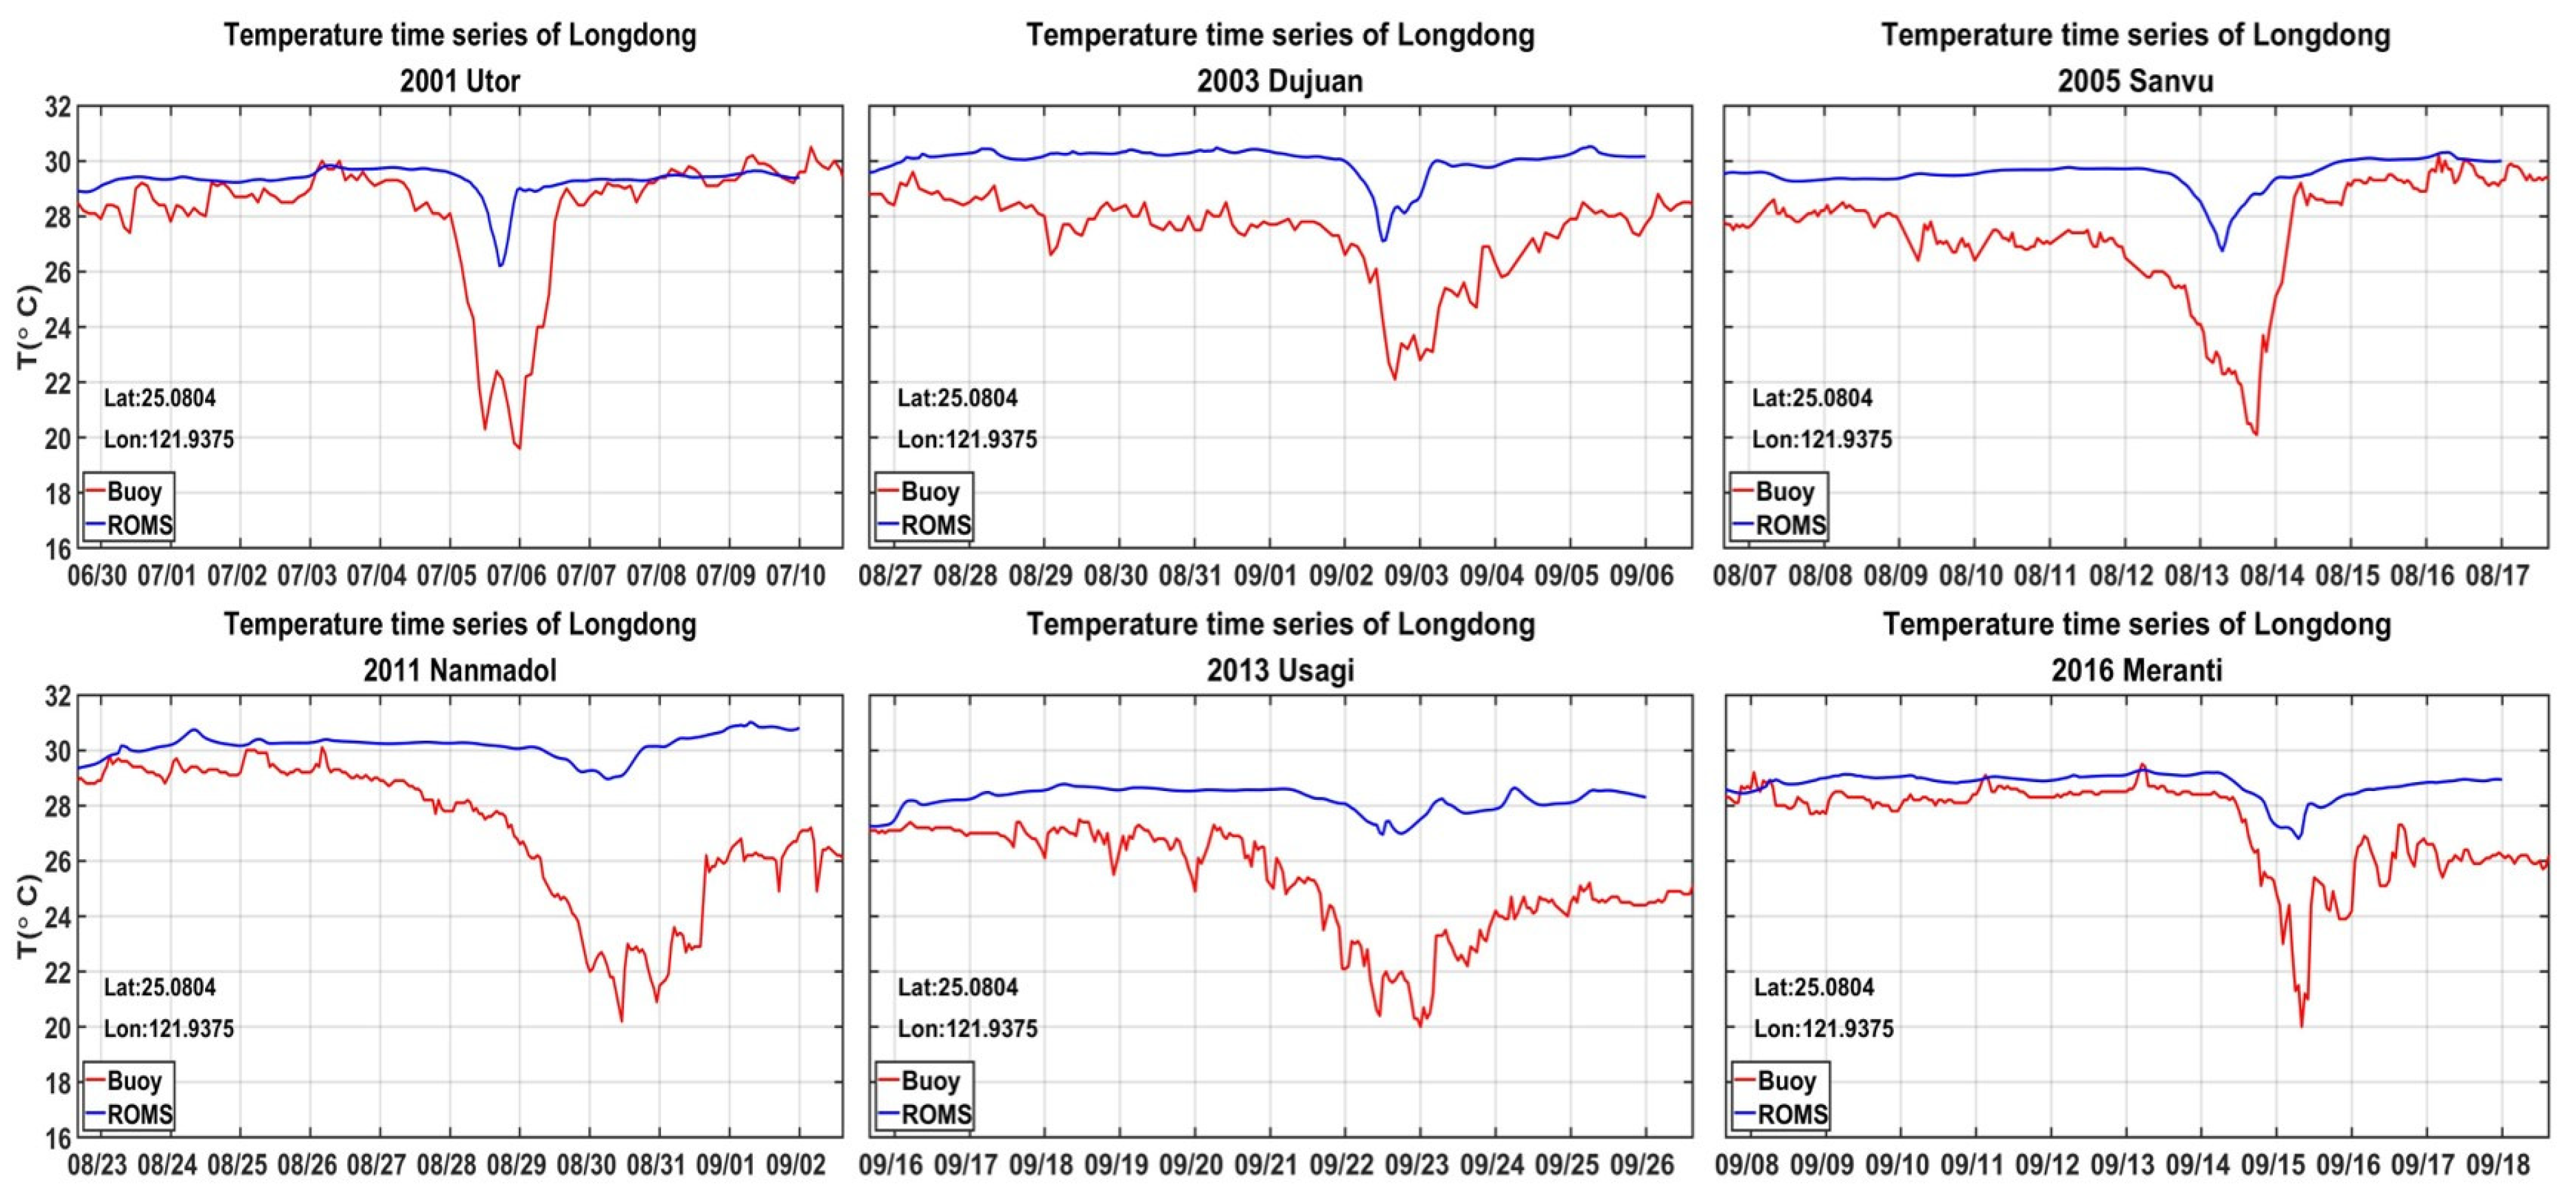
Figure 5.
Same as Figure 4 but for comparison of TICWs derived from observations (red lines) and model simulations with tidal forcing as inputs (blue lines).
Figure 5.
Same as Figure 4 but for comparison of TICWs derived from observations (red lines) and model simulations with tidal forcing as inputs (blue lines).
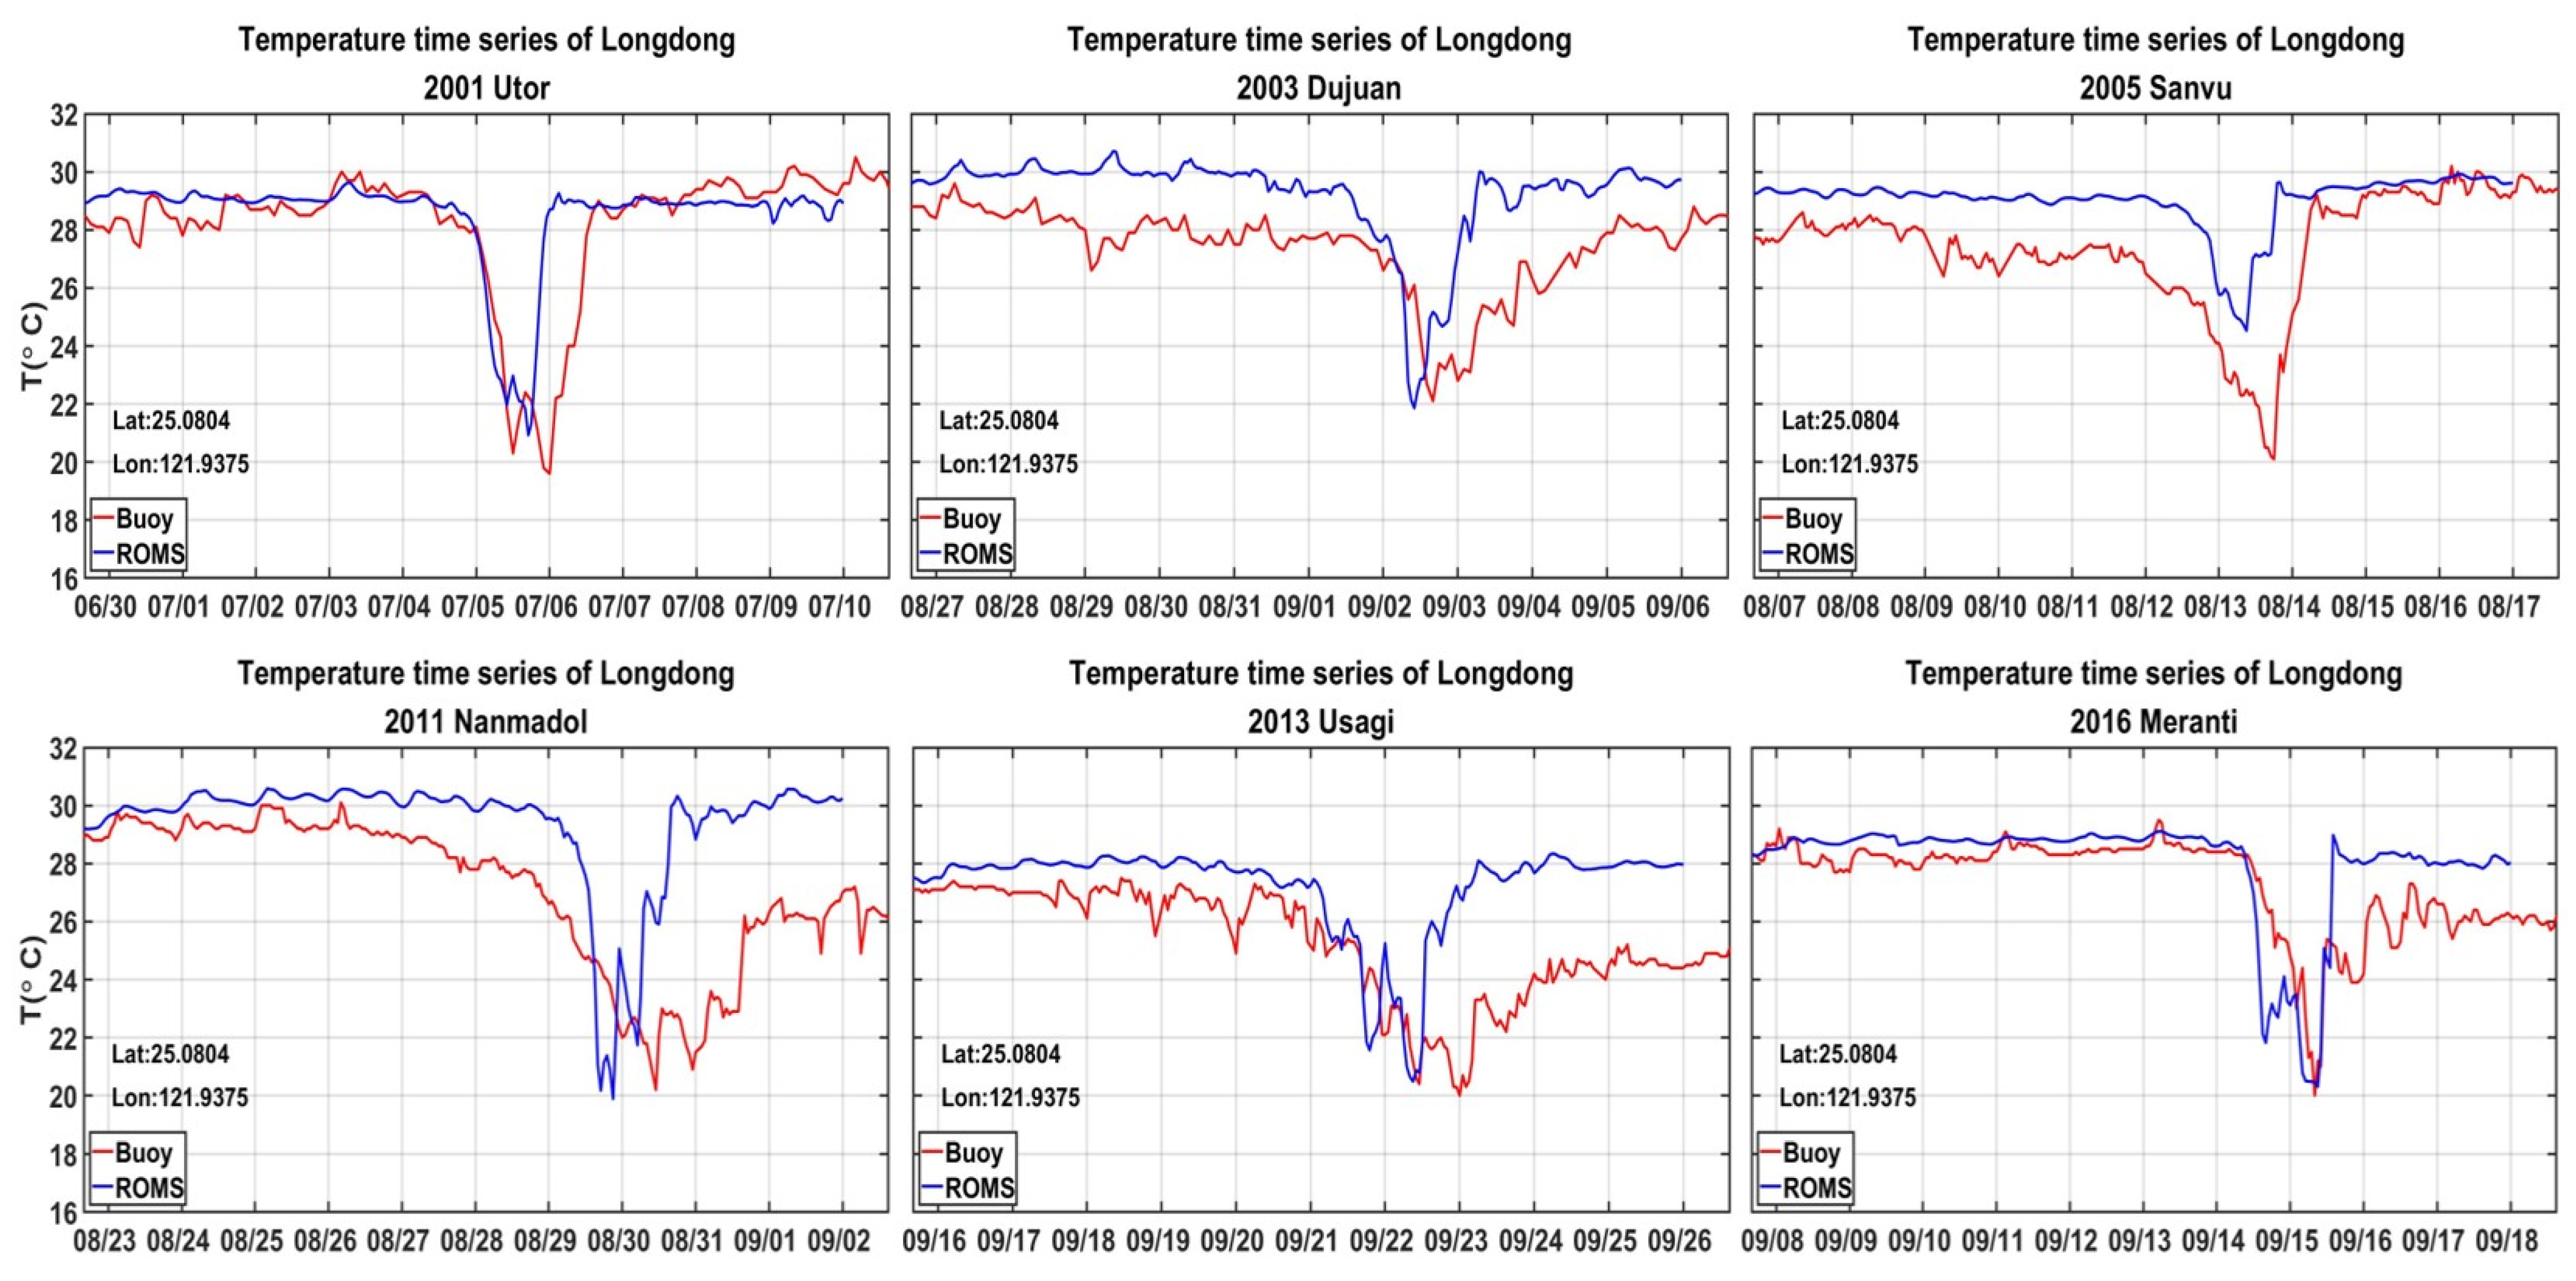
Figure 6.
Depth-averaged, 42-h low-passed ocean current in black arrows and 42-h low-passed SST with tidal forcing (left panels, (a–c,g–i)). Corresponding results but retrieved from 6 simulations without tidal forcing during 6 typhoon passages are shown in right panels (d–f,j–l). Additionally marked is 10-m wind in white arrows (scaled in bottom-right corners). White line in Figure 6a denotes the location of the zonal transect shown in Figure 7.
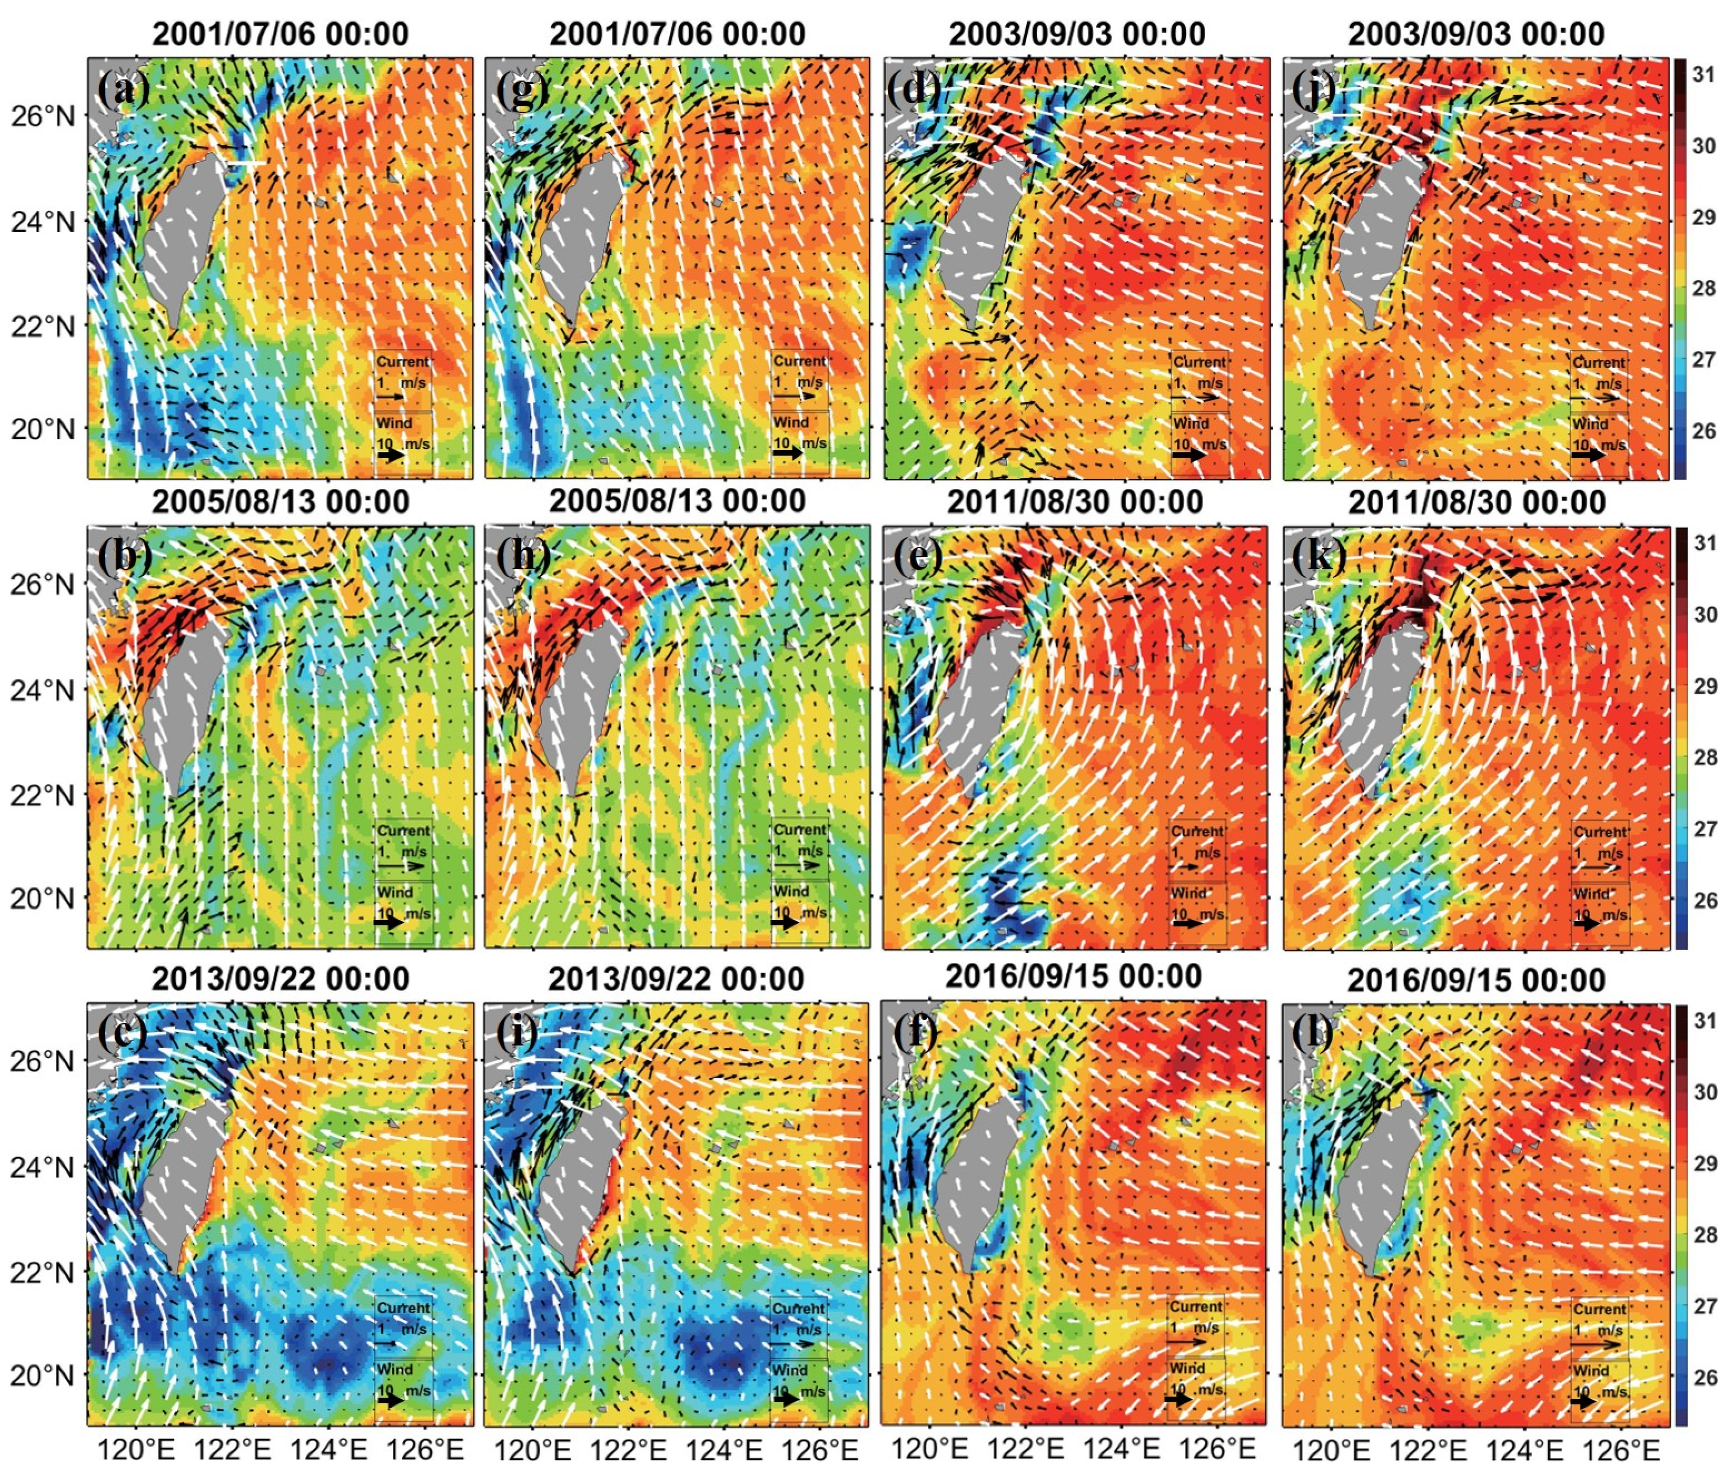
Figure 7.
Transects of differences in temperature (in color shadings) and alongshore-ward (northward) currents (in contours) in both experiments EXPSTD and EXPwithTide corresponding to 12 h before the occurrences of their maximum sea surface cooling at July 6 00:00 (e.g., Figure 6a,g). Red and green lines denote the positions of bottom thermocline (denoted by 20 °C isotherms) corresponding to EXPwithTide and EXPSTD. The location of this zonal transect can be seen in Figure 6a. Same analyses on the other five typhoon cases are demonstrated in Figure S2 of OSM.

Figure 8.
The schematic plot of the dynamic linkage between stronger alongshore (northward) flow and uplift of subsurface cold water surrounding Longdong. According to Tomczak and Godfrey [38], this upwelling is a result of the thermocline slope across a current. The oceanic temperature field reacts to the presence of a strong current by adjusting to geostrophic equilibrium. This process leads to a steep rise in the thermocline from the ocean towards the coast since isotherm depths on the oceanic side of the current cannot change. Orange circles denote the positions of strong current passing through (entering the paper). Dashed line in the right panel marks the original position of the thermocline before uplift.

Figure 9.
Bottom layer kinetic energy divided by the water density (u2 + v2)/2 in m2 s−2, averaged from the entire time of the simulation. The left (right) panel shows the result of simulation without (with) tidal forcing as inputs. Shown as well are 50, 100, 200, 500, and 1000 m isobaths.
Figure 9.
Bottom layer kinetic energy divided by the water density (u2 + v2)/2 in m2 s−2, averaged from the entire time of the simulation. The left (right) panel shows the result of simulation without (with) tidal forcing as inputs. Shown as well are 50, 100, 200, 500, and 1000 m isobaths.
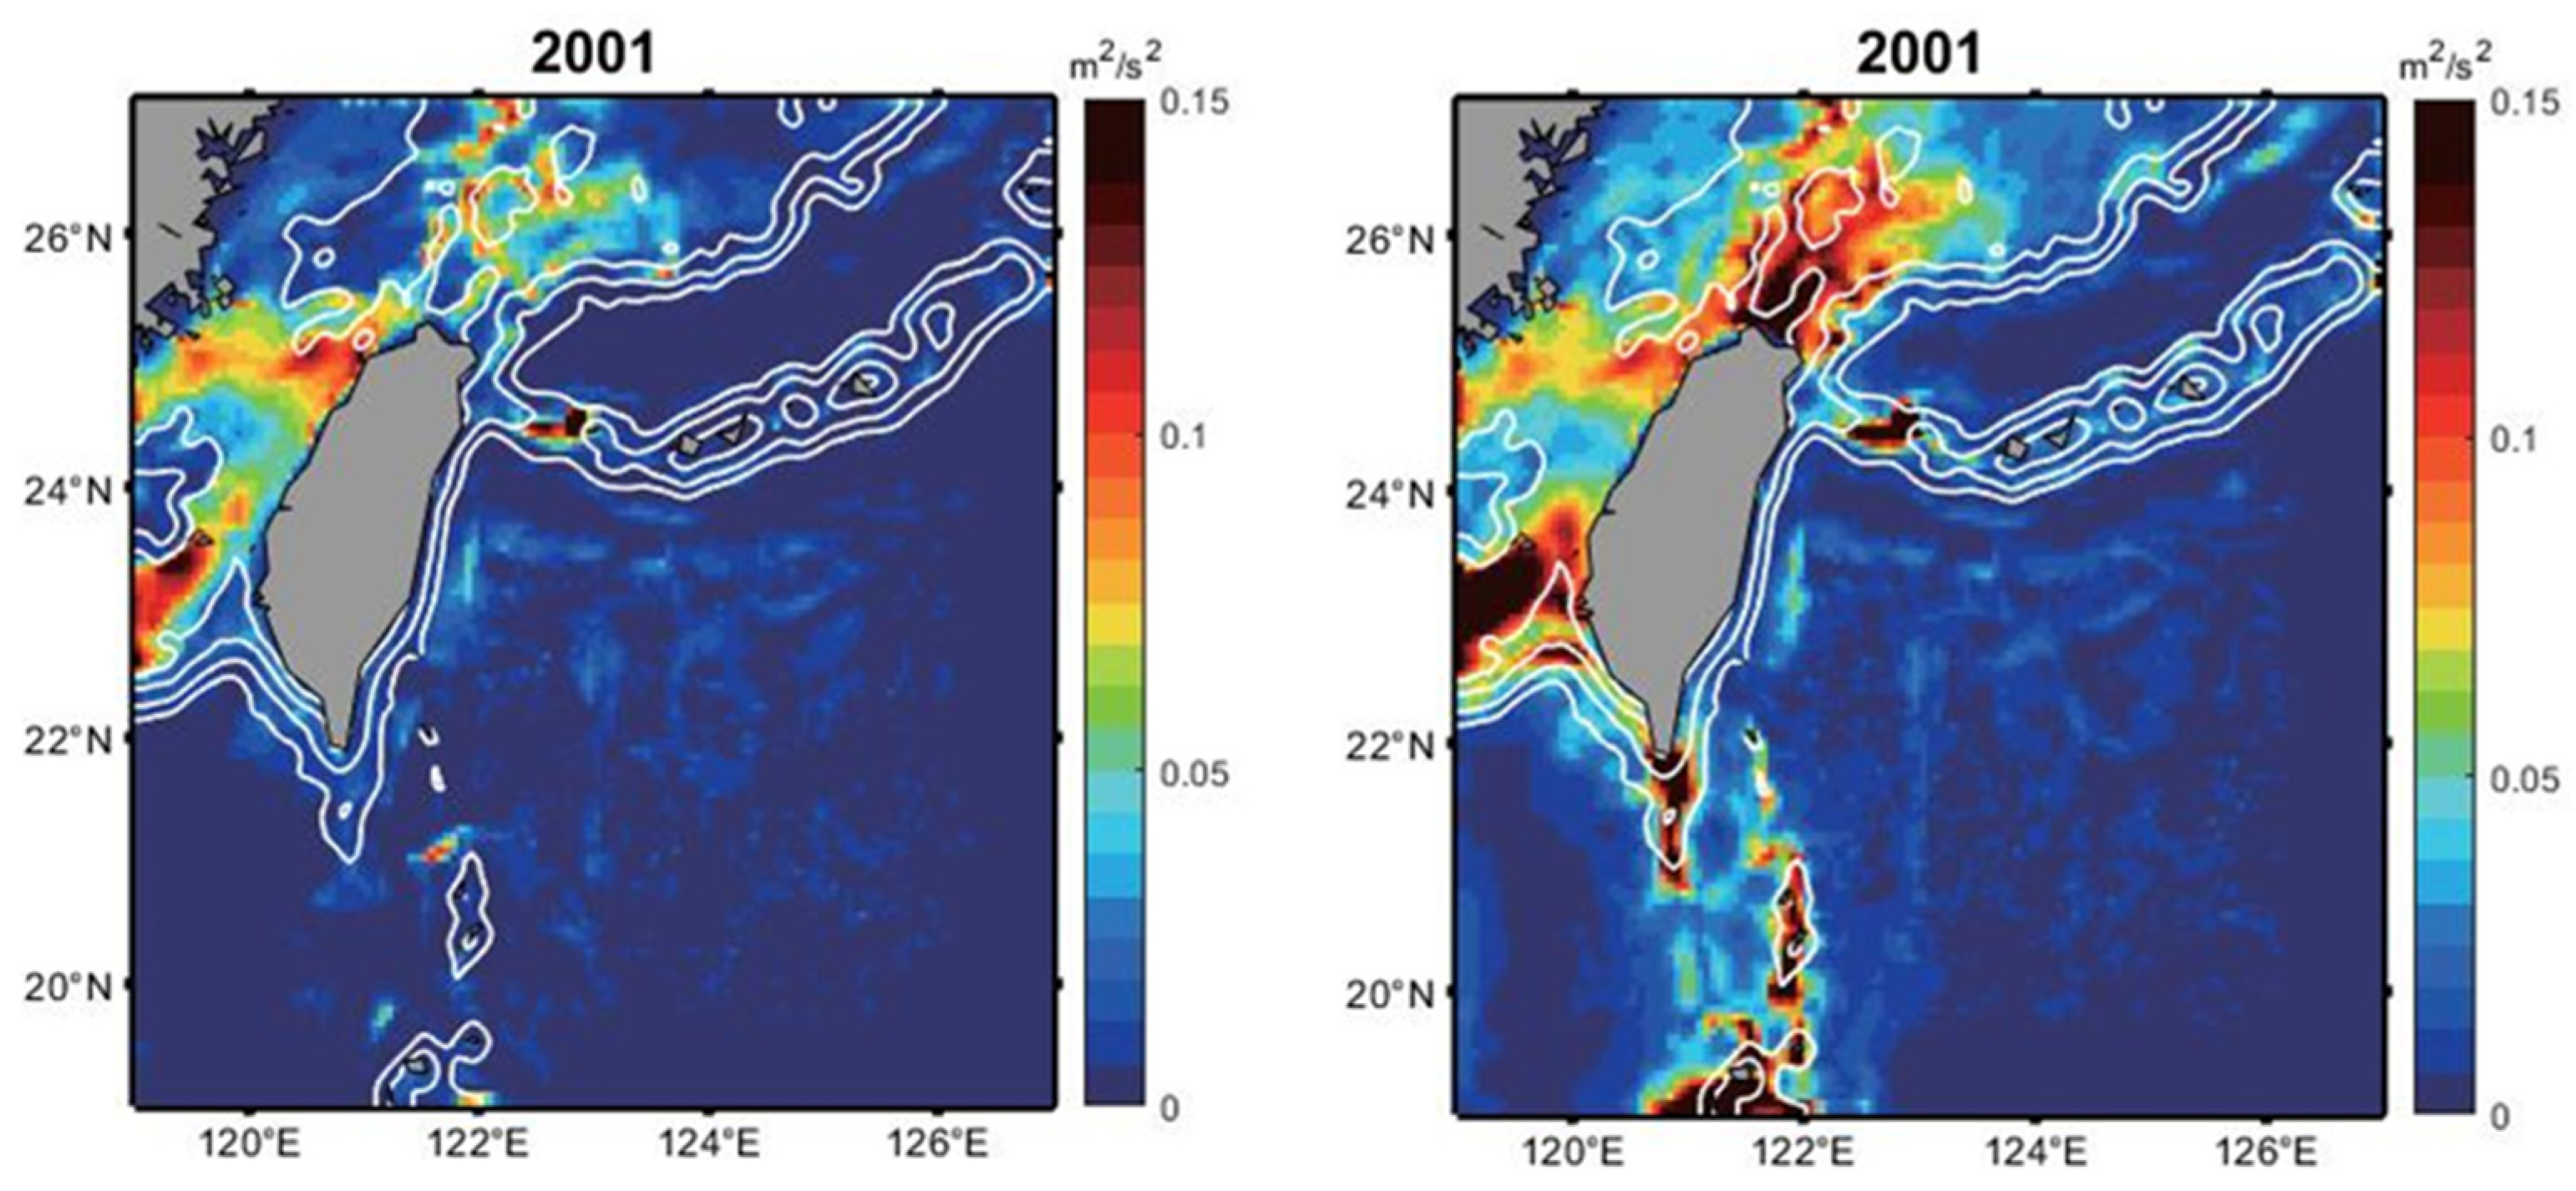
Figure 10.
Depth-averaged tidal residual currents (arrows) superimposed on tidal residual SST (color shadings). This figure shows the composite of typhoons. The thick white segment denotes a shore-normal transect corresponding to Figure 11.
Figure 10.
Depth-averaged tidal residual currents (arrows) superimposed on tidal residual SST (color shadings). This figure shows the composite of typhoons. The thick white segment denotes a shore-normal transect corresponding to Figure 11.
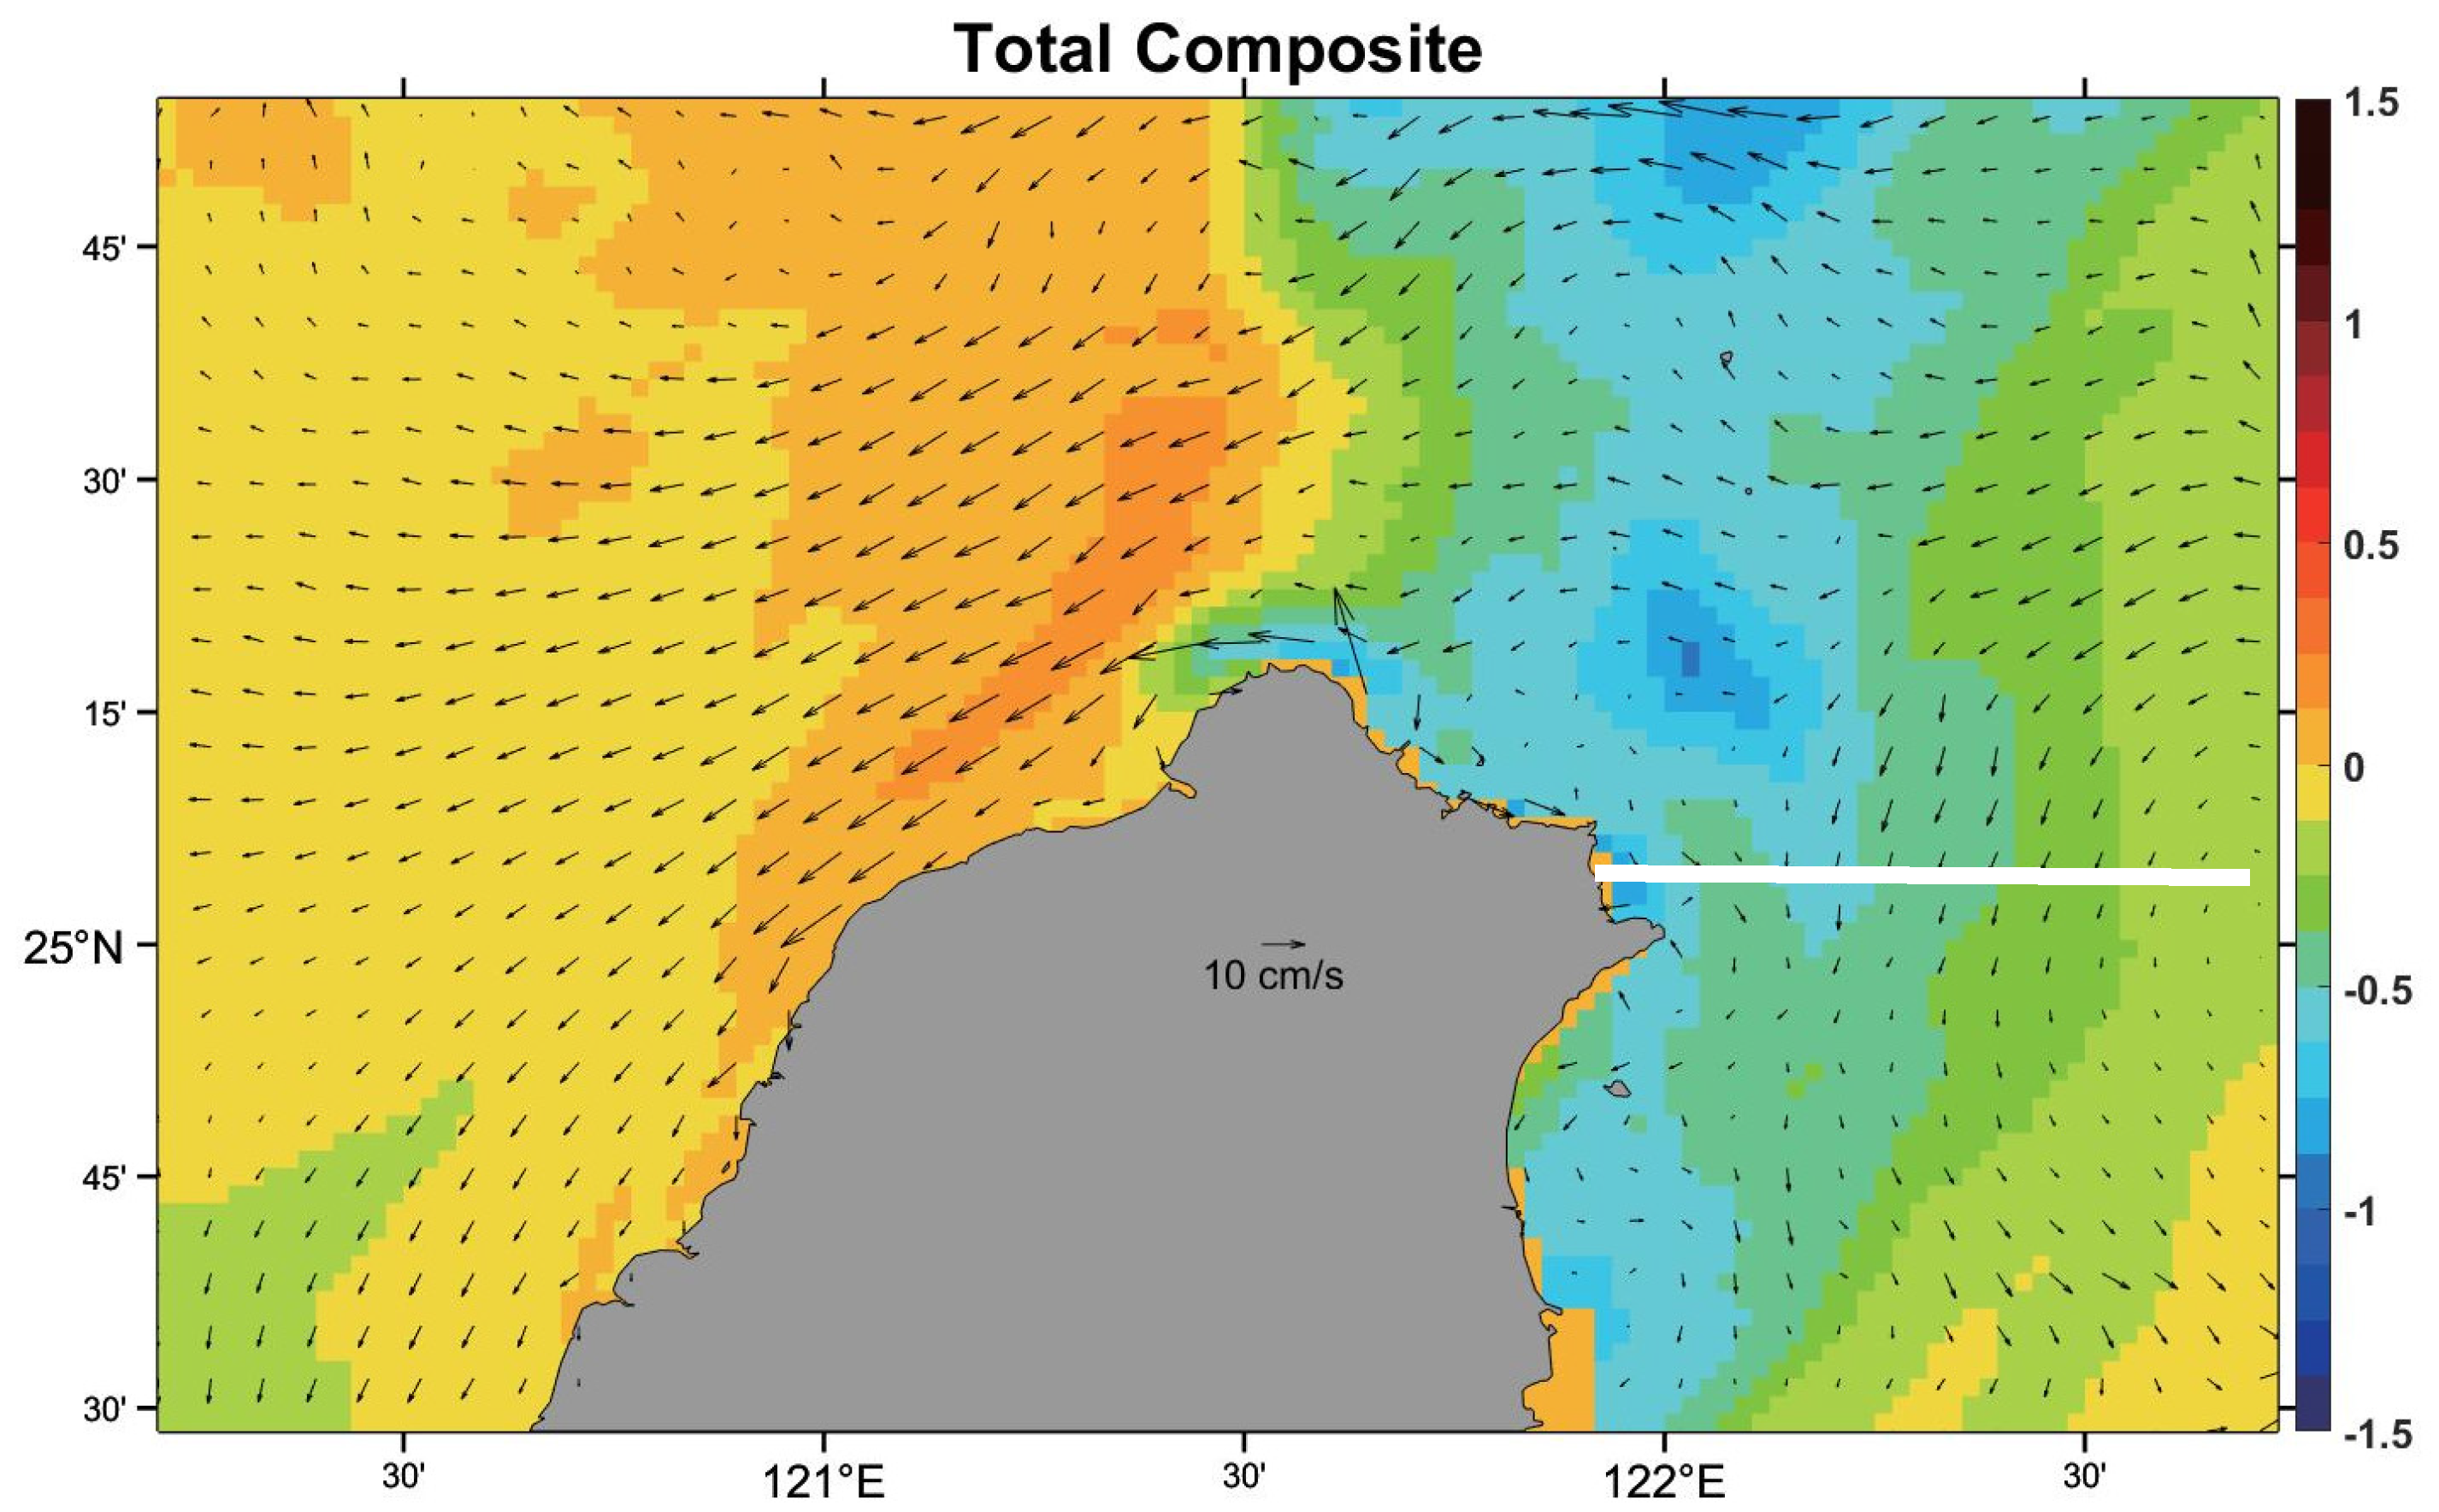
Figure 11.
Composited shore-normal transect of tidal residuals, including temperature (in color shading, °C) and cross-shelf velocity (solid contours denote southward velocities, whereas dashed contours are northward currents). White arrows denote current directions along the transect.
Figure 11.
Composited shore-normal transect of tidal residuals, including temperature (in color shading, °C) and cross-shelf velocity (solid contours denote southward velocities, whereas dashed contours are northward currents). White arrows denote current directions along the transect.
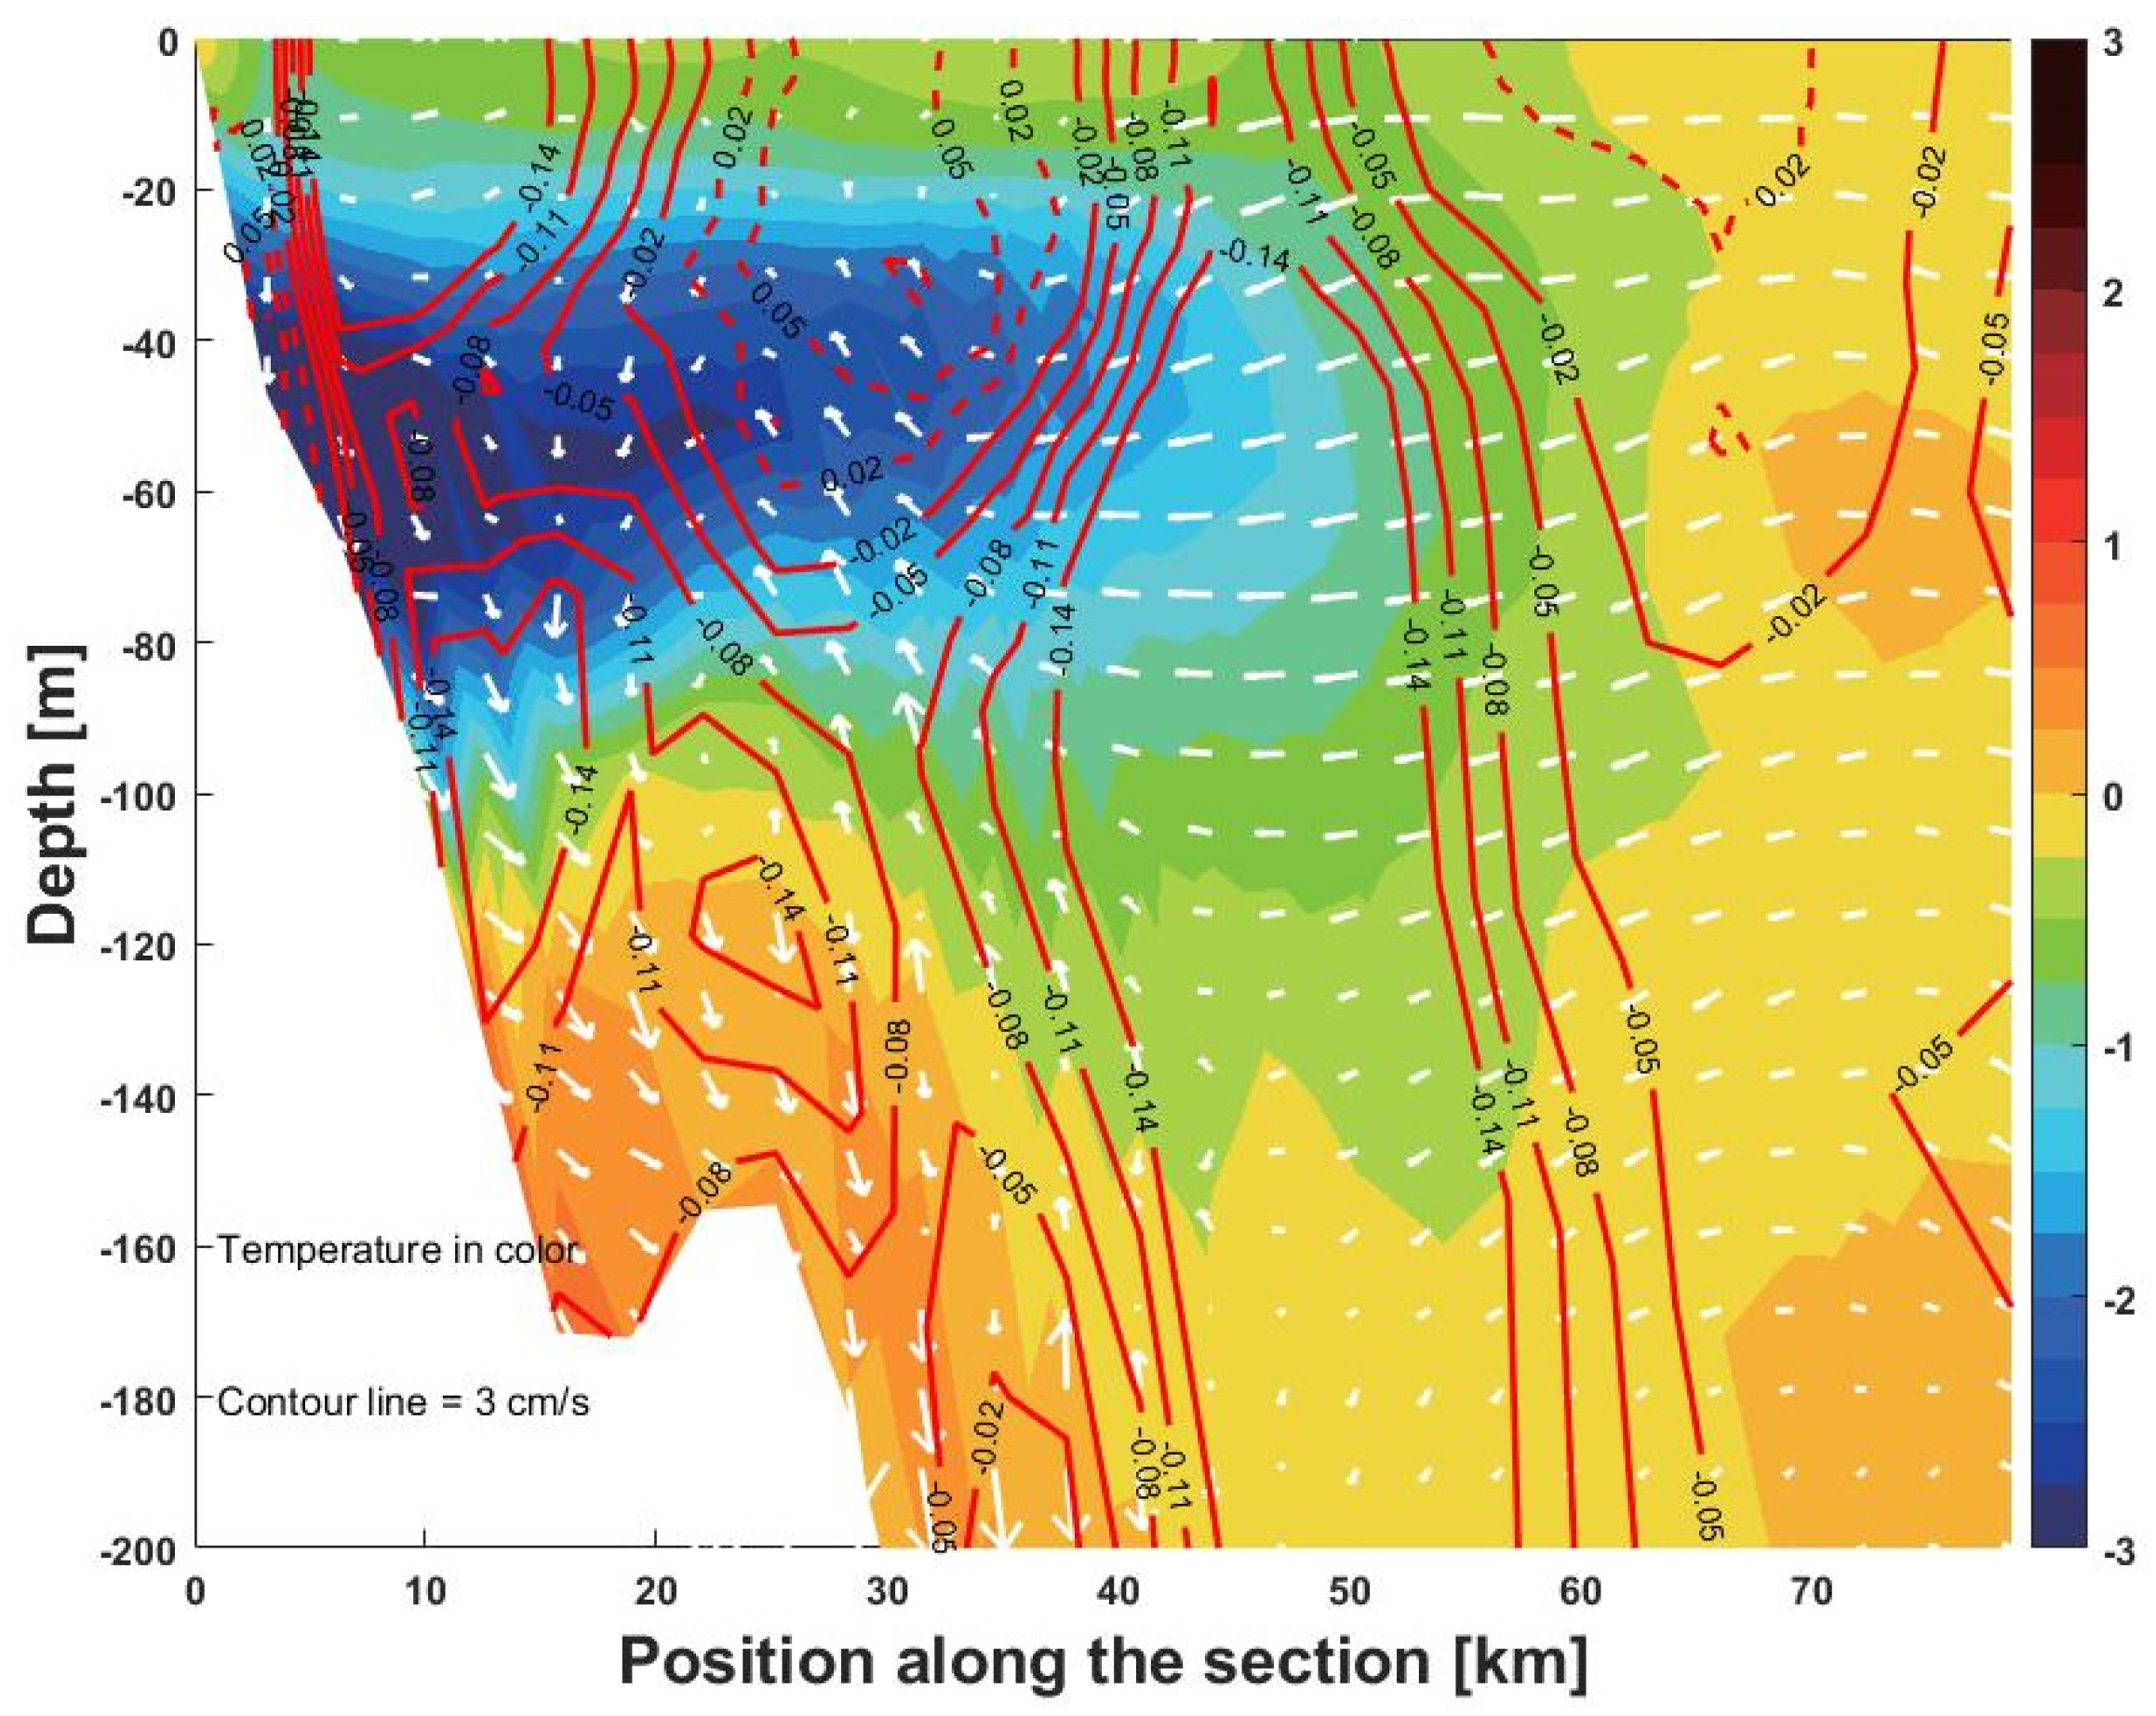
Figure 12.
Evolution of wind forcing (vectors), u, v, w components of velocity fields (units, u: ms−1, v: ms−1, w: 10−4 ms−1) and temperature (°C, color shading) are shown in panels from top to bottom (a–e). Model fields were sampled at 25.08° N, 122° E, which was chosen in reference to where maximum sea surface cooling occurred. Positive values (contours in solid lines) in velocity fields correspond to eastward and northward flows for u and v, respectively. Contours in dashed lines in the u and v fields denote negative, westward, and southward velocities, respectively.


Table 1.
Detailed information of 6 typhoon cases and corresponding simulation periods. The initial and ending dates of certain typhoon cases are defined by the first time appearance and final disappearance of TC corresponding to category tropical depression in JTWC.
Table 1.
Detailed information of 6 typhoon cases and corresponding simulation periods. The initial and ending dates of certain typhoon cases are defined by the first time appearance and final disappearance of TC corresponding to category tropical depression in JTWC.
| Cases | Simulation Periods | Initial Date | Ending Date | Intensity Category | Moving Speed (ms−1) | Maximum Sustained Wind (ms−1) | ΔSST |
|---|---|---|---|---|---|---|---|
| Utor | 6/28~7/10 | 2001/7/1 | 2001/7/7 | I | 9.2 | 38 | 9 |
| Dujuan | 8/25~9/6 | 2003/8/27 | 2003/9/3 | IV | 8.3 | 43 | 6 |
| Sanvu | 8/5~8/17 | 2005/8/9 | 2005/8/14 | I | 6.4 | 20 | 7.3 |
| Nanmadol | 8/21~9/2 | 2011/8/21 | 2011/8/31 | V | 2.5 | 35 | 8.9 |
| Usagi | 9/14~9/26 | 2013/9/16 | 2013/9/24 | V | 5.3 | 53 | 6.4 |
| Meranti | 9/6~9/18 | 2016/9/8 | 2016/9/16 | V | 5.6 | 58 | 8.3 |
Publisher’s Note: MDPI stays neutral with regard to jurisdictional claims in published maps and institutional affiliations. |
© 2022 by the authors. Licensee MDPI, Basel, Switzerland. This article is an open access article distributed under the terms and conditions of the Creative Commons Attribution (CC BY) license (https://creativecommons.org/licenses/by/4.0/).
Share and Cite
MDPI and ACS Style
Zheng, Z.-W.; Chen, Y.-R. Influences of Tidal Effect on Upper Ocean Responses to Typhoon Passages Surrounding Shore Region off Northeast Taiwan. J. Mar. Sci. Eng. 2022, 10, 1419. https://doi.org/10.3390/jmse10101419
AMA Style
Zheng Z-W, Chen Y-R. Influences of Tidal Effect on Upper Ocean Responses to Typhoon Passages Surrounding Shore Region off Northeast Taiwan. Journal of Marine Science and Engineering. 2022; 10(10):1419. https://doi.org/10.3390/jmse10101419
Chicago/Turabian StyleZheng, Zhe-Wen, and Yi-Rui Chen. 2022. "Influences of Tidal Effect on Upper Ocean Responses to Typhoon Passages Surrounding Shore Region off Northeast Taiwan" Journal of Marine Science and Engineering 10, no. 10: 1419. https://doi.org/10.3390/jmse10101419
Note that from the first issue of 2016, this journal uses article numbers instead of page numbers. See further details here.