Article

The Impact of the Caroline Ridge Subduction on the Geomorphological Characteristics of Major Landforms in the Yap Subduction Zone

1
Institute of Marine Geology and Resources, Ocean College, Zhejiang University, Zhoushan 316021, China
2
Department of Geology, College of Earth Sciences and Engineering, The University of Dodoma, Dodoma 41218, Tanzania
*
Authors to whom correspondence should be addressed.
J. Mar. Sci. Eng. 2022, 10(10), 1414; https://doi.org/10.3390/jmse10101414
Submission received: 3 August 2022 / Revised: 7 September 2022 / Accepted: 15 September 2022 / Published: 3 October 2022
(This article belongs to the Section Geological Oceanography)

Abstract

:
The Caroline Ridge (CR) subduction underneath the Philippine Sea Plate brings complex morphotectonic characteristics to the Yap Subduction Zone (YSZ) compared to other normal intra-oceanic subduction systems. However, due to the relative paucity of precise geomorphological information, the detailed morphotectonic settings of the YSZ remain unclear. Therefore, we combine the latest-released bathymetry, marine geomorphometry techniques, and geophysical information to investigate the geomorphological characteristics of landforms in the YSZ and their inter-relationship with the CR subduction. The Parece Vela Basin displays NE-SW oriented fractures which are believed to be influenced by the subduction of CR in the ESE-WNW direction. The north part of the Yap arc exhibits higher Bouguer anomalies, implying the absence of the overlying normal volcanic arc crust. The arc-ward trench shows abnormal higher slope values and reveals two significant slope breaks. The Yap Trench axis reveals varying water depths with an extraordinarily deep point at around 9000 m. The sea-ward trench slope displays higher slope values than normal and shows the presence of grabens, horsts, and normal faults which indicate the bending of the CR before subduction. The CR subduction is observed to be critical in the formation of significant geomorphological characteristics in the YSZ.

1. Introduction

The Yap Subduction Zone (YSZ) is the intra-oceanic subduction zone which is the outcome of the Caroline Plate subducting underneath the Philippine Sea Plate along the Yap Trench between 30 and 25 Ma [1,2]. The Caroline Ridge (CR) is the large buoyant oceanic ridge situated in the north part of the Caroline Plate which was created by the hotspot volcanism in 23 Ma [3]. The CR moved northwest with the Caroline Plate and started to subduct beneath the Philippine Sea Plate along the Yap Trench during 19–15 Ma [4,5]. The significant geomorphological and geophysical changes are realized in the intra-oceanic or ocean-continent subduction zones which are associated with the subducting bathymetric highs, e.g., oceanic ridges, plateaus, and seamounts compared to the normal subduction zones in which there is no subduction of bathymetric highs [6,7,8,9]. The Ontong Java Plateau, Ogasawara Plateau, Hikurangi Plateau, and CR in the western Pacific Ocean, and the Cocos Ridge, Carnegie Ridge, and Nazca Ridge in the eastern Pacific Ocean, are the most significant subducting bathymetric highs in the Pacific Ocean [6,7,9,10,11,12]. The YSZ is thought to have undergone a significant geomorphological and geophysical transformation as a result of the CR subduction which has resulted in unique geomorphological and geological features/characteristics, such as the existence of metamorphic rocks on the Yap arc, no active volcanism, a shorter distance between the arc and the trench axis contrasted to other subduction zones, low seismicity along the trench axis, earthquakes at lower depths (<50 km), and an undefined Wadati–Benioff zone [1,2,4,13,14,15,16,17]. The YSZ is considered to be an immature, complex, and incomplete intra-oceanic subduction zone that is associated with an actively subducting oceanic ridge [4,14,18,19]. Therefore, investigating the geomorphological characteristics of the landforms, i.e., elevation, slope, shape, size, sedimentation, ruggedness, and crust thickness, and how they are influenced by the CR subduction in the YSZ is critical for acquiring important insights and knowledge into the question of the morphotectonic characteristics that are associated with the subduction systems which incorporate subducting bathymetric highs. The discovery of such characteristics can be valuable when modeling ancient subduction settings in the subduction zones of the deep oceans.
There are still few investigations on the morphotectonic settings of the YSZ subsequent CR subduction, despite its complexity, distinctiveness, and relevance among other subduction systems [1,2,4,14,16,17,20,21,22]. Nagihara et al. [2] launched extensive geophysical measurements around the northern Yap Trench and suggested that the current plate subduction is likely despite the CR collision. Sato et al. [16] carried out seismic surveys to investigate tectonic activity in the northern Yap Trench and on the Yap islands. Fujiwara et al. [1] conducted a study on the morphology and tectonics of the Yap Trench and proposed the tectonic evolution of the YSZ. In 2015 and 2016, the research vessel Kexue from China conducted various geophysical investigations, gathering information such as bathymetry and seismic data [4]. However, the geomorphological characteristics of major landforms in the YSZ are still debatable, and it is still uncertain how the CR subduction affects the morphotectonic characteristics of the major geological units in the YSZ. Therefore, in this study, we combine the latest and relatively higher-resolution global bathymetry data, marine geomorphometry techniques, and gravity information to analyze the geomorphological characteristics of landforms in the YSZ, and thereby determine the impact of the CR subduction on the formation of the discovered characteristics.

2. Materials and Methods

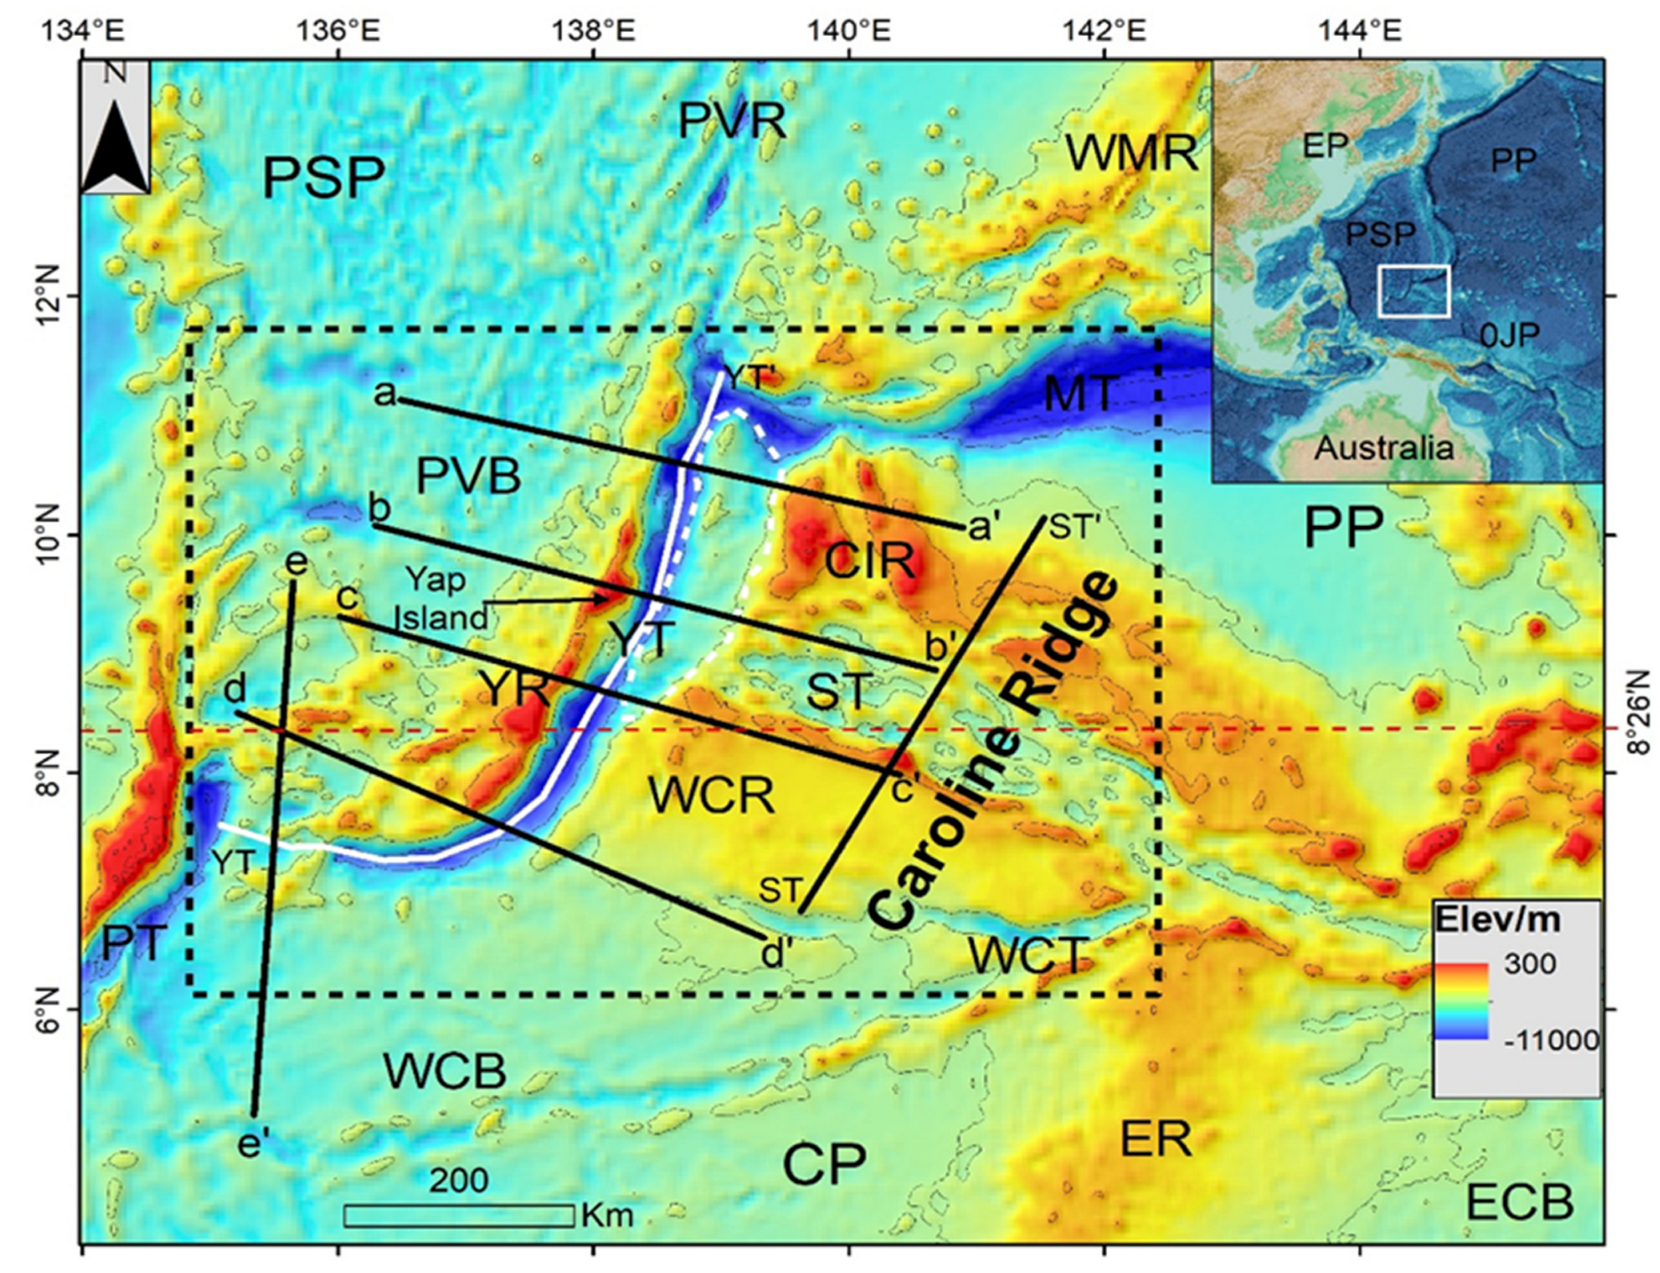
2.1. Tectonic Settings of the YSZ

Figure 1 depicts the position of the YSZ and the nearby regions. The YSZ is located in a highly complex zone of subduction that interconnects the Philippine Sea Plate, Pacific Plate, and Caroline Plate. The subduction of the Caroline Plate underneath the Philippine Sea Plate along the Yap Trench axis at around 30 Ma resulted in the formation of the YSZ. The Caroline Plate subducts at an oblique angle with an estimated subduction speed of 0–6 mm per year [23]. The YSZ is a typical trench-arc-basin system, containing the Yap Trench axis, Yap arc, and Parece Vela Basin. The CR, a large buoyant NEE-SWW oriented oceanic ridge located in the north part of the Caroline Plate, is made up of a series of volcanic seamounts that are believed to have formed in a hotspot less than 30 Ma [3,24,25]. The CR moved in the SEE-NWW direction with the Caroline Plate and started to subduct beneath the Philippine Sea Plate along the Yap Trench during 19–15 Ma [4,5], leading to significant geomorphological and geophysical changes in the YSZ. The Sorol Trough, an extensional rift that separates the Caroline Island Ridges from the West Caroline Rise, was formed during 15–5 Ma [4,20]. It is proposed that the extensional rifting of the Sorol Trough did not progress to the complete tectonic spreading [20]. The collision of the CR and Yap Trench from 20 Ma to 15 Ma is thought to have stopped subduction in the YSZ [21,26,27]. However, several other researchers suggested that subduction was ongoing at a very low subduction speed [1,2,16,28]. It is believed that the CR subduction has caused seismic activities along the YT to be extremely rare, with earthquakes occurring at extremely shallow depths [1]. Moreover, the CR collision is believed to have significantly shortened the distance between the Yap arc and the Yap Trench axis to less than 40 km [1].
During the Eocene, the Pacific Plate was subducted to the west beneath the Philippine Sea Plate, forming the Parece Vela Basin [30,31]. From 30 Ma to 15 Ma, the Parece Vela Basin began to spread symmetrically forming the eastern and western sections with the Parece Vela Rift as a spreading center [15,22,31,32]. The eastern section of the southernmost Parece Vela Basin south of 11°30′ N is currently not visible (Figure 1). Following the CR subduction, the eastern section is thought to have been pushed over the Yap arc [28]. However, other researchers propose that the transform fault displaced the east part and it is currently located in the southernmost section of West Mariana Ridge [4,22,25]. In contrast to most oceanic arcs, which are formed by volcanic rocks, the Yap arc is primarily made from metamorphic rock formations and lacks active volcanism [21]. The collision of the CR with the Philippine Sea Plate is believed to be the reason for the obduction of the oceanic crust of the southernmost Parece Vela Basin and subsequent metamorphic mechanisms on the Yap arc [4]. Given the above geological features, the YSZ is thought to be unique and controversial in the current plate subduction activities in the ocean.

2.2. The Bathymetry Data

The GEBCO_2021 bathymetry was used for analysis in this study [29]. The GEBCO_2021 bathymetry is the most recent GEBCO bathymetry product which was released in July 2021, with a resolution of 430 m × 430 m. The GEBCO grids are the most extensively used global bathymetry data [33,34,35,36]. The GEBCO grids are ideal and very suitable for analyzing massive seafloor features such as continental shelves, subduction zones, seamounts, and seafloor spreading zones [33,34,36,37].

2.3. The Marine Geomorphometry Technique

Geomorphometry is a quantitative earth surface analytical science that originated from geomorphology and evolved from mathematics, earth sciences, and computer science [33,38]. Marine geomorphometry refers to the generation of terrain attributes (e.g., slope, aspect, and curvature) from bathymetry which is known as general geomorphometry, and the extraction of discrete seabed features (e.g., valleys, seamounts, and ridges) from bathymetry which is known as specific geomorphometry [39,40,41].

2.3.1. The General Geomorphometry Technique

The terrain attributes that are known to capture most of the seafloor general geomorphologic characteristics are broad- and fine-scales Bathymetric Position Index (BPI), standard deviation, rugosity, aspect, bathymetric mean, curvature, ruggedness, and slope [33,39,40,42,43,44,45,46,47,48,49,50]. The slope, broad and fine scales BPI, and terrain ruggedness/roughness were found to be suitable for the analysis of this study (Table 1). The four terrain attributes were derived from the GEBCO bathymetry by using the Benthic Terrain Modeler (BTM) extension [51,52,53], of the ArcGIS 10.4.3. The slope, broad BPI, fine BPI, and bathymetry data were later combined to extract seabed geomorphic features.

2.3.2. The Specific Geomorphometry Technique

The BTM classification method was used to extract seabed geomorphic features [51,52,53,54]. A customized classification dictionary [52,54], bathymetry data, slope, broad BPI, and fine BPI were combined using the Classify Benthic Terrain Tool of the BTM to partition the seabed into geomorphic features. The selection of specific seabed features and the development of the classification dictionary for this study (Table 2) were based on previous studies [1,4,5,14,17,19,25,37], and by utilizing the Identify Tool of ArcGIS to investigate the upper and lower limits of the bathymetry, slope, broad BPI, and fine BPI.

2.4. Gravity Anomalies

The free-air, Bouguer, and isostatic gravity anomalies were computed from the WGM2012 global grid with a 1′ × 1′ resolution provided by the Commission for the Geological Map of the World (WGMW) [55,56]. The Bouguer anomaly was calculated using bathymetry data from the 1′ × 1′ ETOPO1 Global Relief model and free-air gravity information generated from surface gravity measurements, satellite altimetry, and satellite gravimetry. The Bouguer gravity correction was based on crustal rock density of 2670 kg/m3 and ocean water density of 1027 kg/m3.

3. Results and Discussion

3.1. The Geomorphological and Geophysical Characteristics of the Major Landforms in the YSZ

3.1.1. The Bathymetric Characteristics of the Major Morphotectonic Regions in the YSZ

Figure 2, Figure 3 and Figure 4b display the bathymetric characteristics of the most important morphotectonic regions of the YSZ, i.e., the southernmost Parece Vela Basin (south of 11°30′ N of the main Parece Vela Basin), Yap arc, arc-ward trench slope, Yap Trench axis, and sea-ward trench slope.
The bathymetric analysis reveals the large NE-SW direction sinuous fractures, seafloor fabrics, and depressions north of 9°00′ N of the southernmost Parece Vela Basin (Figure 2 and Figure 3 with profiles aa’ and bb’). The depressions and seafloor fabrics are also revealed in our geomorphometric analysis in which the seafloor fabrics are assigned the geomorphic feature “seamounts” (Figure 7). The fractures and seafloor fabrics are thought to be the extensions of the Parece Vela Rift and they were formed by the seafloor spreading of the Parece Vela Basin [1,4,15,22,25]. The seafloor fabrics are thought to have formed during the first stage of the Parece Vela Basin spreading which was triggered by the subduction of the Pacific Plate in the E-W direction [31]. The NE-SW oriented fractures, which are located alongside the Yap arc (Figure 2 and Figure 3), are thought to have formed during the second stage of the Parece Vela Basin spreading which was influenced by the subduction of the CR in the SEE-NWW direction [1,4]. The depressions are believed to be formed due to the lack of magma in the spreading center of the Parece Vela Basin which was caused by the stoppage of the Parece Vela Basin spreading after the CR collision [1,25]. The submarine topography of the southernmost Parece Vela Basin south of 9°00′ N displays complex topography of many massive bathymetric highs (Figure 2 and Figure 3 with profiles cc’, dd’, and ee’). The average bathymetry here is approximately 3000 m higher than the northern section. Our geomorphometric analysis displays the rougher seabed with many alternating seamounts, depressions, steep slopes, and large oceanic ridges in this region (Figure 7), implying that the southern and northern sections of the southernmost Parece Vela Basin were not formed in the same tectonic setting.
Figure 3 shows that the overall bathymetry of the Yap arc decreases constantly from the north to the south. The bathymetric values of the Yap arc are observed to be proportional to the bathymetric values of the subducting Sorol Trough, West Caroline Rise, and West Caroline Basin, implying that the water depths of the different regions of the subducting plate influence the formation of water depths of the Yap arc. However, there is an exceptional trend in the north of 10°00′ N of the Yap arc which displays an unusually lower bathymetry of about 4000 m (Figure 3 (profile aa’)), much higher than many volcanic arcs of the oceans. It suggested that the strong structural erosion caused by the strong coupling between the subducting Caroline Island Ridges, horsts and grabens, and normal-faulted structures and the overriding Philippine Sea Plate results in the crustal thinning of the over-thickened volcanic arc crust north of 10°00′ N of the Yap arc and hence leading to the formation of abnormally lower bathymetric values.
The bathymetry of the arc-ward trench slope is observed to be much lower north of 8°26′ N than in the south (Figure 3). Furthermore, the bathymetric values of the subducting Caroline Island Ridges, Sorol Trough, and West Caroline Rise (Figure 3, profiles aa’, bb’, and cc’) in the north of 8°26′ N are approximately 2500 m higher than that of the subducting West Caroline Basin in the south (Figure 3, profiles dd’ and ee’). The bathymetric values of the arc-ward trench slope and subducting plates are observed to be strongly correlated, indicating that the bathymetric values of the subducting plates dictate the bathymetric values of the arc-ward trench slope. In addition, the arc-ward trench slope displays the bathymetric highs north of 8°26′ N which are correlated with the bathymetric highs on the opposite sea-ward trench slope (Figure 2). Moreover, the uplift is observed on the arc-ward trench slope as shown in Figure 3 (profile bb’). The subducting seafloor fabrics on the zone of horsts and grabens are thought to trigger a force that uplifts the overlying oceanic crust layer on the opposite arc-ward trench slope [1,25].
The average bathymetry north of 8°26′ N of the Yap Trench axis is lower than in the south (Figure 3 and Figure 4b). The lower bathymetric values on the north of the Yap Trench axis are observed to be correlated with the bathymetric values of the subducting Caroline Island Ridge, Sorol Trough, and West Caroline Rise, implying that the bathymetric values of the subducting CR influence the formation of the lower bathymetric values of the Yap Trench axis. Furthermore, the bathymetric values along the Yap Trench range between 3000 and 9000 m, with the maximum depth at approximately 9000 m at 10°29′ N, making the Yap Trench one of the deepest trenches in the ocean. Moreover, several isolated shallow values can be found in the north of 8°26′ N of the Yap Trench axis at 9°05′ N, 10°10′ N, and 10°51′ N. The bathymetry along the Yap Trench axis increases steadily towards the south of 8°26′ N. The seamount/ridge at 7°33′ N interrupts the trench axis, and typical trench geomorphology is not observed from 136°00′ E toward the Palau Trench.
The noticeable bathymetric low which is lower 1–2 km than the CR and located north of 8°26′ N in the transition zone between the western side of the Caroline Island Ridge, Sorol Trough, and West Caroline Rise and the Yap Trench axis is revealed on the sea-ward trench slope (Figure 2 and Figure 3 (profiles aa’ and bb’)). The bathymetric low is a zone of horst and graben structures associated with multiple normal faults [1,14,19,22], indicating that the CR bends before subduction and thus there is an extensional setting environment. Furthermore, the large varying direction fractures are realized in the area of horsts and grabens (Figure 2 and Figure 3 (profile aa’)). We suggest that the fractures are the result of the increased compressional stress at the Yap Trench axis which is caused by the subducting horsts and grabens and seamounts of the CR.

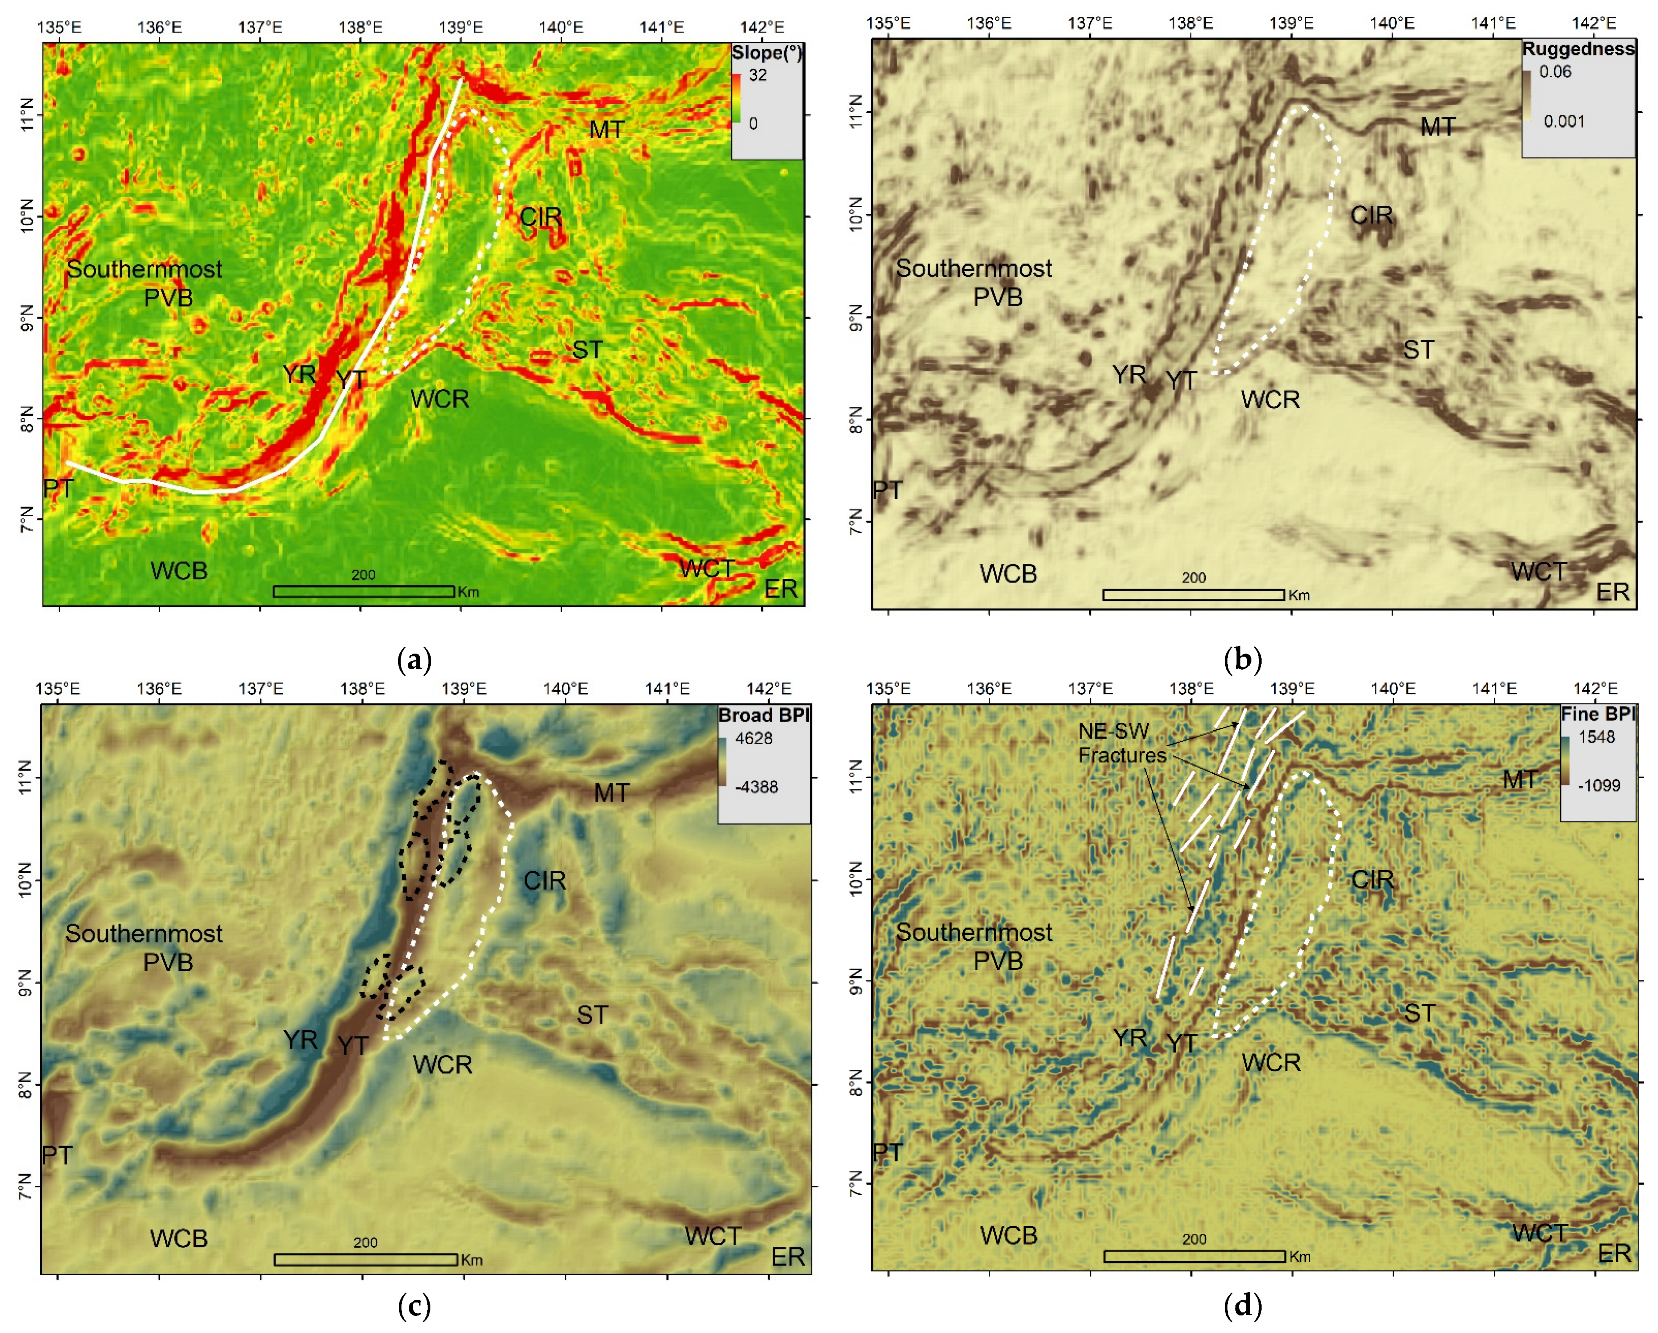
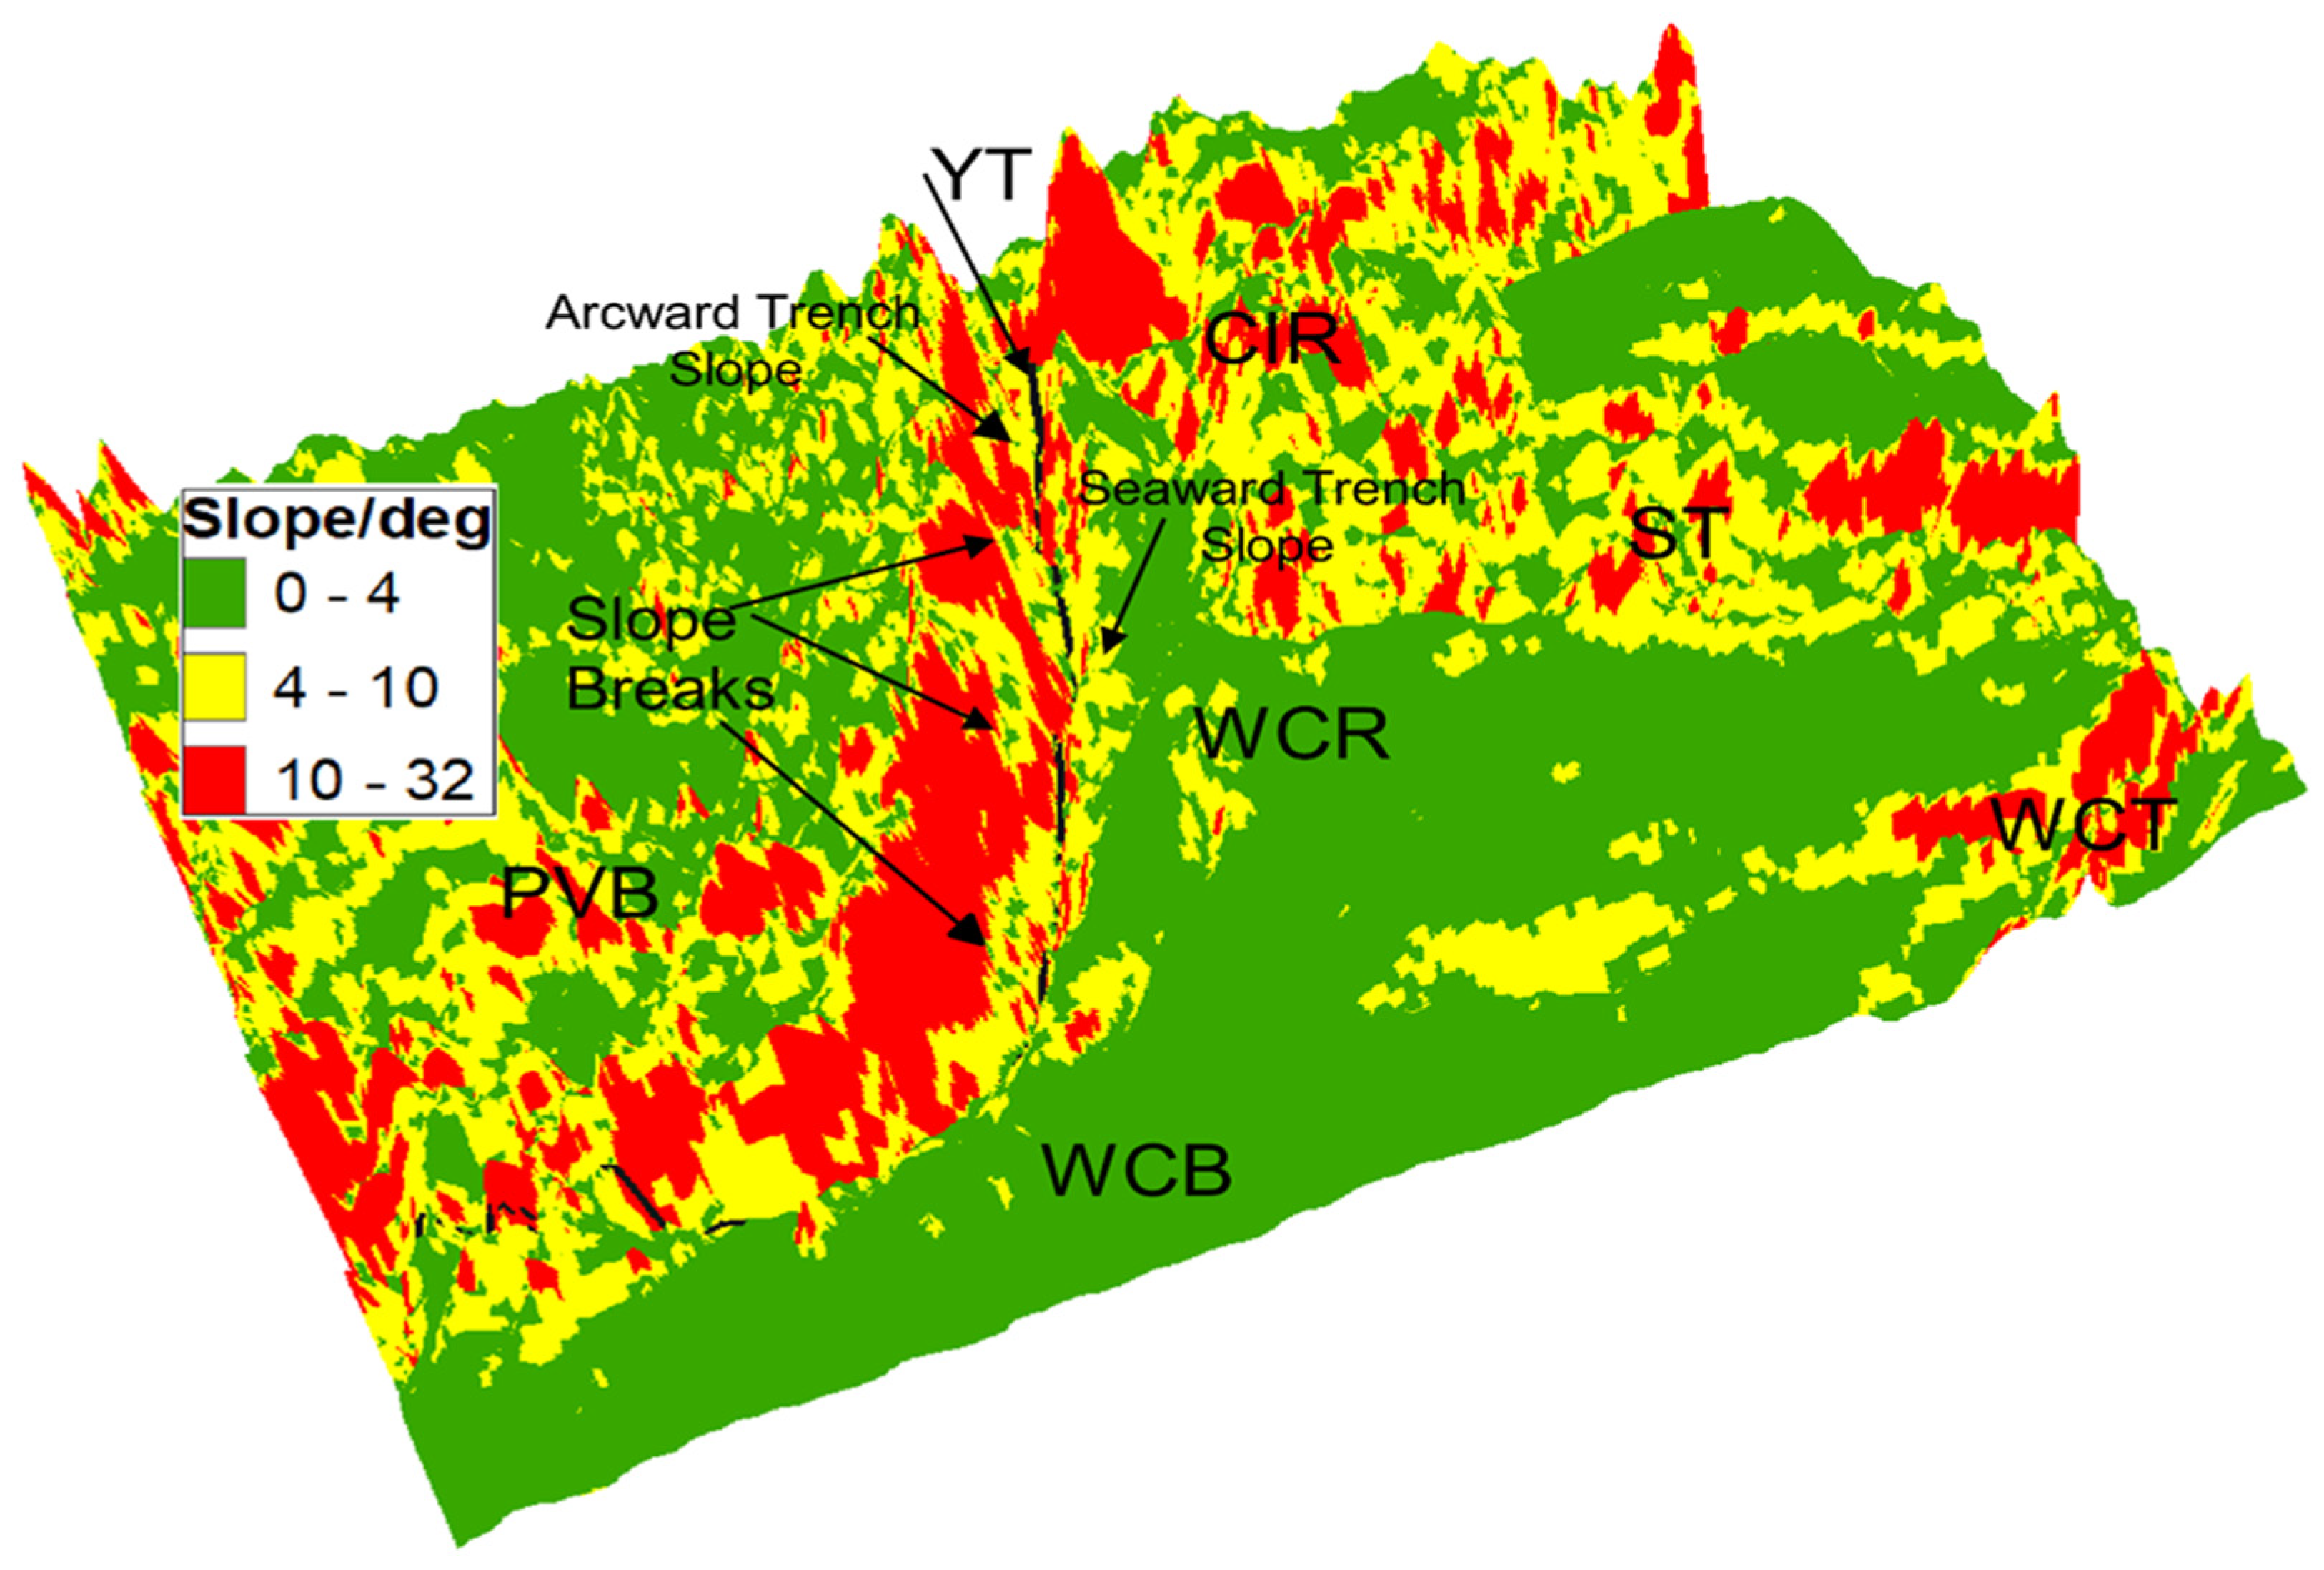
3.1.2. The General Geomorphological Characteristics of the YSZ

The terrain attributes that are determined to be most suitable for analyzing the general geomorphologic characteristics of the YSZ include slope, ruggedness, broad BPI, and fine BPI (Figure 5).
Figure 5a shows lower or moderate slope values in most of the north of 9°00′ N of the southernmost Parece Vela Basin, implying the absence of massive steep-sided bathymetric highs and deep valleys/troughs on this side. Unlike the northern part, the average slope in the south of the southernmost Parece Vela Basin is high because of the presence of highly rugged topography which is occupied by massive steep-sided oceanic ridges, seamounts, and depressions as also shown in Figures 5b and 7.
The arc-ward trench slope is steeper north of 8°26′ N than the south (Figure 3 and Figure 6), possibly due to the vertical movement caused by higher compressional stress imposed at the Yap Trench axis by the subduction of Caroline Island Ridges, West Caroline Rise, and horsts and grabens. Moreover, the two significant slope breaks are identified on the arc-ward trench slope north of 7°30′ N (Figure 3, Figure 5a and Figure 6). The slope breaks have shallower and deeper boundaries at bathymetric values around 5000–6000 m and 6500–7500 m, respectively. Using the swath bathymetry investigations, Fujiwara et al. [1] also discovered these slope discontinuities and suggested that the slope breaks represent thrust faults and lithologic bounds in the overlying Philippine Sea Plate. However, using detailed seismic surveys, Dong et al. [4] discovered no indication of fault zones and lithologic bounds on the slope breaks, instead, they identified the mass wasting reflections at the relatively shallow slope break, indicating the progression of the submarine landslides.
The dominant slope values north of 8°26′ N of the sea-ward trench slope at the contact zone between the CR and Yap Trench axis are observed to be extremely higher (4–10°) (Figure 5a and Figure 6) than typical values (1–3°) [1]. Furthermore, relatively higher slope values are observed between the zone of horsts and grabens and the Caroline Island Ridges, Sorol Trough, and West Caroline Rise, suggesting that the horsts and grabens were developed from the bending and faulted rift shoulder of the subducting CR. This is also consistent with the occurrence of the geomorphic feature “steep slope” between the zone of horsts and grabens and the Caroline Island Ridges, Sorol Trough, and West Caroline Rise as shown in the geomorphic features map in Figure 7.
Figure 5b shows a higher rugged seafloor south of the 9°00′ N of the southernmost Parece Vela Basin than in the north. The smooth terrain that is observed between the high rugged terrain in the north is an indication that sediments are buried in troughs between the ridges/seamounts. Using the seismic surveys, Dong et al. [4] suggested that the highly rugged topography in the north of the southernmost Parece Vela Basin represents irregular ridges that probably resulted from volcanic activities that occurred during the Parece Vela Basin spreading. They also found the development of sedimentary layers in the trough/depressions between the ridges/seamounts in the north of the southernmost Parece Vela Basin. Furthermore, the extremely rugged seafloor in the south of the southernmost Parece Vela Basin is consistent with the rough seafloor presented by the steep slopes between the alternating ridges, depressions, and seamounts as shown in the geomorphological classification map in Figure 7.
The Yap Trench axis is highly rugged, especially at the contact surface with highly elevated Caroline Island Ridges and West Caroline Rise (Figure 5b), indicating that there are little/no sediment deposits in the Yap Trench axis and therefore the subduction is currently continuing. This is consistent with the bathymetric analysis which reveals the V-asymmetric shape of the Yap Trench axis (Figure 3), which is an indication that there is no sediment accumulation in the Yap Trench axis and thus the sediments are currently subducting. Using the swath bathymetry surveys, Fujiwara et al. [1] also found no indication of sediment accumulations in the Yap Trench axis and suggested that the sediments are subducting at the moment. The high terrain ruggedness is observed on the Sorol Trough because of the existence of numerous seamounts consistent with the distribution of geomorphic features in Figure 7, implying that there were intense volcanic eruptions during the rifting process. It is strongly believed that the Sorol Trough is still active [4,14,20,57].
Figure 5c shows that the higher bathymetric ranges on the arc-ward and sea-ward trench slopes north of 8°26′ N are correlated. Moreover, the area of the horsts and grabens displays the same bathymetric range as that of the CR. This is an indication that these structures were formed near the colliding front of the CR and the Yap Trench axis and thus there is a possible intrinsic connection between CR and horsts and grabens. Figure 5d reveals the large NE-SW direction sinuous fractures in the southernmost Parece Vela Basin which is consistent with the findings in Figure 2 and Figure 3 (profile aa’).

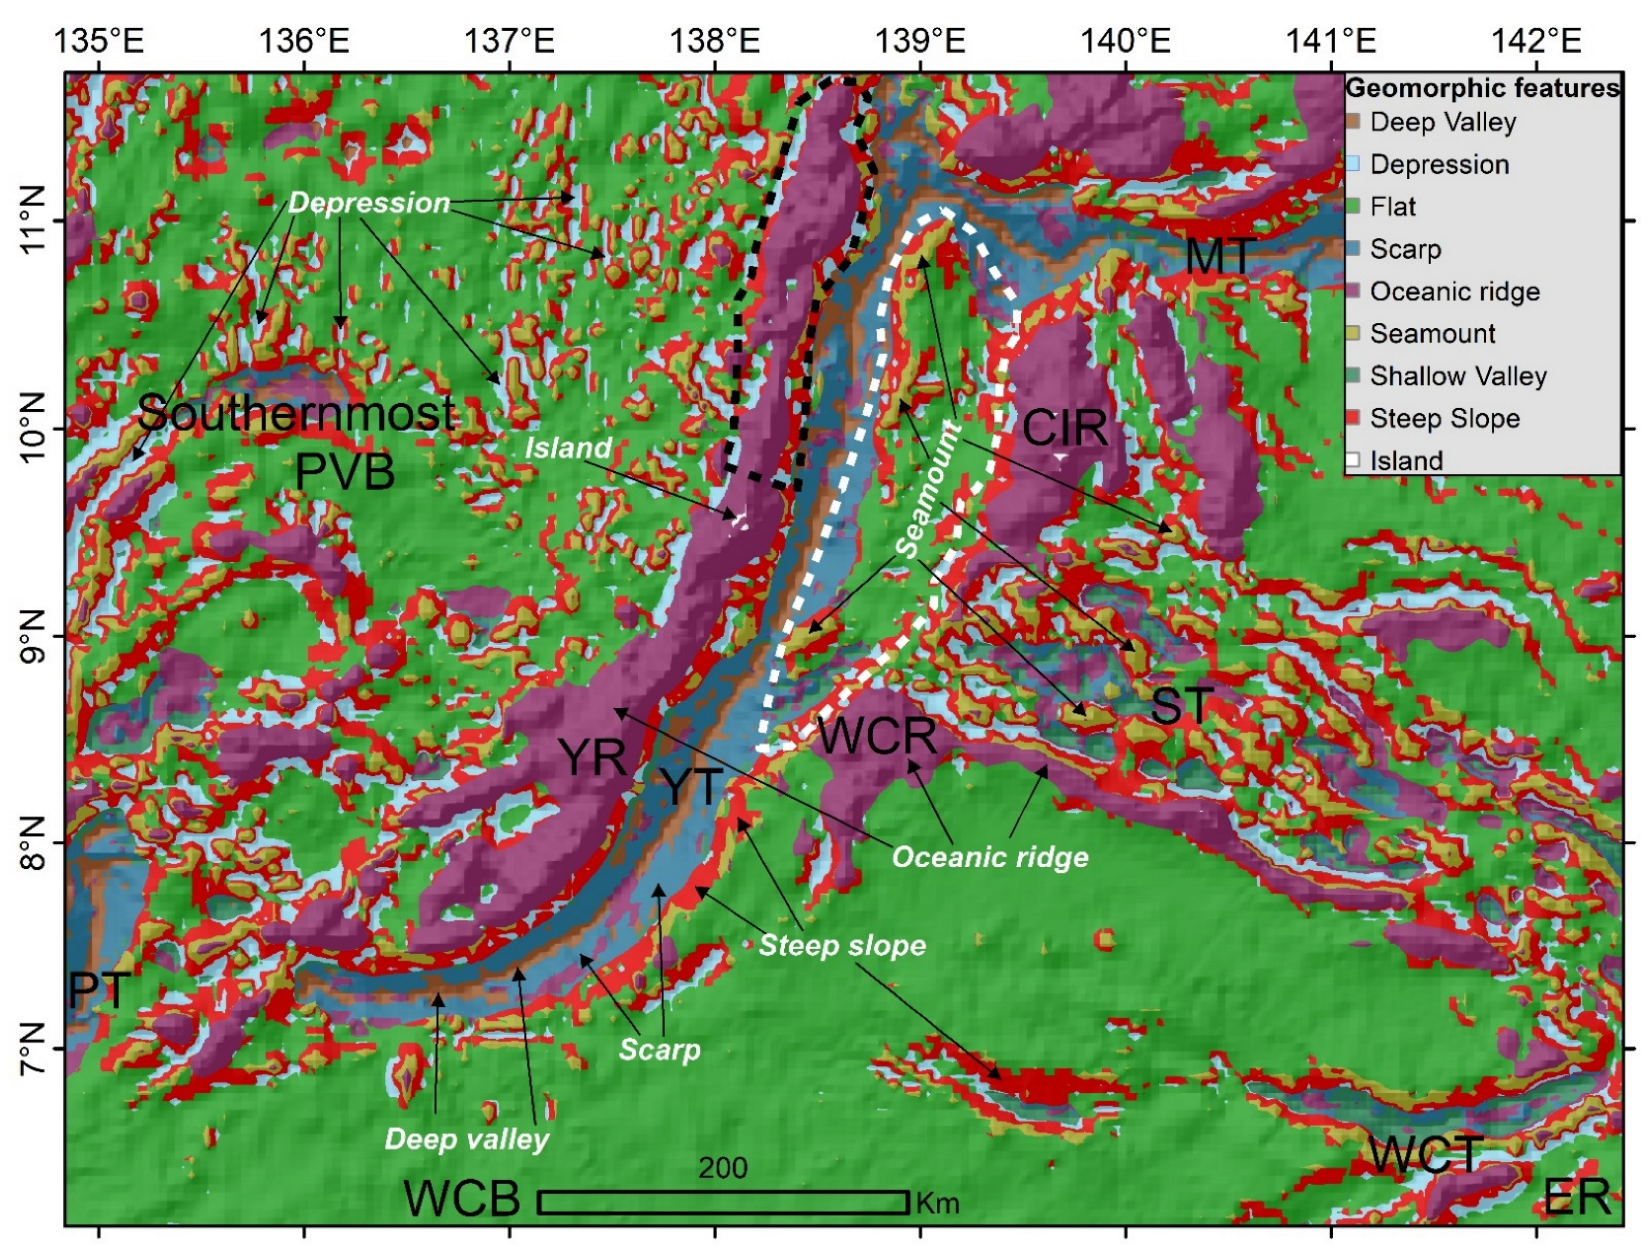
3.1.3. The Classification of Geomorphic Features in the YSZ

For the first time, we represent the important seabed geomorphic features of the YSZ (Figure 7). The nine geomorphic features are determined to be most suitable for analyzing the specific geomorphologic characteristics of the YSZ include “deep valley”, “depression”, “flat”, “scarp”, “oceanic ridge”, “seamount”, “shallow valley”, “steep slope”, and “island”.
The small-scale seamounts are identified north of 9°00′ N of the southernmost Parece Vela Basin (Figure 7). The seamounts are equivalent to the N-S-oriented seafloor fabrics or abyssal hills that were previously discovered using swath bathymetric surveys [4,25]. It is suggested that the N-S-oriented fabrics/seamounts/abyssal hills were created by the first stage of the Parece Vela Rift spreading in the E-W direction [1,4]. In addition, the highly-concentrated depressions are also displayed north of the southernmost section of Parece Vela Basin (see also Figure 3 (profiles aa’ and bb’)). The depressions are thought to result from a lack of magmatism when spreading ceased due to the collision of the CR and Philippine Sea Plate. The area south of 9°00′ N of the southernmost Parece Vela Basin displays rough seabed with many alternating seamounts, large depressions, steep slopes, large oceanic ridges, and flat zones (see also Figure 3 (profiles dd’ and ee’)). Using the swath bathymetry data, Dong et al. [4] discovered the oceanic ridges and seamounts in this region and suggested that they may be the results of tectonic activities i.e., volcanoes. Due to this finding, they hypothesized that the Parece Vela Basin spreading influenced the earlier crust of this region, resulting in similar features to those formed by seafloor spreading. They also discovered sediment deposition in the troughs more than 200 m thick in this area. We can suggest that the discovered flat zones/basins between the ridges and/or seamounts in this area may represent the zones where sediments are deposited.
The Yap Ridge is thinner/narrower north of the 10°00′ N than in the south (Figure 7), which is consistent with our Bouguer anomaly analysis (Figure 8b). This finding suggests that there is an absence of a normal over-thickened and less dense volcanic arc crust in the northern Yap arc. The deep valley with scarps on the sides, representing the Yap Trench axis, is observed to be elongated from the north of the trench axis toward the south and interrupted by the subducting seamounts of the CR at 9°05′ N, 138°26′ E; 10°10′ N, 138 °54′ E; and 10°51′ N, 138°58′ E (Figure 7). The sharp scarps which are observed on the seaward trench slope at the intersection between the Yap Trench axis and the CR north of 8°26′ N are presumably formed by bending and normal faulting of the CR before subducting beneath the Philippine Sea Plate. In addition, the geomorphic feature “steep slope” is observed between the zone of horsts and grabens and the Caroline Island Ridges, Sorol Trough, and West Caroline Rise (see also Figure 5a), suggesting that the horsts and grabens were developed from the bending and faulted rift shoulder of the subducting CR. Moreover, the numerous seamounts, oceanic ridges, steep slopes, and scarps are displayed on the Sorol Trough, implying that there were intense volcanic eruptions during the rifting period.

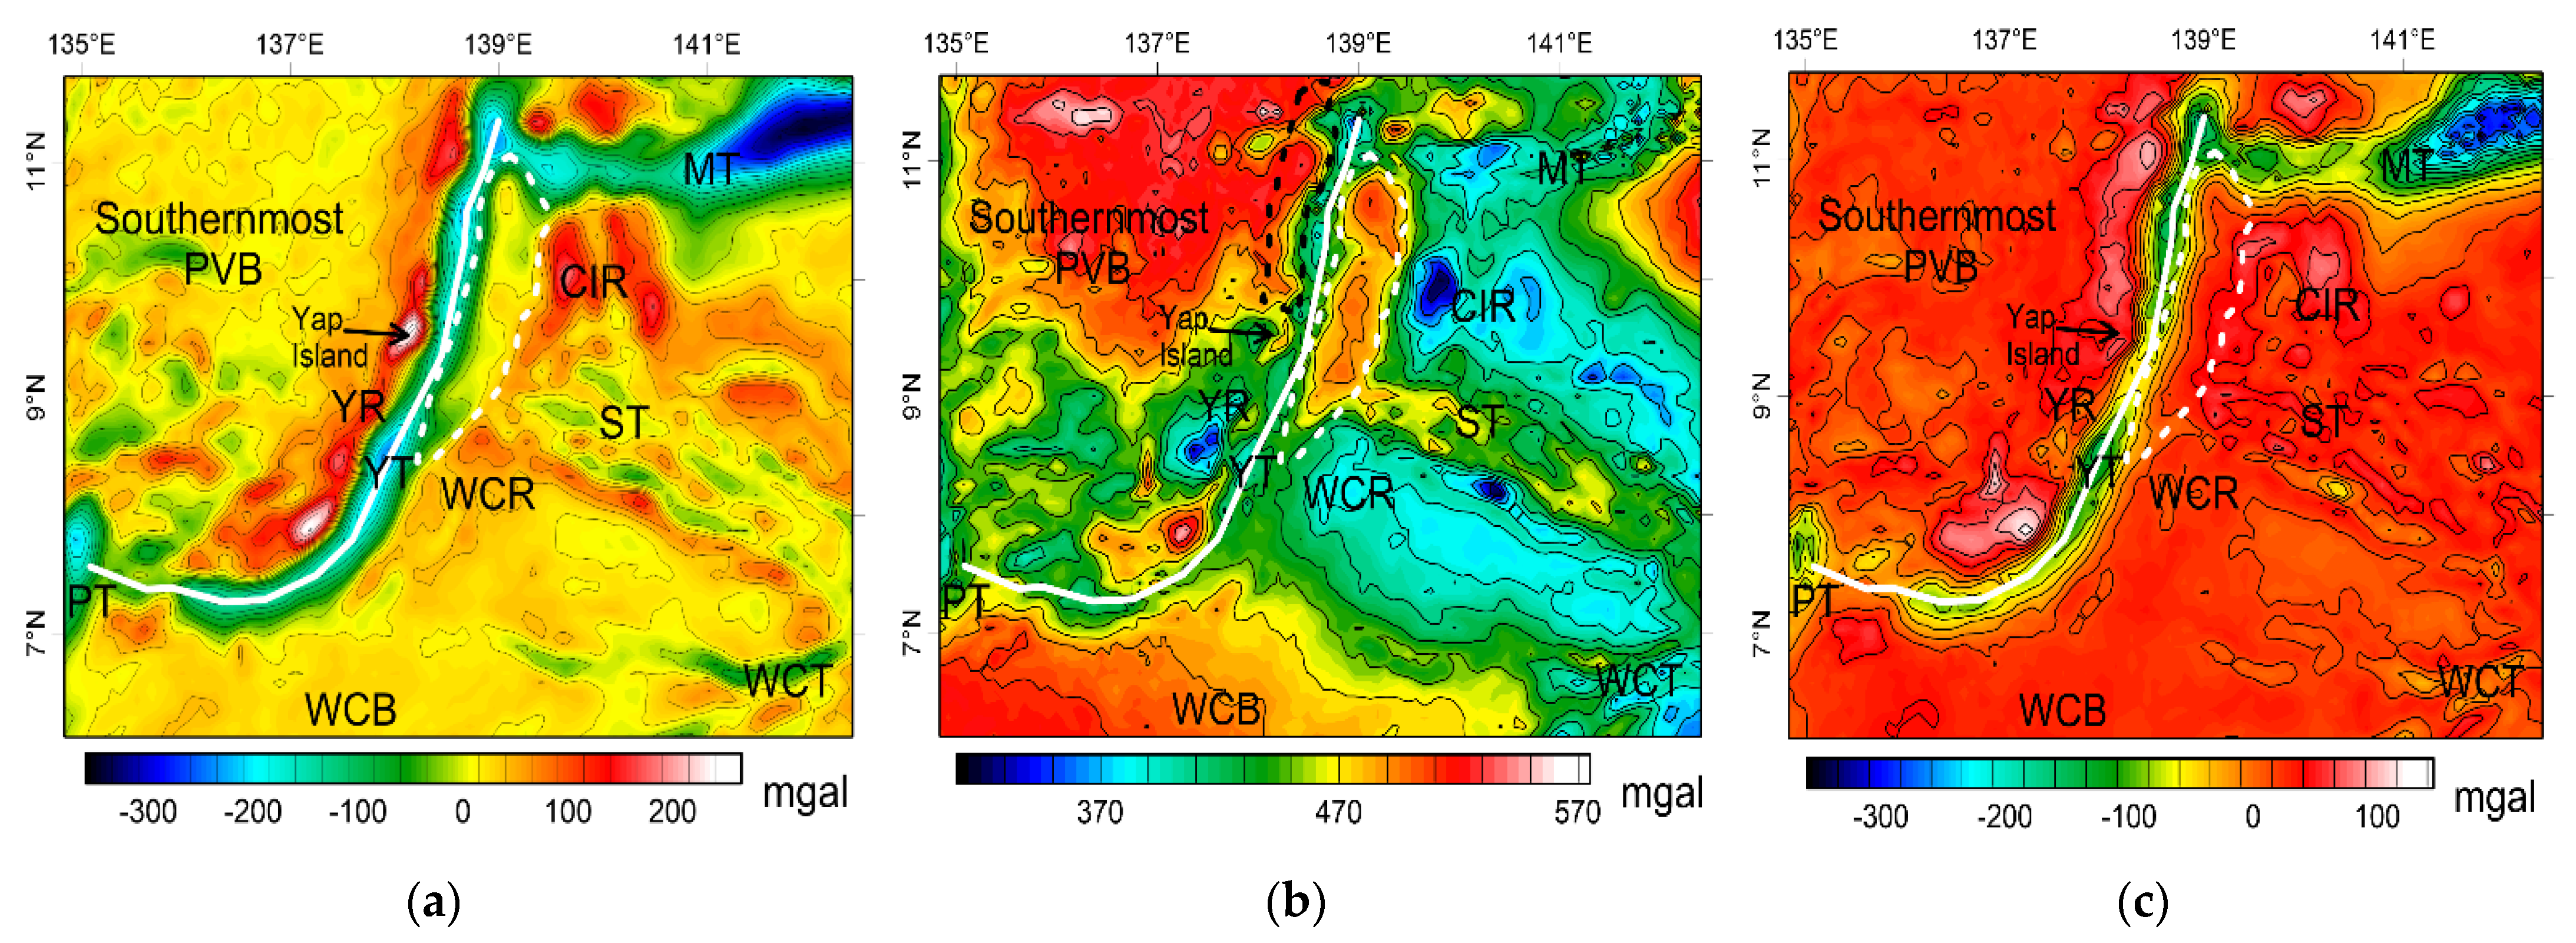
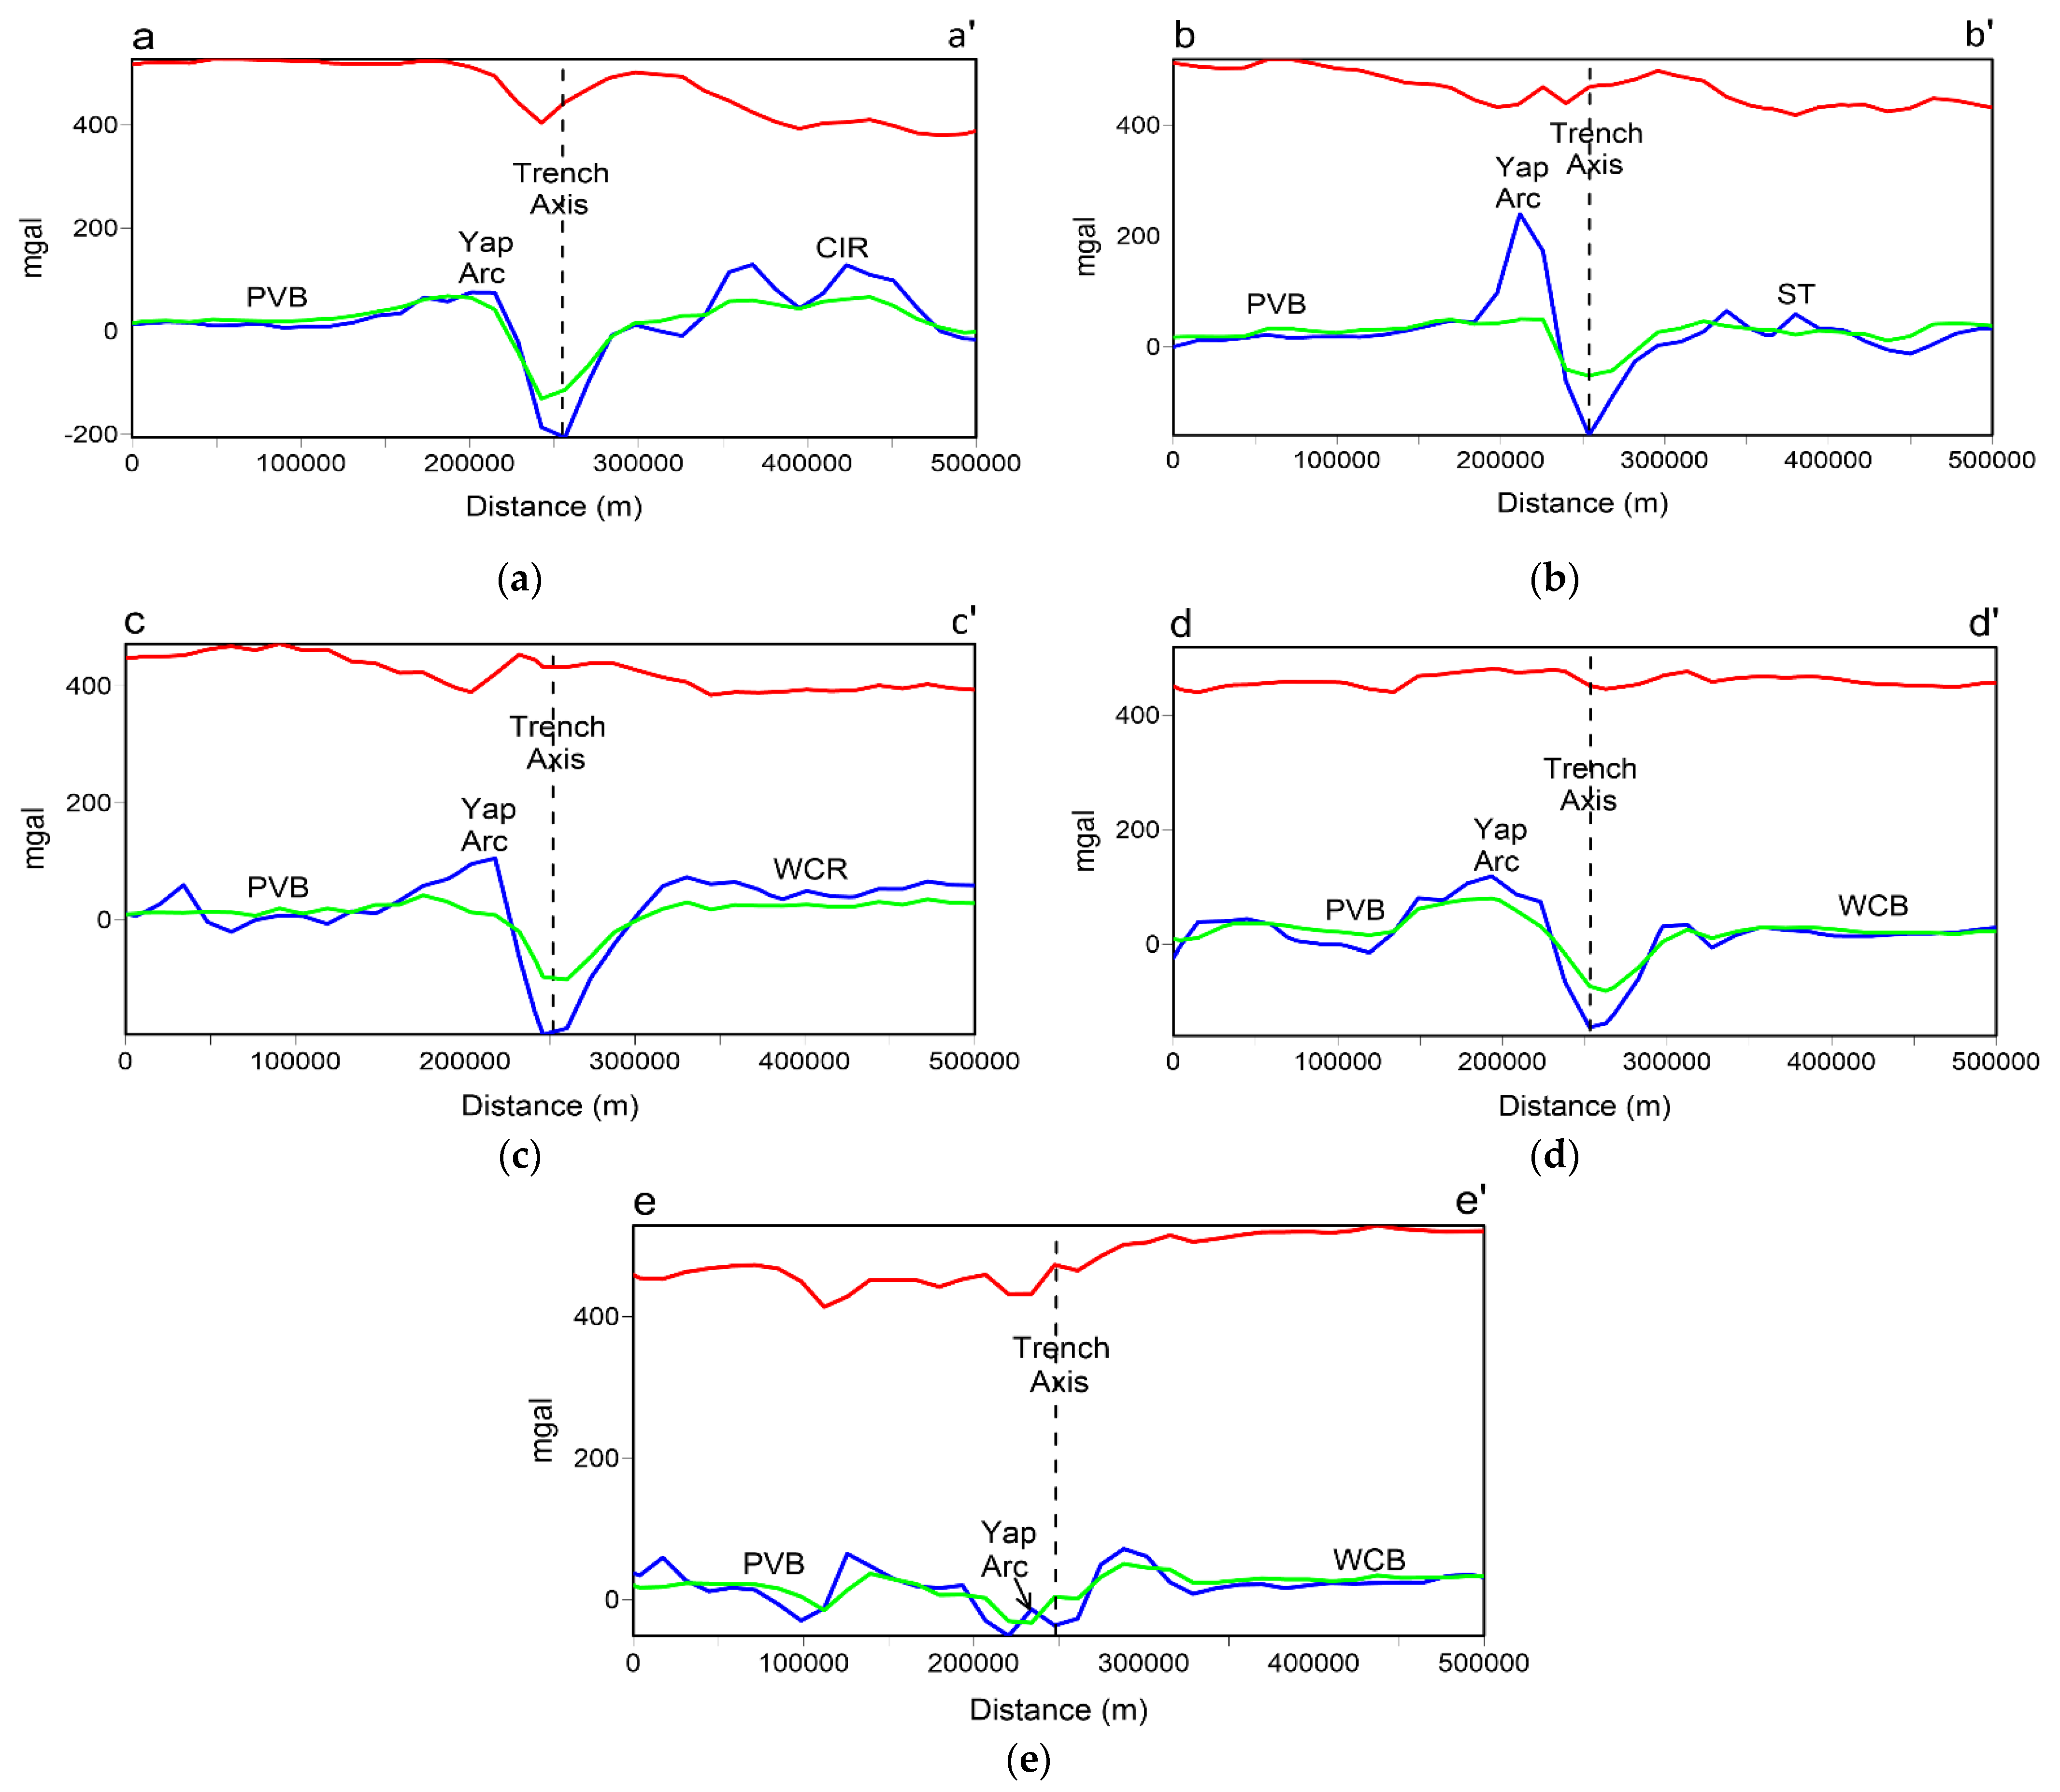
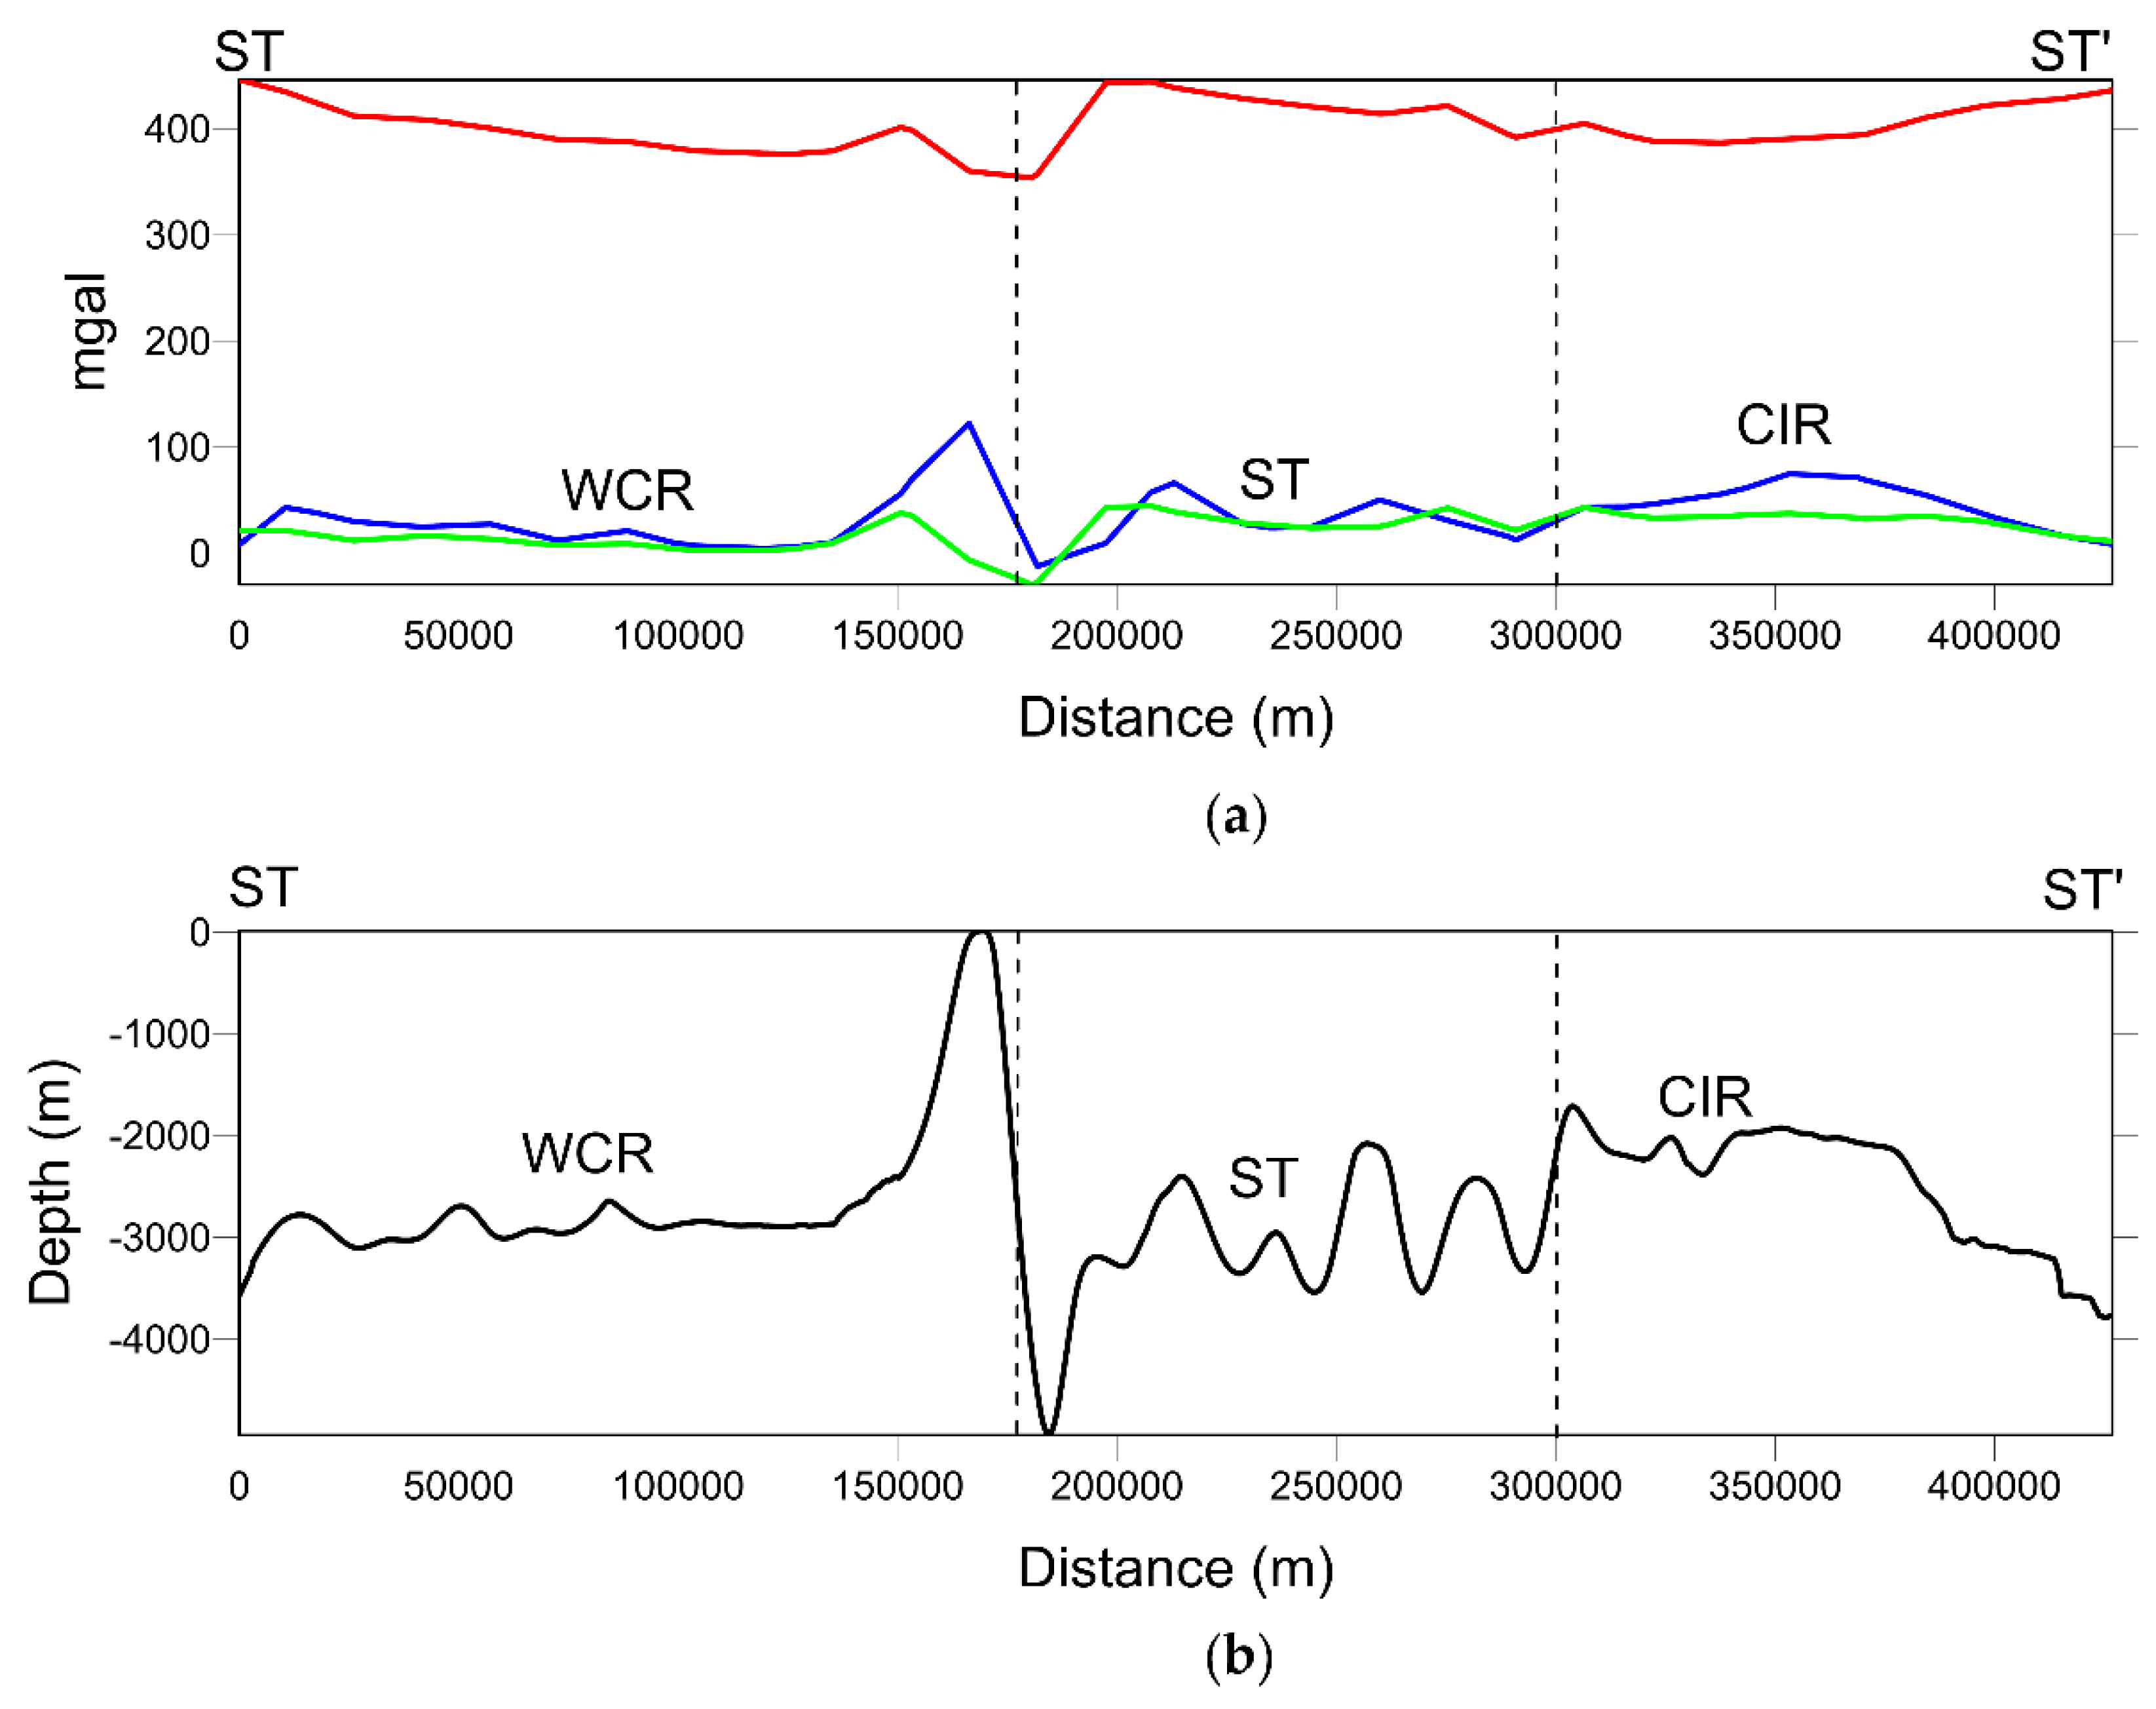
3.1.4. The Gravity Anomalies in the YSZ

Figure 8a displays the free-air gravity anomaly of the YSZ. The Caroline Island Ridges and West Caroline Rise exhibit large values of positive anomalies which are influenced by the presence of over-thickened oceanic ridges beneath these regions as shown geomorphic analysis map in Figure 7. The Parece Vela Basin and West Caroline Basin show near-zero anomalies (see also Figure 9), suggesting that the basins are generally near isostatic equilibrium. Significant differences in free-air gravity anomaly can be seen south of 9°00′ N of the southernmost Parece Vela Basin (see also Figure 9d,e), these differences are believed to be influenced by the dramatic changes in the bathymetric values in this region as shown in our bathymetric analysis (Figure 2 and Figure 3). Moreover, the anomaly of the Parece Vela Basin abruptly increases north of 8°26′ N, from near-zero up to +200 toward the Yap Trench (Figure 9b), indicating that the basin has been uplifted by tectonic force. The Yap Trench axis shows high values of negative anomalies that fall below −200 mGal (Figure 4a), indicating that the dynamic force which is associated with ongoing subduction is acting upon the Yap Trench. High values of the negative anomaly of the Yap Trench vanish from 136°00′ E to the west (Figure 4a), which is consistent with the presence of seamounts, ridges, and depressions along the trench axis as illustrated in the geomorphic features map in Figure 7. The zone of horsts and grabens show near-zero anomaly (see also Figure 9a,b), suggesting that there is the absence of a thick crust of the CR underneath this region. We can suggest that the bending, extending, and subduction of the CR which led to the formation of horsts and grabens have influenced the loss of the thick crust of the CR in this region.
Figure 8b depicts the Bouguer gravity anomaly. The lower anomalies over the Caroline Island Ridges and West Caroline Rise are an indication that the Caroline Island Ridges and West Caroline Rise contain the underlying low-density crust that is uplifted by buoyancy. The Sorol Trough shows relatively higher anomalies than the Caroline Island Ridges and West Caroline Rise (see also Figure 10a), indicating that it has been formed recently and has a thinner underlying oceanic crust. The zone of horst and graben structures displays a higher Bouguer anomaly than the Caroline Island Ridges, West Caroline Rise, and Sorol Trough (see also Figure 9a,b), indicating the absence of an underlying thick crust of the CR. A moderate Bouguer anomaly is revealed along the Yap Trench axis (Figure 4a). The lower Bouguer anomalies north of 8°26′ N of the arc-ward trench slope correlate to bathymetric highs, local uplifts, and slope breaks and in the south, they correlate to the Yap arc, implying that the normal volcanic arc crust exists in the southern section of the Yap arc. In most subduction systems, a low Bouguer anomaly is observed all over the arc because of the development of the thick and low-dense volcanic arc crust underneath the arcs [1,58,59]. In contrast, higher Bouguer anomalies predominate the Yap arc north of 10°00′ N (see also Figure 9a) which is an indication that the thin and high-dense crust exists beneath the arc and the normal thick and less dense arc crust does not exist beneath this area. The Bouguer anomalies south of 9°00′ N of the southernmost Parece Vela Basin vary greatly, highlighting the complexity of tectonic activities in the region.
Figure 8c shows the isostatic anomaly in the YSZ. The results display no obvious structural pattern of two rises (Caroline Island Ridges and West Caroline Rise) and one depression (Sorol Trough) in the CR (Figure 10). A higher isostatic anomaly is observed in the Sorol Trough (Figure 10a), indicating that the crustal activity is strong. A large negative anomaly is observed in the Yap Trench axis, particularly at the contact zone between the trench and the Caroline Island Ridges and West Caroline Rise (see also Figure 4a and Figure 9a,c), indicating that subduction is still occurring and that a less-density and over-thickened crust of the CR is being subducted beneath the overriding Philippine Sea Plate, leading to mass wasting at the trench axis. Furthermore, there is no noticeable variation in anomalies in a zone of horsts, grabens, and normal faulted structures and the CR. The isostatic anomalies in the south and north of the 9°00′ N of the southernmost Parece Vela Basin show no noticeable difference, indicating that the variations in the Bouguer anomalies in the south are caused by differences in crustal thickness.

3.2. The Influence of the CR Subduction on the Geomorphological Characteristics of the YSZ

The geomorphology of the YSZ north of 8°26′ N is more complicated than that of the south, mostly affected by the subduction of highly elevated Caroline Island Ridges, Sorol Trough, West Caroline Rise, and horst and graben structures. Here, we discuss how CR subduction influences the formation of some of the most noticeable morphotectonic characteristics in the different tectonic units of the YSZ.

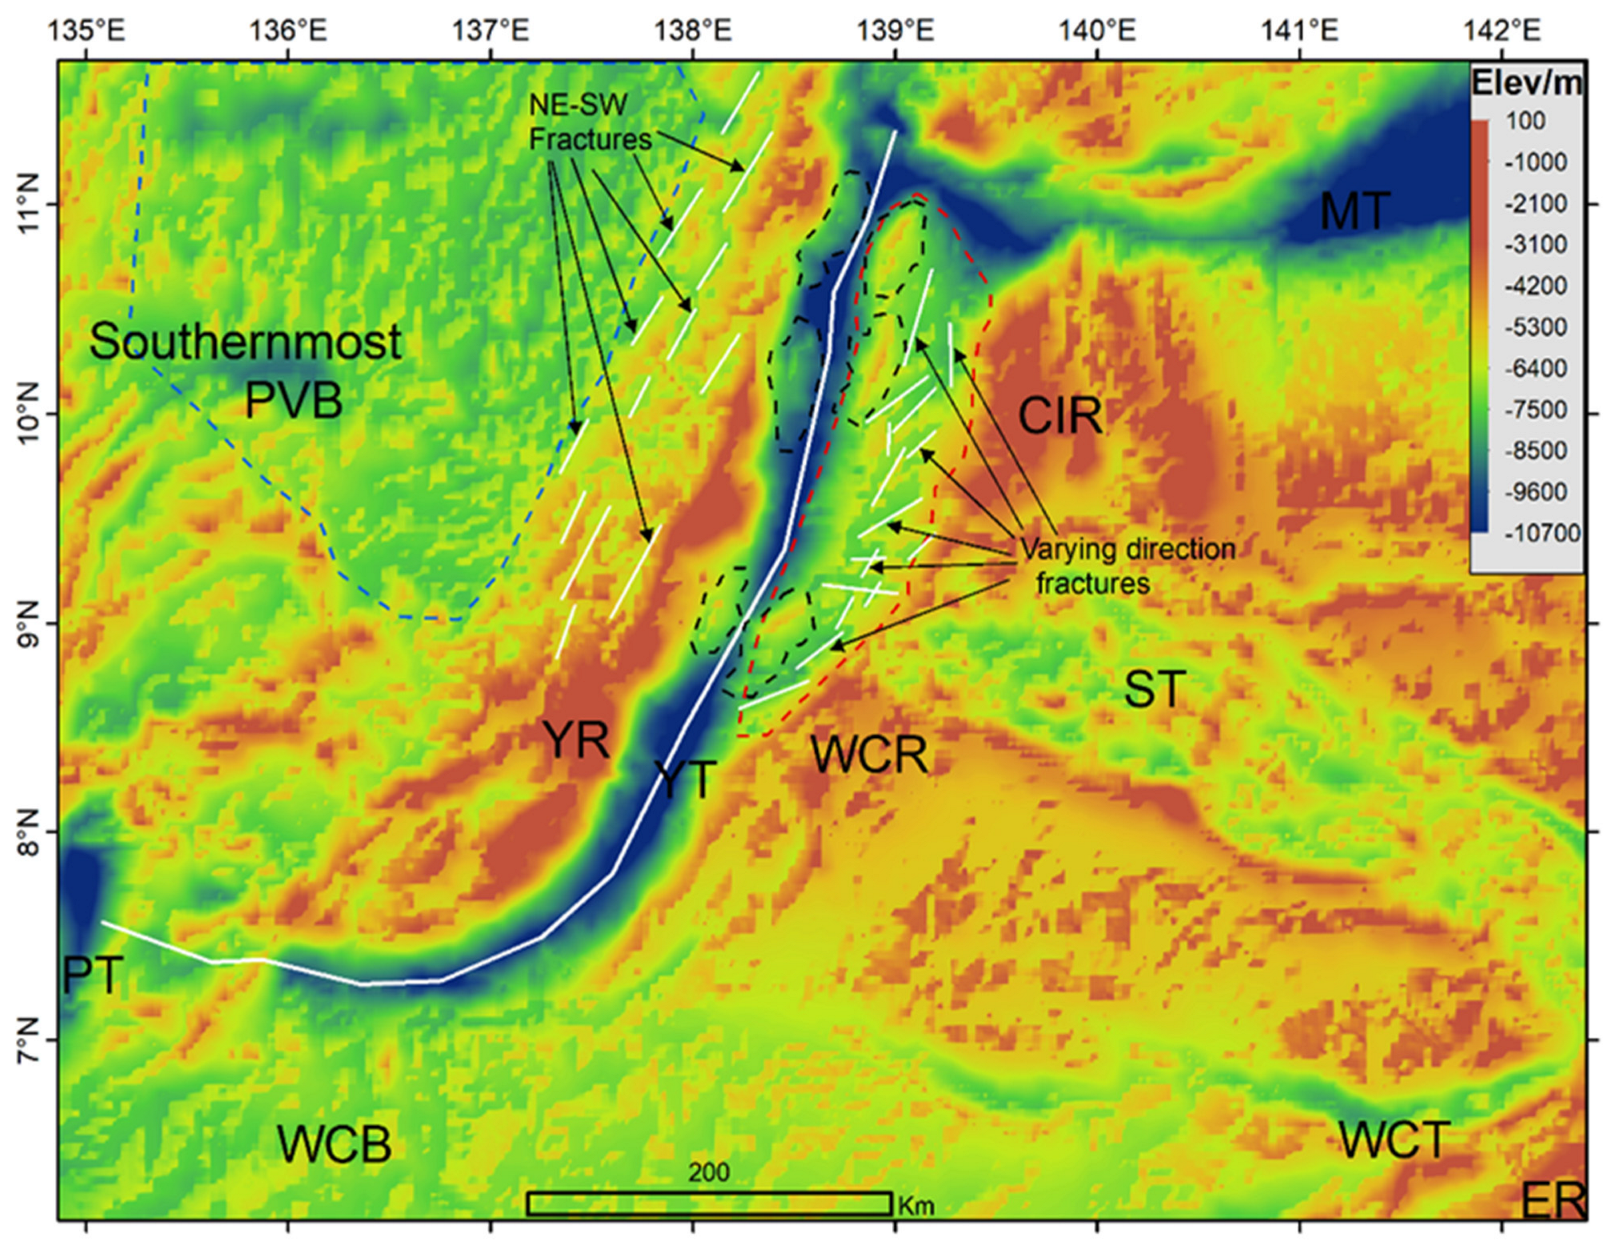
3.2.1. The Influence of CR Subduction on the Formation of large NE-SW Oriented Fractures on the Southernmost Parece Vela Basin

Previous works suggest that the Parece Vela Basin expanded symmetrically for about 5–10 Myr before the collision of CR and the Philippine Sea Plate in 25 Ma [1,4,25,31]. Therefore, the eastern side of the southernmost Parece Vela Basin should be located between the Parece Vela Rift and the Yap Trench axis, but only a western side exists as shown in Figure 1 and Figure 2. Fujiwara et al. [1] suggested that the Parece Vela Basin spreading stopped after the collision of the CR and Philippine Sea Plate, but the NE-SW oriented fractures near the Yap arc are believed to be formed by the Parece Vela Basin spreading which was influenced by the CR subduction in SEE-NWW direction [4,25]. Kobayashi [26] proposed that the CR collision pushed the eastern side of the southernmost PVB westward and thus it subducted beneath the Philippine Sea Plate. However, Okino et al. [22] suggested that the eastern side was moved by the CR collision to the west of the current-day West Mariana Ridge, although they did not have enough evidence to prove their theory. Xia et al. [25] suggested that the collision of the CR caused the eastern side of the southernmost Parece Vela Basin to be obducted onto the Yap arc and arc-ward trench slope. There is still controversy regarding the whereabouts of the eastern side of the southernmost Parece Vela Basin after the collision of the CR and Philippine Sea Plate.
Previous studies suggest that the collision of the CR and Philippine Sea Plate caused the change in a direction of the southernmost Parece Vela Basin spreading from E-W to SEE-NWW [4,15,22,25]. The N-S oriented seamounts/fabrics/abyssal hills which are displayed north of 9°00′ N of the southernmost Parece Vela Basin and also discovered in our bathymetric and geomorphometric analyses in Figure 3 and Figure 7 are believed to have been formed during the first stage of Parece Vela Basin spreading in the E-W direction [4]. The first stage of Parece Vela Basin spreading was triggered by the subduction of the Pacific Plate beneath the Philippine Sea Plate [4,31]. The second stage of the southernmost Parece Vela Basin spreading in the SEE-NWW direction which was influenced by the subduction of NEE-SWW oriented CR probably produced the NE-SW-oriented fractures near the Yap arc [4,15,22]. The fractures propagate southwards and cut the south part of the Yap Arc near the boundary between the West Caroline Rise and West Caroline Basin as shown in our bathymetric analysis in Figure 2 and Figure 3. Based on these findings, we can conclude that the large sinuous NE-SW fractures that are observed in the southernmost Parece Vela Basin are the result of the large compressional force exerted on the ocean crust of the Parece Vela Basin due to the collision of the NEE-SWW-oriented CR and Philippine Sea Plate.

3.2.2. The Impact of CR Subduction on the Formation of the Yap Arc Crust

In most subduction systems, a low Bouguer anomaly is observed all over the arcs because of the development of the thick and low dense volcanic arc crust overlying the arcs [1,58,59]. In contrast, Bouguer anomaly analysis reveals that higher anomalies predominate north of 10°00′ N of the Yap arc (Figure 8b and Figure 9a), which is an indication that the abnormally thin and high-dense crust exists beneath the arc in the northern section and that a normal volcanic arc crust is not available. However, the southern section of the Yap arc shows a low Bouguer anomaly, implying the existence of a normal volcanic arc crust in the south of the Yap arc. Our geomorphometric analysis also supports this finding as it reveals the narrower/thinner Yap Ridge north of 10°00′ N of the Yap arc and a thicker/broader ridge in the south (Figure 7). It is proposed that the subduction of highly elevated ridges and normal-faulted structures increases the ruggedness of the subducting plate, which in turn causes subduction erosion on the overriding plate [1,25,60]. As a result, we suggest that the strong structural erosion caused by the strong coupling between the subducting Caroline Island Ridges, horsts and grabens, and normal-faulted structures and the overriding Philippine Sea Plate in the northern section may have resulted in the loss of the thick and less dense volcanic arc crust north of 10°00′ N of the Yap arc and hence leading to the formation of a thin and high dense underlying Yap arc crust. We also suggest that the abnormally lower bathymetric values north of 10°00′ of the Yap arc as shown in Figure 3 (profile aa’) are the result of the subduction erosion on the overriding plate caused by the strong coupling between the subducting CR and the Philippine Sea Plate.

3.2.3. The Impact of CR Subduction on the Geomorphology of the Arc-Ward Trench Slope

The bathymetric analysis shows that the bathymetric highs on the opposing sides of the arc-ward and sea-ward trench slopes north of 8°26′ N are correlated with each other (Figure 2 and Figure 5c). Fujiwara et al. [1] associated the bathymetric highs on the arc-ward trench slope with the presumed seamounts sitting on the opposite sea-ward trench slope. They argued that the bathymetric highs on the arc-ward trench slope are formed by crustal deformation caused by collisional stress of the presumed subducting seamounts on the sea-ward trench slope. The geomorphometric analysis reveals that the bathymetric highs on the sea-ward trench slope at 9°05′ N, 138°26′ E; 10°10′ N, 138°54′ E; and 10°51′ N, 138°58′ E are the seamounts which subduct together with the subducting CR as shown in Figure 7. Based on our results, we can conclude that the formation of the bathymetric highs on the arc-ward trench slope is heavily influenced by the subducting seamounts of the subducting CR on the opposite sea-ward trench slope.
The two significant slope breaks which are identified on the arc-ward trench slope as shown in Figure 3, Figure 5a and Figure 6 particularly at the contact zone between the CR and Yap Trench axis were also previously discovered by other studies [1,4,17]. Fujiwara et al. [1] and Yang et al. [17] proposed that the slope breaks could be lithological boundaries or a fault in the overriding Philippine Sea Plate. However, Dong et al. [4] found no reflections of lithological boundaries on the slope breaks of the arc-ward trench slope from the reflected seismic waves. Instead, they detected mass wasting reflections at the relatively shallow slope break, indicating the development of submarine landslides. Moreover, they delineated the boundaries of the landslide in the swath bathymetry data and concluded that the relatively shallow slope break may represent the upper boundary of the landslide. In addition, Ohara et al. [28] discovered that the arc-ward trench slope has been covered with debris-flow deposits, suggesting the ongoing undersea landslides. It is generally believed that an arc-ward slope with slope values greater than 10° as shown in Figure 6 is steep enough to cause submarine landslides [44,61]. Therefore, we suggest that the subduction of highly elevated CR probably enhances tectonic erosion of the arc-ward trench slope and considerably reduces the distance from the Yap arc to the Yap Trench axis to about 38 km, resulting in higher slope values on the arc-ward trench slope and the subsequent submarine landslides whose boundaries led to the formation of the discovered slope breaks.

3.2.4. The Impact of CR Subduction on the Morphology of the YT Axis

The bathymetry of the YT axis varies from 3000 to 9000 m (Figure 4b), with the deepest point at approximately 9000 m north of 8°26′ N, making it one of the deepest trenches in the ocean even though the relatively young and less dense Caroline Plate subducts at a very slow speed [1]. Fujiwara et al. [1] argued that the high subduction speed, the old age of the subducting plate, and the thickness of the dense lithosphere are the driving mechanisms that control the deep trenches. Based on our findings, we suggest that the subducting CR most likely aids the onset of intense subduction erosion north of 8°26′ N of the Yap arc-trench system, resulting in the overlying high-density Yap arc crust which is consistent with the Bouguer gravity analysis. The overlying high-density Yap arc crust most likely pushes north of 8°26′ N of the Yap Trench axis downward to the lower bathymetric values as shown in Figure 4b.
The bathymetric values along the Yap Trench axis show a significant difference between north and south of 8°26′ N as shown in Figure 4b. The bathymetry varies greatly with several isolated low values in the north while increasing steadily in the south. Several isolated high bathymetric values can be found in the north of the Yap Trench axis at 9°05′ N, 10°10′ N, and 10°51′ N (Figure 4b). The isolated high bathymetric values at 9°05′ N, 10°10′ N, and 10°51′ N are also the contact zones between the seamounts of the subducting CR and the Yap Trench axis as shown in Figure 7. We conclude that the increased compressional stress at the Yap Trench axis brought about by the encountering seamounts of the subducting CR drives the vertical motion in the Yap Trench axis, thereby elevating the trench axis by nearly 2000 to 4000 m from a maximum depth to form shallow isolated values north of 8°26′ N.
Previous studies indicate that there is no or little sediment cover along the Yap Trench axis [1,17]. However, a sediment deposition speed of approximately 4–37 m/m. y. and a layer of sediment approximately 400 m thick were discovered on the CR and West Caroline Basin, respectively [1,17,20]. As a consequence, Fujiwara et al. [1] argued that if subduction has previously ceased, the Yap Trench axis may have been filled with sediments from the CR as well as the West Caroline Basin. They suggested that the sediments along the YT axis are currently subducting. The bathymetric analysis reveals the V-asymmetric shape of the Yap Trench axis (Figure 3), an indication that there is no accumulation of thick sediments along the trench axis. Furthermore, the relatively higher terrain ruggedness on the trench axis, especially at the contact zone with CR (Figure 5b) also indicates that there are few or no thick sediments along the trench axis. Nonetheless, the large negative values of free-air and isostatic gravity anomalies along the Yap Trench axis (Figure 4a) are an indication of the dynamic force exerted on the crust beneath the Yap Trench by the ongoing subduction, which results in mass wasting along the Yap Trench axis. It is also known that the thickness of sediments in trenches is inversely proportional to the speed of subduction, and since the subduction speed along the Yap Trench is very slow [23], therefore thick sediments were expected to be accumulated along the Yap Trench axis. Moreover, the collision of oceanic bathymetric highs with trench axes is also thought to control effective subduction erosion along the trenches [62]. Based on these findings, we suggest that the CR subduction probably increases the roughness at the contact surface between the CR and Yap Trench axis, thereby accelerating subduction erosion, hence decreasing the thickness of sediments in the Yap Trench axis.

3.2.5. The Impact of CR Subduction on the Formation of the Horst and Graben Structures and Higher Slope Values on the Sea-Ward Trench Slope

The bathymetric low that is identified north of 8°26′ N of the sea-ward trench slope in the transition region between the Caroline Island Ridges, Sorol Trough, West Caroline Rise and Yap Trench axis (Figure 2 and Figure 3 (profiles aa’ and bb’), and Figure 5c) is thought to be the zone of horsts and grabens which are linked to normal faulted structures [1,4,14,25]. The presence of horsts and grabens is an indication of normal faults which are resulted from the bending of the subducting CR [1,4]. The horsts and grabens structures are also believed to be the extensional features of the subducting CR [14]. Using the swath bathymetry and seismic profiles, Dong et al. [4] delineated more geomorphic details of the horst and graben structures and found that a series of faults have developed massively in horst and graben structures. The bending-related faults and the formation of horsts and grabens may be accelerated by the high bathymetry, weak rheology, curvature, and high slope values of the subducting CR [4]. The presence of a steep slope and the absence of a distinct tectonic unit between the zone of horsts and grabens structures and the Caroline Island Ridge, Sorol Trough, and West Caroline Rise (Figure 5a and Figure 7) is an implication that the horsts and grabens were developed by the bending and normal-faulting of the highly-elevated subducting CR in an extensional setting environment. The horsts and grabens, on the other hand, are not observed south of 8°26′ N, indicating that the collision of the CR into the Yap Trench axis had little effect on the geomorphology of the southernmost end of the sea-ward trench slope.
The sea-ward trench slope is dominated by abnormally high 4–10° slope values (Figure 5a and Figure 6), especially at the contact zone between the Yap Trench axis and the CR. Fujiwara et al. [1] discovered 4–6° angles of the sea-ward trench slope of the YSZ and argued that the angles are much higher compared to standard 1–3° angles of the sea-ward trench slopes. Previous work suggests that the angles of the sea-ward trench slopes are inversely proportional to the subduction speed [63]. Furthermore, the tomographic study also shows that the slope values of the subduction plate tend to become larger when the subduction speed decreases [64]. Therefore, we suggest that the subduction of horsts and grabens structures and CR slow down the subduction speed significantly, resulting in abnormally high slope values on the sea-ward trench slope. Nevertheless, we can also argue that the subduction of a less dense crust of the CR increases compression force at the YT axis, resulting in the vertical movement on the sea-ward trench slope and hence the formation of unusually higher slope values.

4. Conclusions

The YSZ is an important case of subduction systems due to the CR subduction and the subsequent development of distinct morphotectonic characteristics. Therefore, the geomorphological characteristics of major landforms in the YSZ are analyzed based on the bathymetry data, marine geomorphometry techniques, and geophysical characteristics, and in doing so the influence of the CR subduction on the geomorphological characteristics of the YSZ is clarified.
  • The large NE-SW direction sinuous fractures are observed in the southernmost Parece Vela Basin. These fractures suggest that the southernmost Parece Vela Basin experienced the ESE–WNW direction spreading after the collision of the ENE-WSW-oriented CR and the Philippine Sea Plate.
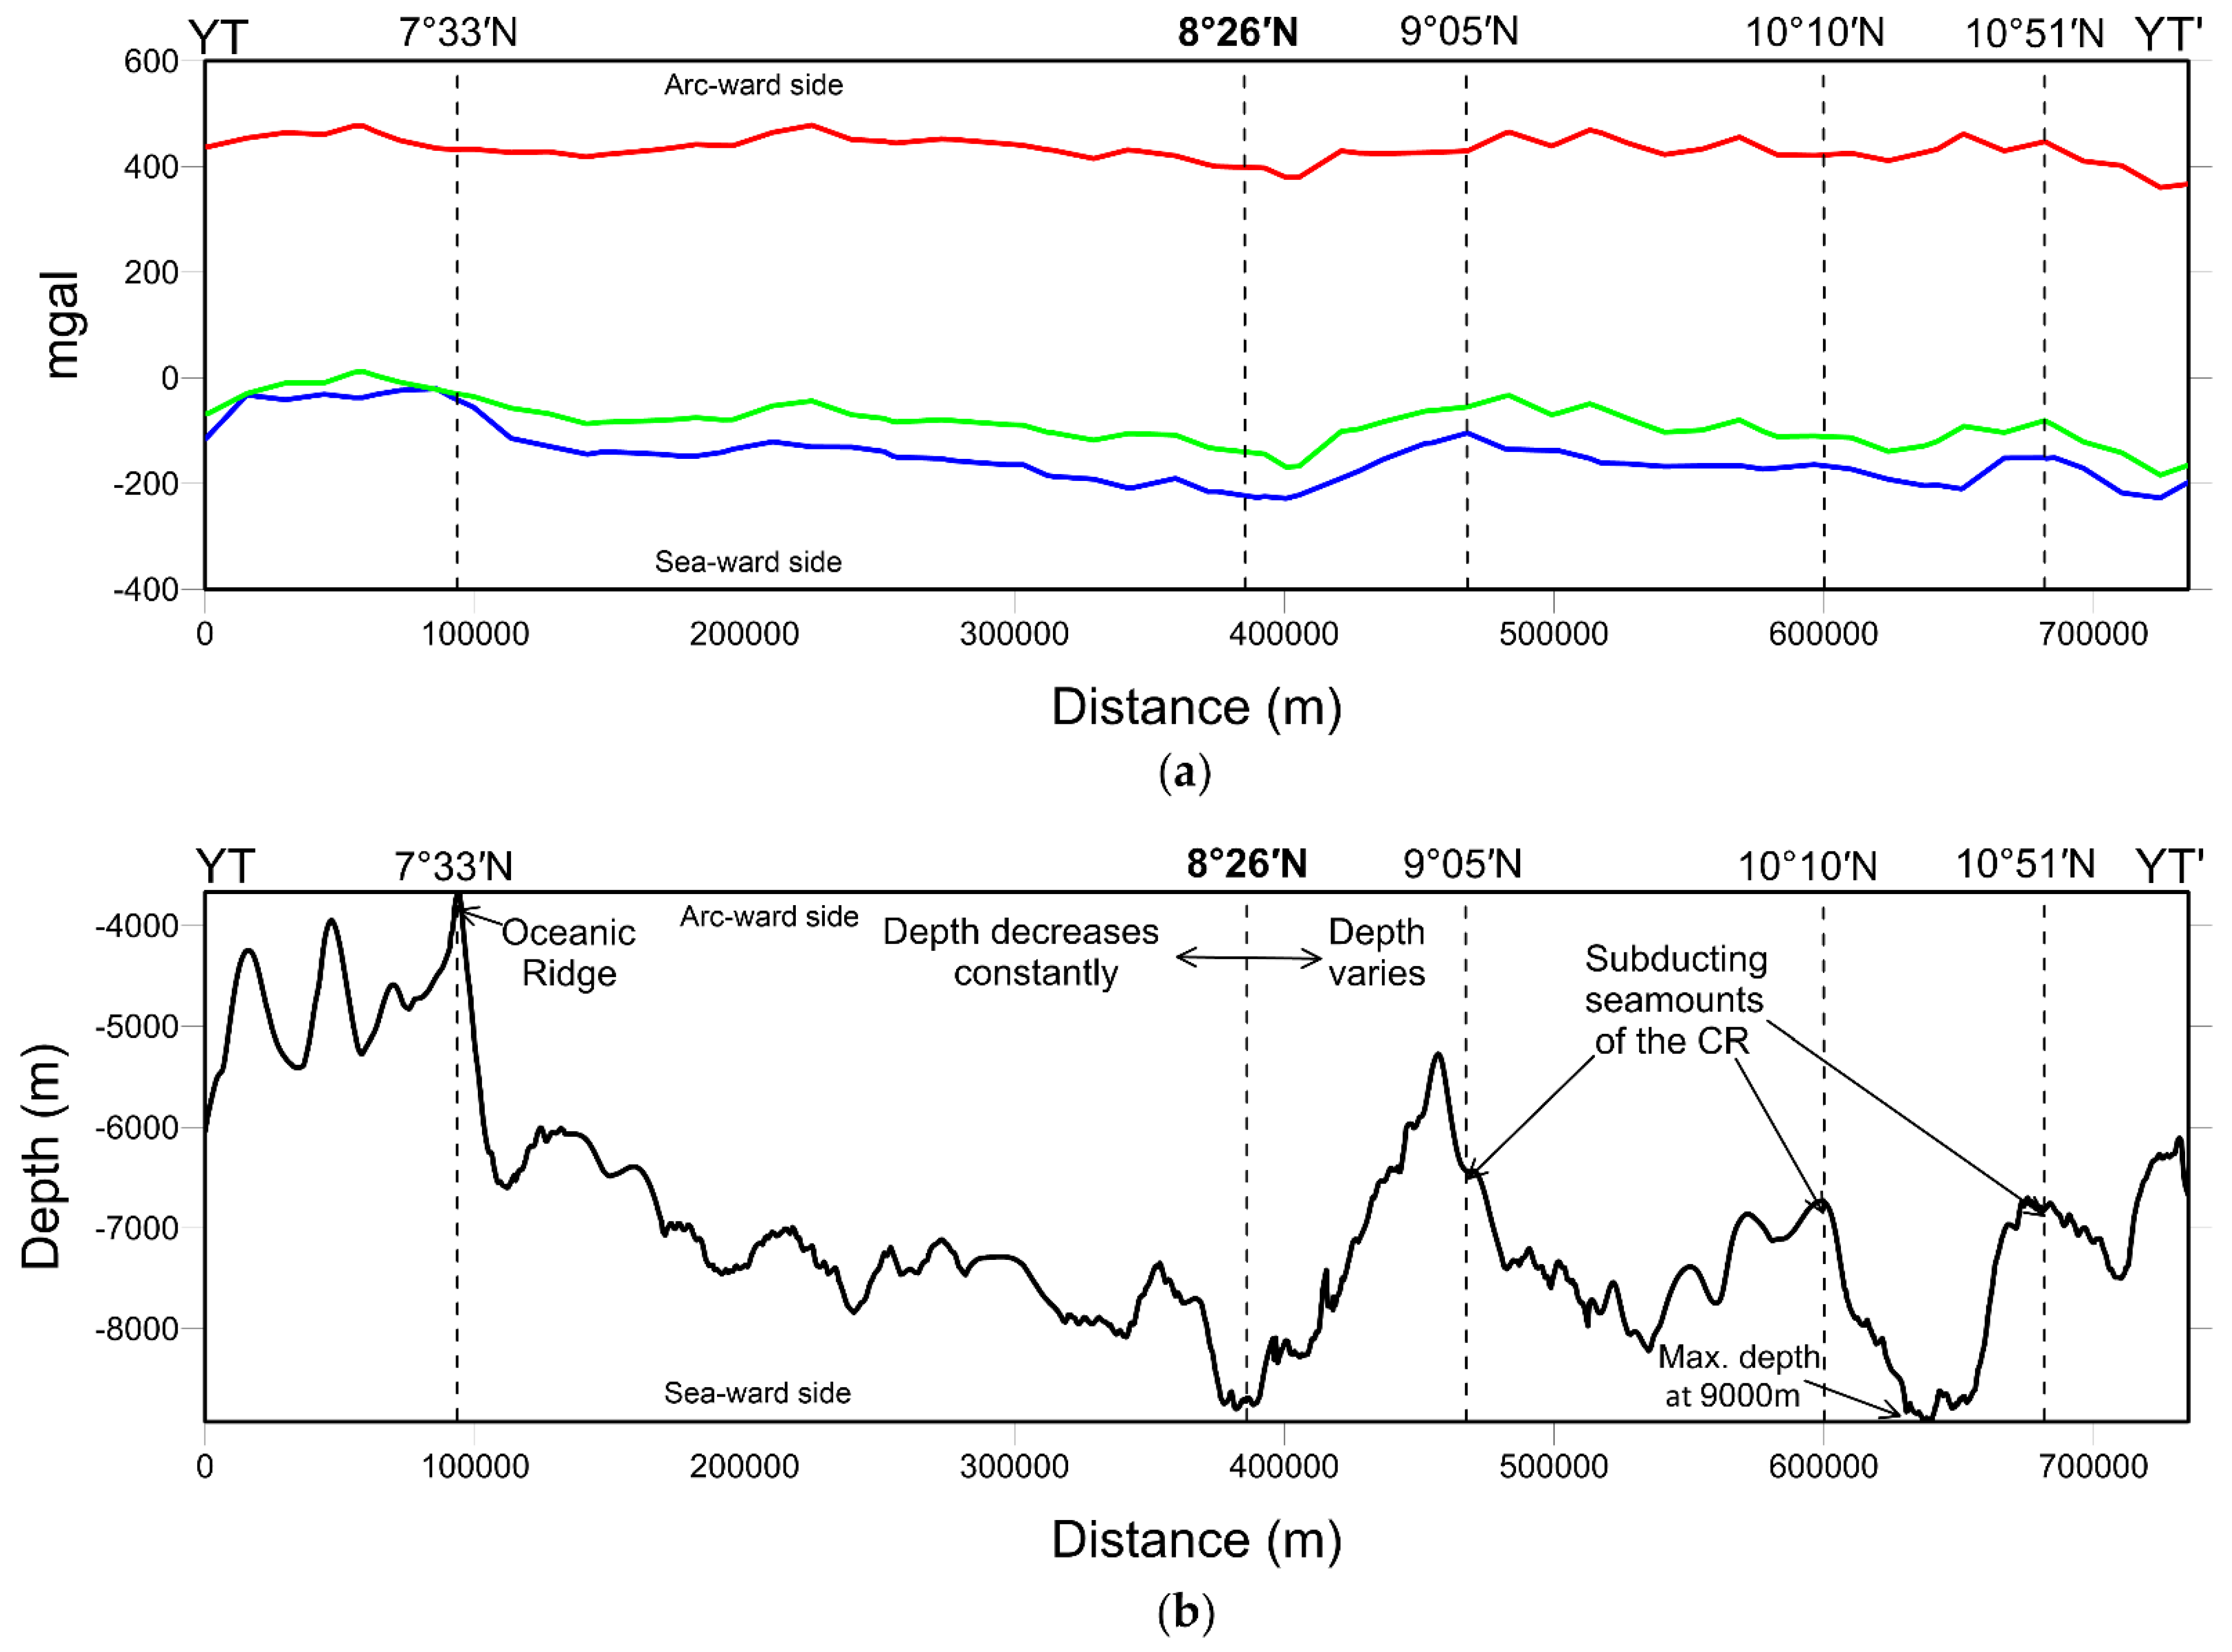
  • Higher Bouguer gravity anomalies and a narrower Yap Ridge are observed north of 10°00′ N of the Yap arc, indicating the absence of a normal overlying thick and low-dense volcanic arc crust. The absence of a normal volcanic arc crust north of the Yap arc may have resulted from the strong structural erosion on the overriding Philippine Sea Plate caused by the strong coupling between the subducting CR and the Philippine Sea Plate.
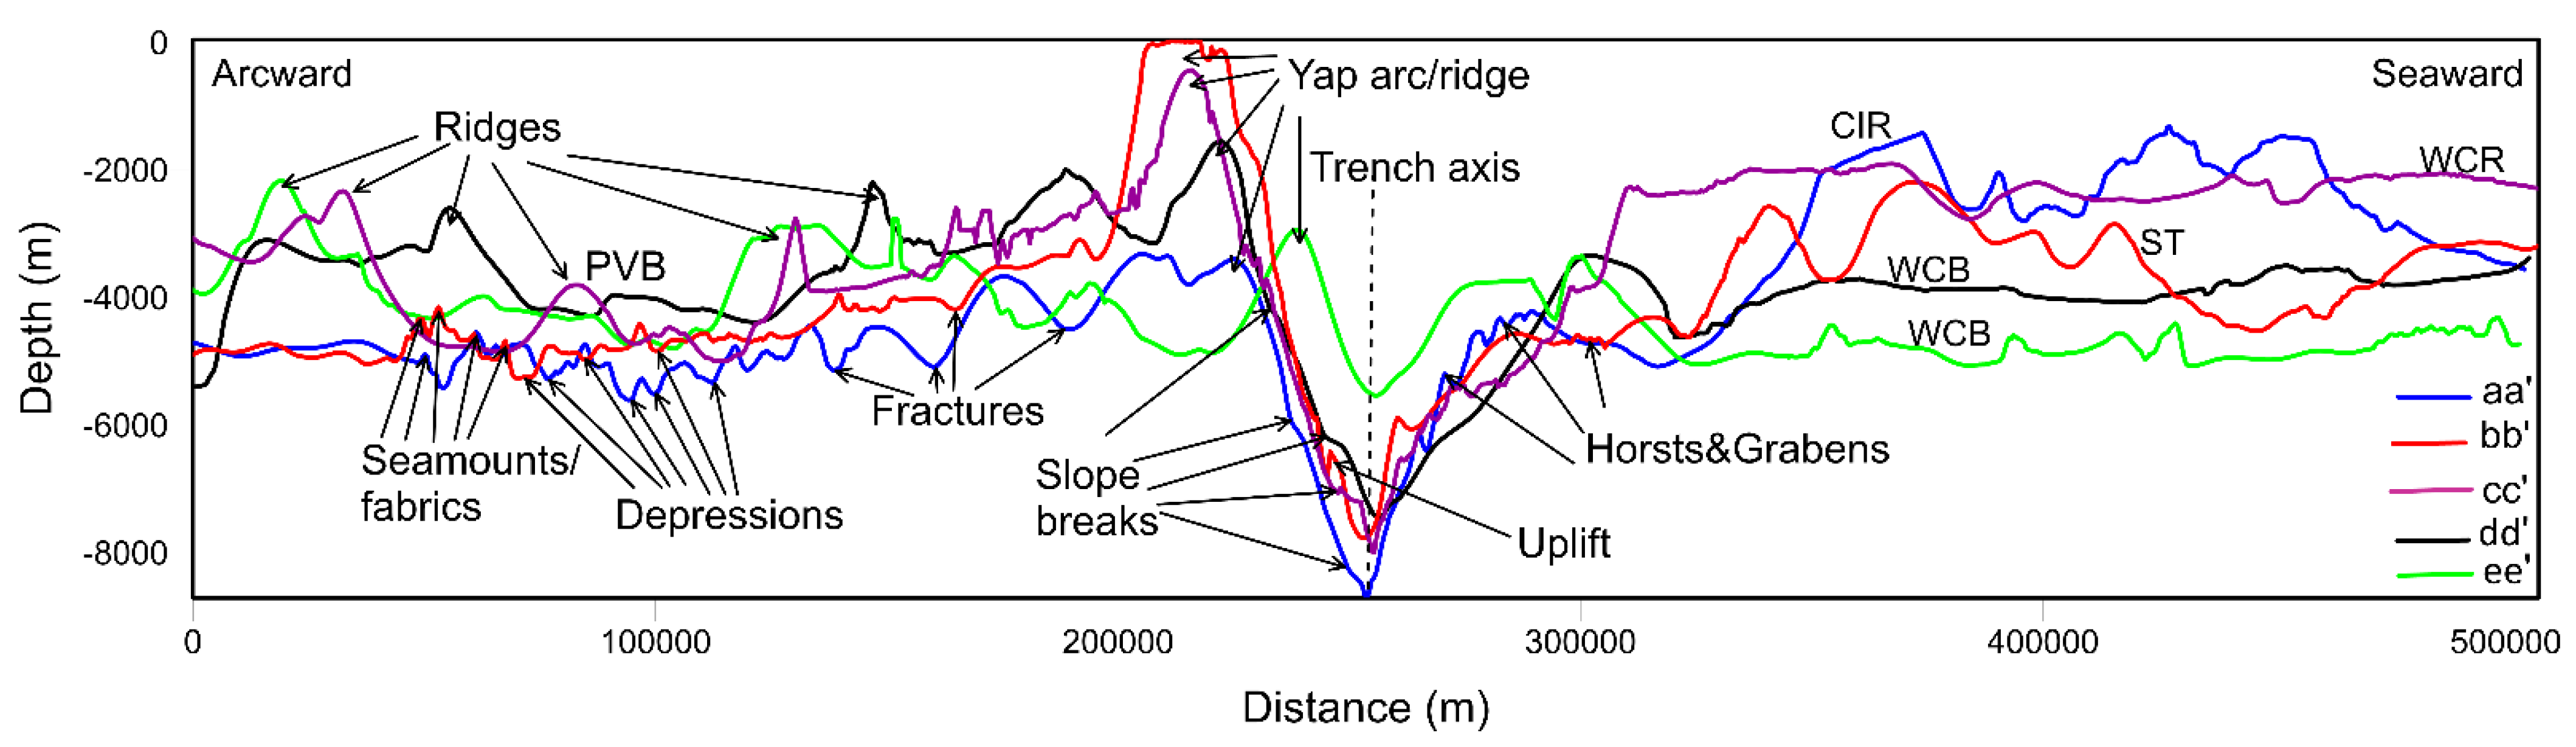
  • The bathymetric highs which are observed on the arc-ward trench slopes north of 8°26′ N are correlated to the subducting seamounts of the CR on the opposite sea-ward trench slopes. This suggests that the subducting seamounts of the CR control the formation of the bathymetric highs on the arc-ward trench slope. Furthermore, two major slope breaks are observed on the arc-ward trench slope. The slope breaks are thought to be the boundaries of the submarine landslide body.
  • The abnormally low bathymetric values are observed north of 8°26′ N of the Yap Trench axis. The low bathymetric values are most likely influenced by the overlying high-density crust north of the Yap arc which forces the trench axis down to lower bathymetry. In addition, several isolated high bathymetric values are observed north of 8°26′ N of the Yap Trench axis. The isolated high bathymetric values are also the contact zones between the subducting seamounts of CR and the Yap Trench axis, suggesting that the subducting seamounts of the CR which are encountering the Yap Trench axis elevate the trench to higher bathymetric values from a maximum depth. Furthermore, higher terrain ruggedness and large negative values of free-air and isostatic gravity anomalies are observed on the Yap Trench axis. The Yap Trench axis also reveals the V-asymmetric shape. These findings suggest that there are no/little thick sediments along the trench axis and thus the sediments are currently subducting.
  • The crescent bathymetric low which is associated with the horst and graben structures is observed north of 8°26′ N of the sea-ward trench slope at the contact zone between the CR and the Yap Trench axis, implying the bending of the subducting CR and thus the extensional setting environment. Furthermore, the slope values of the seaward trench slope north of 8°26′ N are unusually higher (4–10°) compared to normal (1–3°) seaward trench slope values. This suggests that the subduction of the CR increases compression force at the Yap Trench axis, resulting in the vertical movement on the seaward trench slope and hence the formation of unusually higher slope values.

Author Contributions

Conceptualization, P.S. and Z.L.; methodology, P.S., Z.L. and Q.G.; software, P.S. and Q.G.; validation, P.S. and Z.L.; formal analysis, P.S. and Z.L.; investigation, P.S. and Q.G.; resources, Z.L.; data curation, P.S. and Q.G.; writing—original draft preparation, P.S.; writing—review and editing, Z.L. and Q.G.; visualization, P.S.; supervision, Z.L.; project administration, Z.L.; funding acquisition, Z.L. All authors have read and agreed to the published version of the manuscript.

Funding

This research was funded by the National Natural Science Foundation of China (Grant No. 91858213) and the Zhejiang University Education Foundation Global Partnership Fund (Grant No. 100000-11320).

Institutional Review Board Statement

Not applicable.

Informed Consent Statement

Not applicable.

Data Availability Statement

The data presented in this study are available at https://doi.org/10.5285/c6612cbe-50b3-0cff-e053-6c86abc09f8f (accessed on 3 December 2021) and https://bgi.obs-mip.fr (accessed on 12 March 2022).

Acknowledgments

We are pleased to thank the Ocean College of Zhejiang University for granting us the opportunity to undertake this study. We thank two anonymous reviewers for their constructive comments and questions, which helped to improve the manuscript significantly. We also thank Li Chun-Feng for his critical but productive remarks that significantly improved the manuscript.

Conflicts of Interest

The authors declare no conflict of interest.

References

  1. Fujiwara, T.; Tamura, C.; Nishizawa, A.; Fujioka, K.; Kobayashi, K.; Iwabuchi, Y. Morphology and Tectonics of the Yap Trench. Mar. Geophys. Res. 2000, 21, 69–86. [Google Scholar] [CrossRef]
  2. Nagihara, S.; Kinoshita, M.; Fujimoto, H.; Katao, H.; Kinoshita, H.; Tomoda, Y. Geophysical Observations around the Northern Yap Trench: Seismicity, Gravity and Heat Flow. Tectonophysics 1989, 163, 93–104. [Google Scholar] [CrossRef]
  3. Keating, B.H.; Mattey, D.P.; Helsley, C.E.; Naughton, J.J.; Epp, D.; Lazarewicz, A.; Schwank, D. Evidence for a Hot Spot Origin of the Caroline Islands. J. Geophys. Res. Solid Earth 1984, 89, 9937–9948. [Google Scholar] [CrossRef]
  4. Dong, D.; Zhang, Z.; Bai, Y.; Fan, J.; Zhang, G. Topographic and Sedimentary Features in the Yap Subduction Zone and Their Implications for the Caroline Ridge Subduction. Tectonophysics 2018, 722, 410–421. [Google Scholar] [CrossRef]
  5. Zhang, Z.; Dong, D.; Sun, W.; Zhang, G.; Bai, Y. Investigation of an Oceanic Plateau Formation and Rifting Initiation Model Implied by the Caroline Ridge on the Caroline Plate, Western Pacific. Int. Geol. Rev. 2021, 63, 193–207. [Google Scholar] [CrossRef]
  6. Davy, B.; Hoernle, K.; Werner, R. Hikurangi Plateau: Crustal Structure, Rifted Formation, and Gondwana Subduction History. Geochem. Geophys. Geosyst. 2008, 9. [Google Scholar] [CrossRef] [Green Version]
  7. Hoernle, K.; Hauff, F.; van den Bogaard, P.; Werner, R.; Mortimer, N.; Geldmacher, J.; Garbe-Schönberg, D.; Davy, B. Age and Geochemistry of Volcanic Rocks from the Hikurangi and Manihiki Oceanic Plateaus. Geochim. Cosmochim. Acta 2010, 74, 7196–7219. [Google Scholar] [CrossRef]
  8. Mason, W.G.; Moresi, L.; Betts, P.G.; Miller, M.S. Three-Dimensional Numerical Models of the Influence of a Buoyant Oceanic Plateau on Subduction Zones. Tectonophysics 2010, 483, 71–79. [Google Scholar] [CrossRef]
  9. Timm, C.; Davy, B.; Haase, K.; Hoernle, K.A.; Graham, I.J.; Ronde, C.E.J.; Woodhead, J.; Bassett, D.; Hauff, F.; Mortimer, N.; et al. Subduction of the Oceanic Hikurangi Plateau and Its Impact on the Kermadec Arc. Nat. Commun. 2014, 5, 4923. [Google Scholar] [CrossRef] [Green Version]
  10. Gutscher, M.A.; Maury, R.; Eissen, J.-P.; Bourdon, E. Can Slab Melting Be Caused by Flat Subduction ? Geology 2000, 6, 535–538. [Google Scholar] [CrossRef]
  11. Rosenbaum, G.; Gasparon, M.; Lucente, F.P.; Peccerillo, A.; Miller, M.S. Kinematics of Slab Tear Faults during Subduction Segmentation and Implications for Italian Magmatism: Kinematics of Slab Tear Faults. Tectonics 2008, 27. [Google Scholar] [CrossRef] [Green Version]
  12. Rosenbaum, G.; Mo, W. Tectonic and Magmatic Responses to the Subduction of High Bathymetric Relief. Gondwana Res. 2011, 19, 571–582. [Google Scholar] [CrossRef]
  13. Kim, Y.-M.; Lee, S.-M.; Okino, K. Comparison of Gravity Anomaly between Mature and Immature Intra-Oceanic Subduction Zones in the Western Pacific. Tectonophysics 2009, 474, 657–673. [Google Scholar] [CrossRef]
  14. Lee, S.-M. Deformation from the Convergence of Oceanic Lithosphere into Yap Trench and Its Implications for Early-Stage Subduction. J. Geodyn. 2004, 37, 83–102. [Google Scholar] [CrossRef]
  15. Okino, K.; Kasuga, S.; Ohara, Y. A New Scenario of the Parece Vela Basin Genesis. Mar. Geophys. Res. 1998, 20, 21–40. [Google Scholar] [CrossRef]
  16. Sato, T.; Kasahara, J.; Katao, H.; Tomiyama, N.; Mochizuki, K.; Koresawa, S. Seismic Observations at the Yap Islands and the Northern Yap Trench. Tectonophysics 1997, 271, 285–294. [Google Scholar] [CrossRef]
  17. Yang, Y.; Wu, S.; Gao, J.; Tian, L.; Yang, J.; Xu, Y. Geology of the Yap Trench: New Observations from a Transect near 10°N from Manned Submersible Jiaolong. Int. Geol. Rev. 2018, 60, 1941–1953. [Google Scholar] [CrossRef]
  18. Huang, Y.; Sun, C.; Yang, G.; Yue, X.; Jiang, F.; Cao, W.; Yin, X.; Guo, C.; Niu, J.; Ding, H. Geochemical Characteristics of Hadal Sediment in the Northern Yap Trench. J. Oceanol. Limnol. 2020, 38, 650–664. [Google Scholar] [CrossRef]
  19. Zhang, Z.; Dong, D.; Sun, W.; Zhang, G. The Caroline Ridge Fault System and Implications for the Bending-Related Faulting of Incoming Oceanic Plateaus. Gondwana Res. 2021, 92, 133–148. [Google Scholar] [CrossRef]
  20. Altis, S. Origin and Tectonic Evolution of the Caroline Ridge and the Sorol Trough, Western Tropical Pacific, from Admittance and a Tectonic Modeling Analysis. Tectonophysics 1999, 313, 271–292. [Google Scholar] [CrossRef]
  21. Hawkins, J.; Batiza, R. Metamorphic Rocks of the Yap Arc-Trench System. Earth Planet. Sci. Lett. 1977, 37, 216–229. [Google Scholar] [CrossRef]
  22. Okino, K.; Ohara, Y.; Fujiwara, T.; Lee, S.-M.; Koizumi, K.; Nakamura, Y.; Wu, S. Tectonics of the Southern Tip of the Parece Vela Basin, Philippine Sea Plate. Tectonophysics 2009, 466, 213–228. [Google Scholar] [CrossRef]
  23. Seno, T.; Stein, S.; Gripp, A.E. A Model for the Motion of the Philippine Sea Plate Consistent with NUVEL-1 and Geological Data. J. Geophys. Res. Solid Earth 1993, 98, 17941–17948. [Google Scholar] [CrossRef]
  24. Hegarty, K.A.; Weissel, J.K. Complexities in the Development of the Caroline Plate Region, Western Equatorial Pacific. In The Ocean Basins and Margins; Nairn, A.E.M., Stehli, F.G., Uyeda, S., Eds.; Springer: Boston, MA, USA, 1988; pp. 277–301. ISBN 978-1-4615-8043-0. [Google Scholar]
  25. Xia, C.; Zheng, Y.; Liu, B.; Hua, Q.; Liu, K.; Ma, L.; Li, X. Geological and Geophysical Differences between the North and South Sections of the Yap Trench-arc System and Their Relationship with Caroline Ridge Subduction. Geol. J. 2020, 55, 7775–7789. [Google Scholar] [CrossRef]
  26. Kobayashi, K. Origin of the Palau and Yap Trench-Arc Systems. Geophys. J. Int. 2004, 157, 1303–1315. [Google Scholar] [CrossRef] [Green Version]
  27. McCabe, R.; Uyeda, S. Hypothetical Model for the Bending of the Mariana Arc. In Geophysical Monograph Series; Hayes, D.E., Ed.; American Geophysical Union: Washington, DC, USA, 1983; Volume 27, pp. 281–293. ISBN 978-0-87590-053-7. [Google Scholar]
  28. Ohara, Y.; Fujioka, K.; Ishizuka, O.; Ishii, T. Peridotites and Volcanics from the Yap Arc System: Implications for Tectonics of the Southern Philippine Sea Plate. Chem. Geol. 2002, 189, 35–53. [Google Scholar] [CrossRef]
  29. GEBCO Compilation Group GEBCO 2021 Grid. 2021. Available online: https://www.bodc.ac.uk/data/published_data_library/catalogue/10.5285/c6612cbe-50b3-0cff-e053-6c86abc09f8f/ (accessed on 3 December 2021).
  30. Deschamps, A.; Lallemand, S. The West Philippine Basin: An Eocene to Early Oligocene Back Arc Basin Opened between Two Opposed Subduction Zones: Cenozoic History of the West Philippine Basin. J. Geophys. Res. Solid Earth 2002, 107, EPM 1-1–EPM 1-24. [Google Scholar] [CrossRef] [Green Version]
  31. Mrozowski, C.L.; Hayes, D.E. The Evolution of the Parece Vela Basin, Eastern Philippine Sea. Earth Planet. Sci. Lett. 1979, 46, 49–67. [Google Scholar] [CrossRef]
  32. Sdrolias, M.; Roest, W.R.; Müller, R.D. An Expression of Philippine Sea Plate Rotation: The Parece Vela and Shikoku Basins. Tectonophysics 2004, 394, 69–86. [Google Scholar] [CrossRef]
  33. Lecours, V.; Dolan, M.F.J.; Micallef, A.; Lucieer, V.L. A Review of Marine Geomorphometry, the Quantitative Study of the Seafloor. Hydrol. Earth Syst. Sci. 2016, 20, 3207–3244. [Google Scholar] [CrossRef]
  34. Mayer, L.; Jakobsson, M.; Allen, G.; Dorschel, B.; Falconer, R.; Ferrini, V.; Lamarche, G.; Snaith, H.; Weatherall, P. The Nippon Foundation—GEBCO Seabed 2030 Project: The Quest to See the World’s Oceans Completely Mapped by 2030. Geosciences 2018, 8, 63. [Google Scholar] [CrossRef] [Green Version]
  35. Novaczek, E.; Devillers, R.; Edinger, E. Generating Higher Resolution Regional Seafloor Maps from Crowd-Sourced Bathymetry. PLoS ONE 2019, 14, e0216792. [Google Scholar] [CrossRef] [PubMed]
  36. Weatherall, P.; Marks, K.M.; Jakobsson, M.; Schmitt, T.; Tani, S.; Arndt, J.E.; Rovere, M.; Chayes, D.; Ferrini, V.; Wigley, R. A New Digital Bathymetric Model of the World’s Oceans. Earth Space Sci. 2015, 2, 331–345. [Google Scholar] [CrossRef]
  37. Jerosch, K.; Kuhn, G.; Krajnik, I.; Scharf, F.K.; Dorschel, B. A Geomorphological Seabed Classification for the Weddell Sea, Antarctica. Mar. Geophys. Res. 2016, 37, 127–141. [Google Scholar] [CrossRef] [Green Version]
  38. Evans, I.S. Geomorphometry and Landform Mapping: What Is a Landform? Geomorphology 2012, 137, 94–106. [Google Scholar] [CrossRef]
  39. Lucieer, V.; Lecours, V.; Dolan, M.F.J. Charting the Course for Future Developments in Marine Geomorphometry: An Introduction to the Special Issue. Geosci. Switz. 2018, 8, 477. [Google Scholar] [CrossRef] [Green Version]
  40. Lecours, V.; Devillers, R.; Simms, A.E.; Lucieer, V.L. Towards a Framework for Terrain Attribute Selection in Environmental Studies. Environ. Model. Softw. 2017, 89, 19–30. [Google Scholar] [CrossRef]
  41. Lecours, V.; Dolan, M.; Lucieer, V.; Micallef, A. Recent and Future Trends in Marine Geomorphometry. In Proceedings of the Geomorphometry 2018, Denver, CO, USA, 13–17 August 2018; p. 5. [Google Scholar]
  42. Di Stefano, M.; Mayer, L.A. An Automatic Procedure for the Quantitative Characterization of Submarine Bedforms. Geosciences 2018, 8, 28. [Google Scholar] [CrossRef] [Green Version]
  43. Gafeira, J.; Dolan, M.; Monteys, X. Geomorphometric Characterization of Pockmarks by Using a GIS-Based Semi-Automated Toolbox. Geosciences 2018, 8, 154. [Google Scholar] [CrossRef] [Green Version]
  44. Hough, G.; Green, J.; Fish, P.; Mills, A.; Moore, R. A Geomorphological Mapping Approach for the Assessment of Seabed Geohazards and Risk. Mar. Geophys. Res. 2011, 32, 151–162. [Google Scholar] [CrossRef]
  45. Linklater, M.; Ingleton, T.C.; Kinsela, M.A.; Morris, B.D.; Allen, K.M.; Sutherland, M.D.; Hanslow, D.J. Techniques for Classifying Seabed Morphology and Composition on a Subtropical-Temperate Continental Shelf. Geosciences 2019, 9, 141. [Google Scholar] [CrossRef] [Green Version]
  46. Micallef, A.; Krastel, S. (Eds.) Submarine Geomorphology; Springer Geology; Springer International Publishing: Cham, Switzerland, 2018; ISBN 978-3-319-57851-4. [Google Scholar]
  47. Micallef, A.; Le Bas, T.P. A Multi-Method Approach for Benthic Habitat Mapping of Shallow Coastal Areas with High-Resolution Multibeam Data. Cont. Shelf Res. 2012, 39–40, 14–26. [Google Scholar] [CrossRef] [Green Version]
  48. Misiuk, B.; Lecours, V.; Bell, T. A Multiscale Approach to Mapping Seabed Sediments. PLoS ONE 2018, 13, e0193647. [Google Scholar] [CrossRef] [Green Version]
  49. Weiss, A. Topographic Position and Landforms Analysis. In Proceedings of the ESRI User Conference, San Diego, CA, USA, 9–13 July 2001. [Google Scholar]
  50. Wilson, M.F.J.; O’Connell, B.; Brown, C.; Guinan, J.C.; Grehan, A.J. Multiscale Terrain Analysis of Multibeam Bathymetry Data for Habitat Mapping on the Continental Slope. Mar. Geod. 2007, 30, 3–35. [Google Scholar] [CrossRef] [Green Version]
  51. Lundblad, E.R.; Wright, D.J.; Miller, J.; Larkin, E.M.; Rinehart, R.; Naar, D.F.; Donahue, B.T.; Anderson, S.M.; Battista, T. A Benthic Terrain Classification Scheme for American Samoa. Mar. Geod. 2006, 29, 89–111. [Google Scholar] [CrossRef] [Green Version]
  52. Walbridge, S.; Slocum, N.; Pobuda, M.; Wright, D.J. Unified Geomorphological Analysis Workflows with Benthic Terrain Modeler. Geosciences 2018, 8, 94. [Google Scholar] [CrossRef] [Green Version]
  53. Wright, D.J.; Lundblad, E.R.; Larkin, E.M.; Rinehart, R.W.; Murphy, J.; Cary-Kothera, L.; Draganov, K. Benthic Terrain Modeler for ArcGIS 10.1. 2005. Available online: http://www.csc.noaa.gov/digitalcoast/tools/btm (accessed on 5 November 2021).
  54. Walbridge, S.; Wright, D.; Pendleton, M.; Sampson, D.; Huntley, E. Benthic Terrain Modeler for ArcGIS 10.1. 2013. Available online: https://coast.noaa.gov/data/digitalcoast/pdf/btm-tutorial.pdf (accessed on 5 November 2021).
  55. Balmino, G.; Vales, N.; Bonvalot, S.; Briais, A. Spherical Harmonic Modelling to Ultra-High Degree of Bouguer and Isostatic Anomalies. J. Geod. 2012, 86, 499–520. [Google Scholar] [CrossRef]
  56. Bonvalot, S.; Balmino, G.; Briais, A.; Kuhn, M.; Peyrefitte, A.; Vales, N. World Gravity Map; Bureau Gravimetrique International (BGI): Paris, France, 2012. [Google Scholar]
  57. Weissel, J.K.; Anderson, R.N. Is There a Caroline Plate? Earth Planet. Sci. Lett. 1978, 41, 143–158. [Google Scholar] [CrossRef]
  58. Fujimoto, H.; Tomoda, Y. Lithospheric Thickness Anomaly near the Trench and Possible Driving Force of Subduction. Tectonophysics 1985, 112, 103–110. [Google Scholar] [CrossRef]
  59. Yang, C.S.; Segawa, J.; Fukuda, Y. Density Structure of the Mariana Arc and Its Vicinity Obtained from Successive Inversion of the Gravity Anomaly. Tectonophysics 1992, 206, 325–339. [Google Scholar] [CrossRef]
  60. Von Huene, R.; Ranero, C.R.; Vannucchi, P. Generic Model of Subduction Erosion. Geology 2004, 32, 913. [Google Scholar] [CrossRef]
  61. Masson, D.G.; Harbitz, C.B.; Wynn, R.B.; Pedersen, G.; Løvholt, F. Submarine Landslides: Processes, Triggers and Hazard Prediction. Philos. Trans. R. Soc. Math. Phys. Eng. Sci. 2006, 364, 2009–2039. [Google Scholar] [CrossRef]
  62. Clift, P.D.; Pecher, I.; Kukowski, N.; Hampel, A. Tectonic Erosion of the Peruvian Forearc, Lima Basin, by Subduction and Nazca Ridge Collision: Tectonic Erosion of the Peruvian Forearc. Tectonics 2003, 22. [Google Scholar] [CrossRef]
  63. Cross, T.A.; Pilger, R.H. Controls of Subduction Geometry, Location of Magmatic Arcs, and Tectonics of Arc and Back-Arc Regions. Geol. Soc. Am. Bull. 1982, 93, 545. [Google Scholar] [CrossRef]
  64. Miller, M.S.; Kennett, B.L.N.; Toy, V.G. Spatial and Temporal Evolution of the Subducting Pacific Plate Structure along the Western Pacific Margin: Evolution of the Pacific Plate Structure. J. Geophys. Res. Solid Earth 2006, 111. [Google Scholar] [CrossRef]
Figure 1. Location of the YSZ and the neighboring regions. The bathymetry information is derived from the GEBCO_2021 data [29]. The white box on an overview sketch represents the position of Figure 1 in the real world. The black-dashed rectangle depicts the survey region, as represented in Figures 2, 5, 7, and 8. The white-dashed polygon defines the area with horsts and grabens [1,4,14]. According to the location of the subducting CR relative to the Yap Trench, the YSZ is divided into two sections by the red-dashed line at 8°26′ N [1], with the north segment of YSZ corresponding to the subducting Caroline Island Ridges, Sorol Trough, and the northernmost West Caroline Rise and the south segment of YSZ corresponding to the subducting southernmost West Caroline Rise and West Caroline Basin. The line segments aa′, bb’, cc’, dd’, and ee’ represent the position of the 2D comprehensive geophysical profiles across the Yap Trench axis as represented in Figures 3 and 9, respectively. The J-shaped solid white line segment YTYT’ represents the Yap Trench axis, and the 2D comprehensive geophysical profiles along the Yap Trench axis are represented in Figure 4. The line segment STST’ represents the location of the 2D comprehensive geophysical profiles across the Sorol Trough as shown in Figure 10. Abbreviations: CIR: Caroline Island Ridges, EP: Eurasian Plate, ER: Eauripik Rise, CP: Caroline Plate, YR: Yap Ridge, PT: Palau Trench, MT: Mariana Trench, PP: Pacific Plate, PSP: Philippine Sea Plate, PVB: Parece Vela Basin; PVR: Parece Vela Rift, ST: Sorol Trough, WCR: West Caroline Rise, WCT: West Caroline Trough, YT: Yap Trench, WCB: West Caroline Basin, WMR: West Mariana Ridge, OJP: Ontong Java Plateau, ECB: East Caroline Basin.
Jmse 10 01414 g001
Figure 2. The bathymetric characteristics of the southernmost Parece Vela Basin, Yap arc, arc-ward trench slope, Yap Trench axis, sea-ward trench slope, and the CR. The red-dashed polygon outlines the area of horsts and grabens and normal-faulted structures. The black-dashed polygons outline the corresponding bathymetry highs on the arc-ward and sea-ward trench slopes. The J-shaped solid white line delineates the Yap Trench axis. The blue-dashed polygon delineates the area of the southernmost Parece Vela Basin containing seafloor fabrics and depressions. See Figure 1 for abbreviations.
Jmse 10 01414 g002
Figure 3. The impact of the CR subduction on the submarine topography of the southernmost Parece Vela Basin, Yap arc, arc-ward trench slope, Yap Trench axis, and sea-ward trench slope in the north and south of 8°26′ N. Profiles aa’, bb’, and cc’ are extracted from the line segments aa’, bb’, and cc’ north of 8°26′ N, respectively, and profiles dd’ and ee’ are extracted from line segments dd’ and ee’ south of 8°26′ N, respectively. See Figure 1 for the location of the line segments, aa’, bb’, cc’, dd’, and ee’, and the abbreviations.
Jmse 10 01414 g003
Figure 4. The impact of CR subduction on the comprehensive geophysical characteristics along the Yap Trench axis. (a) Gravity anomaly profiles YTYT’ (Red = Bouguer gravity anomaly, Blue = free-air gravity anomaly, Green = isostatic gravity anomaly); (b) Bathymetric profile YTYT’. The subducting seamounts of the CR elevate the trench axis by around 2000–4000 m from the maximum depth north of 8°26′ N. The profiles are extracted from the line segment YTYT’ along the Yap Trench axis as shown in Figure 1.
Jmse 10 01414 g004
Figure 5. The general geomorphological characteristics of the YSZ. (a) Slope (degrees); (b) ruggedness; (c) broad BPI; (d) fine BPI. The white dashed polygon delineates the zone of horst and graben structures. The black dashed polygons outline the correlated bathymetry highs on the arc-ward and seaward trench slopes. The J-shaped solid white line delineates the YT axis. See Figure 1 for abbreviations.
Jmse 10 01414 g005
Figure 6. The influence of the CR subduction on the formation of the slope values of the arc-ward and sea-ward trench slopes. Slope breaks can be identified in places where slope values vary rapidly. The sea-ward trench slope is dominated by abnormally high slope values due to increased compressional force at the Yap Trench axis caused by the subducting CR. See Figure 1 for abbreviations.
Jmse 10 01414 g006
Figure 7. The classification of geomorphic features in the YSZ. The white-dashed polygon outlines the area of horsts and grabens. The black-dashed polygon delineates the region north of 10°00′ N of the Yap arc with unusually thinner/narrower ridge and corresponding higher Bouguer anomalies as shown in Figure 8b. The geomorphic feature “Deep valley” delineates the Mariana, Yap, and Palau trenches axes. See Figure 1 for abbreviations.
Jmse 10 01414 g007
Figure 8. Gravity anomaly fields of the YSZ. (a) Free-air gravity anomaly; (b) Bouguer gravity anomaly; (c) Isostatic gravity anomaly. The contour interval for both maps is 5 mGal. The white dashed polygon delineates the area of horsts and grabens. The J-shaped solid white line delineates the Yap Trench axis. The black dashed polygon delineates the region of the Yap arc with unusually higher Bouguer anomalies. See Figure 1 for abbreviations.
Jmse 10 01414 g008
Figure 9. The gravity anomaly fields across the southernmost Parece Vela Basin, Yap arc, arc-ward trench slope, Yap Trench axis, and sea-ward trench slope in inter-relationship with the CR subduction (Red = Bouguer gravity anomaly, Blue = free-air gravity anomaly, Green = isostatic gravity anomaly). (a) Profile aa’; (b) Profile bb’; (c) Profile cc’; (d) Profile dd’; (e) Profile ee’. Gravitational anomaly profiles aa’, bb’, and cc’ are extracted from the line segments aa’, bb’, and cc’ north of 8°26′ N, respectively, and profiles dd’ and ee’ are extracted from line segments dd’ and ee’ south of 8°26′ N, respectively. See Figure 1 for the location of the line segments, aa’, bb’, cc’, dd’, and ee’, and the abbreviations.
Jmse 10 01414 g009
Figure 10. The comprehensive geophysical characteristics across the Sorol Trough. (a) Gravity anomaly profiles STST’ (Red = Bouguer gravity anomaly, Blue = free-air gravity anomaly, Green = isostatic gravity anomaly); (b) bathymetric profile STST’. The profiles are extracted from the line segment STST’ across the ST as shown in Figure 1. See Figure 1 for abbreviations.
Jmse 10 01414 g010
Table 1. Terrain attributes generated from GEBCO_2021 bathymetry using the BTM tool in the marine general geomorphometry technique.
Terrain AttributeParameterUnitTool
Slope3 × 3 cell neighborhoodDegreeBTM
Broad BPI150 and 15 cell radiiUnitlessBTM
Fine BPI15 and 3 cell radiiUnitlessBTM
Ruggedness3 × 3 cell neighborhoodUnitlessBTM
Table 2. The customized classification dictionary. The upper and lower limits of the broad and fine BPIs range between positive and negative (100). The negative denotes values below the default curve, while the positive denotes the value above the default curve [49]. The slope threshold of 4 degrees was used to distinguish between flats, steep slopes, and scarps. The threshold of 5772 m water depth was used to distinguish between deep valleys (trenches) and shallow valleys (mainly troughs).
Feature IDSeabed FeatureBroad BPIFine BPISlopeDepth
LowerUpperLowerUpperLowerUpperLowerUpper
01Deep valley −100 −100 −5772
02Depression−100100 −100
03Flat−100100−100100 4
04Scarp −100−1001004
05Oceanic ridge100 100 0
06Seamount−100100100
07Shallow valley −100 −100 −5772
08Steep slope−100100−1001004
09Volcanic arc/island100 100 0
Publisher’s Note: MDPI stays neutral with regard to jurisdictional claims in published maps and institutional affiliations.

